Simplified Design of FRP-Confined Square RC Columns under Bi-Axial Bending


1
Department of Civil Engineering, Sanandaj Branch, Islamic Azad University, Sanandaj 6616935391, Iran
2
Department of Civil Engineering, Marivan Branch, Islamic Azad University, Marivan 6671695853, Iran
3
Department of Geotechnical Engineering, Mazandaran Institute of Technology, Babol 6617974554, Iran
*
Author to whom correspondence should be addressed.
Buildings 2017, 7(3), 74; https://doi.org/10.3390/buildings7030074
Submission received: 26 June 2017
/
Revised: 1 August 2017
/
Accepted: 10 August 2017
/
Published: 21 August 2017
(This article belongs to the Special Issue Sustainable Building Materials)
Abstract
:Available guidelines do not provide design procedures for the general case of retrofitting reinforced concrete (RC) columns using fiber reinforced polymer (FRP) sheets subjected to simultaneous bi-axial flexural and axial loads. In many practical cases, columns essentially undergo simultaneous axial force and bi-axial bending moments, especially in in-situ construction. This paper suggests a simplified design method based on the equivalent uni-axial moment concept to calculate the required number of layers FRP sheets for retrofitting RC square columns. The proposed procedure is then verified against available bi-axial moment and axial force test data found in the literature. Results demonstrate that the proposed procedure is appropriate for practical applications with acceptable accuracy. It also appears that retrofitting RC square columns by longitudinal fiber arrangement is only effective for columns with tension-controlled behavior, while transverse and combined longitudinal-transverse arrangements are more effective in enhancing the load bearing capacity of both the compression- and tension-controlled columns. A design example will also be presented.
1. Introduction
There are a number of situations where an increase in structural capacity or rehabilitation of reinforced concrete (RC) columns are required. Those may include deterioration due to environment effects, overloads, aging, design and/or construction errors, damages due to blasts, and collision or earthquake effects. The engineering application of FRP is increasing for strengthening and retrofitting of the elements of reinforced concrete (RC) structures. Reasons behind this may include light weight, high strength, corrosion resistance, good durability and simply construction in comparison with other retrofitting techniques [1]. FRP materials, depending on the fiber layout and orientation (transverse or longitudinal with respect to the column axis), can lead to the improvement of behavior of reinforced columns from both strength and ductility points of view via either enhancement of core concrete confinement or increasing the moment capacity of the section.
There are numerous studies available in the literature, for example [2,3], concerning the behavior of FRP-retrofitted RC columns. Those studies have primarily dealt with how different design parameters such as the number of FRP sheet layers, the mechanical properties of the fibers used, orientation of the fibers with respect to the column axis, etc. affect the strength and ductility properties of the member. Previous studies on strengthening of FRP-retrofitted RC columns have been generally carried out on short columns under different loading conditions [4]. Despite the extensive body of knowledge of theoretical and experimental studies on FRP-retrofitted short columns, studies on slender columns subjected to eccentric loads—and particularly biaxial eccentric loads—are quite limited. Bournas et al. [5] present an analytical model for the analysis of reinforced concrete (RC) members with rectangular cross sections, strengthened in flexure with various types of externally applied reinforcement. The Effects of strengthening of square columns using carbon fiber reinforced polymer (CFRP) composites under uniaxial and biaxial conditions was the subject of an experimental study conducted by Tao and Yu [6]. The study indicated that the ultimate strength of the columns retrofitted by transverse CFRP sheets did not differ significantly from the non-retrofitted columns. Nonetheless, they demonstrated that remarkable enhancement is achieved in load bearing capacity of the column in cases where simultaneous transverse and longitudinal FRP sheets were utilized. Furthermore, they showed that longitudinal fibers have a larger impact on improving the loading capacity of tension-controlled columns. In an analytical and experimental study, Rocca et al. [7] developed a simplified design interaction curve of reinforced concrete columns in the compression-controlled region of behavior using transverse FRP composites under uniaxial bending. The methodology developed in that study is in good accordance with the experimental results. As will be discussed later, in this paper, the compatibility equations of the aforementioned study are incorporated.
Fitzwilliam et al. [8] analyzed the effect of retrofit of short and slender concrete columns using CFRP sheets and with two and four-sheet layouts in both transverse and longitudinal direction of small-scale samples. Their study shows that transverse CFRP layout with respect to longitudinal axis of column leads to enhancement of loading capacity in short columns whereas longitudinal fiber layout might lead to improvement of behavior of slender columns and increase their ultimate strength similar to short columns. Gajdosova et al. [9] conducted an experimental study on eight real scale concrete columns under eccentric loading. The samples included slender columns. Among all, there were two non-retrofitted samples (control samples), two samples retrofitted using transverse CFRP sheets, two samples retrofitted by Near Surface Mounted (NSM) strips, and two samples retrofitted using combined transverse CFRP and NSM sheets. The most obvious finding to emerge from their study is that retrofitting using the NSM method has the largest effect on enhancement of loading capacity of columns in cases where the bending moment is remarkable and/or the loading is eccentric. Teng and Jiang [10] also proposed a theoretical model for predicting the behavior of FRP-retrofitted RC columns.
Punurai et al. [11] Performed an experimental study on five small-scale square RC columns confined with transverse CFRP sheets under axial load and biaxial bending moments. Very good consistency was observed between the experimental results with those obtained from the finite element analytical models. Rahai and Akbarpour [2] also conducted an experimental study on rectangular FRP-jacketed RC columns under uniaxial eccentric loading conditions. In their study, several parameters including thickness of the FRP sheet, the fiber orientation, and loading eccentricity were taken into account. It was demonstrated that the strength and ductility of specimens increased with increasing FRP thickness and that the fiber orientation has a great impact on both the strength and ductility characteristics of the retrofitted member. It was also observed that adding one longitudinal-oriented FRP sheet to the control model with only one transverse-oriented FRP sheet led to significant improvement of ductility characteristics of the member.
The available knowledge on the subject have matured to a state that the impact of confinement provided by FRP composites on load-bearing capacity of both short and slender columns can be estimated with good accuracy. However, from a ductility capacity point of view, notable biases are typically observed between theoretical models and experimental results [12,13]. This may be due to the fact that eccentric loading conditions significantly affects the ultimate axial strain of the confined column, an issue that is of great significance for predicting deformation capacity of retrofitted RC columns under seismic loading conditions. Various theoretical and experimental studies can also be found in literature regarding the behavior of FRP-confined RC columns subjected to axial force and bending moment [14,15,16,17,18,19]. Most of those studies have ignored the effect of the presence of biaxial bending in real cases despite the fact that the presence of combined axial force and biaxial bending moments are very common in practical engineering design due to gravitational and/or lateral load effects or their combination. This includes current FRP retrofitting design guidelines such as ACI440 [20]. This guideline deals with the subject of retrofitting of RC columns under axial loads without direct attention to biaxial moments. It seems that current design procedures consider primarily the increase in axial load capacity of RC columns merely due to the increase in compressive strength of concrete resulting from confinement effects of FPR sheets.
However, previous studies (see above) suggest notable advantages in using FRP composites (in longitudinal and transverse layouts) to enhance the strength and ductility of reinforced concrete columns.
The present research is an extension of the interaction curve method developed in Rocca’s study [7] in which the procedure of creating interaction curves for FRP-jacketed RC columns is taken into account based on principles of equilibrium and strain compatibility in tension-controlled region as well. Moreover, the requirements for proper anchorage (bond length) of fiber reinforcement or anchors through the joints (or footings) are satisfied. Additionally, besides extending the current methods for the conditions of strengthening with transverse fiber (Regarding the longitudinal axis of the column), new equations will be proposed for the longitudinal fiber alone as well as the combined layout. Also, an engineering method will be suggested for evaluating the effect of strengthening the FRP-retrofitted RC columns under the impacts of axial force and biaxial bending as a very important case in practical retrofitting works. The proposed procedures will be illustrated through a case study along with it will be validated against experimental results.
2. Design Philosophy for the Columns Strengthened with Transverse FRP Materials
The present section reviews the procedure of generating simplified interaction curves of non-retrofitted and retrofitted columns under uniaxial bending conditions and using transverse RFP materials. In subsequent sections, additional cases employing longitudinal fibers and combination of longitudinal and transverse fibers by considering biaxial bending will also be developed and discussed. Table 1 presents the notations used in this paper. Other parameters are mentioned in the text. Analysis of RC columns confined with transverse FRP sheets is similar to typical reinforced concrete columns (without FRP sheets); the only difference is the stress-strain model of concrete in the compressive region [21,22].
It is basically assumed in analysis of strengthened columns that the section does not undergo distortion, tensile strength of concrete is negligible and no slippage occurs between the concrete and reinforcements or between the concrete and fibers. Often for simplification, interaction curves of retrofitted and non-retrofitted columns can be generated with appropriate accuracy by linear connecting the five key points of column behavior corresponding to different response modes at failure (Figure 1) [7]. Generation and application of the simplified curve for evaluation of FRP-retrofitted columns is simple and relatively straightforward [7].
Due to the significance of this section, the equations available in the technical literature for strengthening with transverse fibers are presented in the present paper with a slight modification. The key points in the aforementioned simplified interaction curve using ordinary assumptions in analysis of reinforced concrete elements [7] according to Figure 1 include:
- Point A: uniform axial compressive strain in the confined concrete.
- Point B: This point corresponds to the state of strain distribution in which maximum compressive strength is εccu and strain in the last rebar sheet in the tensile region is equal to zero. εccu is the ultimate compressive strength of the confined concrete. In non-confined conditions, εcu i.e., ultimate compressive strength of unconfined concrete is used.
- Point C: This point represents the state of strain distribution in which simultaneously the maximum ultimate compressive strain of concrete is εccu and maximum tensile strain in the last rebar sheet is equal to yield stress. This point is the same as equilibrium (balance) point of the column behavior.
- Point D: This point corresponds to the state of strain distribution in which maximum compressive strain equals εccu (or εcu in unconfined conditions) and strain in the last longitudinal rebar sheet of section is equal to 0.005.
- Point E: This point is associated with the conditions for pure bending without axial force.
In the interaction curve shown in Figure 1, point “A” represents the pure axial compression capacity without any bending moment. For the points “B”, “C” and “D”, location of the neutral axis is obtained based on similarity of triangles in the strain diagram. Point “E” is representative of pure bending without axial force which can be calculated based on classical theories of analysis of RC flexural members (beams). Nominal axial force corresponding to point “A” can be determined using Equation (1):
For longitudinal fiber, Pn is the same as Equation (1) because confinement effect of longitudinal fiber is neglected. Nominal axial force (Pn) and nominal bending moment (Mn) are calculated at points B, C, and D via integration of stress. This integration for non-circular sections is shown in Equations (2) and (3);
In the above equations, c is the distance of neutral axis from the farthest compressive axis of section. Asi, fsi, and dsi are respectively area, stress, and distance to the centroid of area in i-th sheet of longitudinal (bending) rebars. “y” is integration variable in compressive region of section. Compressive strength function fc is used based on the Lam and Teng model [23,24]. This model has been chosen based on the assessment of a series of FRP-confined column models with minimal dimension of 300 mm under pure axial compression [25].
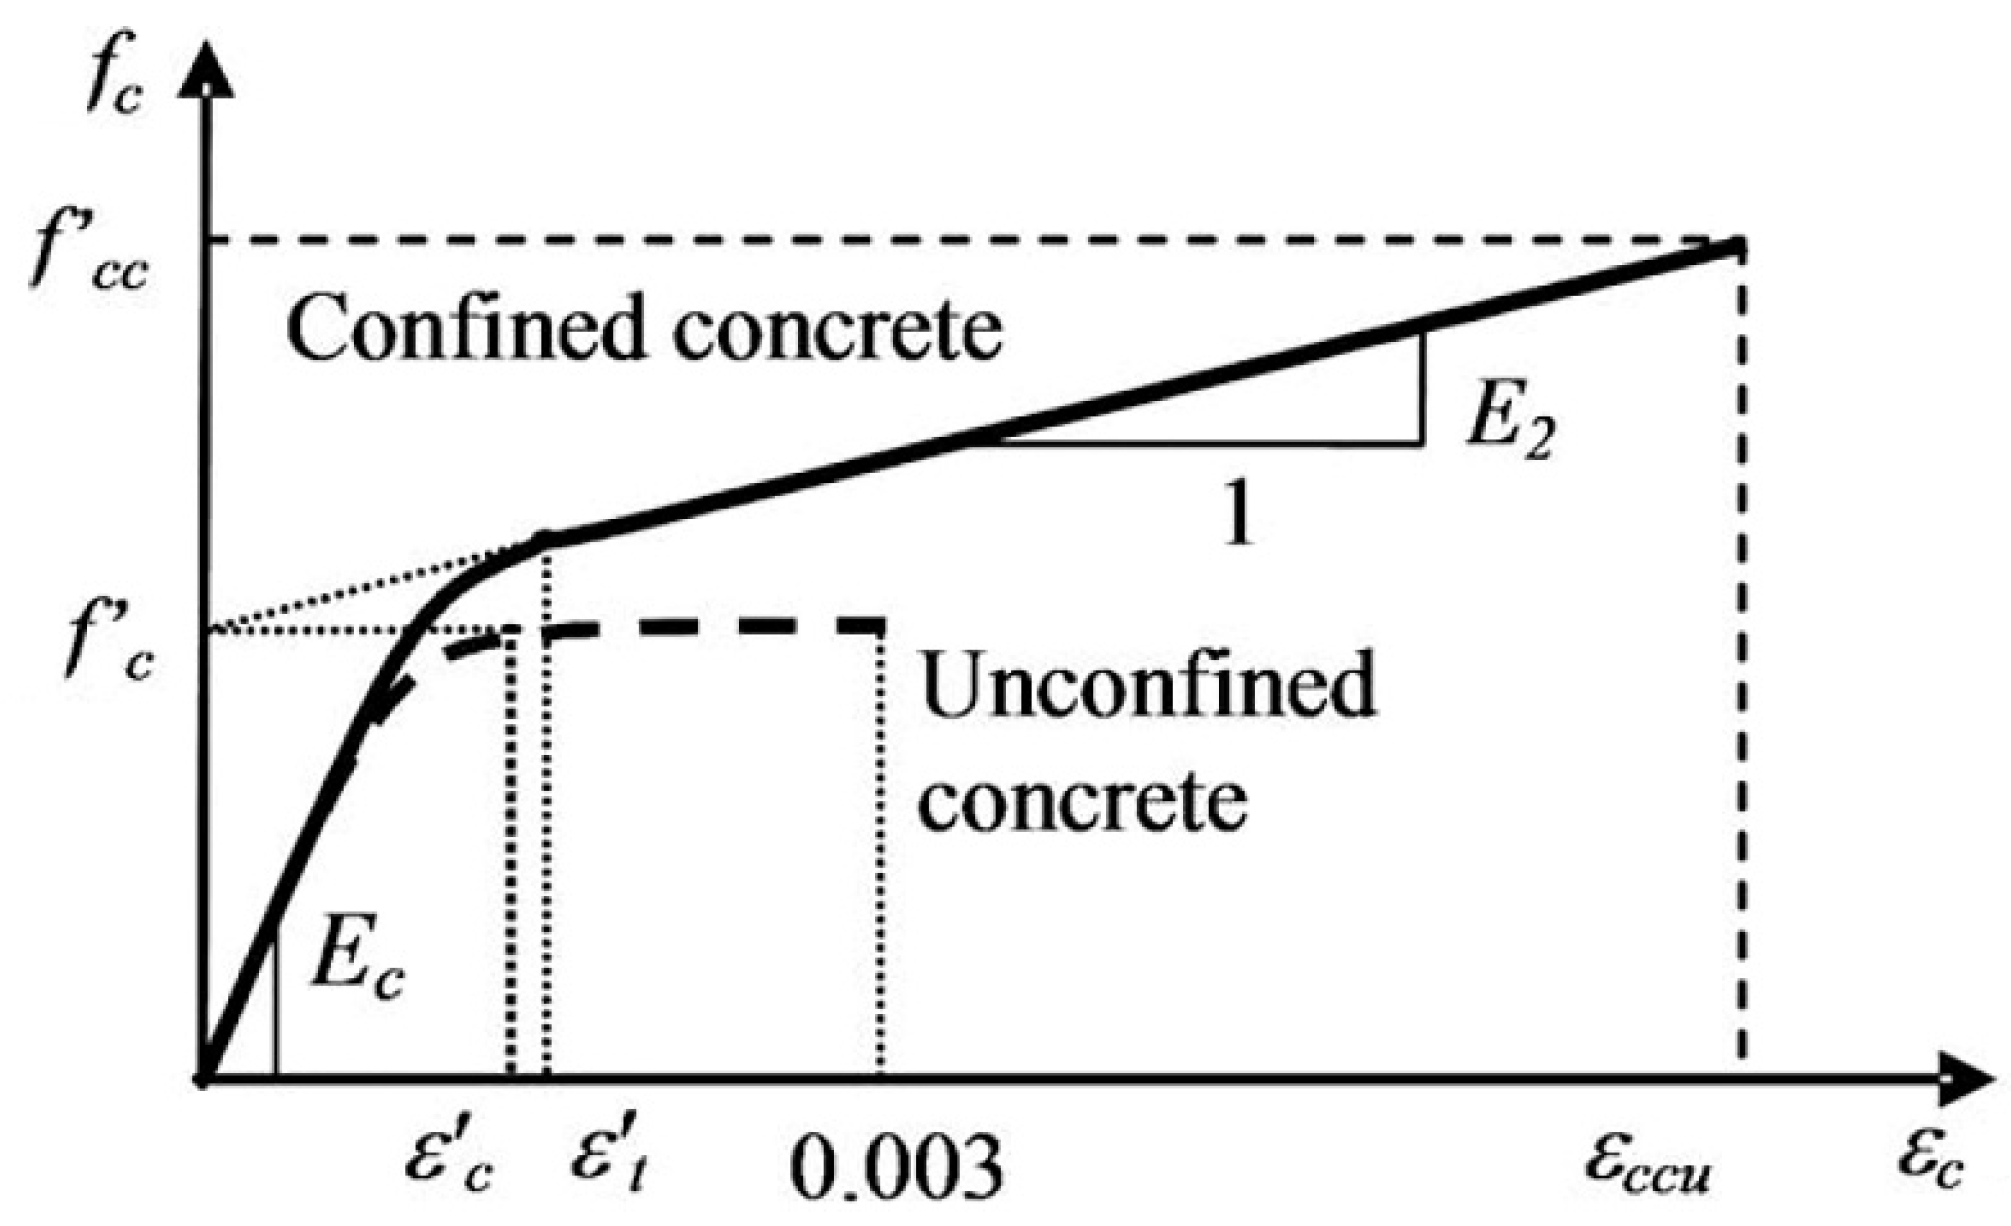
Several models that simulate the stress-strain behavior of FRP-confined compression sections are available in the literature. The stress-strain model by Lam and Teng’s, illustrated in Figure 2, for FRP-confined concrete has been used in many experimentally-verified papers [7]. Stress-strain curve of this model consists of two parabolic and linear parts (Figure 2) which intersect at transient strain . The second part of the curve (which is linear) reaches to the point at the end corresponding to maximum compressive strength fcc and maximum axial strain of confined concrete εccu. This model follows the equations below in different strain intervals:
where, fc and εc are axial stress and strain of the concrete, Ec is elasticity module of the confined concrete, E2 is the slope of linear part of the curve, and is the maximum axial strain of the FRP-confined concrete. Compressive strength of FRP-confined concrete is expressed according to Equation (7):
In the equation above, ka parameter is the “geometrical effect” coefficient which will be explained later. FRP confinement stress (f1) is computed based on principles of equilibrium and compatibility of strains through the following equations:
In Equation (8), effective strain (εfe) is calculated based on kε effect factor and maximum tensile strain (εfu) (). Other parameters are included in Table 1. Based on experimental studies by Lam and Teng, value of is recommended [23]. Similarly, Cary and Harries [26] suggested a value of 0.58 for this parameter. In the present paper, the authors have assumed a value of 0.55 for kε parameter for designing purposes and further assurance. Based on recommendations of ACI-440 Committee [27], the effective FRP strain in deformation state (εfe) in elements under combination of axial force and bending moment is limited to two values of 0.004 and .
In Lam and Teng’s model, maximum compressive strain of FRP-confined concrete is expressed via the following equation:
Compressive strain of unconfined concrete (εc) in the equation above is assumed equal to 0.002. Value of ultimate compressive strain of unconfined concrete (εcu) is considered equal to 0.003 based on ACI318-08 Directive [28]. Geometric effect coefficients ka and kb can be evaluated based on Equations (10) and (11). These values equal 1 for circular sections and depend on two parameters of effective confined area ratio () and aspect ratio (h/b):
If the FRP effect is disregarded in the previous equations, the relationships will hold for the case of no reinforcement too.
3. Design Philosophy for Columns Strengthened with Longitudinal FRP Materials
In this section, the procedure of generating simplified interaction curves of unconfined and confined columns are taken into account under uniaxial bending condition and using longitudinal fibers alone. For this purpose, the same Equations as (1)–(3) of the previous section are applicable. The only difference is the fact that the strength properties of concrete materials will not vary due to the absence of transverse fibers, and as a result, absence of confinement effects. Therefore, the above mentioned equations are rewritten in the form of Equations (12)–(14). It is noteworthy that due to failure of FPR material in supporting the compression, no increase of strength is expected to occur in the compression-controlled region of interaction curve. This issue is also incorporated in Equation (12).
4. Design Philosophy for Columns Strengthened with Combined Longitudinal and Transverse FRP Materials
This section deals with the procedure of generating simplified interaction curves for unconfined and FRP-confined columns under uniaxial bending conditions and equipped with both longitudinal and transverse fibers. It will be shown in the subsequent sections that simultaneous longitudinal and transverse confining technique is very efficient for columns with bending moment (load eccentricity) in one or two directions. As depicted in Section 2, in order to plot the simplified interaction curves of confined columns (retrofitted using FRP materials) and also unconfined columns (non-retrofitted), it is necessary to calculate five points (A, B, C, D, and E as previously introduced in Figure 1).
As implied earlier, in case of applying the longitudinal fiber, it is reasonable to ignore enhancement in axial strength due to insufficient confinement provided by this fiber type. As a result, Equations (12)–(14) of the previous section are rewritten as Equations (15)–(17) below for the case of combined transverse and longitudinal fibers:
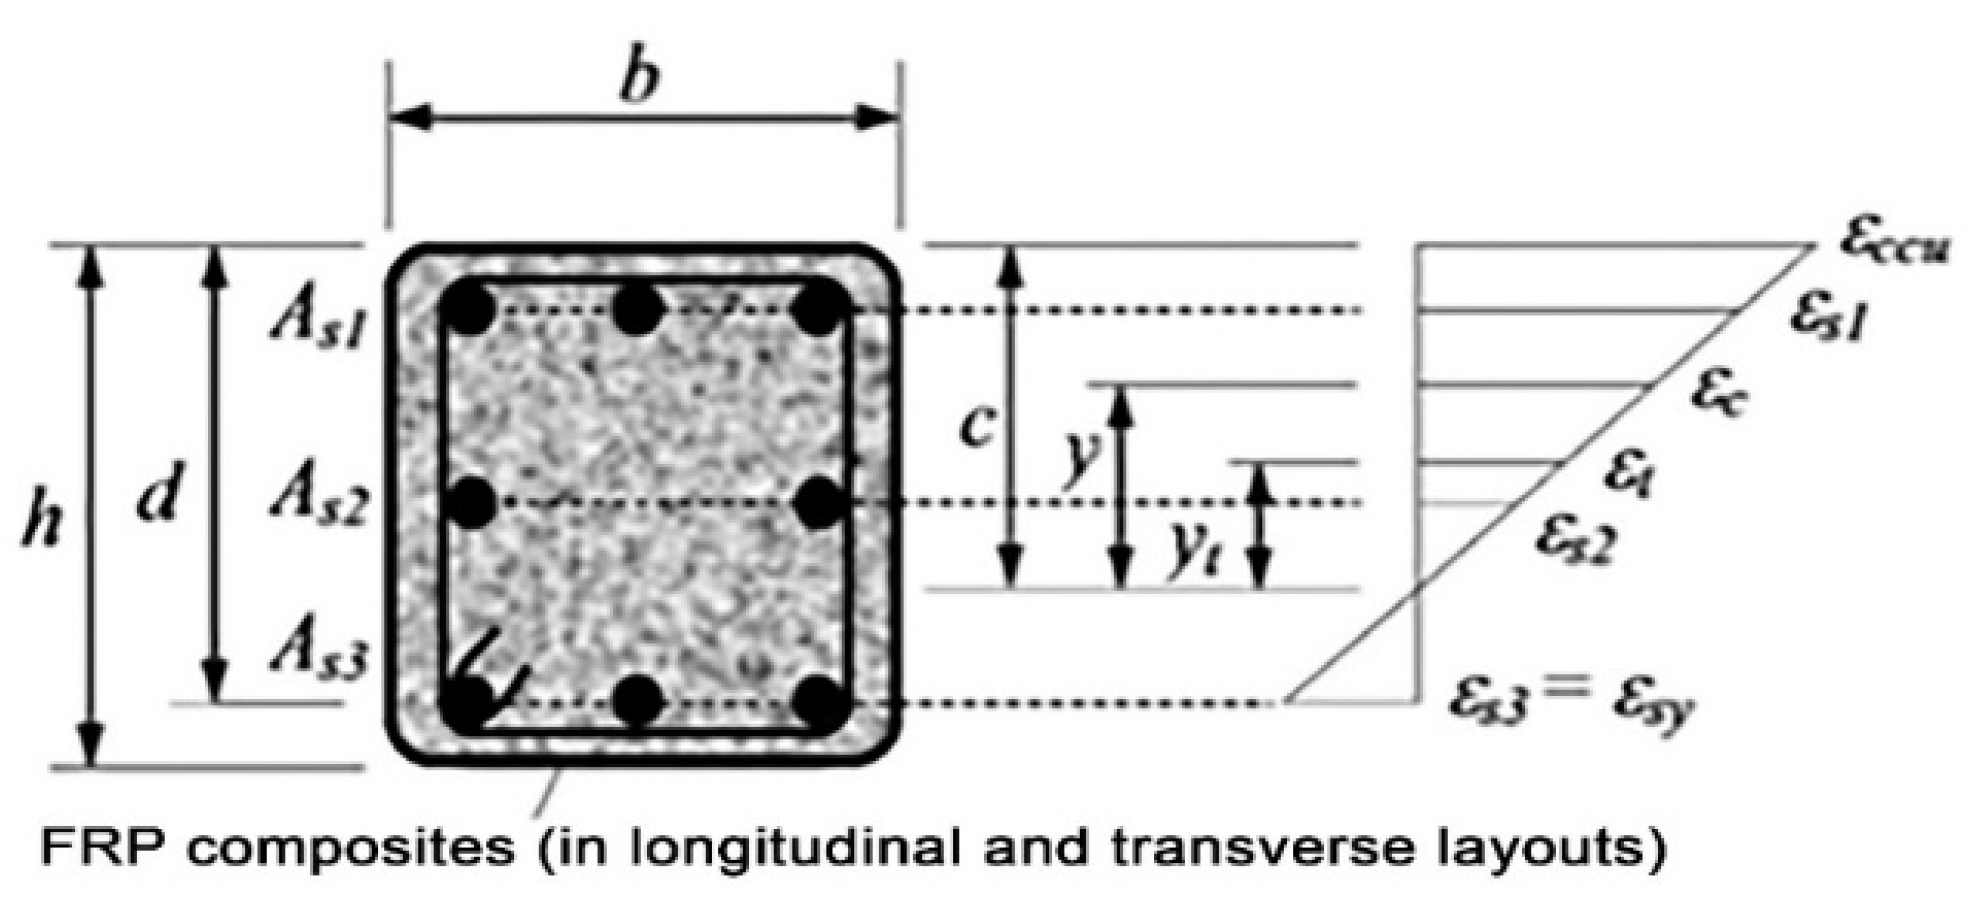
The coordinate parameter yt lies on the cross section has the neutral axis as its origin and is within the compression region of the concrete and is associated with transient strain center. This parameter can be determined using Equation (18) and according to Figure 3 as:
Following integration and rearrangement of Equations (15)–(17) using coefficients A, B, C, D, E, F, G, H, and I, Equations (19)–(21) are derived as below. The aforementioned coefficients are separately included in Equations (22)–(30). Equations (20) and (21) have been, respectively, written for the cases of transverse fiber and combined transverse and longitudinal fibers:
Values of fsi and ffi, respectively, represent the stress in rebar sheets and FRP materials which are calculated based on similarity of triangles in the strain distribution diagram. The respective values are dependent on the position of the neutral axis. Stress in rebar sheets is assumed to be positive for compression and negative for tension. It must be noted that FRP materials merely have tensile capacity, and in practice, the strength of supporting compression is not defined for them. On the other hand, for simplifications in the design formulation, FRP fibers have been modeled separately in the same row as rebar sheets. It should be reminded that nominal axial compressive capacity under net axial compression (Point A in interaction curve) for columns with transverse rebar is limited equal to 80% of value of nominal net axial capacity according to the design procedure of ACI318-08 code of practice [28]. For columns with transverse rebar, based on ACI 318-08 recommendations [28], strength reduction factors should be considered in loading capacity computations.
The equations provided above have been written for the state of uniaxial bending moment and axial force. To extend this method to the more general state of biaxial bending moment, the ultimate biaxial bending moments can be converted into uniaxial moments using credible references [29]. The equivalent uniaxial moments depend on ratio of biaxial bending moments and can be evaluated via Equation (31):
In this equation, Mux and Muy are, respectively, the ultimate bending moments of column under the effect of gravity loads about x and y axes of the section. “b” and “h” also represent the dimensions of section along x and y axes, respectively.
5. Validation of the Procedure
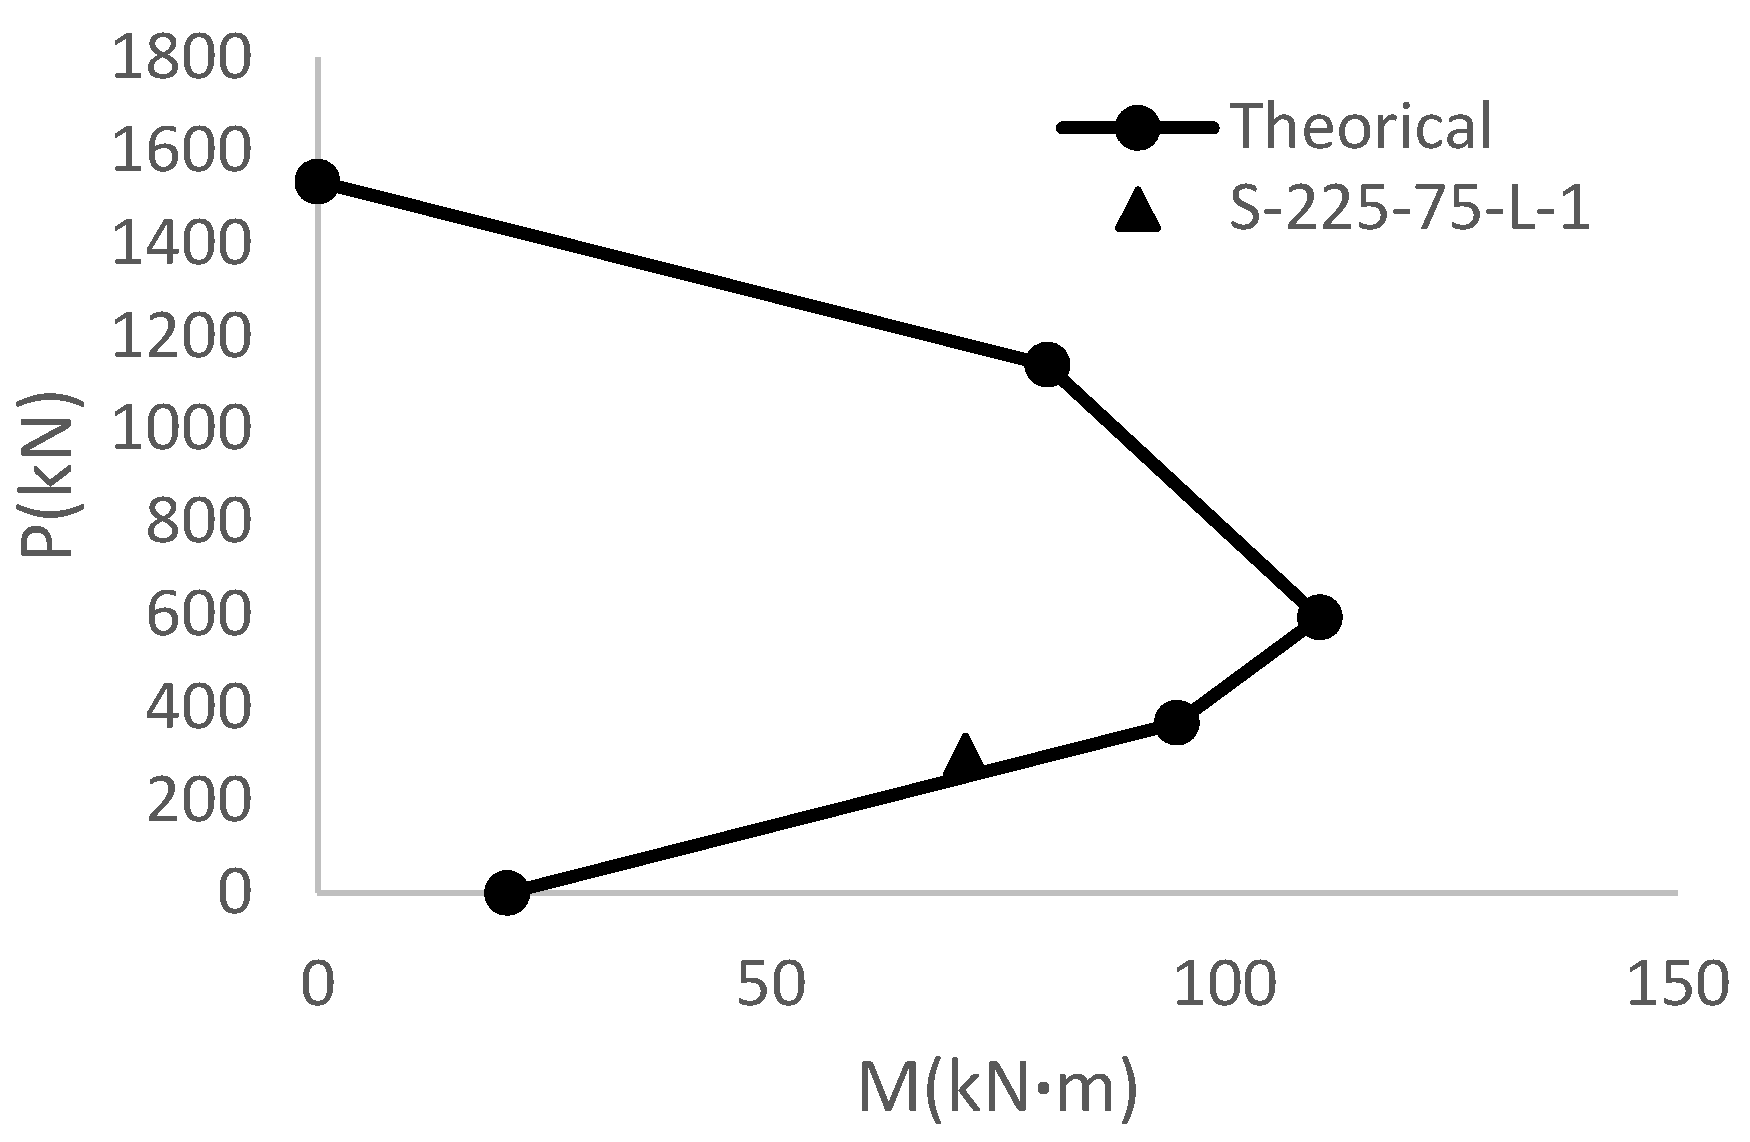
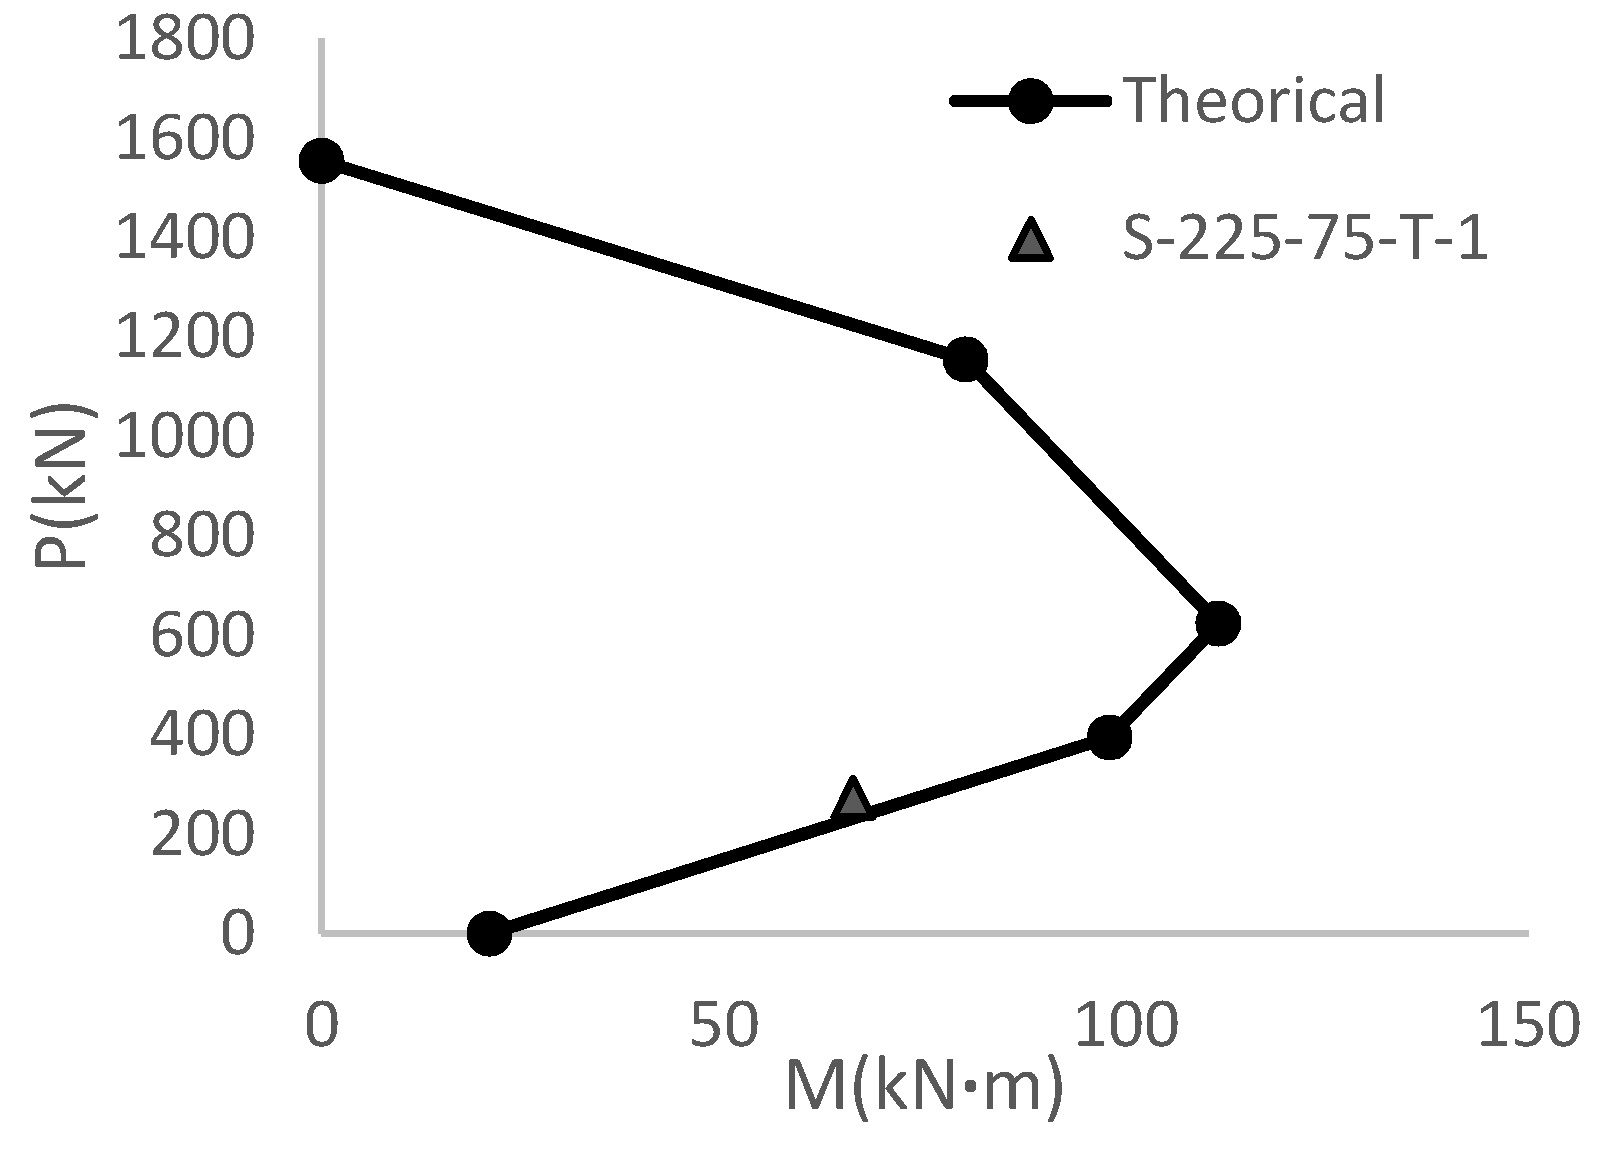
To evaluate the proposed formulation proposed in the present study, the interaction curve for the experimental samples studied by Rahai and Akbarpour [2] is computed and plotted using the proposed equations. The test specimens of that study were tested at actual scale. In Table 2, geometrical and strength specifications of columns are shown from reference [2]. Among the experimental results in the aforementioned study, three column specimens were selected as follows: strengthened with only longitudinal fiber (designated as S-225-75-L-1), strengthened with only transverse fiber (designated as S-225-75-T-1) and strengthened with a longitudinal sheet and a transverse sheet (designated as S-225-75-LT-2).
Numbers 225 and 75 in the designations respectively represent the eccentricity of axial force along y and x direction under which the columns are subjected to axial force and biaxial bending moments. The maximum load and moment exerted as such to each specimen are shown in Table 3.
In the first stage, interaction curves of the columns under analysis are plotted using the equations proposed in the present paper and substitution of biaxial bending moments included in Table 3 by equivalent uniaxial bending moment (calculated using Equation (31)) as separately illustrated for each column in Figure 4, Figure 5 and Figure 6. Also, axial force and equivalent uniaxial bending moment pairs are shown by solid circles on the curves in Figure 4, Figure 5 and Figure 6 according to the values of Table 3. These values actually represent the maximum strength demands exerted on the column. Proximity of the circles to the interaction curve is suggestive of good match between theoretical and experimental results. Thus, the theoretical results acquired in the present research are considered to be acceptable in normal design usages with adequate accuracy. It is worth mentioning that design strength reduction factor was set to be 1 in computation of the interaction curves in Figure 4, Figure 5 and Figure 6.
In order to compare the proposed theoretical interaction curves with the experimental results, the interaction curves of specimens No2 and IA2-a from the Rocca [7] study have been considered. Figure 7 shows the theoretical as well as the experimental interaction curves. No environmental and strength reduction factors were considered in developing these interaction diagrams. As seen, the theoretical interaction curves developed with the proposed procedure of this paper are in good agreement with those derived from experimental results in Reference [7].
6. Case Study
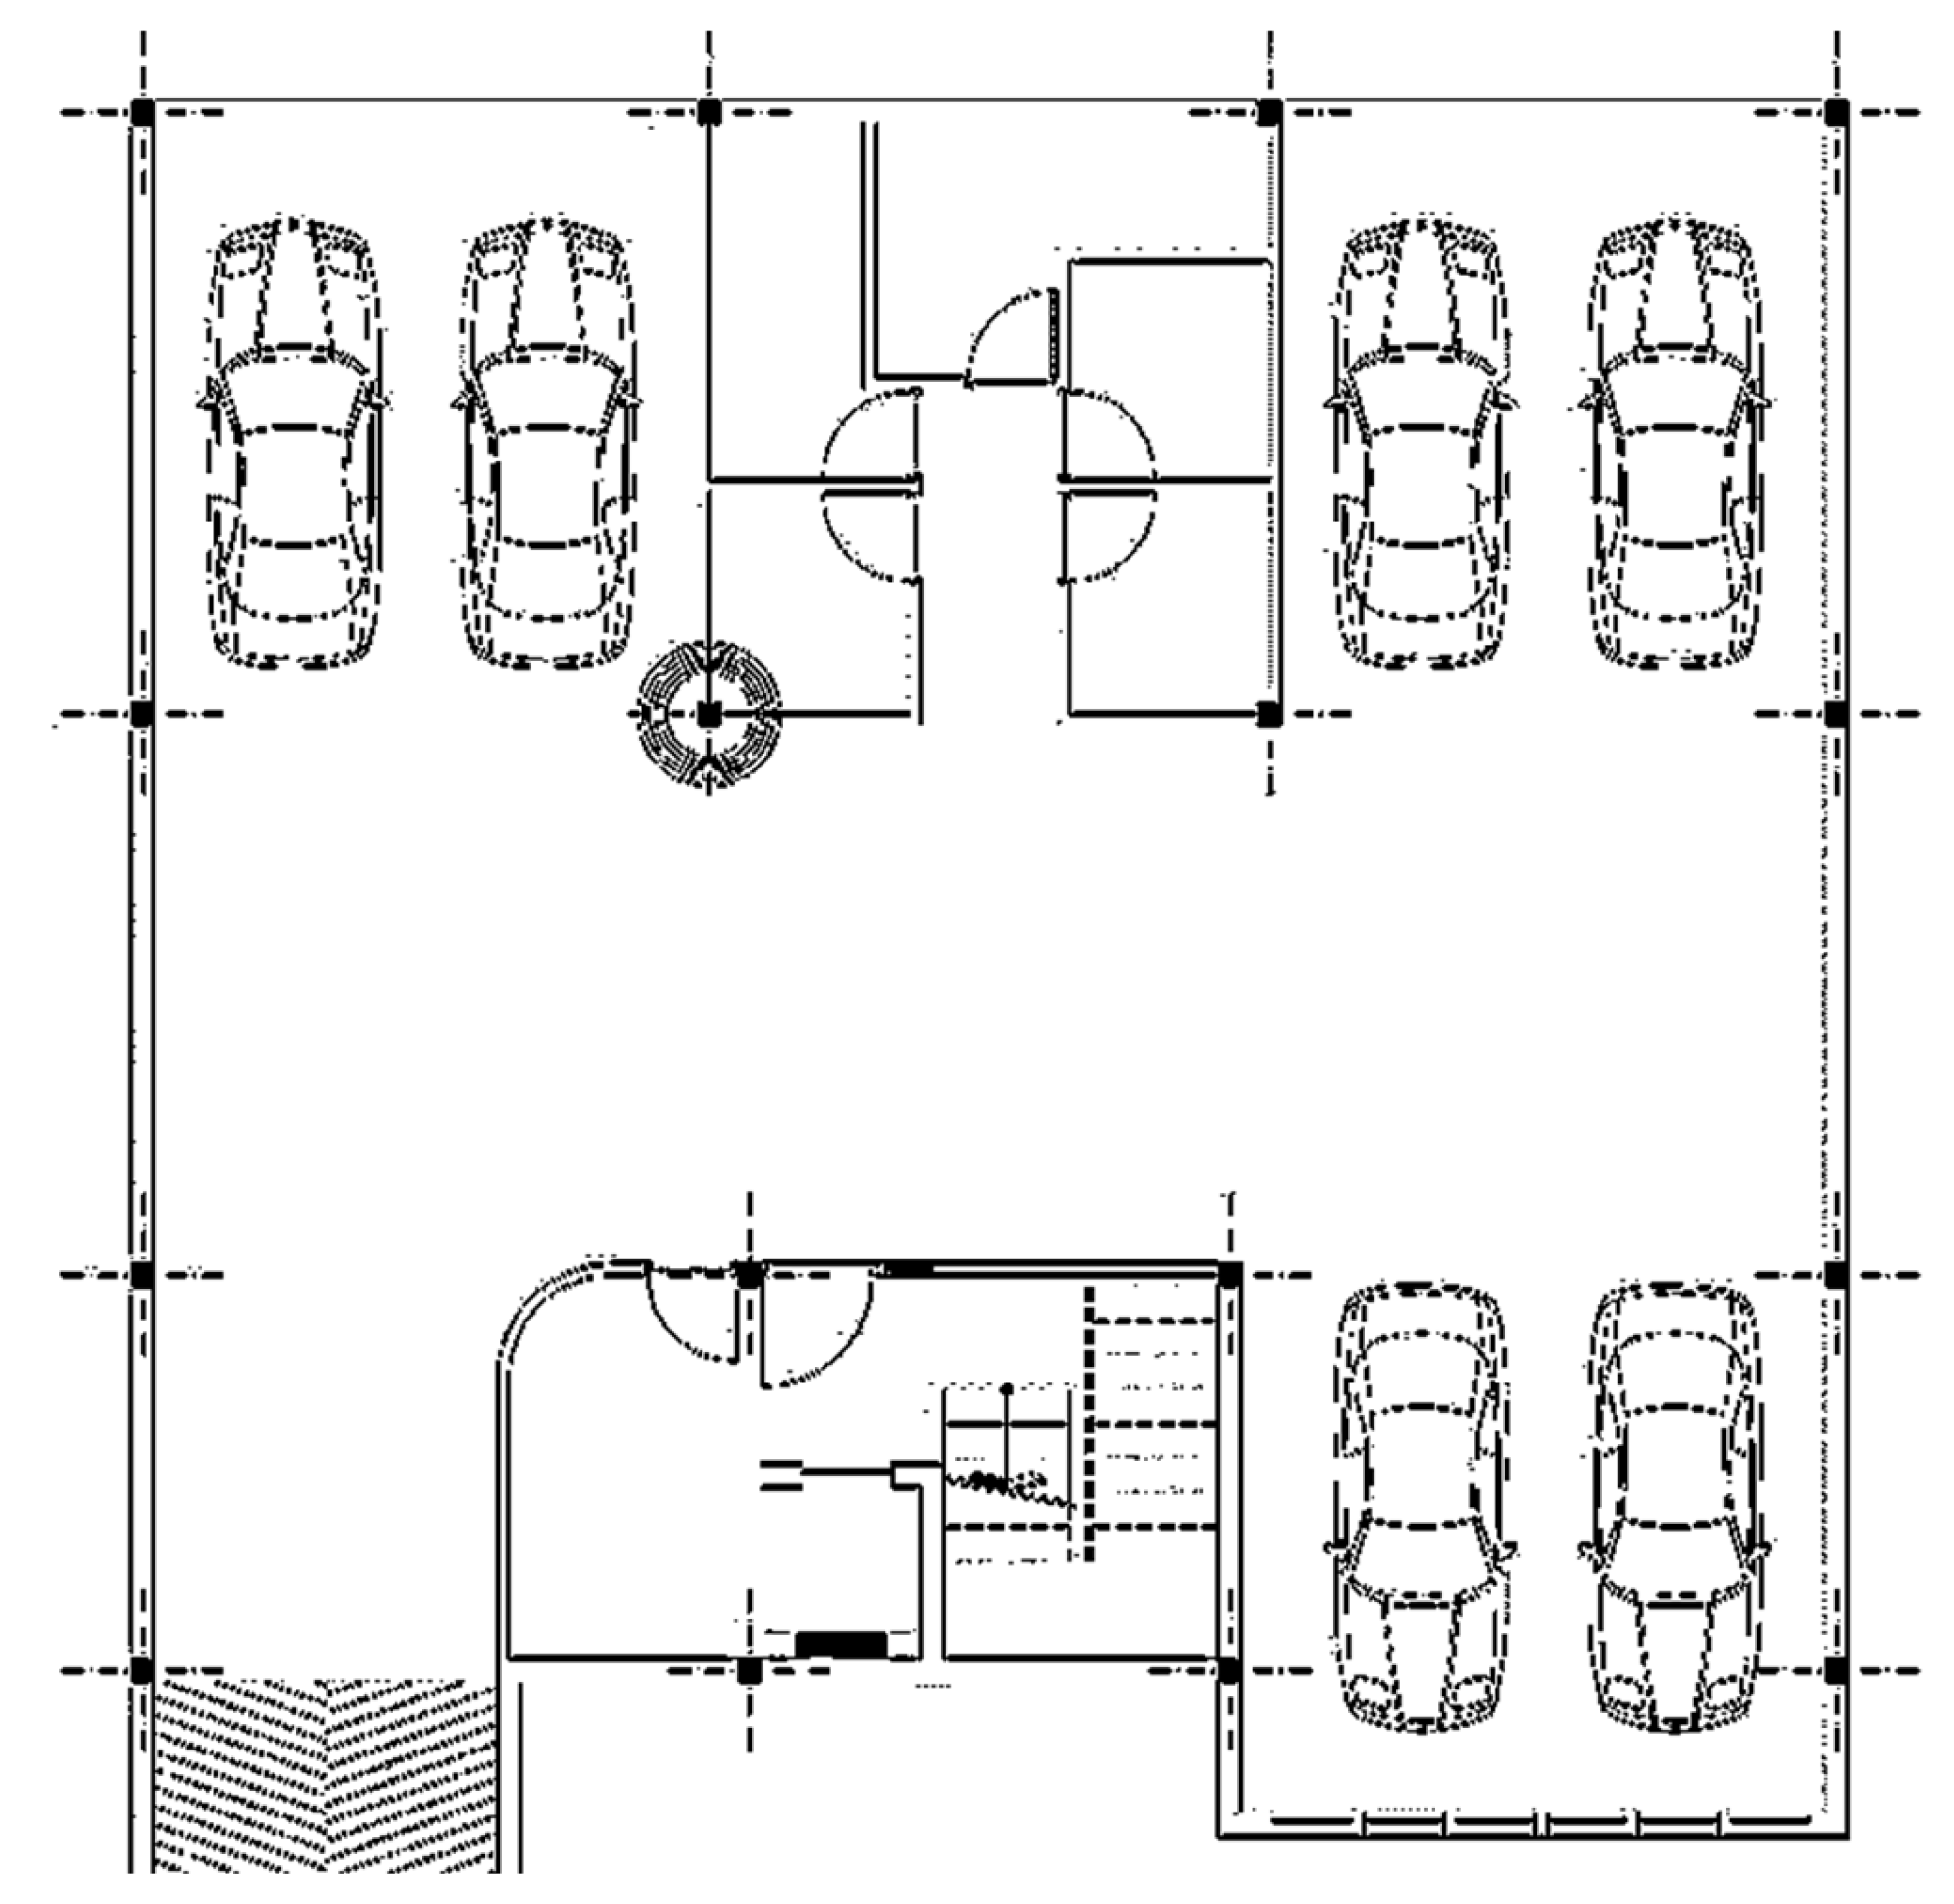
In the present section, strengthening of a column of a 4-story residential building with FRP sheets by using the procedure suggested in the previous sections is investigated. The structure has been designed based on ACI 318-08 code of practice [28] for a site with high seismicity and special ductility level. The lateral load-resisting system is moment-resisting frames in both plan directions. Figure 8 represents the building plan and the respective column. The column is located in the ground floor of the structure. Specifications of materials, sections, and internal efforts of the respective non-retrofitted column are included in Table 4. The concrete strength mentioned in Table 4 is the characteristic strength (28-day) of standard cylindrical sample. Structural analysis was performed assuming cracked section properties. Secondary (P-∆) effects were also considered in the structural analysis. The selected column is to support maximum axial force of 562 kN (12% increase compared to its pre-strengthened condition), bending moments of 198.2 kN·m (23.7% increase) and 33.4 kN·m (15.5% increase) about its cross-section local axes.
Specifications of the FRP jacket sheets are included in Table 5. These specifications belong to sheets made of carbon and have been extracted from available commercial catalogues. The column has been strengthened based on the simplified procedure of the present research. Therefore, aimed at enhancing loading capacity of the column, retrofitting by using one-layer FRP sheets was taken into account. Interaction curves can be plotted using the design equations presented in previous sections (Figure 9). Solid, dashed and dotted-line diagrams, respectively, correspond to interaction curves of the column without retrofitting, retrofitting with transverse fibers and retrofitting with combined longitudinal and transverse fibers.
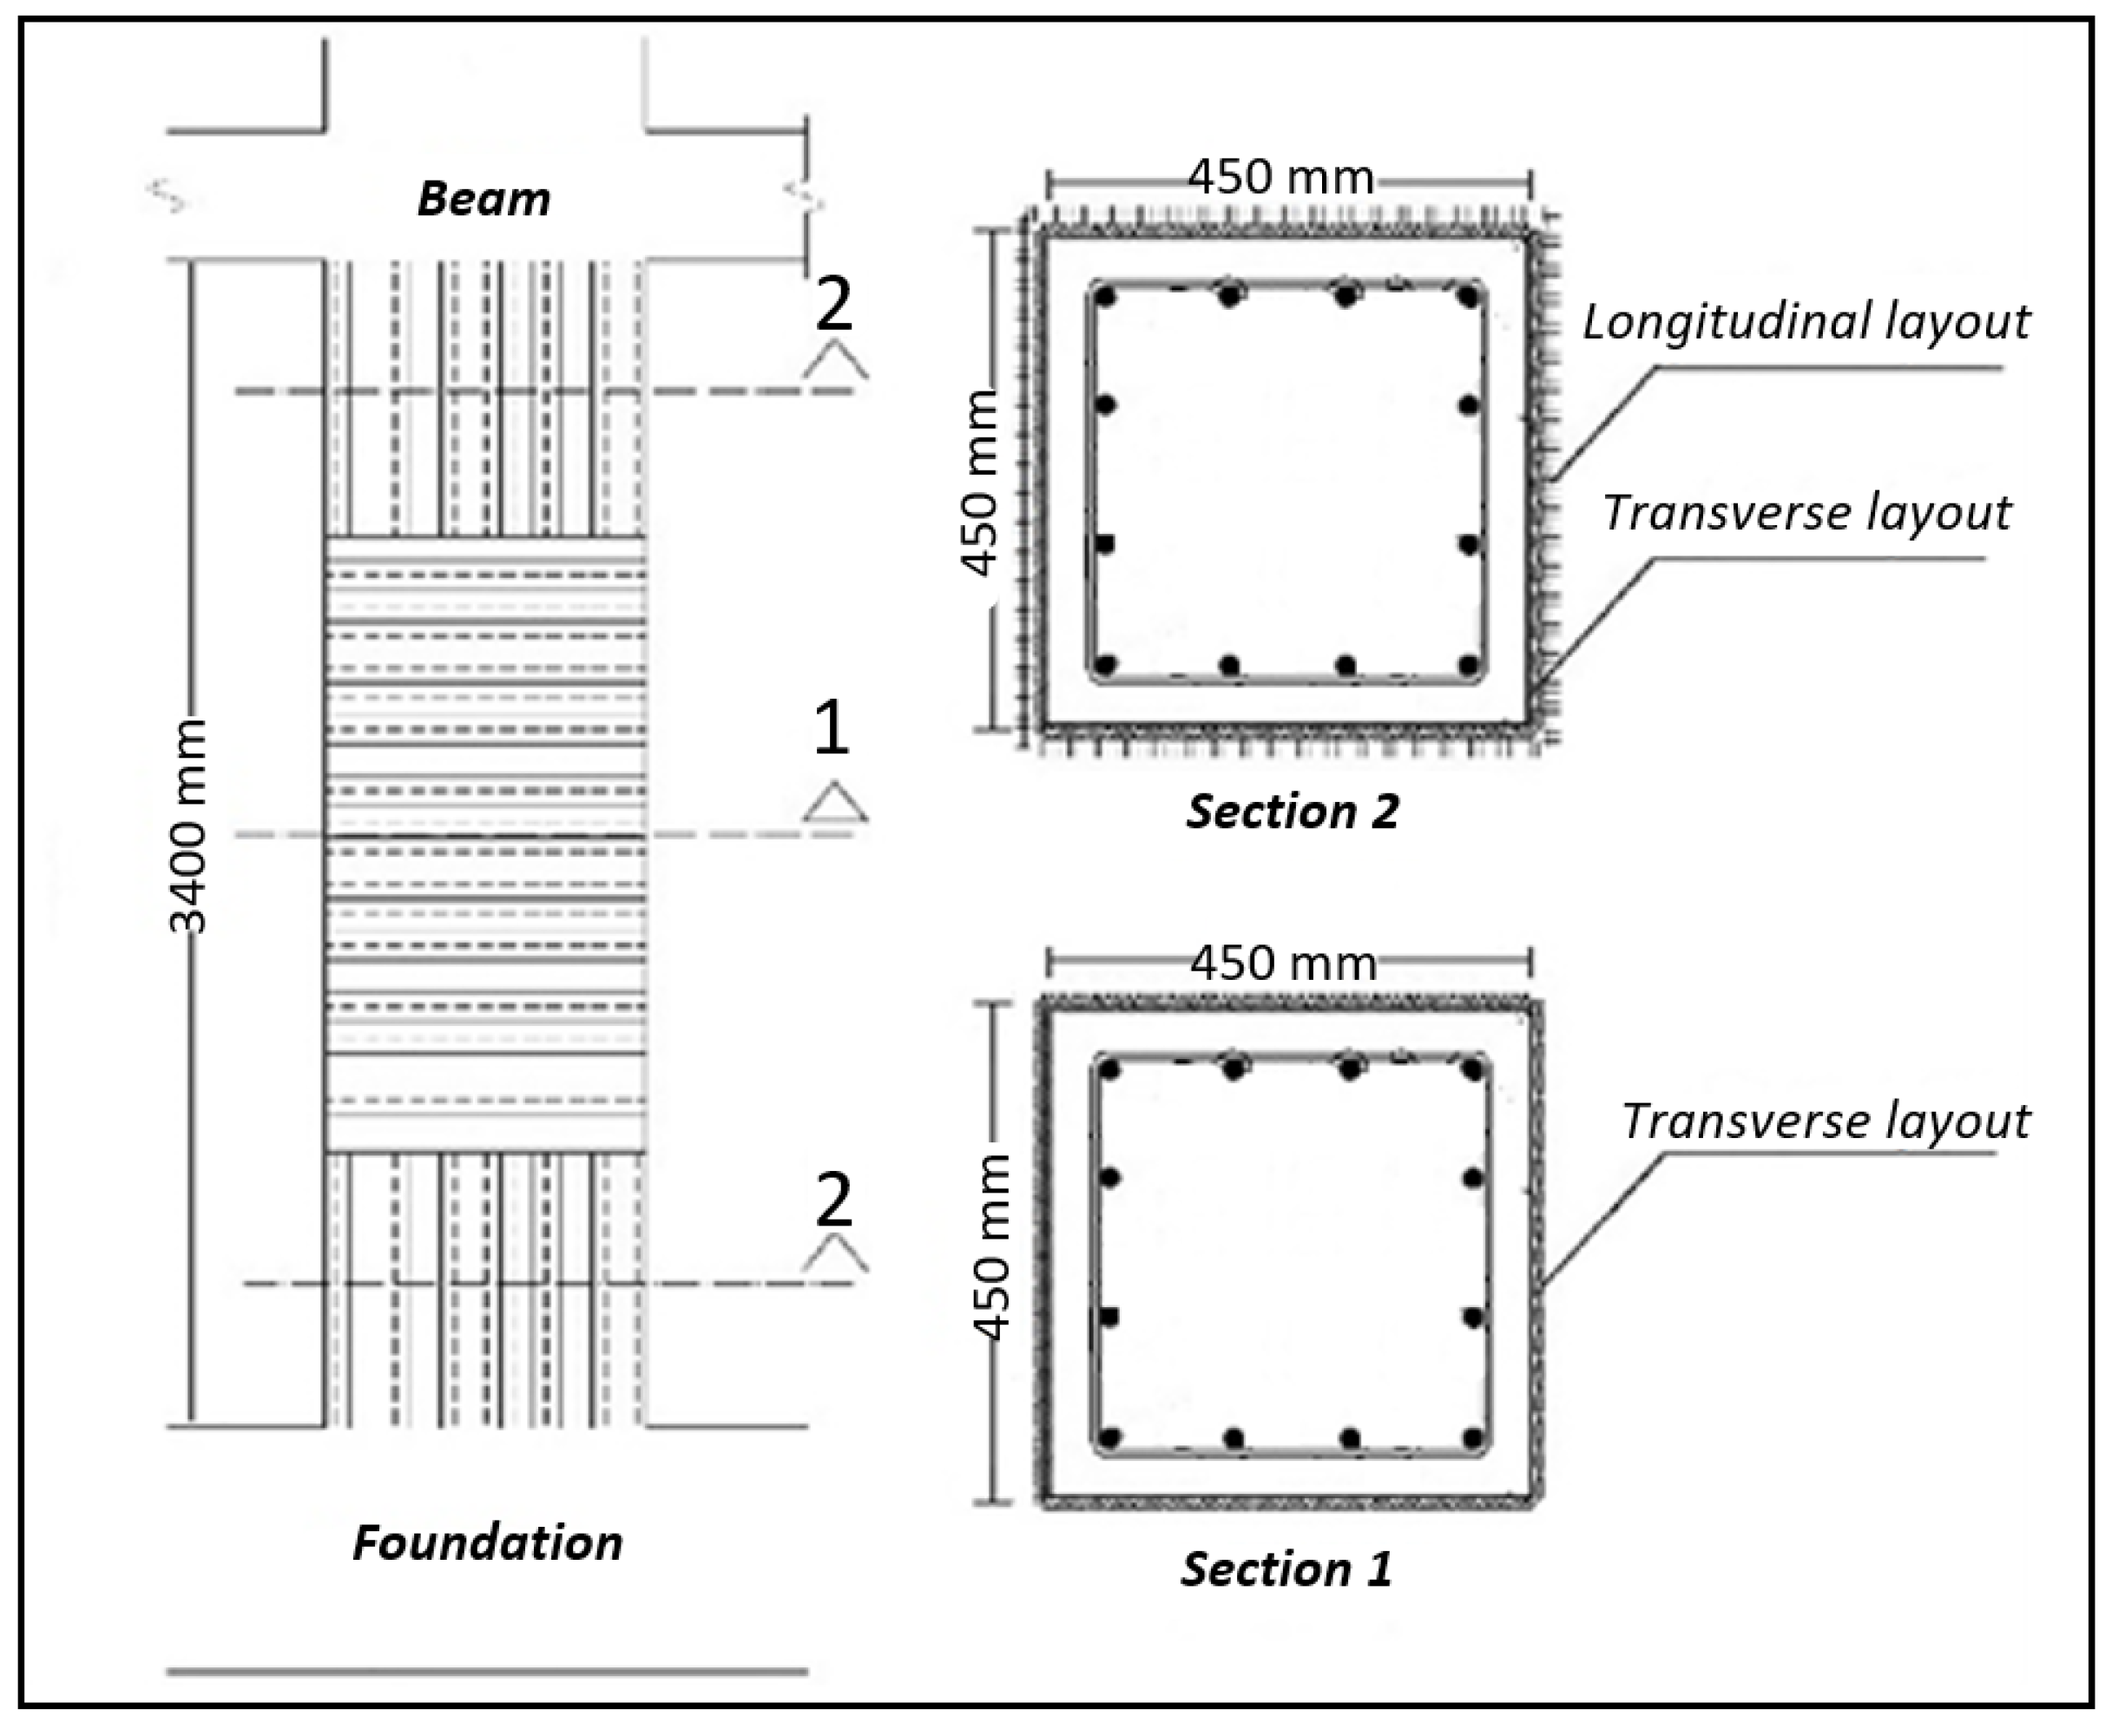
Confinement effects of FRP with combined longitudinal and transverse fiber sheets are more pronounced in enhancing the load bearing capacity of both the compression- and tension-controlled columns. Figure 9 also illustrates this significant finding. The mentioned constraint in current design rules for using FRP materials in strengthening of columns can be alleviated using the equations developed in the present study for longitudinal or combined transverse and longitudinal fiber orientations. It must be noted that previous experimental studies [2,30] have demonstrated that longitudinal fibers also have some effects on confinement level of the column, which have been neglected in the equations developed in the current research. For the same reason, as a practical recommendation, in the case of applying the combined method of strengthening with both longitudinal and transverse fibers, the longitudinal fibers can only be used in critical areas of the column which require reinforcement and strength enhancement (in general, upper and lower parts of the column in normal moment frames); meanwhile, transverse fibers can be used for the entire height of the column. The authors believe that such a method will considerably help the economics of the operations. The final detail of the retrofitted column is illustrated in Figure 10.
The dashed lines represent areas with combined longitudinal and transverse fibers overlaps the dashed line curve (merely longitudinal fiber) in the tension-controlled region, and, overlaps the interaction curve of transverse fiber in the compression-controlled region. Accordingly, as observed, column strengthening is possible using each of the three methods. It is thus preferable to use a combination of transverse and longitudinal fibers in critical regions.
7. Conclusions
This paper proposed a simplified design procedure for calculating the required number of FRP layers for retrofitting of RC square columns under combined effects of axial force and biaxial bending moments. The following can be drawn based on the results of the study:
- 1-
- The presented calculation procedure predicted reasonably close to the experimental results.
- 2-
- Analysis results indicate that fibers with transverse orientation lead to enhancement of strength in the compression-controlled region of the interaction curve of the column and longitudinal fibers cause an increase in strength in the tension-controlled region. In addition, FRP Laminates can be replaced by FRP wraps as longitudinal reinforcements.
- 3-
- Correlation of theoretical findings of the present research with experimental results demonstrates that the interaction curve of the retrofitted column by using transverse fibers widens in the compression-controlled region compared to the tension-controlled region. For the case of applying longitudinal fibers, the curve widens in the tension-controlled region compared to the compression-controlled region.
- 4-
- Combination of longitudinal and transverse fibers must result in enhancement of strength (widening of interaction curve) in both regions. This is the preferred method of retrofitting in most practical cases, especially when considering earthquake loads.
- 5-
- As there is a lack of general design procedure of FRP layers in all practical cases, the procedures proposed in the present research are expected to serve as a guideline for strengthening of reinforced concrete columns using polymer fibers.
Author Contributions
Ehsan Jami and Zana Azarian conceived and designed the experiments; Zana Azarian performed the experiments; Ehsan Jami and Zana Azarian analyzed the data; Salar Manie contributed reagents/materials/analysis tools; Ehsan Jami and Zana Azarian wrote the paper.
Conflicts of Interest
The authors declare no conflict of interest.
References
- Zhang, P.; Xu, X. Size effect of concrete column retrofitted by fiber-reinforced Polymer (FRP). In Proceedings of the 3rd International Conference on Energy Materials and Environment Engineering, Bangkok, Thailand, 10–12 March 2017. [Google Scholar]
- Rahai, A.; Akbarpour, H. Experimental investigation on rectangular RC columns strengthened with CFRP composites under axial load and biaxial bending. Compos. Struct. 2014, 108, 538–546. [Google Scholar] [CrossRef]
- Rami, E.; Patrick, P. Compressive behavior of FRP-confined reinforced concrete columns. Eng. Struct. 2017, 132, 518–530. [Google Scholar]
- Chellapandian, M.; Suriya, P.; Akanshu, S. Strength and ductility of innovative hybrid NSM reinforced and FRP confined short RC columns under axial compression. Compos. Struct. 2017, 176, 205–216. [Google Scholar] [CrossRef]
- Bournas, D.A.; Triantafillou, T.C. Biaxial bending of reinforced concrete columns strengthened with externally applied reinforcement in combination with confinement. ACI Struct. J. 2013, 110, 193–204. [Google Scholar]
- Tao, Z.; Yu, Q. Behavior of CFRP-strengthened slender square RC columns. Mag. Concr. Res. 2008, 60, 523–533. [Google Scholar] [CrossRef]
- Rocca, S.; Galati, N.; Nanni, A. Interaction diagram methodology for design of FRP-confined reinforced concrete columns. Constr. Build. Mater. 2009, 23, 1508–1520. [Google Scholar] [CrossRef]
- Fitzwilliam, J.; Bisby, L. A. Slenderness effects on circular CFRP confined reinforced concrete columns. J. Compos. Constr. 2010, 14, 280–288. [Google Scholar] [CrossRef]
- Gajdosova, K.; Bilcik, J. slender reinforced concrete columns strengthened with fibre reinforced polymers. Slovak J. Civ. Eng. 2011, 19, 27–31. [Google Scholar]
- Teng, J.G.; Jiang, T. Theoretical model for slender FRP-confined circular RC columns. Constr. Build. Mater. 2012, 32, 66–76. [Google Scholar]
- Punurai, W.; Chen, J.; Hsu, C.T.T. Biaxial loaded RC slender columns strengthened by CFRP composite fabrics. Eng. Struct. 2013, 46, 311–321. [Google Scholar] [CrossRef]
- Hadi, M.N.S. Behavior of FRP wrapped HSC columns under different eccentric loads. Compos. Struct. 2007, 62, 145–153. [Google Scholar]
- El-Maaddawy, M. Strengthening of eccentrically loaded reinforced concrete columns with fiber-reinforced polymer wrapping system: Experimental investigation and analytical modeling. ASCE J. Compos. Constr. 2009, 13, 13–24. [Google Scholar] [CrossRef]
- Mohammad, Z.K.; Erfan, S. Plasticity modeling of FRP-confined circular reinforced concrete columns subjected to eccentric axial loading. Compos. Part B 2012, 43, 3497–3506. [Google Scholar]
- Hogr, H.; Sheikh, M.N.; Hadi, M.N. Load and moment interaction diagram for circular concrete columns reinforced with GFRP bars and GFRP helices. J. Compos. Constr. 2017, 21, 04016076. [Google Scholar]
- Abdeldayem, H.; Hamdy, M.; Brahim, B. Axial Load–Moment Interaction Diagram of Circular Concrete Columns Reinforced with CFRP Bars and Spirals: Experimental and Theoretical Investigations. J. Compos. Constr. 2017, 21, 04016092. [Google Scholar]
- Tobbi, H.; Farghaly, A.; Benmokrane, B. Behavior of concentrically loaded fiber-reinforced polymer reinforced concrete columns with varying reinforcement types and ratios. ACI Struct. J. 2014, 111, 375–385. [Google Scholar] [CrossRef]
- Teng, J.G.; Chen, J.F.; Smith, S.T.; Lam, L. FRP Strengthened RC Structures; John Wiley and Sons: West Sussex, UK, 2002; ISBN 978-0-471-48706-7. [Google Scholar]
- Di Nardo, A.; Faella, C.; Realfonzo, R. A design procedure of FRP confining systems for upgrade R/C columns. Proceedings in the Third international conference on FRP composites in civil engineering (CICE), Miami, FL, USA, 13–16 December 2006; p. 219. [Google Scholar]
- American Concrete Institute (ACI). ACI 440.1R-06, Guide for the Design and Construction of Structural Concrete Reinforced with FRP Bars, ACI Committee 440. American Concrete Institute (ACI): Farmington Hills, MI, USA, 2006. [Google Scholar]
- MacGregor, J. Reinforced Concrete Mechanics and Design, 3rd ed.; Pierson Inc.: Upper Saddle River, NJ, USA, 2012; ISBN 13 978-0132176521. [Google Scholar]
- Bank, L.C. Composites for Construction: Structural Design with FRP Materials; John Wiley and Sons: Hoboken, NJ, USA, 2006; ISBN 9780471681267. [Google Scholar]
- Lam, L.; Teng, J. Design-oriented stress–strain model for FRP-confined concrete. Constr. Build. Mater. 2003, 17, 471–489. [Google Scholar] [CrossRef]
- Lam, L.; Teng, J. Design-oriented stress–strain model for FRP-confined concrete in rectangular columns. J. Reinf. Plast. Compos. 2003, 22, 1149–1186. [Google Scholar] [CrossRef]
- Rocca, S. Experimental and Analytical Evaluation of FRP-Confined Large Size Reinforced Concrete Columns. Ph.D. Thesis, University of Missouri-Rolla, Rolla, MO, USA, 2007. [Google Scholar]
- Carey, S.; Harries, K. The Effects of Shape, ‘Gap’, and Scale on the Behavior and Modeling of Variably Confined Concrete; Report No. ST03-05; University of South Carolina: Columbia, SC, USA, 2003. [Google Scholar]
- American Concrete Institute. ACI 440.2R, Guide for the Design and Construction of Externally Bonded FRP Systems for Strengthening of Concrete Structures; American Concrete Institute: Farmington Hills, MI, USA, 2008. [Google Scholar]
- American Concrete Institute. ACI 318-08, Building Code Requirements for Structural Concrete; American Concrete Institute: Farmington Hills, MI, USA, 2008. [Google Scholar]
- Ray, S.S. Reinforced Concrete Analysis and Design; Blackwell Science: London, UK, 1995; ISBN 0-632-03724-5. [Google Scholar]
- Hadi, M.N.S.; Widiarsa, I. Axial and flexural performance of square RC columns wrapped with CFRP under eccentric loading. J. Compos. Constr. 2012, 16, 640–649. [Google Scholar] [CrossRef]
Figure 1.
Simplified interaction curve [7].
Figure 1.
Simplified interaction curve [7].
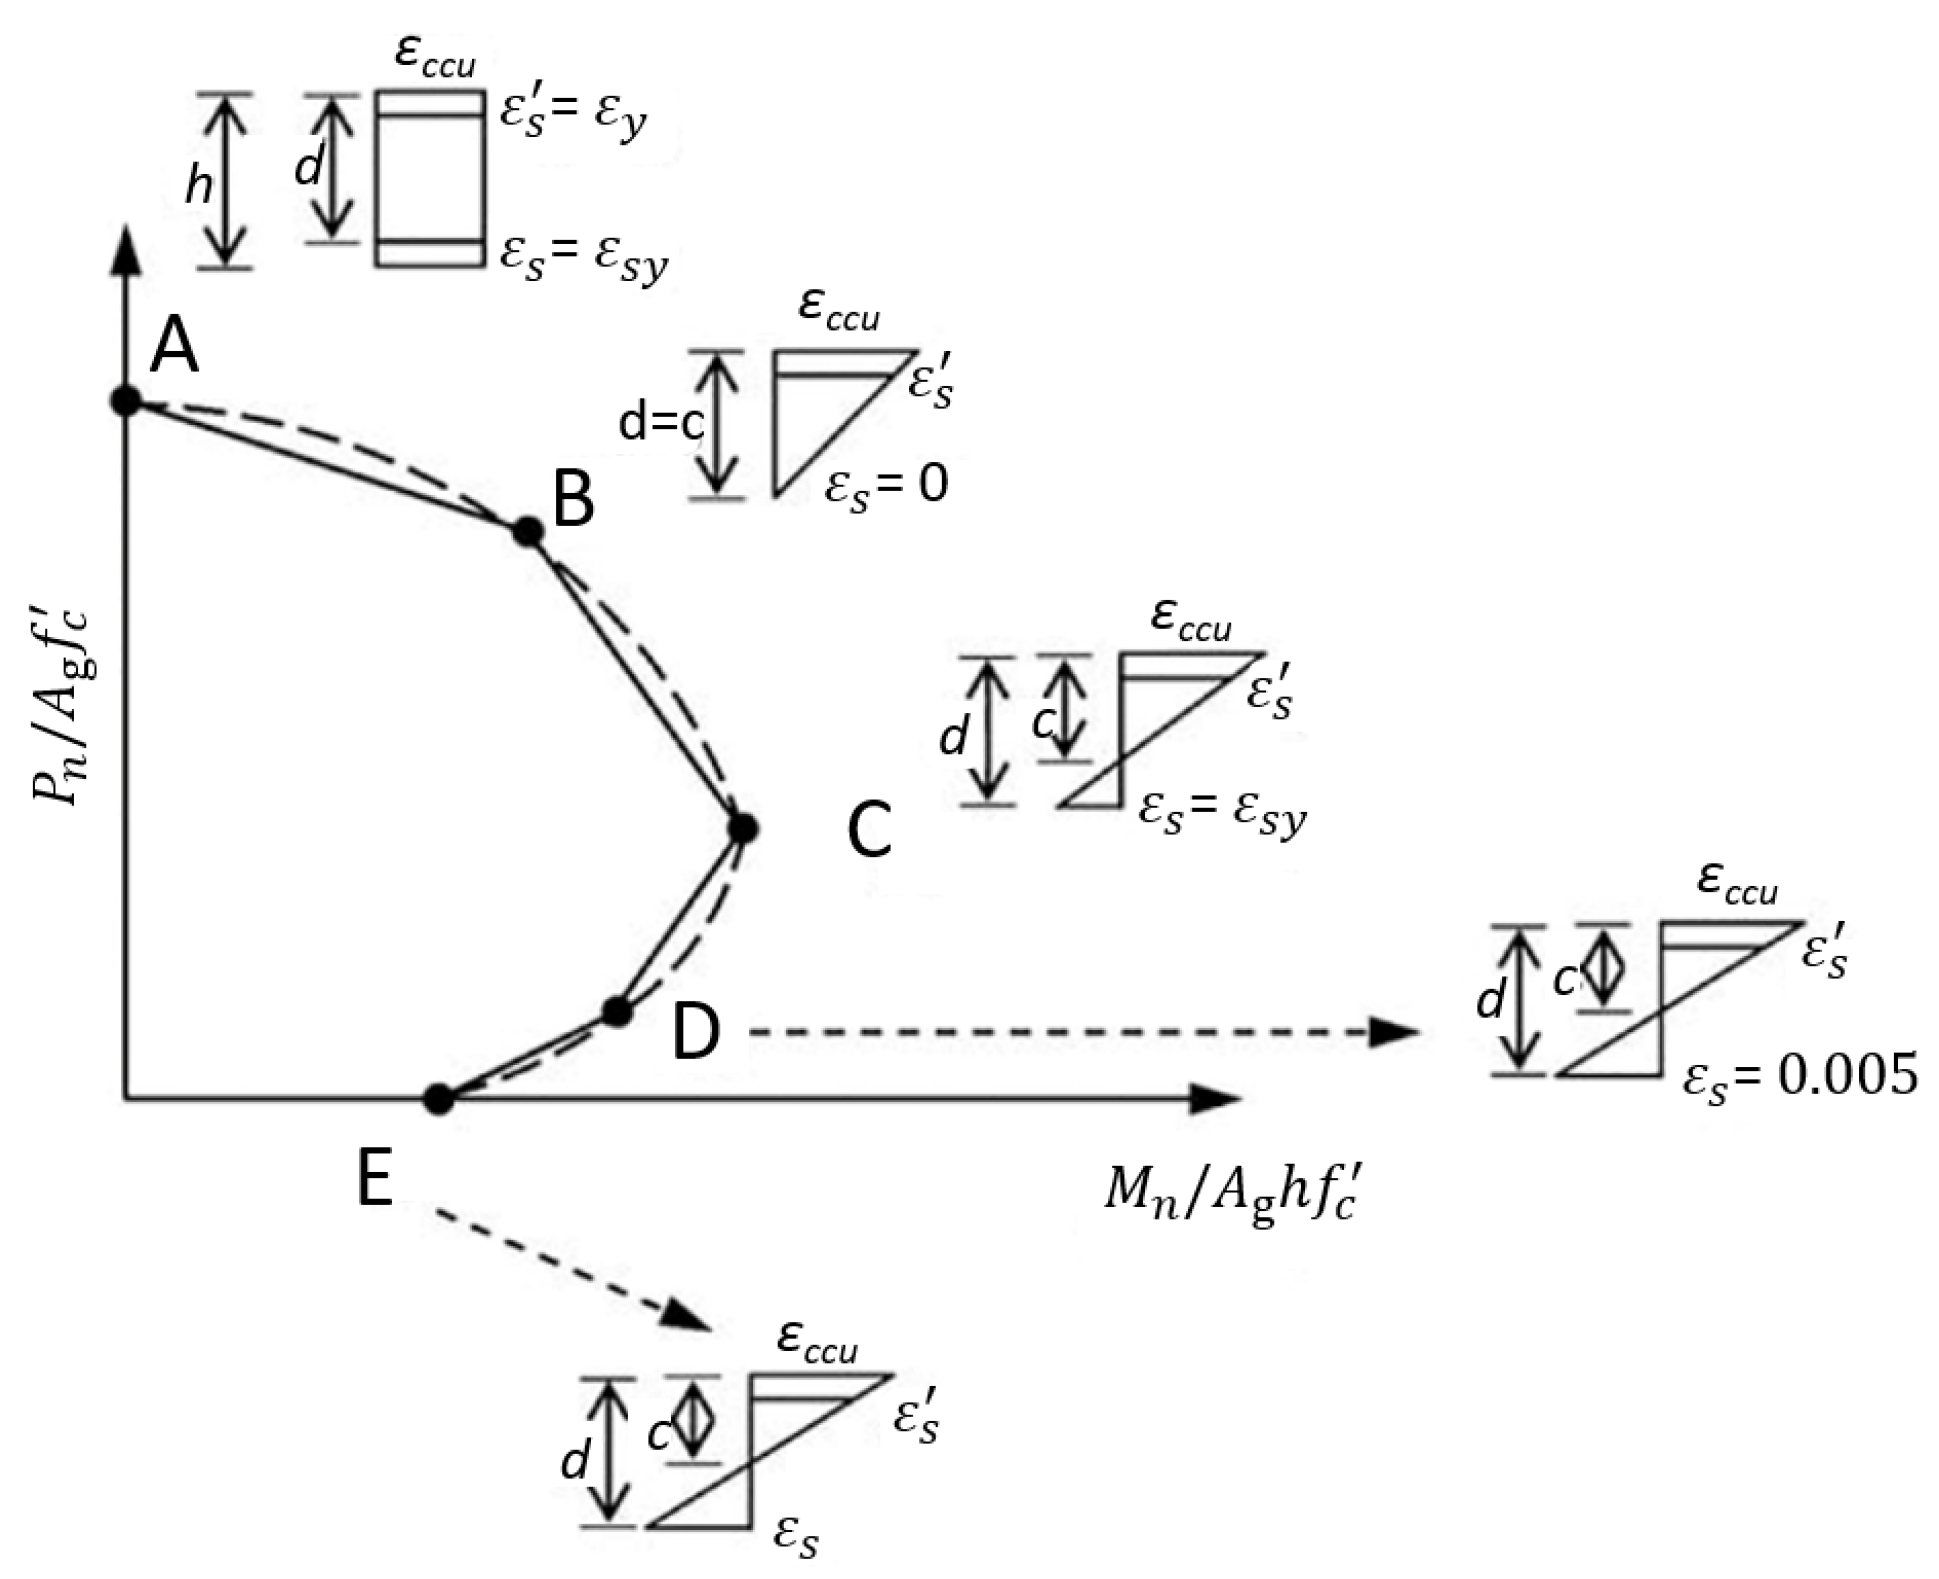
Figure 2.
Stress-strain curve of unconfined and FRP-confined concrete based on Lam and Teng model [23,24].

Figure 3.
Strain distribution diagram in the section.

Figure 4.
Interaction curve of S-225-75-L-1 column.

Figure 5.
Theoretical interaction curve for the S-225-75-T-1 specimen with the experimental P-M pair.
Figure 5.
Theoretical interaction curve for the S-225-75-T-1 specimen with the experimental P-M pair.

Figure 6.
Theoretical interaction curve for the S-225-75-LT-2 specimen with the experimental P-M pair.
Figure 6.
Theoretical interaction curve for the S-225-75-LT-2 specimen with the experimental P-M pair.
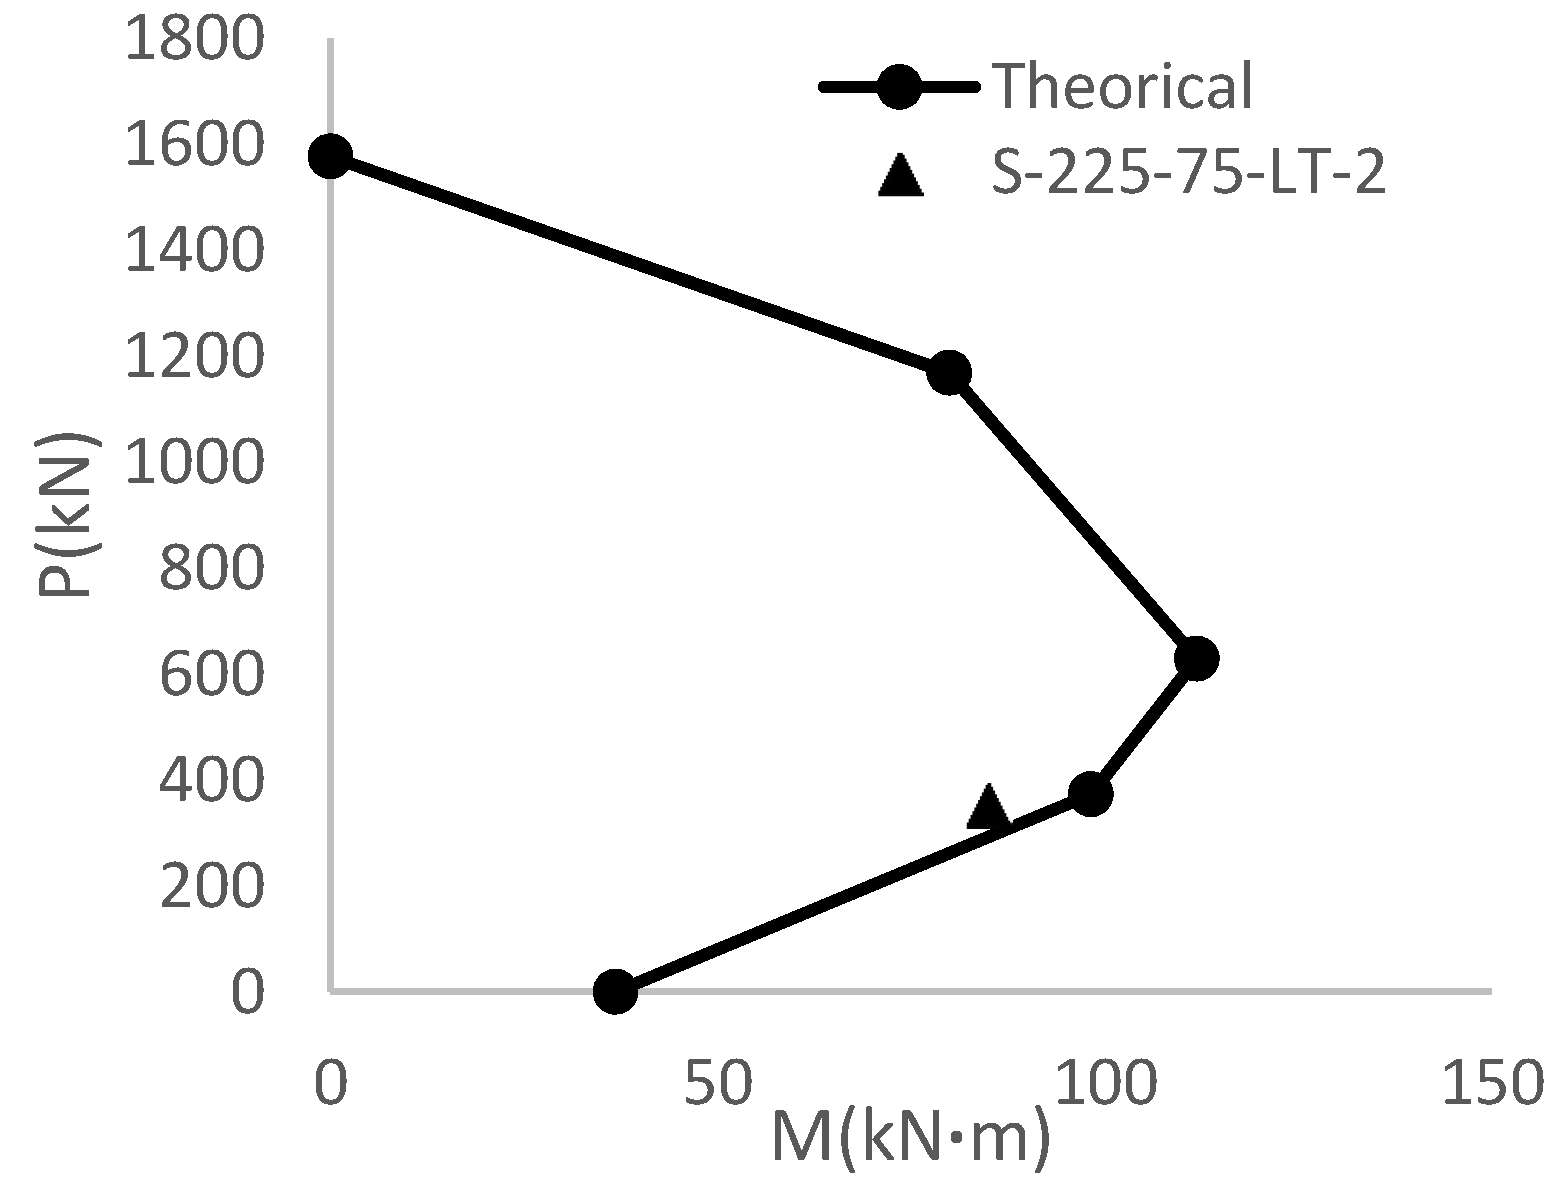
Figure 7.
Interaction curves developed using the proposed procedure in this paper and those derived from experimental results of Reference [7] (a) No2 interaction curve; (b) IA2-a interaction curve.
Figure 7.
Interaction curves developed using the proposed procedure in this paper and those derived from experimental results of Reference [7] (a) No2 interaction curve; (b) IA2-a interaction curve.
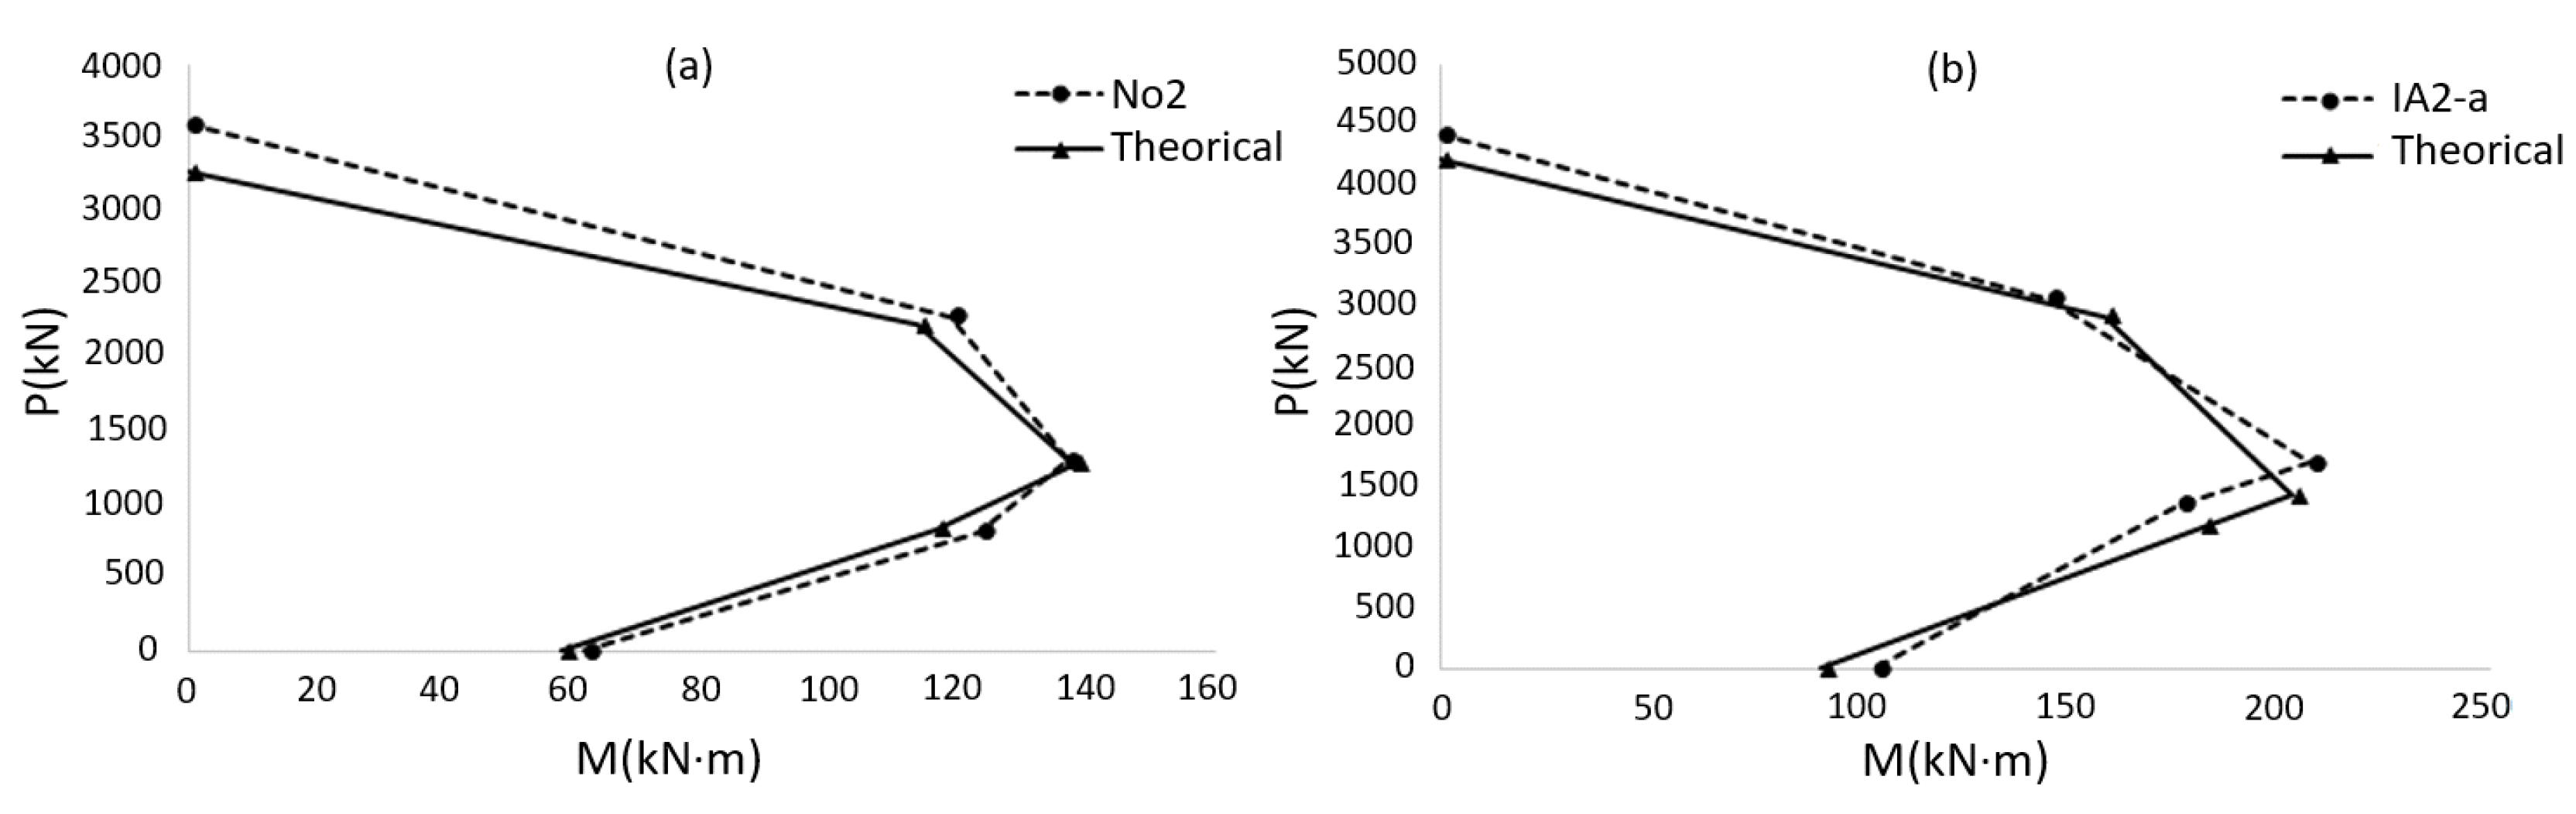
Figure 8.
Plan of the building under analysis (the retrofitted column is highlighted with a circle).
Figure 8.
Plan of the building under analysis (the retrofitted column is highlighted with a circle).

Figure 9.
Interaction curve for different retrofitting states.

Figure 10.
Plan and cross section of the column strengthened with longitudinal and transverse FRP materials.
Figure 10.
Plan and cross section of the column strengthened with longitudinal and transverse FRP materials.


Table 1.
Notations used in this paper.
| Cross-sectional area of concrete | Maximum compressive strength of the confined concrete | ||
| Effective confined area | Maximum tensile strength of FRP | ||
| Total cross-sectional area | Ultimate design tensile strength of FRP | ||
| Cross-sectional area of rebars | Yield stress of longitudinal rebars | ||
| Height of section | Maximum axial strain of the confined concrete | ||
| Width of section | Maximum axial strain of the non-confined concrete | ||
| Environmental reduction coefficient | Transient strain | ||
| Slope of linear section of confined stress-strain curve | Maximum strain of FRP | ||
| Elasticity module of concrete | Maximum ultimate design strain of FRP | ||
| Elasticity module of FRP | Equivalent yield strain of rebars | ||
| Strength reduction coefficient | Strength reduction coefficient of FRP |
Table 2.
Geometrical and strength specifications of the columns studied by Rahaee and Akbarpour [2].
Table 2.
Geometrical and strength specifications of the columns studied by Rahaee and Akbarpour [2].
Table 3.
Failure (ultimate) loading results of the columns studied by Rahai and Akbarpour [2].
Table 3.
Failure (ultimate) loading results of the columns studied by Rahai and Akbarpour [2].
| Column | |||
|---|---|---|---|
| S-225-75-L-1 | 296.69 | 22.5 | 66.76 |
| S-225-75-T-1 | 274.62 | 20.6 | 61.8 |
| S-225-75-LT-2 | 352.78 | 26.5 | 79.4 |
Table 4.
Specifications of materials, cross-section dimensions, and internal actions of the considered column.
Table 4.
Specifications of materials, cross-section dimensions, and internal actions of the considered column.
Table 5.
Specifications of FRP jacketing sheets used in the case study.
© 2017 by the authors. Licensee MDPI, Basel, Switzerland. This article is an open access article distributed under the terms and conditions of the Creative Commons Attribution (CC BY) license (http://creativecommons.org/licenses/by/4.0/).
Share and Cite
MDPI and ACS Style
Manie, S.; Jami, E.; Azarian, Z. Simplified Design of FRP-Confined Square RC Columns under Bi-Axial Bending. Buildings 2017, 7, 74. https://doi.org/10.3390/buildings7030074
AMA Style
Manie S, Jami E, Azarian Z. Simplified Design of FRP-Confined Square RC Columns under Bi-Axial Bending. Buildings. 2017; 7(3):74. https://doi.org/10.3390/buildings7030074
Chicago/Turabian StyleManie, Salar, Ehsan Jami, and Zana Azarian. 2017. "Simplified Design of FRP-Confined Square RC Columns under Bi-Axial Bending" Buildings 7, no. 3: 74. https://doi.org/10.3390/buildings7030074
Note that from the first issue of 2016, this journal uses article numbers instead of page numbers. See further details here.