Where in Connecticut Is the Best Location for a Split Tax? An Analysis of Land Assessment Equity in Several Cities


1
Center for Real Estate and Urban Economic Studies, School of Business, University of Connecticut, 2100 Hillside Road, Unit 1041-RE, Storrs, CT 06269, USA
2
Fedele Group LLC, Londonderry, NH 03053, USA
*
Author to whom correspondence should be addressed.
Buildings 2017, 7(4), 108; https://doi.org/10.3390/buildings7040108
Submission received: 26 July 2017
/
Revised: 25 September 2017
/
Accepted: 26 September 2017
/
Published: 28 November 2017
(This article belongs to the Special Issue Real Estate Economics, Management and Investments)
Abstract
:The ability of local assessors to accurately estimate land values separately from structure values is important when considering a split tax. When the value of land is estimated with less variation, there is greater equity. We examine land ratios in New London, New Haven, and Hartford Connecticut and sub-groupings within these cities for 2006 to 2010. Overall, the land ratios coefficients of dispersion (COD), a measure of horizontal equity, are too large for an equitable split tax. We also look at land assessment equity among sub-groupings of properties near parks, highway exits, airports, Yale University (for New Haven), residential versus commercial properties, land with old versus new properties, and large versus small parcels and ‘expensive’ versus ‘less expensive’ properties (by examining price per square foot). Commercial properties near Hartford’s Brainard Airport are the best candidates for an equitable split tax. We also find that more frequent revaluations are necessary for an equitable split tax.
1. Introduction
An important issue in the implementation of a split tax is the ability of local assessors to accurately estimate the value of land separately from the value of structures. A land tax or a split tax in jurisdictions that are able to more accurately pinpoint the value of land will be more equitable across landowners than in jurisdictions that have more variation in the accuracy of land assessments. If state and local policy makers can gain a clearer understanding of which groupings of properties have more accurately assessed property values, either in a particular city or in sub-groupings of properties within particular cities, this could help them to argue the case that a targeted split tax would be more equitable in terms of assessment accuracy across landowners. A helpful referee suggested that a land value tax in a sub-section of a city might introduce another degree of inequity because some people in the city would be subject to the land value tax while others would not. There is a precedent for considering this type of segregated application in the literature, as in [1].
Given the recent interest in potential split tax implementation in Connecticut, an understanding of which jurisdictions in the state would be best suited to implement such a tax in terms of the accuracy of land assessments may help policy makers to decide where in Connecticut to authorize a split tax. This research project investigates several of the related issues involved in implementing a land tax, with a particular focus on Connecticut cities/towns. The quality of land assessment data and how the value of land can be separated from a total sales price are crucial considerations in validating the feasibility of a split tax.
1.1. Background: Split Taxation
The property tax is perhaps the most important source of revenue for local governments in the United States [2]. It funds everything from police and fire protection to education, roads, libraries, and public parks. Property owners within a jurisdiction exercise significant control over the substance, quantity, and quality of public services. People often choose where to live based on the public services offered [2]. Despite its lack of popularity, the property tax is accepted by most property owners and fairly easy to understand.
With a few exceptions, property tax programs in the United States involve the levy of the same tax rate against the entire property. The real property includes land and improvements to the land. A tax on improvements, however, is a disincentive to invest in a property. Especially where the market for improvements is in transition, and where the best use of the land is an alternative use to the current use, a property owner is unlikely to maintain the existing buildings and pay the higher property taxes associated with a well-maintained structure [3].
Since property tax is levied against improvements, it distorts producer and consumer behavior [4]. In a competitive market, the property tax, like other taxes, will lower the price received by the producers and increase the price paid by the consumer. This results in a drop in improvements to the land. While there is a benefit from the government when it spends the property tax revenue, this benefit is less than the value of the lost improvements due to the lower tax on improvements [5], and, since the amount of the tax levied by the government is less than the loss in overall surplus, the property tax is an inefficiency known as a dead-weight loss.
Henry George proposed a relief to this disincentive. In Progress and Poverty, George suggested that a tax on land would not only eliminate the disincentive to capital improvements to land, it would also encourage the property owner to best utilize the land [6]. To be most effective, the tax on land must be based on the value of the land at its ‘highest and best’ use. While Henry George argues that land ought to be held publicly and rented to the ‘highest bidder’, he acknowledges that confiscation of land is not possible. George suggests that, instead of confiscation, tax on land rent would lead to the same results. The concept of highest and best use is well developed by appraisers and tax assessors and is defined as ‘…the use that will generate the highest net return to the property over a period of time’ [3].
If supply of land is perfectly inelastic, there can be no dead-weight loss caused by the property tax. Since the supply of land is fixed and perfectly inelastic, a property tax on land cannot shift the supply of land. In fact, a nearly confiscatory tax on land will not shift the supply of land. Such a tax will only make many landowners angry. A current debate surrounds the effects of local zoning. It is argued that zoning constricts the elasticity of the real estate market to the extent that the supply is inelastic. Since the supply of the real estate market is inelastic, the property tax on land and improvements does not result in a dead-weight loss [2]. In contrast, others have explained that the portion of the property tax spent on improvements measurably depresses the return of capital to the producer and, therefore, does result in a dead-weight loss [7]. Regardless of these arguments, the supply of land is substantially fixed and can be taxed without altering behavior in the market [4].
A compromise between the traditional, overall property tax and a land tax has developed. If land is simply taxed at a higher rate than improvements, then the benefits of a land tax can be achieved with only a small loss in capital to the producer. The experiment with this ‘split-rate’ tax has been attempted in several jurisdictions in the United States. The results in these jurisdictions are somewhat controversial [8]. See [4] for several examples of the split tax in the U.S., including Pittsburgh, PA, and Hawaii.
Background: Split Tax in Connecticut Cities
In 2008, the State of Connecticut ventured into the split-rate tax experiment. The City of New London was scheduled to complete its revaluation for the 2008 tax year. The city had been identified as a ‘distressed municipality’, and it was hoped that the split-rate tax would encourage economic development. The City of New London had the option to study the impact of the split-rate tax and not adopt the program. New London would report back to the legislature the results of its study by December 2009, including the legal and administrative issues that it discovered. Eventually, New London opted not to adopt the split-rate tax. The opposition by those who stood to lose with the new configuration, plus the opposition by those who misunderstood the tax or simply opposed any new tax, overwhelmed the advocates of the program.
In 2011, the legislature proposed expanding the split rate program to up to three municipalities. Senate Bill 130 strikes the ‘distressed municipality’ requirement from the previous legislation and also strikes the previous language that otherwise limited the program to the City of New London. According to Senator Martin Looney, who introduced the revisions, there were no cities or towns specifically contemplated by the legislation. As a result of our past personal communications with the City of New Haven’s assessor, we learned that the City of New Haven was contemplating this new split-rate option.
Data from the City of New Haven, which is one of the largest cities in Connecticut and the location of Yale University, as well as a less detailed data set for the cities of Hartford (which is the state capital of Connecticut) and New London, have been obtained. We use these data—specifically, the assessed values, the sales prices, and the sale years—in the analyses that follow. Tables of the descriptive statistics for our key measures are included below; a more detailed set of descriptive statistics for the data is available upon request.
We examine the following issues:
- The issue of isolating land assessments from total assessments.
- The overall equity in assessments in a heterogeneous jurisdiction and the implications of extrapolating land assessments from this data.
- The equity in assessments of validated sales when the value of capital improvements is removed from the assessment and the sale price.
- The change in degree of assessment equity in a jurisdiction where the assessed values are updated only once every five years. Our emphasis is on the change in assessment equity when isolating land values from capital improvement values.
1.2. Land and Site Valuation
Curiously, one of the main problems with the land tax was never vetted in the City of New London’s study. The fact is that land is notoriously difficult to accurately value. Land is difficult to value because there are relatively few market sales of vacant land, and, when vacant land is sold, it tends to have significant capital invested in achieving its highest and best use [3]. Even when the land is improved with a new structure, land value can be hard to measure. Mass appraisal techniques used to value land for tax assessments magnify this issue. See [9] for background on appraisal and mass reappraisal. The International Association of Assessing Officers suggests that, as a class, land can be regarded as accurately assessed as a class with a relatively high overall variation from sale prices [10]. There is no measure of accuracy contemplated for land when it is improved.
First, land should be distinguished from improvements. ‘Raw’ or ‘undeveloped’ land is said to have no improvements, but ‘raw’ land does not really exist, and, if it did, it would not likely have a market. Consider that there is a capital cost to the road and utilities that access the land. For land that is on the market, there are several soft costs that an owner typically makes in order to diminish the speculative nature of acquiring land. These may include surveys, engineering studies, and marketing feasibility studies. These improvement costs decrease the speculative nature of the land and increase the value. Almost all land, then, is not raw and involves some improvement costs. These parcels of land are referred to as sites [11].
Perhaps the most difficult aspect of accurate site valuation is establishing the highest and best use. Even sites that have substantial improvements might have a highest and best use other than their existing use [3]. In mass appraisal, capturing these transitional uses in site value is almost never accomplished. While an existing use is strong proof of a highest and best use, it is not always true. For example, a sixty year old factory next to a rapidly expanding retail zone may continue as a factory for several more years. Its site value, however, is more likely a retail site value and not a factory site value. The benefit of economic growth for Hartford, New Haven, and New London through higher land taxes based on both higher rates and higher values may be easily missed in a mass appraisal program.
In particular, condominiums, cooperatives, and time-shares pose a particular difficulty to the assignment of land values. The site for each of these ownership types is commonly owned; each condominium owner has an interest in the land [3]. Ownership, however, does not end at land. Each owner has an interest in the ‘common’ elements such as a clubhouse, tennis courts, and a swimming pool. Culling the value of ownership of the unit from ownership of the common elements is a difficult and uncertain exercise. The value of the total ownership is much easier and certain. For this reason, many assessors simply appraise the total ownership and do not assign a separate site value. This is the case in Hartford, New Haven, and New London. No site values were assigned in the 2008 New London revaluation or the 2006 Hartford and New Haven revaluations. Due to these difficulties, we ignore condominiums in our analyses.
Where adequate market data, especially the sales of sites, exist, reliable site and land assessments are possible. A study of residential site assessments in the City of Edmonton, Canada, suggested that a land tax could be equitably applied [12]. The study examined site transactions in both urban and suburban areas of the city. It also examined the accuracy of site values on improved residential properties. While the Gloudemans et al. study illustrated the capacity to allocate land value in a mass appraisal model, the study’s focus on single family, residential property avoided the more volatile markets in commercial and industrial properties. While the model presented is probably the only transferrable model to commercially-developed computer assisted mass appraisal programs, its applicability to commercial property valuation is questionable. Accordingly, our study examines both commercial and residential (non-condominium) properties in Hartford and New Haven and attempts to determine how both large and small assessment errors would impact the equity of a split tax in New Haven.
Chapman [13] suggests that inaccurate site assessments do not reduce the benefits of a land tax. The study argues that even large levels of error in land valuation ‘avoid(s) the misallocation of resources imposed by a conventional property tax’. The formula for proof, however, does not consider the consequences of large levels of error in land valuation. For example, where the assessment of the tax in error is low due to an incorrect best use, the tax will not act as a compelling reason to change the use to its most productive form. Where the assessment of the tax in error is high, it becomes difficult to differentiate the tax from a conventional property tax; the effective tax would be to draw the same resources from the landowner as if it were a conventional property tax. The study finally does not recognize the difficulty in administering a tax where large levels of error occur. High error levels are likely to result in more appeals and pressure to either eliminate the tax or correct the program. See [14] for an in-depth review of the property tax appeal process.
Cities of Hartford, New Haven and New London
The State of Connecticut requires municipalities to assess property for tax at least once every five years. Since residential property has tended to increase in value faster than other classes of property such as commercial property and business personal property Connecticut cities and towns will not re-assess more frequently. Doing so results in a shift in the tax base to the voting constituents of the jurisdiction. In the 1980s, Connecticut permitted its cities and towns to further avoid this shift in tax base by allowing a phase-in of assessments over the five-year assessment cycle. Hartford was permitted to offset these shifts in the tax base not only by phasing-in assessments but also by including a surcharge on the property tax for commercial real estate, industrial real estate, and business personal property. This surcharge expired in 2010, just before Hartford’s 2011 revaluation.
Due to the five-year cycle in revaluations, our study examines assessed values starting in the first year of a revaluation and continuing through its last. For the city of Hartford, the study examines the last year of the city’s revaluation, 2006, through the year 2010. For New Haven, the data in our study covers 2006 (the year of their last revaluation) through 2010, while the geographic information system (GIS) data we obtained for New Haven (which we use to calculate distances to parks, Yale University, highway exits, and the airport) covers 2007 through 2010. New London completed its revaluation for its tax year, 2008 to 2009. Prior data for New London was not available, so New London is reviewed from 2008 to 2009 through to 2009 to 2010.
There were no qualified land sales in the first year of any of these cities’ revaluations. This is not unexpected, as these cities are well-established and relatively densely developed. The fact that there were no land sales, however, means that the assessors cannot utilize the most reliable mass valuation technique for land assessment, the comparative sales approach [3]. More likely, in New London and New Haven, the assessor used an allocation technique, in which the depreciated cost of the improvements is deducted from the sale price [11]. According to our personal communications with the Hartford assessor, an additional technique was employed using an income capitalization technique to allocate land values. The allocated land values are then used to adjust the land tables for the mass appraisal of sites within the city [3]. Our study employs this technique in the examination of site value ratios.
2. Approach
The International Association of Assessing Officers (IAAO) has promulgated standards for these statistical indicators, which have been adopted by states, local jurisdictions, and courts (IAAO Standard on Mass Appraisal [15] and IAAO Standard on Ratio Studies [10]). The most common tool is the assessment ratio. The assessment ratio is calculated by gathering a sample of ‘qualified’ sales (at the parcel level), and measuring the tax assessment for each sampled property against the sale price of that property. A ‘qualified’ sale is a transaction between a typically motivated buyer and a typically motivated seller. A sale between family members, a foreclosure sale, a sale by the government, a transfer to or from a charitable entity, and auction sales are examples of reasons to disqualify a sale. An assessment divided by the sale price produces an assessment ratio for a single observation. The sample of sales is used to generate an estimate of a total assessment ratio for the jurisdiction. The total assessment ratio is typically the median ratio within the sample. The median is favored because it discounts the influence of outlier ratios and multimodal results. A mean, or average, ratio is calculated as a tool for determining assessments using regression analysis. For a split tax, it is crucial to extract the value of land from each property’s overall sale price in order to calculate a separate ratio for land since the accuracy or quality of the land assessment is important.
All jurisdictions in the United States use market value as the standard to measure the equity of assessments. Some states, including Connecticut, tax property at a percentage of the market value. Connecticut assesses at 70% of the fair market value of property in the year of a revaluation. Connecticut mandates reassessments once every five years, so the mandate for a 70% ratio is only for the first year of the revaluation. The ideal assessment ratio, therefore, in most states is 100%, while the ideal ratio in Connecticut is 70%.
Dispersion or variation from the ideal assessment results from many factors. Since the most common tool for measuring an assessment level is the median ratio, the preferred tool for measuring overall equity in the program is the coefficient of dispersion [10]. The coefficient of dispersion (COD) is calculated by averaging the absolute deviation of each observation from the median. This average is then divided by the median to determine the coefficient of dispersion. The coefficient of dispersion is a preferred tool, wherein the observations of ratios are non-parametric. A large coefficient of dispersion implies that more property owners are either over- or under-assessed, which is a way to measure equity in assessments.
For Connecticut cities and towns, there can be variation (or dispersion) from the 70% ratio for several reasons, some of which we explore. In the year of a revaluation, the State of Connecticut requires the overall level of assessment for all property classes to be within ten percent of the 70% ratio, have a COD of less than fifteen percent, and have a price-related differential between 0.98 and 1.03 (C.G.L. §12-62-3(b) et. seq.). Guidance on achieving this overall performance in assessments in the year of a revaluation is provided by the Connecticut Association of Assessing Officers [16].
Given the importance of disentangling values of land from total sales prices, we deduct the assessed value of the improvements from the sales price of each property that sold in our sample for each city. We then calculate a ratio of land assessments to the adjusted sale price. The IAAO ‘Standard on Ratio Studies’ suggests that a coefficient of dispersion of 20 or less indicates good performance for land assessments.
Of similar importance, we examine the performance of the assessment program and the land assessments over a period of years, starting with the year of revaluation. Since state law requires a reassessment once every five years, the reassessment establishes the basis for the next five years. Changes in markets for the different classes of properties and changes in the physical conditions of properties result in a natural degradation of the quality of the assessment program. Also, the time-frame examined includes significant volatility in real estate markets.
3. Results
3.1. New London
Assessment ratios in the year of a revaluation should meet certain standards in order to qualify the success of the assessment program. The City of New London’s population of real estate is heterogeneous in both the classes of property and the variety of property within those classes. In addition, the city’s total population of properties is quite small; only 7275 parcels. We examine all ‘qualified’ sales of real estate in New London from 1 October 2007 through 31 September 2009. This period (October through September) corresponds with the tax years 2008 and 2009 and is the term used by the state to calculate assessment ratios for municipalities. Since no land or site value is calculated by the city for condominiums, condominiums were not examined in this study. An assessment ratio of 100 percent for appraised values and 70% for assessed values should be achieved within a certain level of accuracy (C.G.L. §12-62-3(b) et. seq.). Considering the complexity and variety of property in New London, a coefficient of dispersion of fifteen percent or less should be achieved in the year of a revaluation [10].
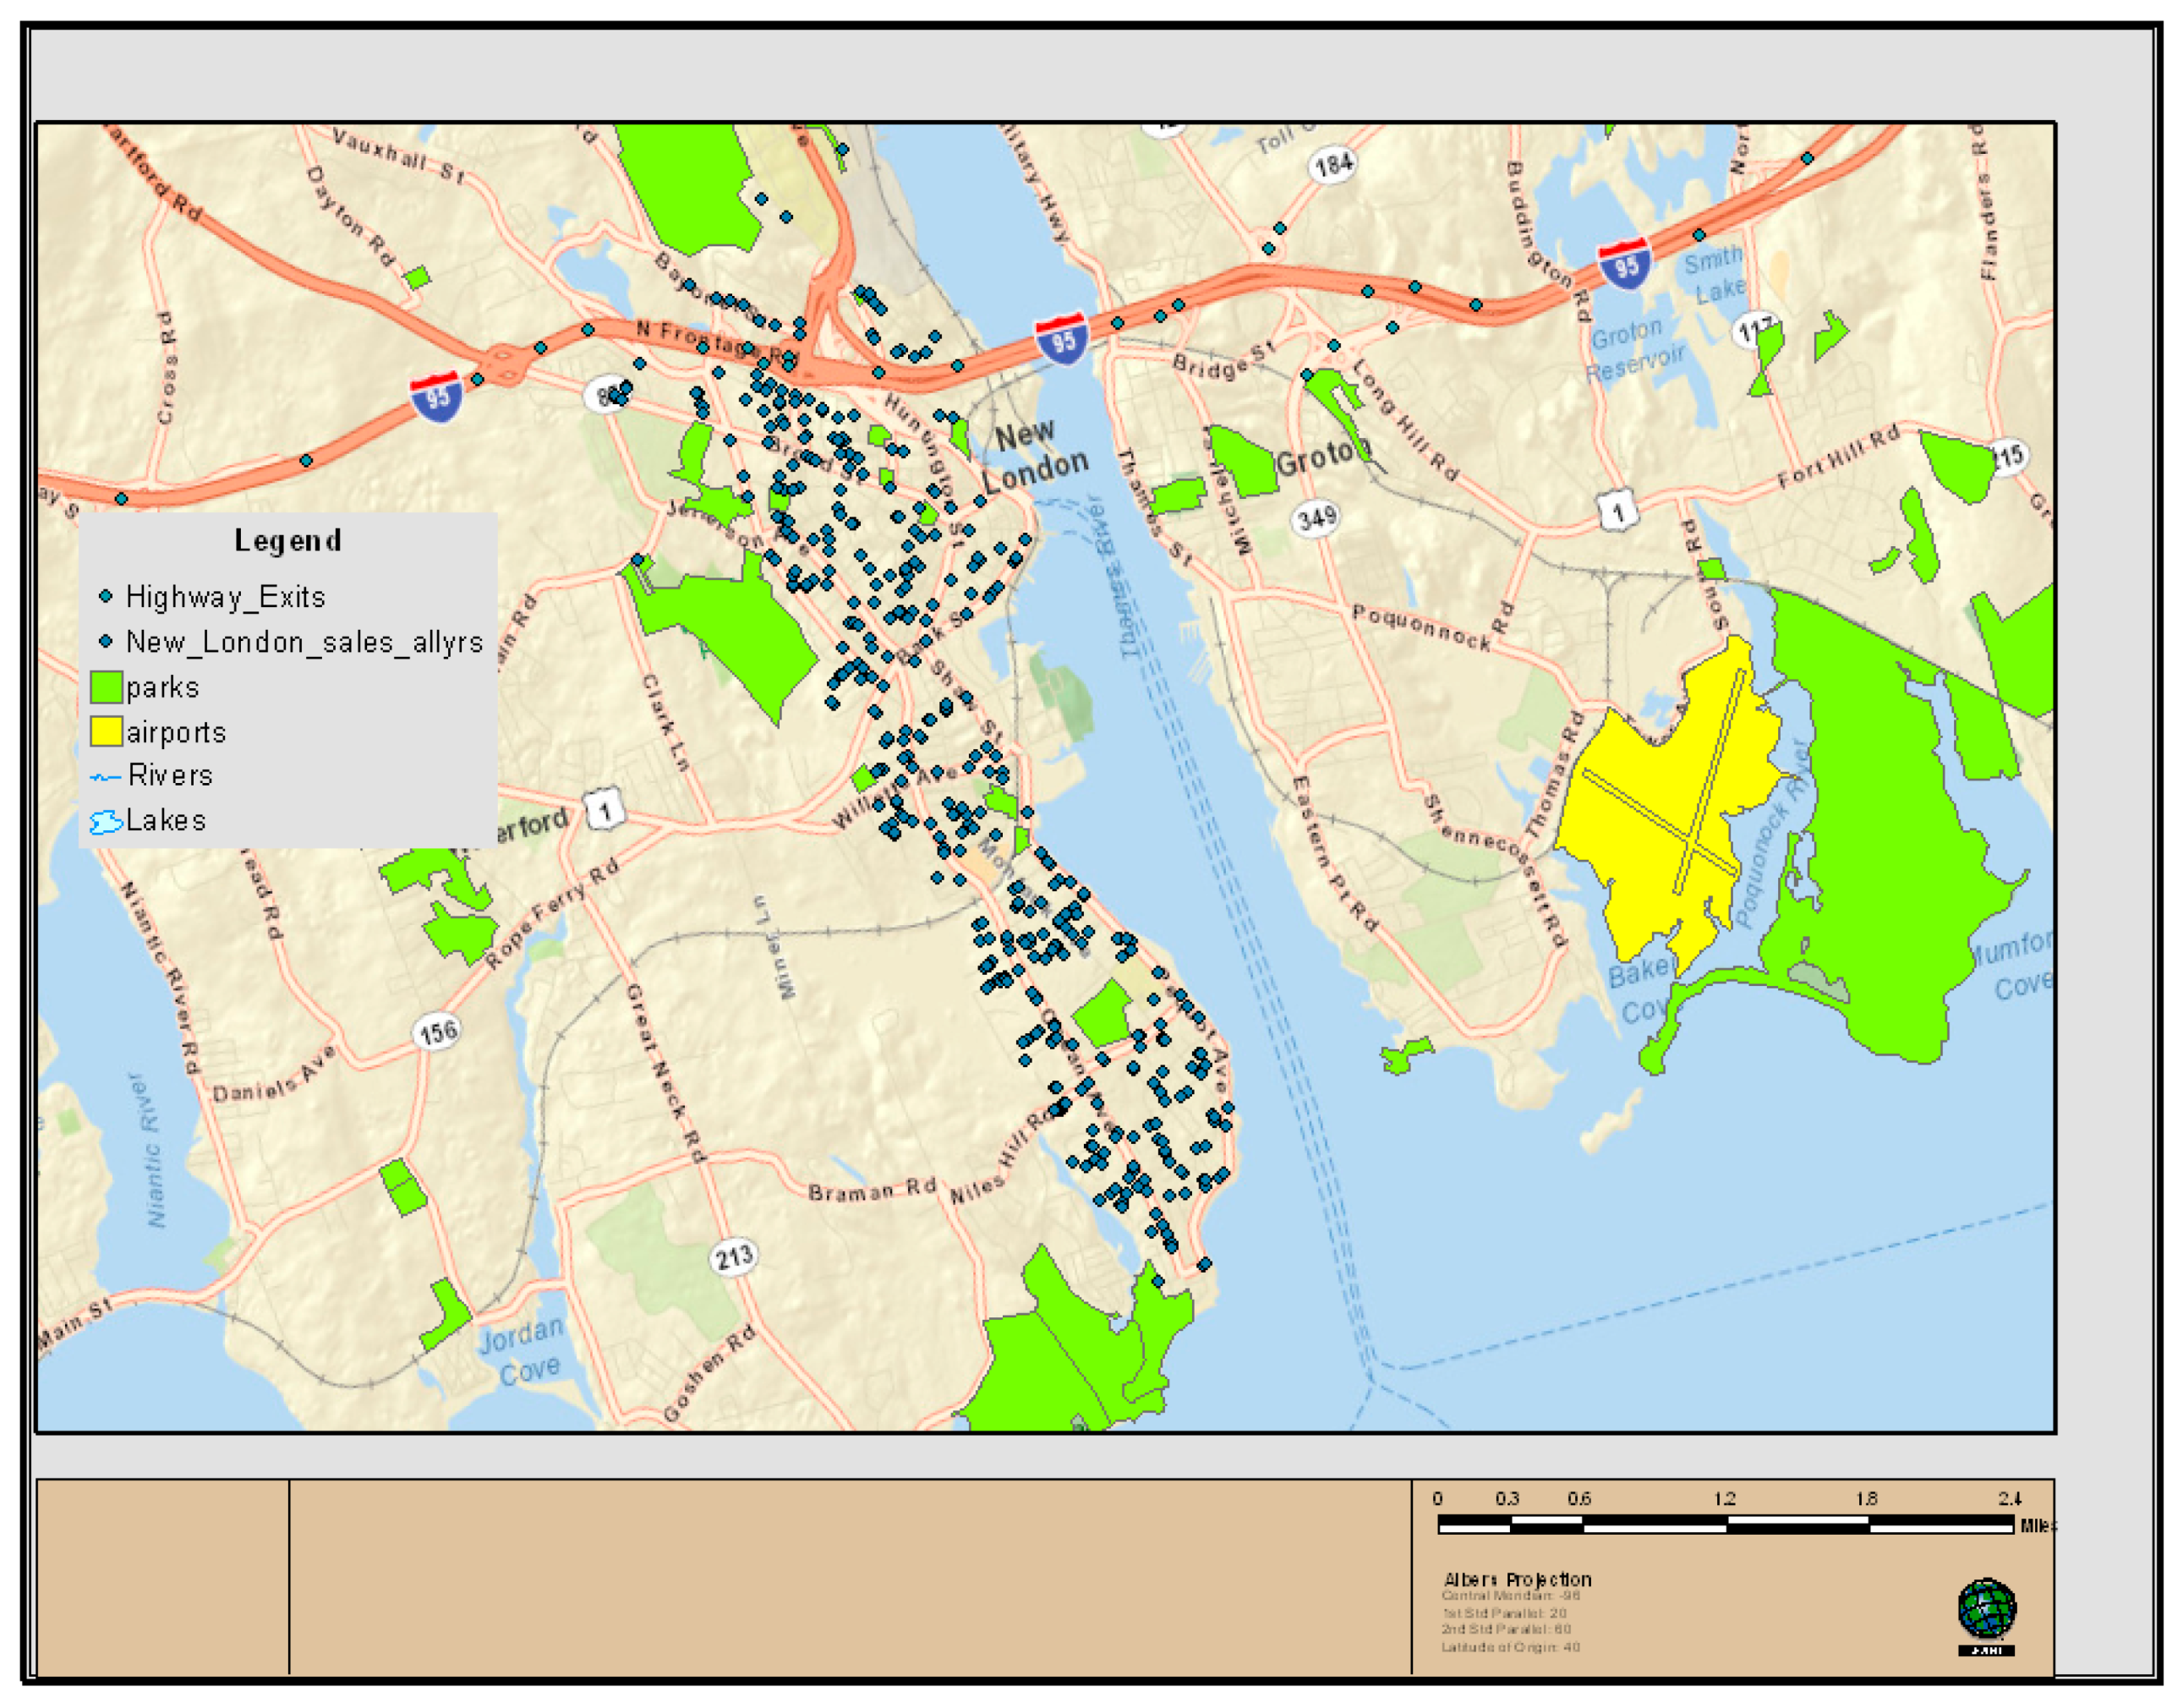
In the selected term, there were only 205 ‘qualified’ sales. The locations of these sales, along with the locations of highway exits, the airport, and parks, can be seen in Figure 1. Of these 205 qualified sales, 182 were single family residential properties. Twenty two were two-family or three-family residential properties. One was a multifamily apartment building, which may be regarded as a commercial class or a residential class property. There were no industrial properties and no site sales in any class of property. Normally, ratio studies are dominated by observations of residential class properties. Residential properties tend to represent the largest pool in the total population of property classes. Residences also tend to turn-over more frequently in real estate markets. In New London, residential class properties, including multifamily properties, represent eighty-four percent of the total. Due to the lack of qualified sales of properties from other classes, the sample is not representative.
For small jurisdictions like New London, the lack of adequate sales to support assessments means reliance on alternative valuation methods that lack substantial confidence. Even for commercial and industrial class properties, where an income approach to value can be utilized, the development of capitalization rates without actual sales can be less accurate.
Where the sample does represent eighty-four percent of the city’s parcel population, our study tests the accuracy of the assessment program as it pertains to residential properties. We examine the appraised values in addition to the assessed values as an approach to extracting the site value (explained in more detail below). While the purported goal of a revaluation is to appraise all property at 100% of the market value, most programs target between 95% and 98%. Assessors target these lower levels for two reasons. First, an assessment program with a ratio between 95% and 98% will still likely be accurate enough to meet a high confidence level in a null hypothesis analysis that the ratio is 100%. Second, since the ratio is measured as a median, if the actual ratio is 100%, then half of all assessments will exceed the market value. By targeting a lower ratio, the assessor will meet the market value requirement and will have fewer complaints of over-assessment.
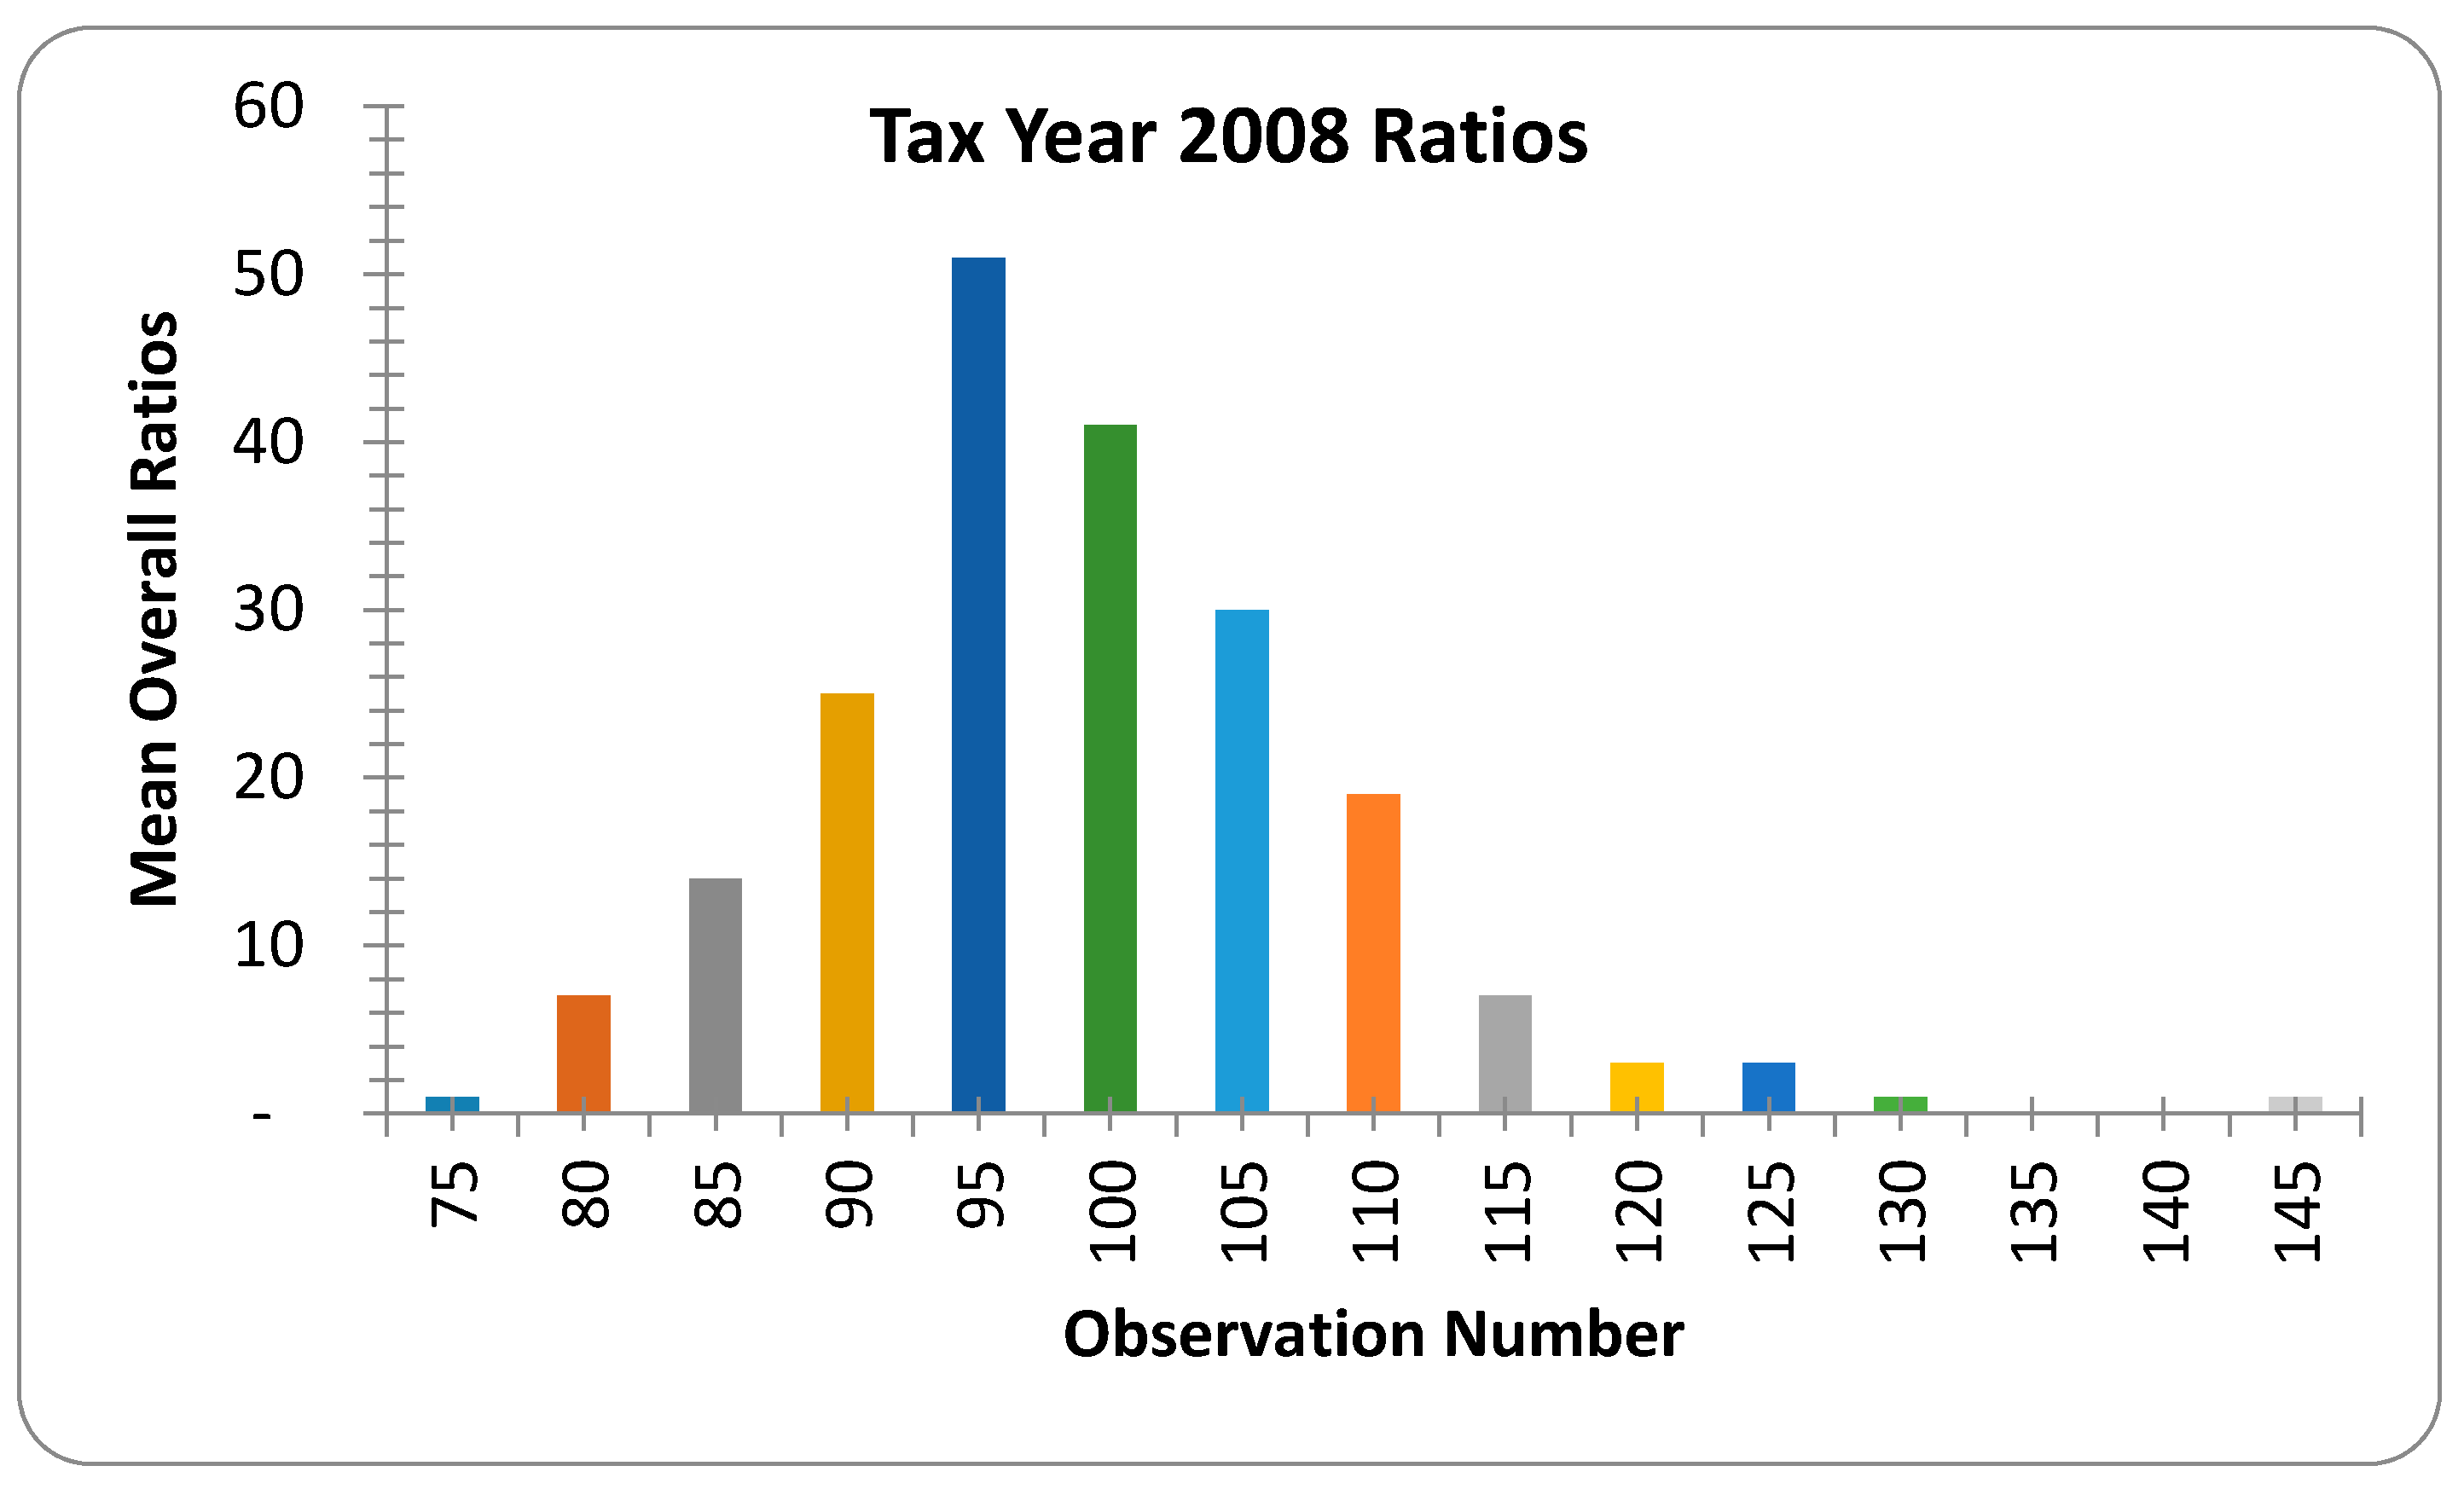
The median ratio is 96%, with a coefficient of dispersion of 7.7. The mean ratio is 97%, with a standard deviation of 9.89. The distribution is unimodal (see Figure 2), with a low degree of dispersion, as indicated by the small standard deviation. There is only a slight skew apparent to the higher ratios. These results are fairly remarkable considering the complexity of the residential pool of properties. They suggest a high degree of accuracy for the assessment of residential properties. They also suggest that additional extrapolation may be permissible.
Since there was a high degree of accuracy in the total assessment of residential class property, extracting the assessed improvement value may reveal accurate site values. Specifically, since (LV + IV) = AV and AV = SP, then (AV − IV) = (SP − IV), where LV is assessed site value; IV is the assessed improvement value; AV is the appraised value; and SP is the sale price. If the extracted appraised site value is accurate when measured against the extracted site value from the sale price, then the use of the site value in a split rate tax will have better results.
Unfortunately the results are poor. The median ratio for the improvement extracted sample is 90%, with a coefficient of dispersion of 24.5. The mean ratio is 97% with a standard deviation of 46.8. As explained above, the International Association of Assessing Officers standard for a coefficient of dispersion for land is 20. The graphed results show a very different result from the overall assessment ratio. Instead of the standard normal model, Figure 3 shows a tri-modal result, skewed to the left, with several outliers. These results indicate that, even with an excellent overall assessment program, New London site values cannot simply be extracted for accurate results. The distribution of the land tax in a split rate program would result in inequities.
These results are also examined to determine if vertical inequities exist. The mean ratio and the standard deviation and the median ratio and the coefficient of dispersion are measures of horizontal equity. An assessment program, however can also suffer inequities between the treatments of high value properties versus low value properties. The price-related differential (PRD) is the tool advocated by the International Association of Assessing Officers to measure whether an assessment program is progressive, regressive, or neutral. The goal of an assessment program is to be neutral.
The PRD is calculated by dividing the mean of the observations by the weighted mean. A weighted mean is calculated by summing the assessments, summing the sale prices, then dividing the sum of the assessments by the sum of the sale prices. For a neutral program, this calculation should be close to 1.00. When the PRD is over 1.00, the program is regressive, or lower valued properties are assessed as higher than higher valued properties. If the PRD is less than 1.00, the program is progressive. Ideally, the PRD should fall within a range of 0.98 and 1.03 [10].
Since assessment programs tend to produce non-parametric results, the PRD has been criticized as not accurately reflecting inequity. The PRD employs the mean, which is a superior tool when the assessment ratios follow a normal distribution. Recently, an alternative tool to measure bias in non-parametric results has been reviewed by the International Association of Assessing Officers. The tool is referred to as the price-related bias (PRB). The coefficient of the PRB is obtained by regressing percentage differences from the median assessment ratio on percentage differences from the median value. The regression coefficient quantifies the relationship between property values and assessment levels. [17]. Where the PRB has not been adopted as a standard measure by the IAAO, the PRB is simply calculated in this study, and it is not a major focus of our analysis or discussion.
For 2008, the PRD for New London land values is 1.159. This PRD indicates that there is an unacceptable level of bias and that land assessments are regressive in nature. The PRB is 0.77. By 2009, the PRD worsens to 1.31, while the PRB improves to 0.55.
The total assessment levels are analyzed by comparing sales of ‘new’ buildings against the sales of ‘old’ buildings. ‘New’ buildings are defined in a range of age between new and forty years old. Forty is selected because commercial cost manual and revaluation companies frequently use forty as the basis for the economic life of most buildings. Economic life means the anticipated amount of time a building will contribute to the property’s value. ‘Old’ buildings tend to have a greater disparity in condition and utility. If old buildings also have a greater disparity in the uniformity of assessments, then a split-rate tax or land tax should motivate the owner to improve the building’s condition, modify the building to improve its utility, and convert the property to its highest and best use.
For New London in 2008, the overall levels of assessment between old buildings and new buildings are highly similar. The mean ratio for new buildings is 96.6% with a standard deviation of 0.069; the mean ratio for old buildings is 96.1% with a standard deviation of 0.083. The median ratio for new buildings is 95.7% with a coefficient of dispersion of 0.045; the median ratio for old buildings is 95.5% with a coefficient of dispersion of 0.07. The PRD for new buildings is 0.94, and the PRD for old buildings is 0.89. Both indicate progressive assessment programs, with higher valued buildings being assessed at a higher rate. The variations between these, however, suggest that there is no material difference in the assessment levels between new and old buildings. Since the overall COD is above the range of 20%, disaggregating properties between old versus new is unlikely to provide an acceptable range for the COD for either old or new buildings.
A final problem with implementing the land tax program in New London is the term of the revaluation. Connecticut municipalities are required to revalue property once every five years. This was the intent in New London. While excellent statistical results are achieved in the first tax year, the program degrades substantially in the second tax year. There are 159 qualified sales in this term. The median ratio of appraised values is 113%, with a coefficient of dispersion of 16.5. The mean ratio is 117% with a standard deviation of 28.4. Property classes are only slightly more varied, with seven commercial class properties. Considering the poor results in the land extraction in 2008, they are amplified in 2009. The median ratio is 75% with a coefficient of dispersion of 99. The mean ratio is 29% with a standard deviation of 7.5. The lack of accuracy in the assessments would have posed significant problems for the administration of the land tax.
To consider the possibility of differences between ‘large’ versus ‘small’ parcels of land, as well as differences between ‘expensive’ and ‘less expensive’ properties, the accuracy of land assessments in New London is also examined by comparing the assessment of the land with the extracted market value of the land on a unit basis. The assessment assigned to the land is divided by the square footage of the site. Similarly, the market value of the land is extracted from the sale price by subtracting the assessed value of the buildings and then dividing it by the square footage of the land. The assessed value per square foot is then divided by the market value per square foot.
Like the above-findings, there is an acceptable level of assessment in the first year of the revaluation, 2008. Table 1 shows that the indicated mean is 93.3% with a standard deviation of 0.281. The indicated median is 89.8%, slightly below the ideal level range of 90% to 105%. The coefficient of dispersion also indicates a fair level of uniformity at 20.6. So, for the first year, there are marginally acceptable results indicating that the assessment per square foot is relatively proportionate.
Also, similar to the above-findings, the degree of proportionality falls precipitously in subsequent years. By 2009, the mean ratio leaps to 165.9% with a standard deviation of 2.73. The median ratio also witnesses extreme changes, rising to 125%. The coefficient of dispersion is 99.9, indicating no relationship whatsoever. A helpful referee indicated that these results for post-2008 may reflect the housing crisis, which began around that time.
Variations between residential class properties and commercial class properties are examined. The results suggest that commercial class properties are favorably treated in relation to residential class properties in the assessment program in New London. Commercial class properties have an overall mean ratio of 86.6% and an overall median ratio of 85.8%. A standard deviation of 0.062 and a coefficient of dispersion of 4.8% indicate a strong correlation in the overall values. On the other hand, residential class properties are assessed at an overall mean ratio of 96.9% and an overall median ratio of 96.1%. The measures of variation similarly show strong correlations, with a standard deviation of 0.076 and a coefficient of dispersion of 6%. These results illustrate the underassessment of commercial class properties by nearly 12%.
Driving deeper, variations between the extracted land values of commercial class properties and residential class properties indicate a strong bias towards commercial class. Commercial land is assessed at an overall mean of 57.6% and an overall median of 55.2%. The standard deviation and coefficient of dispersion slip from the whole property assessment but still fall within or near an acceptable range. For commercial land, the standard deviation is 0.166, while the coefficient of dispersion is 21.9%. Residential land is assessed at an overall mean of 96.1% and an overall median of 92.3. Its measures of variation for the standard deviation are 0.28 and for the coefficient of dispersion are 18.8%. The differences in these ratios suggest that commercial land enjoys a 66.8% advantage over residential land. This disparity would need to be rectified before implementing a land tax.
We also plot the extracted sale price of land against square feet and study the mean COD and PRD for two other categories of properties, proximate to parks and near highway exits. The locations of the parks and highway exits can be seen in Figure 1. For residential land located ¼ mile or less from the nearest park, the COD is approximately 0.32. Similarly, for residential land ¼ mile or less to the nearest highway exit, the COD is approximately 0.42. Both of these estimates for the COD imply that properties within ¼ mile of the nearest park or the nearest highway exit would not be viable candidates for a split tax if assessment equity is a concern. Affirming this is the fact that the sale prices of plots of extracted land exhibited no noticeable relationship.
3.2. New Haven
New Haven completed its last revaluation in 2006 and is scheduled to complete its next revaluation in 2011. Like New London, property types in the city are heterogeneous. As indicated previously, this study examines the performance in terms of equity beginning with the year of revaluation.
Similar to New London, the overall ratio for the City of New Haven results in excellent terms when regarding the overall performance. New Haven’s data are evaluated using assessed values; assessments represent seventy percent of the full value. Like New London, the selected samples represent verified transactions from the first day of the tax year, October 1, through September 30th. All sales in this period are utilized, without determining whether a representative sample is actually acquired. This method corresponds to the State of Connecticut’s method for the equalization of the total assessed values between jurisdictions.
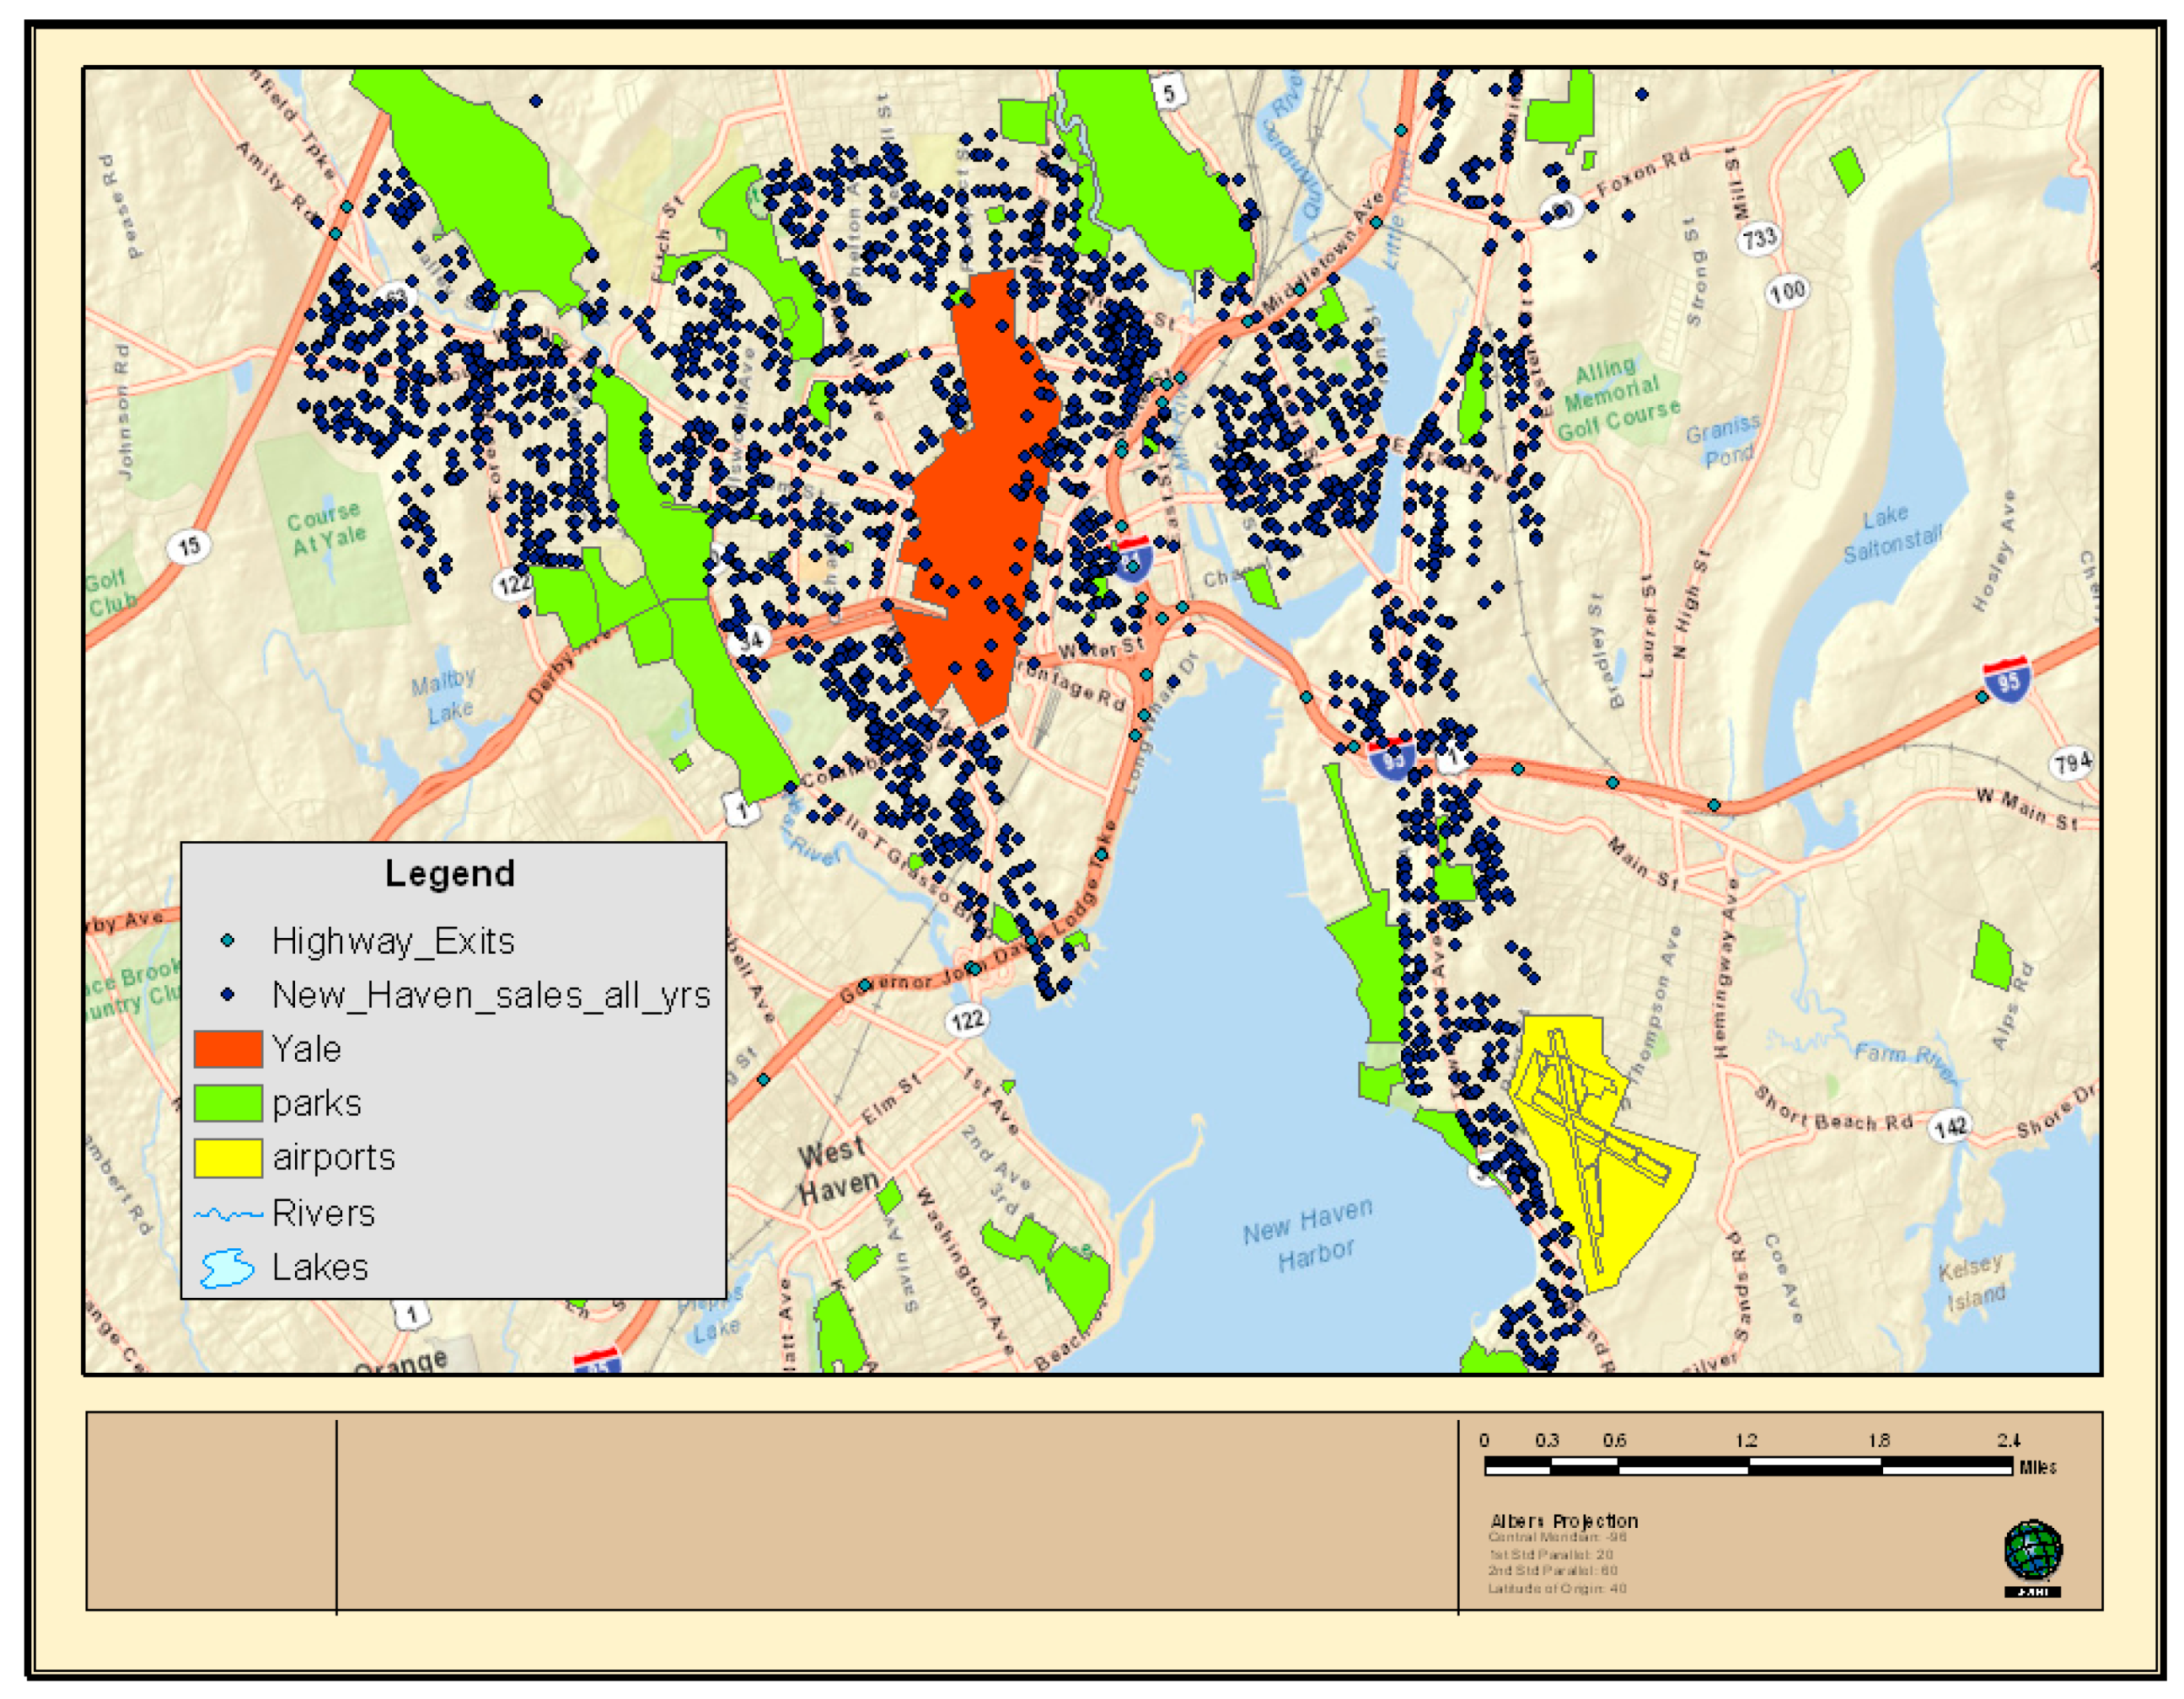
We examine all ‘qualified’ sales of real estate in New Haven from 1 October 2005 through 30 September 2010. This period (October through September) corresponds with the tax years 2006 through 2010 and is the term used by the state to calculate the assessment ratios for municipalities. The locations of the sales for the tax years 2007 to 2010, as well as other landmarks such as parks, highway exits, the airport, and Yale University, can be seen in Figure 4. Since no land or site value is calculated by the City for condominiums, condominiums are not examined in this study. Similar to New London, the complexity and variety of property in New Haven should result in a coefficient of dispersion of fifteen percent or less in 2006 [10].
In 2006, New Haven’s equalized assessment ratio is calculated at 92.0%, as is shown in Table 2. We use an equalized assessment in this study to make comparisons between jurisdictions in similar terms. An assessment is ‘equalized’ by dividing the assessment by the statutory assessment ratio. This result is slightly below an optimum ratio. The statutory overall ratio should be 70%. Although the variances indicated by both the standard deviation, 14, and the coefficient of dispersion, 9.6, suggest relatively low overall variance in observations, there are significant outliers that indicate a non-normal distribution. By 2010, the total assessment ratio had increased to 177%, with significant degradation of the overall program indicated by degrees of variance. The standard deviation shot to 1044, while the coefficient of dispersion leapt to 76.8%. By 2010, there was no significant relationship between assessments and market value in the City of New Haven.
As for New London, because the assessment program was successful in the first two years in terms of total assessments, there is a possibility that the ratio of land assessments to extracted land values might also reflect a significant relationship. Thus, we extract the assessed values of improvements from both the assessment and the sale prices for the New Haven properties.
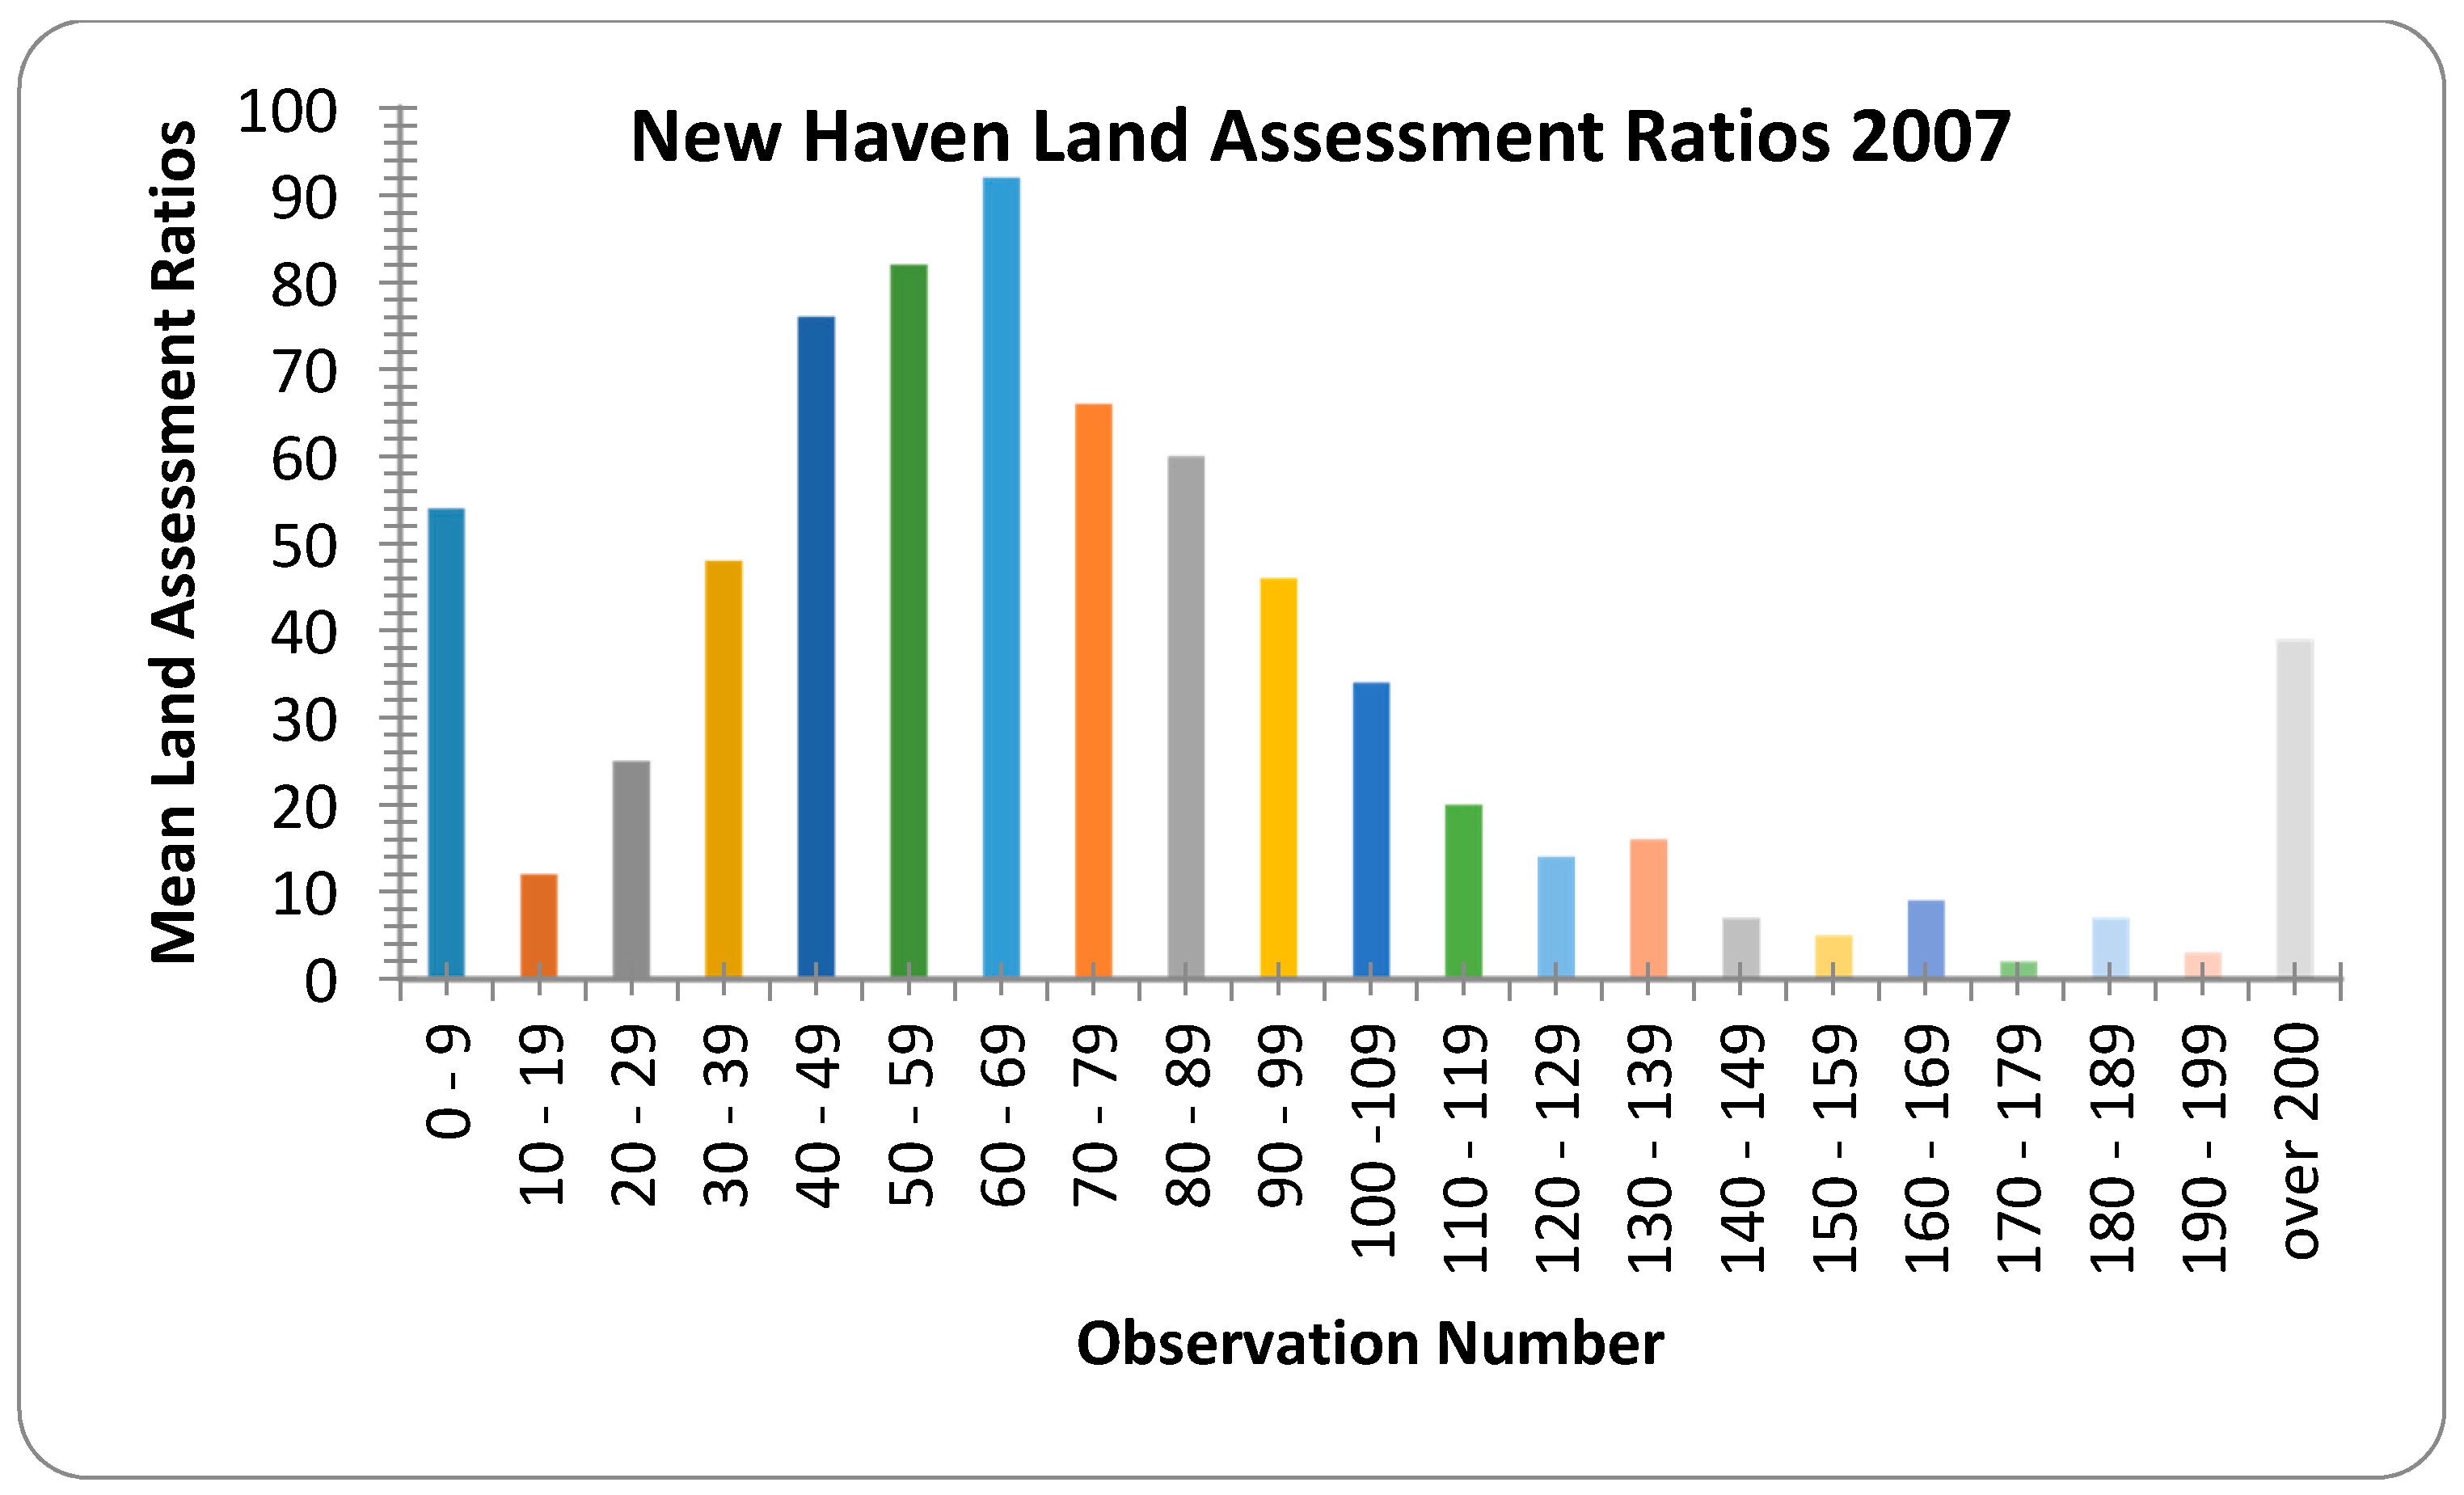
In 2006, the indicated land ratio for New Haven, based on the median, is 75%. The distribution of the land ratios is shown in Figure 5 and Figure 6. A review of classes of property and the ages of properties shows no bias to either. The mean ratio is calculated at 80.4% (see Table 3). The measures of dispersion from both the median and the mean, however, suggest no relationship between the assessed value of land and the extracted market value of land. The standard deviation in 2006 is 3.7, while the coefficient of dispersion is 71.7%. In 2007, measures of dispersion worsen significantly for the standard deviation and for the coefficient of dispersion. By 2010, the median ratio has dropped to 73.6%, with a coefficient of dispersion of 406.3%.
In examining bias in the New Haven program, the price-related differential for land values exceeds the International Association of Assessing Officers’ standard of 0.98 to 1.03 for each year of the assessment program, as can be seen in Table 3. In both 2006 and 2007, the PRD is 1.12, indicating a slightly regressive program for land valuation. Due to anomalies in the calculation of the land value, the 2008 PRD of −1.53 lacks meaning. For 2009 and 2010, however, the PRD fluctuates wildly between 1.99 and 1.04. Both, however, indicate a regressive land valuation program.
We also examine the possibility of differences between ‘large’ versus ‘small’ parcels of land, as well as differences between ‘expensive’ and ‘less expensive’ properties. In this regard, New Haven land assessments were examined by comparing the assessment per square foot and the extracted market value per square foot. Predictably, the only variations from the overall land value statistics were from the weighted mean and the PRD. The weighted mean varied because it is calculated from the sum of the assessments per square foot divided by the sum of the sale prices less building values per square foot. Since the weighted mean changed, the PRD also changed. The PRD in this analysis never meets equity standards. It is regressive through nearly the whole term of the revaluation, reaching as high as 6.69 in 2009. In 2010, the PRD falls to 0.85, suggesting a swing to a progressive program. More likely, however, the PRD may not be an accurate measure of vertical equity in any year.
Similar to New London, we analyze the overall New Haven assessments between new buildings and old buildings for the year of the revaluation, 2006. Also like New London, the overall levels of assessment between old buildings and new buildings are highly similar. The mean ratio for new buildings is 93.2% with a standard deviation of 0.091; the mean ratio for old buildings is 92.1% with a standard deviation of 0.128. The median ratio for new buildings is 92.4% with a coefficient of dispersion of 0.068; the median ratio for old buildings is 92% with a coefficient of dispersion of 0.09. The PRD for new buildings is 1.01, and the PRD for old buildings is 1.02. These PRD indicate a neutral program with no progressive or regressive bias. The variations between these, however, suggest that there is no material difference in the assessment levels between new and old buildings.
The 2006 revaluation in New Haven was a statistical adjustment of assessed values and not a ‘full’ revaluation. It appears that the factors employed in that revaluation were heavily focused on the costs of improvements. Considering an overall level of assessment of 92% and a level of assessment for land at 75%, a split-rate tax might be employed simply to equalize the effect of an overall tax.
We also examine the COD and PRD for properties in New Haven that are close to parks, close to the airport, and close to the nearest highway exit for the years 2007 through 2010. In addition, we examine the COD and PRD for properties that are ‘close’ to Yale University. The locations of these landmarks relative to the sold properties are shown in Figure 4. We also plot the extracted land sale price against square feet for each of these categories, although we find no noticeable pattern.
For our purposes, we define ‘close’ as less than or equal to 0.25 miles. Within ¼ miles of parks, we find that the CODs for extracted residential and commercial land values are extremely high; approximately 150% and 300%, respectively. The PRDs are 2.4 and 5.6 for residential and commercial land, respectively. Within ¼ miles of the nearest highway exit, we find that the CODs for residential and commercial extracted land values are 198% and 160%, respectively. For ¼ miles from the nearest airport, the COD for residential extracted land values is approximately 140%, while, for commercial properties ¼ mile from the airport, there are insufficient numbers of observations (only two parcels) to calculate the COD. For properties within ¼ mile of Yale University, the CODs for residential and commercial extracted land values are 108% and 124%, respectively. Also, the PRsD are 1.9 and 2.5, respectively, implying a highly regressive assessment structure for these properties near Yale University. Thus, it appears as if there are no viable candidates for an equitable split tax among the groupings of properties we examine for New Haven.
3.3. Hartford
As did New Haven, Hartford completed its last revaluation in 2006 and was scheduled to complete its next revaluation in 2011. The property types in Hartford are relatively heterogeneous. As indicated previously, this study examines the performance in terms of equity, beginning with the year of revaluation.
Similar to both New London and New Haven, the overall ratio for Hartford results in excellent terms regarding the overall performance. Hartford’s data are evaluated using assessed values; assessments represent seventy percent of the full value. The selected samples represent verified transactions from the first day of the tax year, 1 October through 30 September. All sales are utilized in this period, without determining whether a representative sample is actually acquired. This method corresponds to the State of Connecticut’s method for the equalization of the total assessed values between jurisdictions.
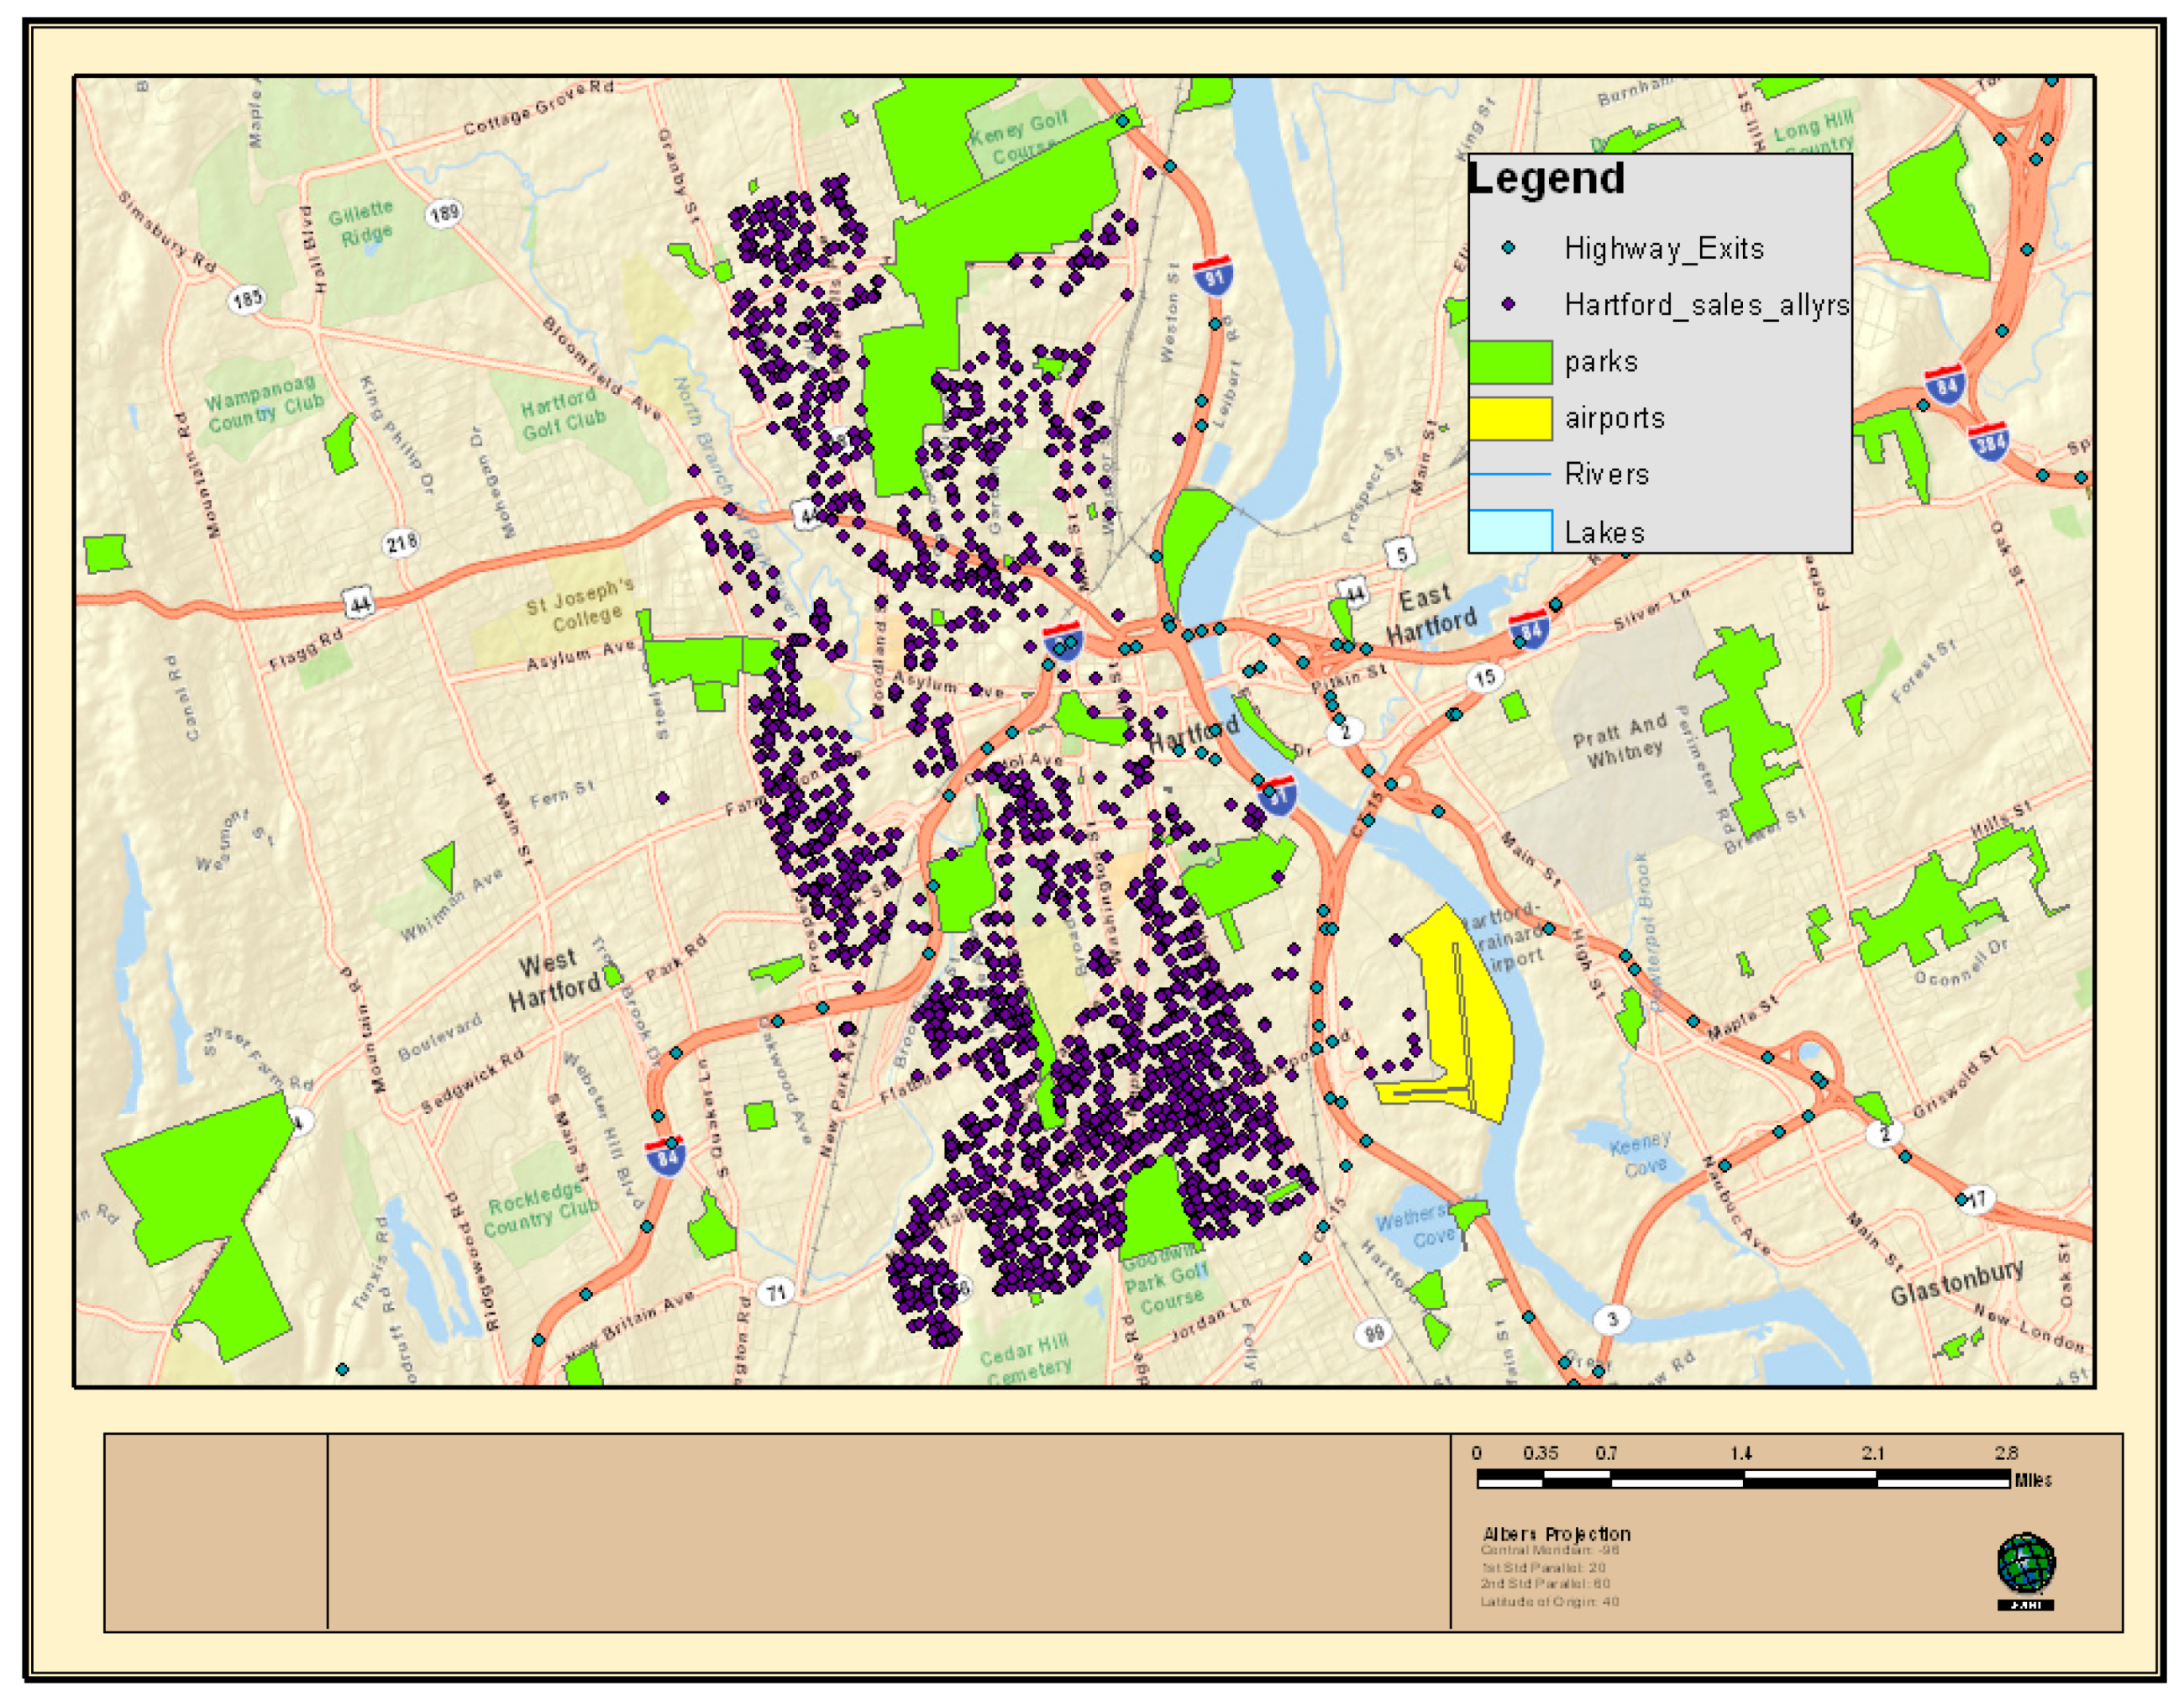
We examine all ‘qualified’ sales of real estate in Hartford from 1 October 2005 through 30 September 2009. This period (October to September) corresponds with the tax years 2006 through 2010 and is the term used by the state to calculate the assessment ratios for municipalities. The locations of these properties, along with the locations of highway exits, the nearest airport, and parks, are shown in Figure 7. Since no land or site value is calculated by the city for condominiums, condominiums are not examined in our study. Like New London and New Haven, the complexity and variety of property in Hartford should result in a coefficient of dispersion of fifteen percent or less in 2006 [10].
In 2006, Hartford’s total assessment ratio is calculated at over 97% (as can be seen Table 4). The purported goal of a revaluation is to appraise all property at 100% of the market value, and most programs target between 95% and 98%. This assessment level is still likely to be accurate enough to meet a high confidence level in a null hypothesis analysis that the ratio is 100%. The Hartford data utilizes full value assessments, like New London. New Haven utilizes equalized assessments. The New Haven assessments are at 70% of their full value assessments.
This result is encouraging, as the full value assessment is close to 100% and the measures of deviation from the central tendency suggest a strong relationship between assessments and sale prices in 2006. The standard deviation is calculated at 14, and the coefficient of dispersion is calculated at 5.3%. For Hartford, the strength of its assessment program remains through 2008. In 2008, the median ratio is 96.9% with a coefficient of dispersion of 12% and a standard deviation of 16. Like New London, the basis for extracting a land value from the assessments and market prices is superior to the basis in New Haven.
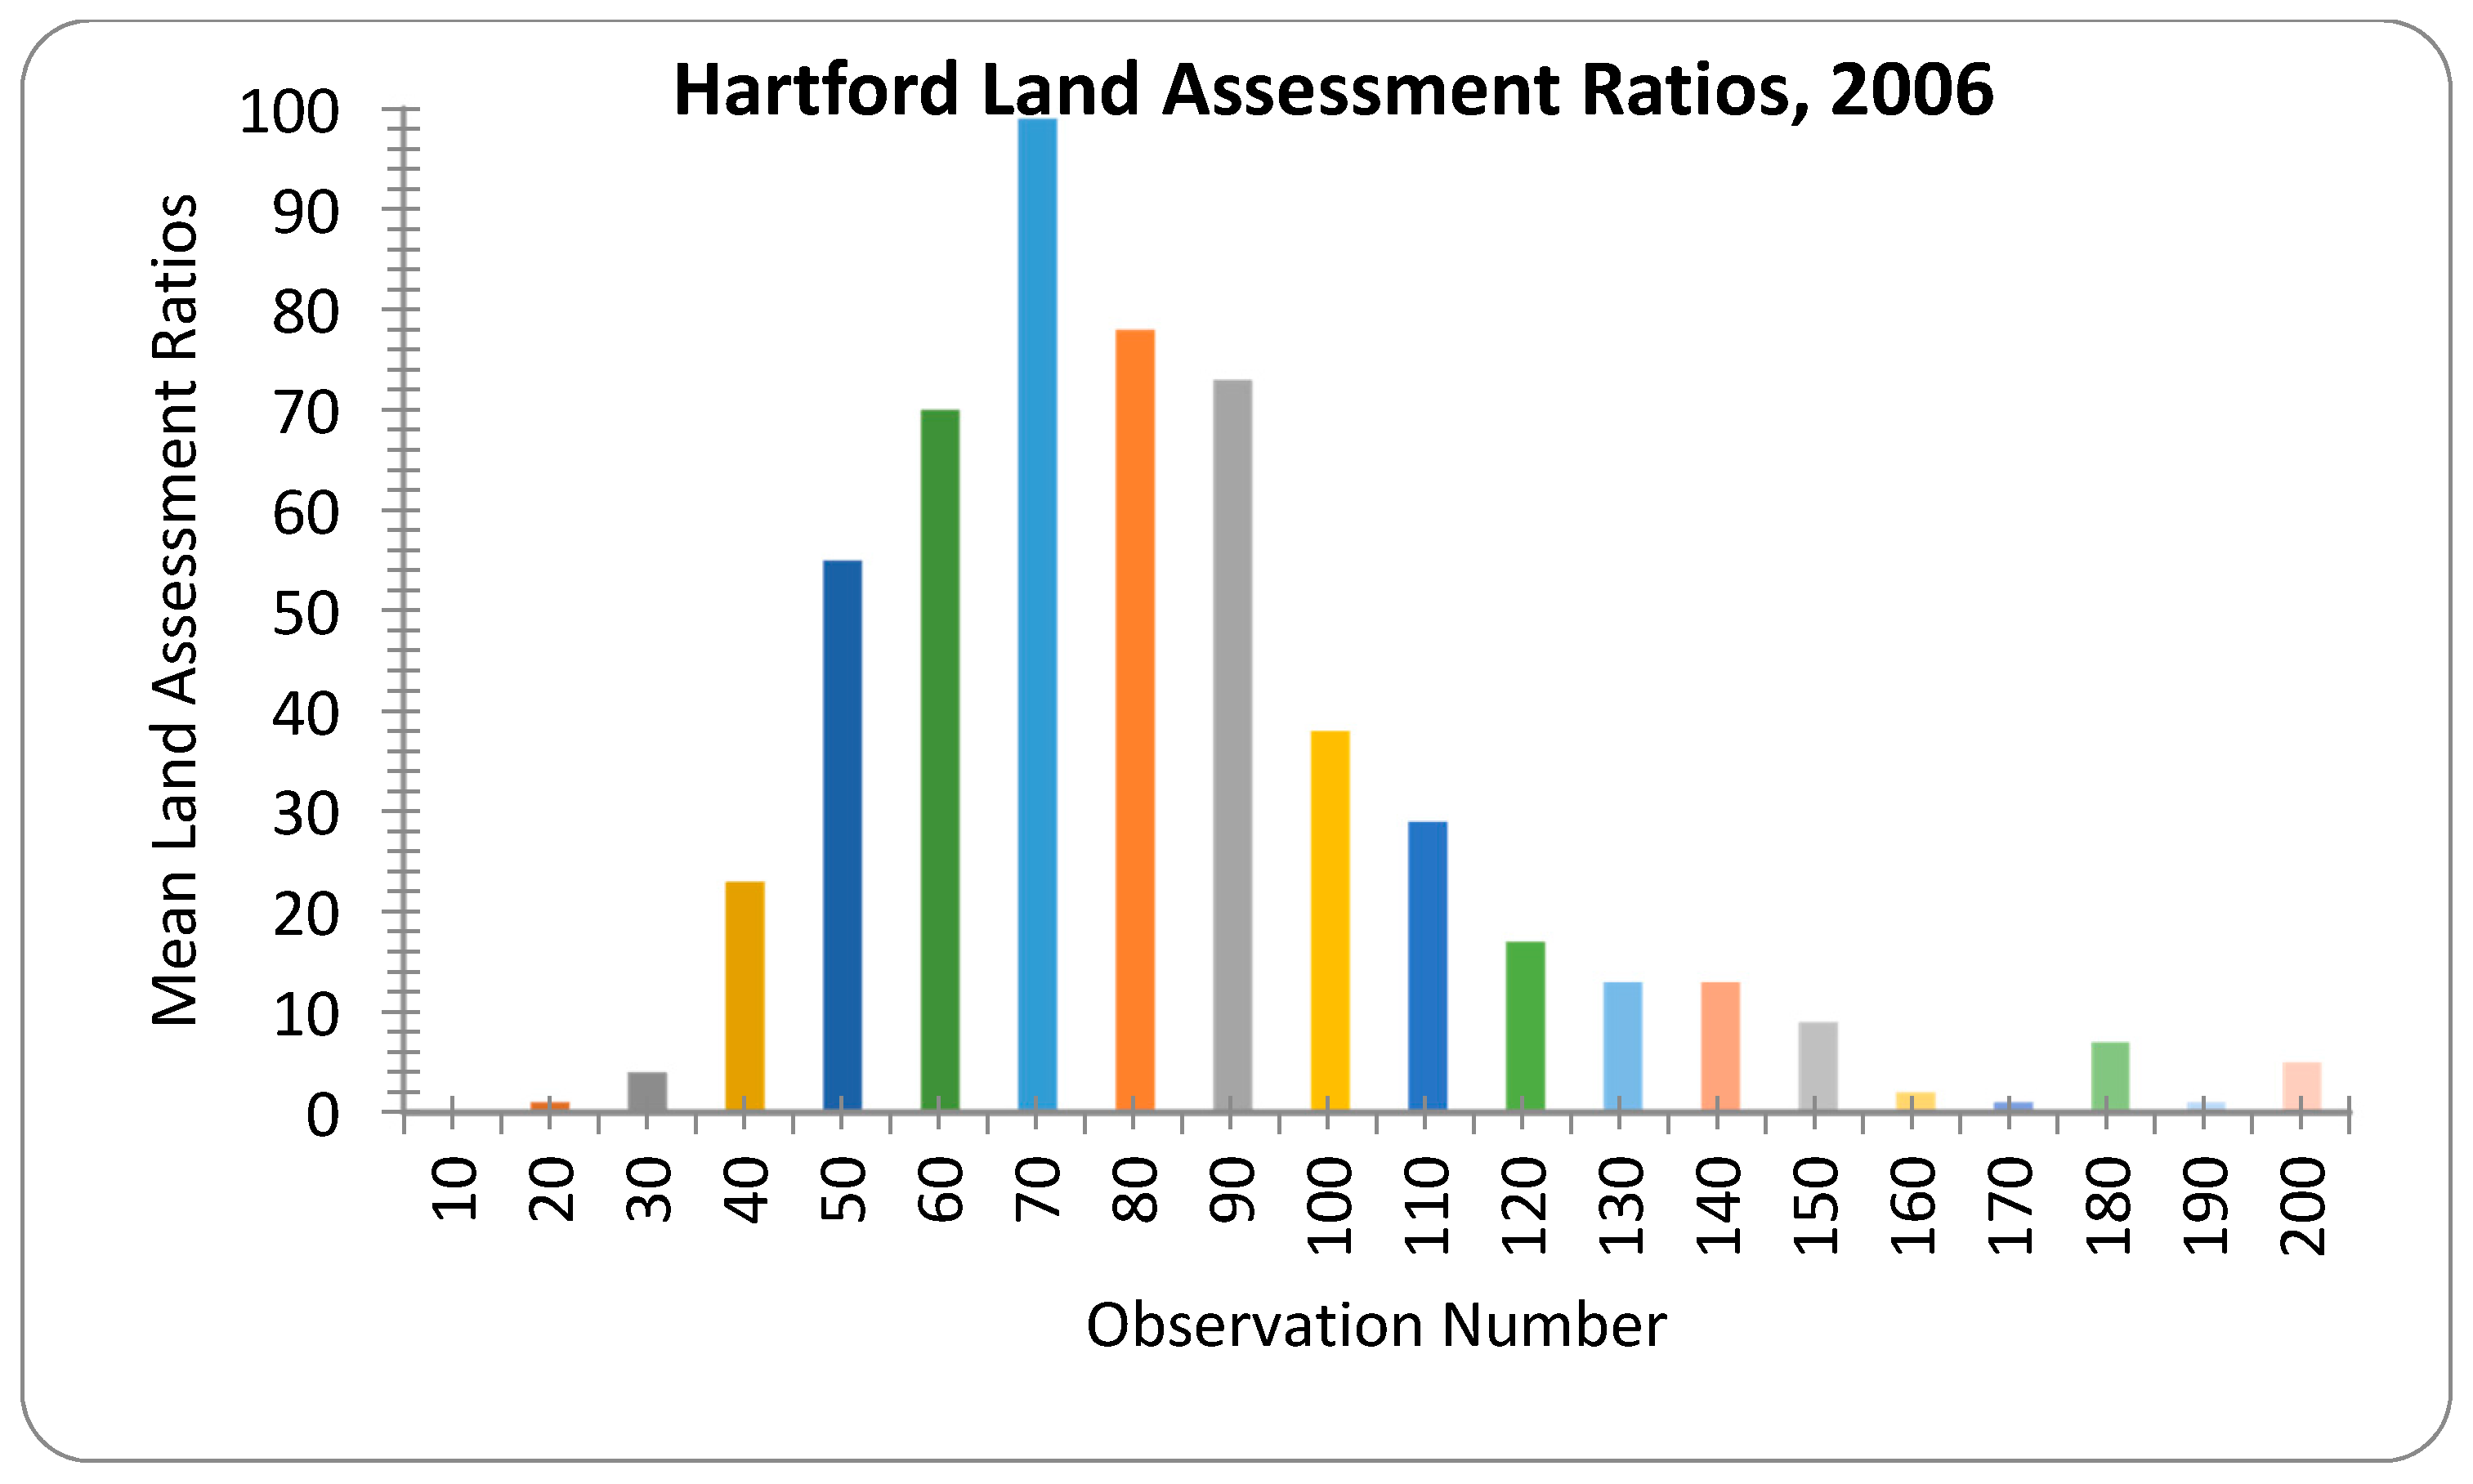
The distributions of land ratios in 2006 and 2007 are shown in Figure 8 and Figure 9, respectively. In 2006, the indicated land ratio for Hartford is 81%. The standard deviation in 2006 is 29, which suggests a modest relationship. The coefficient of dispersion is high at 26.4%. Unlike New Haven, however, Hartford’s extracted land values appear to be normally distributed. Trimming high ratios beyond 200% should result in better performance in the study. Trimming at 200% would reflect the lowest limit that these studies impose, which is 0%. Like New London, and without trimming, an assessment program for land in Hartford rapidly degrades. In 2007, measures of central tendency worsen significantly. The median drops to 68% and the mean to 75.7%. The standard deviation rises to 36, while the coefficient of dispersion is 83%. By 2010, the median ratio has risen to 90%, with a coefficient of dispersion of 112%. By 2010, there is no significant relationship between the extracted land assessment and the extracted land market price.
Hartford never achieves vertical equity in land assessments through the entire term of the assessment program. In the first year, the PRD is 0.685, indicating a progressive assessment program. In 2007, the PRD swings dramatically to 4.38 and an overly regressive program. The program remains regressive through 2010, with a noteworthy 4.38 PRD in 2007.

Table 5.
Land ratios descriptive statistics for all qualified sales in Hartford.
| Descriptive Statistic | 2006 | 2007 | 2008 | 2009 | 2010 |
|---|---|---|---|---|---|
| Mean | 0.871029 | 0.757191 | 0.817581 | 0.969782 | 1.016247 |
| Stand Dev | 0.2909 | 0.363369 | 0.378351 | 0.424603 | 0.421666 |
| Median | 0.814757 | 0.680184 | 0.736478 | 0.926357 | 0.904255 |
| AAD | 0.215159 | 0.564588 | 0.817581 | 0.969782 | 1.016247 |
| COD | 0.264077 | 0.830053 | 1.110122 | 1.046877 | 1.12385 |
| PRD | 0.685 | 4.380 | 1.272 | 1.043 | 1.455 |
| PRB | 0.851 | 0.157 | 1.063 | 1.337 | 1.305 |
| N | 491 | 406 | 246 | 138 | 151 |
As in New London and New Haven, we examine land assessments by comparing the assessment per square foot and the extracted market value per square foot to address potential differences for ‘expensive’ versus ‘less expensive’ properties and ‘small’ versus ‘large’ parcels. Predictably, and like New Haven, there are only minor variations from the overall land value statistics from the weighted mean and the PRD. In fact, the only variation occurs in the 2009 data, where a slightly higher weighted mean results in a slightly lower PRD. The results are a mirror image otherwise.
Total assessments between new buildings and old buildings are analyzed for the first year of the revaluation, 2006. As seen in the New Haven and New London analyses, the overall levels of assessment between old buildings and new buildings are highly similar. The mean ratio for new buildings is 96.9% with a standard deviation of 0.051; the mean ratio for old buildings is 97.2% with a standard deviation of 0.067. The median ratio for new buildings is 96.2% with a coefficient of dispersion of 0.041; the median ratio for old buildings is 96.3% with a coefficient of dispersion of 0.049. The PRD for new buildings is 0.985, and the PRD for old buildings is 0.996. These PRDs indicate a neutral program with no progressive or regressive bias. The variations between these, however, suggest that there is no material difference in the assessment levels between new and old buildings.
We examine land assessments for Hartford by comparing the assessment per square foot and the extracted market value per square foot, both by calculating COD and PRD and by plotting the data to visually examine whether there appear to be any relationships for land that is close to the nearest airport, parks, and the nearest highway exit (these landmarks are shown in Figure 7). The COD (52%) and PRD (1.27) for residential land close to parks in 2006 are both higher than the IAAO standards. For commercial land near parks in 2006, the COD is 6%, implying the equitable distribution of assessments, while the PRD was 1.51, implying regressive assessments. For residential land in Hartford less than one mile to the nearest airport, the COD is 29% while the PRD is 1.12, both of which are outside of the acceptable range. For commercial land in 2006, less than one mile to the airport, the COD is 20.9% and the PRD is 1.0003. This COD implies a more equitable distribution, and the PRD is neither regressive nor progressive. Finally, for residential land in 2006 less than 0.25 miles to the nearest highway exit, the COD is 26.65% and the PRD was 1.25, both of which are outside of the IAAO acceptable range.
Commercial land in 2006 performs even worse, with a COD of 76% and a PRD of 1.83. The plots for extracted land value against square footage reveal no clear relationships for each of the categories of proximity to parks, highway exits, and airports.
4. Conclusions
The implementation of a split rate tax may provide economic benefits to the cities of Hartford, New Haven, and New London, but the current inability to accurately value sites could place a significant amount of doubt in the ability to administer the program. There simply is not enough market data to arrive at accurate and equitable site assessments in jurisdictions like Hartford, New Haven, and New London, and the program cannot survive long terms between revaluations, since the degradation of the quality of assessments from Year One to Year Two is substantial. A split-rate tax will require a jurisdiction to update its assessments regularly, if not annually. It will also require a jurisdiction to focus on issues of equity in land assessments. A proper focus on land assessments will likely require a more vigorous revaluation program that includes site visits so that the assessor can evaluate changing physical and environmental conditions. This would be possible for a split-tax that raises greater revenues than the current property tax since the revaluations and site visits increase costs and lead to regular tax base shifts.
While overall we find a general lack of equity in assessed values, we also search for certain classifications of properties in these cities that have more equitable assessments than others. We explore this issue for commercial versus residential properties, the price per unit (square feet) and vertical equity, both overall and for ‘old’ versus ‘new’ buildings. We also study the price per unit to allow for the possibility of differences between ‘large’ versus ‘small’ parcels of land, as well as differences between ‘expensive’ and ‘less expensive’ properties. None of these categories reveal any strong contenders for the split tax based on a lack of evidence of equity. We also analyze equity for the following property groupings:
- Properties that are close to amenities, (i.e., parks), as opposed to properties that are further from parks.
- Properties that are close to disamenities, namely, highways exits and airports (which may generate noise and traffic).
- For New Haven, in addition to all categories above, we examine properties that are ‘close’ (within a specified distance) to Yale University, as opposed to properties further from Yale.
This analysis of the assessment equity for these groupings gleans one potential candidate grouping of properties for a split tax among the three cities of New Haven, New London, and Hartford. In particular, the extracted land values for commercial properties in Hartford that are less than 1 mile to the nearest airport (i.e., Brainard Airport) demonstrate equitable assessments, so these properties would be the strongest candidates for a split tax.
Acknowledgments
The Lincoln Institute of Land Policy provided research support for this project.
Author Contributions
Jeffrey P. Cohen and Michael J. Fedele both contributed substantially to the work reported.
Conflicts of Interest
The authors declare no conflicts of interest.
References
- Cohen, J.P.; Fedele, M.J. Connecticut’s land value taxation public act: Who would bear the burden? J. Real Estate Res. 2017, 39, 39–63. [Google Scholar]
- Fischel, W.A. Municipal Corporations, Homeowners, and the Benefit View of the Benefit View of the Property Tax. In Property Taxation and Local Government Finance; Oates, W.E., Ed.; Lincoln Institute of Land Policy: Cambridge, MA, USA, 2000. [Google Scholar]
- International Association of Assessing Officers. Property Appraisal and Assessment Administration; Eckert, J.K., Ed.; International Association of Assessing Officers: Chicago, IL, USA, 1990. [Google Scholar]
- Cohen, J.P.; Coughlin, C.C. An introduction to two-rate taxation of land and buildings. Fed. Reserve Bank St. Louis Rev. 2005, 87, 359–374. [Google Scholar]
- O’Sullivan, A. Urban Economics, 7th ed.; McGraw Hill/Irwin: New York, NY, USA, 2009. [Google Scholar]
- George, H. Progress and Poverty; Schalkenbach Foundation: New York, NY, USA, 1879. [Google Scholar]
- Zodrow, G.R. The Property Tax as a Capital Tax: A Room with Three Views; James Baker Institute for Public Policy, Rice University: Houston, TX, USA, 2007. [Google Scholar]
- Oates, W.E.; Schwab, R.M. The impact of urban land taxation: The Pittsburgh experience. Natl. Tax J. 1997, 50, 1–21. [Google Scholar]
- McCluskey, W.; Anand, S. The application of intelligent hybrid techniques for the mass appraisal of residential properties. J. Prop. Invest. Financ. 1999, 17, 218–239. [Google Scholar] [CrossRef]
- International Association of Assessing Officers. Standard on Ratio Studies; International Association of Assessing Officers: Kansas City, MO, USA, 2010. [Google Scholar]
- Appraisal Institute. The Appraisal of Real Estate, 10th ed.; Appraisal Institute: Chicago, IL, USA, 1992. [Google Scholar]
- Gloudemans, R.J.; Handel, S.; Warwa, M. An Empirical Evaluation of Alternative Land Valuation Models; Lincoln Institute of Land Policy Working Paper; Lincoln Institute for Land Policy: Cambridge, MA, USA, 2002. [Google Scholar]
- Chapman, J.I.; Johnston, R.J.; Tyrrell, T.J. Implications of a land value tax with error in assessed values. Land Econ. 2009, 85, 576–586. [Google Scholar] [CrossRef]
- Paparesta, M.P. Understanding the Impact of the Property Tax Appeal Process on Assessment Uniformity: Procedures, Structures, and Outcomes. FIU Electronic Theses and Dissertations. 2015. Available online: http://digitalcommons.fiu.edu/etd/2252 (accessed on 24 November 2017).
- International Association of Assessing Officers. Standard on Mass Appraisal; International Association of Assessing Officers: Kansas City, MO, USA, 2011. [Google Scholar]
- Connecticut Association of Assessing Officers, Inc. Handbook for Connecticut Assessors: A Practical Guide to Assessment Administration for Connecticut’s Assessing Officers; Connecticut Association of Assessing Officers, Inc.: Hartford, CT, USA, 2015. [Google Scholar]
- Gloudemans, R.J. The coefficient of price-related bias: A measure of vertical equity. Fair Equitable 2011, 9, 3–8. [Google Scholar]
Figure 1.
Property sales in New London, CT for the tax years 2008 to 2009.

Figure 2.
Overall ratios for New London in the tax year 2008. The observation number (horizontal axis) is a range, and the Mean Overall Ratio (vertical axis) is the mean overall ratio in the corresponding range. For instance, 75 indicates observations 0 to 75; 80 indicates observations 76 to 80; …; 145 indicates observations 140 to 145.

Figure 3.
Land assessment ratios for New London in the tax year 2008. The observation number (horizontal axis) is a range, and the Mean Land Assessment Ratio (vertical axis) is the mean overall ratio in the corresponding range. For instance, 45 indicates observations 0 to 45; 50 indicates observations 46 to 50; …; 620 indicates observations 261 to 620.
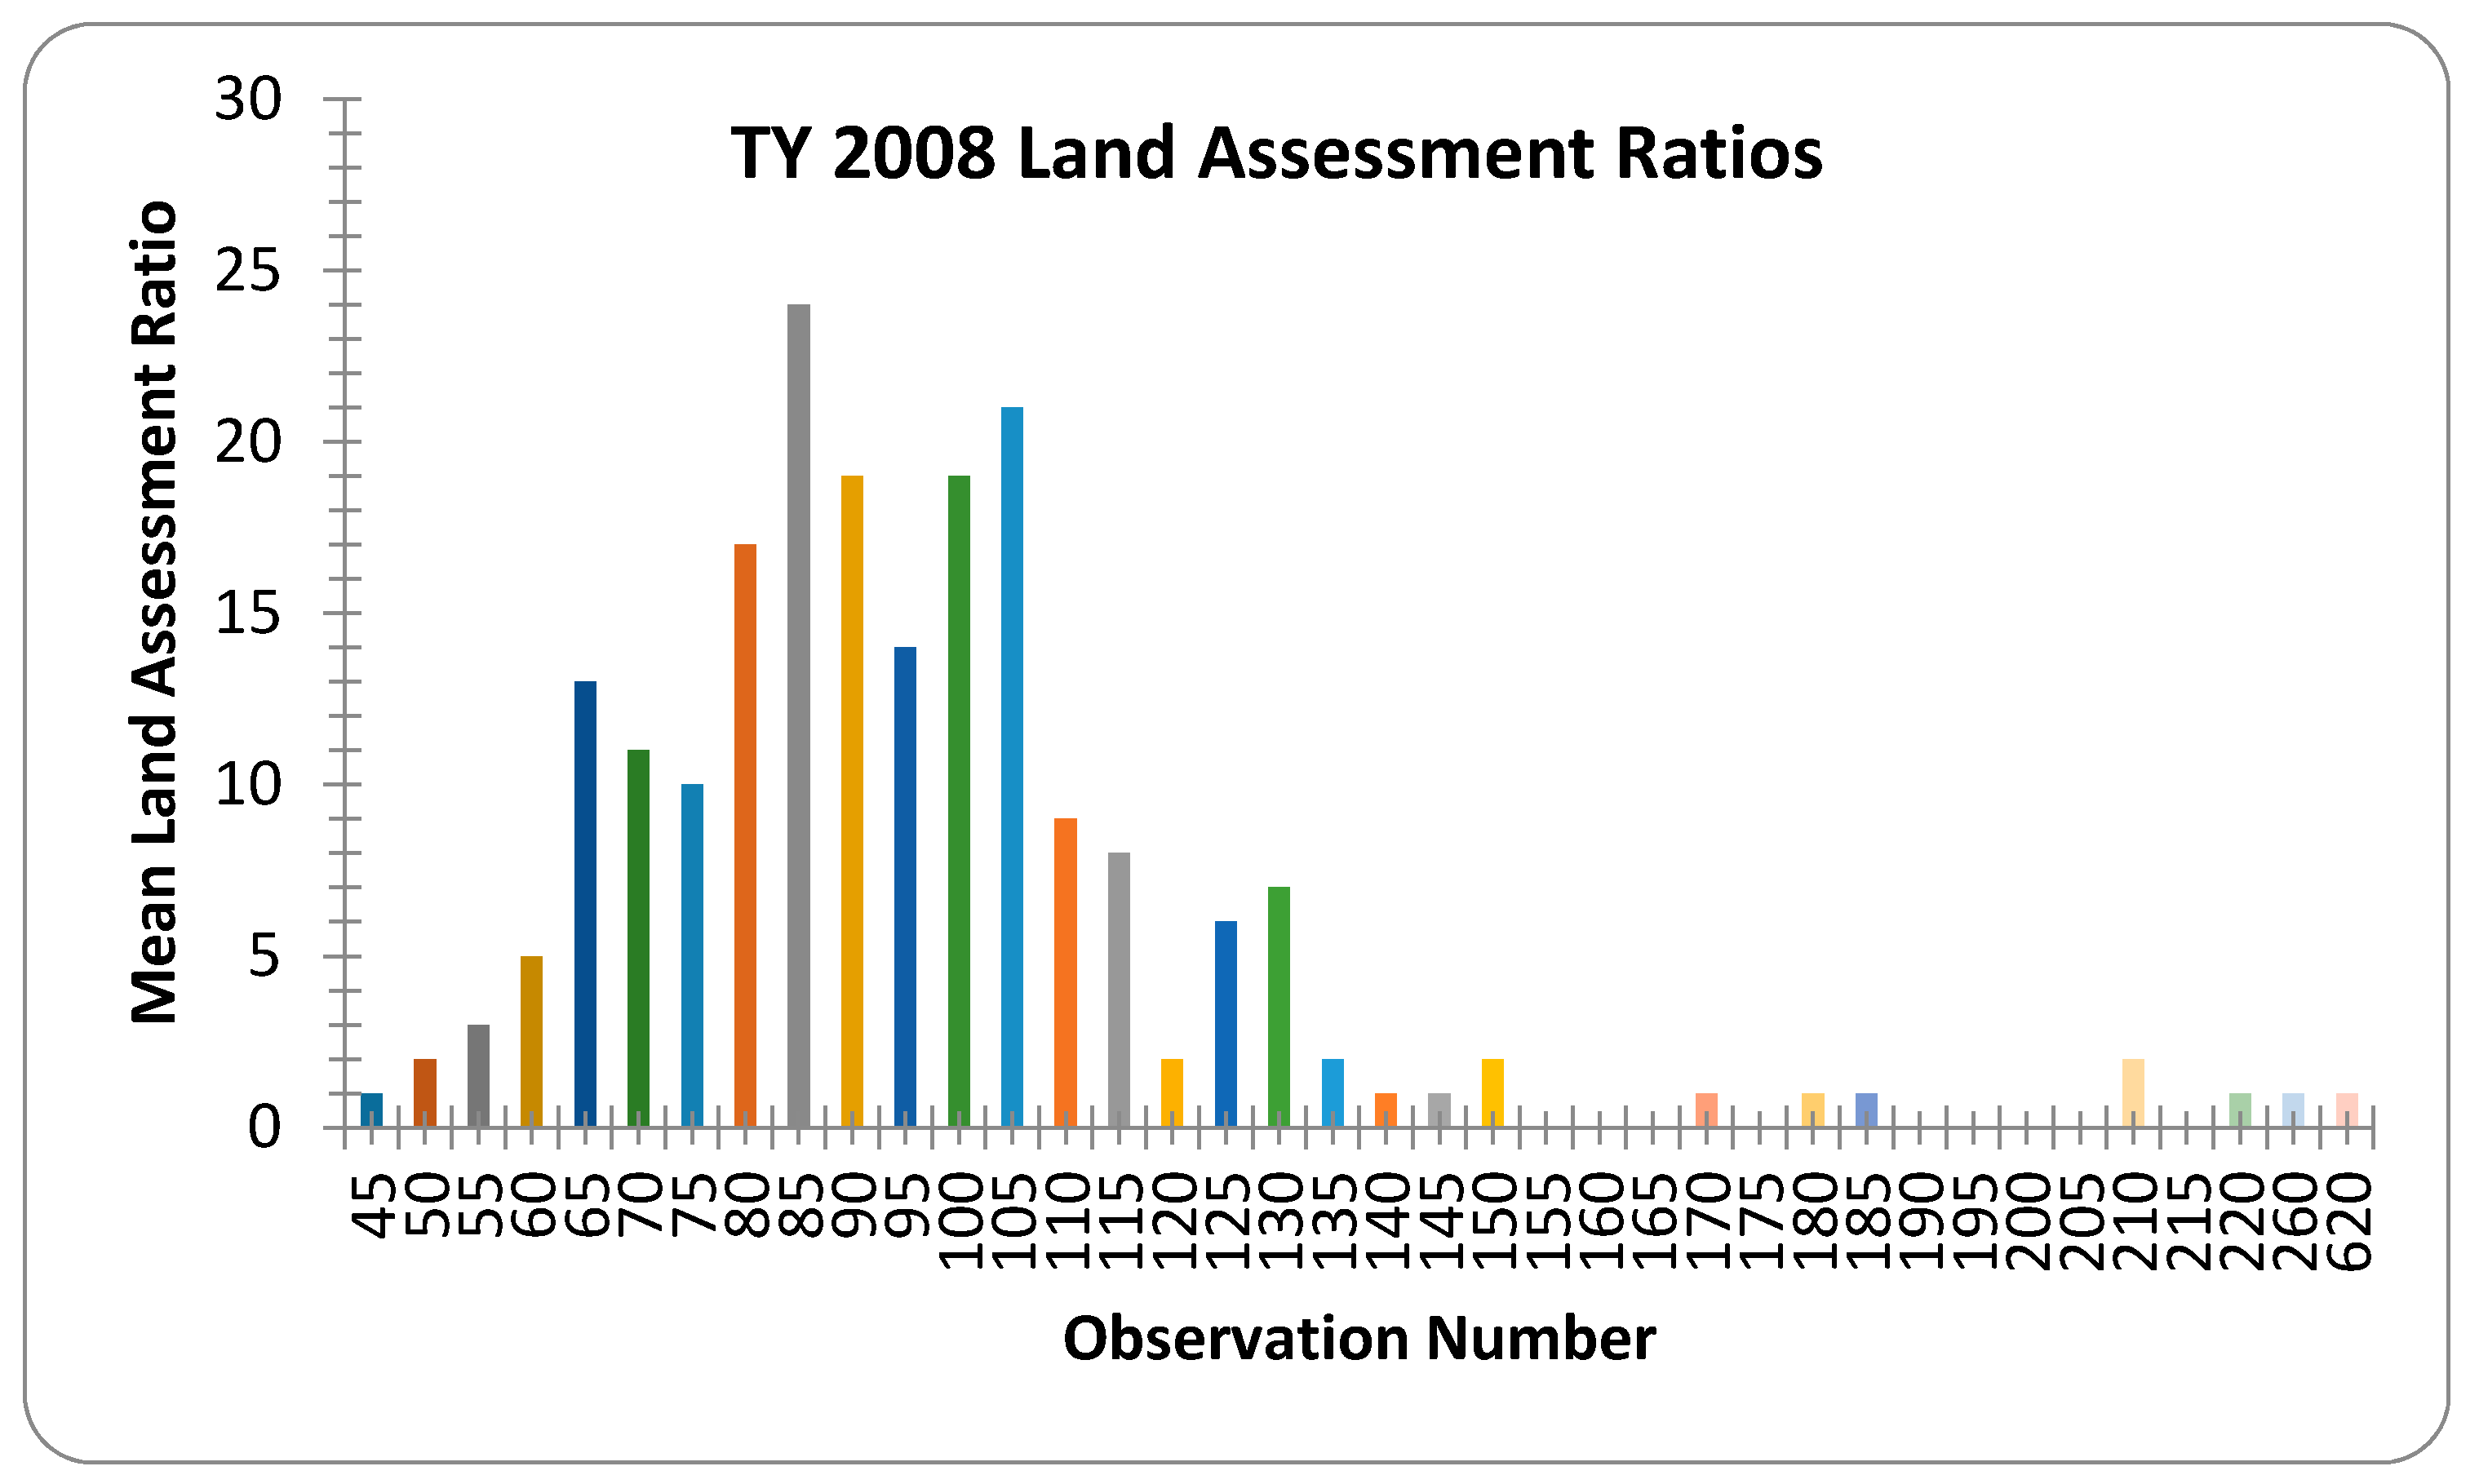
Figure 4.
Property sales in New Haven, CT, for the tax years 2007 to 2010.

Figure 5.
Land assessment ratios in New Haven for the tax year 2006. The observation number (horizontal axis) is a range, and the Mean Land Assessment Ratio (vertical axis) is the mean overall ratio in the corresponding range. For instance, 0–9 indicates observations 0 to 9; …; over 200 indicates observations 200 and over.
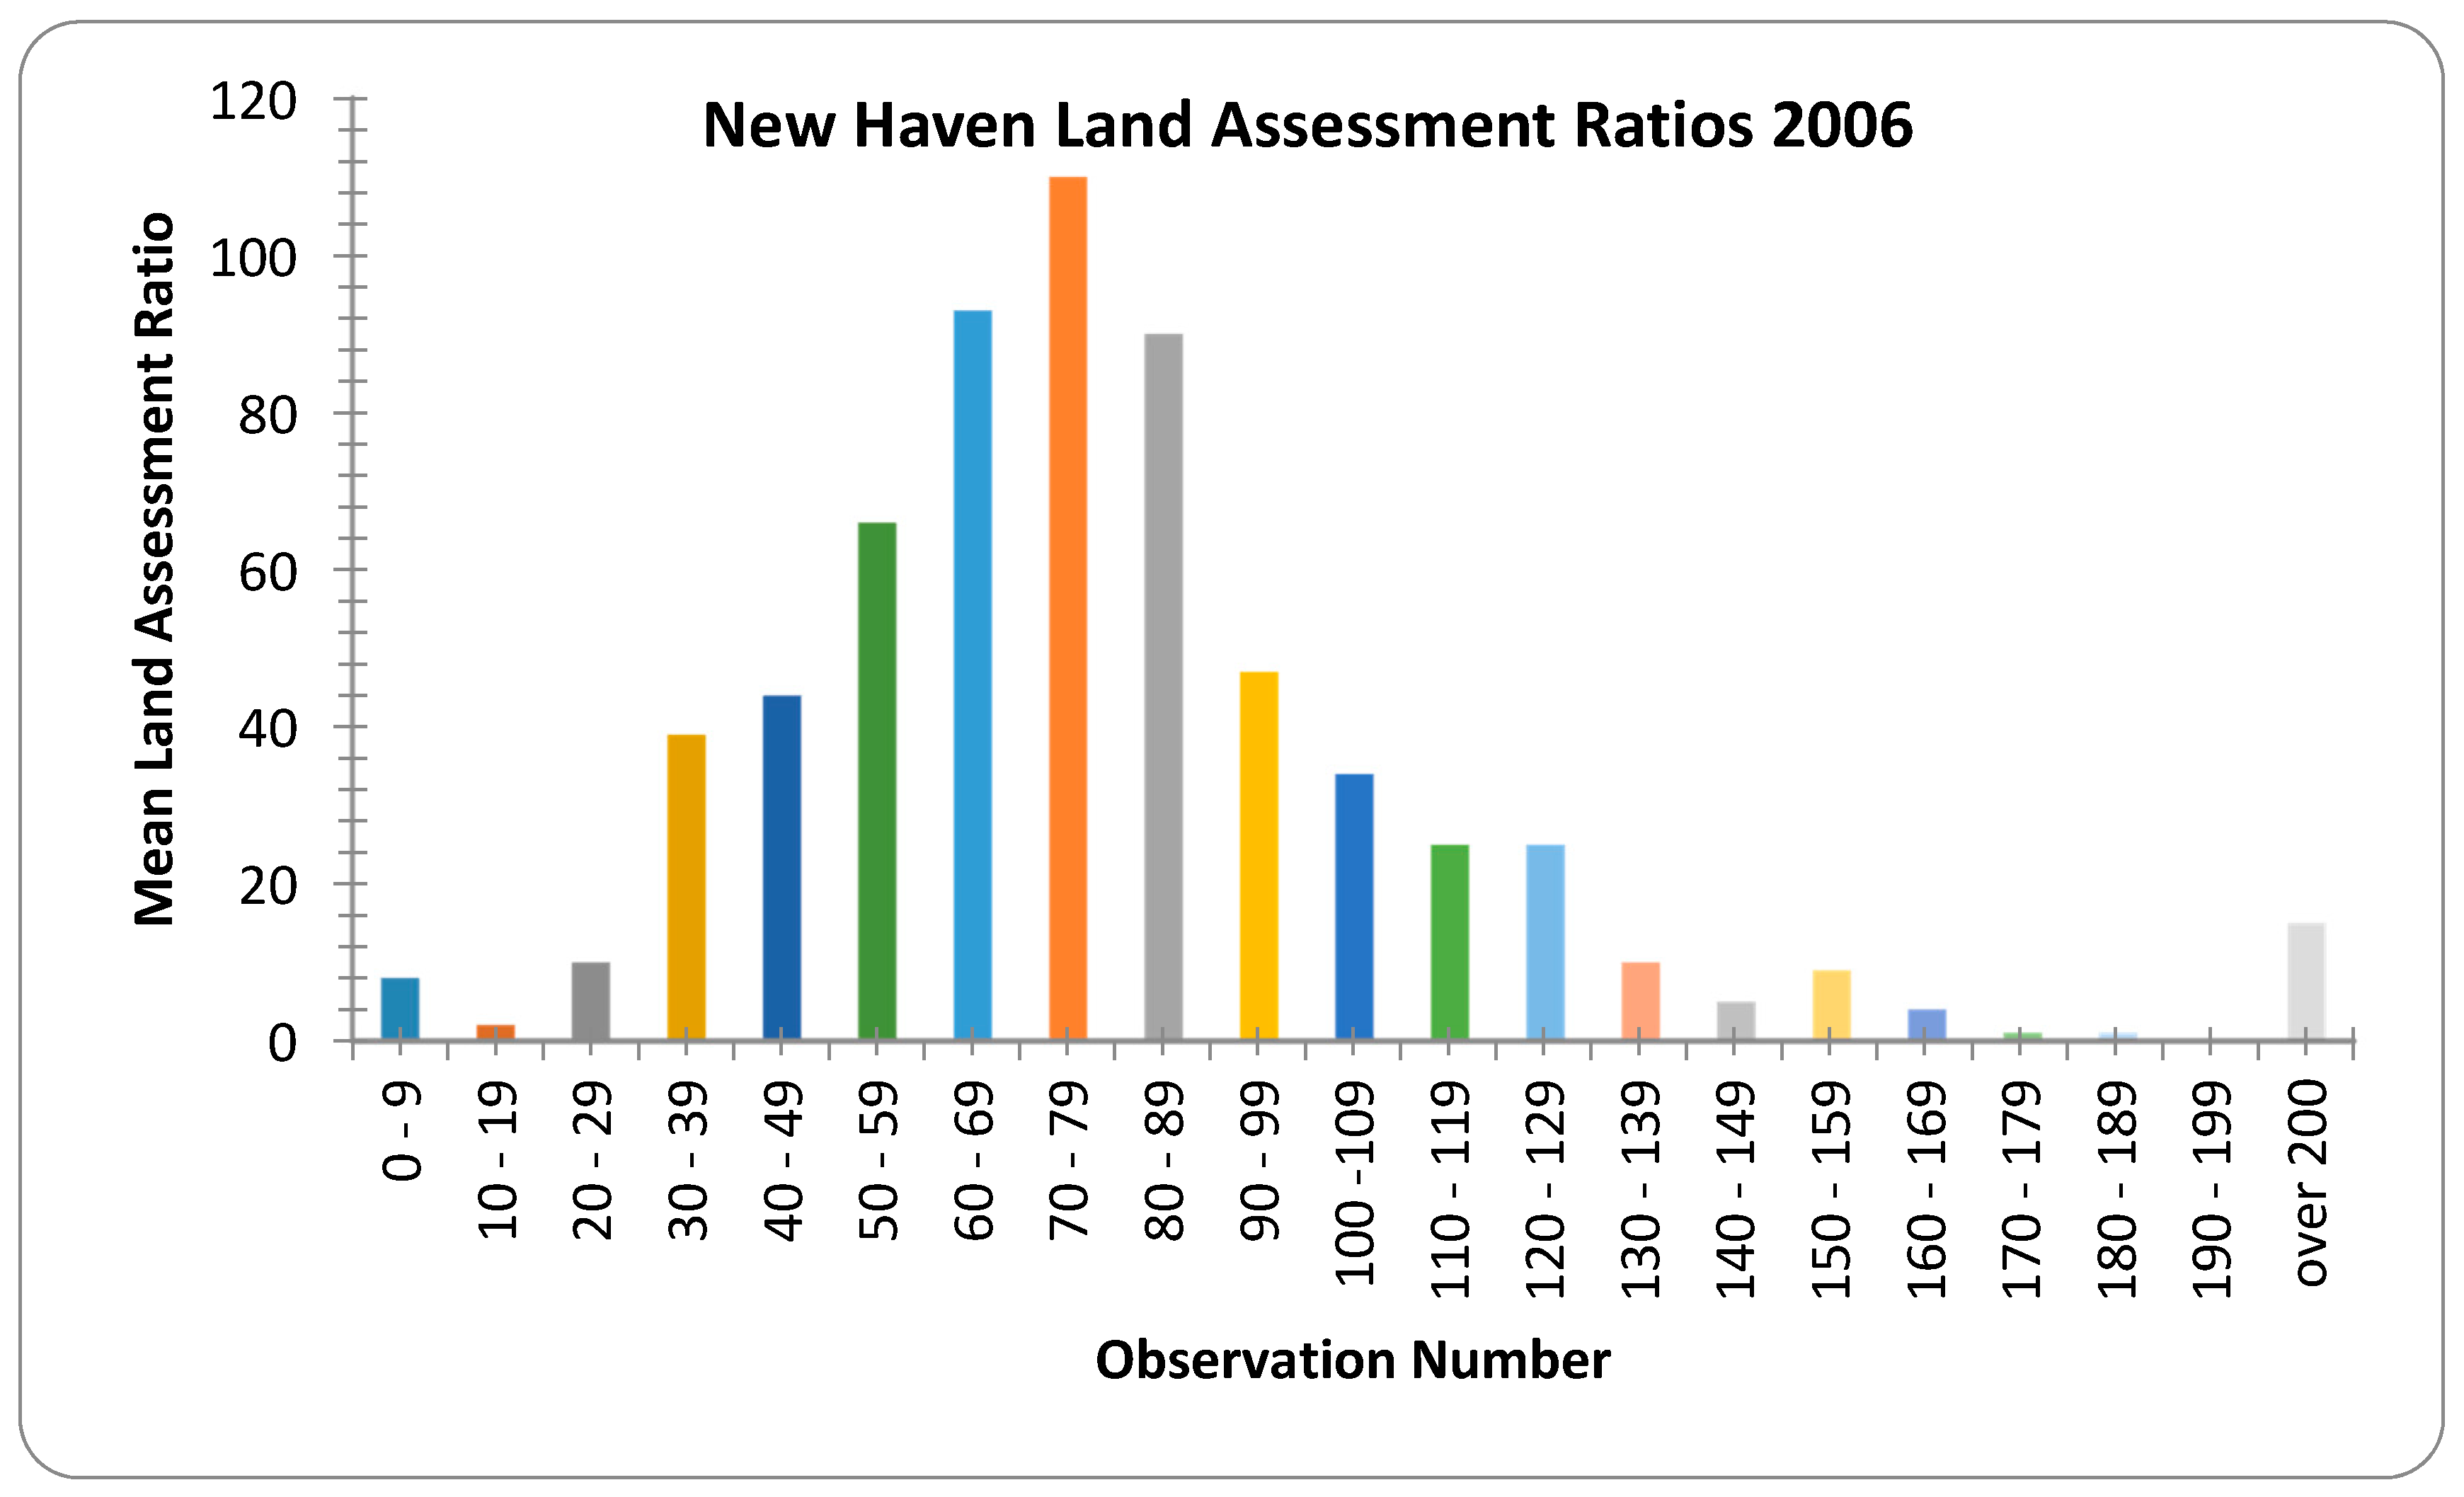
Figure 6.
Land assessment ratios in New Haven for the tax year 2007. The observation number (horizontal axis) is a range, and the Mean Land Assessment Ratio (vertical axis) is the mean overall ratio in the corresponding range. For instance, 0–9 indicates observations 0 to 9; …; over 200 indicates observations 200 and over.

Figure 7.
Property sales in Hartford, CT, for the tax years 2006 to 2010.

Figure 8.
Hartford Land assessment ratios for the tax year 2006. The observation number (horizontal axis) is a range, and the Mean Land assessment ratio (vertical axis) is the mean overall ratio in the corresponding range. For instance, 10 indicates observations 0 to 10; 20 indicates observations 11 to 20; …; 200 indicates observations 200 and over.

Figure 9.
Hartford Land assessment ratios for the tax year 2007. The observation number (horizontal axis) is a range, and the Mean Land Assessment Ratio (vertical axis) is the mean overall ratio in the corresponding range. For instance, 10 indicates observations 0 to 10; 20 indicates observations 11 to 20; …; 200 indicates observations 200 and over.
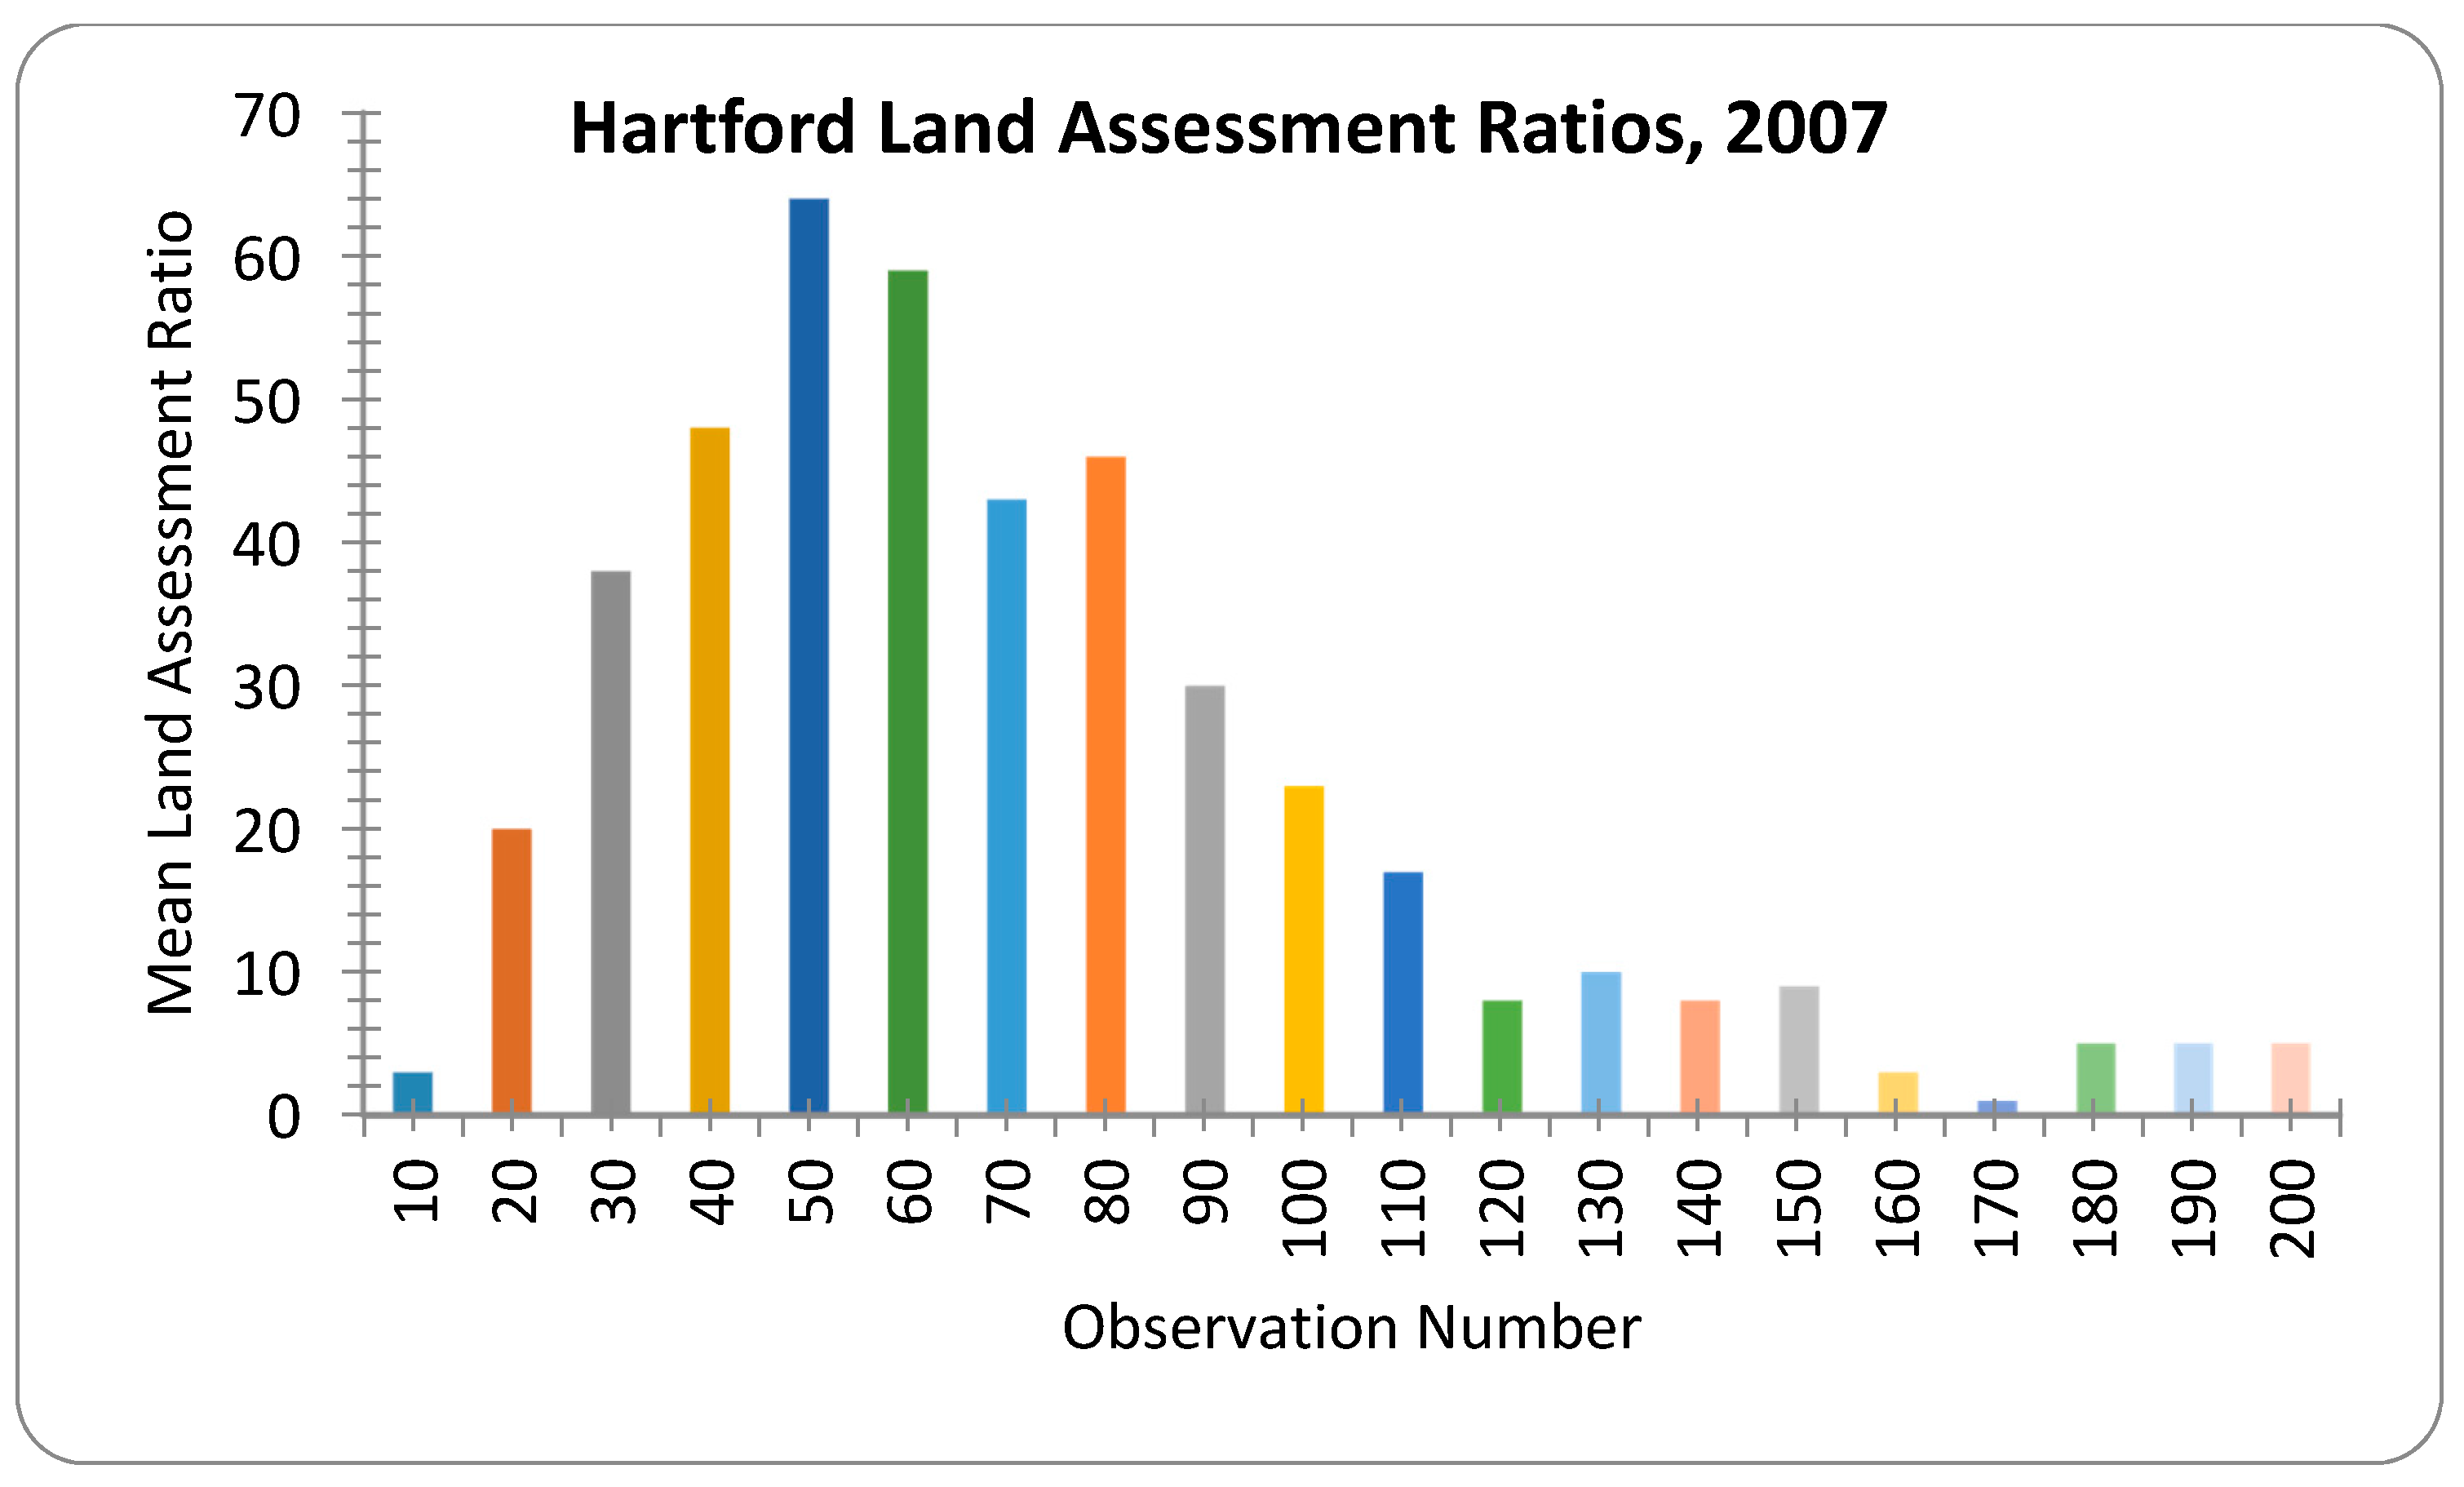
Table 1.
Land ratio descriptive statistics for all qualified sales in New London.
| Descriptive Statistic | 2008 | 2009 |
|---|---|---|
| Mean | 0.932791 | 1.659079 |
| StDev | 0.281569 | 2.730437 |
| COV | 0.301856 | 1.645754 |
| Median | 0.897785 | 1.250218 |
| AAD | 0.185128 | 1.249356 |
| COD | 0.206205 | 0.999311 |
| Weighted Mean | 0.805088 | 1.259546 |
| PRD | 1.15862 | 1.317204 |
| PRB | 0.771899 | 0.554303 |
| N | 129 | 119 |
Table 2.
Overall ratio descriptive statistics for all qualified sales in New Haven.
| Descriptive Statistic | 2006 | 2007 | 2008 | 2009 | 2010 |
|---|---|---|---|---|---|
| Mean | 0.920119 | 0.922357 | 1.135037 | 1.19902 | 1.776654 |
| StDev | 0.146768 | 0.293846 | 3.278983 | 1.28765 | 10.44849 |
| COV | 0.15951 | 0.318581 | 2.888878 | 1.073918 | 5.880992 |
| Median | 0.919672 | 0.894025 | 0.942167 | 1.014907 | 1.122609 |
| AAD | 0.08815 | 0.161046 | 0.350932 | 0.38977 | 0.863039 |
| COD | 0.09585 | 0.180136 | 0.372474 | 0.384045 | 0.76878 |
| Weighted Mean | 0.905902 | 0.884033 | 1.605467 | 0.820928 | 1.059947 |
| PRD | 1.015694 | 1.043351 | 0.706983 | 1.460567 | 1.676172 |
| PRB | 0.753529 | 0.751336 | 0.735539 | 0.682821 | 0.617312 |
| N | 635 | 717 | 530 | 349 | 483 |
Table 3.
Land ratio descriptive statistics for all qualified sales in New Haven.
| Descriptive Statistic | 2006 | 2007 | 2008 | 2009 | 2010 |
|---|---|---|---|---|---|
| Mean | 0.804 | 0.755 | 1.018 | 1.006 | 1.346 |
| StDev | 3.694 | 4.549 | 6.481 | 7.868 | 19.323 |
| COV | 4.595 | 6.027 | 6.366 | 7.824 | 14.359 |
| Median | 0.752 | 0.664 | 0.787 | 0.851 | 0.736 |
| AAD | 0.539 | 0.180 | 1.280 | 2.349 | 2.992 |
| COD | 0.717 | 0.271 | 1.625 | 2.760 | 4.063 |
| Weighted Mean | 0.717 | 0.674 | −0.667 | 0.505 | 1.294 |
| PRD | 1.122 | 1.119 | −1.525 | 1.990 | 1.040 |
| PRB | 0.922 | 0.918 | 0.880 | 0.814 | 0.941 |
| N | 635 | 717 | 530 | 349 | 483 |
Table 4.
Overall ratios descriptive statistics for all qualified sales in Hartford.
| Descriptive Statistic | 2006 | 2007 | 2008 | 2009 | 2010 |
|---|---|---|---|---|---|
| Mean | 0.977214 | 0.937145 | 0.96918 | 1.062269 | 1.109735 |
| Stand Dev | 0.141884 | 0.145174 | 0.162557 | 0.200026 | 0.246784 |
| Median | 0.9625 | 0.934548 | 0.967384 | 1.046439 | 1.089966 |
| AAD | 0.051196 | 0.102759 | 0.120376 | 0.138423 | 0.164865 |
| COD | 0.053191 | 0.109956 | 0.124435 | 0.13228 | 0.151257 |
| N | 491 | 406 | 246 | 138 | 151 |
© 2017 by the Lincoln Institute of Land Policy. Licensee MDPI, Basel, Switzerland. This article is an open access article distributed under the terms and conditions of the Creative Commons Attribution (CC BY) license (http://creativecommons.org/licenses/by/4.0/).
Share and Cite
MDPI and ACS Style
Cohen, J.P.; Fedele, M.J. Where in Connecticut Is the Best Location for a Split Tax? An Analysis of Land Assessment Equity in Several Cities. Buildings 2017, 7, 108. https://doi.org/10.3390/buildings7040108
AMA Style
Cohen JP, Fedele MJ. Where in Connecticut Is the Best Location for a Split Tax? An Analysis of Land Assessment Equity in Several Cities. Buildings. 2017; 7(4):108. https://doi.org/10.3390/buildings7040108
Chicago/Turabian StyleCohen, Jeffrey P., and Michael J. Fedele. 2017. "Where in Connecticut Is the Best Location for a Split Tax? An Analysis of Land Assessment Equity in Several Cities" Buildings 7, no. 4: 108. https://doi.org/10.3390/buildings7040108
Note that from the first issue of 2016, this journal uses article numbers instead of page numbers. See further details here.