The Perceived Benefits of Apps by Construction Professionals in New Zealand

1
Institute of Natural and Mathematical Sciences, Massey University, Albany, Auckland 0745, New Zealand
2
School of Engineering and Advanced Technology, Massey University, North Shore, Auckland 0745, New Zealand
*
Author to whom correspondence should be addressed.
Buildings 2017, 7(4), 111; https://doi.org/10.3390/buildings7040111
Submission received: 26 October 2017
/
Revised: 18 November 2017
/
Accepted: 27 November 2017
/
Published: 1 December 2017
Abstract
:The construction sector is a key driver of economic growth in New Zealand; however, its productivity is still considered to be low. Prior research has suggested that information and communication technology (ICT) can help enhance efficiency and productivity. However, there is little research on the use of mobile technologies by New Zealand construction workforce. This paper reports findings of an exploratory study with the objective of examining the perceived benefits regarding uptake of apps in New Zealand construction sector. Using self-administered questionnaire survey, feedback was received from the major construction trade and professional organisations in New Zealand. Survey data was analyzed using descriptive, one-sample t-test, Spearman’s rank correlation coefficient and structural equation modeling. Results showed that iPhone and Android phone currently dominate the smartphone market in New Zealand construction industry. The top three application areas are site photos, health and safety reporting and timekeeping. The benefits of mobile apps were widely confirmed by the construction professionals. The benefit of “better client relationship management and satisfaction” has substantial correlation with overall productivity improvement and best predictor of the overall productivity improvement. These findings provide a starting point for further research aimed at improving the uptake and full leveraging of mobile technologies to improve the dwindling productivity trend in New Zealand construction industry.
1. Introduction
Mobile technology involving the use of hand-held devices such as smartphones and tablets has changed everyday lives and also pervaded into our professional lives. Previous studies [1,2,3] suggest that information and communication technology (ICT) could improve productivity. Professional work environments comprise of social, communal, technological, computational, managerial and governmental sides among others, since different levels of information related tasks are involved. Moreover, the construction professionals (CPs) workspaces are not confined to specific office locations. With CPs being on-the-move, mobile computing can offer them a quick, simple and easy-to-carry platform to help communicate relevant on-site information to other stakeholders situated in different locations. Moreover, mobile devices (e.g., smartphone, tablet) not only provide communication and computing functions but also provide image and video capturing capabilities which could be put to use for record keeping and documentation purposes. Construction industry related apps currently available in the market offer many functionalities ranging from simple calculations to detailed architectural renderings [4]. It is estimated that there may be nearly 13,000 construction related development and design apps presently in the market [5]. Yet the attitude of uptake of such apps by construction industry in New Zealand is unknown. The aim of this study is to examine the types of phone, application areas and perceived benefits of the uptake apps in the New Zealand construction sector. The construction industry operates in a traditional brick and mortar space involving hardware fittings, heavy machinery, work-bench tools and physical implements. The use of mobile technology in construction professionals’ work environments is unknown. An exploratory study has thus been conducted to investigate this problem. The next sections discuss relevant literature, including an overview of the New Zealand construction sector and existing mobile technologies. Subsequently discussions are focused on the research method adopted. The findings of the study are discussed in relation to the research objectives.
2. Literature Review
The construction sector is a key driver of economic growth in New Zealand with annual revenues of $30 billion plus. Currently it is one of the largest sectors in the New Zealand economy employing 194,000 people; that is, one in 12 jobs are probably in construction [6]. Unfortunately productivity within construction industry is low compared to other economic sectors such as agriculture, forestry manufacturing and service industry [7]. Productivity performance trend of the construction industry has been flat-lining since 2004; it has dragged down New Zealand’s aggregate productivity growth performance [8]. As a result, the New Zealand government has identified productivity growth as a priority [6]. The term “productivity” expresses the association between outputs and inputs [9]. Productivity is a measurement of outputs relative to inputs of resources. Generally, productivity refers to the efficiency with which people or firms convert productive resources such as labour and capital into outputs of goods and services [8]. There are three measures of productivity from an economy aspect: Labour productivity, Capital productivity and Multi-factor productivity [7].
If we produce more or better goods from the same resources, we increase productivity. Or if we produce the same goods from lesser resources, we also increase productivity. By “resources”, we mean all human and physical resources, i.e., the people who produce the goods or provide the services, and the assets with which professionals can produce the goods or provide the services [10]. So improvements in productivity could be interpreted as allowing a given quantity of output to be produced using fewer resources or more and better output to be produced from the same resource base [8]. In other words, high productivity is the intensive and/or efficient use of scarce resources converting input into output, which leads to more profit [11].
The mobile operating system determines the functions and features available on smartphone. It governs the user interface and provides access to the applications and files stored on the device. For the purpose of this research, a smartphone type is defined by the mobile operating system running on the smartphone. According to the IDC smartphone OS market share research, Android captured 85% of worldwide smartphone market while iOS occupied 14.7% worldwide smartphone market in the first quarter of 2017 [12].
- Android phone: running Google’s Android mobile operating system (Android)
- iPhone: running Apple’s iPhone operating system (iOS)
- Windows phone: running Microsoft’s Windows mobile operating system (Windows)
- BlackBerry: running BlackBerry operating system developed by Research In Motion
Smartphone can provide more opportunities for faster data collection and exchange, and improve workflow efficiency [13]. Smartphones can increase productivity by reducing the time spent on many related support functions [2]. The available smartphone apps in construction sector range from project management, calculators, safety, integrated construction cost and accounting, construction site operations, computer aided design, 2D and 3D designs and drawings, estimating, and building information modelling (BIM) [1]. These apps have been developed for the purposes of increasing productivity and efficiency and for managing workflow.
Despite increasing proliferation of apps within the construction industry, little information is available on the perceptions of the CPs on the value of the apps [14]. Previous studies in the construction ICTs have focused on areas such as BIM for managing essentials of building design and project data throughout the building’s life-cycle [15,16], information management at construction sites [17], data visualization and CAD [18], security and safety infrastructure for wireless networks [19], construction defect management [20], Enterprise resource planning (ERP) in improving the effectiveness of UK construction industry [21], construction activity monitoring system [22], and overall use of apps/ICT in the construction industry [23,24]. Hence there is the need to explore the perspectives of New Zealand CPs who are the real hands-on people working on construction industry. Research conducted on USA job sites found that the mobile solutions have impact on quality, subcontractor management, site coordination, safety, productivity, material procurement, project duration, and budget [25]. Bedard [26], director of Global Enterprise Data Solutions and Verizon Enterprise Solutions, suggests mobile technologies can help all phases of the construction process to work seamlessly and keeping costs under control. The claimed benefits of using apps in construction industry are listed in in Table 1:
3. Research Questions and Survey Methods Used
The key questions driving the research are as follows:
- What are the types of smartphone used in New Zealand construction industry?
- What are the application areas the apps used in New Zealand construction industry?
- What are the perceived benefits of the use of apps in New Zealand construction industry?
- Which of the perceived benefits of the apps is the best predictor of the overall productivity improvement in New Zealand construction industry?
Answers to the above research questions are not known. To provide answers to the research questions, two stages of descriptive survey method were carried out. In the first stage an exploratory survey method was adopted to explore the key constructs embodied in the research questions. The choice of this research method was justified on two grounds. Firstly, exploratory surveys are suitable for research where the aim is to generate constructs or theories which will be validated in future quantitative research [31]. Secondly, the method is suitable for empirical data that are qualitative in nature and for which scale of measurement is ordinal [32]. Therefore the qualitative components of the empirical data for the research were obtained through in-depth interviews conducted with 14 members of the New Zealand Registered Master Builders (RMB)—the study sampling frame that represents the majority of the construction professionals in New Zealand. RMB has over three thousand members. The convenience sample of 14 members was in line with the exploratory nature of the study—i.e., to explore social phenomenon as against quantitative experimentation. While the sample size used was small, the interview-based in-depth qualitative exploration of the answers to the research questions provided rich insights on CPs’ views regarding use of apps in the construction sector. In the second stage of data gathering, questionnaire was designed based on feedback from the in depth interviews. The interview data were supplemented with insights gained from previous related research studies [24,25]. Rather than basing the required number of survey participants on the representative minimum sample size, this study adopted census survey of all members in each sampling frame. This is also due to the fact that most trade and professional organisations are reluctant to provide contact information of their members due to privacy reasons. Use of census survey also gives all subjects within the sampling frame equal opportunity to participate and hence minimize response bias. The questionnaire was hosted online and a link was provided in emails requests to all the members that comprised each sampling frame via the circulars issued by their organizational secretariats. Prior to administering the questionnaire to the study sampling frames, it was pre-tested by 8 industry professionals. The pre-test detected problems in the wording of some questions. These were rephrased for clarity and relevance with a view to improving its ability to generate good responses. A specific format of survey was followed which began with a brief description of the aims and objectives of the study and the benefits for participating in the research. The questionnaire was divided into two sections. The first section was used to collect data about the respondents’ perceptions of the benefits of the use of apps in the New Zealand construction industry. Those survey questions were ranked using the Likert scale from largest (5-strongly agree) to smallest (1-strongly disagree): degree of agreement and disagreement. The data thus collected from Likert scale is ordinal, as it refers to ranked data. The second section of the questionnaire was for demographics. Information gathered included the respondents’ experience, status in the company and focused areas of practice. The questionnaire was designed with questions that the construction professional would understand easily and complete within no more than 20 min. The construction professionals were assured that we would maintain their confidentiality and anonymity and only the researchers had access to their survey responses. The questionnaire was hosted online and links were provided in emails sent to all the members of the New Zealand Registered Master Builders (RMB), Licensed Building Practitioners (LBP), New Zealand Institute of Building (NZIOB) and New Zealand Institute of Architects (NZIA) by their organizational secretariats. In total 228 responses were received. Although the number of surveyed may seem small, all the members of those construction affiliations were given the chance to reply.
4. Data Analysis Methods
Second stage data has next been analysed using these statistical methods, namely, descriptive statistics method, One-Sample t-test, Spearman’s rank correlation coefficient (Spearman Rho) and Structural Equation Modelling.
4.1. Descriptive Statistics
The descriptive statistics provide simple summaries about the smartphone types and seven application areas identified from literature review and the first stage in-depth interviews.
4.2. One-Sample T-Test
The one sample t-test is used to determine whether a sample of observations was generated by a process with a specific mean. There are two kinds of hypotheses for a one sample t-test, the null hypothesis and the alternative hypothesis [33]. The null hypothesis assumes that no difference exists between the true mean and the comparison value whereas the alternative hypothesis assumes that some difference exists. The purpose of the one sample t-test is to determine if the null hypothesis should be rejected, given the sample data. The seven benefits identifies from literature review also identifies from the first stage in-depth interviews conducted with 14 members of RMB. We next decided to adopt a critical stance during the second stage of the study. We questioned whether the first-stage interviewees made obvious statements or whether these benefits were actually perceived by the construction workforce. Accordingly, to test the views of CPs towards the perceived benefits which apps might provide, we set up 7 null hypothesis by stating “neither agree nor disagree” to all the perceived benefits.
4.3. Overall Productivity Improvement and Perceived Benefits: Spearman’s Rank Correlation Coefficient
According to New Zealand Centre for Advanced Engineering [34] and Construction Best Practice Programme [35], the important factors affecting productivity are time, cost, quality, client satisfaction, change orders, business performance and health and safety. This suggests the following corresponding hypotheses:
- “More efficient management of checklists, documentation and sign-offs” of smartphone apps’ benefits have positive influence on “Overall improvement in productivity and profit margin on the job”
- “Greatly improve efficiency and accuracy of site inspections and reporting” of smartphone apps’ benefits have positive influence on “Overall improvement in productivity and profit margin on the job”
- “Better client relationship management and satisfaction” of smartphone apps’ benefits have positive influence on “Overall improvement in productivity and profit margin on the job”
- “More efficient employee or subcontractor timesheet management, greater visibility into workforce productivity, performance monitoring and evaluation” of smartphone apps’ benefits have positive influence on “Overall improvement in productivity and profit margin on the job”
- “Greatly reduce liability and risks through accurate and prompt compliance reporting” of smartphone apps’ benefits have positive influence on “Overall improvement in productivity and profit margin on the job”
- “Ability to more accurately and efficiently price and track change orders” of smartphone apps’ benefits have positive influence on “Overall improvement in productivity and profit margin on the job”
- “More accurate customer invoicing and real time tracking for prompt payments” of smartphone apps’ benefits have positive influence on “Overall improvement in productivity and profit margin on the job”
To check the relationship between listed benefits and the overall improvement in productivity and profit, Spearman’s correlation coefficient (Spearman Rho) method (s) method was used to analyse any relationship between the two diverse data sets.
4.4. Structural Equation Modelling
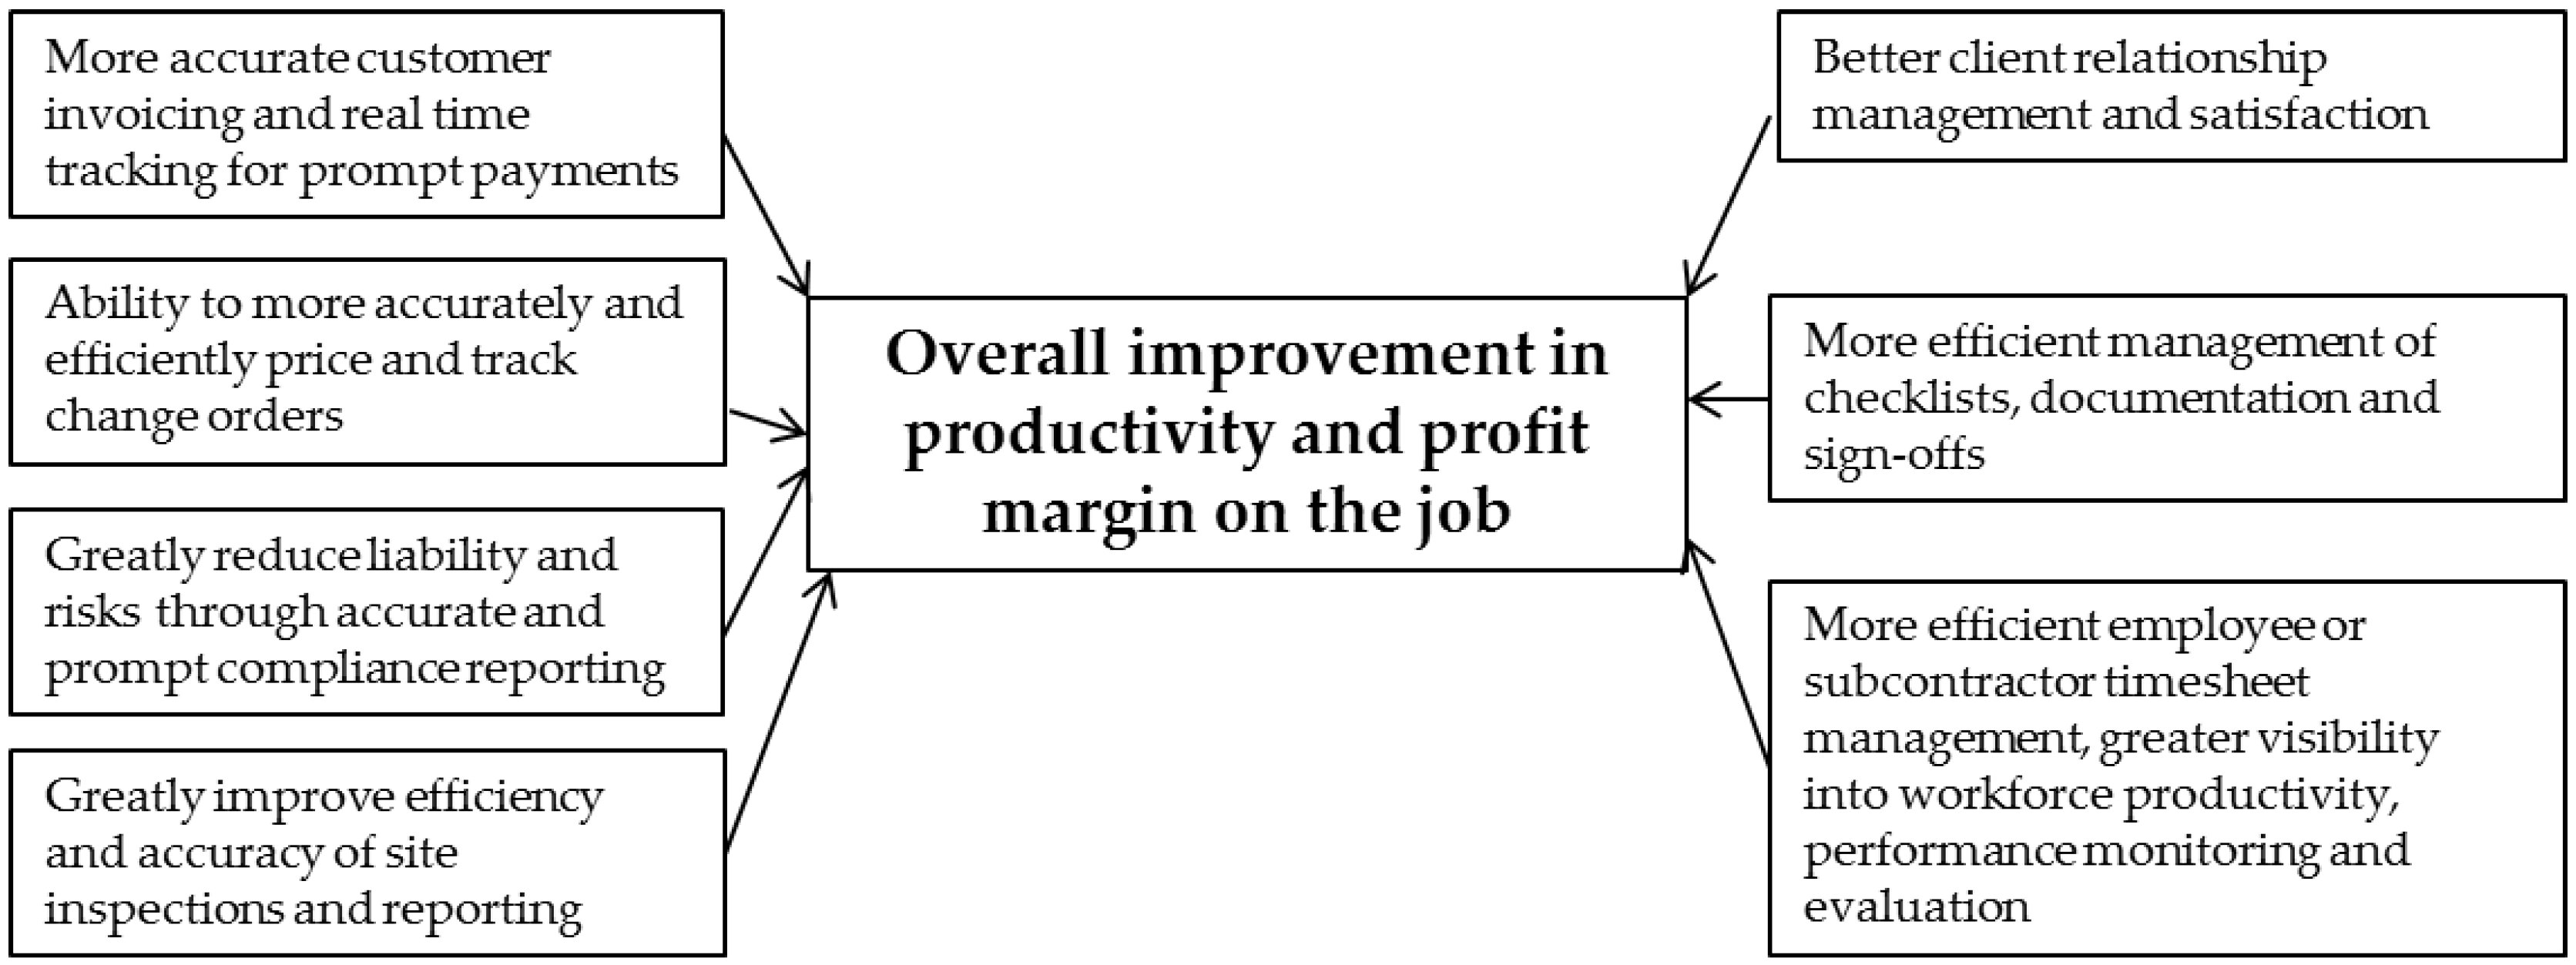
Structural equation modelling (SEM) is a statistical modelling technique. SEM often involves a certain exploratory element. According to Hair et al. [36], SEM has the ability to (1) estimate multiple and interrelated dependence relationships; (2) represent unobserved concepts in these relationships and (3) define a model explaining an entire set of relationships. The analysis of moment of structures (AMOS) is statistical software, which is specially used for structural equation modeling, path analysis, and confirmatory factor analysis. AMOS performs the computations for SEM and displays the results. Because of these advantages, AMOS-based SEM has been applied in this study to explore and validate causal relationships between perceived benefits of mobile apps and its perceived contribution to productivity improvement in the New Zealand construction industry. After Spearman Rho tests, the conceptual model of listed benefits and the overall improvement in productivity is developed as shown in Figure 1. Each arrow will contain a specific weight of relationship after the SEM applied.
5. Results and Discussion
This section presents the results of the questionnaire survey. Among the 228 responses, 130 respondents actually completed the status and experience questions. Of these 56.92% of the responses were in the higher tier of management having roles such as CEO or director in their company, while 30% were project, construction or site manager. Further, about 86.67% of the participants had more than 5 years of work experience in the construction industry while 49.63% of the participants had more than 21 years of work experience in the construction industry. The surveyed participants worked in business areas such as general contracting, project management, earthworks and civils, architect, consultancy, design, joinery and sub construction across differing functional areas (carpentry, roofing, painting, plasterboard linings, concreting, glazing, plumbing, drainage, gas fitting, mechanical, heating air conditioning and ventilation, electrical and tiling).
5.1. Mobile Devices Used in the Construction Industry
Among the 228 responses, 227 respondents completed the question asking if they use mobile technologies. Majority of the respondents (i.e., 209 or 92%) use mobile technologies. 14 respondents (6.17%) said they did not use mobile technologies while 4 respondents (1.76%) stated that they have no idea about mobile technologies. Among the 228 responses, 141 respondents actually answered the question about mobile devices they or their company use. They can choose more than one devices. iPhone and Android phone are most popular devices in New Zealand construction industry. The results are shown in Table 2.
5.2. Areas of Apps Use in the Construction Industry
Among the 228 responses, 139 respondents completed the question about the areas of apps use. Survey results indicated that the respondents were using mobile solutions for multiple application areas as shown in Table 3. The top five applications are site photos (94.24%), Health and Safety reporting (37.41%), Timekeeping (34.53%), RFI’s (30.22%) and Progress Tracking (29.50%).
5.3. Perceived Benefits of App Use
Among the 228 responses, 138 respondents completed the question about the benefits of apps. The questionnaire listed potential benefits offered by smartphone apps and respondents were asked to rank their agreement or disagreement over a 5 point Likert scale: 5 = “strongly agree”; 4 = “agree”; 3 = “neither agree nor disagree”; 2 = “disagree” and 1 = “strongly disagree”. In relation to the hypotheses, we tested if the means of responses for the benefits of mobile technology were within the average value. Table 4 shows that the p-values of the mean ratings are less than the critical alpha value of 0.01 in each case. The critical alpha value <0.01 implies that there is only less than 1% chance that the null hypothesis was in fact true. Therefore there was no statistical basis for accepting the null hypothesis that the people neither agree nor disagree that mobile technology can bring benefits.
Based on the results, all the mean values are greater than 3, we could conclude on above seven perceptions of respondents in relation to benefits from the use of mobile apps in construction.
Perceived Benefits Towards Overall Productivity
As a second measure of consistency check, we examined the causal relationship between the perceived benefits of the technology and the overall improvement in productivity and profit that could be achieved by its use. Spearman’s correlation coefficient (s) method was used to analyse the significance of the relationship between the two diverse data sets. Relationships are first described as positive or negative, and then ranked in the following order: perfect ( = 1), strong ( >= 0.7), substantial ( >= 0.5), moderate ( >= 0.3), weak ( >= 0.1) or none ( >= 0.0) [37,38]
It was found that all the perceived benefits of using mobile technology has positive relationship with overall productivity improvement while “better client relationship management and satisfaction” has substantial correlation with using mobile technology to ensuring overall improvement in productivity and profit as shown in Table 5.
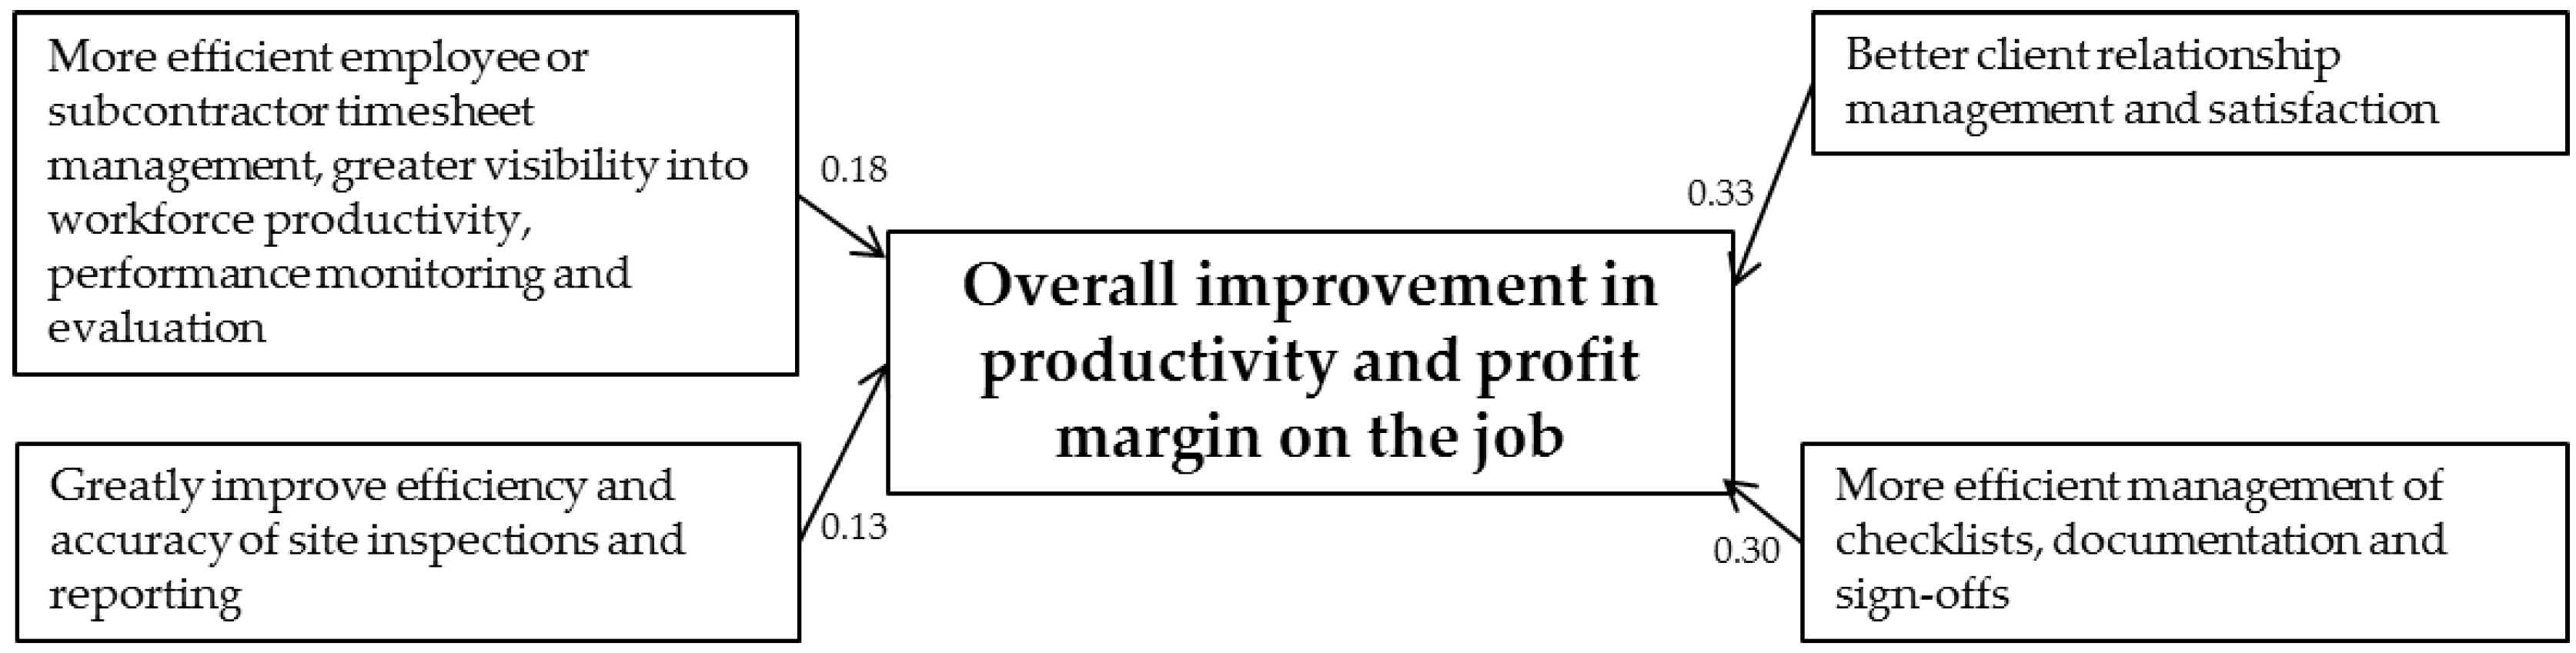
Lastly, we use the analysis of moment of structures (AMOS)-based structural equation modeling (SEM) routine to model and validate the causal relationships between the perceived benefits as independent variables and the overall productivity improvement as the dependent variable. Validity was checked by examining the extent to which developed model fitted the estimated covariance matrices of the dataset. Figure 2 shows the structural equation model developed for this purpose. Out of 7 benefits, only 4 benefits listed in Figure 2 have p-value is less than 0.05. In the majority of statistical analysis, the p-value of 0.05 is used as the cut-off for significance. The significance is found in those 4 benefits. The other 3 benefits have p-values are larger than 0.05. Their significant do not exists. So they are removed from the model.
The output of the regression weights of the perceived benefits of the use of mobile app in Table 6 showed that ‘better client relationship management and satisfaction’ is best predictor of the overall improvement in productivity and profit than other benefits.
6. Conclusions
This research has investigated smartphone use by construction professionals, perceived benefits, key areas of utilization by the construction professionals in New Zealand. Results showed that Apple’s iOS and Google’s Android currently dominate the smartphone market in the construction industry. Site photos, health & safety reporting and timekeeping are top three smartphone application areas utilized by CPs. Overall the New Zealand construction industry has a generally positive attitude towards adoption of smartphone apps. Results indicate all these benefits of using apps have positive relationship with improving overall improvement in productivity and profit in New Zealand construction industry. The benefit of “better client relationship management and satisfaction” has substantial correlation with overall productivity improvement and best predictor of the overall productivity improvement. Findings of the study could help to improve the uptake and full leveraging of mobile technology in the construction industry. This could in turn contribute to improving the dwindling productivity trend in the industry and to achieving the national agenda of 20% productivity improvement by the year 2020 [39]. The research has implications for apps developers to gain better insights on the need application areas of construction professionals. This research is not without limitations. The views expressed are limited to a small percentage of the construction professionals, and hence cannot be generalized beyond the study scope. However, it provides a starting point for further research into the subject.
Author Contributions
Tong Liu is the primary researcher who conducted the study. Tong conducted interviews, identified relevant literature, designed the questionnaire, collected and statistically analysed the dataset, and wrote 80% of the paper. The other co-authors (Jasper Mbachu, Anuradha Mathrani, Beatrix Jones and Barry McDonald) assisted with the questionnaire design, statistical evaluation of the dataset and reviewing of the paper. The author list comprises academics in information technology, construction and statistics, who contributed as a team to highlight the key findings from this research.
Conflicts of Interest
The authors declare no conflict of interest.
References
- Peansupap, V.; Walker, D. Factors affecting ICT diffusion: A case study of three large Australian construction contractors. Eng. Constr. Archit. Manag. 2005, 12, 21–37. [Google Scholar] [CrossRef]
- Pilat, D.; Lee, F.C. Productivity Growth in ICT-Producing and ICT-Using Industries; OECD iLibrary: Paris, France, 2001. [Google Scholar]
- Walker, D.; Hampson, K. Procurement Strategies: A Relationship-Based Approach; John Wiley & Sons: New York, NY, USA, 2008. [Google Scholar]
- Top 10+ Construction Apps for iPhone. Available online: http://www.topapps.net/apple-ios/top-construction-apps-for-iphone.html/ (accessed on 1 November 2016).
- Yovino, J. 14 Construction Apps for 2014. Available online: http://dailyreporter.com/2013/12/27/14-construction-apps-for-2014/ (accessed on 1 November 2016).
- Ministry of Business Innovation & Employment. Construction in New Zealand; Ministry of Business Innovation & Employment: Wellington, New Zealand, 2005.
- Page, I.; Norman, D. Measuring Construction Industry Productivity and Performance; BRANZ: Judgeford, New Zealand, 2014. [Google Scholar]
- Conway, P.; Meehan, L. Productivity by the Numbers: The New Zealand Experience; New Zealand Productivity Commission: Wellington, New Zealand, 2013.
- Liou, F.-S.; Borcherding, J.D. Work sampling can predict unit rate productivity. J. Constr. Eng. Manag. 1986, 112, 90–103. [Google Scholar] [CrossRef]
- Bernolak, I. Effective measurement and successful elements of company productivity: The basis of competitiveness and world prosperity. Int. J. Prod. Econ. 1997, 52, 203–213. [Google Scholar] [CrossRef]
- Arditi, D. Construction productivity improvement. J. Constr. Eng. Manag. 1985, 111, 1–14. [Google Scholar] [CrossRef]
- International Data Corporation (IDC). Smartphone OS Market Share, 2017 Q1. Available online: http://www.idc.com/promo/smartphone-market-share/os (accessed on 1 September 2017).
- Bowden, S.; Dorr, A.; Thorpe, A.; Anumba, C.J.; Gooding, P. Making the case for mobile IT in construction. Comput. Civ. Eng. 2005, 1–12. [Google Scholar] [CrossRef]
- Ministry of Business Innovation & Employment. Productivity Improvement from Value Stream Mapping: The NZ Small Builder—New House Segment; Ministry of Business Innovation & Employment: Wellington, New Zealand, 2013.
- Park, J.; Cho, Y.K.; Kim, K. Field construction management application through mobile BIM and location tracking technology. In Proceedings of the 33rd ISARC International Symposium on Automation and Robotics in Construction, Auburn, AL, USA, 18–21 July 2016. [Google Scholar]
- Suermann, P.C.; Issa, R.R. Evaluating industry perceptions of building information modelling (BIM) impact on construction. J. Inf. Technol. Constr. 2009, 14, 574–594. [Google Scholar]
- Chen, Y.; Kamara, J.M. A framework for using mobile computing for information management on construction sites. Autom. Constr. 2011, 20, 776–788. [Google Scholar] [CrossRef]
- Yang, S.W.; Choi, Y.; Lee, H.C. CAD data visualization on mobile devices using sequential constrained Delaunay triangulation. Comput.-Aided Des. 2009, 41, 375–384. [Google Scholar] [CrossRef]
- Strachan, R.; Stephenson, P. Futuristic construction communication infrastructures: Secure and safe with no wires. J. Inf. Technol. Constr. 2009, 14, 526–539. [Google Scholar]
- Dong, A.; Maher, M.L.; Kim, M.J.; Gu, N.; Wang, X. Construction defect management using a telematic digital workbench. Autom. Constr. 2009, 18, 814–824. [Google Scholar] [CrossRef]
- Barthorpe, S.; Chien, H.-J.; Shih, J.K. A survey of the potential for enterprise resource planning (ERP) in improving the effectiveness of construction management in the UK construction industry. Int. J. Comput. Appl. Technol. 2004, 20, 120–128. [Google Scholar] [CrossRef]
- Rebolj, D.; Babič, N.Č.; Magdič, A.; Podbreznik, P.; Pšunder, M. Automated construction activity monitoring system. Adv. Eng. Inform. 2008, 22, 493–503. [Google Scholar] [CrossRef]
- Ekow, Y.J.; Kofi, O.G. Awareness and Utilization of Construction Related Smart Mobile Device Applications in the Construction Industry. Sci. Technol. 2016, 6, 1–7. [Google Scholar]
- Ikediashi, D.I.; Ogwueleka, A.C.; Haupt, T. Assessing the use of ICT systems and their impact on construction project performance in the Nigerian construction industry. Eng. Constr. Archit. Manag. 2016, 14, 252–276. [Google Scholar] [CrossRef]
- Azhar, S.; Cox, A.J. Impact of Mobile Tools and Technologies on Jobsite Operations. In Proceedings of the 51st ASC Annual International Conference Proceedings, College Station, TX, USA, 22–25 April 2015. [Google Scholar]
- Bedard, P. How Mobile Technologies Are Boosting Construction Site Efficiency. 2013. Available online: http://www.areadevelopment.com/AssetManagement/April2013/construction-site-mobile-project-management-272725.shtml (accessed on 1 January 2017).
- eSUB. 4 Ways for Construction to Benefit from Mobile Apps. Available online: https://esub.com/4-ways-for-construction-to-benefit-from-mobile-apps/ (accessed on 1 January 2017).
- CMA. Benefits of Construction Mobile Apps. Available online: http://blog.constructionmarketingassociation.org/benefits-of-construction-mobile-apps/ (accessed on 1 January 2017).
- Bowden, S.; Dorr, A.; Thorpe, T.; Anumba, C. Mobile ICT support for construction process improvement. Autom. Constr. 2006, 15, 664–676. [Google Scholar] [CrossRef]
- Base. Lead Management App for Construction Workers. Available online: https://www.futuresimple.com/lead-management-app-for-construction-workers/ (accessed on 1 January 2017).
- Zikmund, W.G.; Babin, B.J.; Carr, J.C.; Griffin, M. Business Research Methods; Cengage Learning: Belmont, CA, USA, 2013. [Google Scholar]
- Bryman, A.; Bell, E. Business Research Methods; Oxford University Press: New York, NY, USA, 2015. [Google Scholar]
- Statistical Package for the Social Sciences (SPSS) data analysis software packages, version 21; IBM: New York, NY, USA, 2012.
- Chartered Accountants Australia and New Zealand (CAENZ NZ). Construction Industry KPI’s; Chartered Accountants Australia and New Zealand: Wellington, New Zealand, 2008. [Google Scholar]
- Beatham, S.; Anumba, C.; Thorpe, T.; Hedges, I. KPIs: A critical appraisal of their use in construction. Benchmark. Int. J. 2004, 11, 93–117. [Google Scholar] [CrossRef]
- Hair, J.F.; Black, W.C.; Babin, B.J.; Anderson, R.E.; Tatham, R.L. Multivariate Data Analysis, 6th ed.; Pearson Prentice Hall: Upper Saddle River, NJ, USA, 2006. [Google Scholar]
- Jackson, S.L. Research Methods: A Modular Approach; Cengage Learning: Belmont, CA, USA, 2014. [Google Scholar]
- Miller, L.E. Appropriate Analysis. J. Agric. Educ. 1998, 39, 1–10. [Google Scholar] [CrossRef]
- Kane, C. Productivity Roadmap; Productivity Partnership: Wellington, New Zealand, 2012. [Google Scholar]
Figure 1.
Conceptual Model: Benefits of Apps and Overall Productivity Improvement
Figure 2.
SEM of the Causal Relationships Between the Perceived Benefits of Apps and Overall Productivity Improvement
Figure 2.
SEM of the Causal Relationships Between the Perceived Benefits of Apps and Overall Productivity Improvement

Table 1.
Benefits of Using Apps
| Benefits of Using Apps. | Reference |
|---|---|
| More efficient management of checklists, documentation and sign-offs | [25,27,28] |
| More accurate customer invoicing and real time tracking for prompt payments | [25,28] |
| More efficient employee or subcontractor timesheet management, | [25,28,29] |
| greater visibility into workforce productivity, performance monitoring and evaluation | |
| Ability to more accurately and efficiently price and track change orders | [2,27,28,29] |
| Greatly reduce liability and risks through accurate and prompt compliance reporting | [25,27,28,29] |
| Greatly improve efficiency and accuracy of site inspections and reporting | [25,27,28,29] |
| Better client relationship management and satisfaction | [25,30] |
Table 2.
Mobile Devices Used in New Zealand Construction Industry.
| Devices | Response Count | Response Percentage |
|---|---|---|
| iPhone | 105 | 74.47% |
| iPAD | 56 | 39.72% |
| Andriod Phone | 70 | 49.65% |
| Andriod Tablet | 30 | 21.28% |
| Tablet PC | 23 | 16.31% |
| Windows Phone/Tablet | 7 | 4.96% |
| RFID | 3 | 2.13% |
| Wearable Devices | 2 | 1.42% |
| Blackberry | 1 | 0.71% |
Table 3.
Application Areas Used for New Zealand Construction Industry.
| Devices | Response Count | Response Percentage |
|---|---|---|
| Site Photos | 131 | 94.24% |
| Health & Safety Reporting | 52 | 37.41% |
| Timekeeping | 48 | 34.53% |
| RFI’s | 42 | 30.22% |
| Progress Tracking | 41 | 29.50% |
| Change Orders | 24 | 17.27% |
| Communication | 19 | 13.67% |
| Punch List | 14 | 10.07% |
Table 4.
Perceived Benefits of The Use Of Mobile Technology in Construction.
| Benefits of the Use of Mobile Technology | Mean Rating | p-Value |
|---|---|---|
| More efficient management of checklists, documentation and sign-offs | 3.797 | 0.000 |
| Greatly improve efficiency and accuracy of site inspections and reporting | 3.6719 | 0.000 |
| Better client relationship management and satisfaction | 3.6535 | 0.000 |
| More efficient employee or subcontractor timesheet management, | 3.5385 | 0.000 |
| greater visibility into workforce productivity, performance monitoring and evaluation | ||
| Greatly reduce liability and risks through accurate and prompt compliance reporting | 3.5159 | 0.000 |
| Ability to more accurately and efficiently price and track change orders | 3.5078 | 0.000 |
| More accurate customer invoicing and real time tracking for prompt payments | 3.5039 | 0.000 |
Table 5.
Spearman Rho Test Results: Perceived Benefits Towards Overall Productivity
| Benefits of the Use of Mobile Technology | Correlation Coefficient |
|---|---|
| More efficient management of checklists, | +moderate (s = 0.467) |
| documentation and sign-offs | |
| More accurate customer invoicing and real time | +moderate (s = 0.481) |
| tracking for prompt payments | |
| More efficient employee or subcontractor timesheet management, | +moderate (s = 0.450) |
| greater visibility into workforce productivity, | |
| performance monitoring and evaluation | |
| Ability to more accurately and efficiently price | +moderate (s = 0.445) |
| and track change orders | |
| Greatly reduce liability and risks through accurate | +moderate (s = 0.406) |
| and prompt compliance reporting | |
| Greatly improve efficiency and accuracy of site i | +moderate (s = 0.409) |
| nspections and reporting | |
| Better client relationship management and satisfaction | +substantial (s = 0.656) |
Table 6.
Regression Weights of Perceived Benefits of the Use of Apps Towards Overall Productivity.
| Benefits | Estimate | S.E. | C.R. | p-Value |
|---|---|---|---|---|
| More efficient management of checklists, | 0.304 | 0.061 | 4.946 | 0.000 |
| documentation and sign-offs | ||||
| More accurate customer invoicing and real time | −0.022 | 0.057 | −0.380 | 0.704 |
| tracking for prompt payments | ||||
| More efficient employee or subcontractor timesheet management, | 0.179 | 0.054 | 3.329 | 0.000 |
| greater visibility into workforce productivity, | ||||
| performance monitoring and evaluation | ||||
| Better client relationship management and satisfaction | 0.327 | 0.058 | 5.608 | 0.000 |
| Greatly reduce liability and risks through accurate and | 0.019 | 0.060 | 0.309 | 0.757 |
| prompt compliance reporting | ||||
| Ability to more accurately and efficiently price and | 0.030 | 0.060 | 0.501 | 0.616 |
| track change orders | ||||
| Greatly improve efficiency and accuracy of | 0.127 | 0.059 | 2.152 | 0.031 |
| site inspections and reporting |
© 2017 by the authors. Licensee MDPI, Basel, Switzerland. This article is an open access article distributed under the terms and conditions of the Creative Commons Attribution (CC BY) license (http://creativecommons.org/licenses/by/4.0/).
Share and Cite
MDPI and ACS Style
Liu, T.; Mbachu, J.; Mathrani, A.; Jones, B.; McDonald, B. The Perceived Benefits of Apps by Construction Professionals in New Zealand. Buildings 2017, 7, 111. https://doi.org/10.3390/buildings7040111
AMA Style
Liu T, Mbachu J, Mathrani A, Jones B, McDonald B. The Perceived Benefits of Apps by Construction Professionals in New Zealand. Buildings. 2017; 7(4):111. https://doi.org/10.3390/buildings7040111
Chicago/Turabian StyleLiu, Tong, Jasper Mbachu, Anuradha Mathrani, Beatrix Jones, and Barry McDonald. 2017. "The Perceived Benefits of Apps by Construction Professionals in New Zealand" Buildings 7, no. 4: 111. https://doi.org/10.3390/buildings7040111
Note that from the first issue of 2016, this journal uses article numbers instead of page numbers. See further details here.