Design Oriented Model for the Assessment of T-Shaped Beam-Column Joints in Reinforced Concrete Frames
by
 , ,
, ,
Antonio Bossio
1 ,
,
Francesco Fabbrocino
2,
Gian Piero Lignola
1,*,
Andrea Prota
1 and
Gaetano Manfredi
1 1
Department of Structures for Engineering and Architecture, University of Naples “Federico II”, 80125 Napoli, Italy
2
Department of Engineering, Telematic University Pegaso, 80143 Napoli, Italy
*
Author to whom correspondence should be addressed.
Buildings 2017, 7(4), 118; https://doi.org/10.3390/buildings7040118
Submission received: 26 October 2017
/
Revised: 27 November 2017
/
Accepted: 6 December 2017
/
Published: 10 December 2017
Abstract
:Beam-column joints represent very important elements of reinforced concrete (RC) structures. In fact, beams and columns, at the boundary, generate internal forces acting on concrete core and on reinforcement bars with a very high gradient. To fully understand the seismic performances and the failure modes of T-shaped beam-column joints (external corner-positioned) in RC structures, a simplified analytical model of joint behaviour is proposed and theoretical simulations have been performed. The model is based on the solution of a system of equilibrium equations of cracked joint portions designed to evaluate internal stresses at different values of column shear forces. The main aim of the proposed model is to identify the strength hierarchy. Limit values of different internal stresses allow us to detect the occurrence of different failure modes (namely the failure of the cracked joint, the bond failure of passing through bars, and the flexural/shear failures of columns or beams) associated with column shear forces; the smaller one represents the capacity of the joint. The present work, focusing on T-shaped joints, could represent a useful tool for designers to quantify the performance of new structures or of existing ones. In fact, such a tool allows us to push an initial undesired failure mode to a more appropriate one to be evaluated. Finally, some experimental results of tests available in literature are reported, analysed, and compared to the predictions of the proposed model (by means of a worked example) and of some international codes. The outcomes confirm that failure modes and corresponding joint capacities require an analytical model, like the proposed one, to be accurately predicted.
1. Introduction
Reinforced concrete has been used for more than a century. The early buildings were surely designed by simply considering vertical loads. During the following decades, different codes have followed, so nowadays it is very common to find buildings designed according to old seismic codes or without considering any seismic provision. These buildings usually present a lack of capacity in beam-column joints. Although joints have a restricted area, they are strongly involved in the transfer of forces, mostly under earthquakes. In particular, they often present low shear strength in the joints, leading to brittle shear failures [1,2]. An inadequate design can lead to a shear failure of beam-column joints and to a consequent collapse of the structure [3], particularly in the case of earthquakes [4,5,6,7], even if they are expected to be safe according to classical seismic evaluations that neglect the failure of the joints. For example, referring to L’Aquila earthquake (2009) [8,9], some observations of damaged structures showed that mid-90s Italian structures or older [10,11,12] could present structural lack in joints due to the design approach or insufficient reinforcement, especially in cases of lack of transverse reinforcements (or due to the reduction of the reinforcement cross section due to corrosion [13,14,15,16,17], which should be accounted for in the assessments). In addition, under a seismic action, the beam-column joint is subjected to bending moments (clockwise or counter clockwise) and bars are pushed or pulled at the sides of the joint panel. Under such loading, and if concrete strength and quality are low or the column is not wide enough, debonding of steel bars could occur [18,19] and beams could lose their load capacity.
In previous works available in scientific literature, a number of beam-column joint models have been proposed. For instance, rotational hinges have been calibrated [20,21,22], or macro-element models have been defined [23,24,25], to simulate failed joint behaviour; in a few cases, finite element (FE) models have been proposed [26,27]; however, FE models are usually complex and require significant resources; consequently, they are usually not preferable for practitioner-oriented analyses. Each model has limitations and advantages, but there is no wide consensus on a preferable modelling technique, as many of them are more oriented to a research approach, requiring a comparably detailed and refined modelling of the frames. To obtain a good balance between simplicity and accuracy, this paper proposes a simplified approach suitable for analyzing frames and detecting beam-column joint failure that does not require particular calibrations for each joint.
2. Research Significance
The aim of the present paper is to investigate the corner-positioned RC beam-column joints in order to study their seismic behaviour and to establish the strength hierarchy in the case of failure of beam-column joints, particularly focusing on corner-positioned joints. It aims to contribute to strength hierarchy principles and good practice in their assessment. Modern design codes are strictly linked to these design principles, because the beam-column joint panels’ behaviour influences the ductility of the global structure. Presented theoretical analytical outcomes have been discussed and compared to experimental results.
3. Basis of Theoretical Model
Many experimental data, related to external corner-positioned joints and present in the scientific literature, were gathered and analysed. These data are the result of experimental laboratory tests performed on joints with various geometries, subjected to cyclic load, for which the load levels leading to joint’s failure have been recorded. The evaluation model used to analyse the joints and failure modes is an improvement on the model proposed by Shiohara [28], partially modified in Bossio et al. [29] to account for internal joints. In the case of external joints, the simplifications due to symmetry are no longer valid; therefore, the verse of the shear (positive or negative) should be accounted for and equations modified accordingly. Several geometries of joints have been considered and the shear force has been applied to columns; the so called column shear, Vc, values are assumed as the main force parameter in frame analysis, and the related failure modes, involving the joint assemblage, were evaluated for each of them. Starting from the basic configuration (typical of experimental laboratory test), some geometrical and internal reinforcement modifications were considered and column shear, Vc, values were calculated, so it was possible to detect the relevant failure mode variations, too.
3.1. Mathematical Formulation
The scheme of T-shaped joint was identified by defining the geometric parameters and stresses, as shown in Figure 1 and Figure 2, in the case of negative or positive column shear, respectively. Because of the asymmetry of this kind of joint, two different verses of column shear, Vc, need to be considered (positive and negative). In fact, depending on the column shear verse, the forces acting on the joint panel change (Figure 1a and Figure 2a). The internal forces of the joint, acting on each of the four rigid portions cut by typical diagonal cracks in joints, need to be defined. In the case of positive column shear, the tensile forces of longitudinal bars that cross the joint panel are named F1, F2, F7, and F8, and the compressive forces (assumed as acting at the position of the bars) are named F3, F4, F5, and F6, while the F9, F10 are the resultant force carried by stirrups and/or eventual external reinforcement, and C is the concrete compressive resultants on half of the diagonal (i.e., ) of the joint panel. Particularly, F9 represents the resultant force exerted by stirrups or horizontally-placed externally bonded reinforcements (EBR), and F10 represents the resultant force exerted by vertically-placed EBR (e.g., made of FRP with fibers aligned in the vertical direction). In order to simplify the calculation procedure, the resulting compressive forces of the concrete strut, C, are assumed to act normally on the cross section and are centred with respect to the diagonal of the joint. Conversely, in the case of negative column shear, the tensile strain forces of longitudinal bars that cross the joint panel are named F3, F4, F5, and F6, and the compressive forces are named F1, F2, F7, and F8, while the resultant force absorbed by stirrups and/or externally bonded reinforcements is named F9, and F10 and C are the same, as previously defined.
Referring to Figure 1, in case of positive column shear, the internal forces are obtained by solving Equation (1):
while referring to Figure 2, in case of negative column shear, internal forces are obtained by solving Equation (2):
It is possible to evaluate each internal force by solving a system of equations involving the three equilibrium equations (vertical translation, horizontal translation, and rotation) for each of the four rigid portions of the joint. Of the twelve equations, nine only are independent. If the values for F9, F10, Nc, and Nb are fixed, and considering Equation (3), it is possible to reduce the unknowns to nine.
and aspect ratio is introduced as a = Lc/Lb.
In the case of positive column shear, by solving the system of Equations (4)–(12), all internal forces are evaluated as a function of Vc.
while in the case of negative column shear, the system to solve is represented by Equations (10)–(18), because rotational equilibriums are the same, while translational equilibriums change.
All the symbols introduced in previous equations are depicted in Figure 1 and Figure 2 and in the notation list; it is worth noting that in Equations (10)–(12), the width B of the joint can be equal either to width Bb of beam or width Bc of column, or it can even be different. By solving the system of Equations (4)–(12) or (10)–(18), it is possible to correlate each internal force to column shear values, e.g., as F1(Vc). Then, the limit values of internal forces generating the internal failure mechanisms of the joint can be defined and, consequently, the corresponding column shear, Vc, values are strictly related to the activation of each failure mode, according to Table 1. The capacity of the joint is represented by the minimum of the Vc values.
3.2. Failure Modes
Focusing on joint panel, three failure modes were considered: (i) joint failure with tensile yielding or failure of longitudinal horizontal or vertical reinforcements (related to Vc5 to Vc7 respectively, according to Table 1); (ii) de-bonding of longitudinal reinforcements (related to Vc8 to Vc10, according to Table 1); and (iii) failure of concrete strut (related to Vc11, according to Table 1). The former failure mode is related to the conventional failures of reinforcements in tension (breakage, or yielding on safe side). Considering different layers of bars, i, having cross section, Ak, and characteristic yielding (or eventually ultimate) stress, fy,k, each Fi, can be calculated according to Equation (19) and limited to the axial strength, Fmax.
When Fmax is reached in a horizontal or vertical reinforcement layer, the corresponding Vc is the ultimate column shear Vc5 or Vc6 and Vc7 (for upper or lower columns that have a different axial load), respectively.
Referring to a failure mode due to de-bonding of longitudinal reinforcements (related to Vc8, Vc9, or Vc10), three different de-bonding conditions were considered according to Model Code 2010 and given concrete compressive strength fc [30]:
The maximum bond force is provided by the bond strength multiplied by the lateral surface of the bars only for the length inside the rigid portions cut by diagonal cracks in joints. Three conditions of adhesion can be identified, and corresponding bond strength values are , , and (but it is worth noting that bond force could reach values up to six times lower in some cases [30]). In the case of positive shear, at the upper layer of bars, the value of bond force is F1 + S4, while, at the bottom side, the bond force is F7 + S6; in the case of negative shear, at the upper layer of bars, the value of bond force is F4 + S1, while, at the bottom side, the bond force is F6 + S7, where S_s are the steel contributions. The resultant compressive force needs to be split into steel contribution, S_, and concrete contribution, C_ (Figure 3a,b shows S4 and S6 in the case of positive column shear depicted in Figure 1b). In particular, as shown in Figure 1b (for S4 and S6) and Figure 2b (for S1 and S7), there are four steel contributions that can be calculated, for instance, according to Equations (23)–(26).
To calculate the neutral axis depth, c, recalling linearity of strain diagram of cross section (before attainment of debonding), it is possible to offset to zero the static moment, with respect to the neutral axis, considering the homogenized cross section. When maximum bond force is reached, the corresponding Vc is the ultimate column shear Vc8 to Vc10, depending on the considered bond condition.
The latter considered failure mode is the crushing of concrete strut (related to Vc11). It is possible to obtain the maximum value of concrete contact force, C, by limiting its value to the value of compression strength (of concrete fc) in half strut by solving Equation (27):
If shear friction is assumed along cracks, the concrete contact force, C, can be assumed inclined, θ, not as the diagonal crack (i.e., ϑ ≠ θ), thus requiring a shear friction check, in which deviation from diagonal (i.e., │ϑ − θ│) should be limited to a threshold value.
When maximum concrete contact force is reached, the corresponding Vc is the ultimate column shear Vc11.
Even if present paper focuses on T-shaped joint failure only, the evaluation of the beam and column failure modes is also recommended, according to classical structural analysis approaches (Cosenza et al., 2008) [31]. Considering the failure modes potentially occurring outside the joint that are related to bending moment of beam (ultimate bending moment of beam, Mb) or column (ultimate bending moment of column, Mc, and note that upper and lower columns have different axial loads, and hence strength), and to shear failure of beam (ultimate shear of beam, Vb), it is possible to express them in relation to the column shear, Vc, by solving Equations (28)–(30), respectively.
Finally, the column ultimate shear value leading to column shear failure is, obviously, directly equal to the ultimate column shear, Vc4. The minimum value of calculated column shear values corresponds to the failure mode involving the joint panel.
Please note that even if ultimate bending moment of beam is related to reinforcement yielding, like as the condition provided by Equation (19) for the joint failure, the two failure modes are totally different, as flexural failure of beam is the preferred ductile failure of the system, while joint failure is in any case a brittle failure (associated with reinforcement failure, or simply yielding).
4. Behaviour of Proposed Model and Validation
Scientific literature presents numerous experimental test results; among them, tests by El-Amoury and Ghobarah, [32], Masi et al. [27], and Russo and Pauletta, [33], performed on different kinds of geometry of T-shaped joint, were selected to evaluate stress values leading to failure of the system. By using the proposed theoretical model for each geometry and each considered failure modes of the joints, the values of column shear, Vc, were calculated (and named Vc1 to Vc11 for each considered failure mode, according to Table 1).
Differently from internal joints (Bossio et al. [29]), T-shaped joints are lacking in symmetry simplifications, and positive sign of shear needs to be distinguished from negative one. In order to explain proposed model application, a worked example is provided in the Appendix A and some model predictions were compared to experimental tests. Actual failure mode is represented by the minimum value of column shear load and is limited by bond conditions. The main idea is to create an interesting tool to prevent undesired failure modes (brittle shear failure of the joint, beams, or columns) or to push the failure mode to a more desired ductile beam flexural failure (in case of retrofit or design review). In fact, according to “capacity design” approach, once the desired failure mode is decided, it is possible to use external strengthening (on existing structures), or the design can be calibrated to let ultimate column shear of undesired failure modes exceed the ultimate column shear of the desired failure mode to prevent those undesired failure modes.
Geometrical dimensions and other features of considered specimens are reported in Table 2. An overview of predictions of experiments provided by the proposed model is in Table 3 (and a worked example for T1 test [27] prediction for positive shear is in the Appendix A). All considered specimens present an experimental failure mode due to joint failure, with yielding of longitudinal bars both considering positive or negative shear (Table 3).
5. Simulation of Research by El-Amoury and Ghobarah
The joint is predicted to suffer a joint failure with yielding of horizontal longitudinal bars with a value of Vc5 equal to 59.07 kN both in case of positive or negative shear, close to experimental test’s value [32], which was 58.5 kN (+1% with respect to experimental value). It is worth noting that the desired failure mode of flexural bending of beams is quite close in terms of ultimate column shear (i.e., Vc1). This means that a slight improvement of the joint capacity (e.g., by means of two additional stirrups Vc5 increases up to 66 kN) would let it move from undesired brittle joint failure to a desirable ductile flexural failure of beams. In fact, Vc1 would be still 65.7 kN, higher than new value of Vc5, and hence the lowest column shear controls the failure mode.
6. Simulation of Research by Masi et al.
In this case, the failure mode is represented again by the joint failure involving horizontal longitudinal bars. The value of Vc5 is 13.59 kN, considering that the yielding of bars (and 16.7 kN considering the tensile failure of the bars), both in case of positive or negative shear −24% (−7% considering the rupture of the bars), is lower than experimental value of 18.0 kN [27]. In this case, Vc1 is equal to 17.75 kN, both in positive or negative shear for all cases; hence, an improvement of the joint design would require that Vc1 is the lowest ultimate column shear. In Table 4, some predictions are provided if two or four stirrups are added in the joint panel.
In the case of minimum bond, the failure mode never moves from minimum bond (Vc10 is the smallest ultimate column shear) to other failure modes (apart from adding five stirrups of diameter D8 with two legs, but this is not shown in Table 4). In the case of medium bond, the force that F9 has to provide is equal to 72 kN, reachable by applying two stirrups of diameter D8 with two legs. Figure 4 shows the results obtained for both cases.
7. Simulation of Research by Russo and Pauletta
Considering experimental test results in Russo and Pauletta [33], the failure modes of considered specimens (12_6 and 12_8) were represented by the joint failure with yielding of horizontal longitudinal bars with values of 6.8 kN and 8.18 kN, respectively. For the specimen 12_6, the theoretical value of Vc5 is 7.52 kN (+10% with respect to experimental value), while for the specimen 12_8, the value of Vc5 is 8.33 kN (+2% with respect to experimental value).
8. Parametric Analysis
The proposed model was used to understand the effect of geometric variations in comparison to reference condition in terms of column shear and failure modes. The failure mode and the related values of column shear (both in the case of positive or negative sign of shear) related to eleven considered cases were shown in Table 5. Analyzed reference joint had a beam of dimensions 30 cm × 50 cm (increased in a case to 30 cm × 70 cm), while the column always had the dimensions 30 cm × 30 cm. The column height was 340 cm, reinforced by using four D16 longitudinal ribbed bars; considered beam had a length of 165 cm, reinforced asymmetrically, by using five D16 and tree D16 longitudinal ribbed bars, for upper and lower sides, respectively. Both column and beam were transversally reinforced by using D8 stirrups (two legs) at a distance of 20 cm each other. Concrete cover was 26 mm. Figure 5 shows the geometry of the considered beam-column joint. In order to evaluate the behavior of proposed simplified model, a parametric analysis was performed to highlight peculiarities of the joint. Main parameters were: axial load on column, Nc; concrete strength, fc; number and spacing of stirrups in the joint; longitudinal reinforcement ratio in beams and columns; beam height, and hence joint panel dimensions. Table 5 shows main geometrical characteristics, material properties, and failure modes in the case of positive or negative shear, related to considered configurations 1 to 11. Table 6 provides an insight into the values of ultimate column shear, Vc, in the case of positive or negative shear, leading to each considered failure mode, related to considered configurations 1 to 11.
Table 5 and Table 6 show a significant effect of column axial load, mainly because the bending failure of the column is strictly related to it; once the column failure is prevented, failure of the joint involves horizontal longitudinal bars (and this failure depends on shear sign, e.g., IDs 2 to 5). Adding stirrups (i.e., IDs 6 to 8) to the joint panel improves its capacity, and impacts on joint capacity if joint fails; however, even if joint failure is prevented by enough reinforcement (i.e., IDs 7 and 8), the bending failure of the column or beam depends only on their longitudinal reinforcement and column shear sign. Obviously, bending moment failure of beam is the preferred mode. A higher beam (i.e., ID 9) increases the dimensions of the joint, and the beam capacity too, hence the global capacity increases, but it could push the failure in the column. Friction at joint cracks impacts on the capacity (i.e., IDs 10–11 vs. ID 2) and should be considered as a benefit for the joint behavior; hence, maximum capacity could be considered, but neglecting such friction provides safe side results.
9. Comparison between International Codes and Proposed Model
Joints have been analyzed experimentally and numerically in the past; however, there is still no general agreement in the research community about the assessment of joint behaviour and resistant mechanism, frequently resulting in different design details and amounts of shear reinforcement in the joints provided by international codes and guidelines to assess the column-beam joint behaviour. Particularly, in present paper, the American standard ACI 352, (2002) [34], the Japanese code AIJ, (1999) [35], the European Code, EC8, (2005) [36], and the Italian code (NTC2008 D.M. 14/01/2008—[37]) were considered and their evaluations were compared to the proposed simplified model. Geometrical parameters and material characteristics of each previously considered experimental test were used, and results corroborate the idea that such topic is still an open issue. The comparison should be in terms of columns shear, leading to failure of the beam-column joints. However, referring to Figure 6, the value of the so-called joint shear, Vij, can be calculated according to Equation (31), as it is the simple parameter commonly adopted in guidelines to evaluate joint capacity.
In the case of yielded steel bars, tension forces T are calculated by multiplying the bars’ cross section by the yield stress. Prediction models of joint shear capacity proposed by the ACI 352:2002 [34] and the AIJ:1999 [35] are based on the assumption that the failure of joint occurs in correspondence to the maximum value of joint shear. According to the American code [34], the maximum available joint shear value, Vj,av, is calculated according to the Equation (32):
where the factor γ considers the confinement effect due to the elements converging into the joint, f′c is concrete compressive strength, and Aj is the horizontal section of the joint. The evaluation of γ depends on two considerations: (i) joints can dissipate the energy by means of inelastic strains (Type 1) or by plastic strains (Type 2); and (ii) the code defines many joint categories, according to the external confinement. In this case, this kind of joint corresponds to Type 2 and category A.3 (not previously mentioned cases), so the value of γ is equal to 12. According to the Japanese code [35], the maximum available joint shear value, Vj,av, is calculated according to the Equation (33):
where the factor k considers the number of resisting elements converging into the joint in the direction of the stress, the factor ϕ considers the confinement effect due to the beam, while other symbols have the same meaning as before. In this case, k = 0.7 and ϕ = 0.85 were assumed.
According to the European code [36] and Italian code [37], to check the joint design, the Equation (34) should be satisfied:
where η is equal to
where fck is the characteristic compressive strength of concrete in (MPa) and αj = 0.48, fcd is the design compressive strength of concrete, bj is the width of the joint, equal to the MIN[MAX (Bc; Bb); MIN (Bc + Hc/2; Bb + Hc/2)], where Bc is the width of the column, Bb is the width of the beam, Hc is the height of the column, hjc is the distance between the most external layers of reinforcements into the column, and d is the axial load ratio in the column above the joint, accounting for the axial capacity of the concrete only. In addition, European Code [36] and Italian Code [37] prescribe a minimum value of transverse reinforcement according to Equation (36) in order to avoid diagonal cracking of the joint due to the attainment in diagonal of design tensile strength of concrete, fctd.
where Ash is the whole section of the stirrups, fywd is the design yielding stress of stirrups, bj is the width of the joint, and hjw is the distance between upper and lower layers of reinforcement into the beam. Furthermore, Italian Code [37] provides two expressions to perform checks in compression and tension for existing nodes, which allows the calculation of the maximum values of diagonal compression and tensile stresses inside the concrete, which must be lower than percentages of the concrete compressive strength fc. Equations (37) and (38) are used to calculate the values of maximum diagonal compressive stress σnc and the maximum diagonal tension stress σnt, respectively.
where Nc is the axial load on the upper column, Ag is the horizontal section of the joint, Vn is the joint shear defined as Vij in Equation (31), and fc is the concrete compressive strength (in MPa in (38)).
Joint Shear Failure
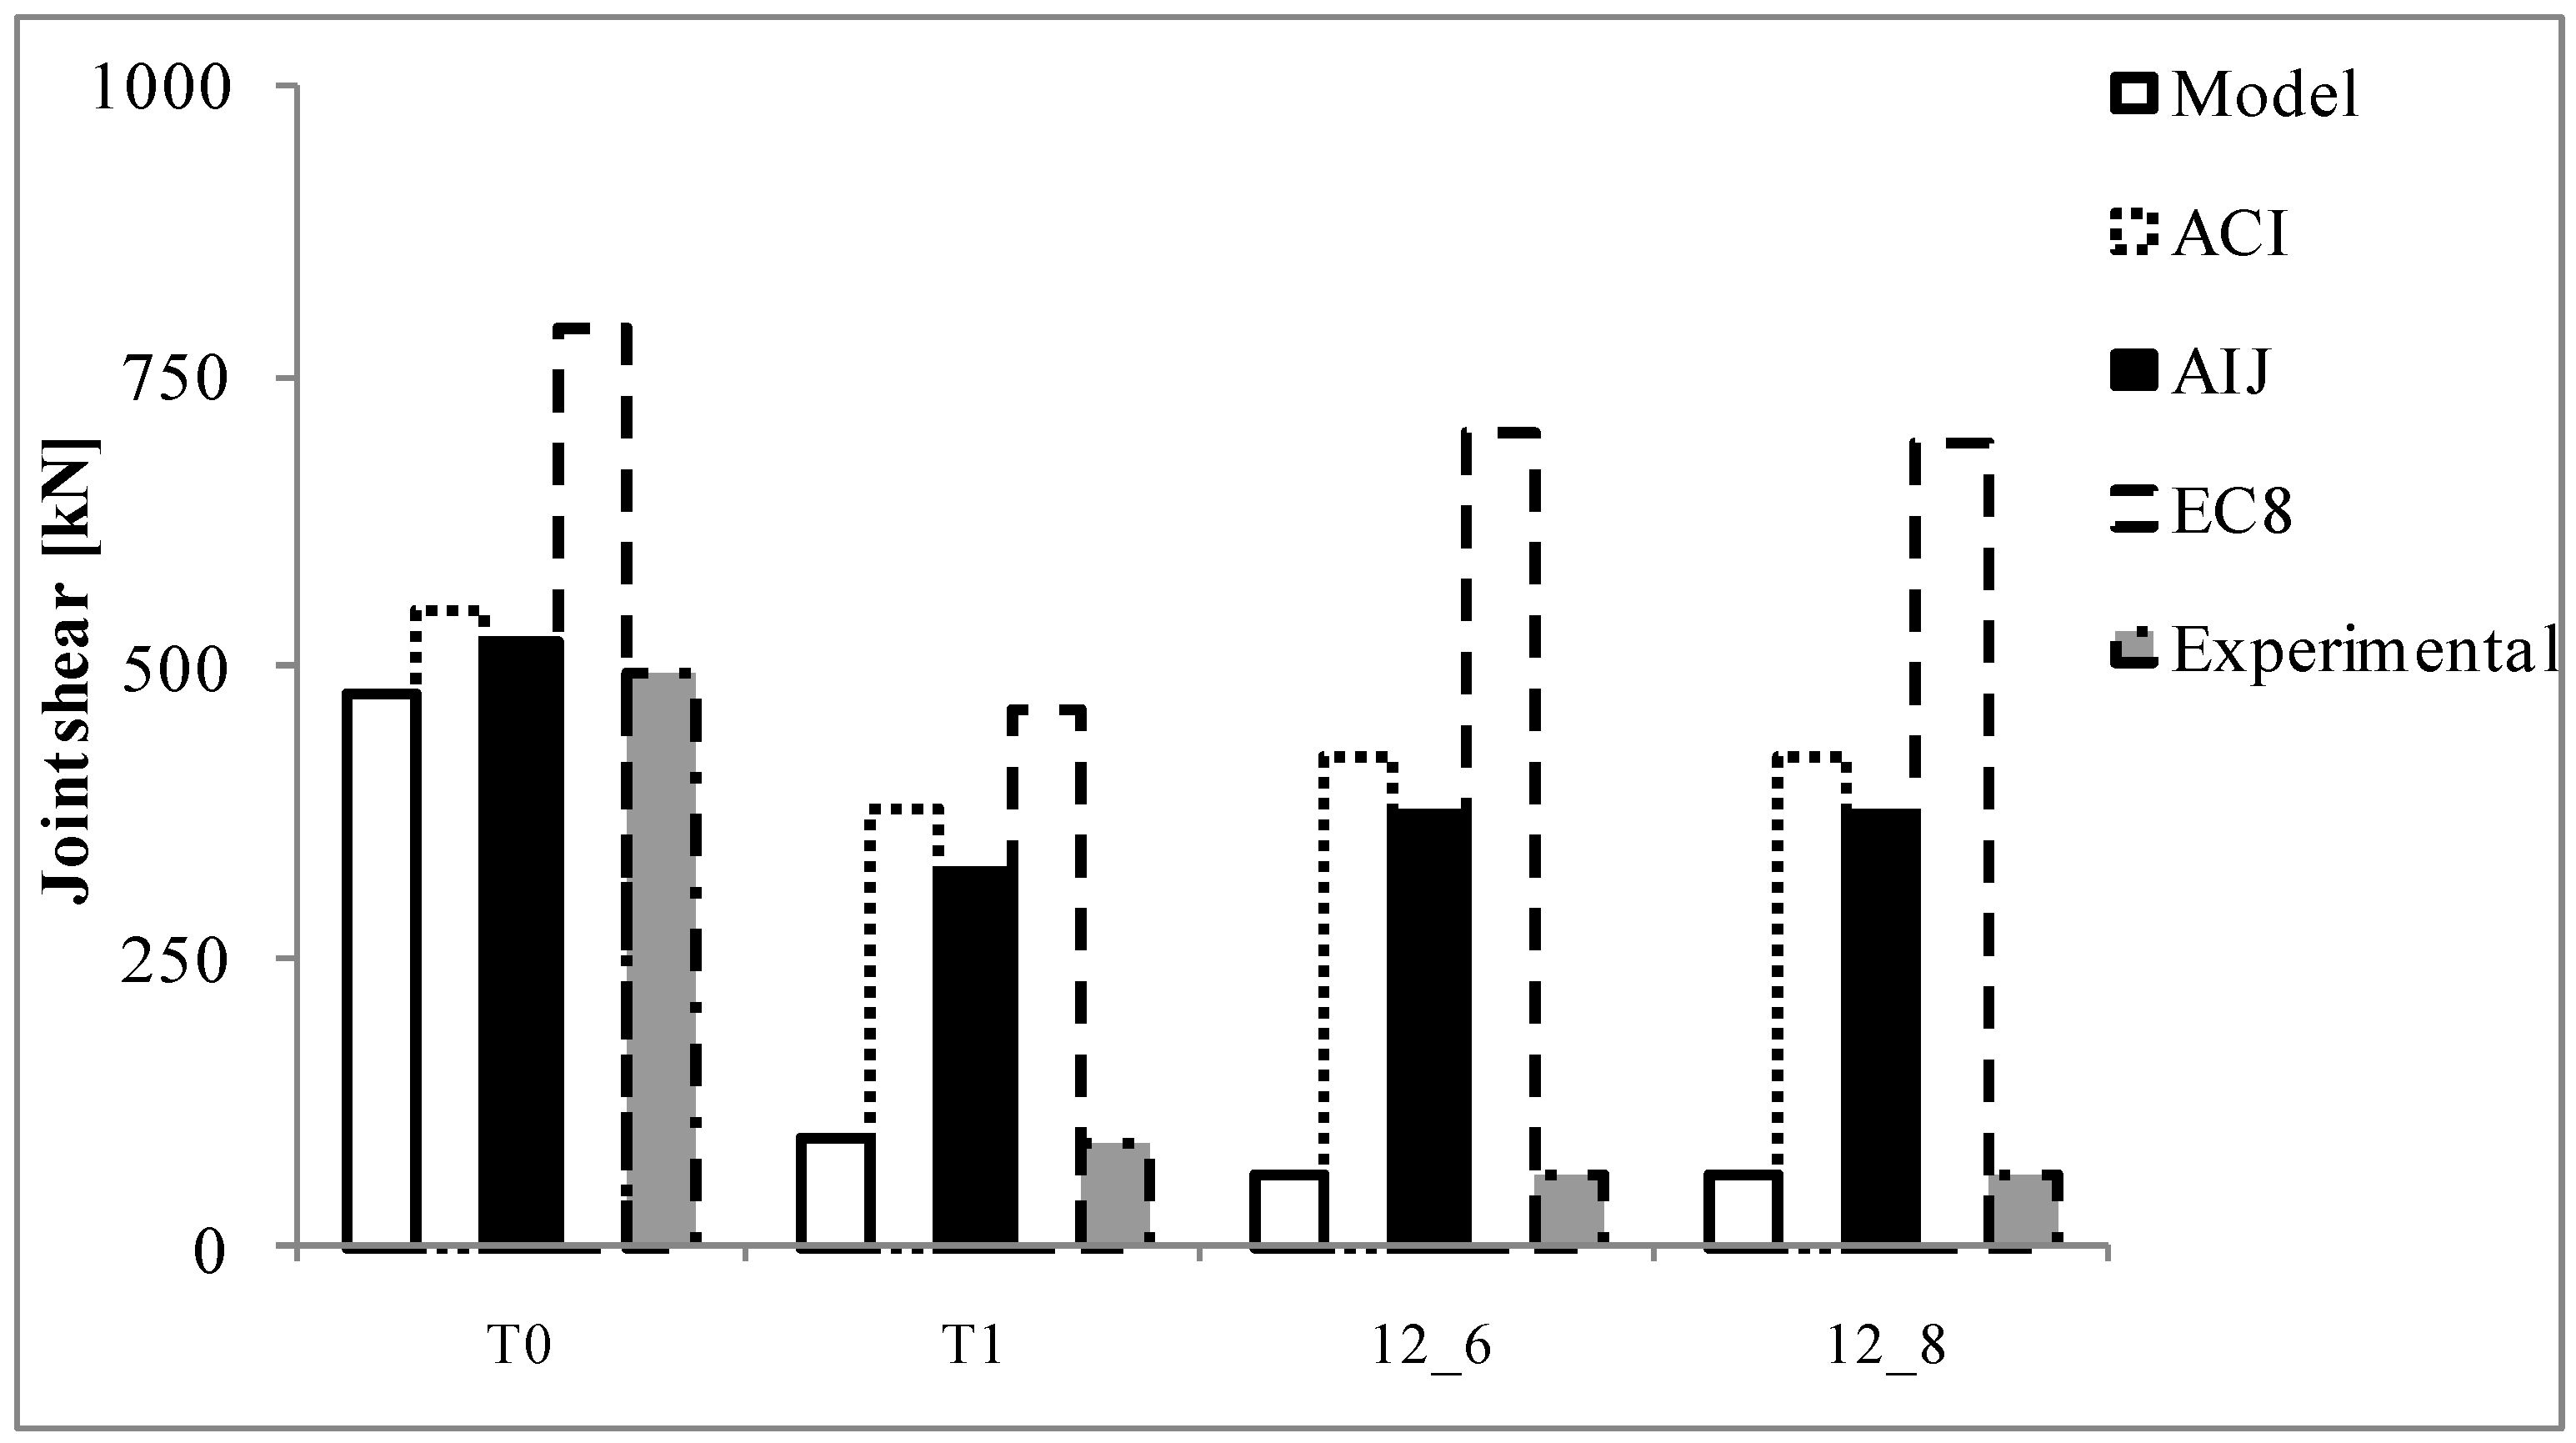
As a first step, the value of column shear, Vc, has been expressed as joint shear, and it was compared to the predictions by codes and guidelines in Table 7. As shown there, proposed model is comparable to experimental outcomes, but it would be interesting to understand the differences in terms of failure predictions with the codes.
Figure 7 shows the comparison between the joint shear for experimental tests, codes, and the proposed model. The European code [36] presents the higher values of joint shear limit for each considered case, while proposed model presents the lower ones.
All the considered codes overestimate the experimental outcomes in terms of joint shear; hence, they could seem not on safe side, but according to Equation (31) they provide, conversely, extremely reduced and over conservative ultimate column shear values related to joint failure. This apparent contradiction can be explained, since it has been shown in many research papers [4,5,11] that the so-called “joint shear” is an inappropriate index for the evaluation of vulnerability of beam-column joints due to joint shear failure, despite the fact it is usually assumed to be the main, simple parameter controlling this failure mode. In fact, the joint shear stress increases even after apparent beginning of joint shear failure, as well as after deterioration of column shear. The reason of the degradation in column shear is due also to the anchorage capacity of longitudinal reinforcement in the beams passing through the joint panel [4,5]. When the anchorage stress attains its capacity, the internal moment lever arms reduce, followed by a deterioration of flexural strength (and variation of forces T, too, hardly quantifiable by design equations in codes). All these phenomena acting together lead to a global reduction of the beam-column joint performances [11].
10. Conclusions
Present paper provides a theoretical yet simplified formulation accounting for failure mechanisms of beam-column joints. The possible different failure modes of beam-column joints are various, but some of them can be considered preferable in respect to others. As is known, a ductile-type failure is preferable to a brittle-type failure; therefore, a design can be performed considering the strength hierarchy. This principle allows for the identification of a better way to design a new joint or eventually retrofit an existing one (e.g., adopting traditional or innovative solutions like as FRP, FRCM, or even newer technologies [38,39,40,41,42,43,44]) to achieve the desired behaviour and failure mode.
The proposed formulation requires the solution of a system of nine equations: the column shear force Vc is the driving parameter, and the equations allow us to correlate each internal stress to the corresponding Vc, and each considered failure mode is associated with a threshold value of internal stresses yielding to the evaluation of Vc1 to Vc11. The minimum value of Vc_ is the capacity of the beam-column joint and provides the associated failure mode, too.
In relation to the type and the amount of reinforcement used, for instance, it is possible to switch from a brittle failure to a ductile failure. According to the strength hierarchy, this can be obtained by letting the Vc associated with a ductile failure of the flexural beam failure (e.g., the flexural beam failure associated with Vc1) be the lowest Vc compared to other brittle failures (e.g., a joint failure associated with Vc5 to Vc11). However, it also appeared clearly that significant errors at the original design phase or very low bond in the smooth bars could jeopardize the success of retrofit interventions for existing joints, requiring excessive amounts of strengthening.
The proposed theoretical model was compared to experimental tests and to international code provisions. The proposed model showed its advantages, as it accurately indicated the failure mode and capacity, dissimilarly from the codes. The reason for this is believed to be that the codes consider, implicitly, only a few potential failure modes. Often this led to poor correlations, when considering the codes, which were over-conservative, thus enforcing the need to develop effective, yet simplified, models, considering not only joint shear but the whole joint assembly behaviour, as in the case of the proposed model.
Author Contributions
A. Prota and G. Manfredi conceived and designed the research; G.P. Lignola performed the analyses; A. Bossio and F. Fabbrocino analyzed the data; A. Bossio, F. Fabbrocino, G.P. Lignola wrote the paper.
Conflicts of Interest
The authors declare no conflict of interest.
Nomenclature
| a | Length of column/length of beam ratio |
| Ag | Area of horizontal section of the joint |
| Aj | Area of horizontal section of the joint |
| Ak | Area of reinforcements |
| As | Area of lower layer of reinforcements |
| A′s | Area of upper layer of reinforcements |
| A′s,b | Area of upper layer of reinforcements (beam) |
| Ash | Whole area of the stirrups |
| B | Width of the joint |
| Bb | Width of the beam |
| Bc | Width of the column |
| bj | Width of the joint |
| C | Compressive resultant force of half concrete strut |
| C1, …, C8 | Compressed concrete contribution evaluated from corresponding compressive resultant forces F1, …, F8 |
| c | Depth of neutral axis |
| CMAX | Strength of half concrete strut |
| F_ | Generic resultant force (e.g., F1 or F2 or F3…) |
| F1, F2, F7, F8 | Resultant force carried in tension for positive column shear or in compression for negative column shear |
| F3, F4, F5, F6 | Resultant force carried in compression for positive column shear or in tension for negative column shear |
| F9 | Resultant force exerted by stirrups or horizontally-placed externally bonded reinforcements |
| F10 | Resultant force exerted by vertically-placed externally bonded reinforcements |
| fc | Concrete compressive strength |
| fcd | Design compressive strength of concrete |
| fck | Characteristic compressive strength of concrete |
| fctd | Design tensile strength of concrete |
| FMAX | Limit value for resultant force |
| fy | Steel yielding strength |
| fy,kc | Characteristic yielding (or eventually ultimate) stress of steel |
| fywd | Design yielding stress of stirrups |
| hb* | Distance between reinforcement layers (in beam) |
| Hb | Height of cross section of beam |
| hc* | Distance between reinforcement layers (in column) |
| Hc | Height of cross section of column |
| hjc | Distance between the most external layers of reinforcements into the column |
| hjw | Distance between upper and lower layers of reinforcement into the beam |
| k | Factor in Japanese code [36] considering the number of resisting elements converging into the joint in the direction of the stress |
| Lb | Length of beam |
| Lc | Lenght of column |
| Mb | Ultimate bending moment of beam |
| Mc | Ultimate bending moment of column |
| Nb | Beam axial load |
| Nc | Column axial load |
| S_ | Generic compressed steel contribution (e.g., S1 or S4 or …) |
| S1, S4, S6, S7 | Compressed steel contribution evaluated from compressive resultant forces F1, F4, F6 and F7 |
| T | Tension forces |
| Vb | Beam shear |
| Vc | Column shear |
| Vc1 | Column shear value associated to Bending failure for beam |
| Vc2 | Column shear value associated to Bending failure for column |
| Vc3 | Column shear value associated to Shear failure for beam |
| Vc4 | Column shear value associated to Shear failure for column |
| Vc5 | Column shear value associated to Joint failure involving horizontal bars |
| Vc6 | Column shear value associated to Joint failure involving vertical bars (upper column) |
| Vc7 | Column shear value associated to Joint failure involving vertical bars (lower column) |
| Vc8 | Column shear value associated to Joint failure due to maximum bond exceedance |
| Vc9 | Column shear value associated to Joint failure due to medium bond exceedance |
| Vc10 | Column shear value associated to Joint failure due to minimum bond exceedance |
| Vc11 | Column shear value associated to Joint failure due to crushing of concrete strut |
| Vij | Joint shear |
| Vj,av | Maximum available joint shear value |
| Vj,bd | Design joint shear of beam |
| αj | Paramater defined in European Code [36] and Italian Code [37] |
| γ | Parameter in ACI 352:2002 [35] that considers the confinement effect due to the elements converging into the joint |
| η | Paramater defined in European Code [36] and Italian Code [37] |
| θ | Inclination of concrete strut |
| ϑ | Inclination of diagonal crack in joint panel |
| νd | Axial load ratio in the column above the joint |
| σnc | Maximum diagonal compressive stress |
| σnt | Maximum diagonal tension stress |
| τ_ | Bond strength |
| Maximum bond strength | |
| D | Average bond strength |
| Minimum bond strength | |
| ϕ | Factor in Japanese code [35] considering the confinement effect due to the beam |
Appendix A
When analyzing the experimental test T1 by Masi et al. (2009) [27] (positive column shear), a numerical worked example is proposed in this section. The system of Equations (4)–(12) is solved by using as input the material characteristics and geometrical parameters reported in Table 2.
Equations (A1)–(A9), solution of the system, allows us to calculate the evolution of forces in the joint as function of column shear, Vc; hence, it is possible to evaluate directly the values of each Vcs. In particular, looking at the joint failure, column shear corresponding to the yielding failure of bars in tension into the beam or columns can be evaluated by equating F1 (Equation (A1)) to minimum yielding force of beam reinforcement (Equation (A10)); and F2 (Equation (A2)) or F8 (Equation (A8)) to minimum yielding force of (upper or lower) column reinforcement (Equation (A11)), respectively. Equations (A12) and (A13) allow us to evaluate the limits to assess the column shear corresponding to the ultimate failure of bars in tension into the beam or column.
Such yielding/ultimate forces of bars are calculated in advance. The minimum force in tensile reinforcement is simply evaluated by accounting for 4D12 (Asb = 226 mm2) in the beam and 4D14 (Asc = 308 mm2) in the column, so that yielding/ultimate forces are:
Hence, the column shear corresponding to the failure due to the yielding of bars in beam, Vc5, is equal to 13.59 kN (16.71 kN in case of ultimate failure of bars). The column shear corresponding to the failure due to the yielding of bars in upper column, Vc6, is equal to 86.40 kN (94.12 kN in case of ultimate failure of bars), while corresponding column shear values involving bars in tension in the lower column, Vc7, is equal to 100.45 kN and 107.99 kN, respectively.
To evaluate the column shear leading to the joint failure due to reinforcement debonding, the bond capacity should be calculated. The bond capacity can be calculated as Fbond:
where n is the number of longitudinal bars, is bar diameter, Leb is the effective bond length, and τ is the uniform bond stress capacity. Three conditions of bond have been considered: the case of maximum, medium, and minimum bond capacities, namely τmax = 10.56 MPa, τmed = 5.28 MPa, and τmin = 1.27 MPa, calculated according model Code 1990 (see Section 3.2). Hence Fbond,max, Fbond,med, and Fbond,min are evaluated substituting the values of τmax, τmed, and τmin into the Equation (A14):
To evaluate bond demand F1 + S4 as a function of column shear Vc, the bar force in compression, S4, is extracted from the global compression force F4, as previously described. The whole section is assumed in the elastic range, hence it is possible to assess the neutral axis, c, by considering the static moment of the cracked section equal to zero. Compression force S4 is evaluated according to Equation (23) as:
where neutral axis, c, is equal to 66.5 mm. In this way, when equating the bond demand to the bond capacity, previously evaluated in the three bond conditions, it is possible to assess the column shears Vc8, Vc9, and Vc10, respectively, as reported in Table 4 for the relevant simulation case.
Similarly, Vc11, corresponding to joint failure due to crushing of concrete strut, is evaluated by equating C to Cmax = 1562 kN in this case (see Equation (27)).
It is now possible to evaluate the failure modes due to bending and shear failures of beam and columns. According to technical theory of flexure and shear capacity at ultimate state of RC beams and columns (e.g., Cosenza et al. [31]), the relevant values can be expressed as functions of the column shear (see Equations (28)–(30)). In the present case, relevant capacities are: beam flexural, Mb = 49.80 kNm, column flexural, Mc = 70.95 kNm, beam shear, Vb = 203.16 kN and column shear, and Vc = 145.89 kN, which is directly equal to Vc4. These values yield to column shears Vc1 to Vc4, respectively (see Table 3, where Lb = 4.63 m and Lc = 3.00 m).
To identify the actual failure mode, the lowest column shear identifies the failure, and in this case (in good bond conditions) it is Vc5, hence a joint failure mode with ultimate strength of bars in tension in the beam (Vc = 16.7 kN, as reported in Table 3, slightly underestimating the experimental capacity, that is 18 kN, with the same reported joint failure mode).
As a concluding remark, to design a retrofit intervention or to improve the original design, failure mode should be moved to beam flexural failure; hence, the joint should be improved to prevent a joint failure for a Vc smaller than Vc1 = 17.75 kN (see Table 4). In any cases, if we have a clear summary of the column shears activating different failure modes for a beam column joint, then it is possible to design a proper and effective retrofit intervention, too, according to capacity design approach.
By considering 4 stirrups (2 legs D8 and total steel area 498 mm2) in the joint, a force F9 = 192.22 kN needs to be considered to solve the system of Equations (4)–(12); hence, the solution is:
The values of yielding/ultimate forces of bars do not change, and so the values of Fbondmax, Fbondmed, Fbondmin, and c, instead of the value of compression force S4, equal to:
In this way, it is possible to update the values of the eleven Vcs according to the addition of stirrups in the joint (i.e., increment of F9 as reported for instance in Figure 4 for Vc9 and Vc10). It is worth nothing that not all the solutions (A1)–(A9) change in (A17)–(A26), as not all the Vcs are sensitive to F9 (see Table 4). F9 (i.e., the amount of joint reinforcement) is enough when Vc1 is the smallest Vc, as discussed in Section 6.
References
- Tran, M.T. Influence Factors for the Shear Strength of Exterior and Interior Reinforced Concrete Beam-Column Joints. Procedia Eng. 2016, 142, 63–70. [Google Scholar] [CrossRef]
- Demir, A.; Caglar, N.; Ozturk, H.; Sumer, Y. Nonlinear finite element study on the improvement of shear capacity in reinforced concrete T-Section beams by an alternative diagonal shear reinforcement. Eng. Struct. 2016, 120, 158–165. [Google Scholar] [CrossRef]
- Borghini, A.; Gusella, F.; Vignoli, A. Seismic vulnerability of existing R.C. buildings: A simplified numerical model to analyse the influence of the beam-column joints collapse. Eng. Struct. 2016, 121, 19–29. [Google Scholar] [CrossRef]
- Manfredi, G.; Verderame, G.M.; Lignola, G.P. A F.E.M. model for the evaluation of the seismic behavior of internal joints in reinforced concrete frames. In Proceedings of the 14th World Conference on Earthquake Engineering, Beijing, China, 12–17 October 2008. [Google Scholar]
- Lignola, G.P.; Verderame, G.M.; Manfredi, G. Effect of bond on seismic performance of internal joints in reinforced concrete frames. In Proceedings of the 14th European Conference on Earthquake Engineering, Orhid, Republic of Macedonia, 30 August–3 September 2010. [Google Scholar]
- Kalogeropoulos, G.I.; Tsonos, A.D.G.; Konstandinidis, D.; Tsetines, S. Pre-earthquake and post-earthquake retrofitting of poorly detailed exterior RC beam-to-column joints. Eng. Struct. 2016, 109, 1–15. [Google Scholar] [CrossRef]
- Favvata, M.; Karayannis, C.; Liolios, A. Influence of exterior joint effect on the inter-story pounding interaction of structures. Struct. Eng. Mech. 2009, 33, 113–136. [Google Scholar] [CrossRef]
- Del Vecchio, C.; Di Ludovico, M.; Prota, A.; Manfredi, G. Modelling beam-column joints and FRP strengthening in the seismic performance assessment of RC existing frames. Compos. Struct. 2016, 142, 107–116. [Google Scholar] [CrossRef]
- Bozza, A.; Asprone, D.; Fabbrocino, F. Urban resilience: A civil engineering perspective. Sustainability 2017, 9, 103. [Google Scholar] [CrossRef]
- Imperatore, S.; Lavorato, D.; Nuti, C.; Santini, S.; Sguerri, L. Numerical modelling of existing RC beams strengthened in shear with FRP U-Sheets. In Proceedings of the 6th International Conference on FRP Composites in Civil Engineering—CICE2012, Rome, Italy, 13–15 June 2012. [Google Scholar]
- Formisano, A.; Iazzetta, G.; Marino, G.; Fabbrocino, F.; Landolfo, R. Seismic residual capacity assessment of framed structures damaged by exceptional actions. In Proceedings of the 7th European Congress on Computational Methods in Applied Sciences and Engineering, Crete, Greece, 5–10 June 2016. [Google Scholar]
- Formisano, A.; Chieffo, N.; Fabbrocino, F.; Landolfo, R. Seismic vulnerability and damage of Italian historical centres: A case study in the Campania region. In Proceedings of the 14th International Conference of Numerical Analysis and Applied Mathematics, Rhodes, Greece, 19–25 September 2016. [Google Scholar] [CrossRef]
- Bossio, A.; Lignola, G.P.; Fabbrocino, F.; Monetta, T.; Prota, A.; Bellucci, F.; Manfredi, G. Nondestructive assessment of corrosion of reinforcing bars through surface concrete cracks. Struct. Concr. 2017, 18, 104–117. [Google Scholar] [CrossRef]
- Manfredi, G.; Prota, A.; Lignola, G.P. Multiscale seismic assessment of aged and deteriorated RC structures in marine environment. In Proceedings of the 10th U.S. National Conference on Earthquake Engineering: Frontiers of Earthquake Engineering (NCEE 2014), Anchorage, AK, USA, 21–25 July 2014. [Google Scholar] [CrossRef]
- Bossio, A.; Monetta, T.; Bellucci, F.; Lignola, G.P.; Prota, A. Modeling of concrete cracking due to corrosion process of reinforcement bars. Cem. Concr. Res. 2015, 71, 78–92. [Google Scholar] [CrossRef]
- Bossio, A.; Lignola, G.P.; Fabbrocino, F.; Prota, A.; Manfredi, G. Evaluation of seismic behavior of corroded reinforced concrete structures. In Proceedings of the 15th International Forum World Heritage and Disaster, Capri, Italy, 15–17 June 2017; pp. 1265–1272. [Google Scholar]
- Bossio, A.; Fabbrocino, F.; Lignola, G.P.; Monetta, T.; Bellucci, F.; Manfredi, G.; Prota, A. Effects of Corrosion on Reinforced Concrete Structures. In Proceedings of the 14th International Forum World Heritage and Degradation, Capri, Italy, 16–18 June 2016; pp. 941–949, ISBN 9788865422571. [Google Scholar]
- Marthong, C.; Dutta, A.; Deb, S.K. Effect of Cyclic Loading Frequency on the Behavior of External RC Beam-Column Connections. J. Earthq. Eng. 2016, 20, 1126–1147. [Google Scholar] [CrossRef]
- Giamundo, V.; Lignola, G.P.; Fabbrocino, F.; Prota, A.; Manfredi, G. Influence of FRP wrapping on reinforcement performances at lap splice regions in RC columns. Compos. Part B Eng. 2017, 116, 313–324. [Google Scholar] [CrossRef]
- Shin, M.; LaFave, J.M. Modeling of cyclic joint shear deformation contributions in RC beam-column connections to overall frame behavior. Struct. Eng. Mech. 2004, 18, 645–669. [Google Scholar] [CrossRef]
- Alath, S.; Kunnath, S.K. Modeling Inelastic Shear Deformation in RC Beam-Column Joints. Master’s Thesis, University of Colorado Boulder, Boulder, CO, USA, 1995. [Google Scholar]
- Altoontash, A. Simulation and Damage Models for Performance Assessment of Reinforced Concrete Beam-Column Joints. Ph.D. Thesis, Stanford University, Stanford, CA, USA, 2004. [Google Scholar]
- Ghobarah, A.; Youssef, M. Modeling of RC beam-column joints and structural walls. J. Earthq. Eng. 2001, 5, 91–111. [Google Scholar] [CrossRef]
- Lowes, L.N.; Altoontash, A. Modeling reinforced concrete beam-column joints subjected to cyclic loading. J. Struct. Eng. 2003, 129, 1686–1697. [Google Scholar] [CrossRef]
- Mitra, N.; Lowes, L.N. Evaluation, calibration, and verification of a reinforced concrete beam-column joint model. J. Struct. Eng. 2007, 133, 105–120. [Google Scholar] [CrossRef]
- Eligehausen, R.; Genesio, G.; Ozbolt, J.; Pampanin, S. 3D analysis of seismic response of RC beam-column exterior joints before and after retrofit. In Concrete Repair, Rehabilitation and Retrofitting II; CRC Press: Boca Raton, FL, USA, 2008; pp. 407–408. [Google Scholar] [CrossRef]
- Masi, A.; Santarsiero, G.; Lignola, G.P.; Verderame, G.M. Study of the seismic behavior of external RC beam–column joints through experimental tests and numerical simulations. Eng. Struct. 2013, 52, 207–219. [Google Scholar] [CrossRef]
- Shiohara, H. New Model for Shear Failure of RC Interior Beam-Column Connections. J. Struct. Eng. 2001, 127, 152–160. [Google Scholar] [CrossRef]
- Bossio, A.; Fabbrocino, F.; Lignola, G.P.; Prota, A.; Manfredi, G. Simplified model for strengthening design of beam-column internal joints in reinforced concrete frames. Polymers 2015, 7, 1732–1754. [Google Scholar] [CrossRef]
- CEB-FIP Model Code 2010. Fib Model Code for Concrete Structures 2010; Ernst & Sohn, Wiley: Berlin, Germany, 2013. [Google Scholar]
- Cosenza, E.; Manfredi, G.; Pecce, M. Strutture in Cemento Armato: Basi Della Progettazione; Hoepli: Milan, Italy, 2008. (In Italian) [Google Scholar]
- El-Amoury, T.; Ghobarah, A. Seismic rehabilitation of beam-column joint using GFRP sheets. Eng. Struct. 2002, 24, 1397–1407. [Google Scholar] [CrossRef]
- Russo, G.; Pauletta, M. Seismic behavior of exterior beam-column connections with plain bars and effects of upgrade. ACI Struct. J. 2012, 109, 225–233. [Google Scholar]
- A.C.I. Commitee. Recommendations for Design of Beam-Column Joints in Monolithic Reinforced Concrete Frame Structures; American Concrete Institute: Detroit, MI, USA, 2002. [Google Scholar]
- Architectural Institute of Japan (AIJ). AIJ Structural Design Guidelines for Reinforced Concrete Buildings; Architectural Institute of Japan: Tokyo, Japan, 1999. [Google Scholar]
- European Committee for Standardization. EC8 Eurocode 8 (EN 1998-1, EN 1998-5), Seismic Design of Buildings; European Committee for Standardization: Brussels, Belgium, 2004. [Google Scholar]
- Ministero delle Infrastrutture. Decreto Ministeriale del 14/01/2008—Norme Tecniche per le Costruzioni; Ministero delle Infrastrutture: Roma, Italy, 2008.
- Babilio, E.; Fabbrocino, F.; Durand, M.; Fraternali, F. On the mechanics of tetrakis-like lattices in the stretch-dominated regime. Extreme Mech. Lett. 2017, 15, 57–62. [Google Scholar] [CrossRef]
- Singh, R.; Singh, R.; Dureja, J.S.; Farina, I.; Fabbrocino, F. Investigations for dimensional accuracy of Al alloy/Al-MMC developed by combining stir casting and ABS replica based investment casting. Compos. Part B Eng. 2017, 115, 203–208. [Google Scholar] [CrossRef]
- Boparai, K.S.; Singh, R.; Fabbrocino, F.; Fraternali, F. Thermal characterization of recycled polymer for additive manufacturing applications. Compos. Part B Eng. 2016, 106, 42–47. [Google Scholar] [CrossRef]
- Singh, R.; Singh, N.; Fabbrocino, F.; Fraternali, F.; Ahuja, I.P.S. Waste management by recycling of polymers with reinforcement of metal powder. Compos. Part B Eng. 2016, 105, 23–29. [Google Scholar] [CrossRef]
- Farina, I.; Fabbrocino, F.; Colangelo, F.; Feo, L.; Fraternali, F. Surface roughness effects on the reinforcement of cement mortars through 3D printed metallic fibers. Compos. Part B Eng. 2016, 99, 305–311. [Google Scholar] [CrossRef]
- Farina, I.; Fabbrocino, F.; Carpentieri, G.; Modano, M.; Amendola, A.; Goodall, R.; Feo, L.; Fraternali, F. On the reinforcement of cement mortars through 3D printed polymeric and metallic fibers. Compos. Part B Eng. 2016, 90, 76–85. [Google Scholar] [CrossRef]
- Fabbrocino, F.; Farina, I.; Amendola, A.; Feo, L.; Fraternali, F. Optimal design and additive manufacturing of novel reinforcing elements for composite materials. In Proceedings of the 7th European Congress on Computational Methods in Applied Sciences and Engineering, Crete, Greece, 5–10 June 2016. [Google Scholar]
Figure 1.
T-shaped joint: (a) geometry and external forces and (b) internal forces, in case of positive column shear.
Figure 1.
T-shaped joint: (a) geometry and external forces and (b) internal forces, in case of positive column shear.

Figure 2.
T-shaped joint: (a) geometry and external forces and (b) internal forces, in case of negative column shear.
Figure 2.
T-shaped joint: (a) geometry and external forces and (b) internal forces, in case of negative column shear.
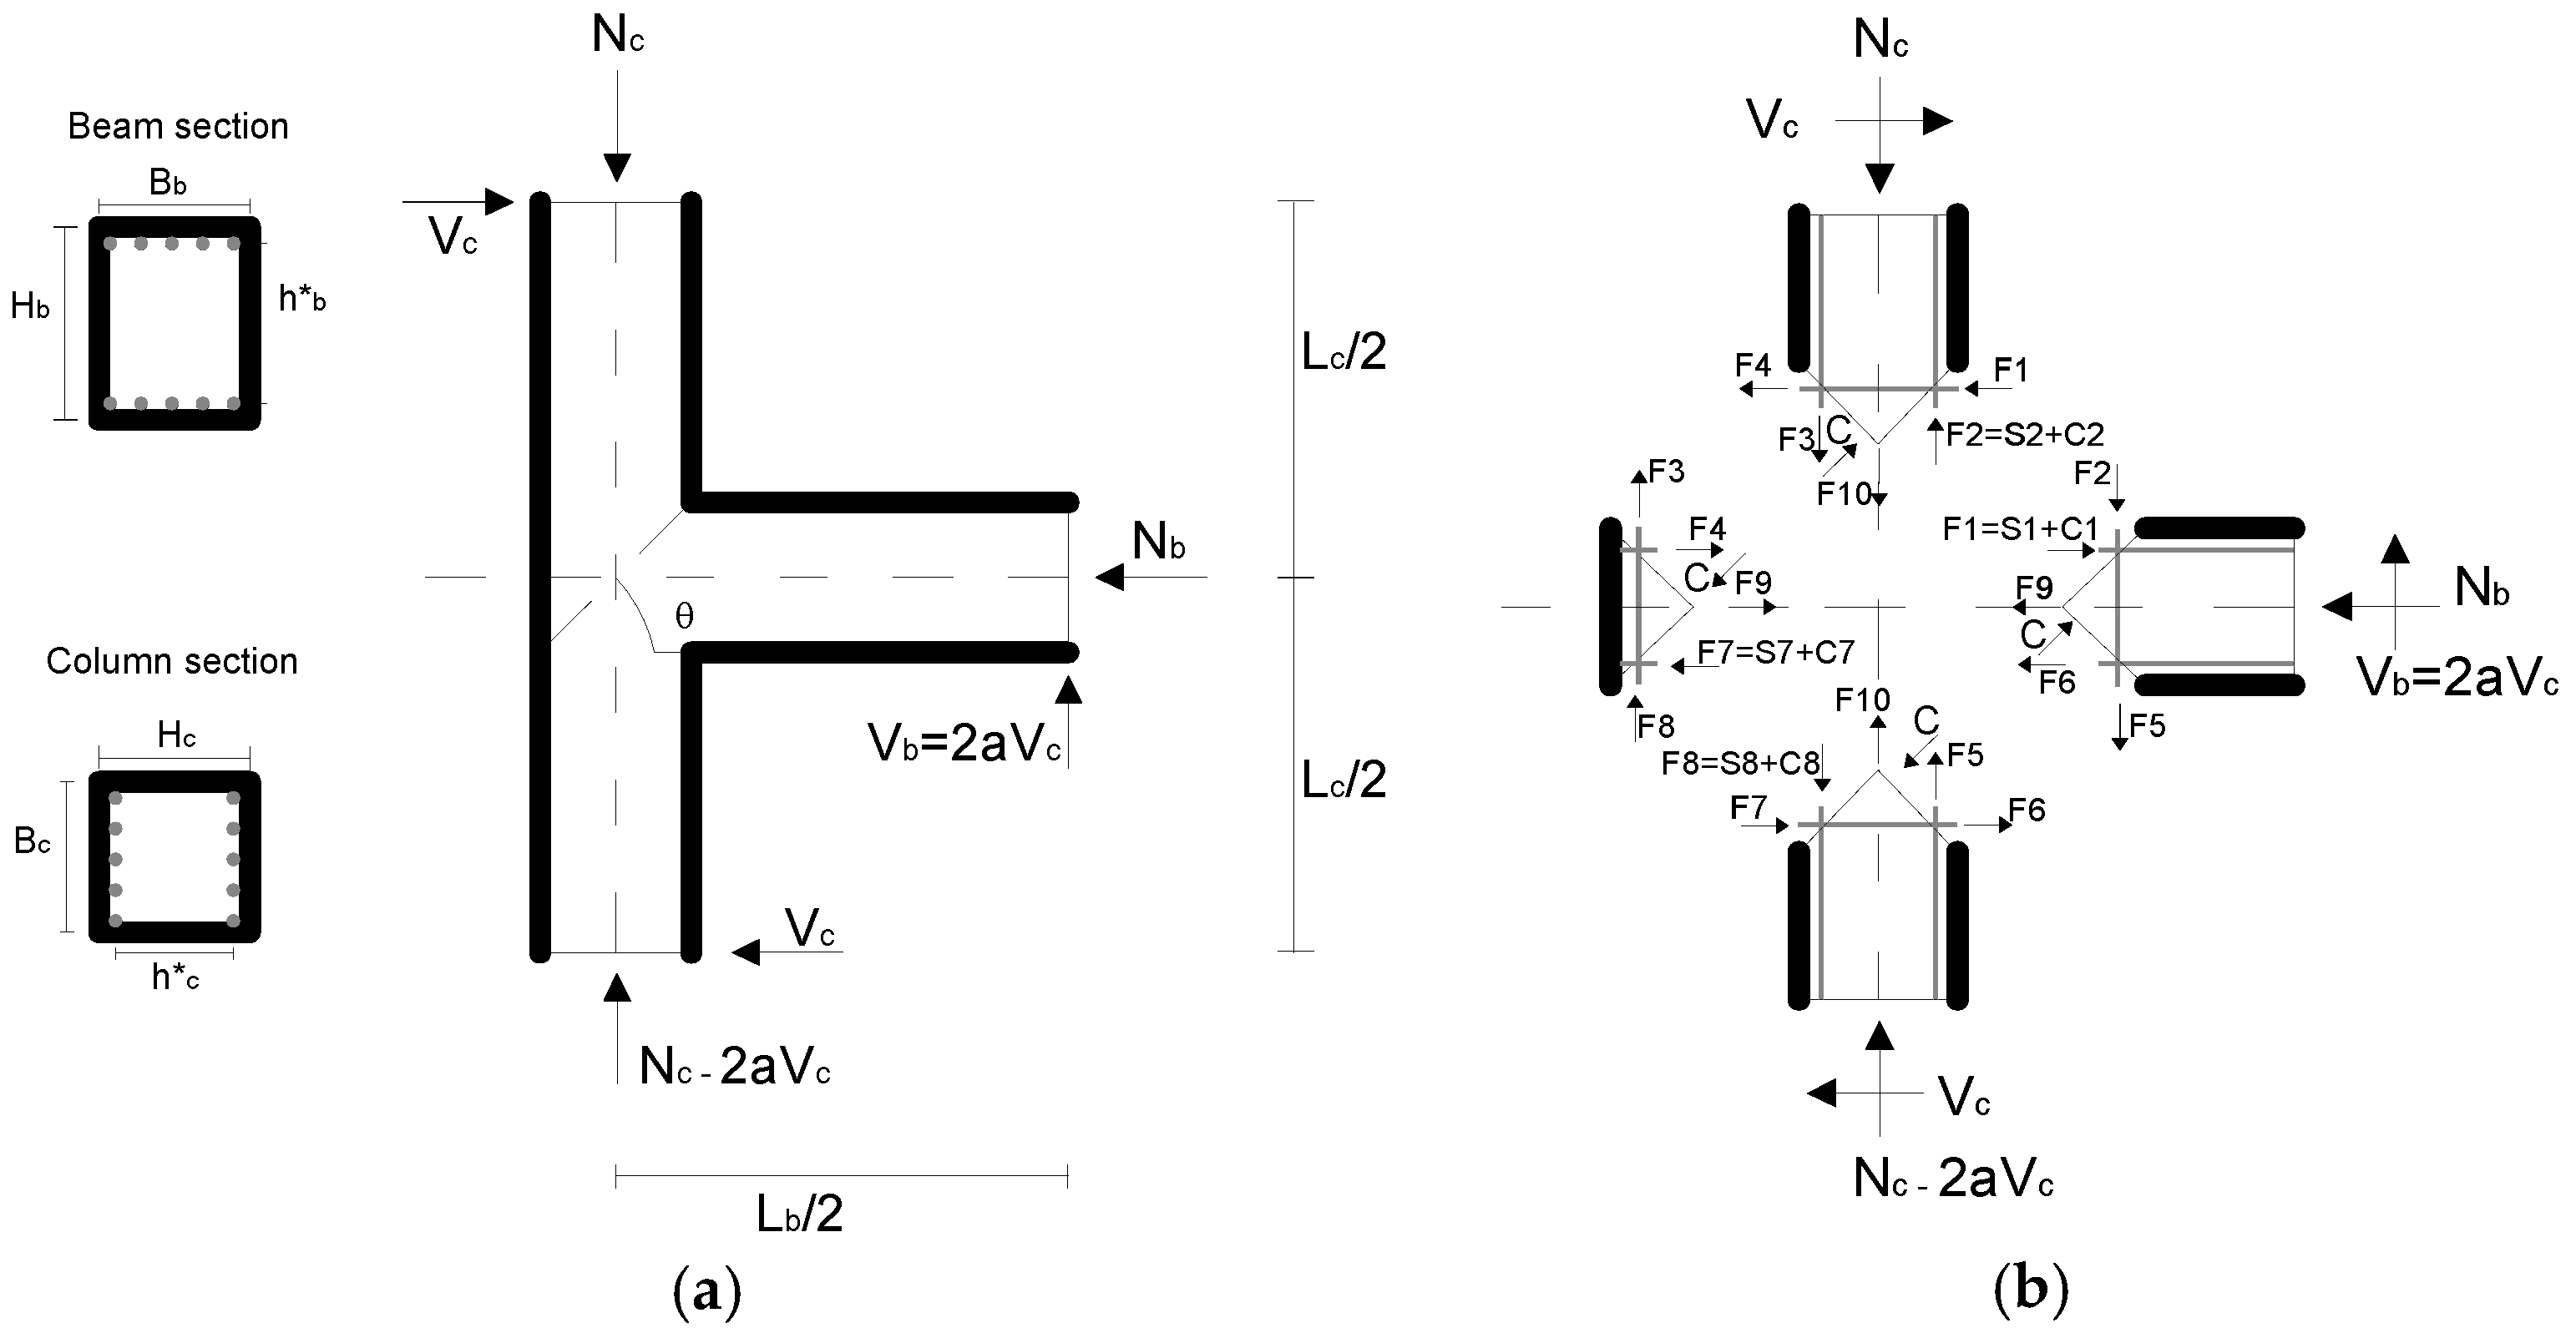
Figure 3.
Positive column shear case: evaluation of contribution of (a) upper layer of reinforcement, (b) lower layer of reinforcement.
Figure 3.
Positive column shear case: evaluation of contribution of (a) upper layer of reinforcement, (b) lower layer of reinforcement.
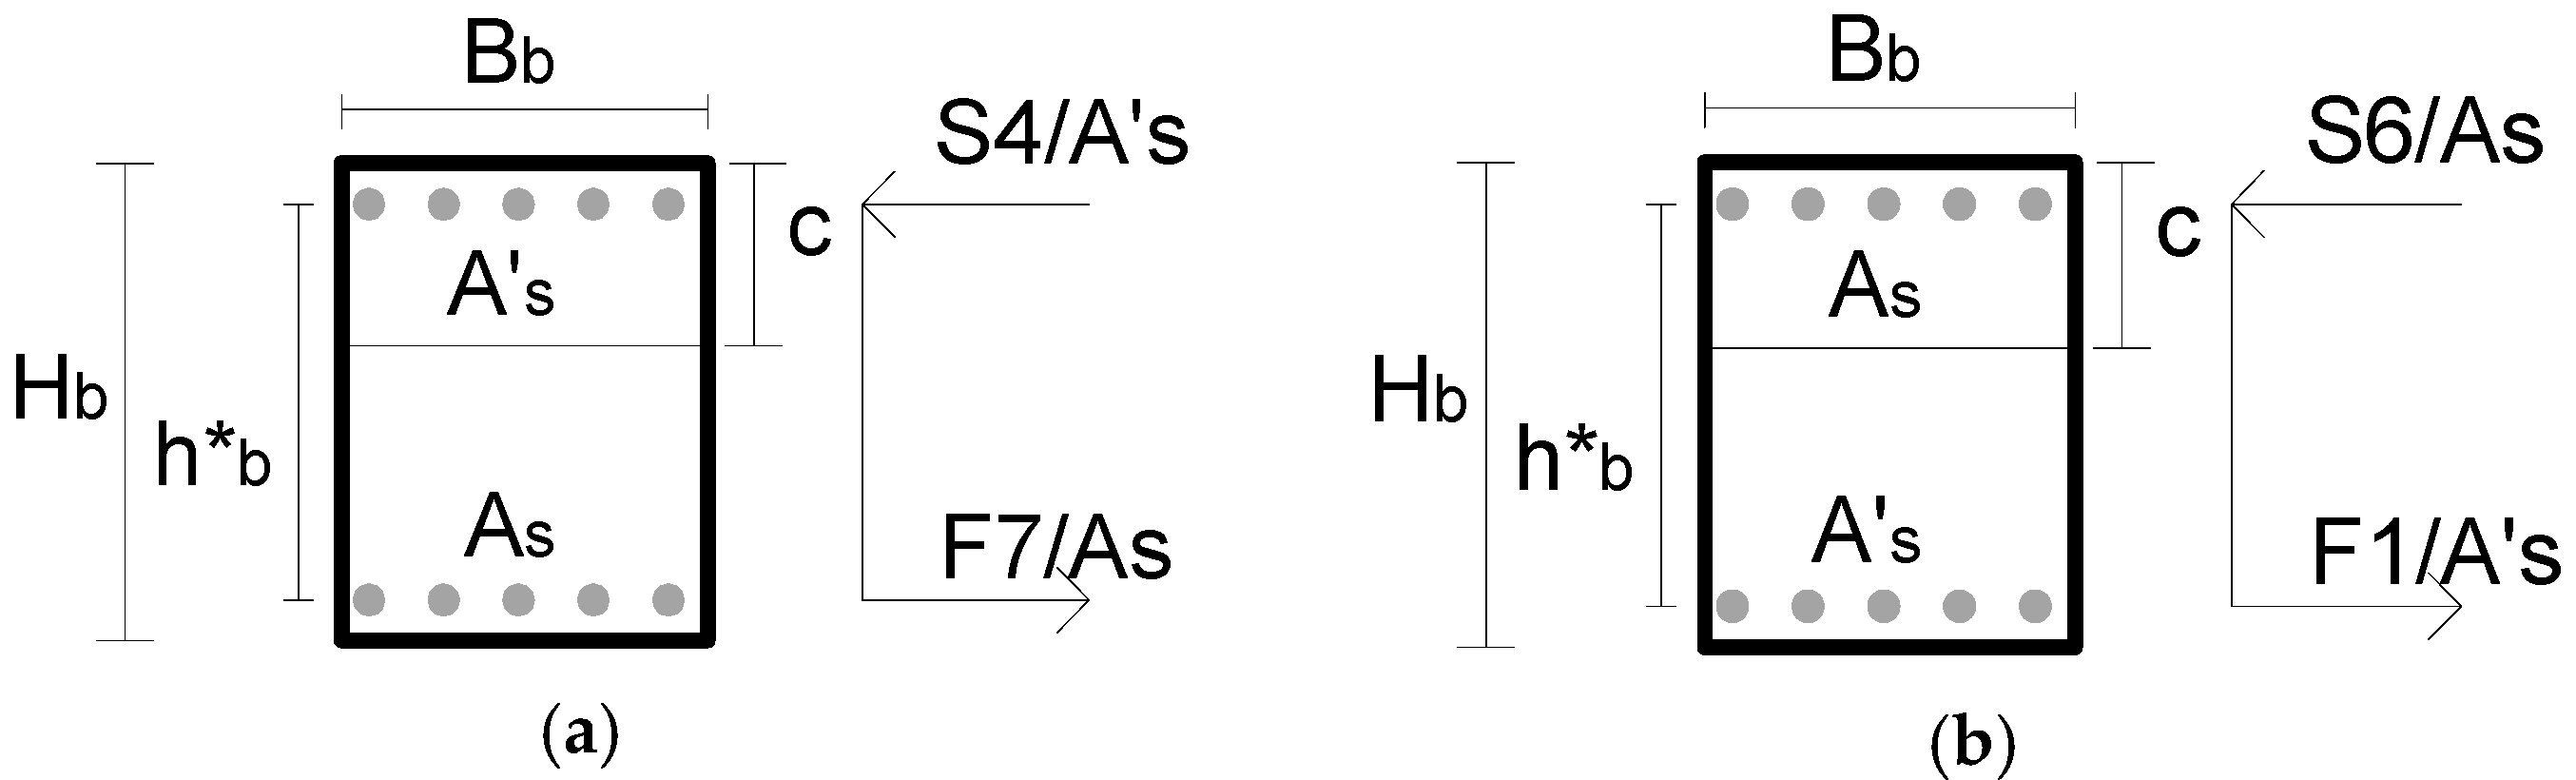
Figure 4.
Envelope of minimum column shear Vc when varying horizontal force F9 (e.g., provided by stirrups) for experimental test by Masi et al. [27].
Figure 4.
Envelope of minimum column shear Vc when varying horizontal force F9 (e.g., provided by stirrups) for experimental test by Masi et al. [27].
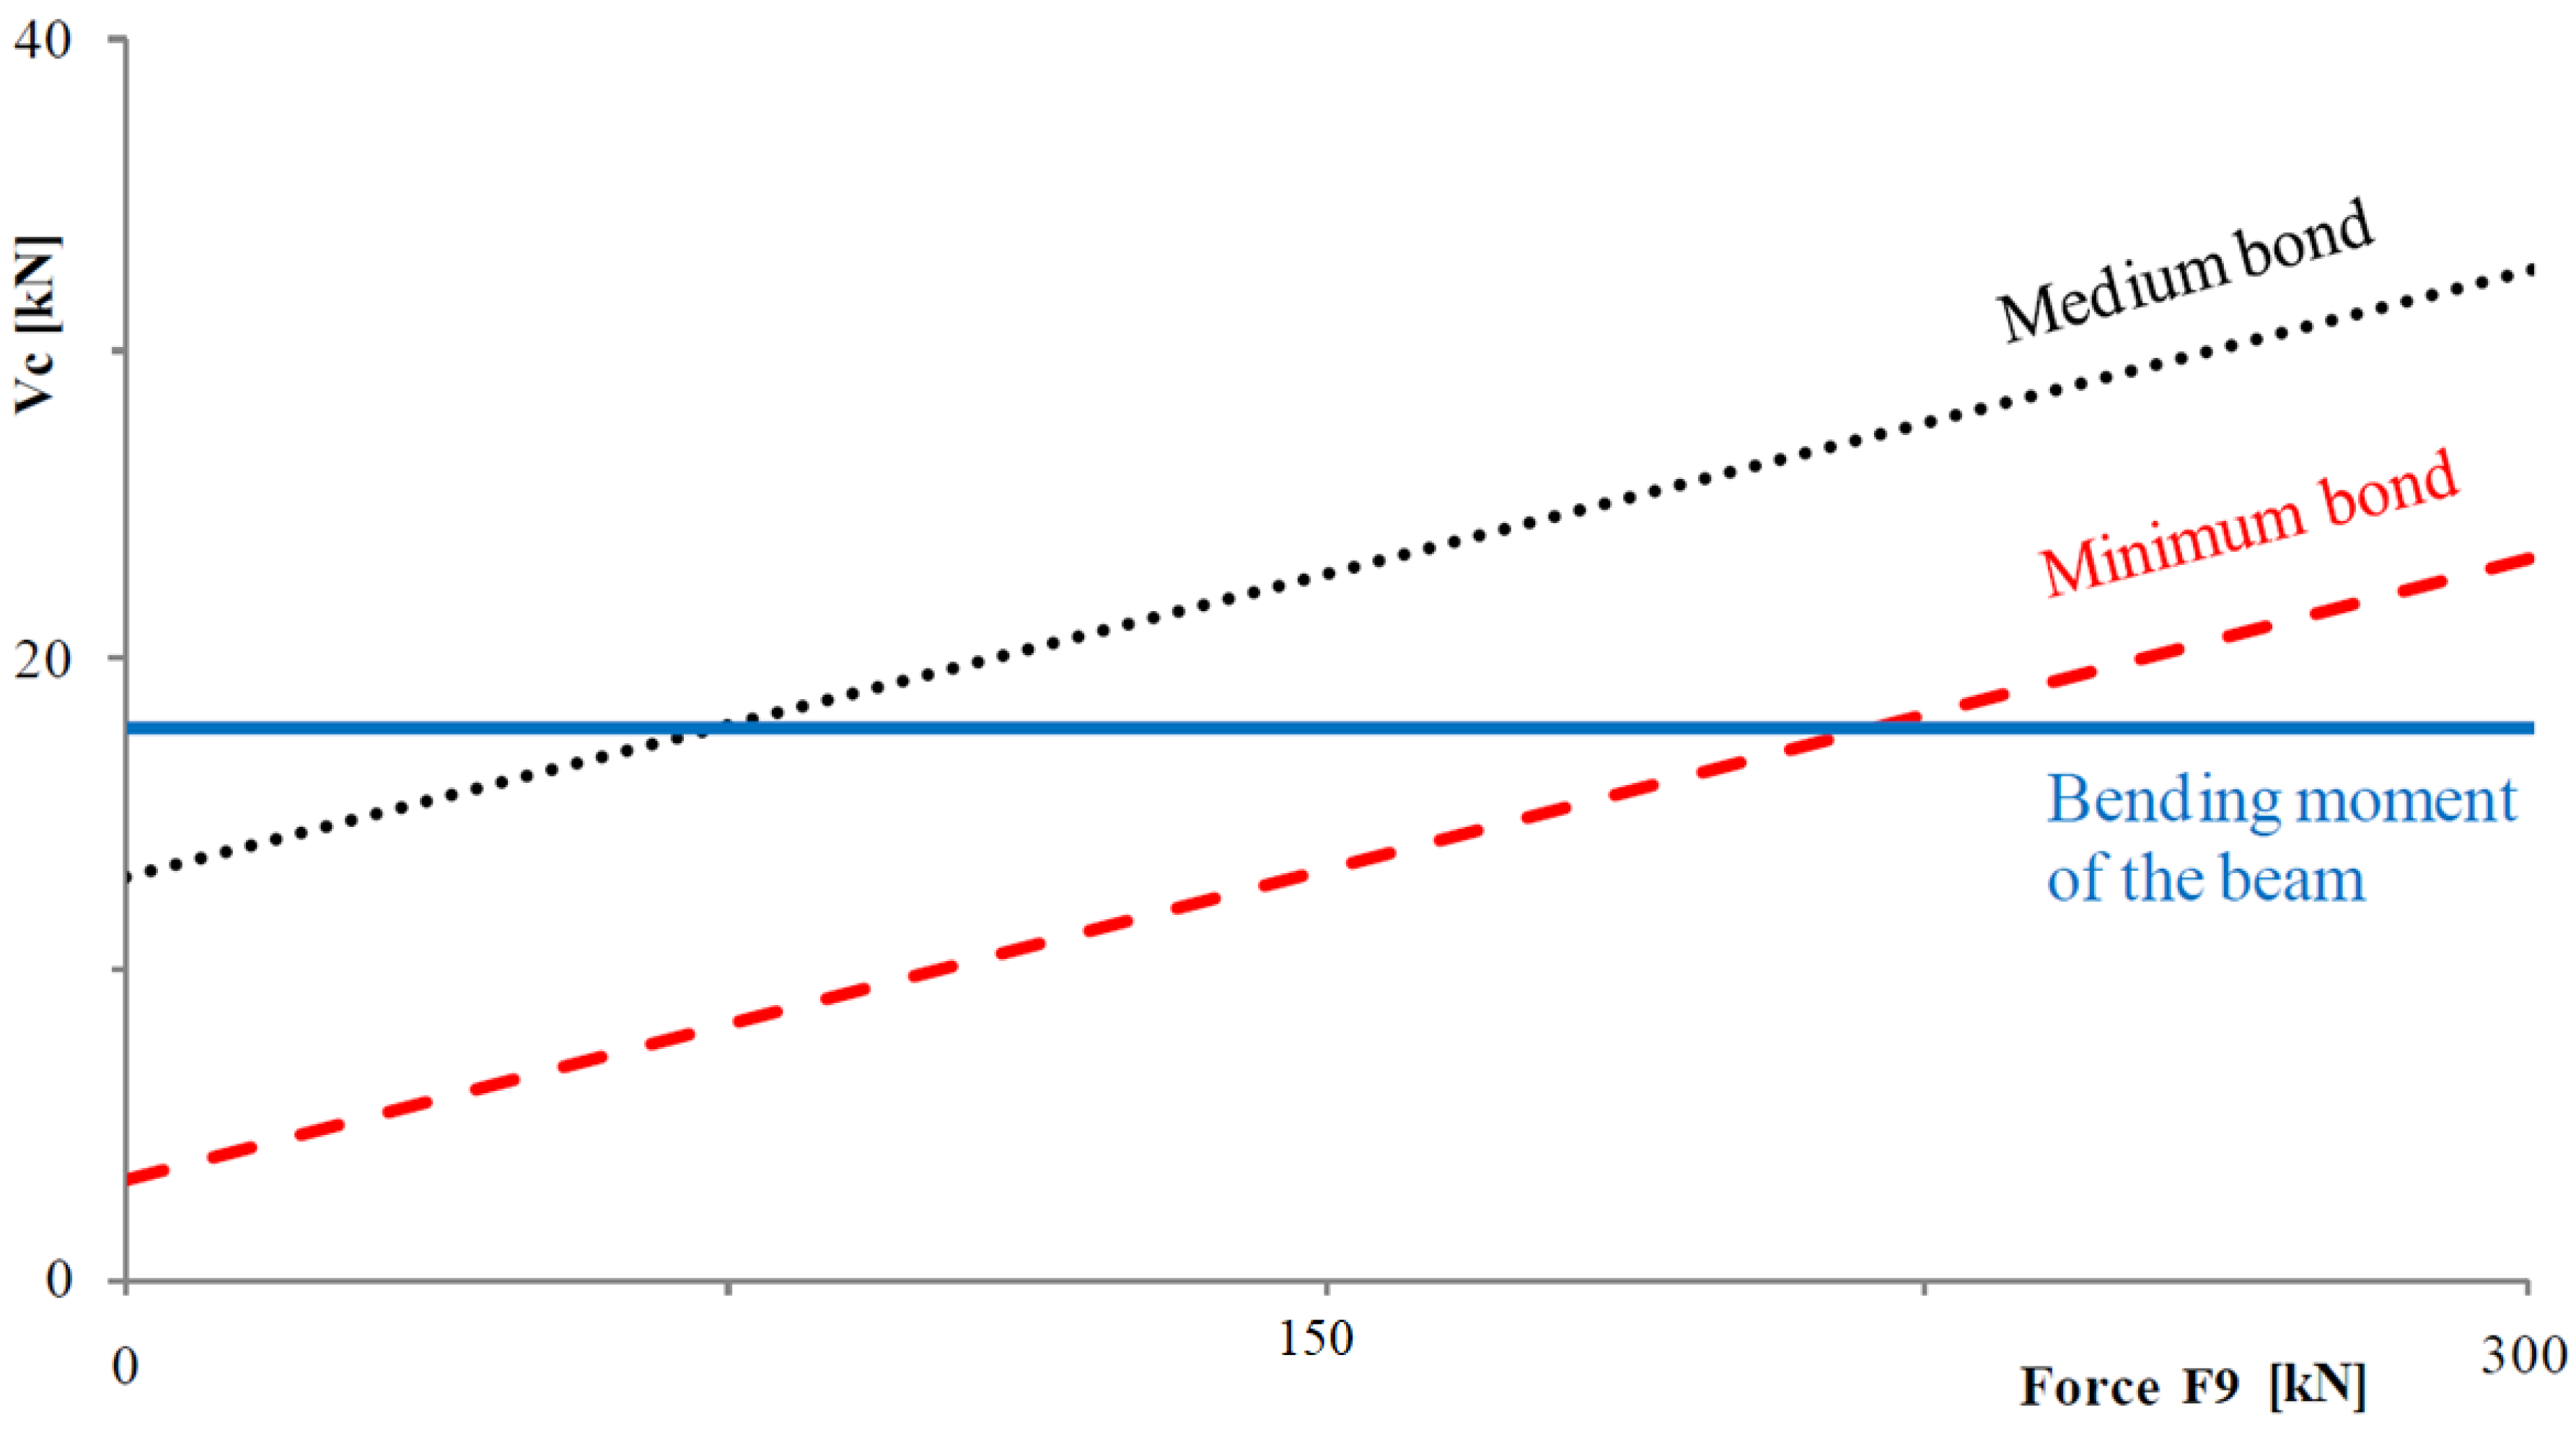
Figure 5.
Geometrical characteristic of considered beam-column joint for parametric analysis.
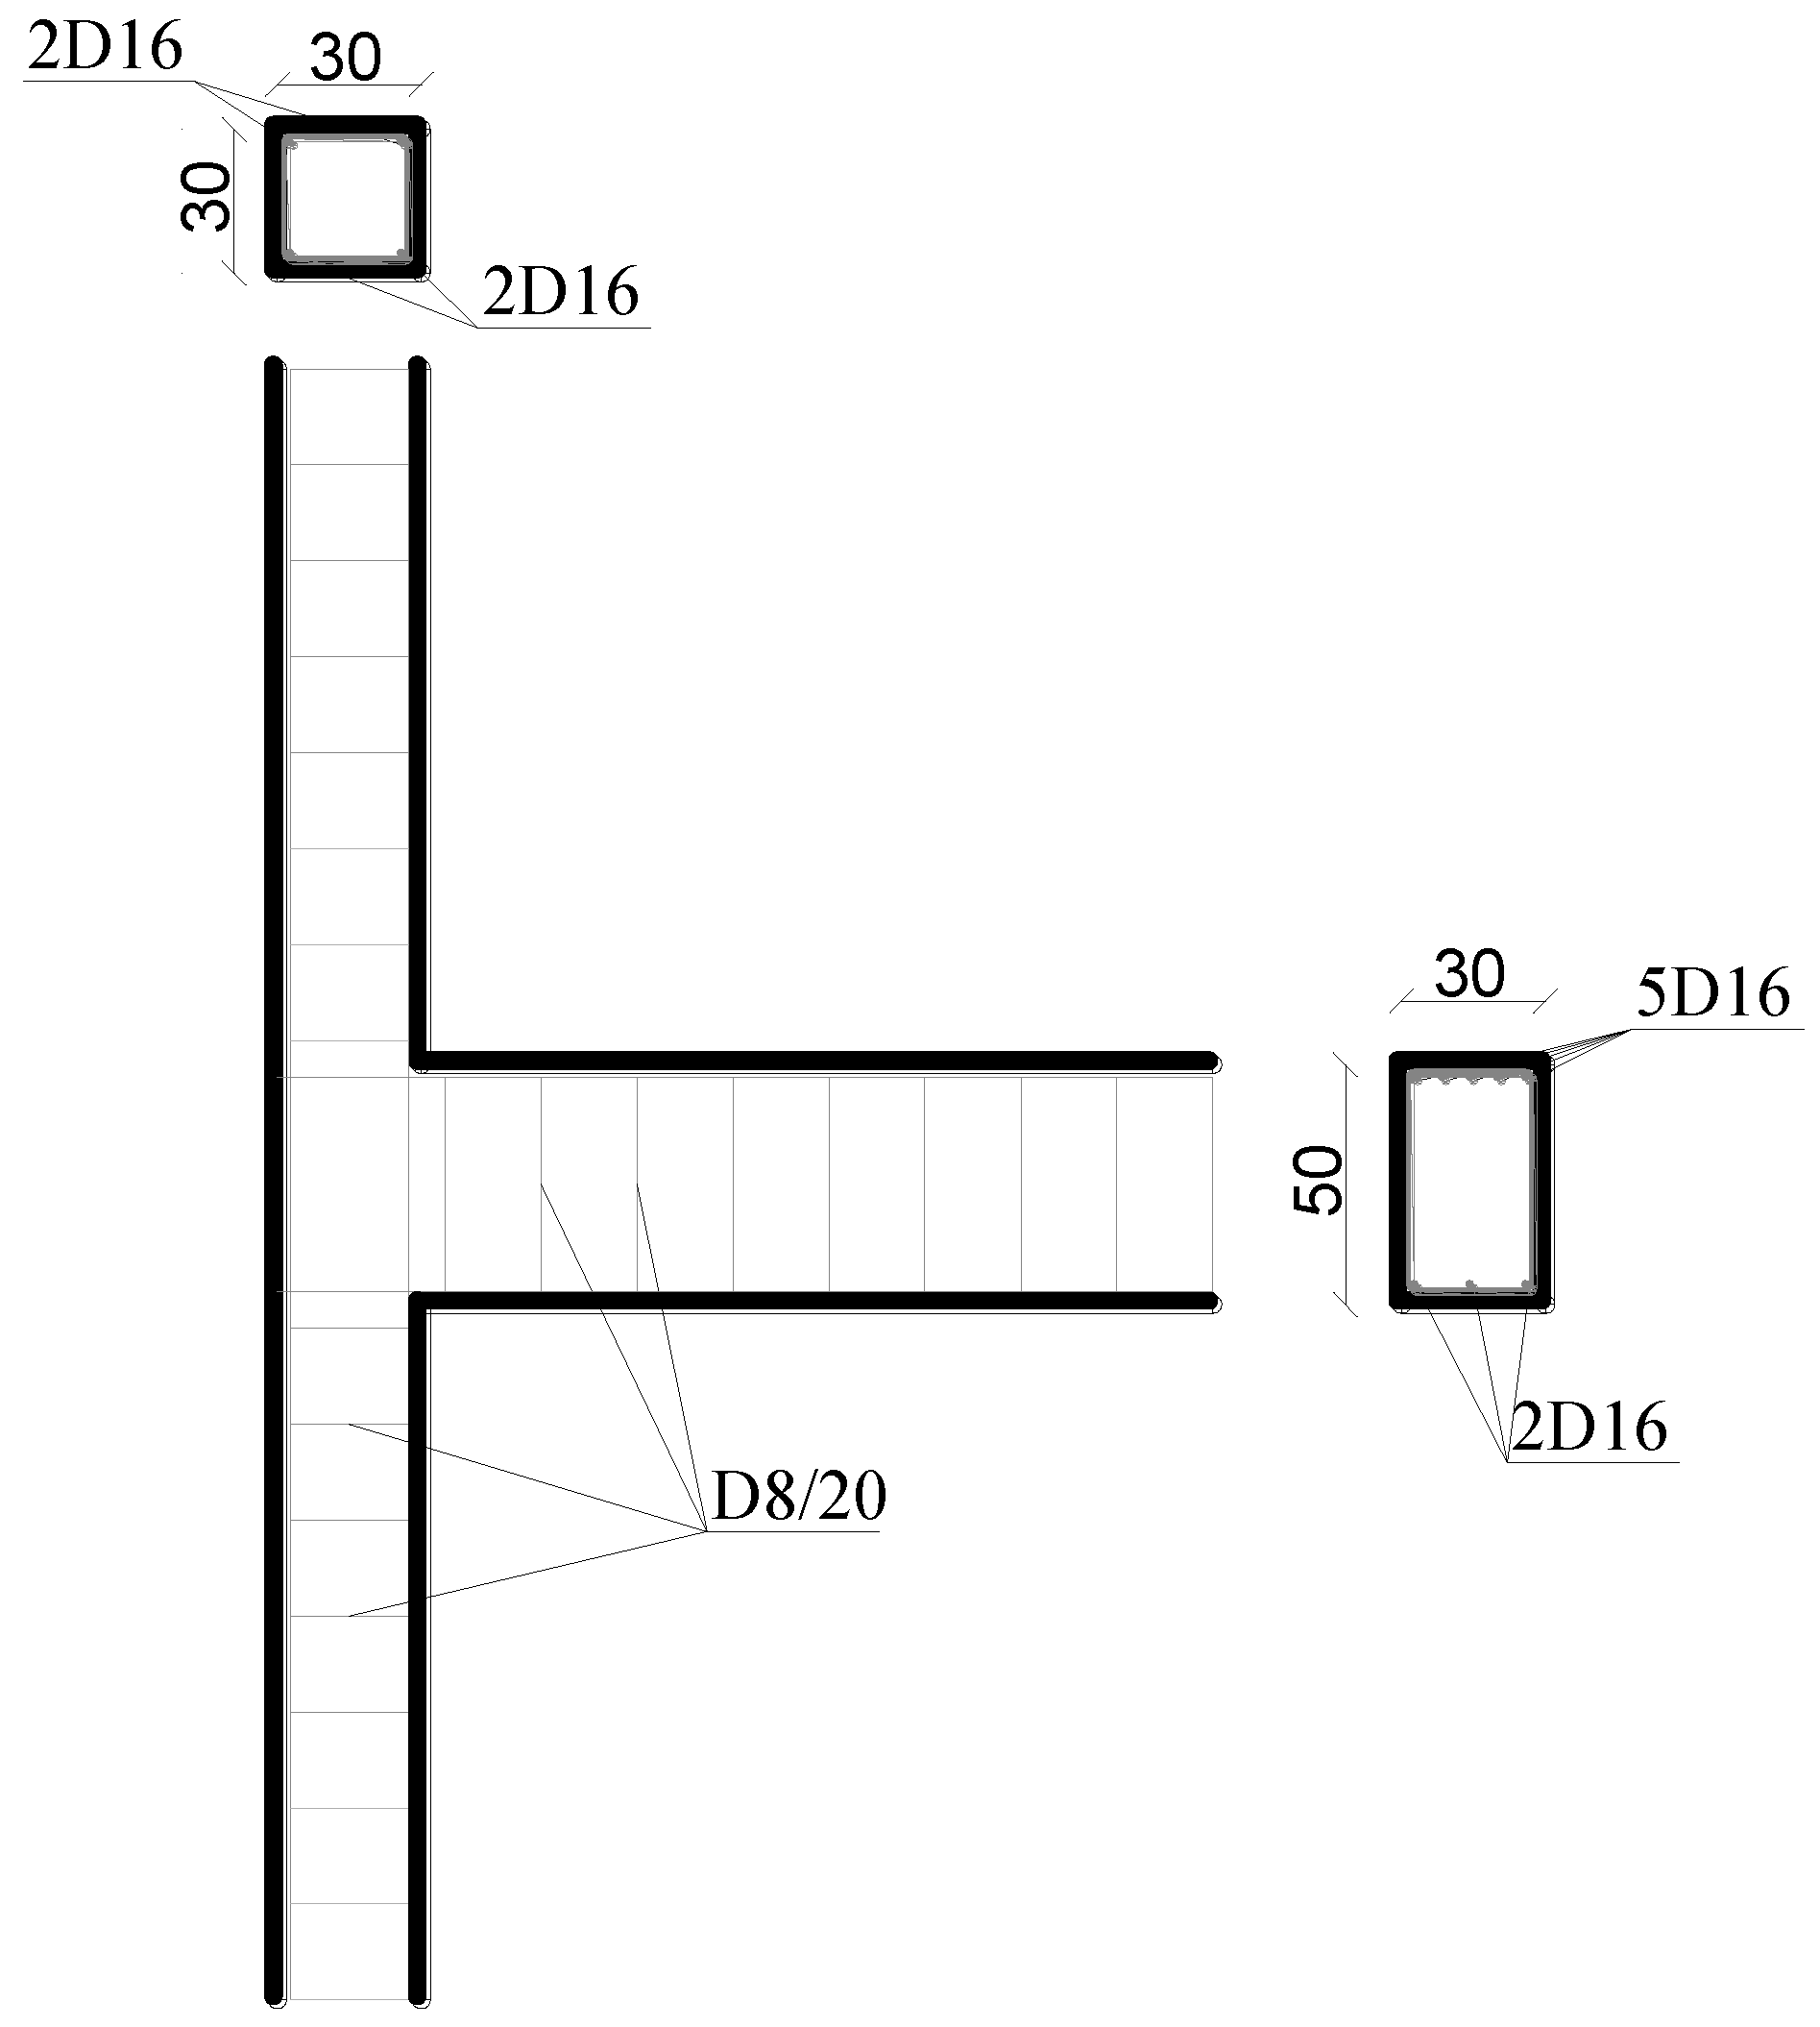
Figure 6.
Joint shear evaluation in an external beam-column joint.
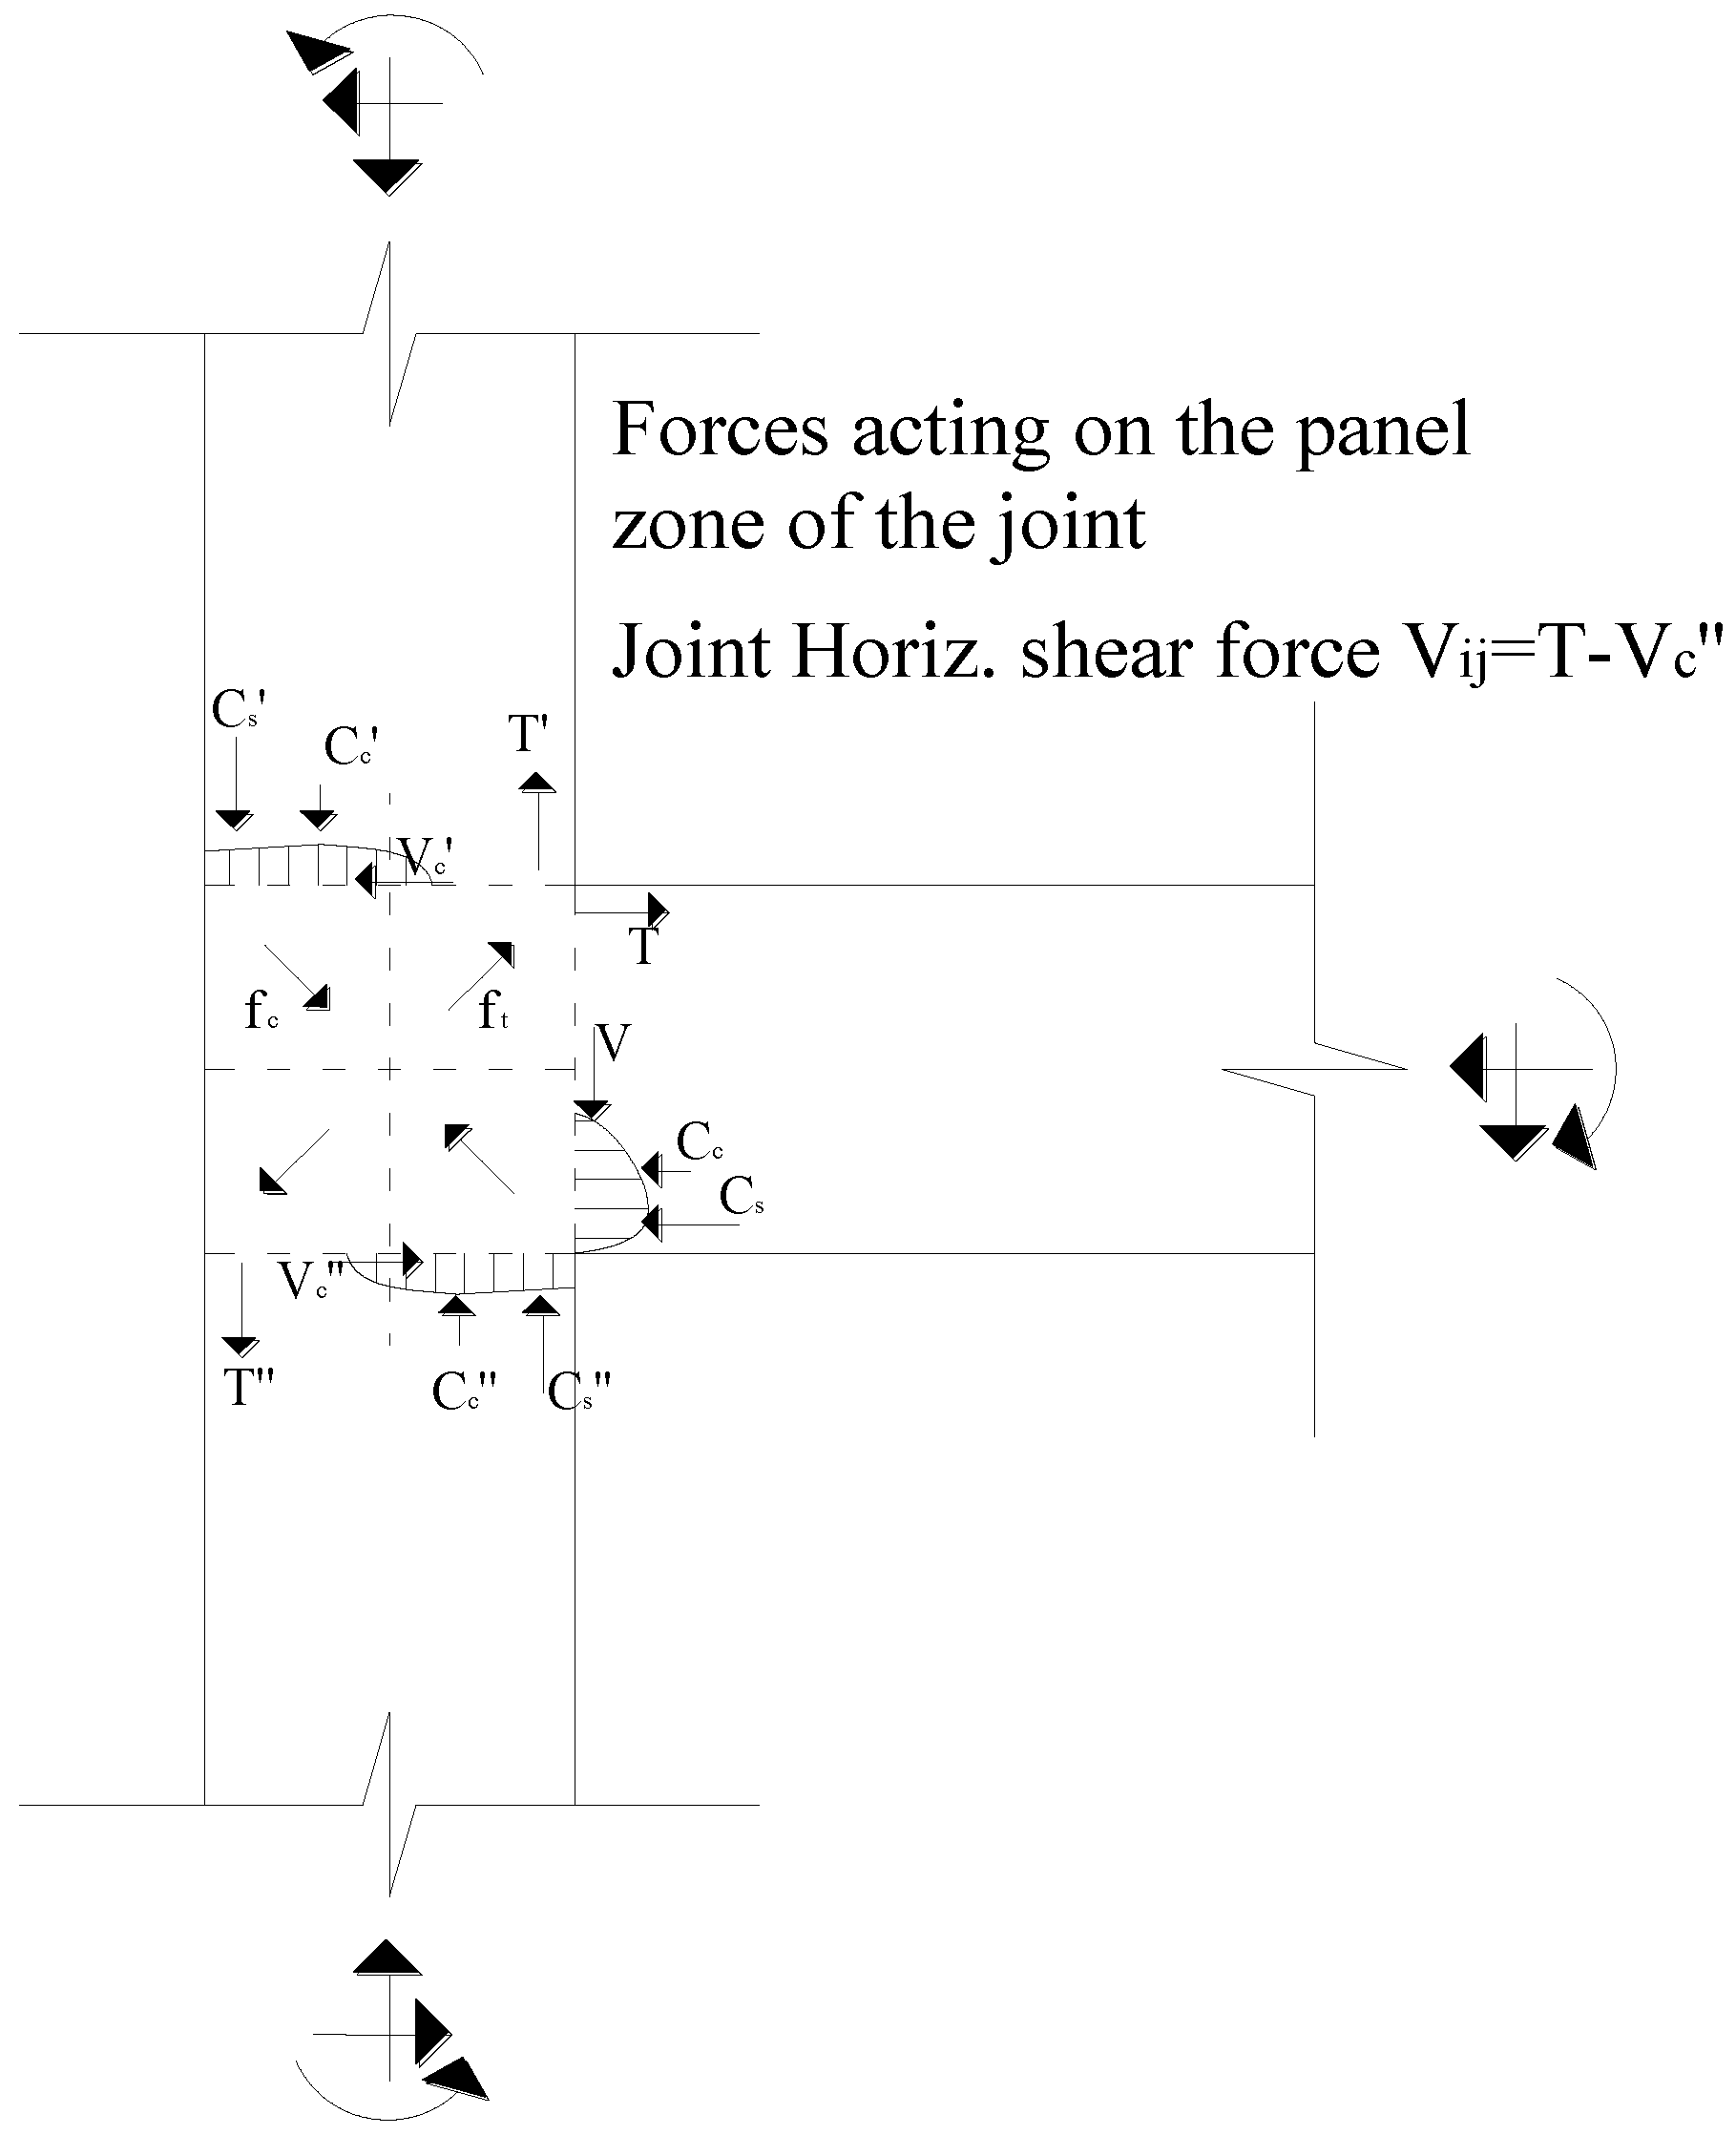
Figure 7.
Comparison of theoretical predictions for the experimental tests, in terms of joint shear.
Figure 7.
Comparison of theoretical predictions for the experimental tests, in terms of joint shear.


Table 1.
Ultimate column shear, Vc, for each considered failure mode.
| Column Shear | Failure Mode |
|---|---|
| Vc1 | Bending for beam |
| Vc2 | Bending for column |
| Vc3 | Shear for beam |
| Vc4 | Shear for column |
| Vc5 | Joint involving horizontal bars |
| Vc6 | Joint involving vertical bars (upper column) |
| Vc7 | Joint involving vertical bars (lower column) |
| Vc8 | Joint due to maximum bond exceedance |
| Vc9 | Joint due to medium bond exceedance |
| Vc10 | Joint due to minimum bond exceedance |
| Vc11 | Joint due to crushing of concrete strut |
Table 2.
Geometrical and mechanical properties of specimens of experimental programs.
| Specimen ID Number | Concrete Charcteristics | Concrete Section | Concrete Cover | Beam | Column | Stirrups | ||||||||||||||||
|---|---|---|---|---|---|---|---|---|---|---|---|---|---|---|---|---|---|---|---|---|---|---|
| Upper Side | Lower Side | Upper Side | Lower Side | Beam | Column | |||||||||||||||||
| Nc | fc | Beam | Column | Beam | Column | Bar Diameter | A′s,b | fy | Bar Diameter | As,b | fy | Bar Diameter | A′s,c | fy | Bar Diameter | As,c | fy | Legs, Diameter | fy | Legs, Diameter | fy | |
| kN | MPa | cm2 | cm2 | mm | mm | mm | cm2 | MPa | mm | cm2 | MPa | mm | cm2 | MPa | mm | cm2 | MPa | N°, mm | MPa | N°, mm | MPa | |
| El-Amoury and Ghobarah (2002) [32] | ||||||||||||||||||||||
| T0 | 600 | 30.6 | 25 × 40 | 25 × 40 | 40 | 40 | 20 | 12.56 | 425 | 20 | 12.56 | 425 | 20 | 9.42 | 425 | 20 | 9.42 | 425 | 2, 10 | 425 | 2, 15 | 425 |
| Masi et al. (2009) [27] | ||||||||||||||||||||||
| T1 | 290 | 17.9 | 30 × 50 | 30 × 30 | 30 | 30 | 12 | 2.26 | 478 | 12 | 2.26 | 478 | 14 | 3.08 | 478 | 14 | 2.08 | 478 | 2, 8 | 478 | 2, 8 | 478 |
| Russo and Pauletta (2012) [33] | ||||||||||||||||||||||
| 12_6 | 90 | 22.16 | 30 × 24 | 30 × 30 | 2.7 | 2.7 | 12 | 2.26 | 315.4 | 12 | 2.26 | 315.4 | 12 | 2.26 | 315.4 | 12 | 2.26 | 315.4 | 2, 6 | 315.4 | 2, 6 | 315.4 |
| 12_8 | 90 | 22.16 | 30 × 24 | 30 × 30 | 2.9 | 2.9 | 12 | 2.26 | 315.4 | 12 | 2.26 | 315.4 | 12 | 2.26 | 315.4 | 12 | 2.26 | 315.4 | 2, 8 | 315.4 | 2, 8 | 315.4 |
Table 3.
Theoretical prediction of shear capacity of considered specimens related to failure modes.
| Experimental Program | ||||||||
|---|---|---|---|---|---|---|---|---|
| Column Shear at Failure | Positive Shear | Negative Shear | ||||||
| El-Amoury and Ghobarah (2002) [32] | Masi et al. (2009) [27] | Russo and Pauletta (2012) [33] | El-Amoury and Ghobarah (2002) [32] | Masi et al. (2009) [27] | Russo and Pauletta (2012) [33] | |||
| T0 | T1 | 12_6 | 12_8 | T0 | T1 | 12_6 | 12_8 | |
| Vc1 [kN] | 65.71 | 17.75 | 9.11 | 9.11 | 65.71 | 17.75 | 9.11 | 9.11 |
| Vc2 [kN] | 172.76 | 56.76 | 35.59 | 35.26 | 172.76 | 56.76 | 35.59 | 35.26 |
| Vc3 [kN] | 175.65 | 156.78 | 24.32 | 42.82 | 175.65 | 156.78 | 24.32 | 42.82 |
| Vc4 [kN] | 270.24 | 145.89 | 73.00 | 72.46 | 270.24 | 145.89 | 73.00 | 72.46 |
| Vc5 [kN] | 59.07 | 13.59 | 8.52 | 8.33 | 59.07 | 13.59 | 8.52 | 8.33 |
| Vc6 [kN] | 125.75 | 86.40 | 25.09 | 24.54 | 125.75 | 86.40 | 25.09 | 24.54 |
| Vc7 [kN] | 137.08 | 100.45 | 30.40 | 29.57 | 114.68 | 74.68 | 21.28 | 20.88 |
| Vc8 [kN] | 110.93 | 25.62 | 24.44 | 23.37 | 110.93 | 25.62 | 24.44 | 23.37 |
| Vc9 [kN] | 60.49 | 13.00 | 12.40 | 11.86 | 60.49 | 13.00 | 12.40 | 11.86 |
| Vc10 [kN] | 15.28 | 3.15 | 3.01 | 2.87 | 15.28 | 3.15 | 3.01 | 2.87 |
| Vc11 [kN] | 160.93 | 160.93 | 102.04 | 102.04 | 160.93 | 160.93 | 102.04 | 102.04 |
Bold numbers indicate failure considering maximum bond exceedance. Italic numbers indicates failure considering minimum bond exceedance.
Table 4.
Comparison of experimental results [27] and simplified model failure predictions to validate simplified proposed model.
Table 4.
Comparison of experimental results [27] and simplified model failure predictions to validate simplified proposed model.
| Failure Mode | No Retrofit | No Retrofit | 2 Stirrups | 2 Stirrups | 4 Stirrups | 4 Stirrups |
|---|---|---|---|---|---|---|
| Pos. Shear | Neg. Shear | Pos. Shear | Neg. Shear | Pos. Shear | Neg. Shear | |
| Vc1 [kN] | 17.75 | 17.75 | 17.75 | 17.75 | 17.75 | 17.75 |
| Vc2 [kN] | 56.76 | 56.76 | 56.76 | 56.76 | 56.76 | 56.76 |
| Vc3 [kN] | 156.78 | 156.78 | 156.78 | 156.78 | 156.78 | 156.78 |
| Vc4 [kN] | 145.89 | 145.89 | 145.89 | 145.89 | 145.89 | 145.89 |
| Vc5 [kN] | 13.59 | 13.59 | 19.51 | 19.51 | 25.35 | 25.35 |
| Vc6 [kN] | 86.40 | 86.40 | 86.40 | 86.40 | 86.40 | 86.40 |
| Vc7 [kN] | 100.45 | 74.68 | 100.45 | 74.68 | 100.45 | 74.68 |
| Vc8 [kN] | 25.62 | 25.62 | 31.77 | 31.77 | 37.82 | 37.82 |
| Vc9 [kN] | 13.00 | 13.00 | 19.34 | 19.34 | 25.59 | 25.59 |
| Vc10 [kN] | 3.15 | 3.15 | 9.64 | 9.64 | 16.03 | 16.03 |
| Vc11 [kN] | 160.93 | 160.93 | 160.93 | 160.93 | 160.93 | 160.93 |
Table 5.
Variability of considered parameters: failure modes and column shear capacity (both in case of positive or negative shear) of considered joint configurations.
Table 5.
Variability of considered parameters: failure modes and column shear capacity (both in case of positive or negative shear) of considered joint configurations.
| ID Number | Nc | fc | Stirrups | FRP | Beam Dimension | Failure Mode (Pos. Column Shear) | Failure Mode (Neg. Column Shear) |
|---|---|---|---|---|---|---|---|
| -- | kN | MPa | -- | -- | cm2 | -- | kN |
| 1 | 0 | 20 | -- | -- | (50 × 30) | Vc2 | 37.1 |
| 2 | 315 | 20 | -- | -- | (50 × 30) | Vc5 | 57.5 |
| 3 | 630 | 20 | -- | -- | (50 × 30) | Vc5 | 57.5 |
| 4 | 315 | 40 | -- | -- | (50 × 30) | Vc5 | 59.5 |
| 5 | 315 | 60 | -- | -- | (50 × 30) | Vc5 | 60.1 |
| 6 | 315 | 20 | 2D8 | -- | (50 × 30) | Vc2 | 62.2 |
| 7 | 315 | 20 | 4D8 | -- | (50 × 30) | Vc2 | 62.2 |
| 8 | 315 | 20 | 8D8 | -- | (50 × 30) | Vc2 | 62.2 |
| 9 | 315 | 20 | -- | -- | (70 × 30) | Vc2 | 66.8 |
| 10 1 | 315 | 20 | -- | -- | (50 × 30) | Vc2 | 62.2 |
| 11 2 | 315 | 20 | -- | -- | (50 × 30) | Vc8 | 32.6 |
Failure due to: Vc2—Bending for column, Vc5—Joint with yielding of horizontal bars, Vc8—Joint due to maximum bond exceedance. 1 ϑ = −20°, 2 ϑ = +20°.
Table 6.
Column shear, Vc, for each considered failure mode, related to each configuration.
| Column Shear at Failure | Shear Sign | Vc1 (kN) | Vc2 (kN) | Vc3 (kN) | Vc4 (kN) | Vc5 (kN) | Vc6 (kN) | Vc7 (kN) | Vc8 (kN) | Vc9 (kN) | Vc10 (kN) | Vc11 (kN) | |
|---|---|---|---|---|---|---|---|---|---|---|---|---|---|
| Configuration ID Number | 1 | Pos. | 75.98 | 37.14 | 135.21 | 161.06 | 57.48 | 58.48 | 77.28 | 75.34 | 40.00 | 9.99 | 145.68 |
| Neg. | 46.09 | 37.14 | 135.21 | 161.06 | 35.46 | 58.48 | 46.27 | 48.62 | 25.08 | 6.15 | 145.68 | ||
| 2 | Pos. | 75.98 | 62.18 | 135.21 | 161.06 | 57.48 | 93.70 | 114.64 | 75.34 | 40.00 | 9.99 | 145.68 | |
| Neg. | 46.09 | 62.18 | 135.21 | 161.06 | 35.46 | 93.70 | 76.97 | 48.62 | 25.08 | 6.15 | 145.68 | ||
| 3 | Pos. | 75.98 | 79.46 | 135.21 | 161.06 | 57.48 | 120.52 | 136.73 | 75.34 | 40.00 | 9.99 | 145.68 | |
| Neg. | 46.09 | 79.46 | 135.21 | 161.06 | 35.46 | 120.52 | 103.34 | 48.62 | 25.08 | 6.15 | 145.68 | ||
| 4 | Pos. | 76.99 | 65.21 | 135.21 | 161.06 | 59.48 | 103.95 | 139.14 | 110.50 | 57.46 | 14.17 | 291.36 | |
| Neg. | 46.72 | 65.21 | 135.21 | 161.06 | 36.13 | 103.95 | 81.79 | 70.05 | 35.77 | 8.71 | 291.36 | ||
| 5 | Pos. | 77.70 | 66.88 | 135.21 | 161.06 | 60.10 | 107.21 | 147.97 | 137.37 | 70.85 | 17.38 | 437.04 | |
| Neg. | 47.29 | 66.88 | 135.21 | 161.06 | 36.35 | 107.21 | 83.27 | 86.47 | 43.97 | 10.68 | 437.04 | ||
| 6 | Pos. | 75.98 | 62.18 | 135.21 | 161.06 | 62.76 | 93.70 | 114.64 | 81.11 | 46.69 | 17.28 | 145.68 | |
| Neg. | 46.09 | 62.18 | 135.21 | 161.06 | 41.10 | 93.70 | 76.97 | 54.68 | 31.59 | 12.97 | 145.68 | ||
| 7 | Pos. | 75.98 | 62.18 | 135.21 | 161.06 | 67.93 | 93.70 | 114.64 | 86.70 | 53.24 | 24.45 | 145.68 | |
| Neg. | 46.09 | 62.18 | 135.21 | 161.06 | 46.65 | 93.70 | 76.97 | 60.62 | 37.99 | 19.68 | 145.68 | ||
| 8 | Pos. | 75.98 | 62.18 | 135.21 | 161.06 | 77.98 | 93.70 | 114.64 | 97.29 | 65.84 | 38.35 | 145.68 | |
| Neg. | 46.09 | 62.18 | 135.21 | 161.06 | 57.49 | 93.70 | 76.97 | 72.09 | 50.42 | 32.78 | 145.68 | ||
| 9 | Pos. | 109.79 | 66.79 | 192.27 | 161.06 | 80.32 | 164.51 | 242.60 | 109.83 | 57.07 | 14.06 | 145.68 | |
| Neg. | 66.38 | 66.79 | 192.27 | 161.06 | 49.06 | 164.51 | 116.51 | 69.82 | 35.64 | 8.68 | 145.68 | ||
| 10 | Pos. | 75.98 | 62.18 | 135.21 | 161.06 | 63.64 | 64.11 | 74.91 | 125.00 | 85.96 | 23.38 | 145.68 | |
| Neg. | 46.09 | 62.18 | 135.21 | 161.06 | 39.58 | 64.11 | 55.48 | 100.54 | 56.26 | 14.35 | 145.68 | ||
| 11 | Pos. | 75.98 | 62.18 | 135.21 | 161.06 | 51.64 | 131.88 | 131.88 | 32.55 | 11.77 | 2.86 | 145.68 | |
| Neg. | 46.09 | 62.18 | 135.21 | 161.06 | 31.91 | 131.88 | 117.37 | 82.06 | 44.42 | 11.20 | 145.68 | ||
Failure due to: Vc1—Bending for beam, Vc2—Bending for column, Vc3—Shear for beam, Vc4—Shear for column, Vc5—Joint with yielding of horizontal bars, Vc6—Joint with yielding of vertical upper bars, Vc7—Joint with yielding of vertical lower bars, Vc8—Joint due to maximum bond exceedance, Vc9—Joint due to medium bond exceedance, Vc10—Joint due to minimum bond exceedance, Vc11—Joint due to crushing of concrete strut. Bold numbers indicate failure considering maximum bond. Italic numbers indicate failure considering minimum bond.
Table 7.
Comparison between proposed model, codes, and experimental results.
| Experimental Joints | |||||
|---|---|---|---|---|---|
| Joint Shear (kN) | Limit Joint Shear (kN) | Joint Shear (kN) | Joint Shear (kN) | Limit Joint Shear (kN) | |
| Model | ACI | AIJ | EC8 | Experimental | |
| El-Amoury and Ghobarah (2002) [32] T0 | 474.73 | 550.96 | 521.93 | 793.31 | 475.30 |
| Masi et al. (2009) [27] T1 | 91.36 | 378.72 | 322.10 | 462.26 | 90.07 |
| Russo and Pauletta (2012) [33] | 63.78 | 421.98 | 374.76 | 702.67 | 64.50 |
© 2017 by the authors. Licensee MDPI, Basel, Switzerland. This article is an open access article distributed under the terms and conditions of the Creative Commons Attribution (CC BY) license (http://creativecommons.org/licenses/by/4.0/).
Share and Cite
MDPI and ACS Style
Bossio, A.; Fabbrocino, F.; Lignola, G.P.; Prota, A.; Manfredi, G. Design Oriented Model for the Assessment of T-Shaped Beam-Column Joints in Reinforced Concrete Frames. Buildings 2017, 7, 118. https://doi.org/10.3390/buildings7040118
AMA Style
Bossio A, Fabbrocino F, Lignola GP, Prota A, Manfredi G. Design Oriented Model for the Assessment of T-Shaped Beam-Column Joints in Reinforced Concrete Frames. Buildings. 2017; 7(4):118. https://doi.org/10.3390/buildings7040118
Chicago/Turabian StyleBossio, Antonio, Francesco Fabbrocino, Gian Piero Lignola, Andrea Prota, and Gaetano Manfredi. 2017. "Design Oriented Model for the Assessment of T-Shaped Beam-Column Joints in Reinforced Concrete Frames" Buildings 7, no. 4: 118. https://doi.org/10.3390/buildings7040118
Note that from the first issue of 2016, this journal uses article numbers instead of page numbers. See further details here.