An Integrated Assessment Approach as a Decision Support System for Urban Planning and Urban Regeneration Policies


Department of Heritage, Architecture, Urban Planning, Mediterranea University of Reggio Calabria, Reggio Calabria 89124, Italy
*
Author to whom correspondence should be addressed.
Buildings 2017, 7(4), 85; https://doi.org/10.3390/buildings7040085
Submission received: 27 July 2017
/
Revised: 5 September 2017
/
Accepted: 19 September 2017
/
Published: 25 September 2017
(This article belongs to the Special Issue Real Estate Economics, Management and Investments)
Abstract
:This paper focuses on an integrated multi-methodological evaluation process; it aimed at supporting public administrators in developing alternative strategies for intervention in urban planning and urban regeneration processes that focus on abandoned urban areas located in a central position. In order to transform crisis areas into areas with new opportunities, starting with their redevelopment and enhancement, the article proposes a selection of evaluation tools that can support and steer the decision maker’s choice of alternative scenarios for intervention. For this purpose, the contribution develops an integrated system of evaluation methodologies for decision-making support, which includes different components and a plurality of points of view, even of conflicting types, providing a more transparent description of the decision-making process. The methodological approach was applied to a pilot case study that concerned the choice of priority intervention between two abandoned and blighted areas located in the central area of the city of Reggio Calabria.
1. Introduction
This paper discusses the role of evaluation in supporting decision-making in urban planning and urban regeneration processes.
The interaction between evaluation and planning processes was examined both from a theoretical and a practical point of view [1,2], with reference to the purpose and reach of evaluation planning and its innovations and methodological improvements.
Working in processes of territorial transformation, in a context of urban sustainability, involves dealing with complex systems, made up of many interacting dimensions, connected in different ways and therefore characterized by dynamics that are not clear or predictable from the study of individual parts. Therefore sustainability must be pursued in all its dimensions (environmental, technological, economic, social, and cultural) in order to identify indicators and indices that can measure these aspects [3].
Territorial transformations therefore constitute complex decision-making problems and underline the growing need for appropriate tools for evaluating programs and intervention projects.
Increasing attention to urban development processes and the effects of planning choices highlights the complexity of defining shared goals, data collection at the base of identifying a set of possible solutions, as well as anticipation of their effects in different development scenarios. The plurality of scenarios and possible solutions makes evaluation a tool of fundamental importance for comparison between different alternatives and choice of a shared solution, as well as to ensure a progressive improvement of knowledge [3].
The evaluation of alternative urban transformation scenarios is therefore a category of decision-making problems that, in order to be solved, needs to be placed in a proper evaluation framework, this strategy ensures the impact analisys of choices that can be strategic for the territory.
Today there is a need not only for adequate tools for evaluating territorial transformation projects, but also to integrate evaluation into the planning and project phases. Indeed, evaluation can be a communication and knowledge production tool that can express its potential only through an integrated approach and a process in which the evaluation develops in parallel with the program and the project and interacts with it throughout all phases of its life cycle, from the ex ante phase to the ex post [3,4].
From this perspective, planning processes should be considered as decision-making processes. Starting from the analysis of strengths and weaknesses in the decision-making context and crossing through a crucial phase of problem-solving, decision-makers are called upon to investigate needs and preferences, define goals, and explore strategies and intervention scenarios to identify the most coherent and satisfactory choice [5].
In particular, as evidenced in the literature, the fundamental role of the evaluation process will be highlighted as a tool for understanding the complexity inherent in the transformation of the territory, communicating it and making it feasible.
Evaluation, as a cyclical process, gives rational support to deal with complexity and allows us to check the effectiveness and solidity of choices by increasing their transparency and improving the process of collective learning [4].
In particular, increasing attention to the concept of sustainable urban development, understood as an ongoing process and not as an unbending condition, underlined the importance of evaluation for assessing progress in improving environmental quality, social prosperity, and economic growth according to a long-term horizon. At the same time, it has progressively emerged as a conceptual framework for integrating values into decision-making activities, making explicit the direction of preferences [6].
There are some fields, such as regional planning, where the multidimensional profile of the decision is clear; in this context different objectives must be pursued that are often conflicting and generate external effects of an immeasurable nature [7]. The formulation of regeneration strategies and processes for the sustainable development of cities is certainly difficult; this is because the nature of a city is complex, but also the concept of sustainable development with a necessarily multidimensional nature is generally not easy to understand beyond the environmental aspects. It is known that urban design can be a multiform concept that includes socioeconomic, ecological, technical, political, and ethical perspectives.
The decision-making process for sustainable development in the built environment requires new approaches that can integrate and synthesize all dimensions and different points of view of an urban system [8].
Considering that urban regeneration programs operate in the current city directly in an open, procedural, and strategic scenario, from the beginning of the process it is necessary to activate the initiative of social and economic stakeholders [9]. In this process, participation plays an essential role in social sharing of choices, in order to develop a territorial consciousness that is necessary for the implementation and management of the program; however, to be effective it must be integrated and take place in the early phases of the process.
In particular, the general theme addressed in this paper on decision-making in urban planning and urban regeneration processes highlights the strategic dimension of urban redevelopment programs; it is as a rule the effect of public and private investments that are oriented to different purposes [10] and induce an overall territorial enhancement with effects of unbalanced benefits sharing, resulting from not transparent assessment [11].
Therefore, to verify the outcomes of this process we need evaluation tools that can measure the effects and find a shared equilibrium point. In summary, the purpose of this study is to provide a “decision support tool” that can improve the quality and transparency of decision and guide public administrators in their future strategic decisions by using integrated approaches to support decision-making processes in urban planning and regeneration contexts and thus improve the allocation of public resources with rational arguments.
The methodological approach used here deals with multidimensional and evaluation systems with different stakeholders using both qualitative approaches to explore the general problem, and quantitative approaches to better study options and alternative performances [12,13].
Through the application to a case study, the contribution intends to emphasize the strategic role played by free or disused areas in the metropolitan context, thus developing a reflection on what it means to deal with urban regeneration strategies of blighted or abandoned areas so that they become opportunities for development of the region and its greater competitiveness on a large scale.
In particular, in this research we have tried out a mixed-method approach [14] to evaluate scenarios and intervention options, based on multidisciplinary work.
Among the different research methods, the multi-phase one [12] has been chosen because it seems particularly suitable to the case study and allows us to follow the next phases of the project’s formulation and have a data collection based on the results of the previous one. As will be presented in the rest of the paper, the multi-phase evaluation methodology clarifies the problem and defines the objectives/values to be achieved through quantitative and qualitative evaluations, finalized by selecting the most coherent and effective option between the two covered alternatives, identified as priorities by the municipal administration for urban regeneration, followed by a quantitative analysis to determine, through economic and financial indicators, the profitability of the chosen option compared to the diversified investment scenarios.
Therefore, the integrated decision support with mixed methods should be a transferable context as a basis for shared actions in a long-term horizon, aimed at effectively developing and building public decision-making and supporting policy makers in their strategic decisions [15].
The paper is organized as follows: Section 2 shows a description of the territorial context and aims of the study, Section 3 illustrates the multi-methodological mixed approach and the individual application phases; finally, Section 4 proposes a detailed discussion of the final results and in Section 5 can be read some conclusions for additional research developments.
2. Case Study: Context and Description Alternatives
The political issue under consideration concerns the need for a decision support framework that can guide decision-makers in their public policies and future strategic choices. In particular, the decision-making problem concerns the intervention priorities for the redevelopment of two abandoned and blighted sites.
The areas under examination are both located in central urban areas of the municipality of Reggio Calabria, in the south of Italy (Figure 1a).
In particular, the first site (Alternative A) concerns the possibility of giving back a function to an unused area, currently occupied by the former Pentimele Existing Entity’s structures (Figure 1c), which Demanio is about to alienate.
The area has a high interest because of its positional features and it is very attractive from the economic and tourist point of view as it is close to the city center and has a privileged position on one of the most scenic natural areas: the Strait of Messina.
The area of 30,000 m2, within a homogeneous zone of type F (residential services: areas for use of public and private services with regional or urban dimension), has a land index of 200 m3/m2.
Preliminary phases, in addition to the first administrative pre-feasibility audits, concerned the study of the accessibility of the area and its context.
The first functional program considers the construction of a convention center with 1400 seats and an accommodation facility, divided into 300 beds in a four-/five-star hotel and 20 residential units for the residence typology.
The second site (Alternative B) concerns the hypothesis of promotion of the ex Italcitrus area. This area, where abandoned structures of a pre-existing industrial activity are located, is owned by the municipal administration and has excellent accessibility (Figure 1b).
The four existing buildings cover an area of almost 5300 m2 and a volume of more than 38,000 m3; the condition of the buildings and their peculiar organization, which was a result of their previous use, together with the lack of historical or architectural value, suggested their demolition, as there is no utility in eventual restoration.
The area has a land area of 14,600 m2; 10,020 m2 of this are intended for the active P.R.G. for the homogeneous zone B (conservative transformation), and 4580 m2 are intended for homogeneous zone E (primary activities).
According to a restrictive interpretation of the plan, in the area it will be possible to achieve a volumetry equal to the existing one increased by 20%, slightly greater than 46,000 m3.
From the point of view of characteristics, the area has good accessibility to the road network, but the surveys have highlighted that, although it faces the Strait of Messina, there is a lack of plausible routes to the sea.
The functional program and the preliminary masterplan were drawn up according to the current conditions of the real estate market of the city of Reggio Calabria and in particular of the concerned area. For the area under consideration, the zone for services connected to leisure and commercially oriented (multisala, indoor swimming pool, indoor sports) have been privileged; this was destined for residences of the mid–high category, just under 30% of the available volume. Ratings on the composition of the functional mix have been discussed and shared with the business world, which is interested in investment in the area.
It should be noted that both alternatives have been developed within the UrbanLab—Centro Studi per l’Edilizia e il Territorio (Center for Buildings and Territory Studies), a permanent academic structure aimed at facilitating the transfer of the scientific knowledge, necessary for innovation, promotion, development and implementation of programs and projects aimed at the redevelopment of the territory to help increase the competitiveness and attractiveness of the Reggio Calabria metropolitan area.
The UrbanLab—Centro Studi per l’Edilizia e il Territorio (Center for Buildings and Territory Studies) has worked in synergy with the S.I.T.I. (Institute on Territorial Systems for Innovation of the Politecnico di Torino and Compagnia di San Paolo) and with the support of the entrepreneurial world and the builders of Reggio Calabria (A.N.C.E.).
3. The Methodological Approach to Supporting Decision-Making Processes
The methodology followed in this study is structured through the combined use of various evaluation techniques with the aim of providing an operating framework able to support and sustain urban planning and urban regeneration processes with particular reference to disused or abandoned central urban areas.
The evolution of the decision-making structure has led to a combination of analysis, evaluation, and public involvement techniques; particular attention is given to the development of deliberative evaluation processes that can consider conflicts of interest, different points of view, and tasks of stakeholders.
Evaluation becomes a process of active participation and sharing identification that can involve two perspectives: the personal point of view (“individual utility”) and the community point of view (“social utility”) [16].
The literature discussion on the use of mixed methods is rather recent [17] (Myllyviita et al., 2014). Their application is becoming increasingly popular [18,19,20,21,22,23]; it tends to overcome the limits of any single method and considers a multidimensional perspective of sustainable urban development that can activate inclusive decision-making processes and improve its quality oriented to the construction of shared choices [24,25].
In addition, it should be noted that applications in urban and territorial policies are rather inadequate [26,27,28,29] and, as a consequence, the benefits that might result from their use are not sufficiently explored and tested.
Among some applications that are used in the first phases of decision-making structuring, most of them are related to combinations of Multi Criteria Analysis (MCA) and SWOT analysis [30,31,32,33,34] and the integration between MCA and economic evaluating models to deal with urban design projects [35,36,37].
It is known that territorial planning can be considered a many-sided concept that includes socioeconomic, ecological, technical, political, and ethical perspectives. The set of problems of these decision-making contexts are “weak” or unstructured as they are characterized by different actors with conflicting opinions and values and a wealth of possible results and margin of error [38,39]. In these situations, the evaluation of alternative scenarios is as a consequence a complex problem; it must consider many aspects, both technical elements based on empirical examinations as well as non-technical ones based on preferences and social concepts.
In this research we tested in the field a mixed-methods approach [14] to support decision-making in the urban dimension on the basis of multidisciplinary work. This study, as far as the authors know, is the first multi-methodological and integrated evaluation aimed at supporting the decision-making process of public administrators, in the field of planning and urban regeneration of abandoned urban areas located in central position; it aimed at identifying priorities and selecting the most effective intervention.
Among the different planning possibilities of mixed-methods research, the sequential approach/multi-phase approch [12] was chosen as particularly appropriate in the context of policy formulation, where the planning process should follow, from the beginning, the following phases of policy formulation.
The sequential approach applied in this study has allowed tus o identify the problematic decisional context and the objectives to be achieved through a qualitative survey, followed by qualitative and quantitative evaluations; the aim is the selection of the most effective option in relation to the identified objectives. Finally, we will verify the economic and financial sustainability, not only of the resources needed in relation to the expected benefits (return on investment), but also on the economic and financial resources to support activities over time [3,36,37].
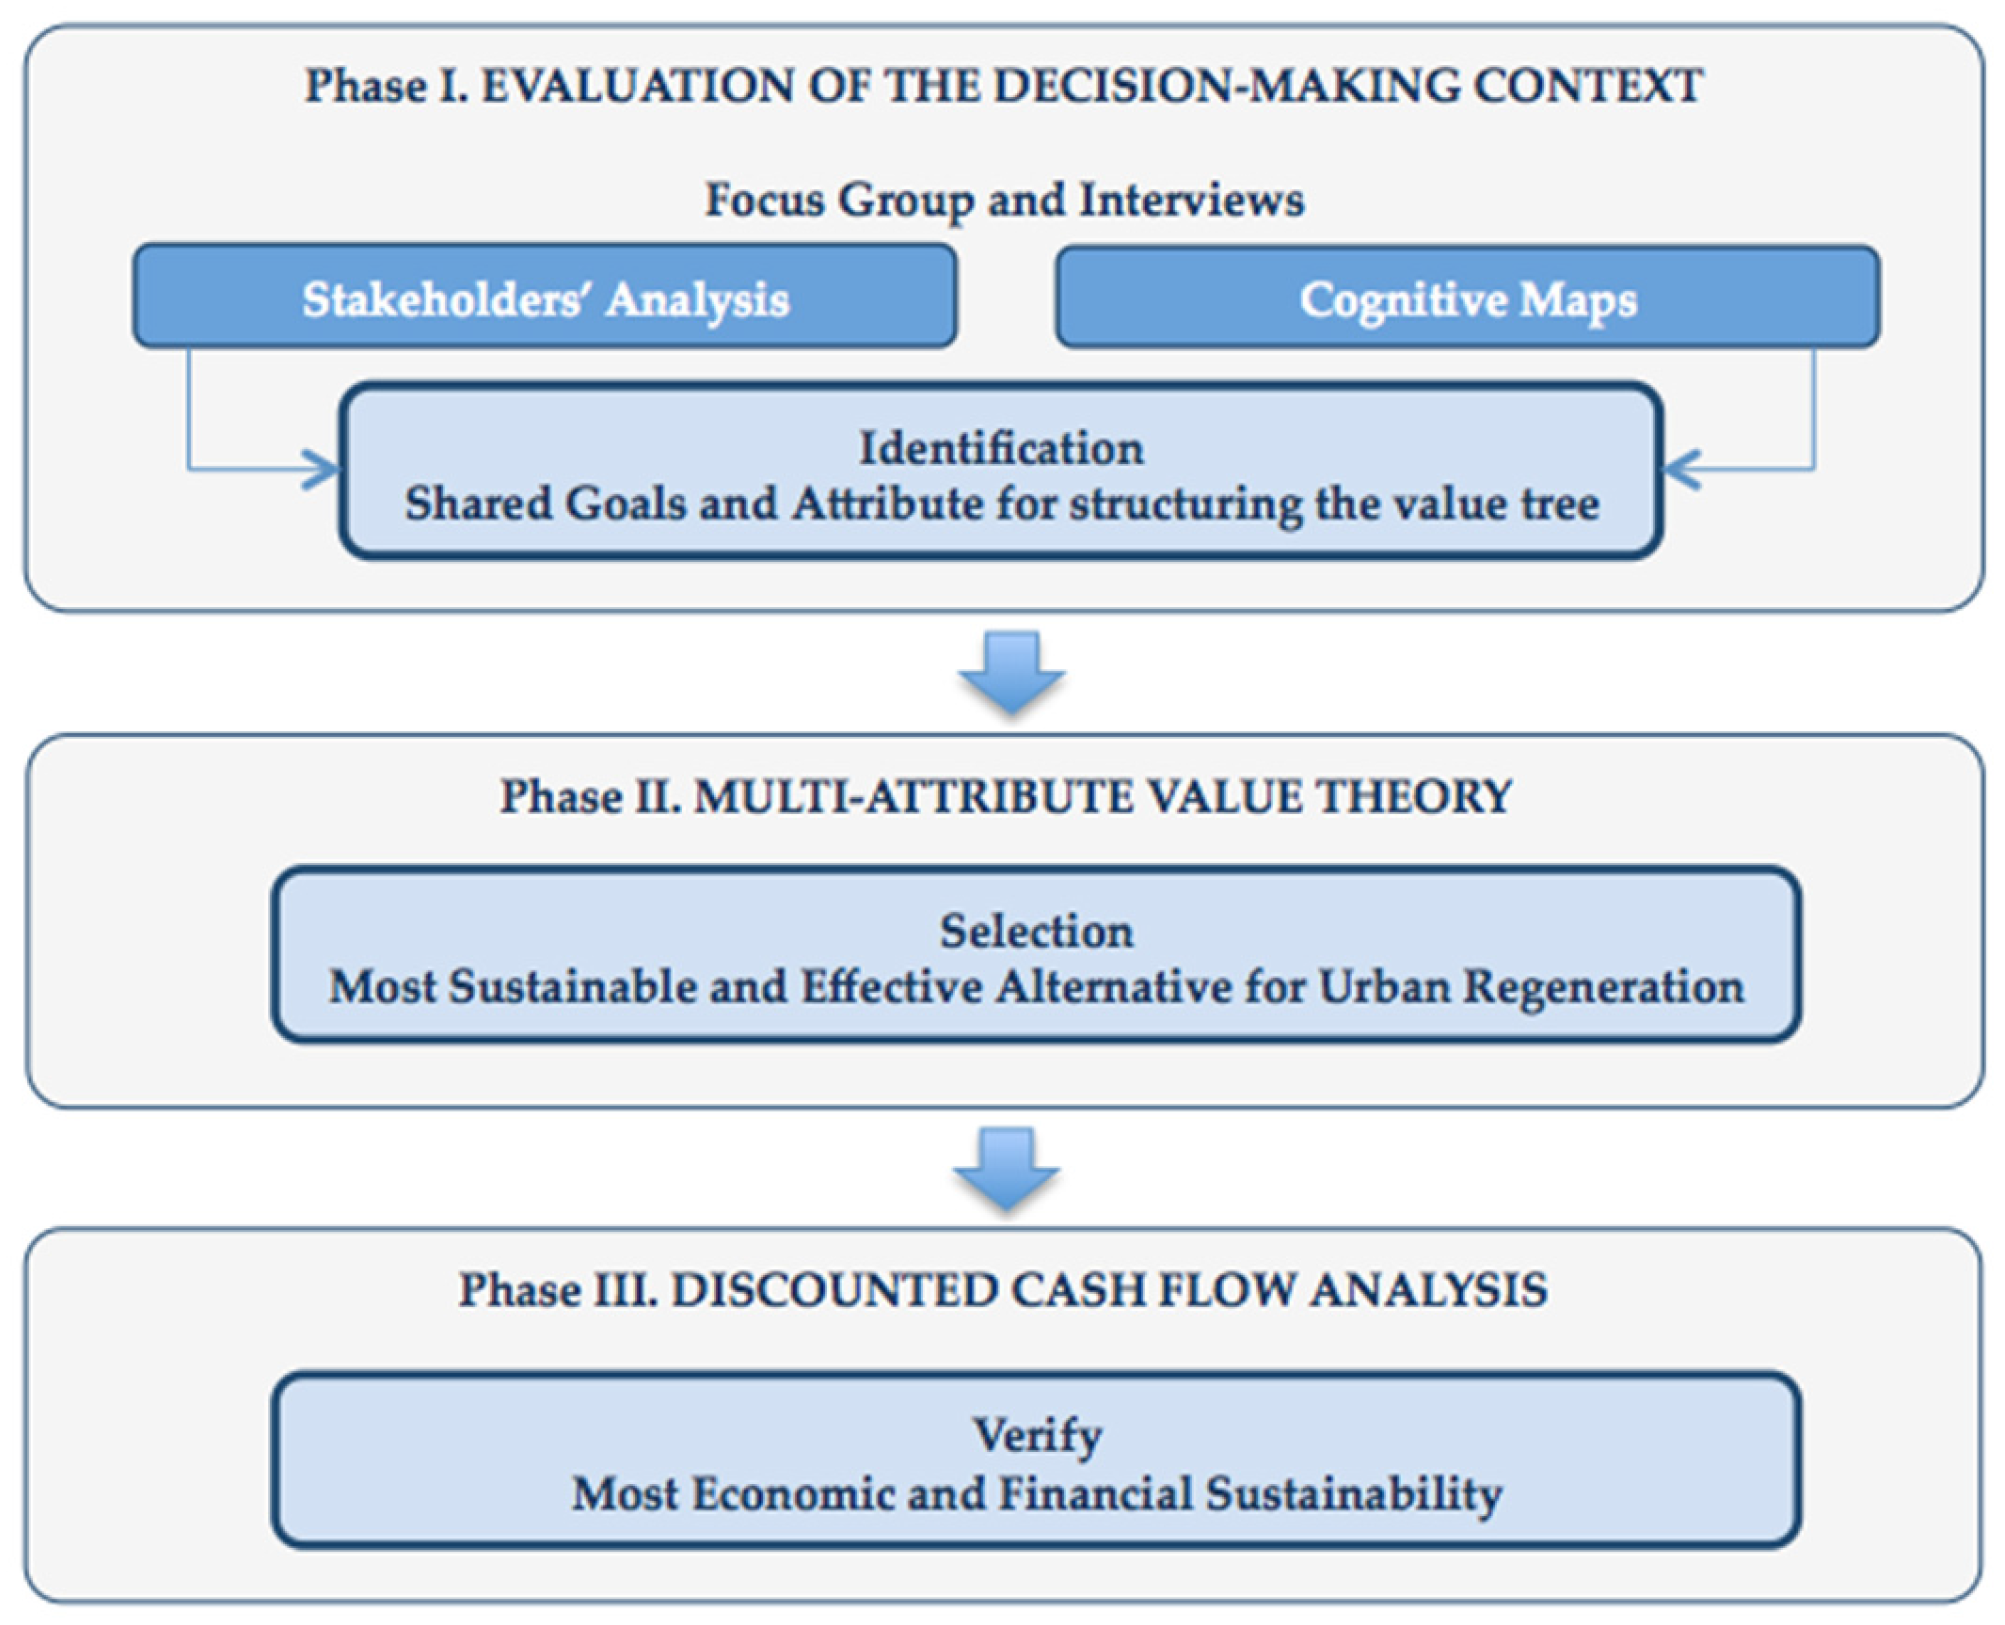
The methodology is organized into three phases (Figure 2):
- Fase I: Decision-making context analysis: Stakeholders Analysis (SA) and Cognitive Maps (CM)
- Fase II: Multi-Attribute Value Theory (MAVT)
- Fase III: Discounted Cash Flow Analysis (DCFA)
3.1. Phase I: Evaluation of the Problem Context, Stakeholders Analysis, and Cognitive Maps
The first phase that supports any decision-making process on public policies, is the identification of stakeholders potentially involved in the process of transformation and their goals [40,41]. Therefore, Stakeholder Analysis (SA) is at the core of every possible theoretical model, as the analysis of stakeholder groups and their behavior plays an important role in strategic planning and evaluation of sustainability, as it allows us to identify conflicts at an early phase of the process [42].
Stakeholders can take different roles in the transformation process that can be synthesized into three main categories: promoters, operators, and users that represent individual or organizations able to influence actions and decision-making as they pursue goals related to the problem and its possible solution [40].
Identifying and studying stakeholders involved in a decision-making problem is particularly important in the field of public decision-making as key personalities can be invited to participate in brainstorming sessions. For this aim, there are different interdisciplinary techniques and approaches that can identify and discuss the purposes to be pursued [43]. Indeed, scientific research has proved that the identification of key goals related to some decision is not an easy task and, without support, people are often not aware of half the goals that are pertinent to them [44,45].
Using SA, the management of the decision-making process can provide a better context on communication and stakeholder relationships’ capacity to influence the plan/project and its implementation. The existence of different points of view allows us to imagine different approaches to the problem, different intervention methods, and different decision-making processes. That is, the complexity increases the number of possible alternatives and is often an important asset [14].
Through the evaluation of the examined problematic context, it was possible to identify the dominant and significant figures of its territory. They have been identified among local institutions, groups, and influential associations, experts and representatives from the dominant economic sectors (restaurateurs, hoteliers, and merchants), and prevalent users like tourists and citizens [16,20]. Stakeholders were differentiated into three principal groups: promoters, operators, and users. The first group includes institutions and experts: they have a high influence on choices oriented to the public weal thanks to many factors like their knowledge, skills, strategic position, and representativeness. The operators of accommodating and productive activities belong to the second group, but also associations that have a high degree of interest and a significant influence on choices referred to the pursuit of their aims (operators in the dominant economic sectors). Finally, the third group includes citizens and tourists who have high interest but low influence. This category is represented by subjects with no instruments and tools to express their interests in a strong and homogeneous way and they often coincide with the beneficiaries of public policy [22,27].
Once the stakeholders are identified, the next phase of analysis of points of view and perceptions was structured by submitting to a stakeholder sample some interviews with the support of the CATWOE approach (clients, actors, transformations, world views, owners, environment) [46] and by organizing appropriate focus groups on the most important themes.
The CATWOE approach is suitable for analyzing the roots of a decision-making problem by offering the opportunity for interviewees to express their opinions deeply and arguably.
The results of the analyses were decoded and interpreted by a research group to allow the identification of strengths and weaknesses of the territory under consideration and to identify future transformation scenarios and their implementation strategies. In this phase, we used the Ishikawa diagram [47] (also called a cause–effect diagram or Fishbone diagram [48]), which identifies the most probable causes of a problem and has allowed us to classify strengths and weaknesses on the basis of their relevance, highlighted through an appropriate evaluation scale (high relevance, mean relevance, low relevance), coordinating it with a color scale.
The elaboration of Cognitive Maps (CM) from the verbal protocol of an interview allows us to structure the contents of interviews from a formal and methodological point of view and analyze qualitative data [20,43]. In addition, the use of CM means representing a system of concepts in order to identify the relationships between them, and communicate the nature of the decision-making problem and the related implications.
The use of CM in order to structure problems before the application of Multi-Criteria Decision Analysis (MCDA) has been discussed by various authors [49,50,51]. In this paper, SA has been integrated with CM in order to follow a more inclusive approach for the identification of the objectives and relevant attributes that are most often shared (Figure 3), which is useful in structuring the subsequent evaluation through Multi-Attribute Value Theory (MAVT).
In conclusion, the stakeholder analysis of decision-making process highlighted that this decision-making network is characterized by high complexity due to different groups of stakeholders being at different levels and having conflicting goals. In this sense, the use of a formal decision support system is very useful to help with decision-making.
3.2. Phase II: Multi-Attribute Value Theory (MAVT) Application for Selection of the Most Coherent Project for Urban Regeneration
On the topic of urban sustainability, there is a broad consensus of opinion that the transformations of the territory are complex decision-making problems and require a multidimensional, transdisciplinary, and pluralistic approach that can integrate and synthesize the multiple perspectives that can be adopted, using the available information, both hard and soft. The plurality of scenarios and possible solutions makes evaluation a tool of fundamental importance for comparing different alternatives and choosing a shared solution, as well as to ensure a progressive increase of knowledge on decision-making [3].
For that purpose, the methodology that supports the integrated decision process, proposed in this case study, uses a specific Multi-Criteria Decision Analysis (MCDA) [52,53], a valuable and increasingly common tool in order to support decision-making towards selecting the best compromise; it is more coherent and satisfying than competing options, and assists with meeting multiple goals.
The MCDA is particularly advantageous as a tool for the evaluation of sustainability in urban and territorial planning choices, where a wide range of environmental, social, and economic issues are to be considered and goals are often conflicting. In addition, MCDA has been considered an appropriate set of methods for the evaluation of sustainability due to its flexibility and ability to simplify the dialogue between stakeholders, analysts, and scientists [54,55].
Among the available MCDA approaches and methods, the present study focused on Multi-Attribute Value Theory (MAVT) [56], a well-studied and well-founded MCDA methodology and a relatively simple method. Indeed, multi-factor decisions research has suggested the use of simple, understandable, and usable approaches to solving decision-making problems [57].
From a methodological point of view, MAVT can deal with problems that involve a finite and discrete set of alternative options that must be evaluated on the basis of conflicting goals. Being able to organise quantitative and qualitative data, MAVT plays a crucial role in environmental decision-making and policy planning, where many aspects are often intangible [58]. For each of them, it is necessary to identify one or more different criteria/attributes, generally with different scale sizes, to measure performance against a given goal [56].
The performances of the two intervention options have been evaluated through the MAVT in relation to the “values at stake”: objectives and attributes that are shared in the first phase and organized according to the value tree [56,59] (Figure 3). In this way it will be possible to identify the most shared and effective urban regeneration alternative.
The process and structure of MAVT are illustrated in the literature [50,59] and structured in three steps.
The first step is crucial to define the problem, and involves identifying and structuring the key goals and related criteria/attributes (that is, the measurable features used to quantify goals and evaluate their performance).
Figure 3 shows the set of attributes that have been identified for the evaluation of the two analyzed alternatives and organized according to the value tree approach [56,59]. It should be noted that these attributes derive from the analysis of the problematic context, SA, and related CM that are described in the previous section. In particular, the evaluation attributes are the technical translation of the objectives and needs of stakeholders [60,61] that were identified by the UrbanLab research group. Along this line, the evaluation criteria listed in Figure 3 represent the interests and concerns of the different stakeholder groups identified in the previous phase.
The proposed model considers the full range of possible impacts of the alternatives under consideration. In particular, the evaluation gives consideration to the following attributes: (1) environmental aspects concerning the effects of transformation in terms of pollution, consumption of natural resources, and green areas; (2) social aspects, referring to the multiple consequences of interventions affecting the population, considering inhabitant services, public security, integration, and social inclusion; (3) economic aspects that represent the possible interconnection points of the operation with the economic system, such as job creation or synergies with local economic activity; the feasibility is also considered in terms of investment development and profitability; (4) aspects of urban planning that give consideration to both accessibility and mobility elements, as well as aspects related to the density and gridlock of the area; (5) mobility aspects related to accessibility of public transport and parking areas. These criteria were used to identify the best compromise between the two alternatives under consideration.
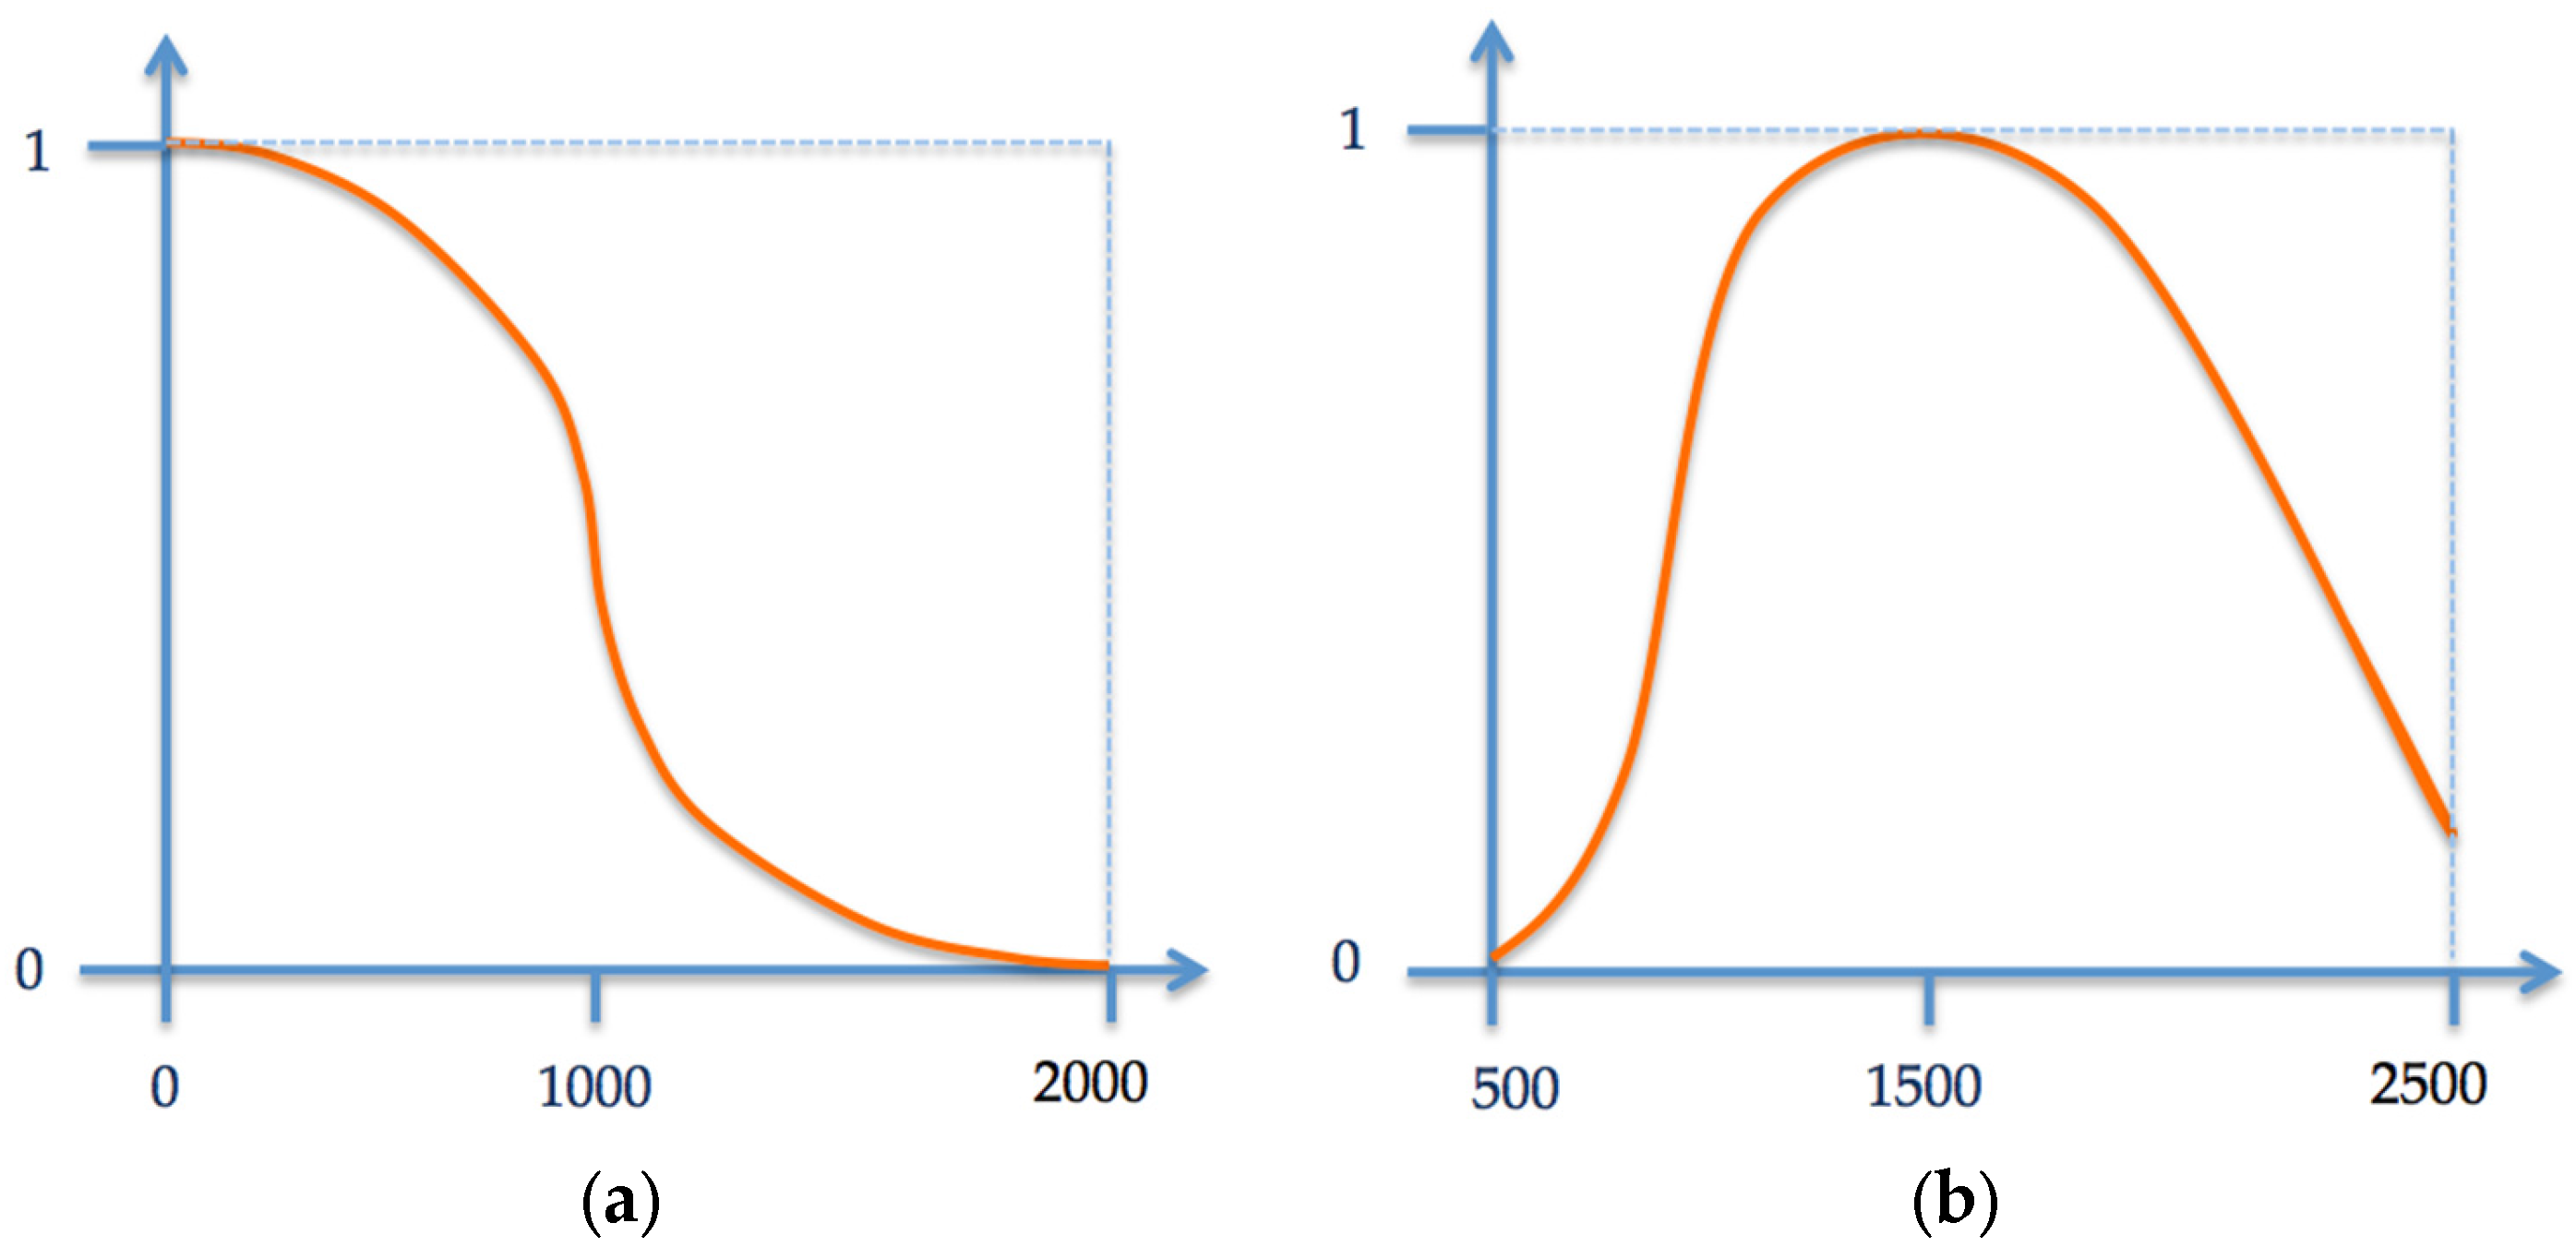
The second step is to evaluate and obtain a general ranking of the alternative options. Once the alternative options are definided, is necessary to determine the perfomance level of each attribute for each alternative. In order to combine the attributes identified (Figure 3) and obtain a general ranking of alternatives, the MAVT approach requires the creation of a value function [39]. Following the MAVT method, each criterion is described by a value function that allows us to scale the attributes between 0 (worst performance and minimum objective effects) and 1 (better performance and high-end results) to compare incommensurable elements. This step, contrary to the subsequent preferential excitement, which is more subjective, must be as objective as possible and preferably made by experts.
Figure 4 shows, for example, the value of attributes related to pollution level and parking spaces.
In the third step, once the alternatives are evaluated, it is necessary to define the importance of the different attributes used in decision-making. For the estimation of the weights, in this case, a method of rating was used, often applied in planning practice. This type of method requires the interlocutor to assign a predetermined number of points (e.g., 100) to the criteria, identified in such a way that the number of points assigned to each criterion reflects its relative importance [62].
In this study, the importance of the different attributes was assessed by a multidisciplinary team of experts chosen in light of their specific knowledge in the fields of architecture, urban planning, sociology, environmental engineering, urban planning, and economic evaluation. For criteria evaluation, each expert must answer a detailed questionnaire pertaining to his specific field, while for the evaluation of objectives the questionaire was completed by all the experts.
Appendix C shows the overall results of the MAVT application. It is possible to note that, between the two alternatives, Alternative A is the favorite one for the Ex-Exhibition Center of Pentimele (Figure 1b).
These results were further studied by developing a sensitive analysis of general objectives’ weights that confirms the solidity of the model. Table 1 shows a summary of the results for the three different scenarios. Detailed scenarios are available in Appendix C (Table A12, Table A13 and Table A14).
3.3. Phase III: Discounted Cash Flow Analysis
Following the multi-phase approach in this third and last phase, outlined in Section 2, a Discounted Cash Flow Analysis (DCFA) was developed to verify the economic and financial sustainable and feasibility of Area A—Ex-Exhibition Center of Pentimele.
The evaluation of investment projects, with the simple use of synthetic economic and financial indicators [63,64,65], allows the decision maker to evaluate whether the program has sufficient profitability for the developers that will be involved in the next phase of implementation and management.
In addition, through DCFA it is possible to evaluate, among different scenarios, the option that has a passing level of profitability, and thus to identify the more “attractive” scenario for developers.
Preliminary to DCFA is the definition of a masterplan and two alternative functional scenarios. Scenario 1 includes the Congress Centers with the Hotel and Residence (Figure 5); Scenario 2 (derived from Scenario 1) only includes the Congress Center and Hotel without the presence of a Residence.
The option of including the residence typology is justified by an opportunity to diversify and seasonalize demand, allowing the developer to increase its profitability and reduce production costs, as a residence has a lower level of finish than a hotel.
On the basis of the functional Scenario 1 (Figure 5), a preliminary evaluation of the relative areas was made in addition to a market estimate of the expected benefits related to foreseen income from rent and functional activities and finally an estimate of production, management, and maintenance costs (Appendix A: Table A2, Table A3, Table A4, Table A5, Table A6 and Table A7).
Once the expected costs and benefits of Scenario 1 are estimated, it was easy to deduce technical and economic quantities for Scenario 2, which will be used in the next study on cash flow.
Finally, on the basis of technical and economic data of the two scenarios, it was possible to develop DCFA on the annual employment rate of 20% that is recorded for similar structures in the same context (see Scenarios 1a and 1b, Table A8 and Table A10). In addition, two more scenarios have been developed with a higher employment rate of 30% derived from the two previous scenarios. Therefore, DCFA in the Appendix B (Table A8, Table A9, Table A10 and Table A11) has been made with respect to the following four scenarios:
- 1a. Congress Center–Hotel with an occupancy rate of 20%;
- 1b. Congress Center–Hotel with an occupancy rate of 30%.
- 2a. Congress Center–Hotel–Residence with an occupancy rate of 20%;
- 2b. Congress Center–Hotel–Residence with an occupancy rate of 30%;
In addition to giving consideration to all costs (production, management, and maintenance) and revenues, the analyses are developed by taking into account these factors:
- time period of 10 years, expected average return time for a private promoter;
- discount rate of 5%, understood as opportunity cost of capital invested in different operations, and calculated on the basis of the market conditions connected to the analysis period;
- debt capital of 45% for the cost of production with a passive interest at 8%; as a matter of fact, from a methodological point of view, the DCFA should be pre-tax as the rates could be a deductible cost and therefore a benefit; in this case the intention was to know the incidence of the rate on the cash flows;
- depreciation of the work by 20% at the end of the 10-year period; the hypothesis is that, at the end of this period, the structure may be alienated;
- capital contribution corresponding to 15% of the cost of construction; assuming that the intervention could be part of the public and private partnership (P.P.P.) through an iterative process, the minimum value that the public operator would invest in making the financial intervention sustainable was obtained.
All scenarios show a positive value of Net Present Value (NPV) (see Appendix A: Table A1, Table A2, Table A3 and Table A4); higher values indicate more profitable interventions and the presence of the residence increases its value due to the higher occupancy rate (more of the 30%). As a consequence, the variable that most influences the sustainability and feasibilty of the project is the occupancy rate, which highlights the correlation between the Congress Center and the accommodating facilities.
Promoting the metropolitan area of Reggio Calabria as a new venue for events and providing it with an adequate structure would mean attracting new attendees, distributed over a longer period and not only concentrated in the summer season. In the hypothesis that the congress center only has as a function the auditorium hall, occuped at least eight times a year, with a capacity of 1400 people this means increasing the number of arrivals in the city of about 11,000. This would mean an annual increase in arrivals of almost 18% compared to the current 61,000 (ISTAT data). The intervention would not only have direct employment implications, but would have significant economic implications for the city. There are, however, many critical aspects that may call into question the success of the proposal (costs of management, maintenance, unforeseen risks of demand).
This paper, which represents a synthesis of the study, demonstrates how the economic evaluation approach at the early programming phases of urban development strategies allows us to forecast effects according to different development scenarios. The evaluation, if integrated in the decision-making process, can offer decision makers a range of alternative options in order to choose more objectively on the basis of shared purposes and strategies.
At a more advanced stage of the study, the results can be further verified by sensitivity analysis of some variables in order to examine the effects of such variations on NPV and IRR profitability indicators.
4. Discussion
The multi-methodological approach, described in this paper and applied to a case study, has been successfully applied to urban planning to assess the various alternative options based on their impact on the built and natural environment as well as the socioeconomic and institutional context.
At the same time, in applying the methodology in the case study, it is possible to highlight some of the criticalities that may arise in some cases in comparison with context specificities and others in the application of techniques. Data collection requires careful selection of information from reliable and up-to-date sources, as well as the availability of stakeholders identified to collaborate on decision-making. Cognitive mapping helps identify shared preferences but requires long implementation and processing times.
Another critical issue is that the evaluation carried out using the MAVT method should not only be related to expert knowledge but should allow for an effective interaction between different points of view. The use of the MAVT approach within a stakeholder assembly would make preferences explicit and activate an incremental evaluation process that will allow us to deal with conflicts and build converging coalitions into shared visions.
A methodological course elaborated according to the proposed model requires that the construction of the cognitive framework develops over time and combines the design of project choices, constantly feeding new contributions and providing new incentives to guide the selection of information, identification of values, analysis of conflicts, and building of shared preferences oriented to the elaboration of transformation scenarios in order to respond to the needs of decision-making contexts characterized by complexity and uncertainty.
Through a flexible and adaptive methodology combining both qualitative and quantitative methods of evaluation and participatory stakeholder engagement, it is possible to build complex urban transformation strategies and promote good governance processes capable of enhancing local deliberative democracy by activating an effective collaboration between promoters, operators, and users. Furthermore, with the support of integrated evaluation approaches, it is also possible to develop a systemic and active form of preparation for change as a basis for shared actions in a long-term vision aimed at effectively developing and building public decision-making.
5. Conclusions
The interdisciplinary and participatory pathway developed in this study, through the combined use of different evaluation tools, provides an operational framework that supports and sustains complex urban planning and design policies for urban regeneration [66], with particular reference to disused or abandoned central urban areas [57]. This approach has allowed to us translate integrated evaluative approaches into complex evaluation systems that can support a shared and transparent planning choices, according to a bottom-up approach.
The experimentation, structured in this way, is located within a broader research course, utilizing the contribution and results of evaluation experiences that are tested in other contexts [9,10,11,15,16,20,22,27,28,29,30,67], aiming at delineating incremental and coherent decision-making processes [9,11,15,27,29].
The interaction between different knowledge, approaches, and tools allows us to formulate scenarios, strategies, and actions, contributing to the creation of richer and more complex regional knowledge and to building more bottom-up sharing and transformation strategies [8,9,68]. The transformation strategies were supported by a decision-making process devoted to understanding needs and identifying “complex values” [27]. Local reality, with its normative, spatial, temporal, cultural, social, and cognitive characteristics, is the context in which design and planning responses can be defined [69,70,71].
In the field of experimentation, the application of an integrated and multi-methodological approach has allowed us not only to explore possible solutions, to take into account various multidimensional components, tangible and intangible relationships, and perceptions of stakeholders, but also to support decision-making processes with reference to a long-term approach.
The proposed methodology, in conclusion, shows promising effectiveness in supporting complex urban transformations, in which a considerable number of constraints—coming from a wide and diverse community of actors and stakeholders—affect the planning and design process. Continuous feedback is key to this approach, whose purpose is not to define the “best” solution (if one exists) but instead to identify the most shared one.
Author Contributions
The contribution is the result of the joint work of the four authors. The paper must be attributed in equal parts to the authors. However, Lucia Della Spina wrote the article and structured the methodology applied to the case study. Raffaele Scrivo has prepared preliminary analyzes for case studies and developed DCFA related, Angela Viglianisi and Immacolata Lorè have developed the MAVT multicriteria analysis applied to the case study.
Conflicts of Interest
The authors declare no conflict of interest.
Appendix A

Table A1.
First hypothesis of functional program and sizing.
| Congress Center—Private Spaces | m2 Covered Surface | |
| Auditorium | 1540 | |
| Conference rooms/hall and foyer | 968 | |
| Storage | 400 | |
| Restaurant/café | 1000 | |
| Total A | 3908 | |
| Congress Center—Public Spaces | m2 | |
| Foyer | 400 | |
| Exposition Area | 400 | |
| Press room/VIP area | 140 | |
| Commercial spaces | 1000 | |
| Total B | 1940 | |
| Total A + B | 5848 | |
| 4-/5-Star Hotel | m2 | |
| Beds | 0 | |
| Suite | 0 | |
| Swimming pool area | 160 | |
| Wellness Center | 160 | |
| Service space | 1500 | |
| Total | 1820 | |
| Residence | m2 | |
| Accommodating facilities | 1300 | |
| External Areas | m2 | |
| A + B—Congress Center | ||
| Outdoor parking/bus terminal | ||
| Hotel and Residence | 7000 | |
| Outdoor parking | 5000 |
Table A2.
Summary of production costa.
| Summary of Production Cost | Euros |
|---|---|
| Congress Center | 10.660.800,00 |
| Hotel (4/5 stars) | 15.284.000,00 |
| Residence | 2.080.000,00 |
| Purchase of the area | 3.600.000,00 |
| Total | 31.624.800,00 |
Table A3.
Summary of management and maintenance costs—congress center.
| Summary of Management and Maintenance Costs—Congress Center | Euros |
|---|---|
| Management Cost | 600.000,00 |
| Maintenance Cost | 648.800,00 |
| Total | 1.248.800,00 |
Table A4.
Summary of management and maintenance costs—hotel and residence.
| Summary of Management and Maintenance Costs—Hotel and Residence | Euros |
|---|---|
| Annual Management Cost (60%–70% staff cost) | 1.170.571,43 |
| Maintenance Cost (every five years) | 1.676.000,00 |
| Total | 2.846.571,43 |
Table A5.
Summary of income—congress center (euros/year).
| Summary of Income—Congress Center (Euros/Year) | Euros |
|---|---|
| Congress Center—private spaces: | |
| Auditorium | 28.000,00 |
| Other rooms/hall and foyer | 163.200,00 |
| Restaurants/café | 392.000,00 |
| Total of Congressional activities | 583.200,00 |
| Congress Center—public spaces: | |
| Exposition Area | 18.000,00 |
| Commercial space | 240.000,00 |
| Total of complementary activities | 258.000,00 |
| Total (Euro/annual) | 841.200,00 |
Table A6.
Summary of income—hotel.
| Summary of Income—Hotel (Euros/Year) | Euros |
|---|---|
| Income with an expected occupancy rate of 20% | 1.533.000,00 |
| Income with an expected occupancy rate of 30% | 2.299.500,00 |
Table A7.
Summary of income—residence.
| Summary of Income—Residence (Euros/Year) | Euros |
|---|---|
| Income off season (50% occupancy rate) | 50.400,00 |
| Income at high season (100% occupancy rate) | 89.600,00 |
| Income out of season (30% occupancy rate) | 58.800,00 |
| Total annual income | 198.800,00 |
Appendix B
Table A8.
Scenario 1a: Congress Center–Hotel with an Occupancy Rate of 20%.
| Annual Revenues Costs (€) | 40% of Own Capital (€) | Revenues Costs Distribuited on 10 Years (€) | Year of Construction 1 (€) | Year of Construction 2 (€) | Year of Construction 3 (€) | Year 1 (€) | Year1 + n… (€) | Year 10 (€) | ||
|---|---|---|---|---|---|---|---|---|---|---|
| Acquisition cost of the area | 3.600.000,00 | 3.600.000,00 | ||||||||
| Total | 3.600.000,00 | 3.600.000,00 | 3.600.000,00 | |||||||
| Realization costs | ||||||||||
| Congress Center | 10.380.800,00 | 10.380.800,00 | ||||||||
| Parking/ bus terminal | 280.000,00 | 280.000,00 | ||||||||
| 4/5 star hotel | 17.352.000,00 | 17.352.000,00 | ||||||||
| Parking | 200.000,00 | 200.000,00 | ||||||||
| Total of Realization Costs + Area | 31.812.800,00 | 31.812.800,00 | 3.600.000,00 | |||||||
| Management and Maintenance Costs | €/m2 | |||||||||
| Management Costs of the Congress Center | 92,48 | 600.000,00 | 600.000,00 | 600.000,00 | 600.000,00 | |||||
| Maintenance Costs of the Congress Center | 100,00 | 648.800,00 | 1.297.600,00 | 648.800,00 | ||||||
| Management Costs of the receptive activity | 145,33 | 1.401.000,00 | 1.401.000,00 | 1.401.000,00 | 1.401.000,00 | |||||
| Maintenance Costs of the receptive activity | 200,00 | 1.928.000,00 | 3.856.000,00 | 1.928.000,00 | ||||||
| Total of Management and Maintenance Costs | 4.577.800,00 | 2.001.000,00 | 2.001.000,00 | 4.577.800,00 | ||||||
| Revenues | ||||||||||
| Revenues of Congress and private spaces activities | 583.200,00 | 583.200,00 | 583.200,00 | 583.200,00 | ||||||
| Revenues of complementary activities Congress Center and public spaces | 258.000,00 | 258.000,00 | 258.000,00 | 258.000,00 | ||||||
| Revenues of Hotel activity | 1.921.360,00 | 960.680,00 | 1.441.020,00 | 1.921.360,00 | ||||||
| Total of Revenues | 2.762.560,00 | 1.801.880,00 | 2.282.220,00 | 2.762.560,00 | ||||||
| Management balance net of financial contributions and finance charges | −7.200.000,00 | −199.120,00 | 281.220,00 | −1.815.240,00 | ||||||
| Capital contribution | % | |||||||||
| 15% on Realization Cost | 15% | 4.771.920,00 | 477.192,00 | 2.863.152,00 | 1.431.576,00 | |||||
| Residual value | 20% | |||||||||
| 80% of the cost value of realization | 100% | 31.812.800,00 | 6.362.560,00 | 25.450.240,00 | ||||||
| Economic flow | −6.722.808,00 | 2.863.152,00 | 1.431.576,00 | −199.120,00 | 281.220,00 | −1.815.240,00 | ||||
| Loan capital | % | |||||||||
| 45% of the cost value of realization | 45% | 14.315.760,00 | ||||||||
| Finance charges | ||||||||||
| esposizione | annual | −6.722.808,00 | 2.863.152,00 | 1.431.576,00 | −199.120,00 | 281.220,00 | −1.815.240,00 | |||
| interest payable (mortage) | 8.00% | 2.133.470,39 | 2.133.470,39 | 2.133.470,39 | ||||||
| interest receiveable | 1.00% | |||||||||
| Flow of finances | −6.722.808,00 | 2.863.152,00 | 1.431.576,00 | −2.332.590,39 | −1.852.250,39 | 21.501.529,61 | ||||
| annual | ||||||||||
| Discount rate | 5.00% | |||||||||
| Net Present Value (NPV) (€) | 83.132,14 | |||||||||
| Internal Rate of Return (IRR) | 5.11% | |||||||||
Table A9.
Scenario 1b: Congress Center–Hotel with an Occupancy Rate of 30%.
| Annual Revenues Costs (€) | 40% of Own Capital (€) | Revenues Costs Distribuited on 10 Years (€) | Year of Construction 1 (€) | Year of Construction 2 (€) | Year of Construction 3 (€) | Year 1 (€) | Year1 + n… (€) | Year 10 (€) | ||
|---|---|---|---|---|---|---|---|---|---|---|
| Acquisition cost of the area | 3.600.000,00 | 3.600.000,00 | ||||||||
| Total | 3.600.000,00 | 3.600.000,00 | 3.600.000,00 | |||||||
| Realization costs | ||||||||||
| Congress Center | 10.380.800,00 | 10.380.800,00 | ||||||||
| Parking/ bus terminal | 280.000,00 | 280.000,00 | ||||||||
| 4/5 star hotel | 17.352.000,00 | 17.352.000,00 | ||||||||
| Parking | 200.000,00 | 200.000,00 | ||||||||
| Total of Realization Costs + Area | 31.812.800,00 | 31.812.800,00 | 3.600.000,00 | |||||||
| Management and Maintenance Costs | €/m2 | |||||||||
| Management Costs of the Congress Center | 92,48 | 600.000,00 | 600.000,00 | 600.000,00 | 600.000,00 | |||||
| Maintenance Costs of the Congress Center | 100,00 | 648.800,00 | 1.297.600,00 | 648.800,00 | ||||||
| Management Costs of the receptive activity | 145,33 | 1.401.000,00 | 1.401.000,00 | 1.401.000,00 | 1.401.000,00 | |||||
| Maintenance Costs of the receptive activity | 200,00 | 1.928.000,00 | 3.856.000,00 | 1.928.000,00 | ||||||
| Total of Management and Maintenance Costs | 4.577.800,00 | 2.001.000,00 | 2.001.000,00 | 4.577.800,00 | ||||||
| Revenues | ||||||||||
| Revenues of Congress and private spaces activities | 583.200,00 | 583.200,00 | 583.200,00 | 583.200,00 | ||||||
| Revenues of complementary activities Congress Center and public spaces | 258.000,00 | 258.000,00 | 258.000,00 | 258.000,00 | ||||||
| Revenues of Hotel activity | 1.921.360,00 | 1.441.020,00 | 3.472.172,00 | 2.882.040,00 | ||||||
| Total of Revenues | 2.762.560,00 | 2.282.220,00 | 4.313.372,00 | 3.723.240,00 | ||||||
| Management balance net of financial contributions and finance charges | −7.200.000,00 | 281.220,00 | 2.312.372,00 | −854.560,00 | ||||||
| Capital contribution | % | |||||||||
| 15% on Realization Cost | 15% | 4.771.920,00 | 477.192,00 | 2.863.152,00 | 1.431.576,00 | |||||
| Residual value | 20% | |||||||||
| 80% of the cost value of realization | 100% | 31.812.800,00 | 6.362.560,00 | 25.450.240,00 | ||||||
| Economic flow | −3.122.808,00 | 2.863.152,00 | 1.431.576,00 | 281.220,00 | 2.312.372,00 | −854.560,00 | ||||
| Loan capital | % | |||||||||
| 45% of the cost value of realization | 45% | 14.315.760,00 | ||||||||
| Finance charges | ||||||||||
| esposizione | annual | −3.122.808,00 | 2.863.152,00 | 1.431.576,00 | 281.220,00 | 2.312.372,00 | −854.560,00 | |||
| interest payable (mortage) | 8.00% | 2.133.470,39 | 2.133.470,39 | 2.133.470,39 | ||||||
| interest receiveable | 1.00% | |||||||||
| Flow of finances | −3.122.808,00 | 2.863.152,00 | 1.431.576,00 | −1.852.250,39 | 178.901,61 | 22.462.209,61 | ||||
| annual | ||||||||||
| discount rate | 5.00% | |||||||||
| Net Present Value (NPV) (€) | 8.411.311,41 | |||||||||
| Internal Rate of Return (IRR) | 20.74% | |||||||||
Table A10.
Scenario 2a: Congress Center–Hotel–Residence with an Occupancy Rate of 20%.
| Annual revenues costs (€) | 40% of own capital (€) | Revenues Costs distribuited on 10 years (€) | year of construction 1 (€) | year of construction 2 (€) | year of construction 3 (€) | year 1 (€) | year1 + n… (€) | year 10 (€) | ||
|---|---|---|---|---|---|---|---|---|---|---|
| Acquisition cost of the area | 3.600.000,00 | 3.600.000,00 | ||||||||
| Total | 3.600.000,00 | 3.600.000,00 | 3.600.000,00 | |||||||
| Realization costs | ||||||||||
| Congress Center | 10.380.800,00 | 10.380.800,00 | ||||||||
| Parking/ bus terminal | 280.000,00 | 280.000,00 | ||||||||
| 4/5 star hotel | 15.084.000,00 | 15.084.000,00 | ||||||||
| Parking | 200.000,00 | 200.000,00 | ||||||||
| Residence | 2.080.000,00 | 2.080.000,00 | ||||||||
| Total of Realization Costs + Area | 31.624.800,00 | 31.624.800,00 | 3.600.000,00 | |||||||
| Management and Maintenance Costs | €/mq | |||||||||
| Management Costs of the Congress Center | 92,48 | 600.000,00 | 600.000,00 | 600.000,00 | 600.000,00 | |||||
| Maintenance Costs of the Congress Center | 100,00 | 648.800,00 | 1.297.600,00 | 648.800,00 | ||||||
| Management Costs of the receptive activity | 139,69 | 1.170.571,43 | 1.170.571,43 | 1.170.571,43 | 1.170.571,43 | |||||
| Maintenance Costs of the receptive activity | 200,00 | 1.676.000,00 | 3.352.000,00 | 1.676.000,00 | ||||||
| Total of Management and Maintenance Costs | 4.095.371,43 | 1.170.571,43 | 1.170.571,43 | 4.095.371,43 | ||||||
| Revenues | ||||||||||
| Revenues of Congress and private spaces activities | 583.200,00 | 583.200,00 | 583.200,00 | 583.200,00 | ||||||
| Revenues of complementary activities Congress Center and public spaces | 258.000,00 | 258.000,00 | 258.000,00 | 258.000,00 | ||||||
| Revenues of Hotel activity | 1.533.000,00 | 766.500,00 | 1.149.750,00 | 1.533.000,00 | ||||||
| Revenues of Residence activity | 198.800,00 | 198.800,00 | 198.800,00 | 198.800,00 | ||||||
| Total of Revenues | 2.573.000,00 | 1.806.500,00 | 2.189.750,00 | 2.573.000,00 | ||||||
| Management balance net of financial contributions and finance charges | −7.200.000,00 | 35.928,57 | 419.178,57 | −1.522.371,43 | ||||||
| Capital contribution | % | |||||||||
| 15% on Realization Cost | 15% | 4.743.720,00 | 474.372,00 | 2.846.232,00 | 1.432.116,00 | |||||
| Residual value | 20% | |||||||||
| 100% of the cost value of realization | 100% | 31.624.800,00 | 6.324.960,00 | 25.299.840,00 | ||||||
| Economic flow | −6.725.628,00 | 2.846.232,00 | 1.432.116,00 | 35.928,57 | 419.178,57 | −1.522.371,43 | ||||
| Loan capital | % | |||||||||
| 45% of the cost value of realization | 45% | 14.231.160,00 | ||||||||
| Finance charges | ||||||||||
| esposizione | annual | −6.725.628,00 | 2.846.232,00 | 1.432.116,00 | 35.928,57 | 419.178,57 | −1.522.371,43 | |||
| interest payable (mortage) | 8.00% | 2.120.862,50 | 2.120.862,50 | 2.120.862,50 | ||||||
| interest receiveable | 1.00% | |||||||||
| Flow of finances | −6.725.628,00 | 2.846.232,00 | 1.432.116,00 | −2.084.933,93 | −1.701.683,93 | 21.656.606,07 | ||||
| annual | ||||||||||
| discount rate | 5.00% | |||||||||
| NPV (€) | 1.076.169,75 | |||||||||
| IRR | 6.51% | |||||||||
Table A11.
Scenario 2b: Congress Center–Hotel–Residence with an Occupancy Rate of 30%.
| Annual Revenues Costs (€) | 40% of Own Capital (€) | Revenues Costs Distribuited on 10 Years (€) | Year of Construction 1 (€) | Year of Construction 2 (€) | Year of Construction 3 (€) | Year 1 (€) | Year1 + n… (€) | Year 10 (€) | ||
|---|---|---|---|---|---|---|---|---|---|---|
| Acquisition cost of the area | 3.600.000,00 | 3.600.000,00 | ||||||||
| Total | 3.600.000,00 | 3.600.000,00 | 3.600.000,00 | |||||||
| Realization costs | ||||||||||
| Congress Center | 10.380.800,00 | 10.380.800,00 | ||||||||
| Parking/ bus terminal | 280.000,00 | 280.000,00 | ||||||||
| 4/5 star hotel | 15.084.000,00 | 15.084.000,00 | ||||||||
| Parking | 200.000,00 | 200.000,00 | ||||||||
| Residence | 2.080.000,00 | 2.080.000,00 | ||||||||
| Total of Realization Costs + Area | 31.624.800,00 | 31.624.800,00 | 3.600.000,00 | |||||||
| Management and Maintenance Costs | €/mq | |||||||||
| Management Costs of the Congress Center | 92,48 | 600.000,00 | 600.000,00 | 600.000,00 | 600.000,00 | |||||
| Maintenance Costs of the Congress Center | 100,00 | 648.800,00 | 1.297.600,00 | 648.800,00 | ||||||
| Management Costs of the receptive activity | 139,69 | 1.170.571,43 | 1.170.571,43 | 1.170.571,43 | 1.170.571,43 | |||||
| Maintenance Costs of the receptive activity | 200,00 | 1.676.000,00 | 3.352.000,00 | 1.676.000,00 | ||||||
| Total of Management and Maintenance Costs | 4.095.371,43 | 1.170.571,43 | 1.170.571,43 | 4.095.371,43 | ||||||
| Revenues | ||||||||||
| Revenues of Congress and private spaces activities | 583.200,00 | 583.200,00 | 583.200,00 | 583.200,00 | ||||||
| Revenues of complementary activities Congress Center and public spaces | 258.000,00 | 258.000,00 | 258.000,00 | 258.000,00 | ||||||
| Revenues of Hotel activity | 1.533.000,00 | 1.149.750,00 | 2.770.350,00 | 2.299.500,00 | ||||||
| Revenues of Residence activity | 198.800,00 | 198.800,00 | 198.800,00 | 198.800,00 | ||||||
| Total of Revenues | 2.573.000,00 | 2.189.750,00 | 3.810.350,00 | 3.339.500,00 | ||||||
| Management balance net of financial contributions and finance charges | 419.178,57 | 2.039.778,57 | −755.871,43 | |||||||
| Capital contribution | % | |||||||||
| 15% on Realization Cost | 15% | 4.743.720,00 | 474.372,00 | 2.846.232,00 | 1.423.116,00 | |||||
| Residual value | 20% | |||||||||
| 100% of the cost value of realization | 100% | 31.624.800,00 | 6.324.960,00 | 25.299.840,00 | ||||||
| Economic flow | % | |||||||||
| 45% | 14.321.160,00 | |||||||||
| Loan capital | ||||||||||
| 45% of the cost value of realization | −6.725.628,00 | 2.846.232,00 | 1.423.116,00 | 419.178,57 | 2.039.778,57 | −755.871,43 | ||||
| Finance charges | ||||||||||
| esposizione | annual | −6.725.628,00 | 2.846.232,00 | 1.423.116,00 | 419.178,57 | 2.039.778,57 | −755.871,43 | |||
| interest payable (mortage) | 8.00% | 2.120.826,50 | 2.120.826,50 | 2.120.862,50 | ||||||
| interest receiveable | 1.00% | |||||||||
| Flow of finances | −6.725.628,00 | 2.846.232,00 | 1.423.116,00 | −1.701.683,93 | −81.083,93 | 22.423.106,07 | ||||
| annual | ||||||||||
| discount rate | 5.00% | |||||||||
| NPV (€) | 7.720.993,64 | |||||||||
| IRR | 19.15% | |||||||||
Appendix C
Table A12.
Overall MAVT Results—Scenario 1.
| Criteria | Criteria Weights | Attributes | Attributes Weights | Attributes Global Weights | Alternative | |||
|---|---|---|---|---|---|---|---|---|
| Standardized Scores | Global Score | |||||||
| Alternative A | Alternative B | Alternative A | Alternative B | |||||
| (a) | (b) | c = (a × b) | (e) | (f) | (c × e) | (c × f) | ||
| Economic Value | 0.15 | • Effect on local economic activities | 0.15 | 0.0225 | 1 | 0.8 | 0.023 | 0.018 |
| 0.15 | • Touristic activities | 0.14 | 0.021 | 1 | 0.2 | 0.021 | 0.004 | |
| 0.15 | • Commercial activities | 0.12 | 0.018 | 0.8 | 0.5 | 0.144 | 0.009 | |
| 0.15 | • Real estate improvement | 0.13 | 0.0195 | 0.6 | 0.6 | 0.012 | 0.012 | |
| 0.15 | • Employment opportunities | 0.16 | 0.024 | 0.75 | 0.5 | 0.018 | 0.012 | |
| 0.15 | • Investment costs and resources | 0.12 | 0.018 | 0.6 | 0.4 | 0.011 | 0.007 | |
| 0.15 | • Profitability | 0.18 | 0.027 | 1 | 0.6 | 0.027 | 0.016 | |
| 0.255 | 0.078 | |||||||
| Social Value | 0.26 | • Creation of new houses | 0.1 | 0.026 | 0.8 | 0.5 | 0.021 | 0.013 |
| 0.26 | • Integration | 0.16 | 0.0416 | 0.5 | 1 | 0.021 | 0.042 | |
| 0.26 | • Gentrification | 0.12 | 0.0312 | 0.6 | 0.4 | 0.019 | 0.012 | |
| 0.26 | • Public safety | 0.16 | 0.0416 | 0.8 | 0.8 | 0.033 | 0.033 | |
| 0.26 | • Creation of attractive functions | 0.18 | 0.0468 | 0.6 | 0.4 | 0.028 | 0.019 | |
| 0.26 | • Service for the population | 0.14 | 0.0364 | 1 | 0.4 | 0.036 | 0.015 | |
| 0.26 | • Sport and leisure activities | 0.14 | 0.0364 | 0.8 | 0.6 | 0.029 | 0.022 | |
| 0.187 | 0.155 | |||||||
| Environmental Value | 0.25 | • Land use | 0.14 | 0.035 | 0.5 | 0.5 | 0.018 | 0.018 |
| 0.25 | • Acustic emission | 0.16 | 0.04 | 1 | 0.6 | 0.040 | 0.024 | |
| 0.25 | • Resource cosumption | 0.15 | 0.0375 | 1 | 1 | 0.038 | 0.038 | |
| 0.25 | • Urban waste disposal | 0.15 | 0.0375 | 1 | 0.6 | 0.038 | 0.023 | |
| 0.25 | • Green areas | 0.15 | 0.0375 | 0.8 | 0.6 | 0.030 | 0.023 | |
| 0.25 | • Rehabilitation of polluted areas | 0.25 | 0.0625 | 0.8 | 1 | 0.050 | 0.063 | |
| 0.213 | 0.187 | |||||||
| Urban Planning Value | 0.24 | • Urban regeneration | 0.18 | 0.0432 | 1 | 0.4 | 0.043 | 0.017 |
| 0.24 | • Urban density | 0.12 | 0.0288 | 1 | 0.5 | 0.029 | 0.014 | |
| 0.24 | • Congestion | 0.15 | 0.036 | 1 | 0.7 | 0.036 | 0.025 | |
| 0.24 | • Accesibility and mobility | 0.18 | 0.0432 | 0.9 | 0.4 | 0.039 | 0.017 | |
| 0.24 | • Management of crowded spaces | 0.15 | 0.036 | 0.6 | 0.8 | 0.022 | 0.029 | |
| 0.24 | • Creation of new hubs | 0.22 | 0.0528 | 1 | 0.8 | 0.053 | 0.042 | |
| 0.221 | 0.145 | |||||||
| Trasportand Mobility Value | 0.1 | • Accessibility and pubblic transport | 0.5 | 0.05 | 1 | 0.7 | 0.050 | 0.035 |
| 0.1 | • Parking | 0.5 | 0.05 | 0.8 | 0.5 | 0.040 | 0.025 | |
| 0.090 | 0.060 | |||||||
| 0.966 | 0.625 | |||||||
Table A13.
Overall MAVT Results—Scenario 2.
| Criteria | Criteria Weights | Attributes | Attributes Weights | Attributes Global Weights | Alternative | |||
|---|---|---|---|---|---|---|---|---|
| Standardized Scores | Global Score | |||||||
| Alternative A | Alternative B | Alternative A | Alternative B | |||||
| (a) | (b) | c = (a × b) | (e) | (f) | (c × e) | (c × f) | ||
| Economic Value | 0.1 | • Effect on local economic activities | 0.15 | 0.015 | 1 | 0.8 | 0.015 | 0.012 |
| 0.1 | • Touristic activities | 0.14 | 0.014 | 1 | 0.2 | 0.014 | 0.003 | |
| 0.1 | • Commercial activities | 0.12 | 0.012 | 0.8 | 0.5 | 0.144 | 0.006 | |
| 0.1 | • Real estate improvement | 0.13 | 0.013 | 0.6 | 0.6 | 0.008 | 0.008 | |
| 0.1 | • Employment opportunities | 0.16 | 0.016 | 0.75 | 0.5 | 0.012 | 0.008 | |
| 0.1 | • Investment costs and resources | 0.12 | 0.012 | 0.6 | 0.4 | 0.007 | 0.005 | |
| 0.1 | • Profitability | 0.18 | 0.018 | 1 | 0.6 | 0.018 | 0.011 | |
| 0.218 | 0.052 | |||||||
| Social Value | 0.24 | • Creation of new houses | 0.1 | 0.024 | 0.8 | 0.5 | 0.019 | 0.012 |
| 0.24 | • Integration | 0.16 | 0.0384 | 0.5 | 1 | 0.019 | 0.038 | |
| 0.24 | • Gentrification | 0.12 | 0.0288 | 0.6 | 0.4 | 0.017 | 0.012 | |
| 0.24 | • Public safety | 0.16 | 0.0384 | 0.8 | 0.8 | 0.031 | 0.031 | |
| 0.24 | • Creation of attractive functions | 0.18 | 0.0432 | 0.6 | 0.4 | 0.026 | 0.017 | |
| 0.24 | • Service for the population | 0.14 | 0.0336 | 1 | 0.4 | 0.034 | 0.013 | |
| 0.24 | • Sport and leisure activities | 0.14 | 0.0336 | 0.8 | 0.6 | 0.027 | 0.020 | |
| 0.173 | 0.144 | |||||||
| Environmental Value | 0.25 | • Land use | 0.14 | 0.035 | 0.5 | 0.5 | 0.018 | 0.018 |
| 0.25 | • Acustic emission | 0.16 | 0.04 | 1 | 0.6 | 0.040 | 0.024 | |
| 0.25 | • Resource cosumption | 0.15 | 0.0375 | 1 | 1 | 0.038 | 0.038 | |
| 0.25 | • Urban waste disposal | 0.15 | 0.0375 | 1 | 0.6 | 0.038 | 0.023 | |
| 0.25 | • Green areas | 0.15 | 0.0375 | 0.8 | 0.6 | 0.030 | 0.023 | |
| 0.25 | • Rehabilitation of polluted areas | 0.25 | 0.0625 | 0.8 | 1 | 0.050 | 0.063 | |
| 0.213 | 0.187 | |||||||
| Urban Planning Value | 0.26 | • Urban regeneration | 0.18 | 0.0468 | 1 | 0.4 | 0.047 | 0.019 |
| 0.26 | • Urban density | 0.12 | 0.0312 | 1 | 0.5 | 0.031 | 0.016 | |
| 0.26 | • Congestion | 0.15 | 0.039 | 1 | 0.7 | 0.039 | 0.027 | |
| 0.26 | • Accesibility and mobility | 0.18 | 0.0468 | 0.9 | 0.4 | 0.042 | 0.019 | |
| 0.26 | • Management of crowded spaces | 0.15 | 0.039 | 0.6 | 0.8 | 0.023 | 0.031 | |
| 0.26 | • Creation of new hubs | 0.22 | 0.0572 | 1 | 0.8 | 0.057 | 0.046 | |
| 0.240 | 0.157 | |||||||
| Trasportand Mobility Value | 0.15 | • Accessibility and pubblic transport | 0.5 | 0.075 | 1 | 0.7 | 0.075 | 0.053 |
| 0.15 | • Parking | 0.5 | 0.075 | 0.8 | 0.5 | 0.060 | 0.038 | |
| 0.135 | 0.090 | |||||||
| 0.979 | 0.630 | |||||||
Table A14.
Overall MAVT Results—Scenario 3.
| Criteria | Criteria Weights | Attributes | Attributes Weights | Attributes Global Weights | Alternative | |||
|---|---|---|---|---|---|---|---|---|
| Standardized Scores | Global Score | |||||||
| Alternative A | Alternative B | Alternative A | Alternative B | |||||
| (a) | (b) | c = (a × b) | (e) | (f) | (c × e) | (c × f) | ||
| Economic Value | 0.2 | • Effect on local economic activities | 0.15 | 0.03 | 1 | 0.8 | 0.030 | 0.024 |
| 0.2 | • Touristic activities | 0.14 | 0.028 | 1 | 0.2 | 0.028 | 0.006 | |
| 0.2 | • Commercial activities | 0.12 | 0.024 | 0.8 | 0.5 | 0.144 | 0.012 | |
| 0.2 | • Real estate improvement | 0.13 | 0.026 | 0.6 | 0.6 | 0.016 | 0.016 | |
| 0.2 | • Employment opportunities | 0.16 | 0.032 | 0.75 | 0.5 | 0.024 | 0.016 | |
| 0.2 | • Investment costs and resources | 0.12 | 0.024 | 0.6 | 0.4 | 0.014 | 0.010 | |
| 0.2 | • Profitability | 0.18 | 0.036 | 1 | 0.6 | 0.036 | 0.022 | |
| 0.292 | 0.104 | |||||||
| Social Value | 0.2 | • Creation of new houses | 0.1 | 0.02 | 0.8 | 0.5 | 0.016 | 0.010 |
| 0.2 | • Integration | 0.16 | 0.032 | 0.5 | 1 | 0.016 | 0.032 | |
| 0.2 | • Gentrification | 0.12 | 0.024 | 0.6 | 0.4 | 0.014 | 0.010 | |
| 0.2 | • Public safety | 0.16 | 0.032 | 0.8 | 0.8 | 0.026 | 0.026 | |
| 0.2 | • Creation of attractive functions | 0.18 | 0.036 | 0.6 | 0.4 | 0.022 | 0.014 | |
| 0.2 | • Service for the population | 0.14 | 0.028 | 1 | 0.4 | 0.028 | 0.011 | |
| 0.2 | • Sport and leisure activities | 0.14 | 0.028 | 0.8 | 0.6 | 0.022 | 0.017 | |
| 0.144 | 0.120 | |||||||
| Environmental Value | 0.2 | • Land use | 0.14 | 0.028 | 0.5 | 0.5 | 0.014 | 0.014 |
| 0.2 | • Acustic emission | 0.16 | 0.032 | 1 | 0.6 | 0.032 | 0.019 | |
| 0.2 | • Resource cosumption | 0.15 | 0.03 | 1 | 1 | 0.030 | 0.030 | |
| 0.2 | • Urban waste disposal | 0.15 | 0.03 | 1 | 0.6 | 0.030 | 0.018 | |
| 0.2 | • Green areas | 0.15 | 0.03 | 0.8 | 0.6 | 0.024 | 0.018 | |
| 0.2 | • Rehabilitation of polluted areas | 0.25 | 0.05 | 0.8 | 1 | 0.040 | 0.050 | |
| 0.170 | 0.149 | |||||||
| Urban Planning Value | 0.2 | • Urban regeneration | 0.18 | 0.036 | 1 | 0.4 | 0.036 | 0.014 |
| 0.2 | • Urban density | 0.12 | 0.024 | 1 | 0.5 | 0.024 | 0.012 | |
| 0.2 | • Congestion | 0.15 | 0.03 | 1 | 0.7 | 0.030 | 0.021 | |
| 0.2 | • Accesibility and mobility | 0.18 | 0.036 | 0.9 | 0.4 | 0.032 | 0.014 | |
| 0.2 | • Management of crowded spaces | 0.15 | 0.03 | 0.6 | 0.8 | 0.018 | 0.024 | |
| 0.2 | • Creation of new hubs | 0.22 | 0.044 | 1 | 0.8 | 0.044 | 0.035 | |
| 0.184 | 0.121 | |||||||
| Trasportand Mobility Value | 0.2 | • Accessibility and pubblic transport | 0.5 | 0.1 | 1 | 0.7 | 0.100 | 0.070 |
| 0.2 | • Parking | 0.5 | 0.1 | 0.8 | 0.5 | 0.080 | 0.050 | |
| 0.180 | 0.120 | |||||||
| 0.970 | 0.614 | |||||||
References
- Khakee, A. Evaluation and planning: Inseparable concepts. Town Plan. Rev. 1998, 69, 359–374. [Google Scholar] [CrossRef]
- Lichfield, N. Community Impact Assessment and Planning. The Role of Objectives in Evaluation Design. Recent Developments in Evaluation in Spatial, Infrastructure and Environmental Planning; Geo Press: Groningen, The Netherlands, 2001; pp. 75–83. [Google Scholar]
- Mondini, G. La valutazione come processo di produzione di conoscenza per il progetto. Valori e Valutazioni 2009, 3, 5–17. [Google Scholar]
- Bentivegna, V. Il contributo della valutazione alla razionalità e legittimazione del piano. Urbanistica 1995, 105, 66–71. [Google Scholar]
- Las Casas, G.B.; Tilio, L.; Tsoukiàs, A. Public decision processes: The interaction space supporting planner’s activity. In Computational Science and Its Applications—ICCSA 2012, Proceedings of the 2012 International Conference on Computational Science and Its Applications (ICCSA 2012), Salvador de Bahia, Brazil, 18–21 June 2012; Springer: Berlin/Heidelberg, Germany, 2012; pp. 466–480. [Google Scholar]
- Keeney, R.L. Common mistakes in making value trade-offs. Oper. Res. 2002, 50, 935–945. [Google Scholar] [CrossRef]
- Bottero, M.C.; Mondini, G. Valutazione e Sostenibilità: Piani, Programmi, Progetti; Celid: Torino, Italy, 2009. [Google Scholar]
- Lombardi, P.L.; Brandon, P.S. Sustainability in the built environment: A new holistic taxonomy of aspects for decision making. Int. J. Environ. Technol. Manag. 2002, 2, 22–37. [Google Scholar] [CrossRef]
- Della Spina, L.; Ventura, C.; Viglianisi, A. A Multicriteria Assessment Model for Selecting Strategic Projects in Urban Areas. In Computational Science and Its Applications—ICCSA 2016, Proceedings of the 2016 International Conference on Computational Science and Its Applications (ICCSA 2016), Beijing, China, 4–7 July 2016; Springer International Publishing: Cham, Switzerland, 2016; pp. 414–427. [Google Scholar]
- Napoli, G.; Giuffrida, S.; Trovato, M.R. Fair Planning and Affordability Housing in Urban Policy. The Case of Syracuse (Italy). In Computational Science and Its Applications—ICCSA 2016, Proceedings of the 2016 International Conference on Computational Science and Its Applications (ICCSA 2016), Beijing, China, 4–7 July 2016; Springer International Publishing: Cham, Switzerland, 2016; pp. 46–62. [Google Scholar]
- Della Spina, L.; Scrivo, R.; Ventura, C.; Viglianisi, A. Urban renewal: Negotiation procedures and evaluation models. In Computational Science and Its Applications—ICCSA 2015, Proceedings of the 2015 International Conference on Computational Science and Its Applications (ICCSA 2016), Banff, AB, Canada, 22–25 June 2015; Springer International Publishing: Cham, Switzerland, 2015; pp. 88–103. [Google Scholar]
- Creswell, J.W.; Plano Clark, V.L. Designing and Conducting Mixed Methods Research; Sage: Thousand Oaks, CA, USA, 2011. [Google Scholar]
- Morse, J.; Niehaus, L. Mixed Method Design: Principles and Procedures; Left Coast Press: Walnut Creek, CA, USA, 2009. [Google Scholar]
- Bazeley, P. Issues in mixing qualitative and quantitative approaches to research. In Applying Qualitative Methods to Marketing Management Research; Buber, R., Gadner, J., Richards, L., Eds.; Palgrave Macmillan: Basingstoke, UK, 2004; pp. 141–156. [Google Scholar]
- Sturiale, L.; Calabro, F.; Della Spina, L. The Management Tools for Urban Transformation in Future Useful, Attractive and Friendly Cities. The Role of Evaluation Work. In Proceedings of the 18th IPSAPA/ISPALEM International Scientific Conference, Catania, Italy, 3–4 July 2014; pp. 41–48. [Google Scholar]
- Cerreta, M.; Inglese, P.; Malangone, V.; Panaro, S. Complex values-based approach for multidimensional evaluation of landscape. In Computational Science and its Applications, ICCSA 2014, Lecture Notes in Computer Science (LNCS); Murgante, B., Misra, S., Rocha, A.M.A.C., Torre, C., Rocha, J.G., Falcão, M.I., Taniar, D., Apduhan, B.O., Gervasi, O., Eds.; Springer International Publishing: Cham, Switzerland, 2014; pp. 382–397. [Google Scholar]
- Myllyviita, T.; Hujala, T.; Kangas, A.; Eyvindson, K.; Sironen, S.; Leskinen, P.; Kurttila, M. Mixing methods—Assessment of potential benefits for natural resources planning. Scand. J. For. Res. 2014, 29, 20–29. [Google Scholar] [CrossRef]
- Medda, F.; Nijkamp, P. A combinatorial assessment methodology for complex transport policy analysis. Integr. Assess. 2003, 4, 214–222. [Google Scholar] [CrossRef]
- Miller, D.; Patassini, D. (Eds.) Beyond Benefit Cost Analysis. Accounting for Non-Market Values in Planning Evaluation; Ashgate: Aldershot, UK, 2005. [Google Scholar]
- Fusco Girard, L.; Cerreta, M.; De Toro, P. Integrated planning and integrated evaluation. Theoretical references and methodological approaches. In Beyond Benefit Cost Analysis. Accounting for Non-Market Values in Planning Evaluation; Miller, D., Patassini, D., Eds.; Ashgate: Aldershot, UK, 2005; pp. 175–205. [Google Scholar]
- Deakin, M.; Mitchell, G.; Nijkamp, P.; Vreeker, R. (Eds.) Sustainable Urban Development Volume 2: The Environmental Assessment Methods; Routledge: Oxon, UK, 2007. [Google Scholar]
- Fusco Girard, L.; Cerreta, M.; De Toro, P. Valutazione Ambientale Integrata: Una sperimentazione per la funivia Sorrento-Sant’Agata. In La Valutazione Ambientale nei Piani e nei Progetti; Colombo, L., Losco, S., Pacella, C., Eds.; Le Penseur: Brienza, Italy, 2008; pp. 481–494. [Google Scholar]
- Munda, G. Social Multi-Criteria Evaluation for a Sustainable Economy; Springer: Heidelberg, Germany, 2008. [Google Scholar]
- Carlsson-Kanyama, A.K.; Dreborg, H.; Moll, H.; Padovan, D. Participative backcasting: A tool for involving stakeholders in local sustainability planning. Futures 2007, 40, 34–46. [Google Scholar] [CrossRef]
- Allmendinger, P.; Haughton, G. Soft spaces, fuzzy boundaries, and metagovernance: The new spatial planning in the Thames Gateway. Environ. Plan. A 2009, 41, 617–633. [Google Scholar] [CrossRef]
- Bottero, M. A multi-methodological approach for assessing sustainability of urban projects. Manag. Environ. Qual. Int. J. 2015, 26, 138–154. [Google Scholar] [CrossRef]
- Cerreta, M.; Malangone, V. Valutazioni multi-metodologiche per il Paesaggio Storico Urbano: La Valle dei Mulini di Amalfi. BDC Bollettino Del Centro Calza Bini 2014, 14, 39–60. [Google Scholar]
- Ferretti, V. From stakeholders’ analysis to cognitive mapping and Multi-Attribute Value Theory: An integrated approach for policy support. Eur. J. Oper. Res. 2016, 253, 524–541. [Google Scholar] [CrossRef]
- Berta, M.; Bottero, M.; Ferretti, V. A mixed methods approach for the integration of urban design and economic evaluation: Industrial heritage and urban regeneration in China. Environ. Plan. B Plan. Des. 2016. [Google Scholar] [CrossRef] [Green Version]
- Ferretti, V.; Bottero, M.; Mondini, G. An integrated approach for exploring opportunities and vulnerabilities of complex territorial systems. In Lecture Notes in Computer Science; Hutchison, D., Kanade, T., Kittler, J., Kleinberg, J.M., Mattern, F., Mitchell, J.C., Naor, M., Pandu Rangan, C., Steffen, B., Terzopoulos, D., Tygar, D., Weikum, G., Eds.; Springer International Publishing: Cham, Switzerland, 2014; pp. 51–64. [Google Scholar]
- Kajanus, M.; Leskinen, P.; Kurtille, M.; Kangas, J. Making use of MCDS methods in SWOT analysis. Lessons learnt in strategic natural resources management. For. Policy Econ. 2012, 20, 1–9. [Google Scholar] [CrossRef]
- Kurttila, M.; Pesonen, M.; Kangas, J.; Kajanus, M. Utilizing the analytic hierarchy process (AHP) in SWOT analysis—A hybrid method and its application to a forest-certification case. For. Policy Econ. 2000, 1, 41–52. [Google Scholar] [CrossRef]
- Yavuz, F.; Baycan, T. Use of swot and analytic hierarchy process integration as a participatory decision making tool in watershed management. Procedia Technol. 2013, 8, 134–143. [Google Scholar] [CrossRef]
- Zavadskas, E.K.; Turskis, Z.; Tamosaitiene, J. Selection of construction enterprises management strategy based on the SWOT and multi-criteria analysis. Arch. Civ. Mech. Eng. 2011, 11, 1063–1082. [Google Scholar] [CrossRef]
- Azimi, Y.; Osanloo, M.; Esfahanipour, A. An uncertainty based multi-criteria ranking system for open pit mining cut-off grade strategy selection. Resour. Policy 2013, 38, 212–223. [Google Scholar] [CrossRef]
- Jimenez, L.G.; Pascual, B. Multicriteria cash-flow modeling and project value-multiples for two-stage project valuation. Int. J. Proj. Manag. 2008, 26, 185–194. [Google Scholar] [CrossRef]
- Mikucioniene, R.; Martinaitis, V.; Keras, E. Evaluation of energy efficiency measures sustainability by decision tree method. Energy Build. 2014, 76, 64–71. [Google Scholar] [CrossRef]
- Prigogine, I. End of Certainty; The Free Press: New York, NY, USA, 1997. [Google Scholar]
- Simon, H.A. The New Science of Management Decision; Harper and Brothers: New York, NY, USA, 1960. [Google Scholar]
- Dente, B. Understanding Policy Decisions; Springer, PoliMI Springer Briefs: New York, NY, USA, 2014. [Google Scholar]
- Liu, B.; Du, Z. (Eds.) Advances in Services Science and Services Information Technology; WIT Press: Southampton, UK, 2014. [Google Scholar]
- Gill, L.; Lange, E.; Morgan, E.; Romano, D. An analysis of usage of different types of visualisation media within a collaborative planning workshop environment. Environ. Plan. B Plan. Des. 2013, 40, 742–754. [Google Scholar] [CrossRef]
- Eden, C. Analyzing cognitive maps to help structure issues or problems. Eur. J. Oper. Res. 2004, 159, 673–686. [Google Scholar] [CrossRef]
- Bond, S.D.; Carlson, K.A.; Keeney, R.L. Generating objectives: Can decision makers articulate what they want? Manag. Sci. 2008, 54, 56–70. [Google Scholar] [CrossRef]
- Gordon, S.N.; Floris, A.; Boerboom, L.; Lamas, T.; Eriksson, L.O.; Nieuwenhuis, M.; Garcia, J.; Rodriguez, L. Studying the use of forest management decision support systems: An initial synthesis of lessons learned from case studies compiled using a semantic wiki. Scand. J. For. Res. 2014, 29 (Suppl. S1), 44–55. [Google Scholar] [CrossRef]
- Rosenhead, J.; Mingers, J. Rational Analysis for a Problematic World Revisited; John Wiley and Sons: Hoboken, NJ, USA, 2001. [Google Scholar]
- Wittwer, J.W. Fishbone Diagram/Cause and Effect Diagram in Excel. Available online: https://www.vertex42.com/ExcelTemplates/fishbone-diagram.html (accessed on 29 October 2009).
- Gupta, K.; Sleezer, C.M.; Russ-Eft, D.F. American Society for Training and Development. A Practical Guide to Needs Assessment, 2nd ed.; Pfeiffer: San Francisco, CA, USA, 2007. [Google Scholar]
- Bana e Costa, C.A.; Ensslin, L.; Corrêa, E.C.; Vansnick, J. Decision support systems in action: Integrated application in a multicriteria decision aid process. Eur. J. Oper. Res. 1999, 113, 315–335. [Google Scholar] [CrossRef]
- Belton, V.; Stewart, T.J. Multiple Criteria Decision Analysis: An Integrated Approach; Kluwer Academic Publishers: Boston, MA, USA, 2002. [Google Scholar]
- Kpoumié, A.; Damart, S.; Tsoukiàs, A. Integrating Cognitive Mapping Analysis into Multi-Criteria Decision Aiding. Available online: https://hal-normandie-univ.archives-ouvertes.fr/hal-01510937/document (accessed on 3 September 2017).
- Greco, S.; Figueira, J.; Ehrgott, M. Multiple Criteria Decision Analysis; Springer: New York, NY, USA, 2005. [Google Scholar]
- Roy, B.; Bouyssou, D. Multicritere ala Décision, A Méthodes et cas; Economica: Paris, France, 1993. [Google Scholar]
- Munda, G. Measuring sustainability: A multi-criterion framework. Environ. Dev. Sustain. 2005, 7, 117–134. [Google Scholar] [CrossRef]
- Rowley, H.V.; Peters, G.M.; Lundie, S.; Moore, S.J. Aggregating sustainability indicators: Beyond the weighted sum. J. Environ. Manag. 2012, 111, 24–33. [Google Scholar] [CrossRef] [PubMed]
- Keeney, R.L.; Raiffa, H. Decisions with Multiple Objectives; John Wiley: New York, NY, USA, 1976. [Google Scholar]
- Guarini, M.R.; Battisti, F. Application of a Multi-criteria and Participated Evaluation Procedure to Select Typology of Intervention to Redevelop Degraded Urban Area. Procedia Soc. Behav. Sci. 2016, 223, 960–967. [Google Scholar] [CrossRef]
- Bottero, M.; Mondini, G.; Oppio, A. Decision Support Systems for Evaluating Urban Regeneration. Procedia Soc. Behav. Sci. 2016, 223, 923–928. [Google Scholar] [CrossRef]
- Keeney, R.L. Value-focused thinking: A path to creative decision making. Long Range Plan. 1997, 2, 314. [Google Scholar]
- Gamboa, G.; Munda, G. The problem of windfarm location: A social multi-criteria evaluation framework. Energy Policy 2007, 35, 1564–1583. [Google Scholar] [CrossRef]
- Munda, G. Social multi-criteria evaluation: Methodological foundations and operational consequences. Eur. J. Oper. Res. 2004, 158, 662–677. [Google Scholar] [CrossRef]
- Miller, D. Project location analysis using the goals achievement method of evaluation. J. Am. Plan. Assoc. 1980, 46, 195–208. [Google Scholar] [CrossRef]
- Manganelli, B. Real Estate Investing; Springer International Publishing: Cham, Switzerland, 2015. [Google Scholar]
- Tajani, F.; Morano, P. Evaluation of vacant and redundant public properties and risk control: A model for the definition of the optimal mix of eligible functions. J. Prop. Invest. Financ. 2017, 35, 75–100. [Google Scholar] [CrossRef]
- Nesticò, A.; Pipolo, O. A protocol for sustainable building interventions: Financial analysis and environmental effects. Int. J. Bus. Intell. Data Mining 2015, 10, 199–212. [Google Scholar] [CrossRef]
- Rugolo, A.; Calabrò, F.; Scrivo, R. The Assessment Tool for the Design of the Territories. The Impacts from the Road Infrastructure in the Inland Areas of the Province of Reggio Calabria. Procedia Soc. Behav. Sci. 2016, 223, 534–541. [Google Scholar] [CrossRef]
- Della Spina, L. Integrated Evaluation and Multi-methodological Approaches for the Enhancement of the Cultural Landscape. In Computational Science and Its Applications—ICCSA 2017; Gervasi, O., Murgante, B., Misra, S., Borruso, G., Torre, C.M., Rocha, A.M.A.C., Taniar, D., Apduhan, B.O., Stankova, E., Cuzzocrea, A., Eds.; Lecture Notes in Computer Science; Springer International Publishing: Cham, Switzerland, 2017; Volume 10404, pp. 478–493. [Google Scholar]
- Concilio, G. Bricolaging Knowledge and Practices in Spatial Strategy-Making. Mak. Strat. Spat. Plan. 2010, 9, 281–301. [Google Scholar]
- Calabrò, F.; Della Spina, L. Innovative tools for the effectiveness and efficiency of administrative action of the metropolitan cities: The strategic operational programme. Adv. Eng. Forum 2014, 11, 3–10. [Google Scholar] [CrossRef]
- Calavita, N.; Calabrò, F.; Della Spina, L. Transfer of development rights as incentives for regeneration of illegal settlements. Adv. Eng. Forum 2014, 11, 639–646. [Google Scholar] [CrossRef]
- Campolo, D.; Rugolo, A.; Scrivo, R. Lo Spin-off universitario “UrbanLab srl” strumenti e metodi per le trasformazioni urbane in PPP. LaborEst 2014, 9, 81–85. [Google Scholar]
Figure 1.
(a) Area of study; (b) Ex- Italcitrus-area B; (c) Ex-Exhibition Center of Pentimele-area A.
Figure 1.
(a) Area of study; (b) Ex- Italcitrus-area B; (c) Ex-Exhibition Center of Pentimele-area A.
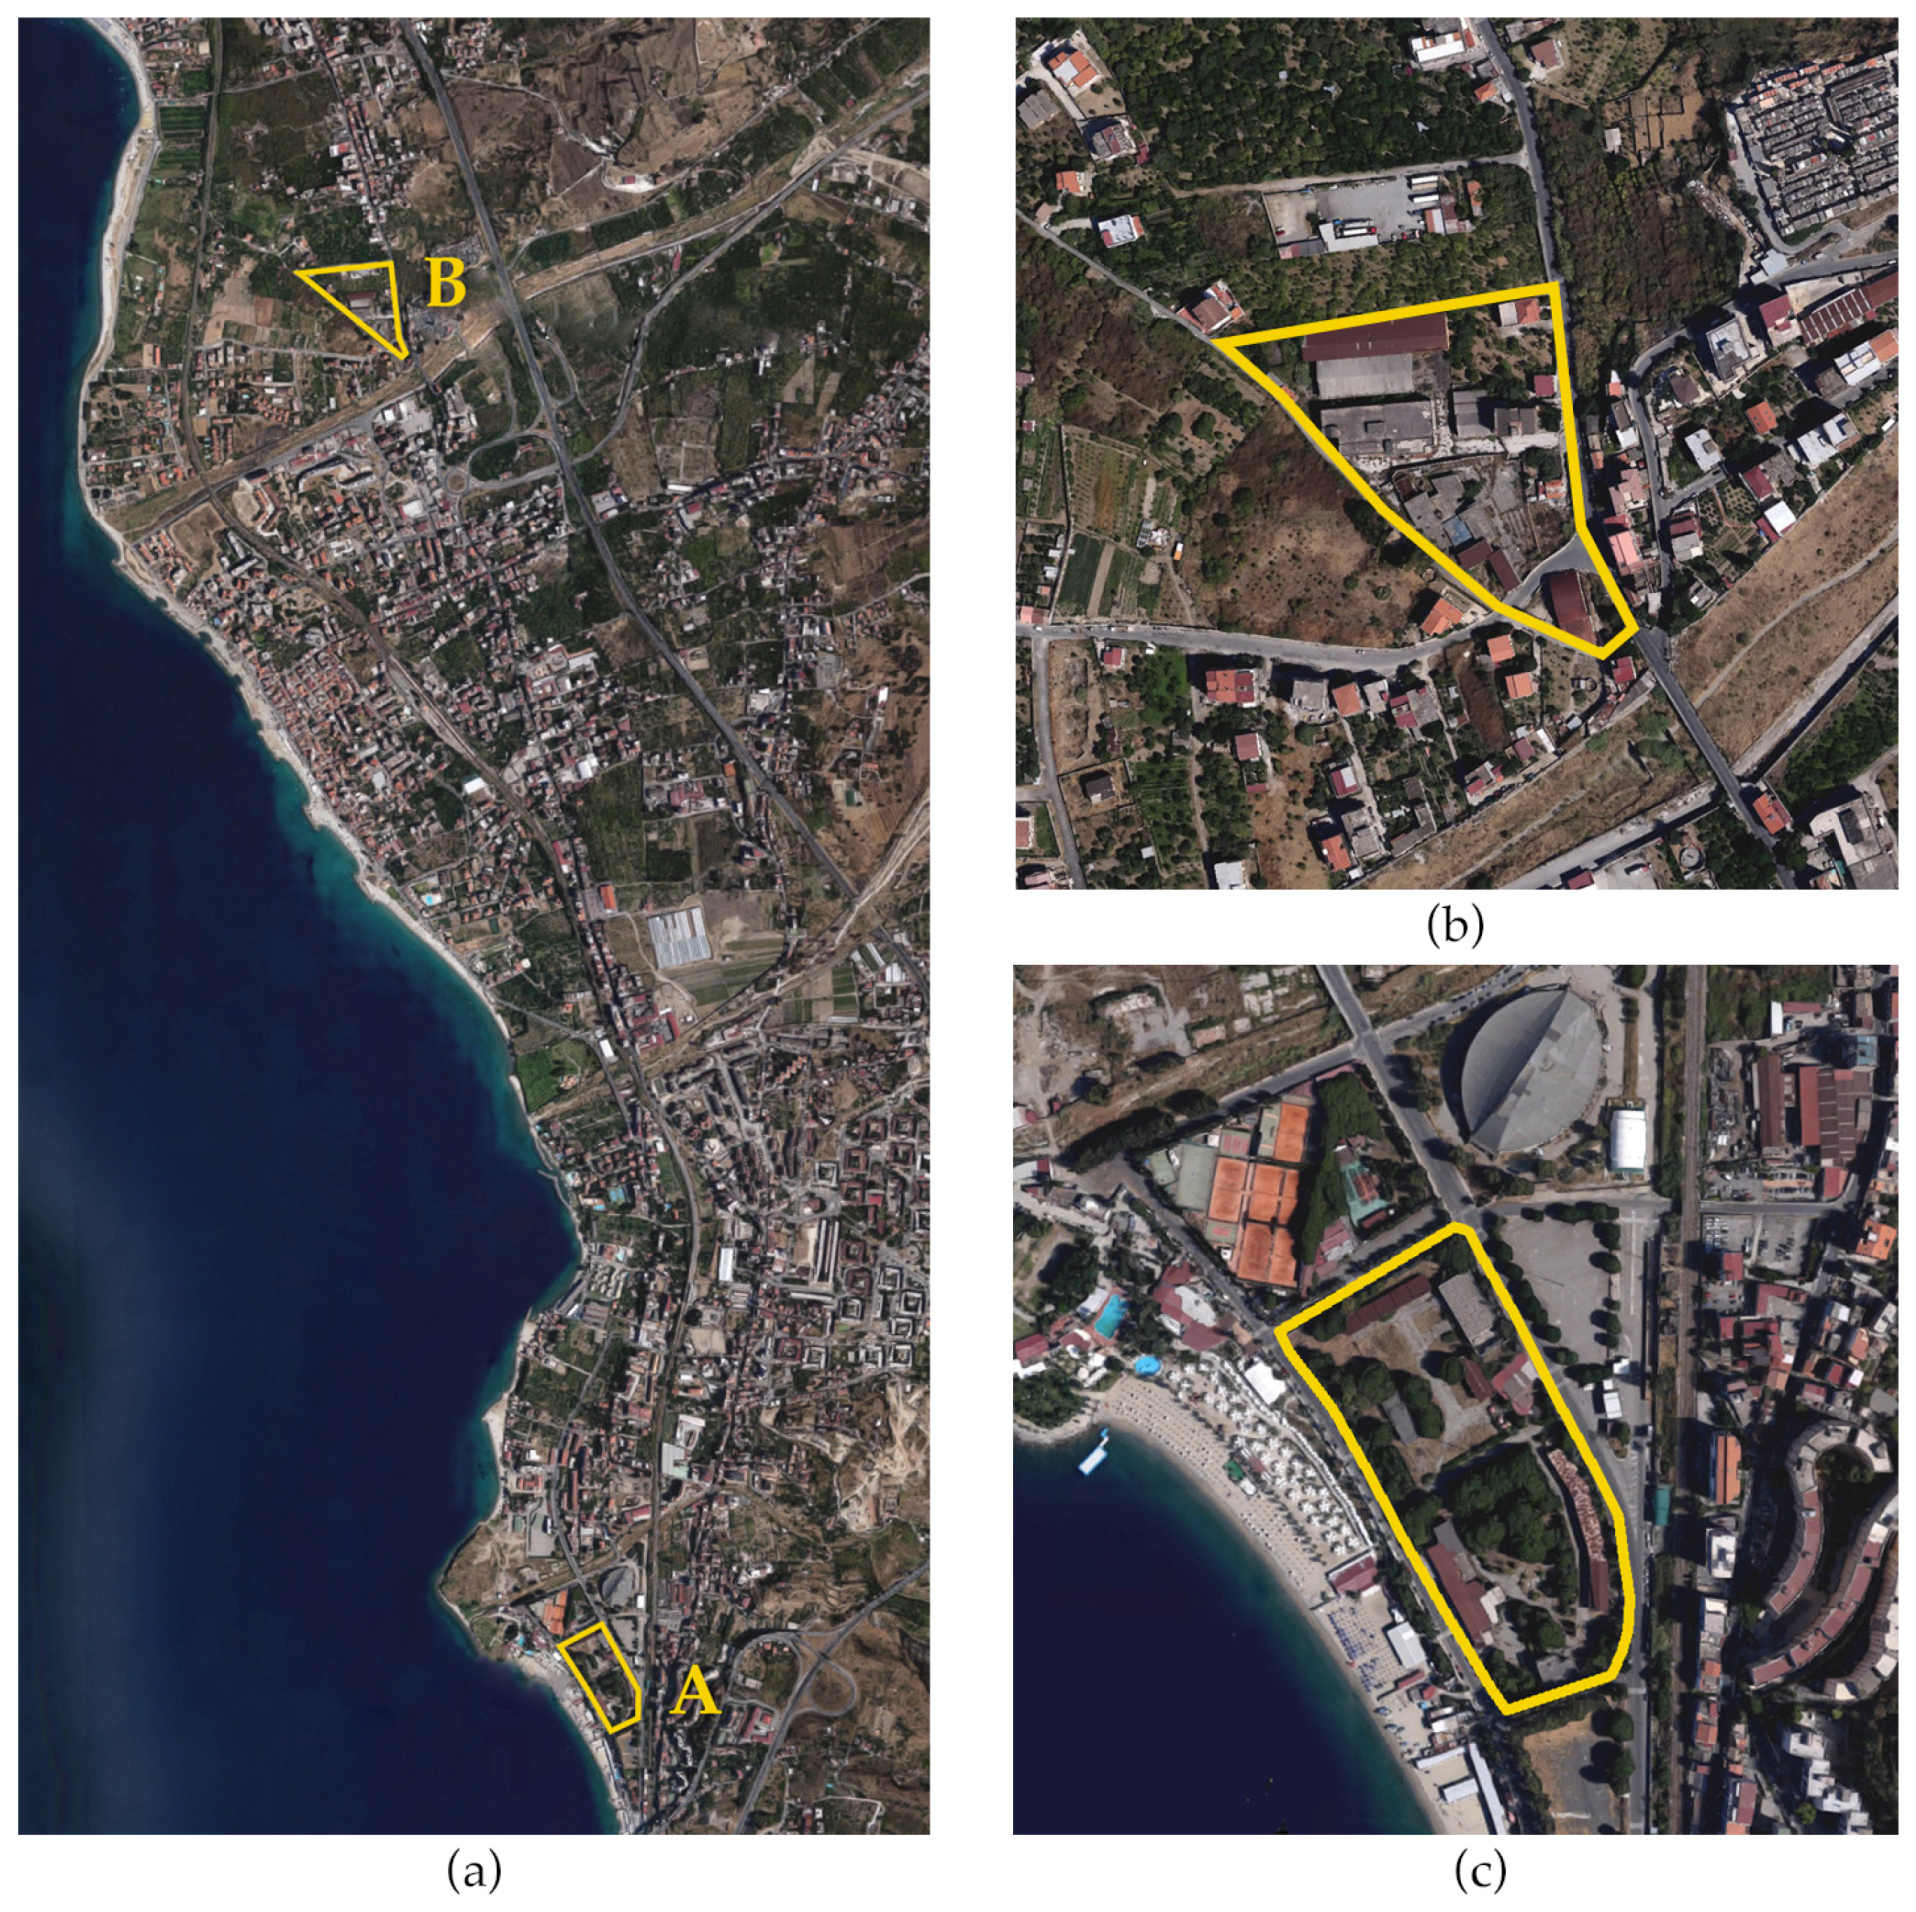
Figure 2.
The integrated approach followed in the study.

Figure 3.
Structuring of the value tree.
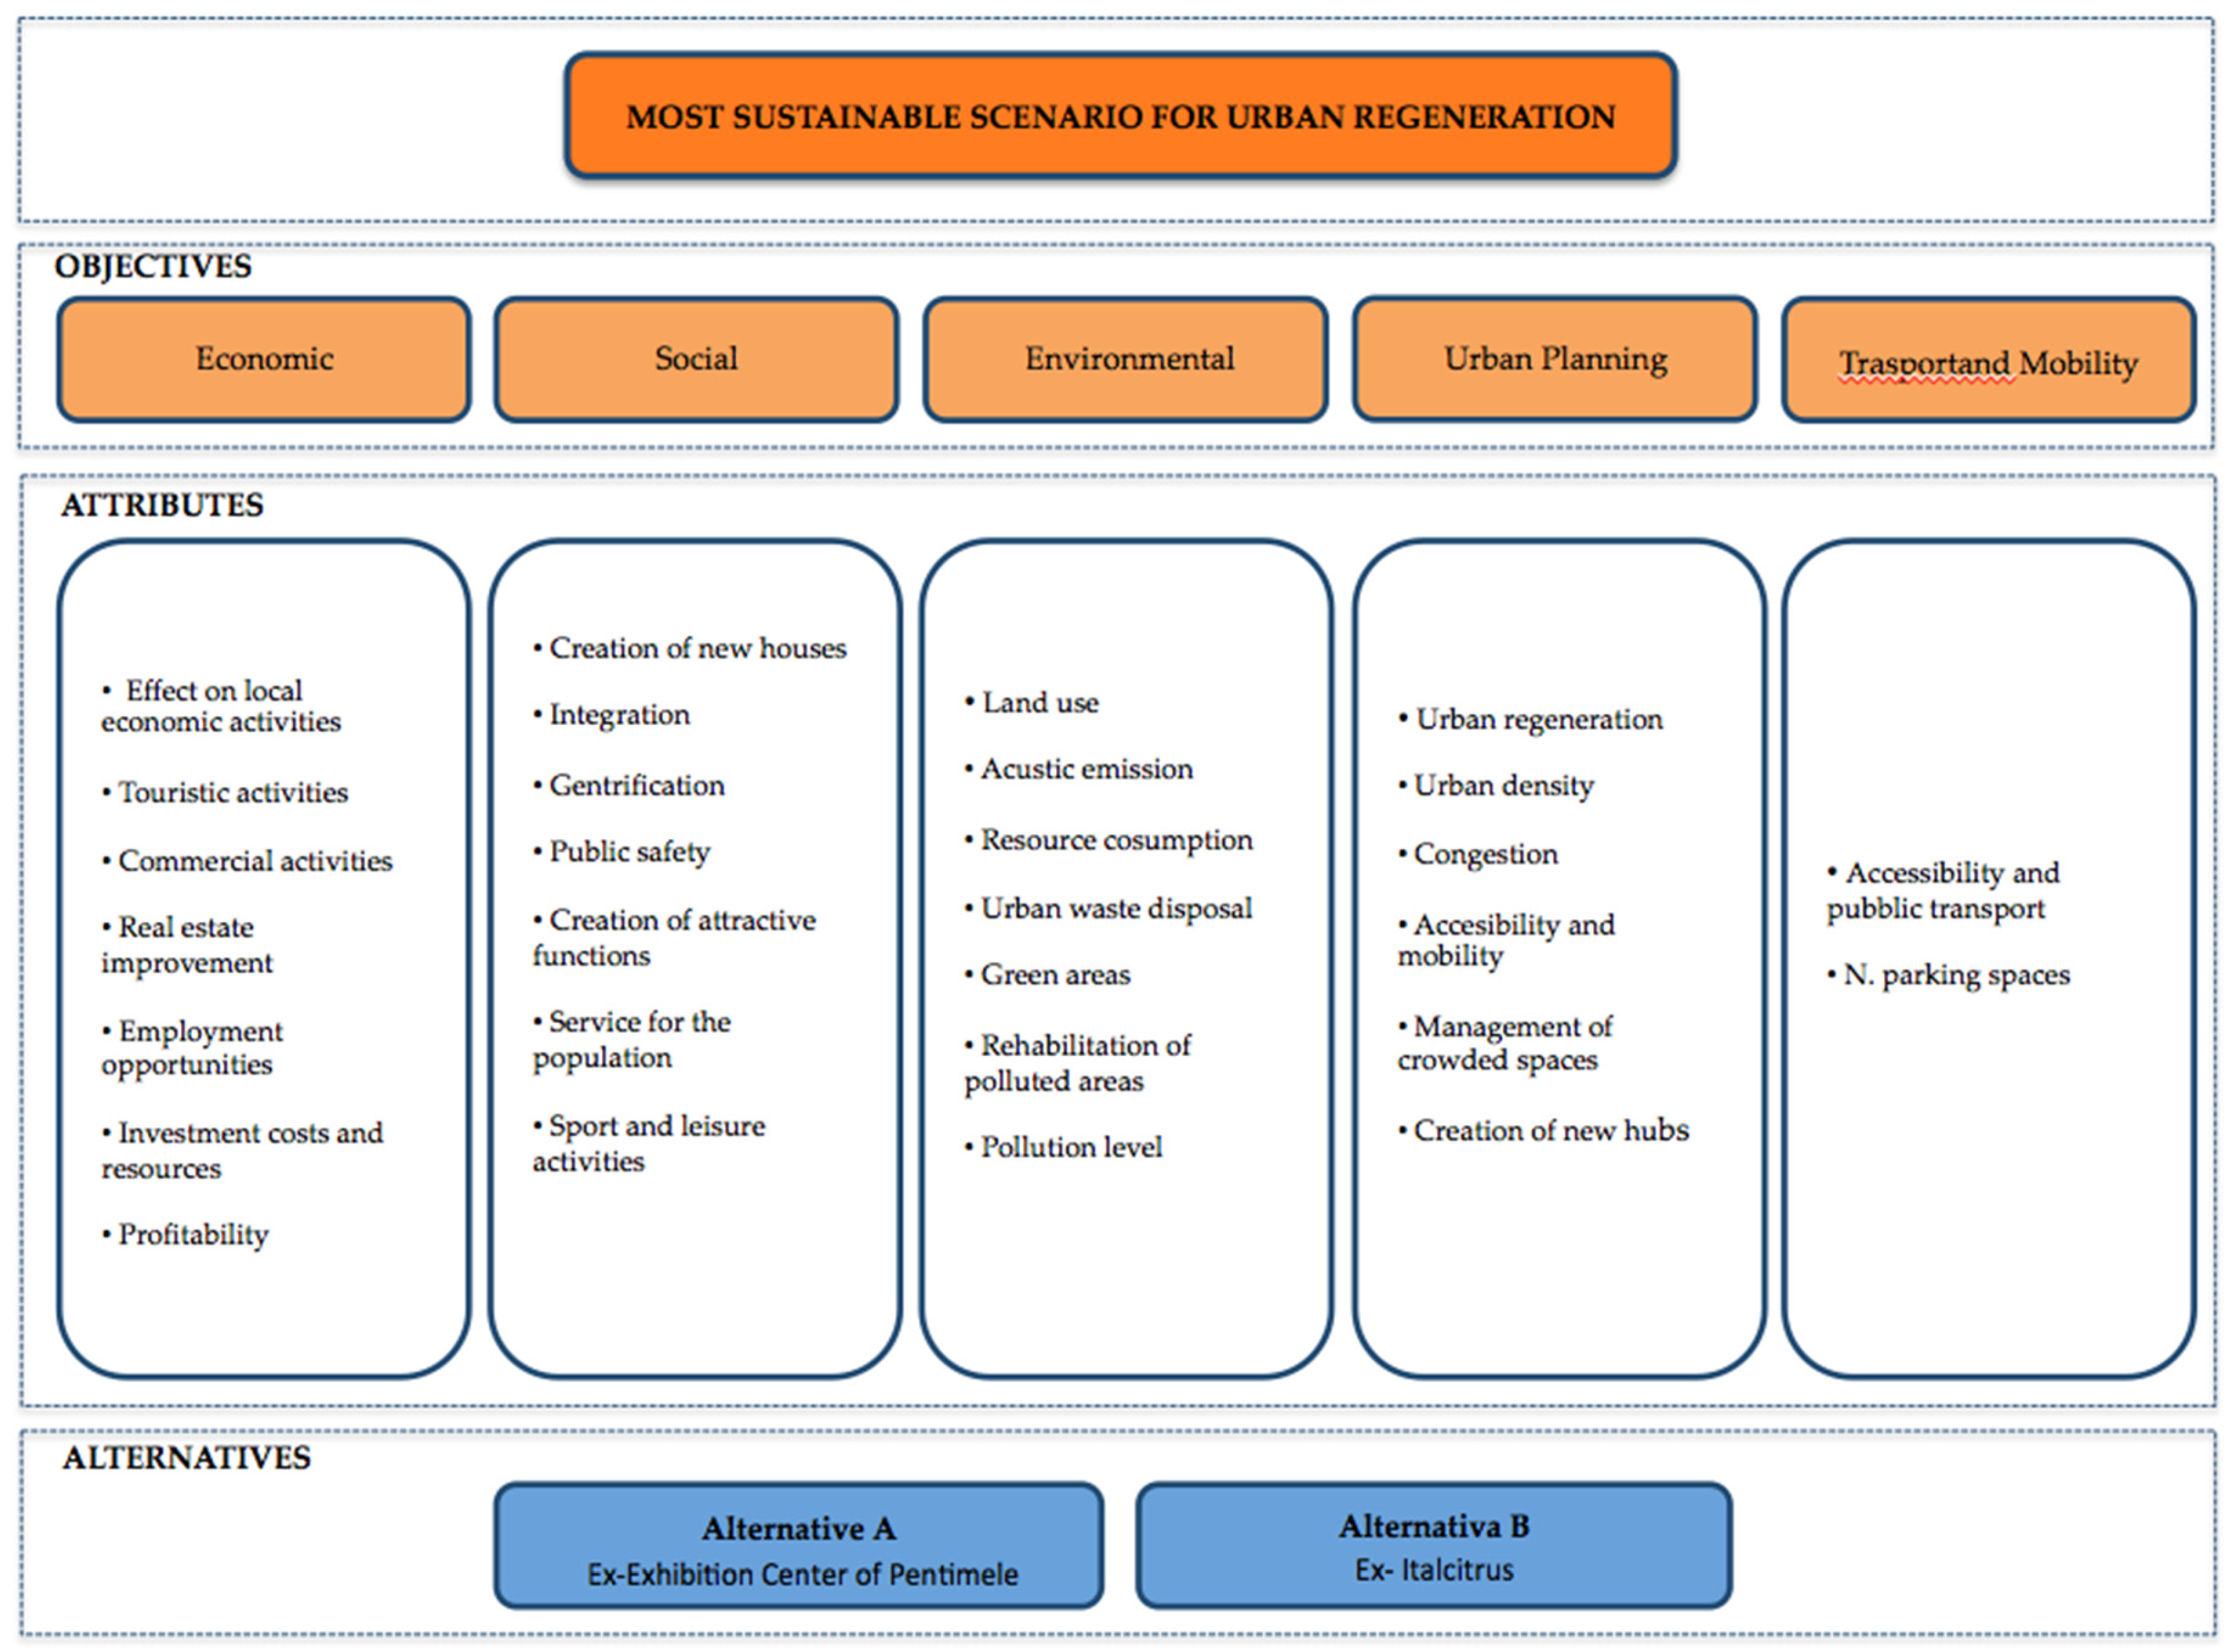
Figure 4.
(a) Pollution level; (b) parking spaces.

Figure 5.
First hypothesis of functional program and sizing.
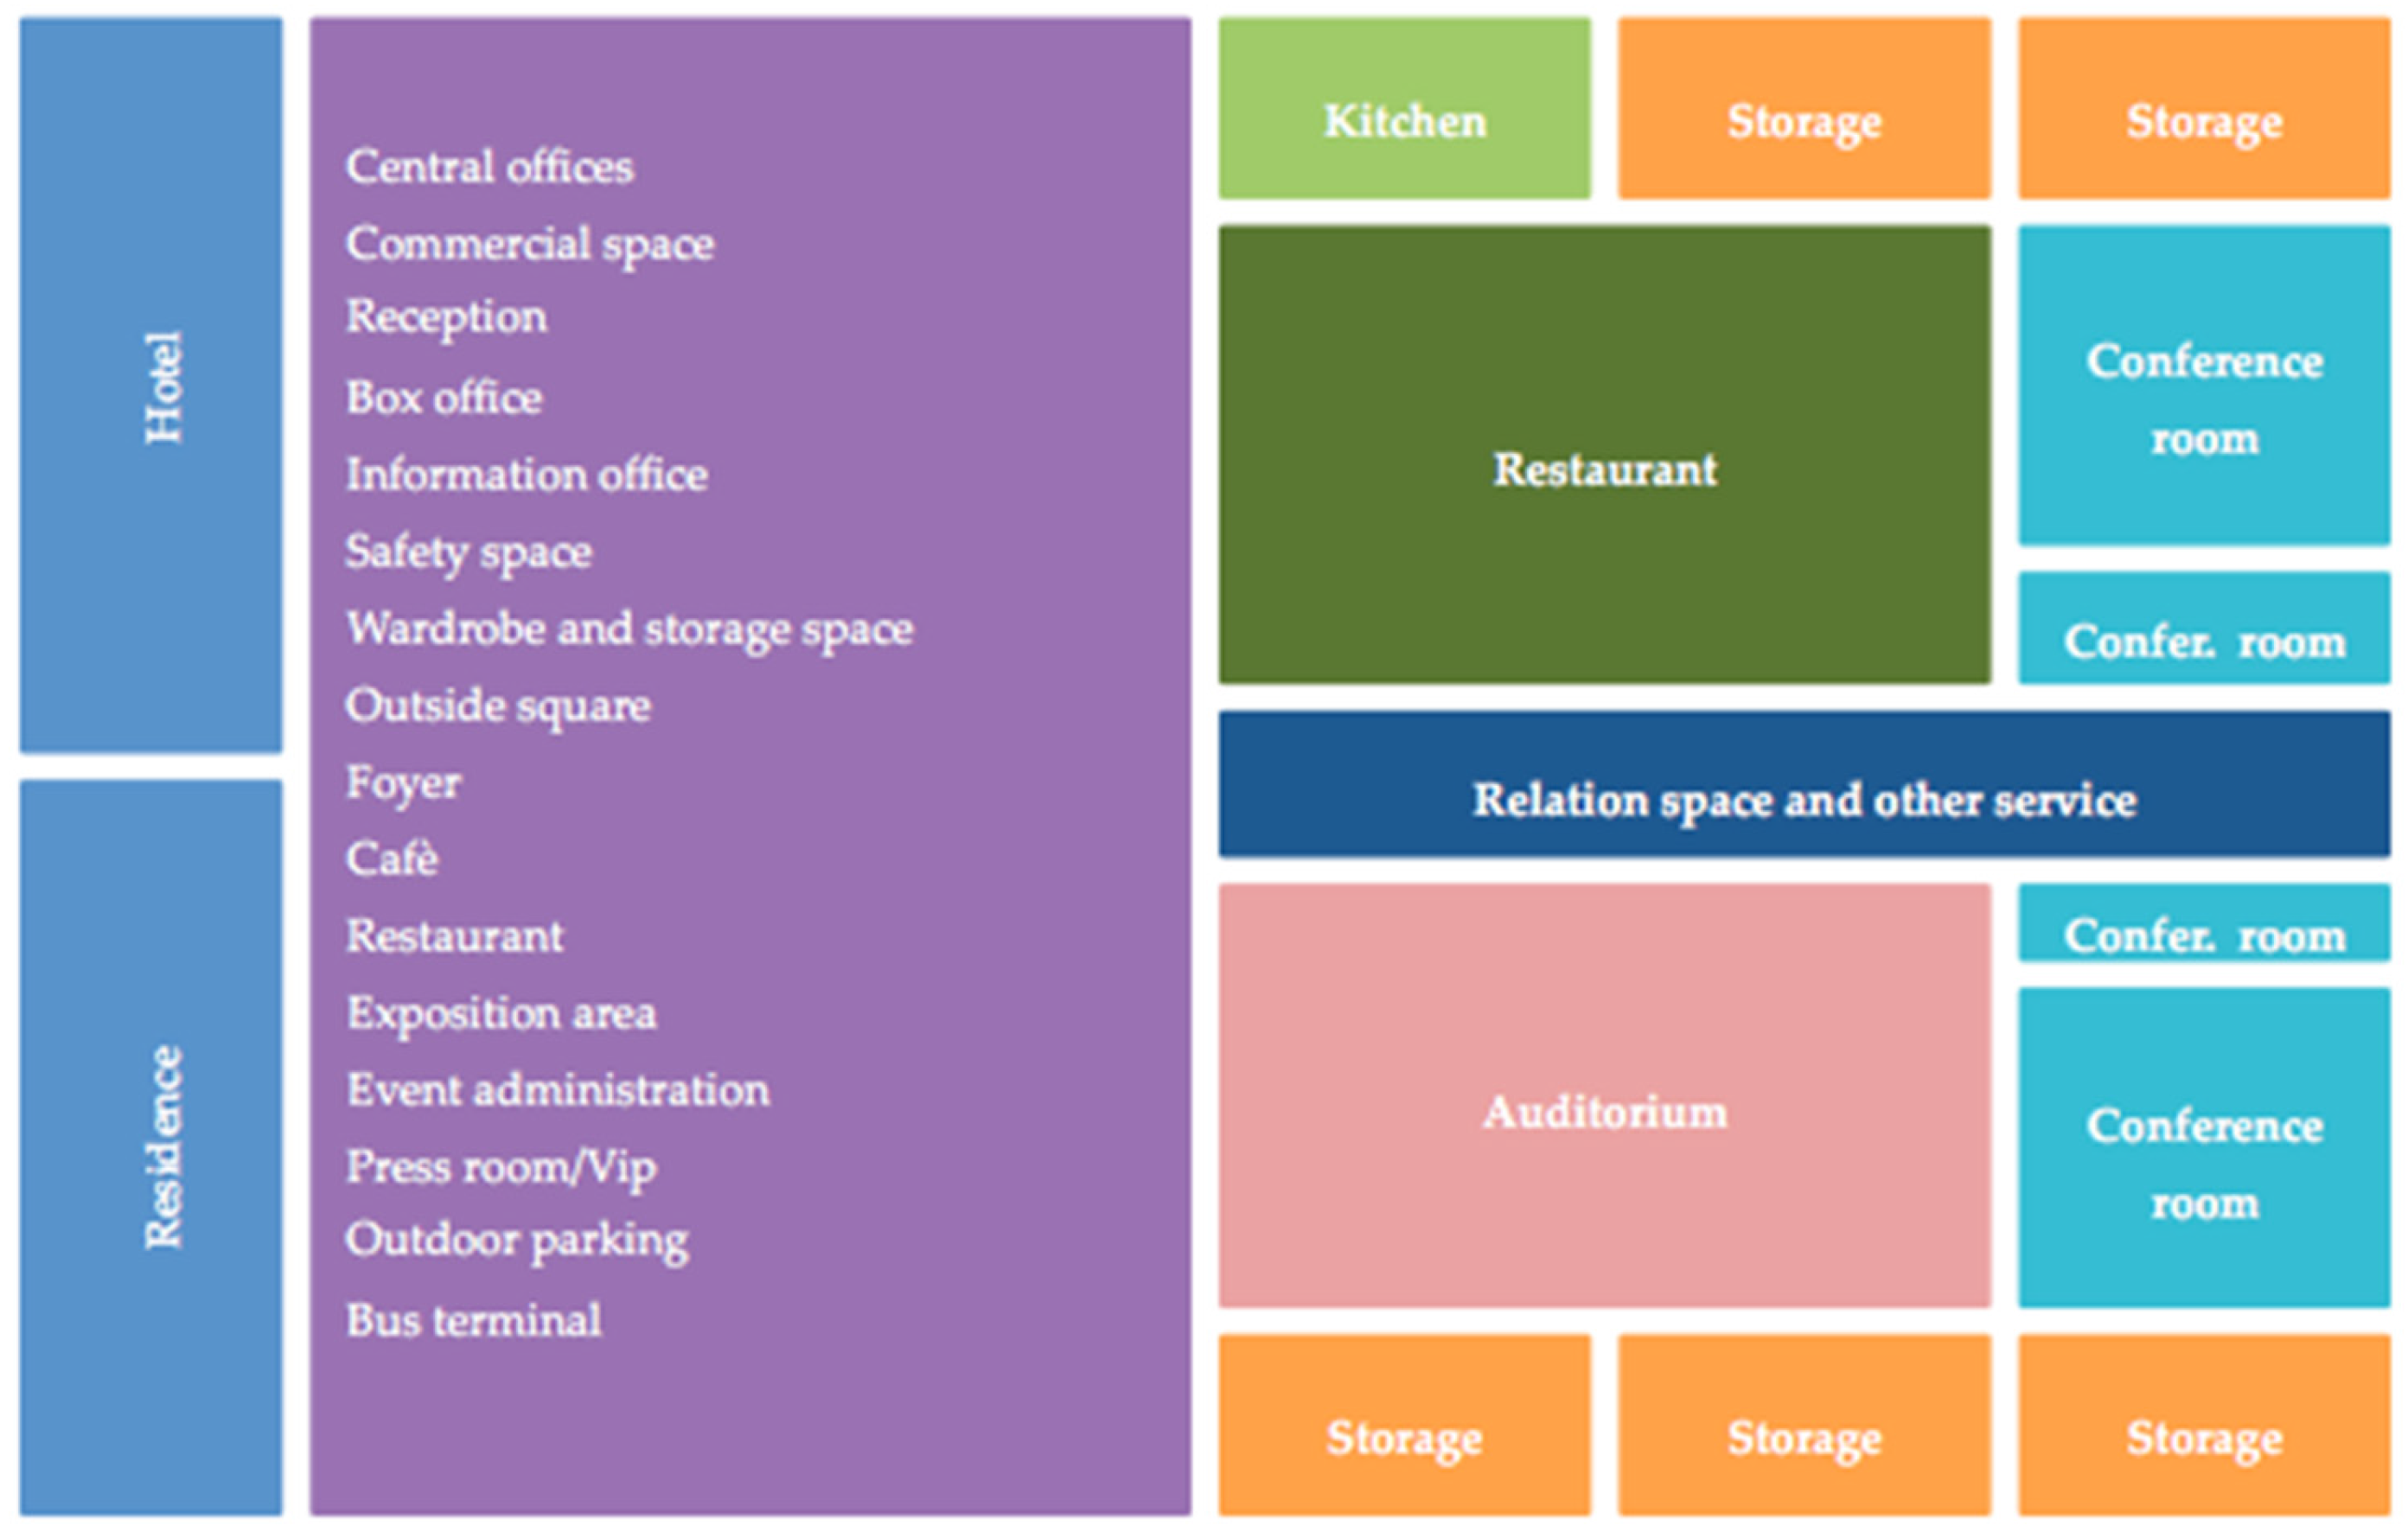
Table 1.
Sensitivity analysis results.
| Scenario 1 | Scenario 2 | Scenario 3 | ||||
|---|---|---|---|---|---|---|
| Alternatives | ||||||
| A | B | A | B | A | B | |
| Objectives | ||||||
| Economic | 0.255 | 0.078 | 0.218 | 0.052 | 0.292 | 0.104 |
| Social | 0.187 | 0.155 | 0.173 | 0.144 | 0.144 | 0.120 |
| Environmental | 0.213 | 0.187 | 0.213 | 0.187 | 0.170 | 0.149 |
| Urban Planning | 0.221 | 0.145 | 0.240 | 0.157 | 0.184 | 0.121 |
| Trasport Mobility | 0.090 | 0.060 | 0.135 | 0.090 | 0.180 | 0.120 |
| Total scores | 0.966 | 0.625 | 0.979 | 0.630 | 0.970 | 0.614 |
© 2017 by the authors. Licensee MDPI, Basel, Switzerland. This article is an open access article distributed under the terms and conditions of the Creative Commons Attribution (CC BY) license (http://creativecommons.org/licenses/by/4.0/).
Share and Cite
MDPI and ACS Style
Della Spina, L.; Lorè, I.; Scrivo, R.; Viglianisi, A. An Integrated Assessment Approach as a Decision Support System for Urban Planning and Urban Regeneration Policies. Buildings 2017, 7, 85. https://doi.org/10.3390/buildings7040085
AMA Style
Della Spina L, Lorè I, Scrivo R, Viglianisi A. An Integrated Assessment Approach as a Decision Support System for Urban Planning and Urban Regeneration Policies. Buildings. 2017; 7(4):85. https://doi.org/10.3390/buildings7040085
Chicago/Turabian StyleDella Spina, Lucia, Immacolata Lorè, Raffaele Scrivo, and Angela Viglianisi. 2017. "An Integrated Assessment Approach as a Decision Support System for Urban Planning and Urban Regeneration Policies" Buildings 7, no. 4: 85. https://doi.org/10.3390/buildings7040085
Note that from the first issue of 2016, this journal uses article numbers instead of page numbers. See further details here.