Numerical Modelling for the Thermal Performance Assessment of a Semi-Opaque Façade with a Multilayer of Nano-Structured and Phase Change Materials


Department of Industrial Engineering, University of Florence, Via Santa Marta 3, 50139 Florence, Italy
*
Author to whom correspondence should be addressed.
Buildings 2017, 7(4), 90; https://doi.org/10.3390/buildings7040090
Submission received: 28 July 2017
/
Revised: 31 August 2017
/
Accepted: 11 October 2017
/
Published: 14 October 2017
Abstract
:The aim of our present study was to assess and compare the thermo-physical and energy behaviour of different integrated building façades, using a multi-physics simulation approach. Advanced integrated façades composed of opaque modules, one of them with a phase change materials (PCM) layer, the others with multilayer panels, combined with transparent ones, consisting of nano-structured materials and new-generation photovoltaic systems, were investigated. A multi-physics approach was used for the design optimization of the studied components and evaluation of their thermo-physical and heat transfer performance. In particular, computational fluid dynamics (CFD) multi-physics transient simulations were performed to assess air temperature and velocity fields inside the ventilated cavities. Analysis of heat and mass exchange through all the components was assessed during heating and cooling mode of a reference building. The typical Mediterranean climate was considered. Results comparison allowed the dynamic heat transfer evaluation of the multilayer façades as a function of variable climatic conditions, and their flexibility and adaptability exploitation, when different energy strategies are pursued. The multi-physics modelling approach used, proved to be a strong tool for the energy design optimization and energy sustainability evaluation of different advance materials and building components.
1. Introduction
Research and technological innovation have produced a significant improvement in the building envelope thermal and energy performances, plant system and equipment. Energy efficiency has been investigated by comparing building retrofit/refurbishment solutions in existing non-residential buildings. Responsive Building Elements (RBEs), especially Advanced Active Integrated Façades (AAIFs), appear to be the most appropriate solutions for improving energy saving [1]. The AAIFs are an effective solution for renewable energy exploitation in Mediterranean climates and achieving energy sustainability with the use of dynamic construction elements able to passively absorb/adsorb, dissipate, or accumulate energy. There has been a considerable amount of research into the field of building envelope energy efficiency. In particular, applications of the AIF systems both at design/commercial and research levels, have taken into account the concept suggested in [1,2] of the envelope as a “dynamic” building element integrated with building plant/services. This means that thermo-physical behaviour of building components may easily change over time and adapt to different building/occupant requirements (heating/cooling, higher/lower ventilation, natural lighting) and boundary conditions (indoor/outdoor climate, internal heat loads, pollution, etc.). This concept is termed Responsive Building Elements (RBEs). With reference to a number of excellent studies on this subject, each type of solar façade actually belongs to the RBEs, both for their two main classifications, opaque solar façades and transparent or semi-transparent solar façades [2,3,4,5,6,7,8]. At present, most research has suggested different classifications for the study of advanced building façade systems, in order to assess their thermal behaviour by transient simulations and experimental measurements [9,10,11]. The common basis of all the research is the concept that a building envelope is to be conceived as a “self-sufficient building skin”. This means that it behaves dynamically incorporating different technologies (e.g., ventilation systems, decentralized heating/cooling units, heat exchangers, energy supply devices, energy storage, thermal buffering, sun shading purposes, lighting equipment, shading devices and natural and/or forced ventilation in the cavities). This façade system, (Multifunctional Facade Modules—MFMs), interacts with the other building services in order to reduce energy consumption, summer cooling loads, winter heat losses and assure thermal comfort, natural lighting, acoustic insulation, correct building ventilation and indoor air quality [10]. Thermal performance of these special building envelopes (in the form of active and interactive façades, respectively equipped with mechanical and natural ventilation cavities) has been investigated experimentally and numerically to analyze energy efficiency and potential in reducing cooling demand during the summer season, especially in a Mediterranean climate [12,13]. Experimental measurement campaigns of a ventilated building envelope were carried-out in a PASLINK test-cell in the Athens area [14]. The results obtained have highlighted, as the ventilation rate of the cavity is the wall working fundamental parameter useful to control the optimal transfer of the heat received by the external façade in the summer season. In particular, experimental data analysis has proved that mechanical ventilation is necessary in the presence of a radiant barrier effect of the wall during summer night-time. The energy benefit due to the phase change materials (PCM) use inside different building components has been studied in [15]. The author has suggested a simple model to assess thermo-physical performance of PCMs applied on the inner surface of all of the indoor walls. The model estimates the optimal thickness of the PCM layer, which can be discharged by night ventilation and/or the total wall surface necessary for the storage effect of the external and internal heat sources. Dynamic simulation results, obtained with Energy Plus software, of the PCM application on three different buildings in a Mediterranean climate, have shown the buildings thermal and energy performance improvement. However, it has also been demonstrated that strong night ventilation is crucial for the energy discharge that stored up in the building mass during the day. The influence of mass and thermal capacity of building envelopes was also investigated in [16,17]. In this study, different design strategies, combining mass and insulation solutions with bioclimatic building design, have been assessed using a thermal simulation model, usually applied to passive solar and low energy buildings, in order to evaluate their impact on cooling and heating energy consumption. Parametric studies of mass and (external) insulation solutions of residential buildings, located in a Mediterranean area, have been developed for thermal and energy performance evaluation. Most of the literature has directed advanced multifunctional façade systems towards renewable energy source integration, passive and active solar applications and building plant system use connections, by means of experimental testing and/or validation and simulation [18,19,20]. Although the experimental approach can provide accurate results, it is very time consuming and expensive. It also requires complex measuring systems and specific dedicated sensors. Usually, it is particularly design-dependent and not always easily reproducible. The aim of our present study was to assess and compare the thermo-physical and energy behaviour of different building integrated façades, using a multi-physics simulation approach that can be carried out by commercial software [21]. In our current research, a numerical modelling, which can be used to predict thermo-physical and energy performance of advanced integrated active façade systems, is provided. The proposed methodology is based on computational fluid dynamics (CFD) transient simulations combined with a multi-physical approach applied to solid geometric models. This method allows evaluation of the following aspects:
- the relevant thermo-physical parameters and the energy performances of the advanced façade systems (taking into account different energy designs, renewable energy integrated uses);
- comparison of the energy performance of the integrated building components considered located in different Mediterranean areas, characterized by large hourly climatic fluctuations;
- the energy assessment of the façade components studied when integrated with building and plant systems.
Our method can also be an important predictive simulation tool for establishing the energy design of the AAIFs, so as to reach effectiveness, energy sustainability and thermal comfort.
2. Materials and Methods
2.1. Geometry and Materials
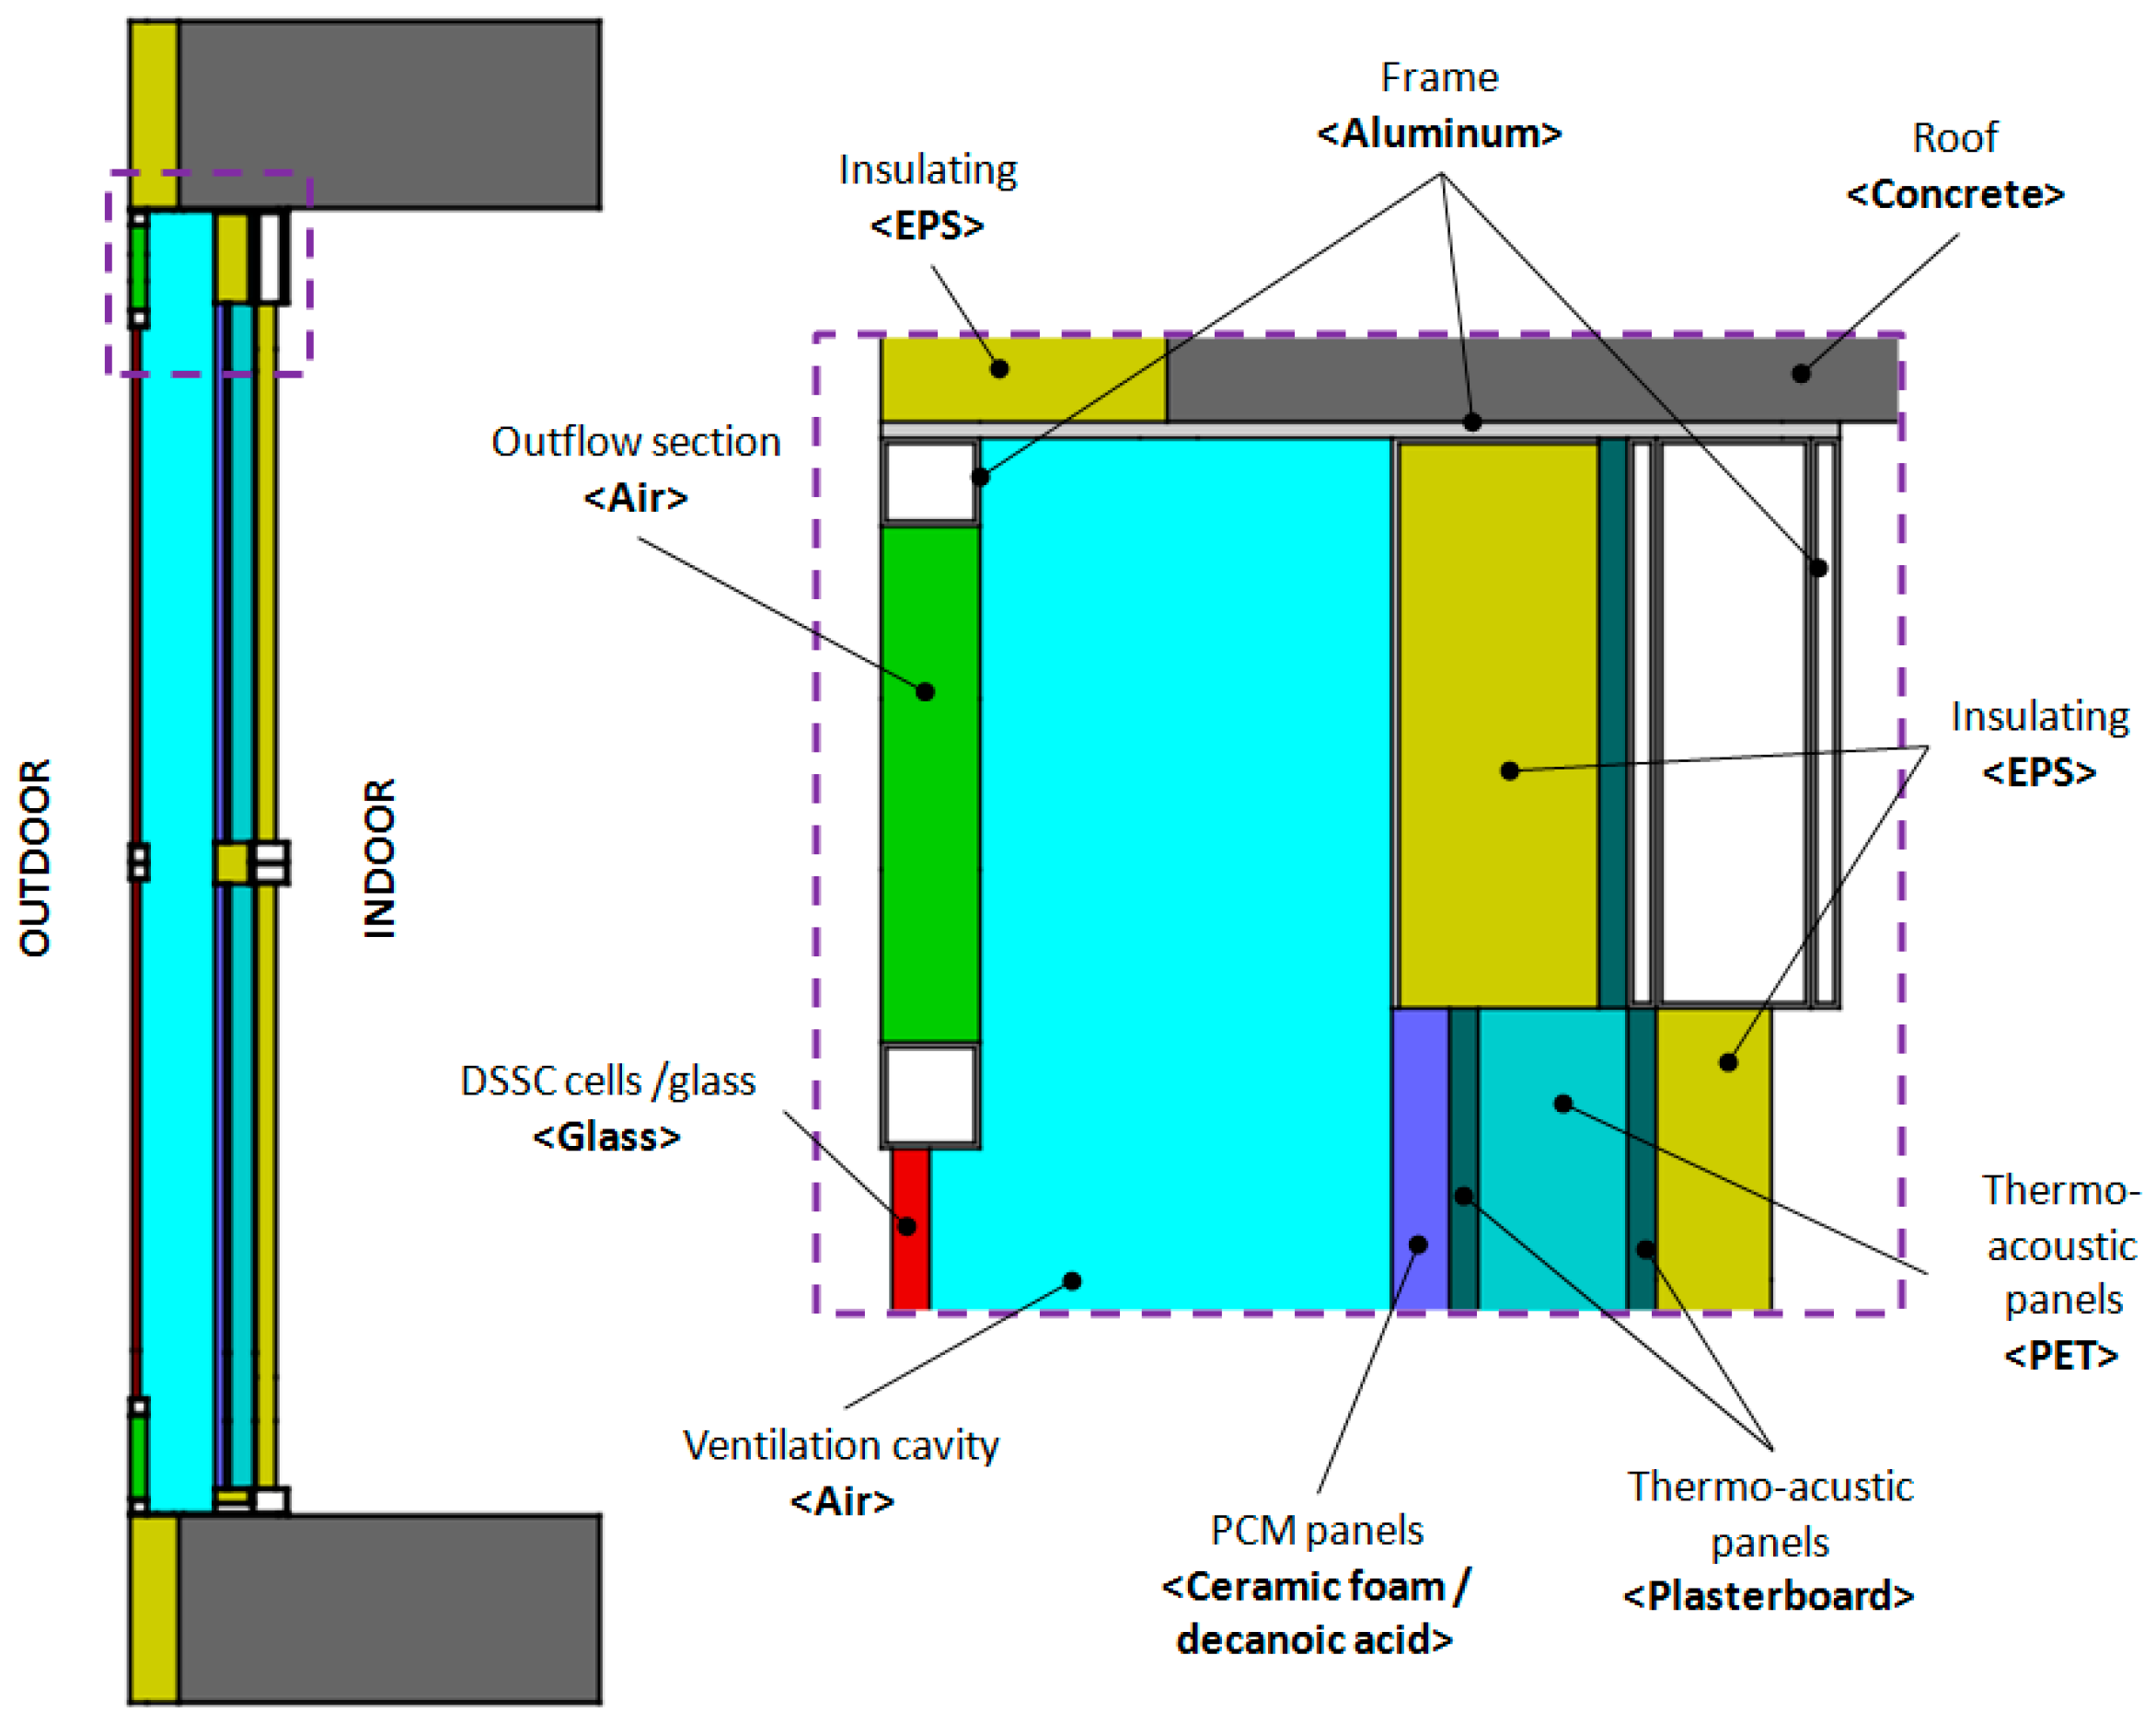
Two basic typologies of advanced integrated and semi-opaque façades were investigated by fluid-dynamic and thermal analysis transient simulations. Two-dimensional geometric models were built up in two different configurations with respect to different layers of the building envelope. The solid geometry used for numerical simulations is outlined in Figure 1 and Figure 2 for both configurations. The longitudinal sections are provided together with an enlargement of the top portion. The façade configurations refer to a funded and ongoing research project cited in the acknowledgment.
The first configuration, from now on labelled <S1>, consists of a ventilated cavity bounded by an infrared (IR) glass layer from outdoors and a multilayer wall from indoors. The air cavity has an inlet and outlet section connected to the external environment, respectively located at the bottom and top. The air cavity was geometrically built up taking into account the sixteen horizontally arranged honeycomb ceramic panels charged by TiO2. These panels are conceived for internal air cleaning and purification when external air is also used for indoor ventilation. This working condition was not considered in our present study. The honeycomb ceramic panels were modelled and studied because of their important incidence for fluid dynamic resistance and thermal capacity in CFD Multi-physics transient simulations. The multi-layer wall consists of a sandwich thermo-acoustic panel (plasterboard and polyethylene terephthalate (PET)) and an insulating expanded polystyrene (EPS) panel. The EPS is also used to insulate the concrete at the floor/roof levels and some portion of the aluminum frame of the system. The second configuration, from now on labelled <S2>, is similar to <S1>. The main differences consist of the use of external glass integrated by Dye Sensitized Solar Cells (DSSC) on the outer side of the ventilated air cavity and panels made of a Phase Change Material (PCM) embedded in ceramic foam on the inner side. The <S2> system does not have honeycomb panels. In order to assess the dumping/buffering thermal effect of the PCM with respect to the external cyclic thermal load transmitted to the indoors, the same <S2> system was simulated without the PCM panels. In this latter case, the air cavity includes the thickness for positioning the PCM panels. This configuration is labelled <S3> from now on. Therefore, the <S3> geometric configuration almost corresponds to the <S2> layout given in Figure 2. The only difference in <S3> with respect to <S2> is the lack of the PCM panels (indigo represented in Figure 2), and the consequent wider dimension of the air cavity (in <S3>, the air cavity extends to the sandwich thermo-acoustic panel).
Thermo-physical properties of the construction materials used for <S1> and <S2>/<S3> systems were obtained by a wide-ranging comparative search for the most significant experimental and testing studies in the literature on this subject. They are listed in Table 1. In particular, results of practical tests and assessments of PCM-incorporated building elements widely performed experimentally in the literature [13,19,20,22,23,24] were also considered and used for dynamic simulations.
Thermo-physical properties of PCM panels given in Table 1 refer to the values averaged on the experimental evidence provided by recent literature, evaluated for a finite product made of decanoic acid embedded in a ceramic foam and contained in a plastic envelope. The ceramic foam is filled by the decanoic acid; the resulting medium is optically opaque. Referring to PCM, the temperature of liquid–solid transition is Tm = 34 °C, with L = 153.2 kJ/kg the phase change enthalpy (latent heat of fusion/solidification). Thermal conductivity values both for liquid (L) and solid (S) states are shown in the same Table 1.
At present, there are few applied studies of detailed simulation techniques of PCMs for building applications. Fundamental heat and mass exchanges governing equations, characterized by nonlinear phenomena changing over time and space, especially when PCM is incorporated and/or encapsulated in opaque/transparent systems, have to be considered for transient numerical simulation assessment. Starting from the existing studies on proper PCM simulation [17,19,20,24], we applied a numerical procedure based on the enthalpy formulation of the energy equation in order to simulate the melting/solidification in the PCM medium, as described in the following section.
2.2. Governing Equations
As is common knowledge, the working principle of a natural ventilated façade is based on the buoyancy-driven flow induced on the air flow rate inside a cavity, mainly due to thermal load on the boundary layers and radiative heat exchange in the same channel. Depending on the external climatic constraints (external air temperature, incident solar radiation) the air inside the channel is moved by a buoyancy and draft effect due to natural convection. Reynolds Averaged Navier–Stokes (RANS) and energy equations were numerically solved under the assumptions of Newtonian fluid and uncompressible flow. This assumption allows the assessment of the natural convection with turbulent flow in the air cavity of the ventilated façade. Air density was considered a temperature dependent variable by means of the ideal gas law. A closure scheme based on a two-equation (k-ε) turbulence method was adopted for solving the momentum and continuity equations. Hinojosa et al. [25] demonstrated the k-ε turbulence model is one of the most suitable closure schemes for turbulent airflow simulation in ventilated cavities.
The numerical modelling of the phase change process was developed by a specific formulation of the energy equation, taking into account the numerical approach suggested by [17,26], validated in [27] and applied in [28]. Consequently, the use of a numerical scheme based on continuous equation discretization is appropriate for solving physical problems involving liquefaction/solidification of building materials [17,26,27,28]. Lee et al. [29] used a discretized method based on a finite difference approach in order to model the phase change process of PCM used for building purposes in 1D approximation. In our study, we adopted an equivalent specific capacity formulation for taking into account the latent heat released during the phase change. The method that we propose is not limited to the use of an average temperature value evolving over time (1D approach) because the physical properties of all the materials depend on the local temperature, spatially computed during the transient analysis. Two values of the mean thermal conductivity and thermal capacity were considered when they refer to the solid and/or liquid state. From a numerical modelling point of view, the heat transfer in the PCM is a transient, nonlinear phenomenon with a moving solid–liquid interface, generally connected to the well known “moving boundary” solution problem that can be solved by using the method suggested in [29]. The proposed formulation is based on the assumption that the phase change happens with a small temperature variation; therefore, ΔT = TL − TS, where TS is the temperature of the solid phase when the fusion process begins, while TL is the temperature of the liquid phase once the medium is fully melted. Under this assumption, the energy equation in the PCM can be formulated as follows:
where:
and being:
The solid–liquid interface in the melting medium corresponds to the isotherm curve at the temperature Tm = (TL + TS)/2. In this study, a temperature difference of ΔT =0.1 °C (being Tm = 34 °C) was chosen. Smoothed Heaviside step functions were chosen to define the PCM thermo-physical properties as functions of temperature, in order to dispose of continuous and differentiating functions taking into account the different values of physical properties in the neighborhood of phase transition. The connected model validation, referring to the applied numerical procedure adopted to simulate the phase change process and used for the current studied applications, is reported in a recent paper [27]. Here, a successful comparison between numerical results and experimental evidence from literature [27] is provided.
2.3. Numerical Modelling
The commercial multi-physical and finite element analysis (FEA)-based software COMSOL Multiphysics (COMSOL 5.3, Burlington, MA, USA) [21] was used to solve fluid-dynamic and thermal transient fields during transient investigation of the façades studied. Continuous equations were discretized by the Finite Element method on non-structured and non-uniform computational meshes made up of triangular Lagrange elements of the second order. Influence of spatial discretization was preliminarily checked, in order to assure mesh-independent results. Table 2 shows an extract of the grid test.
In particular, the average values of the temperature at the outflowing section, the average temperature of air inside the cavity and the rate of airflow are given for <S3> configuration at 12 h in summer conditions. The relative difference in temperature as a function of the mesh refinement is very low. The maximum relative gap computed on the outflowing airflow is less than 3.6%. Mesh #2 was retained for computations.
Time-marching was performed by adopting an Implicit Differential-Algebraic (IDA) solver, based on variable-order and variable-step-size Backward Differentiation Formulas (BDF). Because the time-marching scheme is implicit, a nonlinear system of equations was solved at each time step by applying a modified Newton algorithm. Algebraic systems of equations coming from differential operator discretization were solved by a multi-frontal package, a direct solver being particularly efficient for computing unsymmetrical sparse matrixes by an LU decomposition technique (LU stands for the well known, in the numerical analysis, “Lower Upper” factors as the product of a lower triangular matrix and an upper triangular matrix).
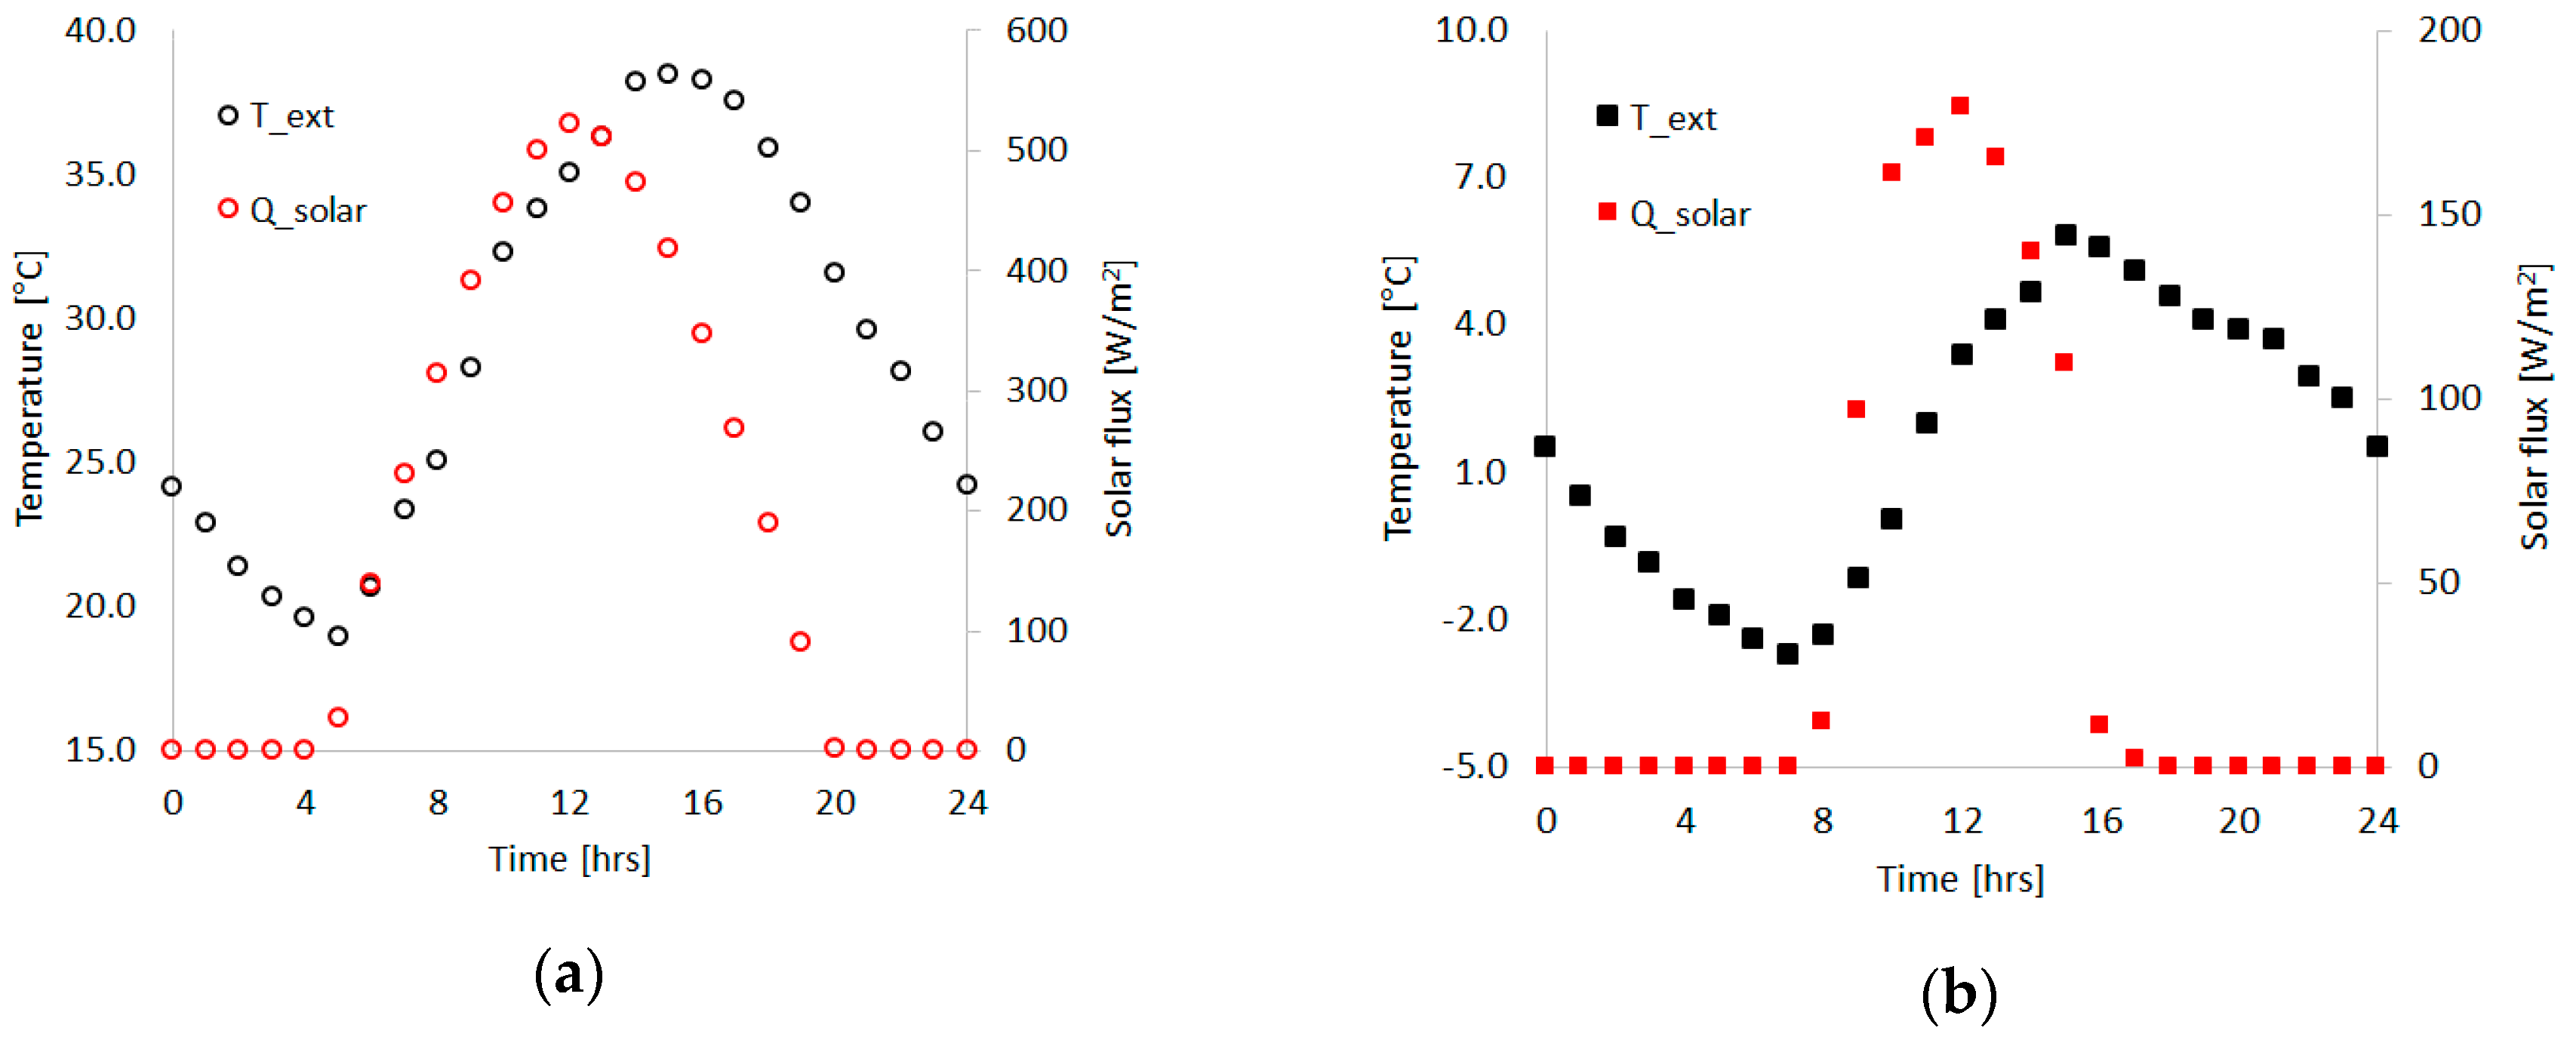
In order to compare results, all the analyses were applied to the same time-variable boundary thermal constraints of the numerical model used for <S1>, <S2> and <S3>. We performed simulations during two representative days: the first one referring to summer conditions, the second one to winter conditions. Boundary constraints correspond to the external climatic data concerning the hottest/coldest day of the summer/winter conditions for a Mediterranean climate (Florence, Italy), that correspond to maximum/minimum values of the air temperature and solar radiation on a vertical south-exposed surface (16 July/26 January), which was processed by applying the method suggested in [30]. This choice was due to the interest in developing the study on thermo-physical performances of building envelope during the most critical climatic conditions. Therefore, the assumed hourly climatic data are shown in Figure 3a,b, where daily time evolution of the external air temperature (black circle symbols) and total solar radiation incident on the south façade (red squared symbols) are shown for the summer (16 July) and winter (26 January) simulated day. It should be noted that thermal constraints applied to the system fall within a very wide range of climatic data (maximum air temperature in summer and minimum air temperature in winter), by enabling the system to be fully characterized in a wide range of potentials and different locations (climatic) of use.
A stabilized periodic regime was achieved before results post-processing. This item was successfully achieved by consecutively applying the same daily-evolution of the thermal constraints during several days of simulations, in order to obtain velocity and temperature fields not dependent on the initial numerical conditions. The procedure was stopped when no differences were found between velocity and temperature evaluated in several chosen points of the geometry at the same time but referring to two consecutive days. All of the remaining boundary conditions used in the model can be summarized as follows. At the external surfaces of the building envelope, we considered a combination of the incident solar flux and a thermal dispersion due to a conjugate convective and radiating heat flux from the wall to the ambient. A solar factor (SF) of 0.67 was considered, SF being the percentage of incident heat that passes through the reflective IR Glass/DSCC Glass layers (DSCC stands for glass integrated with Dye Sensitized Solar Cells). The convective flux contribution was expressed considering a heat transfer coefficient (h_ext = 23 W/(m2 K)) and the difference between the local wall temperature and the external temperature. The radiating flux contribution was expressed by means of a global surface emissivity of 0.84, considering a surface-to-ambient heat transfer mechanism. For the inner surface of the façade (facing indoors), we only considered a convective heat flux, the internal heat transfer coefficient being h_int = 7.7 W/(m2 K) and assuming a constant controlled indoor temperature T_in = 24 °C. The values of the heat transfer coefficients were deduced from the current standards [31,32]. Concerning the open boundary of the system (incoming/outflowing air to/from the cavity), the external air enters the cavity at the time-variable external temperature while an outflowing thermal condition (null normal thermal gradient) was used for the outlet section of the cavity. Insulation conditions were finally assumed at all the roof/floor boundaries.
3. Results
This section shows the velocity and temperature fields obtained as results of the governing equations integration. The air velocity fields inside the channel (i.e., the air cavity) of the façade, due to the natural convection computed for summer conditions at 12 a.m. are given in Figure 4 for the <S1>, <S2> and <S3> systems.
The horizontal honeycomb panels of <S1> obstruct the thermal driven airflow inside the ventilation cavity; therefore, the velocity magnitude is relatively lower than that of the <S2> and <S3> configurations. It is important to notice that the colour scale in each plot given in Figure 4 is adapted to each system in order to enlarge the motion field representation for each one. Though the airflow in <S2> and <S3> is very similar, in the <S3> system, it is more intense because of the increased width of the ventilation channel with respect to the <S2> configuration. The flow pattern computed for the winter conditions are topologically very similar to those shown in Figure 4 evaluated for the summer conditions, but the magnitude of the motion and air flow fields is much lower: the maximum velocity achieved at 12 h in winter conditions for the <S1>, <S2> and <S3> systems are, respectively, 0.28, 0.52 and 0.59 m/s.
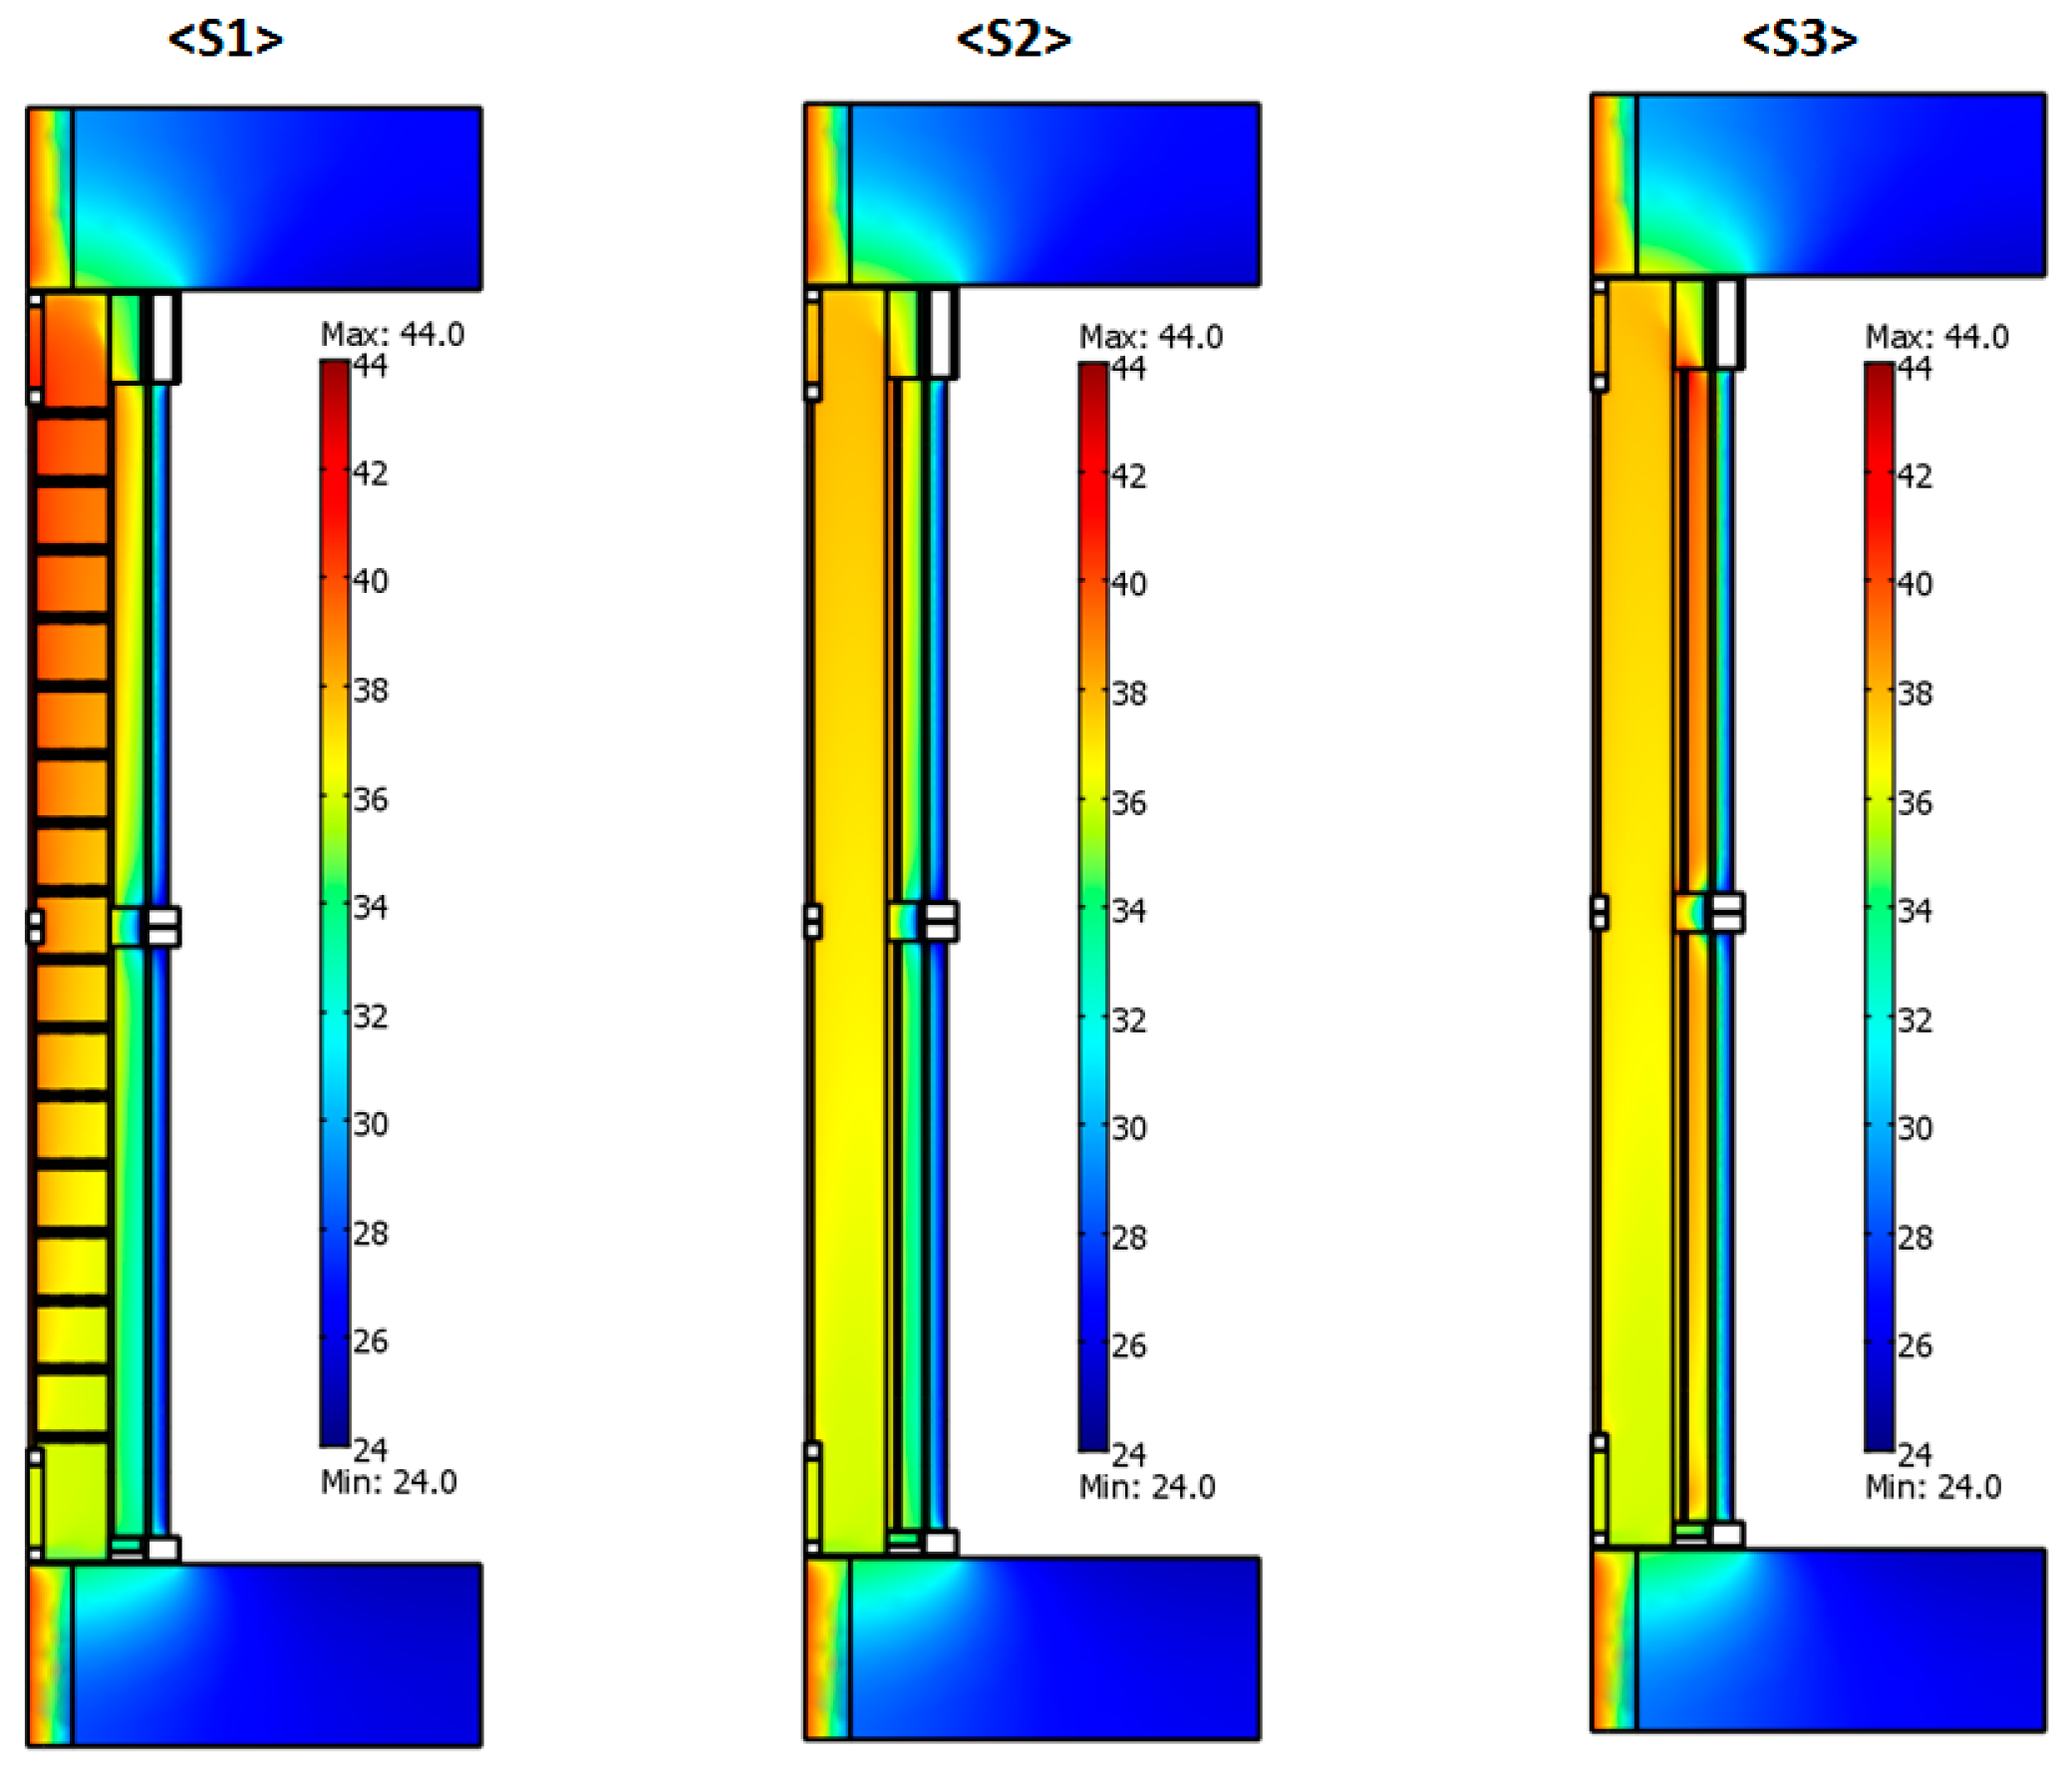
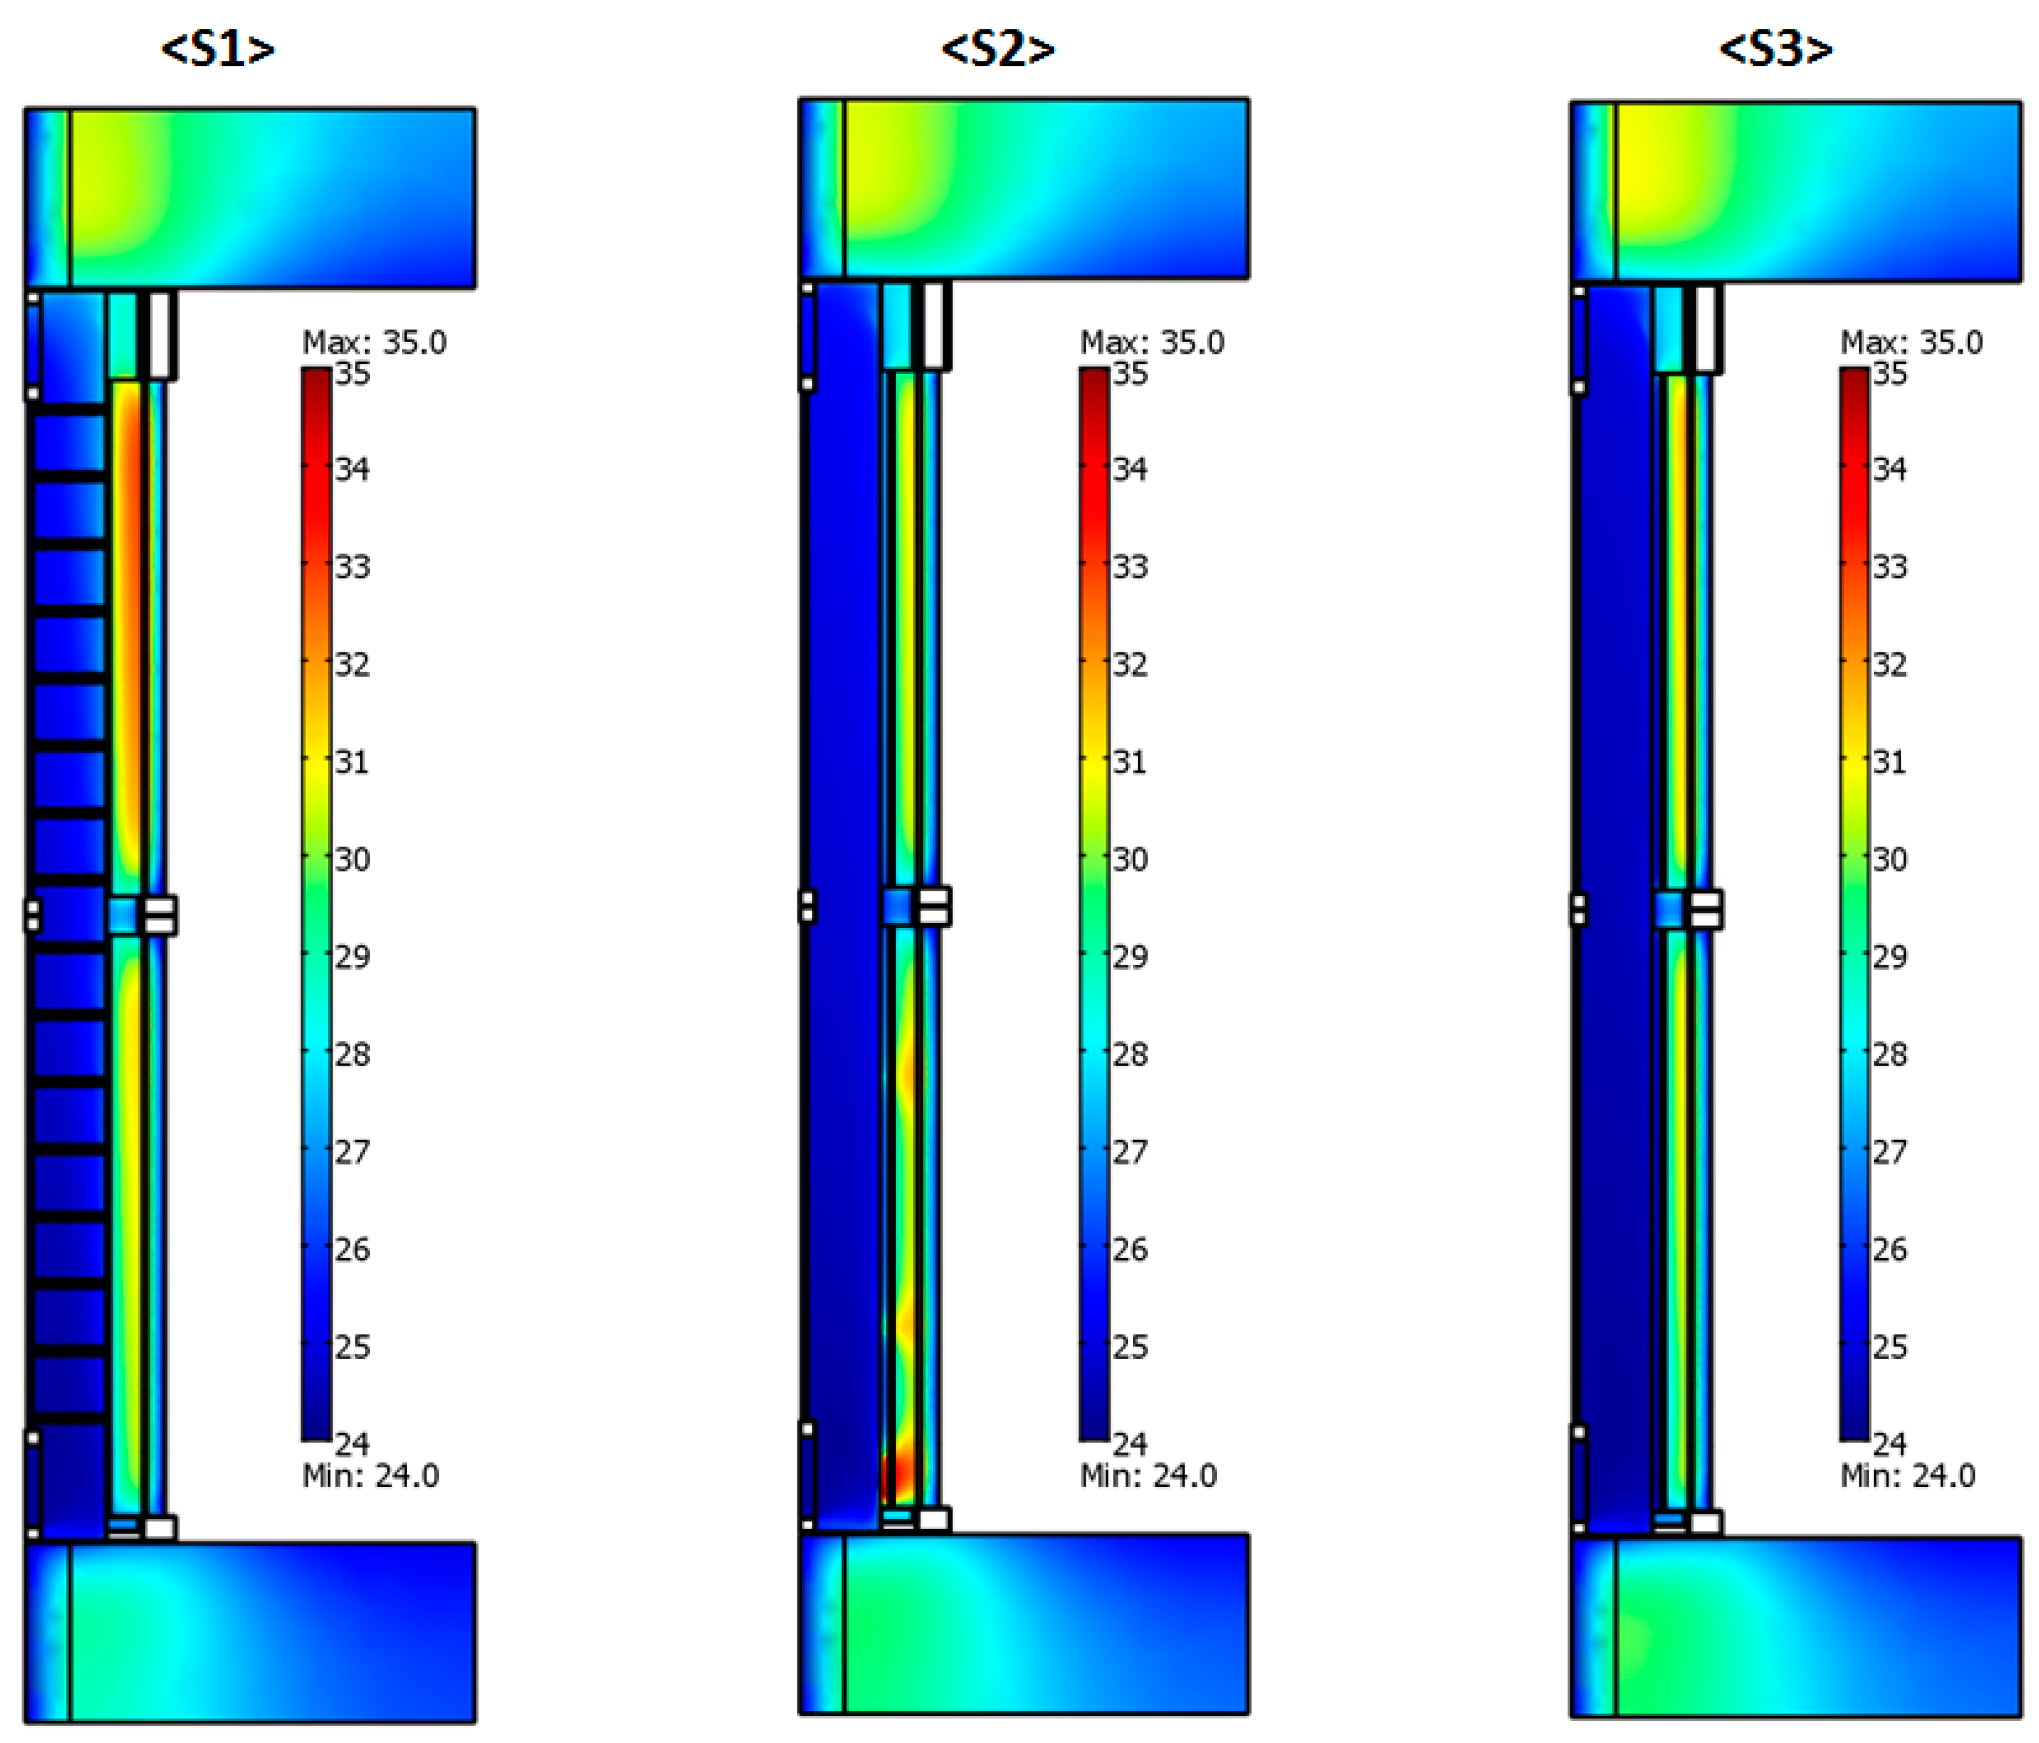
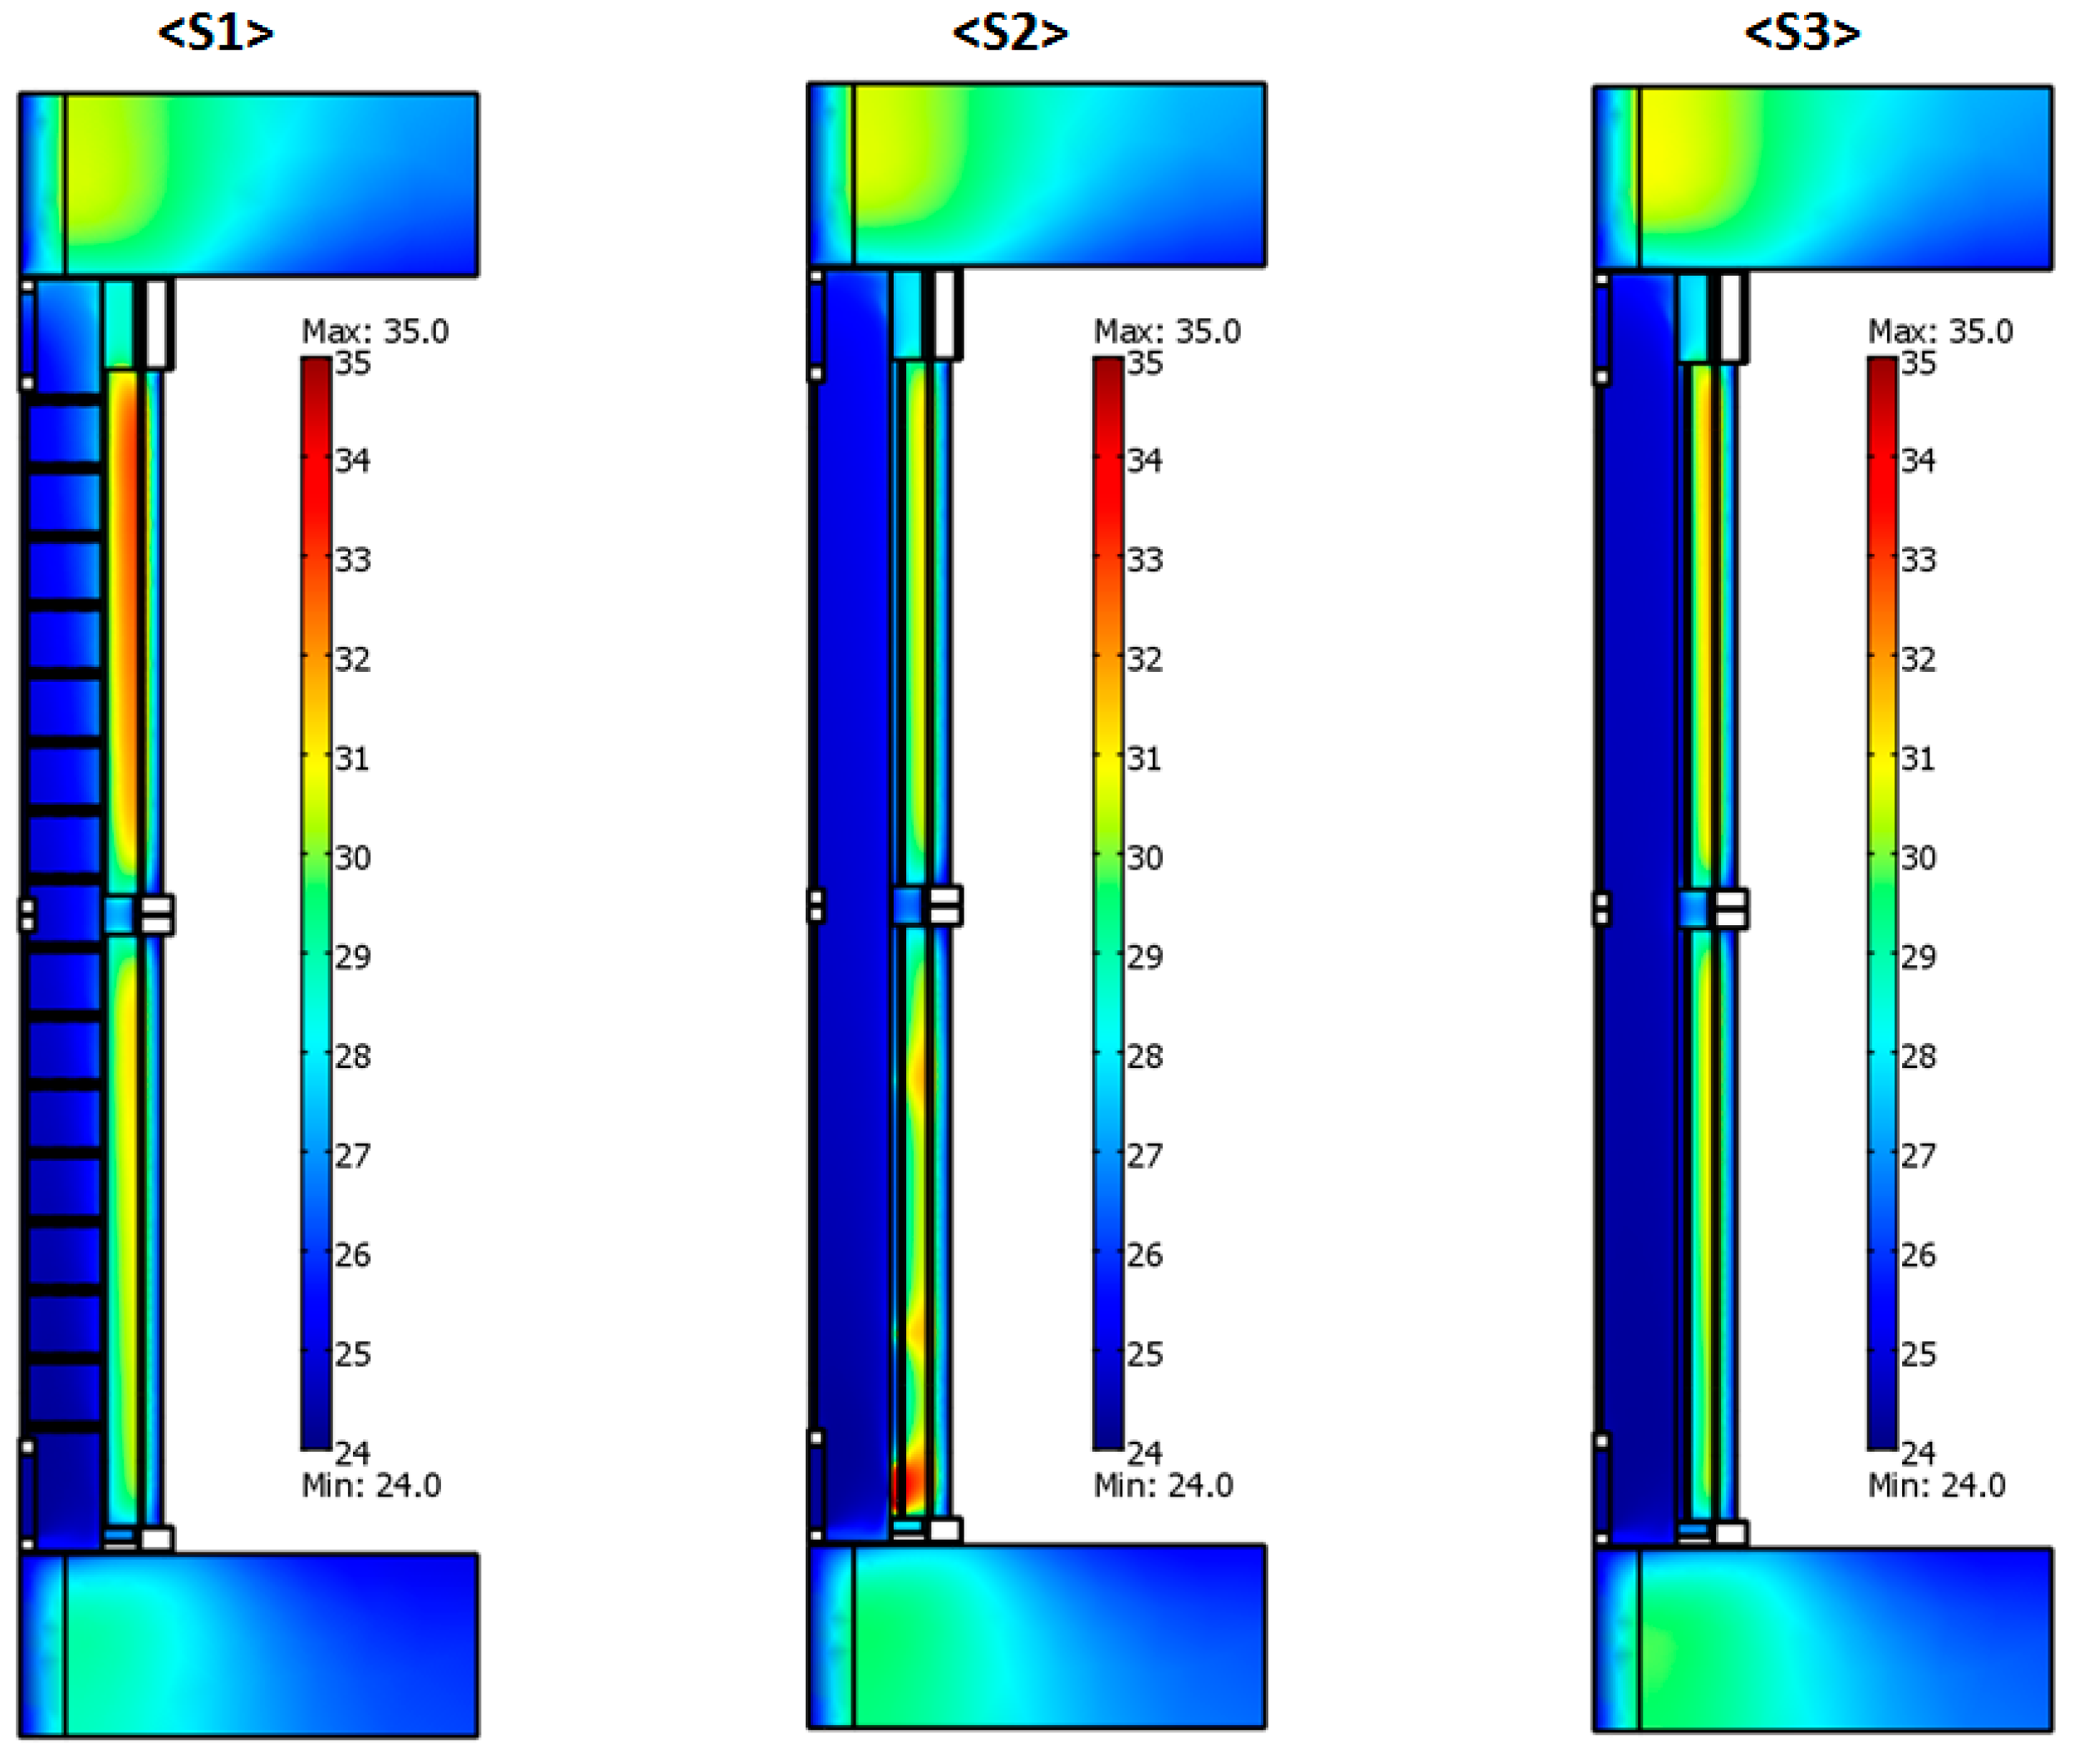
Figure 5, Figure 6, Figure 7 and Figure 8 provide the temperature distribution, read as temperature field, evaluated at 6 h, 12 h, 18 h and 24 h for the <S1>, <S2> and <S3> systems. For each figure (Figure 5, Figure 6, Figure 7 and Figure 8), the colour scale provides a useful comparison of the thermo-physical behaviour of the three system configurations. Comparison of the temperature distribution fields suggests the following basic considerations.
Due to the low airflow velocity in the ventilation cavity, the air temperature values inside <S1> system are higher than those in the <S2> and <S3> systems, especially in the upper part of the cavity. This causes an important vertical thermal gradient in the ventilation cavity in <S1> that is transmitted to the layers behind, closer to the indoor environment. The thermal buffer and damping effects induced by the PCM panel in <S2> are evident with respect to the <S3> configuration, especially in the bottom portion of the system, corresponding to the inlet region of the airflow at the outside climatic conditions. At 6.00 a.m. (Figure 5), the temperature values inside the PCM panel are only slightly higher for the <S2> than <S3> systems because of the energy buffered during the previous day. Otherwise, at 12 h (Figure 6) and 6.00 p.m. (Figure 7) the PCM panel keeps temperature values lower than those of the <S3> configuration. In particular, at 6.00 p.m., the PCM layer seems to “lock” the temperature at approximately 34 °C, which corresponds to the solid/liquid phase change of the material used for simulations.
On the other hand, at 12.00 p.m. (Figure 8), the heat buffered by PCM during the hottest part of the day provides higher temperature values with respect to those obtained for <S3>. In the bottom part of the PCM panel inside the <S2> system, temperature distribution at 12.00 p.m. (Figure 8) highlights the incoming air “impact” on the PCM panel, the solid interface and then the local increase of the heat transfer. This effect is evident when analyzing the colour variation along the vertical direction from red-green to yellow-red given in Figure 8 (<S2> system) and the velocity field provided by Figure 4 (<S2> system). Figure 9 provides the thermal fields evaluated for the system at 12 h during winter conditions. In general, thermal behaviour of <S2> and <S3> configurations in winter climate is very similar, temperature being always far from the PCM transition threshold.
4. Discussion
Results were post-processed in order to deduce a further characterization of the three systems studied. The average air velocity at the outlet section of the ventilated air cavity was computed for the air flow rate evaluation due to the different façade configurations that are graphically shown in Figure 10, respectively, for <S1>, <S2> and <S3> in summer (circle symbols) and winter (squared symbols) conditions.
Due to the lower solar radiation incident on the building envelope during the winter period, the airflow rate flowing inside the façade cavity is lower with respect to the one obtained for the summer period. This item was found for each system configuration. Otherwise, for summer and winter conditions, the air motion field for <S1> is lowest with respect to the other two configurations: the transient assessment of the outflowing air stream highlights this effect. The airflow rate is at a maximum for the <S3> configuration because of the higher width of the cavity with respect to the <S2> (this system is devoid of the PCM panel). However, because of the higher thermal level detected in the <S1> configuration, thermal power dissipated by ventilation (i.e., the thermal flux extracted from the chimney) is comparable between all of the studied configurations, both in summer and winter. Figure 11 provides the comparison between thermal power rates dissipated by natural convection for the three façade systems, in summer and winter conditions. Thermal power removed from the façade system by the heated air flowing in the cavity is absolutely higher during summer and for the <S3> configuration.
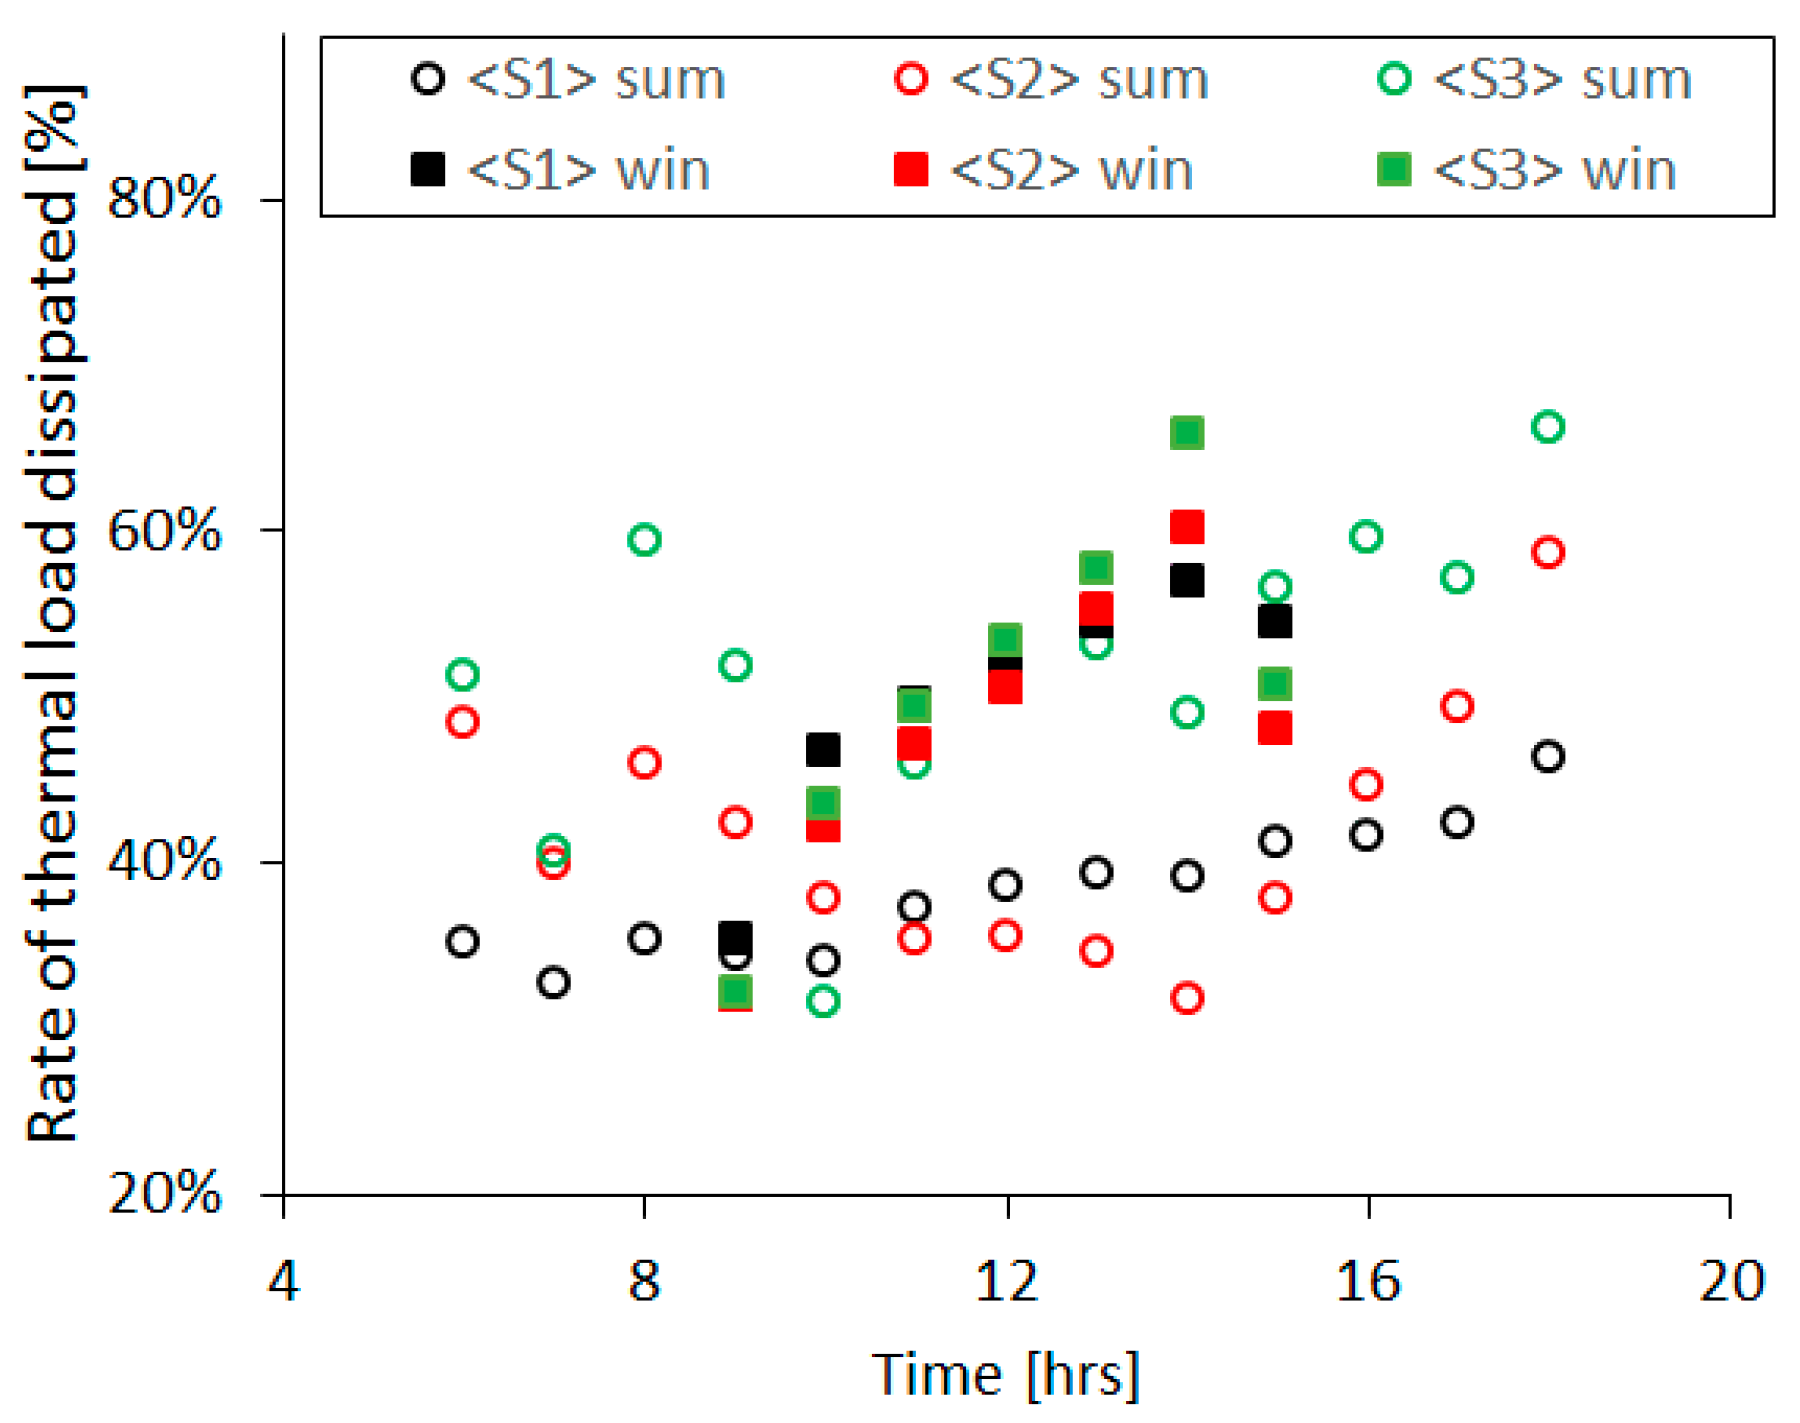
On the other hand, Figure 12 shows the values of an index that we defined the efficiency evaluation of the three studied façade configurations. This efficacy index is provided by the ratio between the total heat extracted from the channel due to ventilation and total solar radiation flux incident on the façade. Because of its formulation, the efficacy index values were computed only during the hours of the day when solar radiation is present.
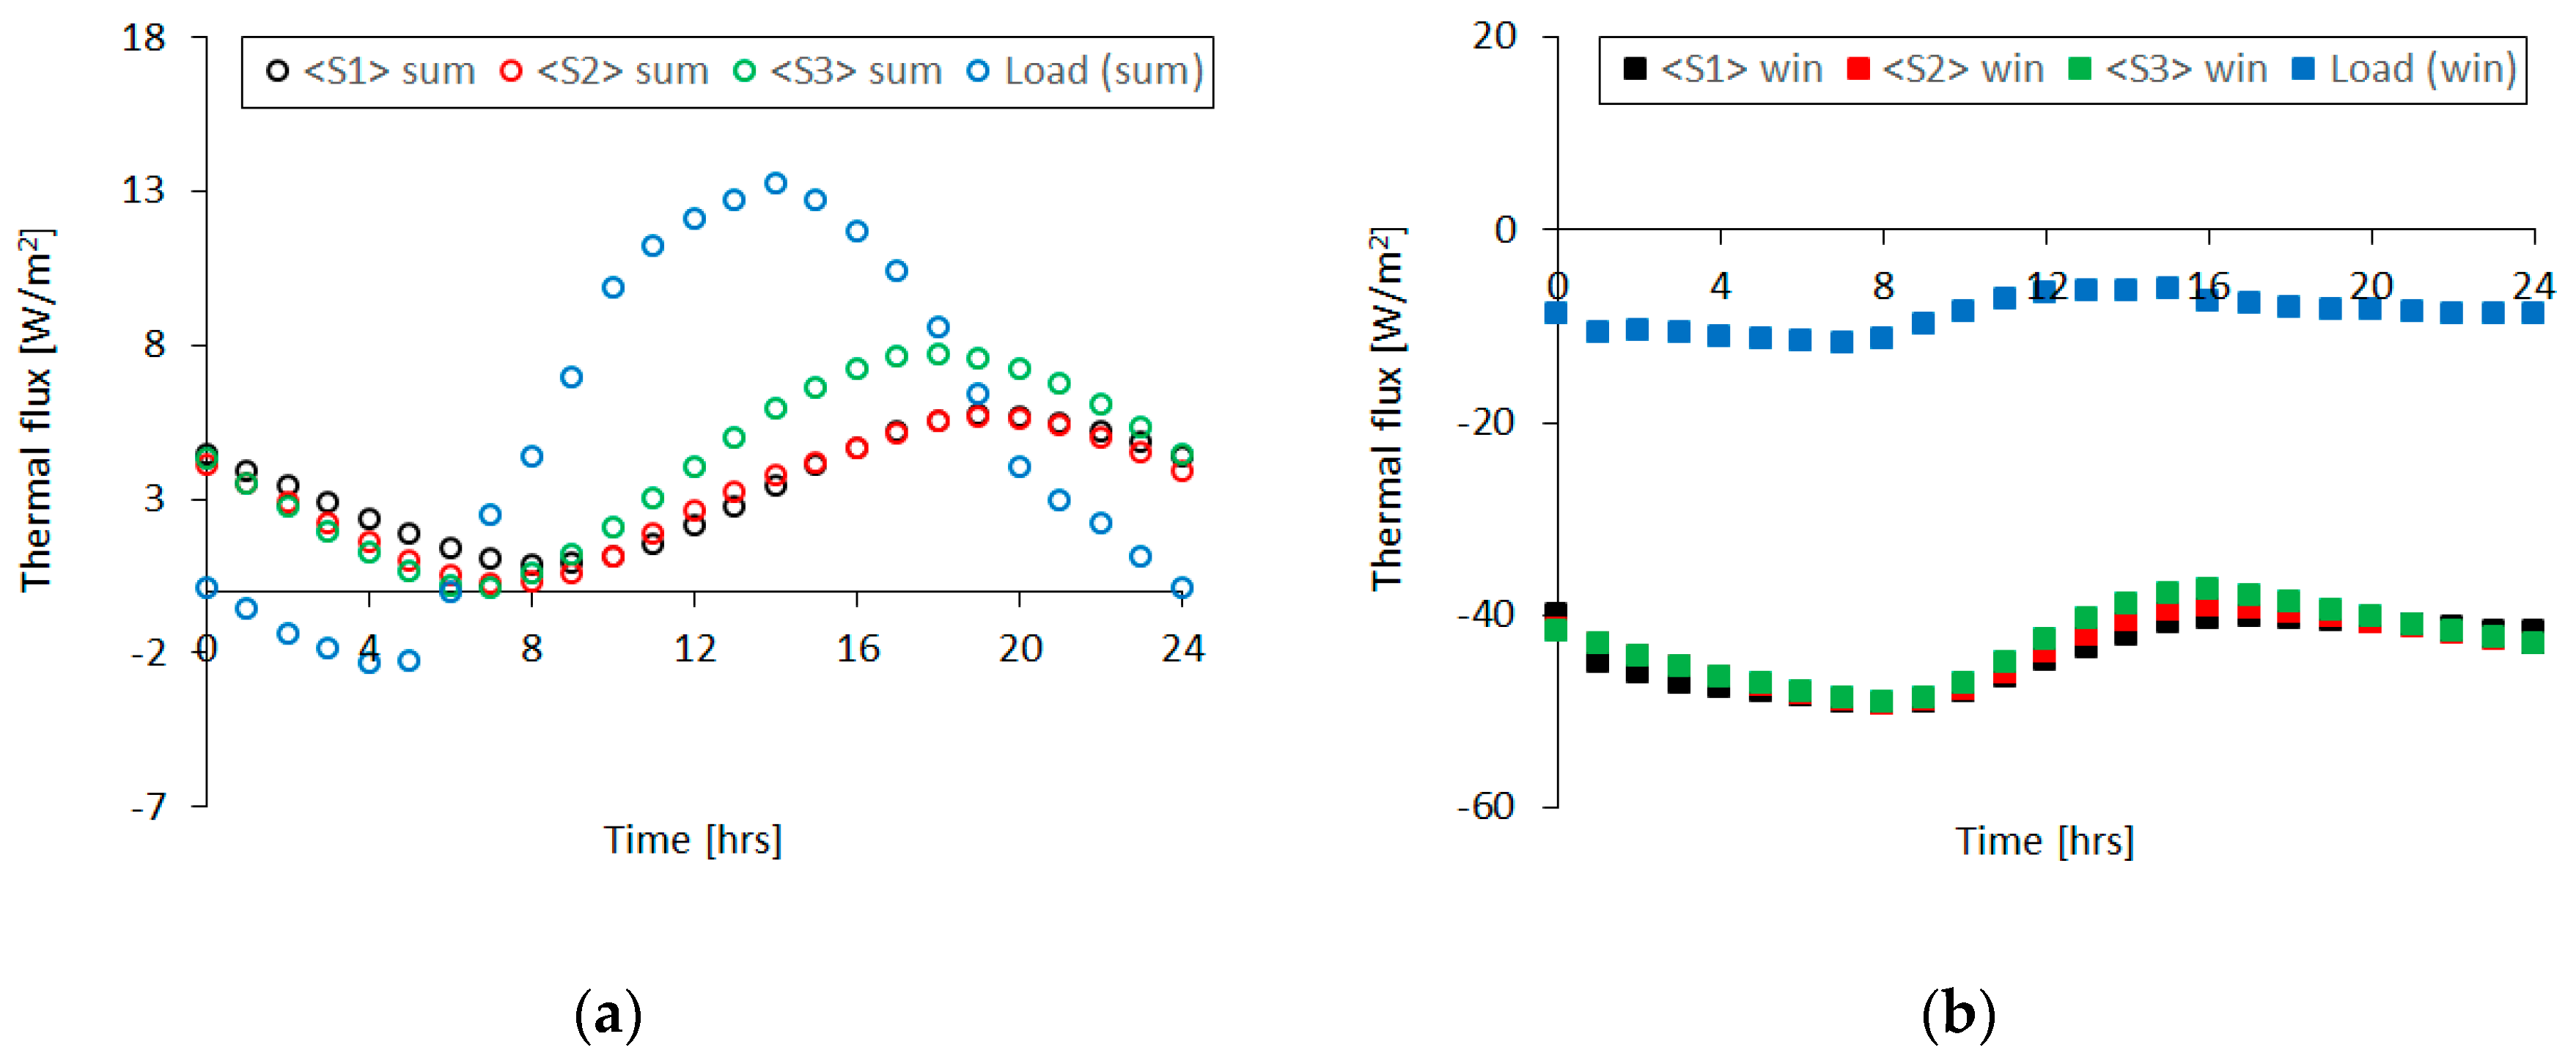
As plotted in Figure 12, the ratio values follow within the range values of 30–60%. Despite the higher flow rate in the cavity obtained for summer conditions, the heat flux, dissipated by ventilation, normalized with respect to the thermal gain due to incident solar radiation is equivalent both in summer and winter for <S1> and <S3> configurations. It should be noted that, during winter, the solar radiation thermal input has to be considered a free heat gain, so that a higher value of the computed index should not be considered a performance (efficacy) index for the system. This is particularly evident when comparing the results provided in Figure 13a,b.
The same Figure 12 provides a very different behaviour of the <S2> system during summer and winter, especially during the hottest part of the day, with higher values of solar irradiance. As shown in Figure 12, the trend of the values, provided as red squared and circled symbols, is divergent for all the hours between 10 and 14 h. As a matter of fact, during summer, PCM “works” producing a strong thermal buffer on the thermal power due to the incident solar radiation. Therefore, the heat flux rate dissipated by ventilation (and normalized with respect to the incident thermal load) is lower than the one gained for winter conditions, during which the temperature value is very distant from the transition temperature of PCM (its working conditions) and consequently the PCM panel works as a “usual” layer of the building envelope. In particular, the thermal power dissipated during summer is higher than that dissipated in winter for all of the three façade systems (Figure 11). However, if the efficacy index is considered, the thermal performances of the systems <S1> and <S3> are not very different: in winter, less heat is dissipated by the chimney effect, but, at the same time, the value of the incident solar radiation is reduced. For the <S2> system, the situation is different: in the summer (Figure 11), the PCM works and therefore part of the heat flux due to the incident solar radiation contributes to the phase change, while, in winter, the PCM cannot work (Figure 12). This finding clearly highlights the choice of using a PCM typology (i.e., transition temperature) rather than another strongly dependent on its location and application on a particular ventilated façade system, but also external climatic conditions.
Results show that the different choices on the PCM type and its design in the façade system can be oriented by the main target to be pursued, i.e., storing heat in the envelope for cold climate sites or dump heat transmission across the envelope for hot climate sites. Let us now turn to the thermal flux transferred to the indoor environment. Figure 13a,b show the thermal flux incident to the building envelope, computed by taking into account the solar-air temperature, indoor constant air temperature and the stationary thermal transmittance of the façade system (being about 0.5 W/(m2K) for all the three configurations). In the same figures, three curves are plotted, corresponding to the thermal flux transferred to (from) indoors, starting from (to) the external environment, obtained by simulation results for <S1>, <S2> and <S3> in summer (Figure 13a) and winter (Figure 13b) conditions. Looking at Figure 13a, thermal damping and peak-to-peak offset can be clearly appreciated for all the configurations. The dynamic thermal transmittance computed for the façade system corresponds to 0.229, 0.226 and 0.307 for <S1>, <S2> and <S3>, respectively. An important gap can be found between <S3> and the couple <S1> and <S2>. The presence of the PCM panel in <S2> and the thermal mass of the ceramic honeycomb panels in <S1> can explain its better thermal performances compared with those of component <S2>. Otherwise, in winter conditions, thermal transfer throughout the building envelope is totally due to the heat transfer from inside to outside (negative values of the computed heat flux). Thermo-physical behaviour of <S1>, <S2> and <S3> during winter conditions is very similar (Figure 13b). When analyzing results obtained for winter, it must be considered that when the external air temperature is lower than the internal one, there may be appreciable values of the incident solar radiation. This fact guarantees the natural convection inside the air cavity and then the chimney effect (with natural draft due to the air density differences, i.e., the effect of buoyancy forces). The chimney effect is also present without important values of the incident solar radiation because, in any case, the air warms up assuring the natural draft in the cavity. From the thermal exchange point of view, the total heat losses through the building components <S1>, <S2> and <S3> are not favourable, but the advantage consists of vapour condensation removal.
5. Conclusions
Our present study suggests a multi-physical approach based on the coupling of the heat-transfer, fluid-dynamics and phase-change phenomena for identifying the energy performance of different integrated building façade systems. It also allows an initial overall quantification of the thermal benefit achievable by a dynamic, adaptive façade system. Results demonstrated that a shorter reaction time of the façade system, due to PCM introduction, which provides a fundamental thermal buffer effect strictly connected to the cyclic climatic stress, could result in better thermal performance. Using the CFD simulation based on a multi-physics approach, it was possible to deduce a significant results comparison of the thermal performances of the three façade systems studied. Transient simulation results demonstrated that the PCM inside the air cavity increases the heat storage capacity and then thermal inertia of the façade system. However, the ventilated façade can be used as a cold storage during summer periods, using the night cooling effect only when the PCM has been fully solidified during the night. Moreover, the use of ceramic elements guarantees a high thermal capacity over time. The thermal performances of the façade systems studied are highly influenced by the architectural features and localization of the façade system, external climatic conditions and cooling demand of the building. Results obtained and, in particular, the efficacy index values for winter and summer show the possibility of a new integrated building façade system design, using different PCM layers, according to different phase change temperature values, which makes their use suitable and energy sustainable for every kind of Mediterranean climate. Our proposed modelling approach can also be used as a possible retrofit tool for implementation on existing buildings, aiming at an increase in their thermal performance. Furthermore, the climate in the Mediterranean region has a set of challenges for all of the building integrated multilayer façades that make them energy sustainable and effective solutions especially in very hot summer conditions, when they operate as adaptive dynamic building envelopes.
Acknowledgments
The present research study falls within a funded project. The authors express their gratitude to the Tuscany Region for the financial support from the PAR-FAS 2007-2013, SELFIE Project.
Author Contributions
Carla Balocco conceived and designed the numerical experiments; Giuseppe Petrone implemented and post-processed the numerical modelling and results. Both authors contributed in writing the paper.
Conflicts of Interest
The authors declare no conflict of interest.
References
- IEA Energy Conservation in Buildings & Community Systems (IEA–ECBCS). Annex 44, Integrating Environmentally Responsive Elements in Buildings, Design Guide; IEA–ECBCS: Paris, France, 2010. [Google Scholar]
- Favoino, F.; Goia, F.; Perino, M.; Serra, V. Experimental analysis of the energy performance of an ACTive, RESponsive and Solar (ACTRESS) façade module. Sol. Energy 2016, 133, 226–248. [Google Scholar] [CrossRef]
- Nagy, Z.; Svetozarevic, B.; Jayathissa, P.; Begle, M.; Hofer, J.; Lydon, G.; Willmann, A.; Schlueter, A. The Adaptive Solar Facade: From concept to prototypes. Front. Arch. Res. 2016, 5, 143–156. [Google Scholar] [CrossRef]
- O’Hegarty, R.; Kinnane, O.; McCormack, S.J. Review and analysis of solar thermal facades. Sol. Energy 2016, 135, 408–422. [Google Scholar] [CrossRef]
- Lai, C.-M.; Hokoi, S. Solar façades: A review. Build. Environ. 2015, 91, 152–165. [Google Scholar] [CrossRef]
- Sanchez, E.; Rolando, A.; Sant, R.; Ayuso, L. Influence of natural ventilation due to buoyancy and heat transfer in the energy efficiency of a double skin facade building. Energy Sustain. Dev. 2016, 33, 139–148. [Google Scholar] [CrossRef]
- Peng, J.; Curcija, D.C.; Lu, L.; Selkowitz, S.E.; Yang, H.; Zhang, W. Numerical investigation of the energy saving potential of a semi-transparent photovoltaic double-skin facade in a cool-summer Mediterranean climate. Appl. Energy 2016, 165, 345–356. [Google Scholar] [CrossRef]
- Rafaela, A.; Agathokleous, A.; Kalogirou, S.A. Double skin facades (DSF) and building integrated photovoltaics (BIPV): A review of configurations and heat transfer characteristics. Renew. Energy 2016, 89, 743–756. [Google Scholar]
- Szakály, F.; Hortobágyi, Z.; Bagi, K. Discrete Element Analysis of the Shear Resistance of Planar Walls with Different Bond Patterns. Open Constr. Build. Technol. J. 2016, 10, 220–232. [Google Scholar] [CrossRef]
- Elarga, H.; De Carli, M.; Zarrella, A.; Abo Elazm, M.; Alvarez, C. Assessment of active double skin facade integrated with PV cell. In Proceedings of the ASHRAE Winter Conference, Chicago, IL, USA, 20–24 January 2015. [Google Scholar]
- Corgnati, S.P.; Perino, M.; Serra, V. Experimental assessment of the performance of an active transparent façade during actual operating conditions. Sol. Energy 2007, 81, 993–1013. [Google Scholar] [CrossRef]
- Energy and Thermal Improvements for Construction in Steel (ETHICS). RFSR-CT-2008-00038, WP3: Innovative Techniques for Improved Thermal Comfort; Report on innovative use and test results of Phase-Change-Materials; ETHICS: Brussels, Belgium, 2008. [Google Scholar]
- De Gracia, A.; Cabeza, L.F. Phase change materials and thermal energy storage for buildings. Energy Build. 2015, 103, 414–419. [Google Scholar] [CrossRef]
- Argiro, C.D.; Androutsopoulos, A.V.; Lykoudis, S.P. Experimental study of the cooling performance of a ventilated wall. J. Build. Phys. 2016, 39, 297–320. [Google Scholar]
- Becker, R. Improving thermal and energy performance of buildings in summer with internal phase change materials. J. Build. Phys. 2014, 37, 296–324. [Google Scholar] [CrossRef]
- Serghides, D.K.; Georgakis, C.G. The building envelope of Mediterranean houses: Optimization of mass and insulation. J. Build. Phys. 2012, 36, 83–98. [Google Scholar] [CrossRef]
- Bamonte, P.; Caverzan, A.; Kalaba, N.; Lamperti Tornaghi, M. Lightweight Concrete Containing Phase Change Materials (PCMs): A Numerical Investigation on the Thermal Behaviour of Cladding Panels. Buildings 2017, 7. [Google Scholar] [CrossRef]
- Liu, P.-F.; Lin, Y.-P.; Tzeng, C.-T.; Lai, C.-M. Heat Transfer and Energy Performance of a PVA Wall Tile Containing Macro-Encapsulated PCM. Sol. Energy 2015, 9, 652–672. [Google Scholar] [CrossRef]
- Tittelein, P.; Gibout, S.; Franquet, E.; Johannes, K.; Zalewski, L.; Kuznik, F.; Dumas, J.P.; Lassue, S.; Bédécarrats, J.P.; David, D. Simulation of the thermal and energy behaviour of a composite material containing encapsulated-PCM: Influence of the thermodynamical modelling. Appl. Energy 2015, 140, 269–274. [Google Scholar] [CrossRef]
- Hawlader, M.N.A.; Uddin, M.S.; Zhu, H.J. Encapsulated phase change materials for thermal energy storage: Experiments and simulation. Int. J. Energy Res. 2002, 26, 159–171. [Google Scholar] [CrossRef]
- Comsol Multiphysics v5.3 User Guide 2017. Available online: www.comsol (accessed on 1 May 2017).
- Hasse, C.; Grenet, M.; Bontemps, A.; Sallée, L.H. Realization, test and modelling of honeycomb wallboards containing a Phase Change Material. Energy Build. 2011, 43, 232–238. [Google Scholar] [CrossRef]
- Fokaides, P.A.; Kylili, A.; Kalogirou, S.A. Phase change materials (PCMs) integrated into transparent building elements: A review. Mater. Renew. Sustain. Energy 2015, 4. [Google Scholar] [CrossRef]
- Brandl, D.; Mach, T.; Kaltenecker, P.; Sterrer, R.; Neururer, C.; Treberspurg, M.; Hochenauer, C. CFD assessment of a solar honeycomb (SHC) façade element with integrated PV cells. Sol. Energy 2015, 118, 155–174. [Google Scholar] [CrossRef]
- Hinojosa, J.F.; Rodrı´guez, N.A.; Xama´n, J. Heat transfer and airflow study of turbulent mixed convection in a ventilated cavity. J. Build. Phys. 2016, 40, 204–234. [Google Scholar] [CrossRef]
- Bonacina, C.; Comini, G.; Fasano, A.; Primicerio, M. Numerical solution of phase change problems. Int. J. Heat Mass Transf. 1973, 16, 1825–1832. [Google Scholar] [CrossRef]
- Petrone, G.; Cammarata, L. Numerical simulation of phase change materials melting process. Comput. Therm. Sci. 2013, 5, 227–237. [Google Scholar] [CrossRef]
- Cammarata, G.; Monaco, L.; Cammarata, L.; Petrone, G. A Numerical Procedure for PCM Thermal Storage Design in Solar Plants. Int J. Heat Technol. 2014, 31, 105–110. [Google Scholar] [CrossRef]
- Lee, K.O.; Medina, M.A.; Sun, X.Q. Development and verification of an Energy Plus-based algorithm to predict heat transfer through building walls integrated with phase change materials. J. Build. Phys. 2016, 40, 77–95. [Google Scholar] [CrossRef]
- International Organization for Standardization (ISO). UNI CTI 2009 Methodology for the Compilation of Climatic Data for the Determination of the Hourly Climatic Data of the “Typical Years” Referred to ISO 15927-4: 2005 Hygrothermal Performance of Buildings—Calculation and Presentation of Climatic Data—Part 4: Hourly Data for Assessing the Annual Energy Use for Heating and Cooling; ISO: Geneva, Switzerland, 2009. (In Italian) [Google Scholar]
- International Organization for Standardization (ISO). EN ISO 13789:2007 Thermal Performance of Buildings. Transmission and Ventilation Heat Transfer Coefficients. Calculation Method; ISO: Geneva, Switzerland, 2007. [Google Scholar]
- International Organization for Standardization (ISO). EN ISO 6946:2007 Building Components and Building Elements. Thermal Resistance and Thermal Transmittance. Calculation Method; ISO: Geneva, Switzerland, 2007. [Google Scholar]
Figure 1.
Geometry of <S1> system and enlargement of its top portion.
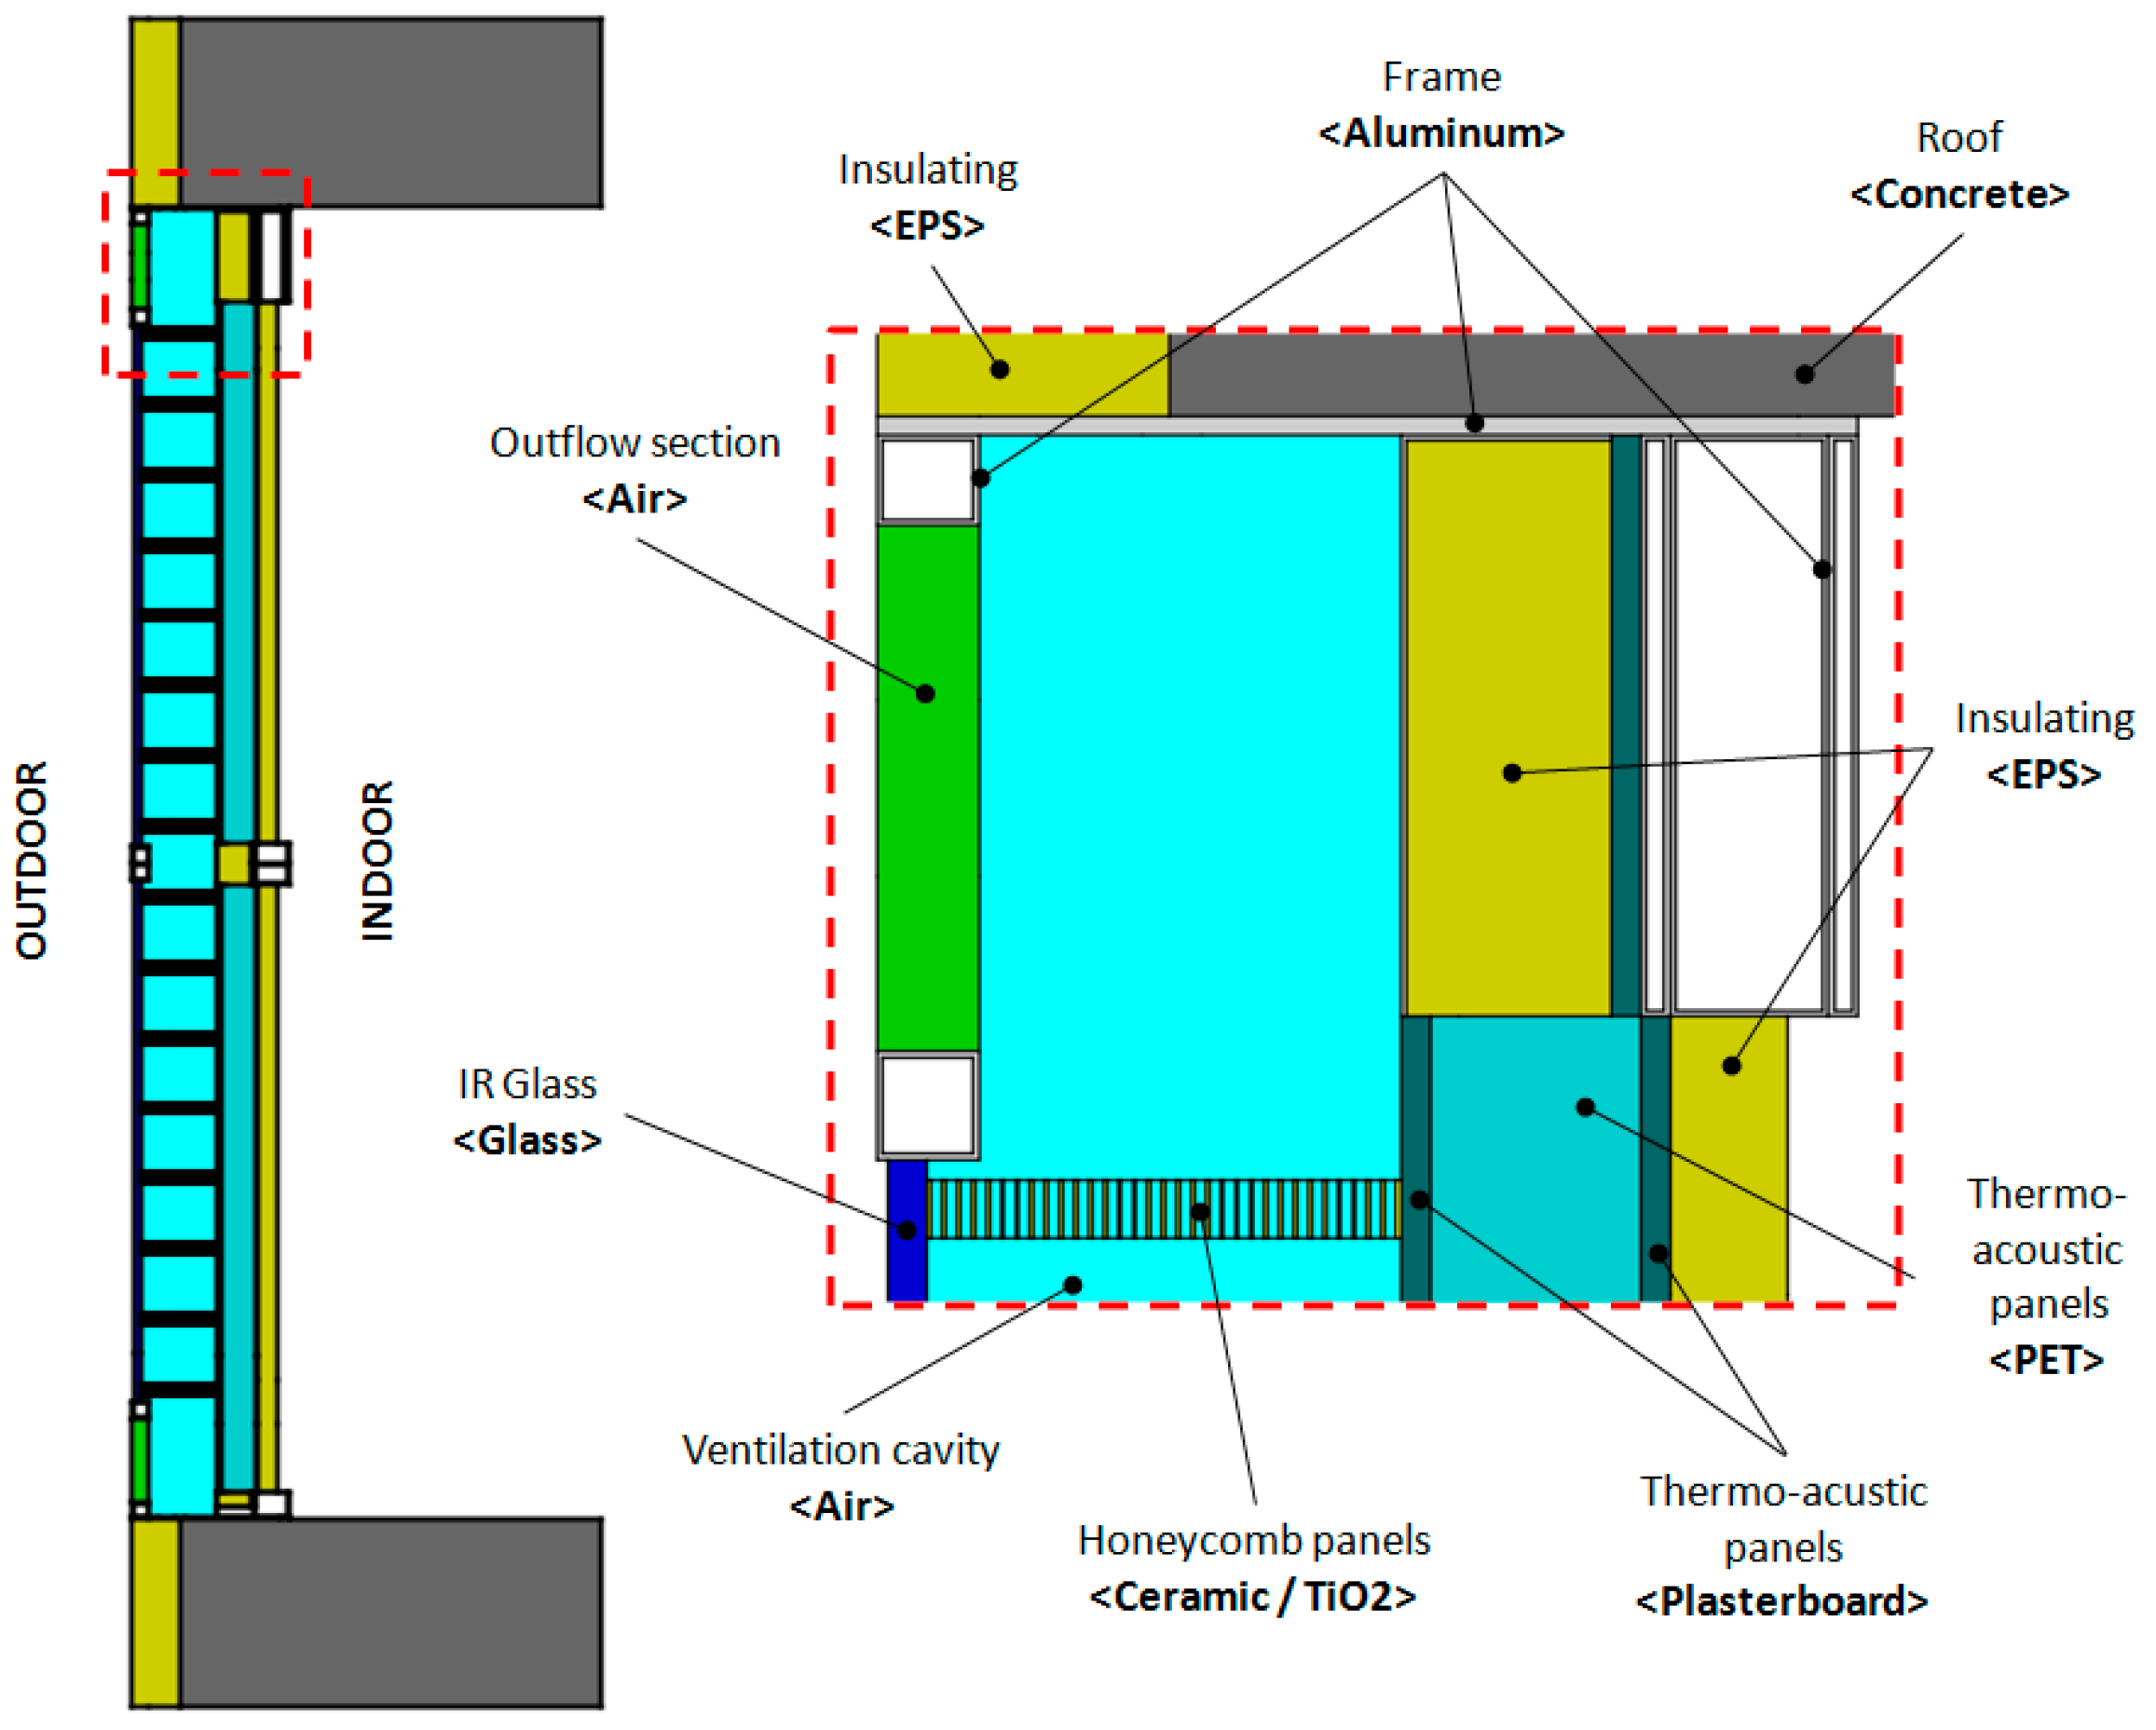
Figure 2.
Geometry of <S2> system and enlargement of its top portion.

Figure 3.
External air temperature (black symbols, values refer to the left vertical axis) and solar radiation data (red symbols, values refer to the right vertical axis) used for computational fluid dynamics (CFD) transient simulations: (a) summer and (b) winter conditions.
Figure 3.
External air temperature (black symbols, values refer to the left vertical axis) and solar radiation data (red symbols, values refer to the right vertical axis) used for computational fluid dynamics (CFD) transient simulations: (a) summer and (b) winter conditions.

Figure 4.
Velocity field (m/s) for <S1>, <S2> and <S3> system at 12.00 a.m.
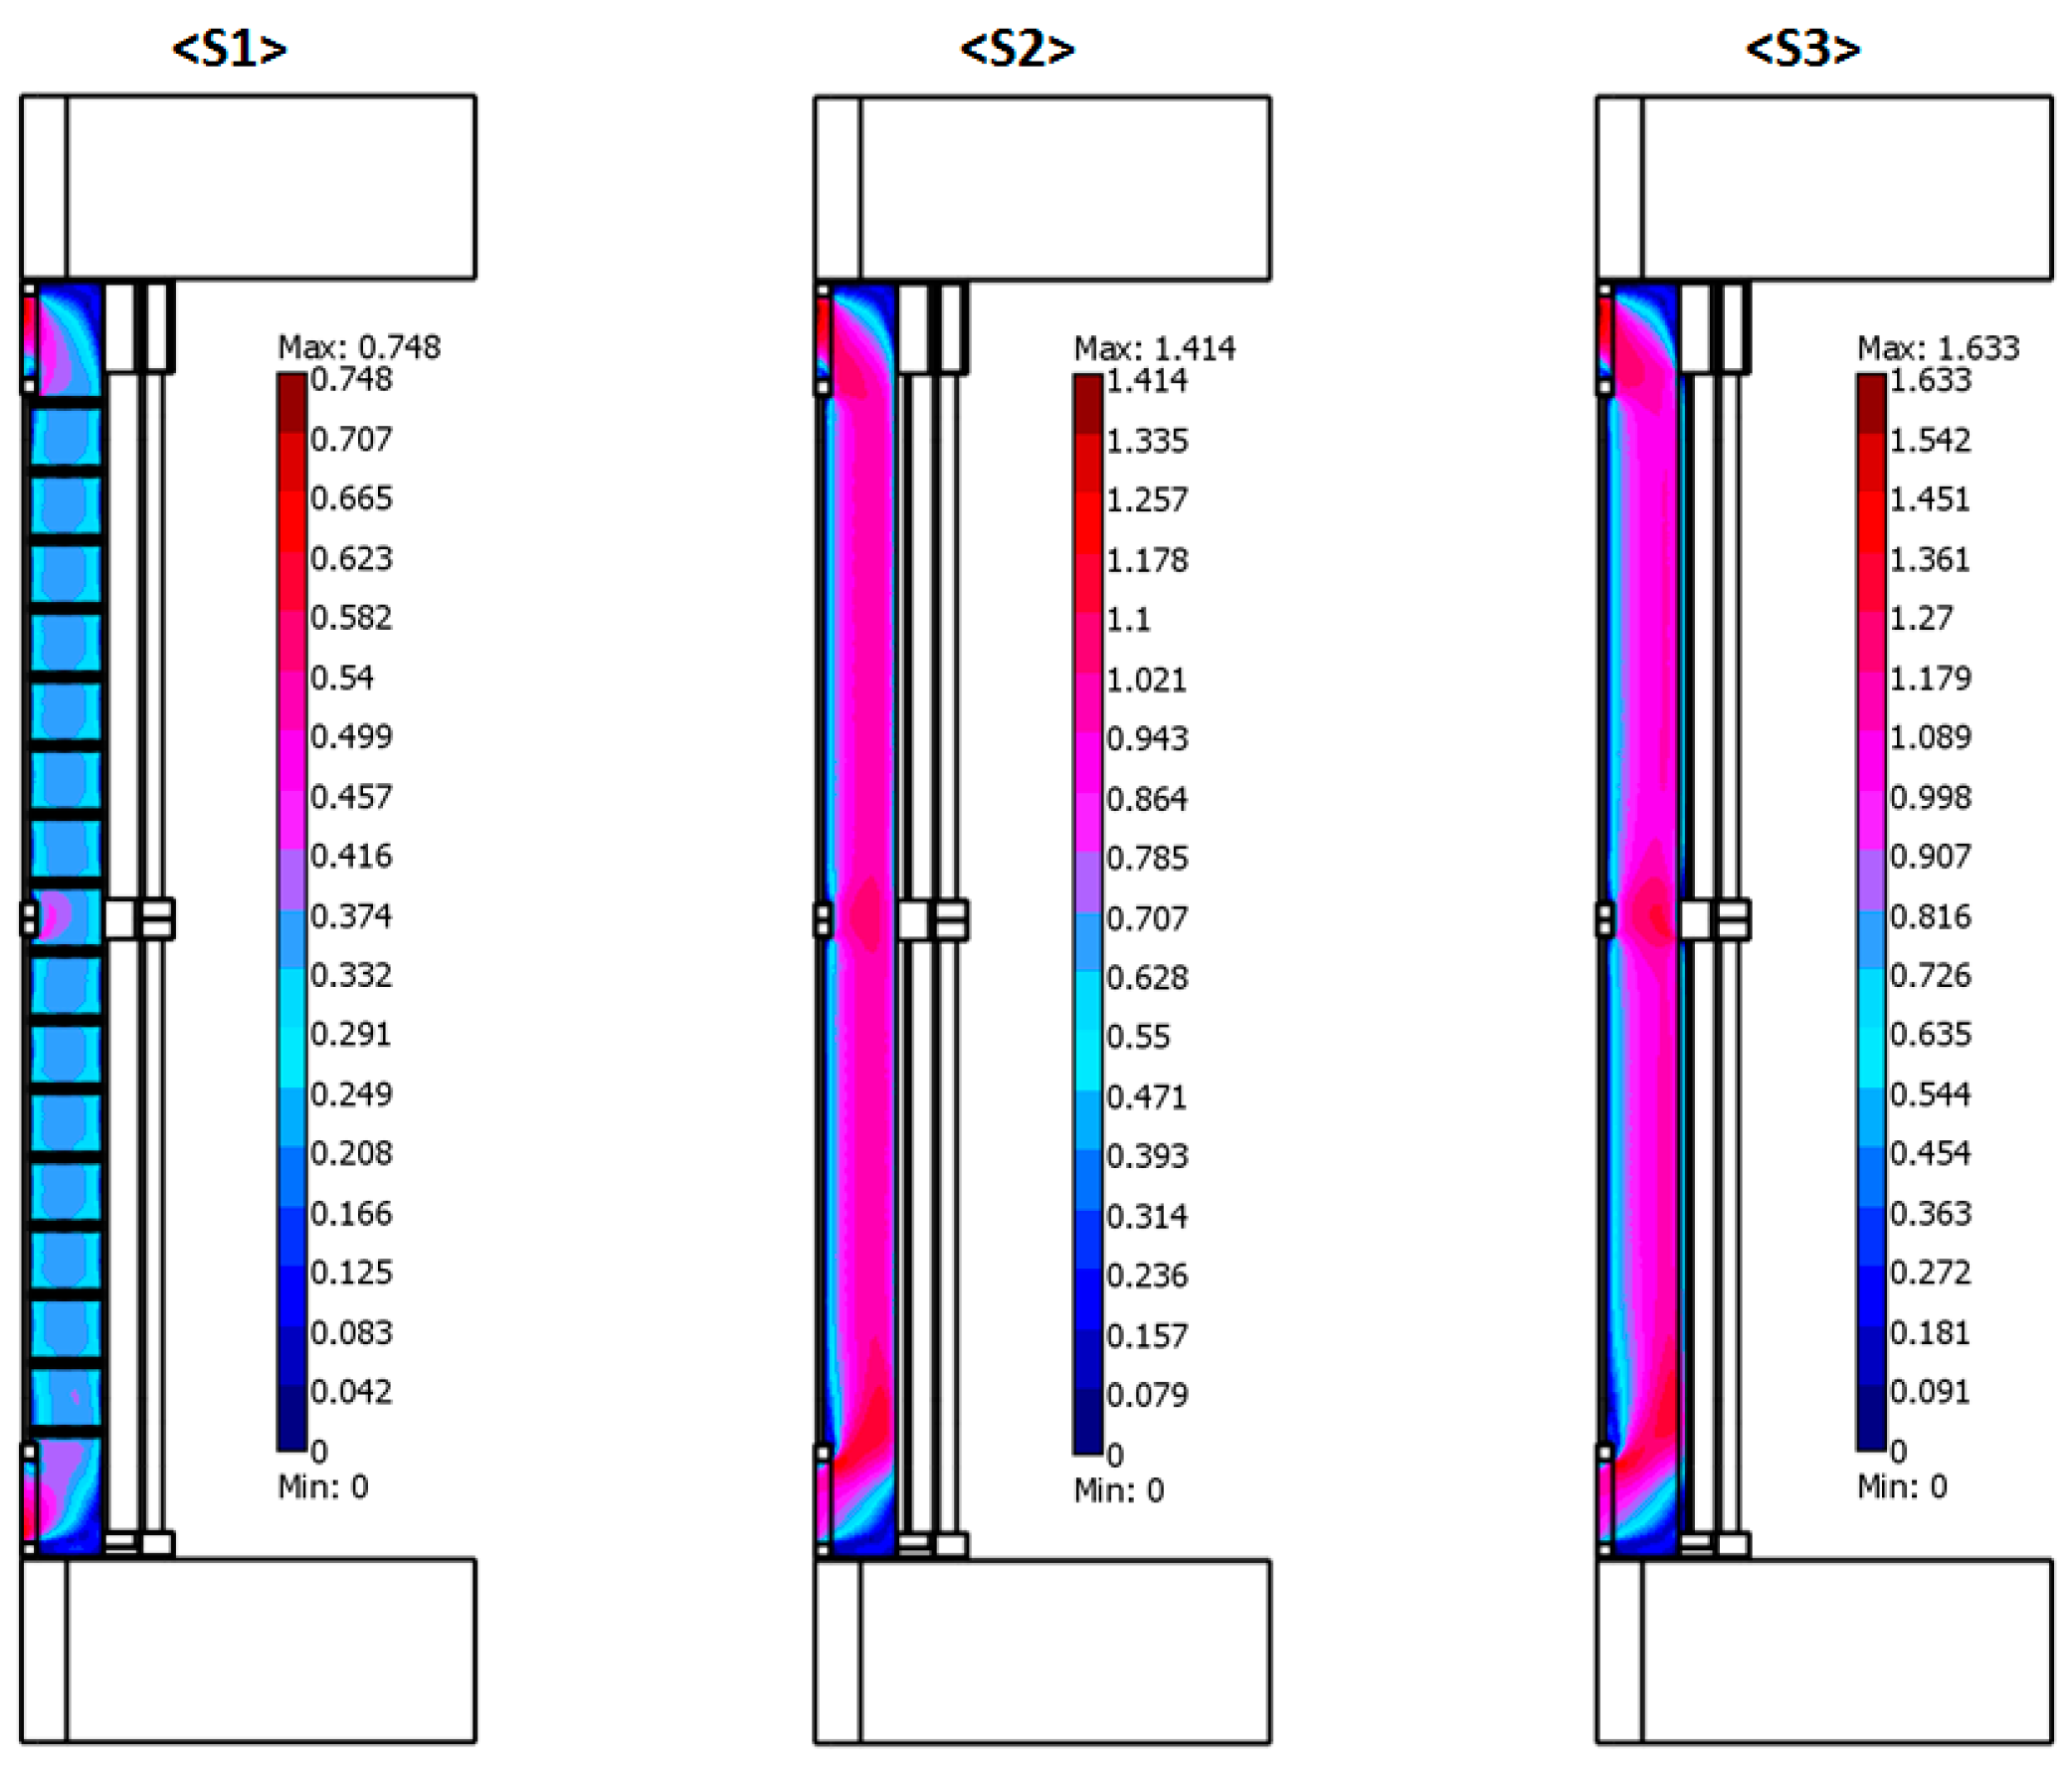
Figure 5.
Temperature distribution (°C) for <S1>, <S2> and <S3> system at 6.00 a.m. in summer conditions.
Figure 5.
Temperature distribution (°C) for <S1>, <S2> and <S3> system at 6.00 a.m. in summer conditions.

Figure 6.
Temperature distribution (°C) for <S1>, <S2> and <S3> system at 12.00 a.m. in summer conditions.
Figure 6.
Temperature distribution (°C) for <S1>, <S2> and <S3> system at 12.00 a.m. in summer conditions.
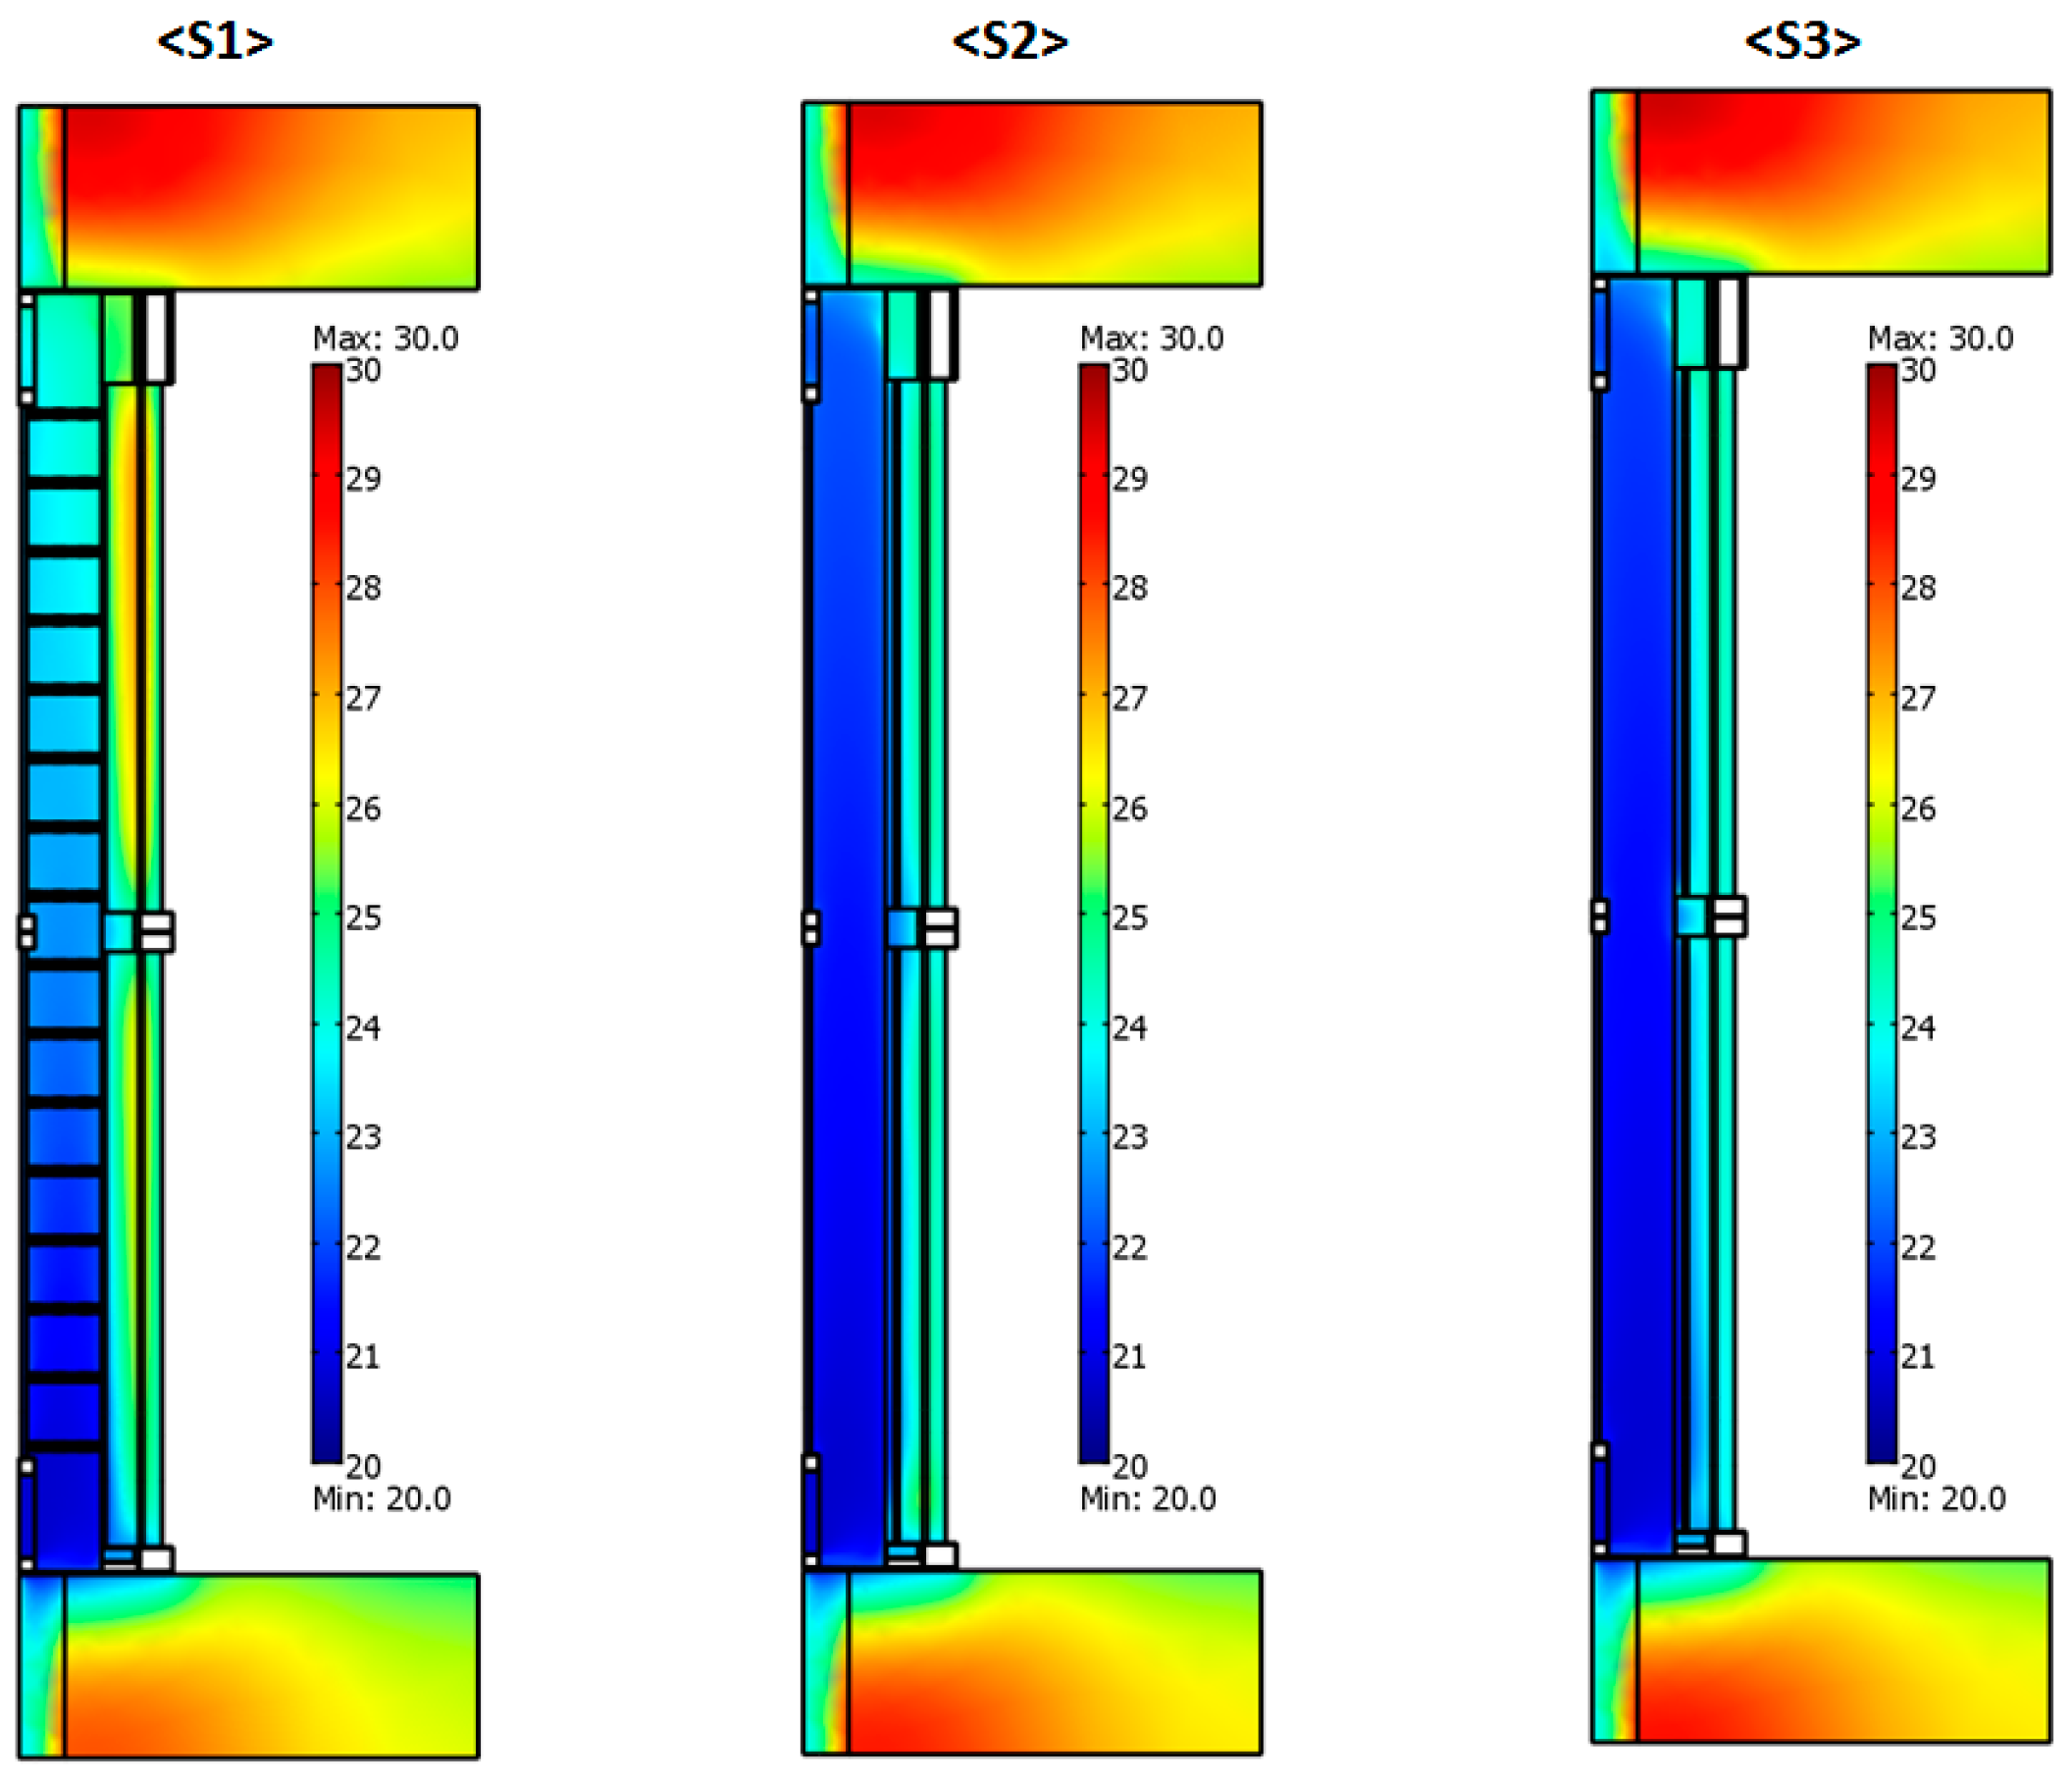
Figure 7.
Temperature distribution (°C) for <S1>, <S2> and <S3> system at 6.00 p.m. in summer conditions.
Figure 7.
Temperature distribution (°C) for <S1>, <S2> and <S3> system at 6.00 p.m. in summer conditions.

Figure 8.
Temperature distribution (°C) for <S1>, <S2> and <S3> system at 12.00 p.m. in summer conditions.
Figure 8.
Temperature distribution (°C) for <S1>, <S2> and <S3> system at 12.00 p.m. in summer conditions.

Figure 9.
Temperature distribution (°C) for <S1>, <S2> and <S3> system at 12.00 a.m. in winter conditions.
Figure 9.
Temperature distribution (°C) for <S1>, <S2> and <S3> system at 12.00 a.m. in winter conditions.

Figure 10.
Time evolution of the airflow rate at the output section of the ventilation cavity for <S1>, <S2> and <S3> in summer (circle symbols) and winter (squared filled symbols) conditions.
Figure 10.
Time evolution of the airflow rate at the output section of the ventilation cavity for <S1>, <S2> and <S3> in summer (circle symbols) and winter (squared filled symbols) conditions.
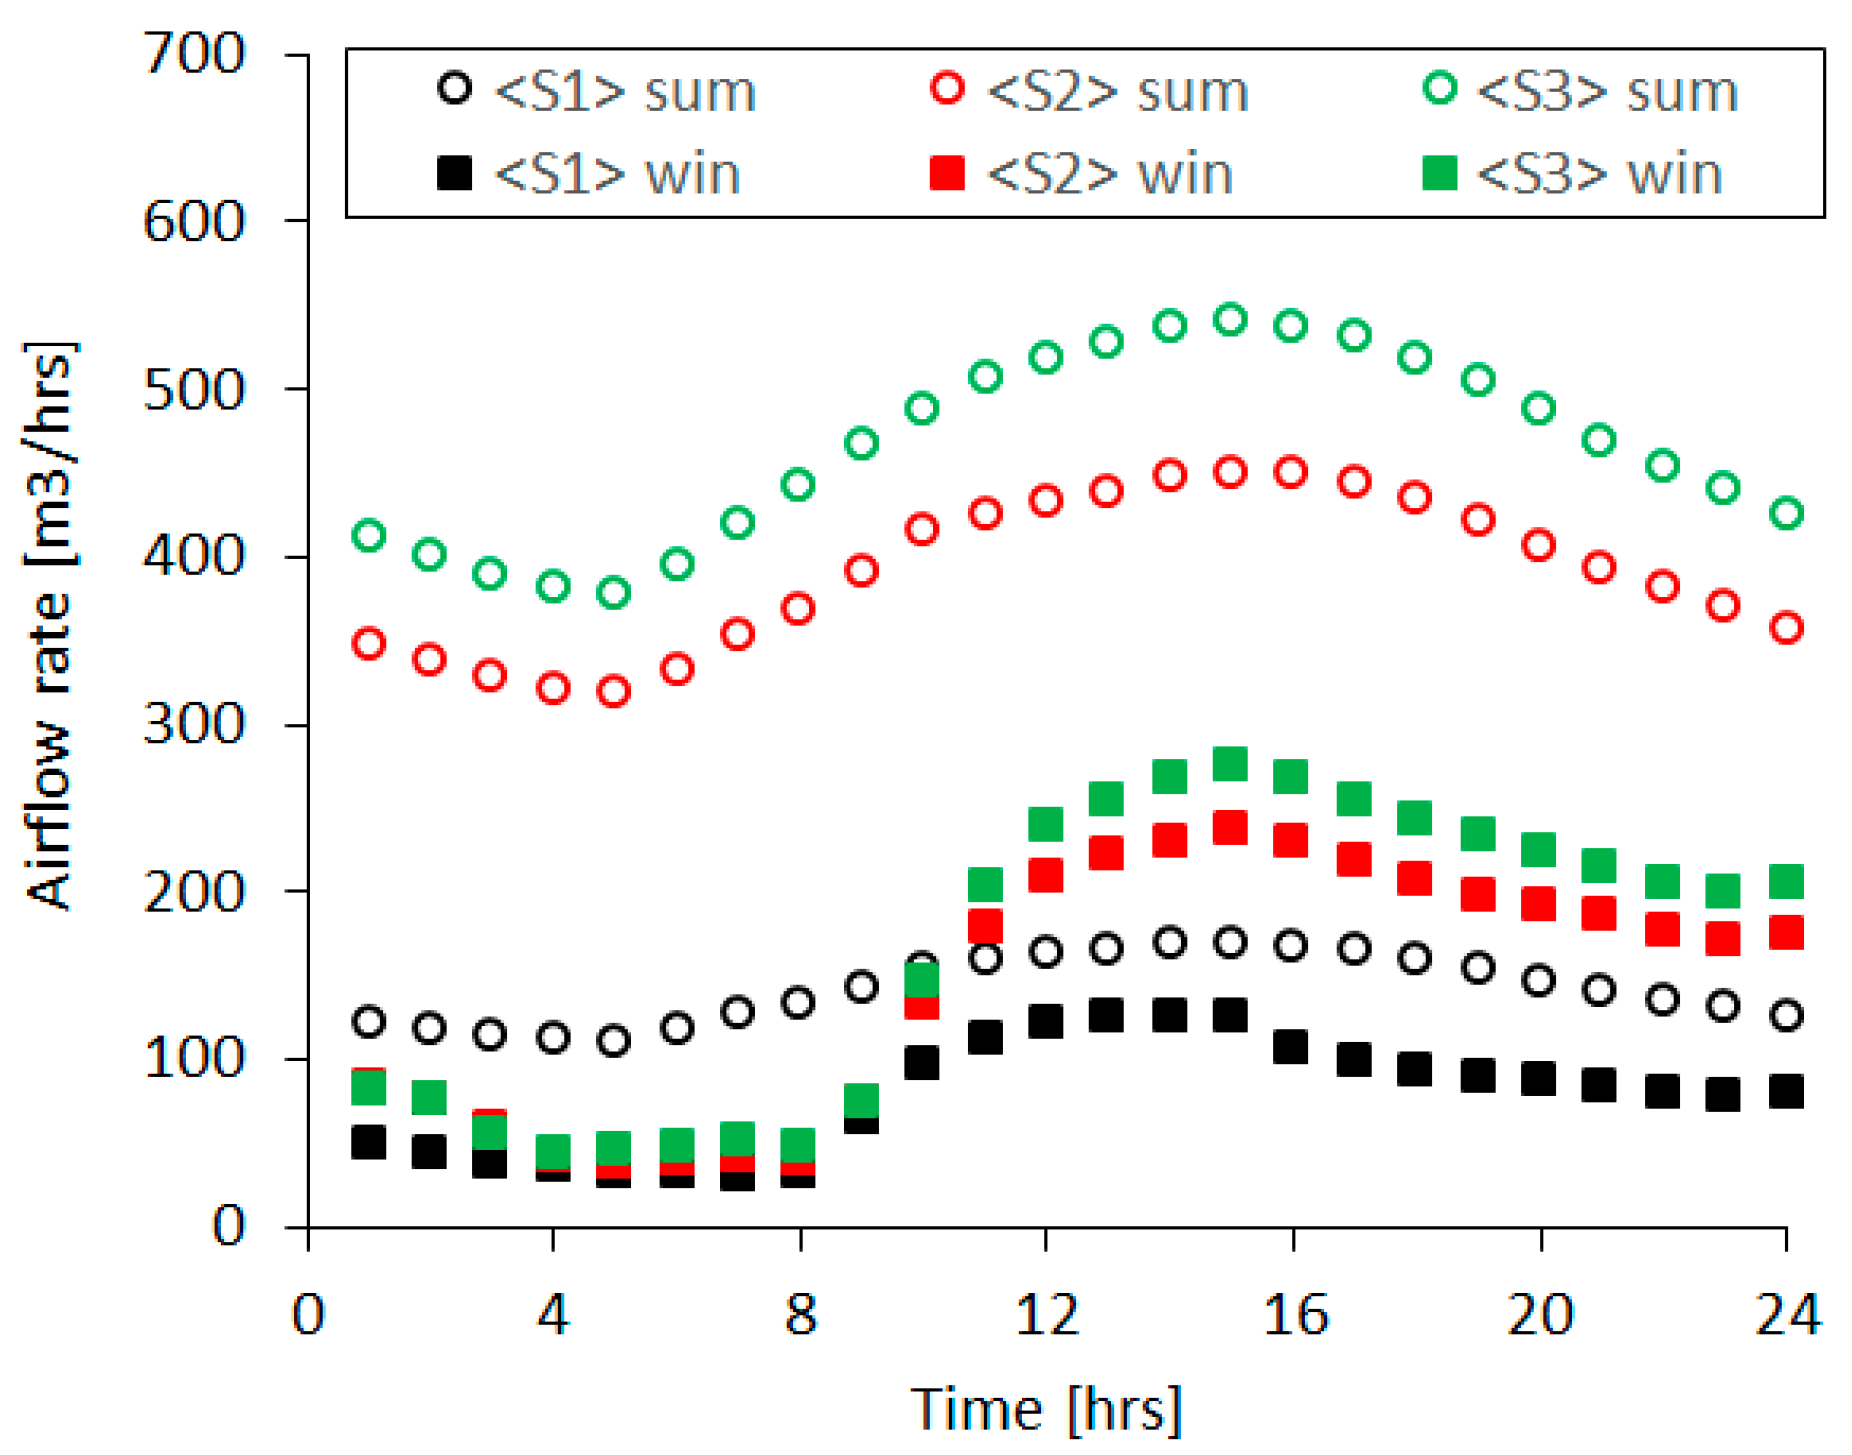
Figure 11.
Time evolution of thermal power dissipated by ventilation for <S1>, <S2> and <S3> in summer (circle symbols) and winter (squared filled symbols) conditions.
Figure 11.
Time evolution of thermal power dissipated by ventilation for <S1>, <S2> and <S3> in summer (circle symbols) and winter (squared filled symbols) conditions.
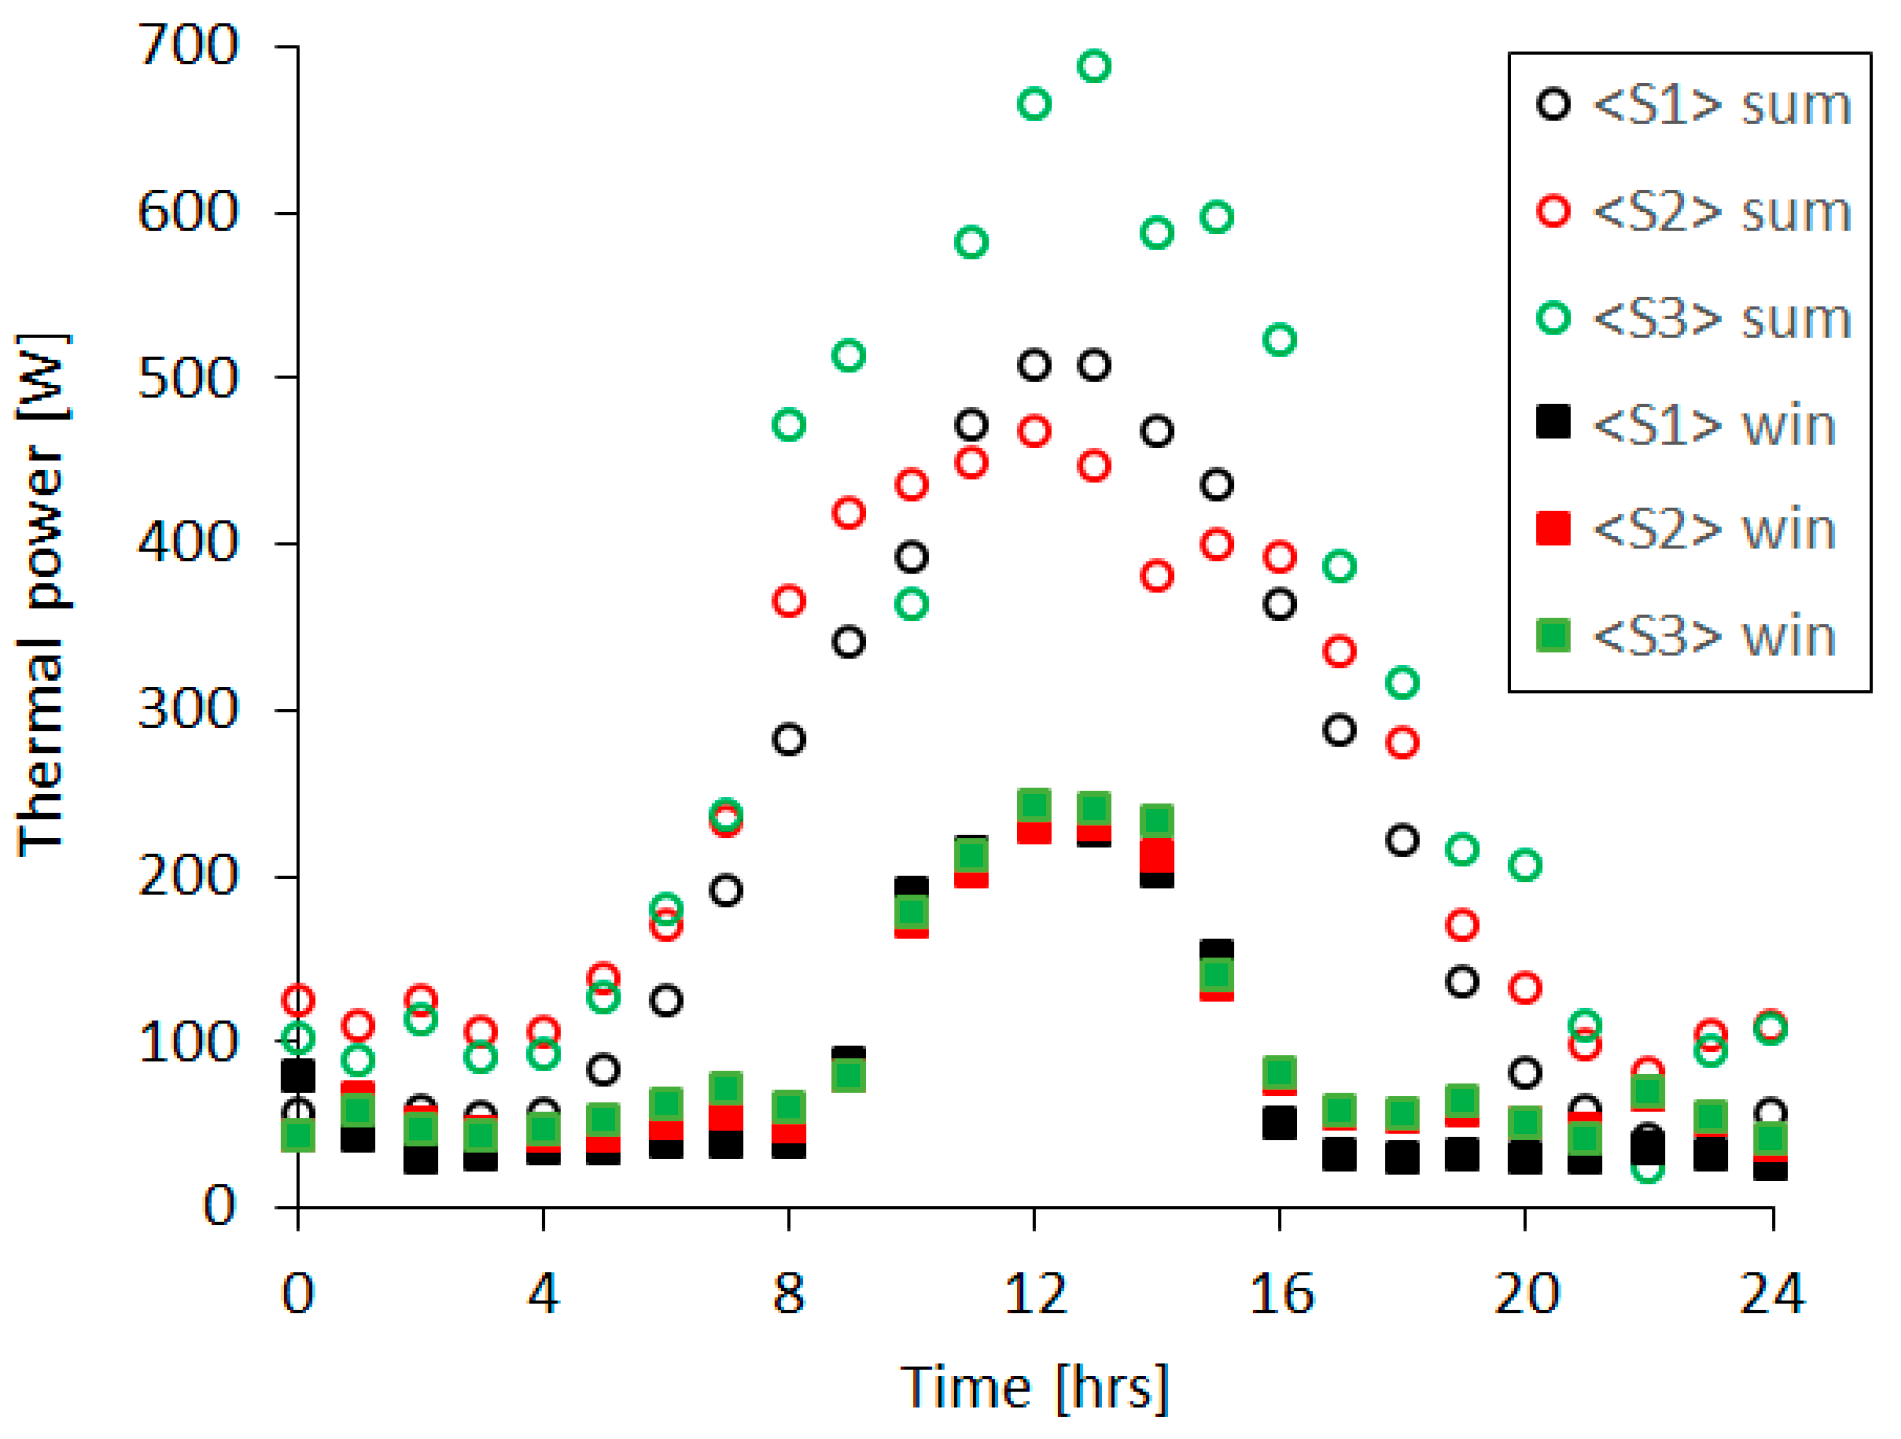
Figure 12.
Percentage rate of solar thermal load dissipated by ventilation for <S1>, <S2> and <S3> in summer (circle symbols) and winter (squared filled symbols) conditions.
Figure 12.
Percentage rate of solar thermal load dissipated by ventilation for <S1>, <S2> and <S3> in summer (circle symbols) and winter (squared filled symbols) conditions.

Figure 13.
Incident thermal flux and transferred thermal flux to the indoor environment for <S1>, <S2> and <S3> in (a) summer and (b) winter conditions.
Figure 13.
Incident thermal flux and transferred thermal flux to the indoor environment for <S1>, <S2> and <S3> in (a) summer and (b) winter conditions.

Table 1.
Thermo-physical properties of materials.
| Material | Density | Thermal Conductivity | Specific Heat at Constant Pressure |
|---|---|---|---|
| [kg·m−3] | [W·m−1K−1] | [J·kg−1K−1] | |
| EPS | 32 | 0.03 | 1700 |
| Concrete | 2200 | 1.8 | 880 |
| Ceramic/TiO2 | 2100 | 1.63 | 1016 |
| PET | 1380 | 0.28 | 1050 |
| Plasterboard | 1900 | 0.20 | 840 |
| Aluminium | 2800 | 200 | 900 |
| Air | p·R−1·T−1 | 0.026 | 1010 |
| Ceramic foam/Decanoic acid | 1179 | 0.789(S) ÷ 0.627(L) | 1500 |
| IR Glass/ DSCC Glass | 2410 | 0.937 | 840 |
Table 2.
Grid Test results.
| Mesh | Nr Elements | DOF | T_m | T_out | F_out |
|---|---|---|---|---|---|
| [-] | [-] | [°C] | [°C] | [m3/h] | |
| #1 | 51,337 | 326,673 | 37.56 | 39.79 | 509.7 |
| #2 | 55,913 | 365,660 | 37.53 | 39.77 | 519.6 |
| #3 | 60,093 | 394,252 | 37.51 | 39.76 | 528.9 |
Notes: T_out is the average outflow temperature, T m is the average cavity temperature, F_out is the airflow rate computed at the outlet section; DOF stands for Degree of Freedom.
© 2017 by the authors. Licensee MDPI, Basel, Switzerland. This article is an open access article distributed under the terms and conditions of the Creative Commons Attribution (CC BY) license (http://creativecommons.org/licenses/by/4.0/).
Share and Cite
MDPI and ACS Style
Balocco, C.; Petrone, G. Numerical Modelling for the Thermal Performance Assessment of a Semi-Opaque Façade with a Multilayer of Nano-Structured and Phase Change Materials. Buildings 2017, 7, 90. https://doi.org/10.3390/buildings7040090
AMA Style
Balocco C, Petrone G. Numerical Modelling for the Thermal Performance Assessment of a Semi-Opaque Façade with a Multilayer of Nano-Structured and Phase Change Materials. Buildings. 2017; 7(4):90. https://doi.org/10.3390/buildings7040090
Chicago/Turabian StyleBalocco, Carla, and Giuseppe Petrone. 2017. "Numerical Modelling for the Thermal Performance Assessment of a Semi-Opaque Façade with a Multilayer of Nano-Structured and Phase Change Materials" Buildings 7, no. 4: 90. https://doi.org/10.3390/buildings7040090
Note that from the first issue of 2016, this journal uses article numbers instead of page numbers. See further details here.