Article

Identification of Value Proposition and Development of Innovative Business Models for Demand Response Products and Services Enabled by the DR-BOB Solution

1
R2M Solution srl, Pavia 27100, Italy
2
School of Science and Engineering, Teesside University, Middlesbrough TS1 3BX, UK
3
DuneWorks, Eindhoven 5617 BA, The Netherlands
*
Author to whom correspondence should be addressed.
Buildings 2017, 7(4), 93; https://doi.org/10.3390/buildings7040093
Submission received: 22 September 2017 / Revised: 19 October 2017 / Accepted: 20 October 2017 / Published: 23 October 2017
(This article belongs to the Special Issue Selected Papers from Sustainable Places 2017 (SP2017) Conference)

Abstract

:
The work presented is the result of an ongoing European H2020 project entitled DR-BOB Demand Response in Blocks of Buildings (DR-BOB) that seeks to integrate existing technologies to create a scalable solution for Demand Response (DR) in blocks of buildings. In most EU countries, DR programs are currently limited to the industrial sector and to direct asset control. The DR-BOB solution extends applicability to the building sector, providing predictive building management in blocks of buildings, enabling facilities managers to respond to implicit and explicit DR schemes, and enabling the aggregation of the DR potential of many blocks of buildings for use in demand response markets. The solution consists of three main components: the Local Energy Manager (LEM), which adds intelligence and provides the capacity for predictive building management in blocks of buildings, a Consumer Portal (CP) to enable building managers and building occupants to interact with the system and be engaged in demand response operations, and a Decentralized Energy Management System (DEMS®, Siemens plc, Nottingham, England, UK), which enables the aggregation of the DR potential of many blocks of buildings, thus allowing participation in incentive-based demand response with or without an aggregator. The paper reports the key results around Business Modelling development for demand response products and services enabled by the DR-BOB solution. The scope is threefold: (1) illustrate how the functionality of the demand response solution can provide value proposition to underpin its exploitation by four specific customer segments, namely aggregators and three types of Owners of Blocks of Buildings in different market conditions, (2) explore key aspects of the Business Model from the point of view of a demand response solution provider, in particular around most the suitable revenue stream and key partnership, and (3) assess the importance of key variables such as market maturity, user engagement, and type of blocks of buildings as drivers to market penetration and profitability. The work presented is framed by the expected evolution of DR services in different market contexts and the different relationships between the main stakeholders involved in the DR value chain in different EU countries. The analysis also relies on the results of interviews conducted at the fours pilot sites of the DR-BOB project with key representatives of the management, operations, and marketing. These are used to better understand customer needs and sharpen the value proposition.

1. Introduction

The European Commission (EC) has set targets for 2020 including a 20% reduction in greenhouse gas emissions (from 1990 levels), a 20% increase of the share of renewable energy sources (RES), and a 20% improvement in energy efficiency [1]. In 2014, renewable energy sources represented 29% of energy generation in the EU [2] and they are continuing to grow. The increasing penetration of intermittent and non-controllable decentralized renewable energy sources is causing serious stability problems in the EUs electricity distribution and transmissions networks. This is resulting in high costs for ancillary services in many EU countries and grid operators frequently having to curtail RES generation or to limit further penetration of RES in congested areas. Therefore, there is a need for more flexibility to increase/decrease energy demand when required by the transmission/distribution system operator. Demand Response (DR) represents the most suitable and immediately available way to provide this flexibility due to its wide applicability and cost-effectiveness when compared to other technologies (e.g., storage) or measures (e.g., grid reinforcement). Globally DR could support the penetration of RES on the energy network, mitigate capacity issues on distribution networks, maximize local self-consumption and reduce the required generators margins procured by Transmission System Operators (TSOs), Distribution System Operators (DSOs), and Balance Responsible Party (BRPs) to guarantee grid stability [3]. DR systems help grid operators and consumers by enabling the shifting or reduction of energy use while compensating participating consumers for their contribution. A DR provider (i.e., aggregator) acts as an intermediary between the grid operator and energy consumers. When the grid operator has difficulties with matching national energy demand, a notification is sent to the DR provider. The DR provider identifies from its portfolio of customers those that can participate. The selected customers receive a request to reduce their energy demand, either manually or automatically, and in return receive financial compensation for their participation [4].
DR programs in the form of agreements between single large energy consumers (i.e., energy-intensive industrial sites) and grid operators have been in place for some time. However, these programs have failed to work for small- and medium-scale energy consumers [3]. Blocks of Buildings (BOB) might provide the right scale to participate in DR-programs because when compared to single buildings, they offer more flexibility in timing of energy usage, local energy generation, and energy storage with potentially exploitable assets and synergies. To test this potential, the EC-funded project DR-BOB (GA No. 696114) seeks to integrate existing technologies to create a scalable solution that enables DR operations in buildings consisting of different blocks. These technologies are a Decentralized Energy Management System (DEMS®) provided by Siemens, a Local Energy Manager (LEM) from Teesside University (outcome of the IDEAS EU-funded project), and a Consumer Portal (CP) that was developed based on the GridPocket EcoTroksTM (GridPocket SAS, Sophia-Antipolis, France) tool. The integration of these technologies enables real-time optimization of the local energy production, consumption, and storage to maximize economic profit, minimize CO2 emissions, and comply with DR requests. The DR-BOB solution is intelligent in the sense that it is automated and can adapt to fluctuation in the energy demand or production, subject to dynamic price tariffs and changing weather conditions. The solution is developed and then implemented infour4 pilot sites: the University of Teesside in Middlesbrough (UK), blocks of office buildings in the Montaury district of Anglet (FR), the Fondazione Poliambulanza hospital in Brescia (IT), and the Technical University of Cluj-Napoca (RO). To ensure market penetration, the integration and implementation activities are accompanied by the development of appropriate and innovative Business Models, able to capture the value of the DR-BOB solution for both the potential customer segments and the solution providers.
Following this introduction, Section 2 describe the challenges encountered when approaching the business modelling activities, while 
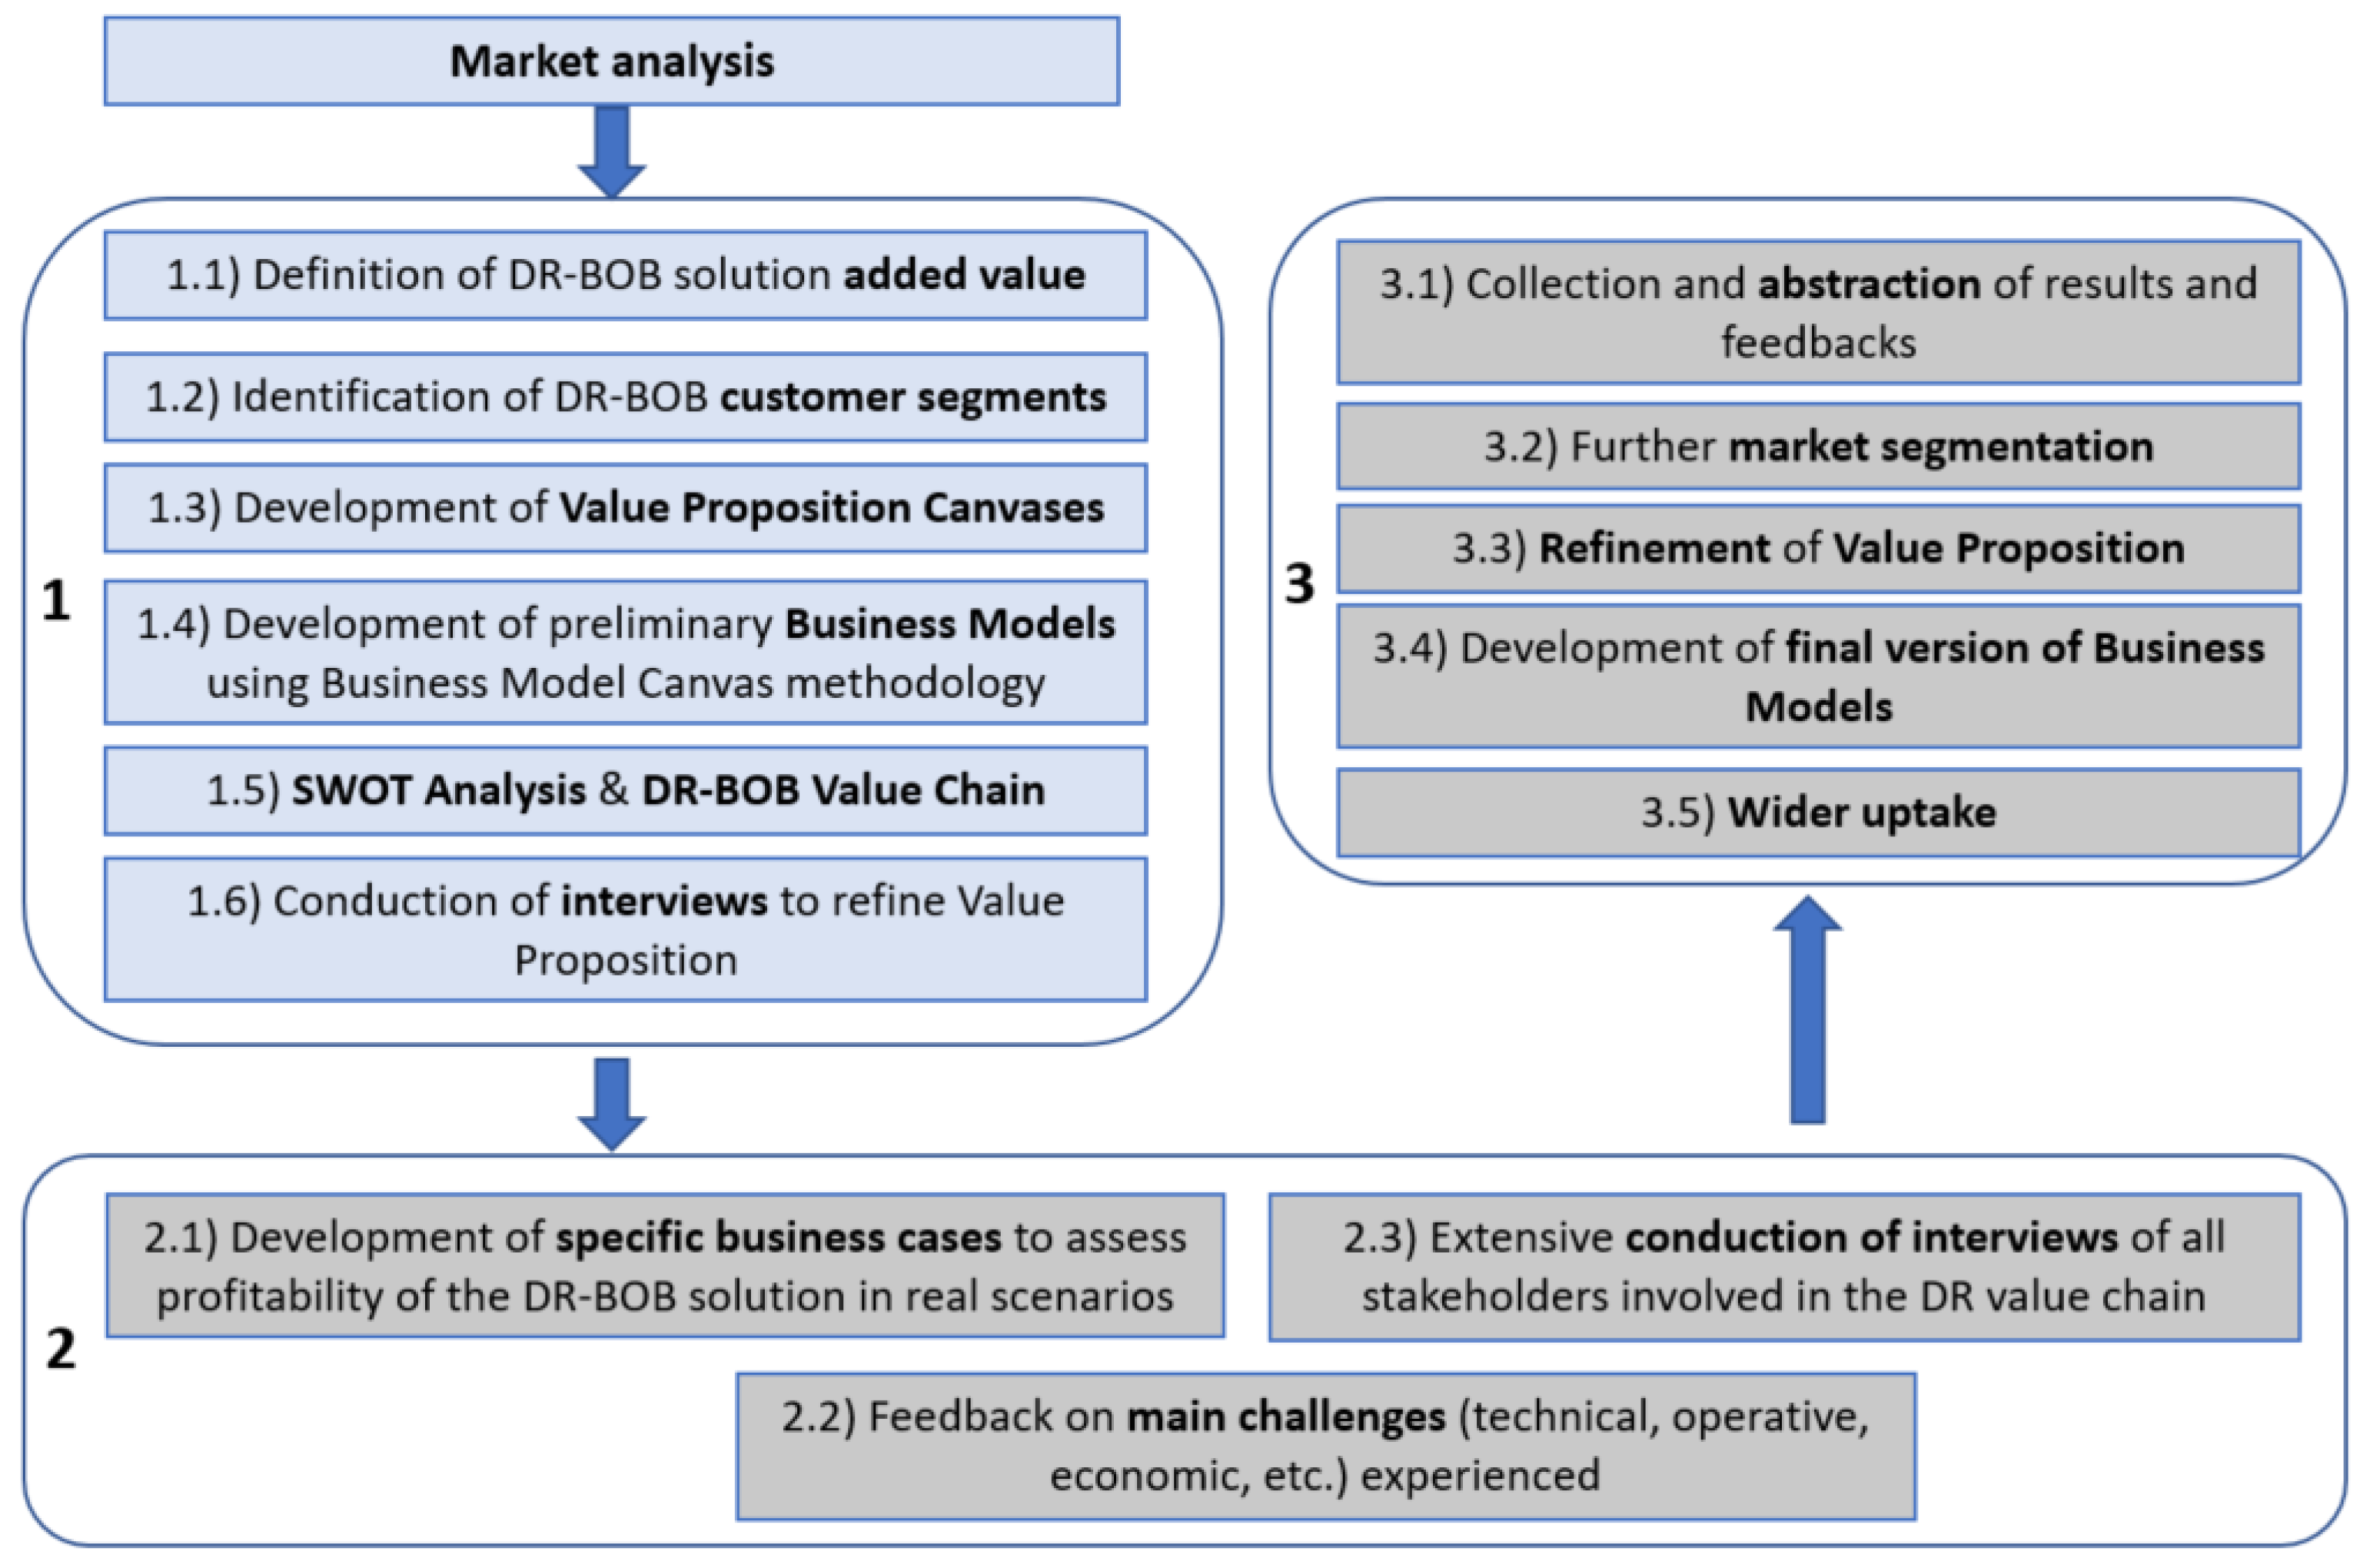
Section 3 reports the resulting 3-phase methodology for business model development. Then, Section 4 and Section 5 focus on the activities completed to date (phase 1), which led to the first version of business models. Section 6 describes the next step, which will involve the implementation in the pilot buildings and the development of pilot-focused cost-benefit analysis. Finally, Section 7 reports the key findings resulting from the completion of phase 1.

2. Challenges for Business Model Development

Demand Response services are increasing in the EU, but their penetration is still limited and uneven, as they are progressing differently in different EU countries [5]. The development of Business Models associated to DR services in Europe has significant challenges particularly in the tertiary sector, as summarized below.
  • The different DR stakeholder and regulatory maturity levels in Europe: In many countries DR does not exist, or it is not seen as a need by key stakeholders. In other countries, the lack or uncertainty of the regulatory framework is a significant barrier to the development of DR [6,7];
  • Many markets are currently oriented toward low-risk direct load control solutions: In countries were DR services are present, aggregators are not particularly interested in the tertiary sector, preferring industrial direct load control [8], which is characterized by lower risk;
  • Implicit vs. explicit DR: Flexibility can be used for both implicit/cost-based DR (e.g., dynamic tariffs) or for explicit/incentive-based DR (e.g., frequency control) [9], but not at the same time. The choice of one over the other is subject to profitability assessment;
  • Occupant engagement is often fundamental to ensure profitability: In buildings, the role of occupants is much more relevant than in industries. This both from a user’s comfort perspective and in terms of participation in DR actions;
  • Customer needs differ according to building type: DR might not be suitable in all buildings because customer needs vary significantly from one building type to another.
The above points have been taken into consideration when identifying the best strategy for appropriate Business Models development. Concerning DR market maturity, three maturity levels have been considered:
(1)
Fully-developed DR markets, where both implicit and explicit DR schemes are implemented (such as those in France, UK, and the Netherlands);
(2)
Partially-developed DR markets, where only implicit DR is available (such as Italy);
(3)
Under-developed markets, where DR only involves energy efficiency measures and management of local generation.

3. Methodology Used for Business Model Development

3.1. Overall Methodology

Figure 1 outlines the approach used for Business Model development; the activities involved are grouped into three phases.
(1)
Development of the first version of Business Models and preliminary validation. In this phase, initial DR-BOB Business Models are developed following a top-down approach, starting from market analysis and value proposition identification rather than from specific business cases or applications. Pre-validation of these Business Models is obtained though mapping with DR-BOB pilot sites and initial feedback from interviews, which identify areas that require further investigation.
(2)
Implementation of Business Models in real cases and validation through cost-benefit analysis. In this second step, the developed Business Models are applied to real cases (i.e., the DR-BOB pilots) with real customer needs and requirements. This phase enables the adaptation of the general Business Models produced in phase 1 by giving more importance to customers, end users, and building occupants than to DR market evolution. Profitability of the DR-BOB solution implementation in the four pilots and (in turn) validation of these pilot-focused Business Models is conducted through cost-benefit analysis based on the results of the implementation activities in terms of cost saving and customer satisfaction.
(3)
Refinement of Business Models for full applicability. Finally, results of cost-benefit analysis, together with feedbacks from interviews and workshops (involving BOBs owners and occupants other than those of the four pilots and a wide set of stakeholders in the DR-value chain), allow us to move from the validated pilot-focused Business Models back to general ones, ensuring a reliable and consistent homogenization of results. All this will result in the final version of the Business Models, now refined using a bottom-up approach and widely applicable to a highly segmented market.
The strategy for an effective Business Model development consists therefore in a synergic combination of a top-down and a bottom-up approach. In this sense, the application of the general Business Models in the pilot cases is considered to be a fundamental turning point to validate the general, market-led assumptions on the DR-BOB added value and to compare them with the needs of customers in real cases.

3.2. Detailed Methodology for Phase 1

At the time of writing, only Phase 1 is completed, which led to the definition of the first version of Business Models. The following process was applied in their design and preliminary validation.
  • Definition of the current value network for DR services. The value networks for DR services across European countries are identified to detail market conditions, the role of key stakeholders, customer needs, and products/services currently available to fulfil these needs. Information was collected through desk research, project partners’ contribution, and informal interviews with the pilot partners.
  • Definition of DR-BOB products/services. Based on the individual technologies developed in the project (DEMS, LEM, CP), the associated services, and their relevance to the identified key stakeholders, logical combinations of components were made. This resulted in a clear set of DR-BOB products and services to be applied to different types of customers in different market maturity conditions.
  • Identification of target customer segments. Analysis of the possible positioning of a DR-BOB product or service provider on the two generic value networks. From this analysis, two target customer segments are identified: aggregators and owners of blocks of buildings. A further refinement in the two identified customer segments is made, based on the information retrieved from previous market research in the project. This results in four different customer segments.
  • Value Proposition identification. For each of the four customer segments, the jobs to be done, pains and gains have been mapped on a Value Proposition Canvas. The results from a first round of semi-structured interviews was used as the input for this exercise. Next, the DR-BOB products and services and expected customer benefits were plotted on the Value Proposition Canvas, showing the mapping between DR-BOB products and the customer segments.
  • Design of Business Models. Using the Business Model Canvas, two business models have been prepared, each targeted at a different customer segment.
  • SWOT analysis of the business models. Analysis of the favorable and unfavorable internal and external factors of the two DR-BOB business models.
  • Validation of the business models against the pilots. Interviews with pilot stakeholders were held in order to gain insight into the jobs, pains, and gains of the pilot organizations, to check how the business models and value propositions matched the conditions of the pilot organizations, and to acquire initial feedback from the interviewees. A total of 14 interviews were held with representatives of pilot sites in the management, marketing, and operations business areas. The objective was to answer the following questions. First, how do pilots currently manage their businesses and create value for their clients. Second, what is the role and importance of energy management and energy in general for them and their clients. Third, how do pilots think DR-BOB can help them improving their work and/or improve their value proposition, and what are the potential issues/limits for its implementation.
  • Fine-tune Business Models and Value Propositions. The results of the interviews are used to adapt the business models and value propositions to improve their match with the pilot organizations’ needs and demands and come out with a list of useful recommendations for future development activities.

4. The DR-BOB Added Value

As part of the first phase, a market analysis identified how the DR-BOB solution can generate value with respect to current DR technologies and expected evolutions in European markets (in other words the DR-BOB added value). Initially the analysis did not focus on specific customer segments (i.e., how DR-BOB can bring value to specific stakeholders), but considered the current DR markets in different European countries and the key requirements of DR schemes and operations. The main value elements brought by the DR-BOB solution are listed below.
  • DR enabling technology: DR-BOB allows BOB to participate directly or indirectly (with an aggregator) in both implicit and explicit DR schemes;
  • Flexibility & Scalability: DR-BOB is a flexible solution that enables both implicit and explicit DR in BOB. It is made of components that can be used individually or jointly to provide a wide range of services to different customer segments. The solution can be integrated in existing Building Energy Management Systems (BEMS) and is scalable, i.e., new components can be added once DR schemes are enabled. Therefore, the solution can be applied to different types of buildings and in markets with different DR maturity levels.
  • Smarter DR service in BOB: DR in buildings is currently mostly limited to direct load control. DR-BOB adds intelligence at BOB level, thus enabling multiple assets control in presence of a DR request. DR-BOB always finds the most effective solution in terms of assets management, where effectiveness does not only involve technical aspects, but also financial, environmental and comfort ones.
  • New eligible assets for DR: Small building assets (e.g., with capacity lower than 0.5 MW) so far have not been eligible for participation in explicit DR schemes (even through direct load control) due to technical and economic reasons. This limit is even stricter when participation involves acting on complex control strategies (e.g., for HVAC systems). By adding control at BOB level, DR-BOB extends participation to these assets, which become fully capable of providing DR services.
  • Extended DR potential in BOB through smarter control strategies: Direct asset control is generally done through simple control algorithms based on fixed set-points (e.g., an electric water heater can be switched on-off freely, provided that the water temperature is always above a certain value). The DR-BOB solution allows more complex control strategies and control based on varying conditions (e.g., weather), thus maximising flexible load availability on a real-time basis.
  • Engagement of building occupants: DR-BOB enables the participation of building/facility managers and building occupants in DR actions so that changing local circumstances can be taken into account to ensure that local conditions are not compromised. In addition, the engagement of building occupants can support the creation of awareness and support more energy-efficient behaviours at the workplace.

5. Identified Customer Segments and Business Models

The analysis of the added value of the DR-BOB solution was then sharpened to target specific customer segments and identify business opportunities. This led to the development of two Business Models, both addressing the ambitions and the value offering of a “DR-BOB solution provider”, but each targeting different costumer segments and different market conditions. The DR-BOB solution provider can be considered as a technology provider, but it focused here on the provision of the DR-BOB products and services. Business Models have been developed using the Osterwalder’s canvas methodology [10]. To further clarify customer needs and shape the DR-BOB solution value proposition, the business models have been further refined using the Value Proposition canvas methodology [11].
The first Business Model targets BOB owners with different capabilities and in different market conditions:
  • BOB owners in fully developed DR markets with enough capacity (in terms of available flexibility) to directly participate in explicit DR schemes;
  • BOB owners in fully developed DR markets without enough capacity (in terms of available flexibility) to directly participate in explicit DR schemes and participating through an aggregator;
  • BOB owners in partially developed and undeveloped DR markets doing implicit DR or predictive building management.
The second Business Model targets aggregators, which exist only in fully-developed DR market contexts.
In Business Model 1, the technology provider sells the solution directly to BOB owners (or other stakeholders that could be associated with BOB such as municipalities, district managers, local Distribution Network Operators, or intermediaries like ESCOs (Energy Service Companies). The BOB owner gets the opportunity to improve its controllability on the building and, based on the specific market conditions, reduce its energy bill through implicit and explicit DR (with or without an aggregator). In addition, the solution enables predictive maintenance (due to the great amount of data managed) and is able to involve building occupants. In terms of revenue streams, two approaches are identified: product-based and service-based. The choice of one or the other is a function of the market maturity level, of the specific conditions of the BOB, and of the willingness of the DR-BOB solution provider to include building management in its service offering.
For the product-based revenue stream, the DR-BOB solution provider sells the solution directly to the BOB Owner, together with all installation services required to make it fully operative (e.g., integration with existing BEMSs and control systems, implementation and calibration of algorithms, communication between components, support with DR schemes, etc.). Then, the provider also sells maintenance and customer support services, which include regular upgrades to both hardware and software, problem fixing, etc. These additional services are typically sold through annual contracts at a fixed rate based on building size and complexity. This approach is typical of BEMS providers.
The second case uses a service-based approach that is typical of ESCOs. In this case, the revenue for the DR-BOB solution provider does not come from the direct sale of products and limited services, but from part of the revenue that the BOB Owner gets from the utilization of the DR-BOB solution. In this sense, the provider installs the DR-BOB tool in the BOB and provide all services (installation, maintenance, customer support, etc.) without any direct compensation but is paid as a result of cost-saving and revenue obtained from energy efficiency measures and implicit and explicit DR programs. The two parties sign a contractual agreement (which in the case of ESCOs is called Energy Saving Performance Contract—ESPC) that specifies duration of the service, compensation, obligations, etc. Differently from the product-based approach, in this second case, the DR-BOB solution provider is investing in the implementation of DR-BOB in the BOB and expects to get a return from that. This means that the provider is directly interested in how the building is managed and the solution is used. Therefore, it is likely to provide consulting and knowledge to maximize the benefits. In this sense, it is likely that the BOB Owner might decide to externalize facility management services in favor of the DR-BOB solution provider. The BOB Owner would reduce its operative costs and maximize the impact of the DR-BOB solution utilization. The provider would be able to fully control and maximize the profitability of its investment and strengthen its relationship with the end customers.
In the second Business Model, the solution is provided to aggregators that use the DR-BOB solution (in particular, the Siemens’ DEMS®) to extend their portfolio of flexibility providers and then participate in explicit DR schemes. Other stakeholders that could take the roles of aggregators in future are ESCOs, retailers and DSO, if supported by regulations. The main revenue for the DR-BOB solution provider should come from the direct sale of the DEMS and LEMs and CPs (to be then installed in BOBs) and from a limited number of associated services (e.g., training to the aggregators, installation of the DEMS and upgrades). This because the provision of services associated to the BOB, such as installation of LEM and CP, customer support, and maintenance and upgrades, should be part of the agreement between the aggregator and the BOB Owner and should not involve directly the DR-BOB solution provider.
In fully developed DR markets, it is the aggregator who is interested in enabling DR in BOBs and the one sending DR requests to its clients. In spite of this, it is likely that the aggregator will sub-contract some of these services to the solution provider or other professionals due to their higher experience, although always keeping the direct relationship with the end user. This is even more probable in emerging DR markets, where new aggregators will lack the resources for the implementation of the solution in buildings.
However, unlike Business Model 1, it is unlikely that the aggregator will want to establish a service-based agreement with the DR-BOB solution provider and compensate it with part of the revenue obtained from participation in explicit DR schemes. Direct sale seems the only viable option.

6. Implementation in Use Cases

The development and deployment of DR technologies and programs is driven by business opportunities related to improvements in the electricity network or market-based opportunities [12]. Within the former group, the opportunities lie in the possibility of using flexibility in existing energy markets (day-ahead, balancing and ancillary service, capacity, etc.) to provide services to market players and network operators [8]. Many studies have already proven the effectiveness of such business opportunities and models through simulation and empirical assessment of DR programs applied to existing markets [13,14] and also refer to the building sector [15]. In DR-BOB, the scope is not to create/test new DR schemes, but simply to check the applicability and profitability of existing ones using flexibility provided by Blocks of Buildings. It is also in scope of the project to assess the appeal and techno-economic convenience of values of flexibility other than the use in energy markets. To do so the business models developed in the already-completed phase 1 will be implemented in the four project’s pilot sites to assess effectiveness and profitability of the DR-BOB solution in real cases. This will also provide feedbacks on technical issues, occupants’ engagement, impact on end users’ comfort conditions, constraints in specific buildings, etc.
Demonstration activities at each pilot will involve the following three steps.
(1)
Collection of historical data for the creation of a reliable baseline (for both consumption and environmental data), including eventual upgrades to the buildings’ monitoring and control systems;
(2)
Installation and set-up of the DR-BOB solution;
(3)
Running of the DR-BOB solution for a given observation period (up to one year).
During the final step, the building energy/facility manager will receive and implement DR requests. These will be triggered based on real and/or emulated events (using a market emulator developed as part of the project) and existing DR and tariff schemes. Building occupants will be asked to provide feedback on other aspects of the solution, such as impact on building management comfort conditions, their work load, etc. Full description of the DR-BOB scenarios can be found in [16], with key aspects summarized below.

6.1. UK Pilot Site—Teesside University

The demonstration activities at Teesside University will involve four explicit DR schemes and one implicit one, as reported in the following Table 1.
The scenarios will globally involve up to 700 kW of flexible capacity, mainly deriving from the HVAC system and the CHP of the university. Scenario 3 will also heavily involve building occupants. All explicit DR schemes are established by the UK TSO (UK National Grid) [17].

6.2. French Pilot Site—Montaury District (Anglet)

In this group of office buildings, the demonstrations will involve two implicit and two explicit DR schemes, as reported in the following Table 2.
Main assets involved are heat pumps and office equipment. This pilot sites also include a DR action on gas consumption.

6.3. Italian Pilot Site—Fondazione Poliambulanza hospital (Brescia)

Demonstration activities at the hospital will involve 3 implicit and one explicit DR scheme. This because explicit DR programs are not yet available in Italy. Table 3 reports the DRs scenarios implemented.
The scenarios will involve up to 350 kW of flexible assets. Some events will be triggered by a dynamic tariff, obtained as a combination of energy costs for generating heat, coolth and electricity through a trigeneration plant (CCHP) and the hospital’s gas and electricity import tariffs. Scenario 2 will heavily involve the members of the hospital’s administration staff, who will be required to switch off non-essential office equipment.

6.4. Romanian Pilot Site—Technical University of Cluj-Napoca

As in Italy, Romania has not yet established explicit DR schemes. As a consequence, scenarios for this pilot site will emulate some explicit DR conditions, as summarized in Table 4.
The two scenarios implemented in the university will involve up to 100 kW of flexible capacity and will directly engage students in the DR actions.

6.5. Methodology for Cost-Benefit Analysis

A detailed cost-benefit analysis will be carried out for each pilot site, with the aim of assessing the profitability of the implementation of the DR-BOB solution. The scope of the analysis will be limited to the boundaries of the four blocks of buildings and it will not take into consideration, in phase 2, the impact of the DR-BOB solution on the electricity network and the benefits in case of extensive deployment.
Costs will be divided into Capital Expenditures (CAPEX) and Operational Expenditures (OPEX). The former will include the total cost for purchasing, installing, and configuring the DR-BOB hardware and software components, as estimated by the project partners that developed them. CAPEX will also include the additional costs for improving the monitoring and control capabilities of the buildings and enabling an effective deployment of the DR-BOB solution. To this aim, the project provided for the development of a dedicated methodology for assessing the DR Technology Readiness Level (DRTRL) of a building [18]. All pilots were assessed and categorized based on this methodology, which also gave an indication of the required additional metering and control equipment to be installed to achieve the appropriate readiness level. Information about OPEX will be collected during the observation period by recording direct and indirect costs for running the DR-BOB solution; this includes either human resources, licenses for DR-BOB software or other tools (e.g., Building Management Systems), maintenance activities resulting from DR-BOB, etc.
Benefits will be obtained from the economic results of the DR actions during the observation period (either triggered by real or emulated events). The LEM and DEMS are programmed based on existing DR schemes and settlement processes. In most cases, these involve the calculation of a dynamic baseline (based on historical data and current weather and occupancy conditions) and the comparison with the consumption observed during the DR event. Results for each DR instance will be recorded and visualized on the CP, and their cumulation will provide the total cost-saving and revenue during the observation period.
Reliability and consistency of results will be also ensured by adequate replicability assessments to make sure all flexible assets and all DR opportunities are taken into account when calculating overall benefits due to DR.
Furthermore, estimation of benefits will also include those deriving from improvements in building management and operation of assets and from the increased participation of building occupants in energy-related activities. Table 5 summarizes the data to be recorded for use in the cost-benefit analysis at each pilot site.
The collected cost and benefit information will be then used to calculate cashflows and extract relevant economic indicators (payback time, NPV, IRR) associated to the implementation of the DR-BOB solution in each block of buildings. Finally, as part of phase 3, the results of the cost-benefit analysis will be abstracted and scaled up at national and European levels to see the potential impact of the DR-BOB solution on the various EU DR markets and arrive to the final version of the business models. This will be done in compliance with well-established methodologies for cost-benefit analysis of smart grid projects [19,20].

7. Key Findings from Phase 1

The development of the initial version of the DR-BOB Business Models involved identification of key relationships between stakeholders involved in the DR value chain and an analysis of expected evolution scenarios for DR markets in Europe. The initial validation of the identified value propositions is achieved via 14 interviews with representatives of the management, marketing, and operations departments at the pilot sites. The scope was to understand customer needs and start the tailoring of the Business Model to the specific pilot cases. The key findings to be taken into account when implementing the solution at the four pilot sites and develop the final version of Business Models are listed below:
  • Importance of DR market maturity: As already mentioned, development of DR services is progressing at different rates in EU countries due to a lack of appropriate regulatory frameworks and uncertainty about the evolution of regulation for DR. This significantly affects all aspects of a Business Model, including value propositions, revenue streams, channels, and key activities. For instance, in DR-ready countries such as the UK or France, the most relevant business opportunities are market-based and tend to privilege users able to provide a large amount of flexibility. In countries where DR schemes are not present or are under development, enhanced building control or management of local generation become the more appealing opportunity. Market maturity and the evolution of market conditions are aspects that must be accurately considered when implementing DR-BOB in the four pilot sites as they impact significantly on cost-benefit elements. Table 6 gives an indication of the potential energy cost-saving (for both electricity and heat) and DR revenue achievable in the four pilot sites through participation in implicit DR and use of predictive building management strategies and participation in explicit DR schemes respectively. These are expressed as % of the actual energy and electricity bills and will be validated as part of the demonstration phase of the project. The table shows that in Italy and Romania, potential saving for implicit DR are higher than in the UK and France, because no explicit DR scheme is currently available in these countries. However, any modification in the regulatory framework of these countries in the coming years might significantly impact in the distribution of the two sources of revenue. Flexibility can be only used once, so it will be used to participate in the schemes that brings higher savings.
  • Importance of customer segmentation: The interviews illustrated that value propositions and customer needs can vary significantly in different building types. In some cases, this could completely re-shape the DR-BOB solution providers Business Model. For instance, comfort conditions are more relevant in hospitals than in universities due to stricter air quality and thermal requirements. The hospital’s staff are more concerned about the potential impact of DR on patients’ comfort conditions than the universities staff are concerned about the potential impact of DR on students’ comfort conditions. Therefore, further segmentation of customers per building type is required to specify the DR-BOB solution offer further according to building type. This issue of customer segmentation is closely related to the next key finding, which concerns the role of building users and occupants.
  • The role of building users and occupants: Building users and occupants are the DR-BOB solution’s end users and enablers. Without an accurate understanding of their needs and the reasons behind their engagement in DR it will be difficult to fully unlock the DR potential of BOBs. In commercial buildings targeted by DR-BOB where factors such as profit maximization, convenience, and comfort have different importance for different individuals [21], the human factor is a primary risk [22]. Some of the DR schemes to be implemented in the pilot sites require occupants to be engaged in DR actions. The implications of users’ participation will have to be taken into account when implementing the solution at the project pilot sites and when estimating the benefits deriving from participation in DR programs [23]. A miss-understanding of customer needs or an incorrect interpretation of users’ participation may lead to the adoption of inappropriate business models.
  • The need to highlight benefits of the DR-BOB solution: To reach BOB owners, particularly in undeveloped and partially developed DR markets, the benefits of the DR-BOB solution should be clearly shown in comparison with other cost-saving solutions (e.g., energy efficiency/Demand Side Management). In fact, many representatives of the pilot sites did not fully understand the convenience of DR solutions with respect to energy efficiency interventions such as LED replacement or envelope insulation. This is to be done by structuring the DR-BOB cost-benefit analysis in a way that enables clear comparison with other cost-saving measures (e.g., payback time) but also takes into account the potential benefits associated to DR market evolution (e.g., scenario-based Life Cycle Cost Analysis).

8. Conclusions

Traditional methodologies for Business Models development and validation tend to fail when involving DR services, especially in the context of commercial buildings. This is often due to the large number of stakeholders involved and the difficulties of identifying value for each of them. This paper presents an alternative methodology based on the coupling of a top-down and a bottom-up approach, starting from the general market level, moving to the specific application in real cases, and then scaling up back to the general. The first stage of this methodology has been applied at the time of writing. This led to the definition of two Business Models, both addressing the value offering of the DR-BOB solution provider but targeting respectively BOB Owners in different market conditions and aggregators. The initial validation of the Business Models has involved interviews with pilot sites representatives. These were useful to sharpen the value proposition and identify key aspects for improvement. In particular, the evolution of DR markets and the need further segmentation of customers per building type are the as key to building reliable Business Models and ensure fast market penetration of the DR-BOB solution. It is also important that the next phases of the Business Model development ensure occupants’ participation in DR and communicate the added value of DR with respect to other cost-saving measures to guarantee a fruitful implementation of the solution and maximize profitability.

Acknowledgments

The authors acknowledge financial support from the European Commission under the H2020 program, project DR-BOB (Demand Response in Blocks Of Buildings), GA No. 696114.

Author Contributions

Mario Sisinni wrote the paper, coordinated the work and was responsible for the identification of the added value of the DR-BOB solution and the development of the business models. Sander Smit, Federico Noris and Thomas B. Messervey contributed to the definition of the methodology for business model development and to value proposition canvases. Tracey Crosbie contributed to the refinement of the business models and the definition of key aspects of the canvases; she also acted as quality reviewer. Sylvia Breukers and Luc Van Summeren coordinated the interviews to key representatives of the pilot sites and contributed to the identification of key findings.

Conflicts of Interest

The authors declare no conflict of interest.

References

  1. European Parliament. ‘Decision No 406/2009/EC of the European Parliament and of the Council on the Effort of Member States to Reduce Their Greenhouse Gas Emissions to Meet the Community’s Greenhouse Gas Emission Reduction Commitment up to 2020’. 23 April 2009. Available online: http://eur-lex.europa.eu/eli/dec/2009/406/oj (accessed on 20 October 2017).
  2. European Environmental Agency. Overview of Electricity Production and Use in Europe; EEA: Copenhagen, Denmark, 2014. [Google Scholar]
  3. Crosbie, T.; Vukovic, V.; Short, M.; Dawood, N.; Charlesworth, R.; Broderick, P. Future Demand Response Services for Blocks of Buildings; Springer: Berlin, Germany, 2016. [Google Scholar]
  4. Crosbie, T.; Short, M.; Dawood, M.; Charlesworth, R. Demand Response in Blocks of Buildings: Opportunities and Requirements. Enterpreneurship Sustain. Issues 2017, 4, 271–281. [Google Scholar] [CrossRef]
  5. SEDC—Smart Energy Demand Coalition. Explicit Demand Response in Europe—Mapping the Markets 2017; SEDC: Brussels, Belgium, 2017. [Google Scholar]
  6. Shen, B.; Ghatikar, G.; Lei, Z.; Li, J.; Wikler, G.; Martin, P. The role of regulatory reforms, market changes, and technology development to make demand response a viable resource in meeting energy challenges. Appl. Energy 2014, 130, 814–823. [Google Scholar] [CrossRef]
  7. COWI Consortium. Impact Assessment Study on Downstream Flexibility, Price Flexibility, Demand Response & Smart Metering; European Commission—DG Energy: Brussels, Belgium, 2016. [Google Scholar]
  8. Behrangrad, M. A review of demand side management business models in the electricity market. Renew. Sustain. Energy Rev. 2015, 47, 270–283. [Google Scholar] [CrossRef]
  9. Eurelectric. Everything You Always Wanted to Know about Demand Response; Eurelectric: Brussels, Belgium, 2015. [Google Scholar]
  10. Osterwalder, A.; Pigneur, Y. Business Model Generation: A Handbook for Visionaries, Game Changers, and Challengers; Wiley: Hoboken, NJ, USA, 2010. [Google Scholar]
  11. Osterwalder, A.; Pigneur, Y.; Bernarda, G.; Smith, A. Value Proposition Design Book. 2014. Available online: https://strategyzer.com/books/value-proposition-design (accessed on 29 January 2017).
  12. Thomas, C.; Kim, J.; Star, A.; Hong, J.; Nam, Y.; Choi, J. An assessment of business models for demand response. Presented at the Grid-Interop Forum, Denver, CO, USA, 17–19 November 2009. [Google Scholar]
  13. Parvania, M.; Fotuhi-Firuzabad, M.; Shahidehpour, M. Optimal Demand Response Aggregation in Wholesale Electricity Markets. IEEE Trans. Smart Grid 2013, 4, 1957–1965. [Google Scholar] [CrossRef]
  14. Ma, O.; Alkadi, N.; Cappers, P.; Denholm, P.; Dudley, J.; Goli, S.; Hummon, M.; Kiliccote, S.; MacDonald, J.; Matson, N.; et al. Demand Response for Ancillary Services. IEEE Trans. Smart Grid 2013, 4, 1988–1995. [Google Scholar] [CrossRef]
  15. Zhou, Z.; Zhao, F.; Wang, J. Agent-Based Electricity Market Simulation with Demand Response from Commercial Buildings. IEEE Trans. Smart Grid 2011, 2, 580–588. [Google Scholar] [CrossRef]
  16. Perevozchikov, I.; Brassier, P.; Broderick, J.; Short, M.; Galluzzi, J.F.; Czumbil, L.; Ceclan, A. DR-BOB—D2.2: Demonstration Scenarios. In DR-BOB—Demand Response in Blocks of Building; European Commission: Brussels, Belgium, 2016. [Google Scholar]
  17. UK National Grid—Balancing Services Webpage. Available online: http://www2.nationalgrid.com/uk/services/balancing-services/ (accessed on 20 July 2017).
  18. Crosbie, T.; Broderick, J.; Short, M.; Charlesworth, R.; Dawood, M. Demand response technology readiness levels for blocks of buildings. In Proceedings of the the Sustainable Places Conference 2017, Middlesbrough, UK, 28–30 June 2017. [Google Scholar]
  19. Giordano, V.; Onyeji, I.; Fulli, G.; Jimenez, M.S.; Filiou, C. Guidelines for Conducting a Cost-Benefit Analysis of Smart Grid Projects; European Commission—Joint Research Centre: Brussels, Belgium, 2012. [Google Scholar]
  20. Schiavo, L.L.; Larzeni, S.; Vailati, R.; Stromsather, J.; Raphaël, R.; Delfanti, M.; Elia, E.; Sommantico, G. Cost/benefit assessment for large-scale smart grids projects: The case of Project of Common Interest for smart grid “GREEN-ME”. Presented at the 23rd International Conference on Electricity Distribution, Lyon, France, 15–18 June 2015. [Google Scholar]
  21. Good, N.; Ellis, K.A.; Mancarella, P. Review and classification of barriers and enablers of demand response in the smart grid. Renew. Sustain. Energy Rev. 2017, 72, 57–72. [Google Scholar] [CrossRef]
  22. O’Connell, N.; Pinson, P.; Madsen, H.; O’Malley, M. ‘Benefits and challenges of electrical demand response: A critical review. Renew. Sustain. Energy Rev. 2014, 39, 686–699. [Google Scholar] [CrossRef]
  23. Breukers, S.; van Summeren, L.; Crosbie, T. Mind the gap when implementing technologies intended to reduce or shift energy consumption. In Proceedings of the the Sustainable Places Conference 2017, Middlesbrough, UK, 28–30 June 2017. [Google Scholar]
Figure 1. Approach for Business Model development.
Buildings 07 00093 g001
Table 1. Demand Response (DR) scenarios and scheme implemented in the UK pilot site.
#Scenario ImplementedType of DRReference DR SchemeMain Assets Involved
1Electric Demand ReductionExplicitShort Term Operating Reserve (STOR)HVAC
2Electric Demand IncreaseExplicitDemand Turn Up (DTU)Micro CHP
3Electric Peak Demand ReductionExplicitCritical Peak Pricing (CPP)Laboratory equipment
4Electric Peak Demand ReductionImplicitScheme based on ToU tariffsEV charging
5Static Frequency ResponseExplicitFrequency Control by Demand Management (FCDM)UPS, backup generators
Table 2. DR scenarios and scheme implemented in the French pilot site.
#Scenario ImplementedType of DRReference DR SchemeMain Assets Involved
1Electric Demand ReductionExplicitFrench Capacity MarketHeat pumps and small power
2Gas Demand ReductionExplicitNoneWoodchip and gas boilers
3Electric Peak Demand ReductionImplicitScheme based on ToU tariffs and weather conditionsHeat pumps and small power
4Virtual microgridImplicitEquivalent to UK Demand Turn Up (DTU) based on local PV generation and local requestsPV plant
Table 3. DR scenarios and scheme implemented in the Italian pilot site.
#Scenario ImplementedType of DRReference DR SchemeMain Assets Involved
1Electric Peak Demand ReductionExplicit (virtual)Virtual Critical Peak Pricing (CPP) Chillers
2Electric Demand shavingImplicitDynamic tariff based on use of CCHP and ToU tariffsSmall Power
3Electric Demand ShiftingImplicitDynamic tariff based on use of CCHP and ToU tariffsFood carts
4Optimal schedulingImplicitScheme based on ToU tariffs and weather conditionsCCHP and all generation systems
Table 4. DR scenarios and scheme implemented in the Romanian pilot site.
#Scenario ImplementedType of DRReference DR SchemeMain Assets Involved
1Electric Peak Demand ReductionExplicit (virtual)Virtual Critical Peak Pricing (CPP)Chillers, HVAC, pumps, PCs and lab equipment
2Electric Demand ReductionExplicit (virtual)Virtual Direct Load ControlHVAC, washing machines, PCs
Table 5. Data recorded for the cost-benefit analysis.
ItemDetailsSource of Information
CAPEXPurchase, installation and configuration of DR-BOB componentsEstimation of project partners and actual installation costs
Additional metering and control equipmentActual purchase and installation costs
OPEXRunning of the DR-BOB solutionActual direct and indirect costs recorded during observation period
BenefitsParticipation in DR programsActual benefits recorded during observation period, including replicability assessments
Predictive building management, improved awareness and participation of building occupantsActual benefits recorded during observation period, results of qualitative assessments
Table 6. Estimated ranges of cost-saving and revenue for participation in DR and predictive building management.
Pilot SitePotential Energy Cost-Saving due to Implicit DR (% of the Energy Bill) and Predictive Building ManagementPotential Revenue due to Explicit DR (% of the Electricity Bill)
UK3–5%7–10%
France2–4%5–8%
Italy5–10%0% (to date)
Romania5–10%0% (to date)

