How Green Do We Want to Live in 2100? Lessons Learned from the Homes of the Present-Day Rich


Department of Economic Geography, Faculty of Spatial Sciences, University of Groningen, P.O. Box 800, 9700 AV Groningen, The Netherlands
*
Author to whom correspondence should be addressed.
Buildings 2017, 7(4), 97; https://doi.org/10.3390/buildings7040097
Submission received: 21 July 2017
/
Revised: 18 September 2017
/
Accepted: 12 October 2017
/
Published: 23 October 2017
(This article belongs to the Special Issue Nature-Based Solutions and their Relation to Urban Resilience)
Abstract
:This study explores the extent to which rich Dutch households live green, in the form of green surrounding homes directly and nearby public green. The authors interpret this ‘greenness’ as a signal of how green the wider population wishes to live in the long-term as it grows wealthier over time. In our analyses of property transaction data on the 2009–2012 residential market, we focus on 2303 properties that sold for at least 1 million Euros, the ‘properties of the rich’. Results indicate that the rich live relatively green: on average, and depending on local degrees of urbanization, the parcels of million Euro properties are up to 7.0 times larger than parcels of lower priced properties. We find too, that the rich live closer to public green spaces than the more general population does, especially if such green is highly appreciated by a wide public. Furthermore, the rich are found to live in either very highly urban locations or in the least urban locations—if these are nearby cities. We perform basic long-term land-use forecasts of demand for residential space across local property markets, and findings suggest that preference for green living will increase over time. Our results especially show that how well these green preferences are accommodated by existing residential structures may become increasingly problematic as and if we grow wealthier over time. Our findings may foster long ongoing research and policy debate on urban planning.
1. Introduction
Urbanization is an ongoing long-term process across the globe. Empirical evidence suggests that people worldwide, with the exception of those in very poor regions, “may all live in cities by the end of the century” [1] (p. 771). We may also become considerably wealthier if historical trends continue, see [2], in part because urbanization fosters processes that lead to wealth creation [3]. For instance, agglomeration economies of cities offer many jobs and allow people to specialize; cities also provide an extensive array of consumer amenities that people value greatly [4]. Higher wealth, however, appears to correspond with higher appreciation of green in residential areas [5,6,7]—and such green is essentially the counterpart of urbanity. This poses an important question for urban planning in the aim to strike a balance between the advantages of the supply of green and levels of urban density: as we grow wealthier over time, will we in future long for more green in our increasingly urban living environment? And if so, should cities not be built in a greener way than is currently being done? Indeed, due to the durability of residential real estate, decisions made today on how to balance green and grey as cities develop, will strongly influence how optimally residential preferences can be met in the future. Hence, this paper sets out to discover more about our future preferences for green living.
Predicting future residential preferences is notoriously challenging. Predictive models, however complex and comprehensive, are bound to use data on current preferences, trends therein, or scenarios, and thus the uncertainty of their predictive accuracy remains [8]. Perhaps for this reason, the literature on the measurement of future residential preferences, see for example [9,10], to the authors’ knowledge, does not include studies that focus on green. This gap in the literature is highlighted in the research agenda outlined in [11] (p. 71), commenting on the insufficient knowledge on how “the resilience and adaptability of urban areas to future economic, housing and environmental demands [can] be enhanced through appropriate design and management of urban green spaces”.
In this study, we accept the challenge of ‘forecasting’ how green the Dutch population wants to live in the future, and in so doing take an approach that is powerful in its simplicity. Our research here rests on the premise, or the thought experiment, that the general population’s future green preferences can be broadly understood from the characteristics and locations of residential properties purchased by the present-day rich;—if the general population grows wealthier over time—as indicated by trends in the Netherlands over past decades and centuries [12,13]. We follow Clark [2] (p. 4) in this respect, who writes “we already see how the rich live, and their current lifestyle predicts powerfully how we all eventually live if economic growth continues” as “over the long-run income is more powerful than any ideology or religion in shaping lives.” Clark’s statement resonates in this paper. We presume here that as we grow wealthier over time, the residential preferences of ‘the masses’ may converge towards those of the present-day rich, but obviously not so close as to mirror them precisely. For instance, in earlier years the wealthy had horse-drawn carriages, used a bathing tub with a servant pouring water onto their backs, and owned summer houses. The general population now owns cars, takes daily showers in a bathroom without servants and rents (or owns) recreational homes in summer. In other words, the general population mirrors the preferences of the earlier rich, but not precisely. The underlying rationale is that since demand for residential space both inside and outside of the home is elastic with income, as [14] show, increases in general wealth add pressure to the competition for land. An increase in competition drives land prices upward since, countrywide, only limited adjustment may be possible on the supply-side of the land market due to a Ricardian-like limitation of the supply of land for development. This situation is expected to continue over the long-run because of the Dutch government’s historical use of restrictive planning controls (see [15]), which are likely to be implemented since the already limited growth of the population is expected to slow even further over time. Thus, given the abovementioned market circumstances, even in the long-run, what matters is not people’s absolute wealth when they seek to buy large properties with large parcels, but rather their relative wealth [16]. We also adhere to the notion that general wealth is likely to rise over the long-term (c.f. [2]), and this would enlarge the material (residential) aspirations of the wider population [16,17]. In effect, how a widespread change in aspirations unfolds, with respect to the extent to which people wish to live ‘green’, is what this paper ‘forecasts’.
Before continuing, we think it is relevant to elaborate what is meant by the phrase ‘general wealth is likely to increase over the long-term’. Indeed, gross domestic product (GDP) growth may falter and has been modest in several western countries in recent years. The present paper does not dispute that; it is uncertain how economic development and the distribution of wealth across the population may move over the long-term. Although in several western countries overall GDP growth has been modest in recent years, we do not observe flat levels of real productivity and innovation in the globalized production system. This observation holds whether we look at the production of, for example, smart phones, agricultural goods, maritime transport, renewable energy, or electric cars. In each of the associated sectors strong innovative and productivity-enhancing forces are at work that affect real wealth although GDP growth is modest. The implication here is the possibility of long-term increases in real wealth shared amongst the general population; it is this context within which we presume that the general population may become wealthier over time.
In examining the extent to which the present-day rich live green as a sign of future preferences of the wider population, we compare the characteristics of expensive properties with other, less expensive, properties. To do so, we use property transaction data comprising about 80% of the Dutch residential market over 2009–2012, thereby allowing us to observe 2303 properties that sold for at least 1 million Euros. We analyze the size of these property parcels and measure the proximity of these properties to generic public green space and to public green space that has been deemed particularly attractive. We investigate the consideration that ‘greenness’ of properties may vary in accordance with local degree of urbanization. The abovementioned analysis is also performed on a sample of properties sold for less than 1 million Euros, comprising 99% of all observed properties, so that we may assess how green the relatively general population lives in the present day. We compare the findings of the ‘very expensive property’ and the ‘lower priced property’ samples to better understand the relative magnitude of how green the rich live.
The magnitude of how green the rich live is—in this study—assumed to demonstrate a relative preference for green living. However, it is possible that some rich prefer to live in properties with large parcels, not plainly because of direct enjoyment of green associated with the property, but because the green allows them to remain unobserved while outdoors, or otherwise mitigates negative externalities from neighbors. If so, the wealthy are not motivated only by the ability to enjoy the typical aesthetic or recreational amenities that green brings about. Perhaps the rich seek anonymity in the rural [18] by acquiring large estates, even though anonymity may be achieved in cities, as these host higher densities of population including other rich people. The precise motivations driving rich households to seek green are nevertheless beyond the scope of this paper. In the wider literature, land consumption by the rich is often related to the exhibition of wealth, prestige and status [16,19,20,21]. For example, Woods [21] suggests that some of the present-day rich emulate the rural lifestyles of the old aristocracy. Similarly, Brueckner et al. [6] show that urban location patterns of rich households can be endogenous. Such behaviors seem to justify the general assumption of the current paper that, if wealth increases over time, more people may seek to live as green as the present-day rich.
Our analysis on how green the present-day rich are living, builds on a theoretical rationale that underpins a wide literature on hedonic property price modeling [5,22,23]. Hedonic models estimate the change in property price, given a marginal change in a particular attribute, such as square meters or distance to green, to reveal present-day residential preferences from sampled property transactions. A key assumption then is that buyers acquire properties with the mix of attributes most preferable to them, and importantly, those that they can afford, given their budget for housing. Along the same line of thought we argue that when people are subject to a budget constraint so negligible that they are able to consider buying nearly any property listed for sale, they have the relative freedom to buy property which reflects their ‘ultimate’ preferences most closely. Hence, one can explore if people ultimately prefer to live more green, or less green, without estimating how households’ willingness to pay for a marginal change in the ‘greenness’ of their living environment is influenced by income level, as economic valuation studies tend to do [5,7,24]. The absolute physical dimensions of the parcels of present-day rich properties, and how close these properties are to public green, are also insightful in and of themselves. They offer an important window onto whether the wider population prefers to live more green or less green, in the future as it grows wealthier over time.
This paper’s perspective is broader than the scope of marginal effect analyses in economic valuation studies, including studies on hedonic property pricing [5,7,22]. Hedonic property price analyses have shown that, controlling for location and structural property characteristics, buyers in the Netherlands are willing to pay a premium of up to 16% for property nearby attractive nature, see ([22]; www.housingvaluenature.org); furthermore, a study of US data shows that the relative premium paid for an incrementally larger garden may be higher for higher priced properties [7]. Such information, however, pertains to preferences for marginal changes in the observed characteristics and does not contain information on people’s broader preferences for the overall physical dimensions of properties and gardens, one of the focal points of this work.
Given that we explore how green the present-day rich are living, and discuss the implications for urban planning if general wealth continues to rise over time, the present paper contributes to the literature on green urban planning (c.f. [11]), and joins the ongoing debate on how green, how centralized, or how decentralized we should build our cities [25,26,27]. In addition, as explicitly encouraged by [28], our research adds to the geographical field which examines lifestyles of the wealthy [29].
We structure the remainder of the paper as follows. The next section describes the study area, data, and our chosen methodology. The main results are then discussed in Section 3, which also analyzes demand for space if, in the future, more people begin living like the present-day rich. Section 4 discusses the implications of our results for urban planning.
2. Materials and Methods
Our study area, the country of the Netherlands, is suitable for our ‘natural field experiment’ for three reasons. First, the country’s gross domestic product per capita grew considerably, by a factor of 7.0, from 1921 to 2011 in real terms—as data from Statistics Netherlands indicates. Of course, rises in real prices of property and land have restricted households from increasing the quality of their residential situations. Nevertheless, it is clear that over the past century the residential standard of the Dutch has risen considerably, and we expect it to do so in the future. Second, in European countries, the location choices of the rich are driven by the presence of (natural) amenities rather than by the location of new construction, as is the case in the United States [30]. Thus, it is reasonable to assume that, in the Netherlands, the locations of properties of the rich give a fair representation of how near to public green the rich prefer to live. Third, the country is highly urbanized but also contains rural areas and the supply of green varies across space. For these reasons, the Netherlands offers an appropriate case for inquiring into the question of building greener cities with the assumption that, in the future, more people may wish to live like the present-day rich.
One may wonder why the authors of this study do not conduct a survey of the general population with regard to its expected preferences for green living in the future. We have decided not to because predicted utility is shown to have poor accuracy, and (future) material aspirations may respond to increases in wealth [17,31,32]. Hence, we study how wealth and green living relate through a direct analysis of rich households, based on information of their actual market behavior.
Properties of the wealthy are sampled from 2009–2012 data on property transactions registered in the Dutch Association of Real Estate Brokers and Real Estate Experts (NVM) database. The NVM data comprise about 80% of all transactions on the Dutch market in the observed years. Prices are adjusted for inflation to reflect the value of the Euro in 2012. The transaction data also describe several characteristics of the observed properties, including parcel size and location, but the data give no information about buyers. Our study defines properties of the wealthy as properties that sold for 1 million Euros or more, because buying such property requires a very large budget for housing. We do acknowledge that alternative definitions of ‘wealthy’ can be proffered, and thus consider several definitions later in the paper. After cleaning the data (it is noteworthy that, from the full transaction dataset, we use only observations of secondary market transactions of properties with a permanent residential function), we obtain our sample of 1 million Euro properties which includes 2303 single family properties and 201 apartments. As a ‘general population’ benchmark, we use a sample drawn from the NVM database of all other properties sold at prices below 1 million Euros. These observations include 254,871 single family properties and 113,498 apartments. Single family properties and apartments are considered separately, as their price formation and their distributions by urban density each differ structurally. The distributions of million Euro single family properties and apartments across NVM broker local property markets (N = 76) are shown in Figure 1. All observations are geocoded at address level.
In order to delineate public green, we use 2010 land use data from Statistics Netherlands. These data describe green of at least one hectare in size across the Netherlands. ‘Green’ is defined as any non-developed land that could be considered as ‘natural’: agricultural land (22,644 km2), in addition to typical green features, such as (urban) parks (284 km2), recreational green spaces (667 km2), allotments (38 km2), open nature (1411 km2), water bodies comprising lakes and lakes (3661 km2), and forests (3454 km2). With respect to green, we also consider that “as household incomes change over time, amenities are like hamburger or caviar in that some are inferior and some superior” [33] (p. 542). To distinguish among the ‘caviar’ in the green within our study area, we also use data that delineate green land uses that are highly appreciated by a wide Dutch public (at national scale). These data were generated in a study by Daams et al. (in press) by combining 2010 land use data with Greenmapper (previously named Hotspotmonitor) data. The Greenmapper is a Google Maps-based survey that asks respondents to designate green that, in their perception, is attractive– see [34,35,36]. Distances to (attractive) green are Euclidean in order to ensure a straightforward interpretation.
Green can be considered as a counterpart to developed land, and for this reason the interplay between green and urban density is an important focal point in our study. Spatial variation in urban density is measured from 2012 grid data acquired from Statistics Netherlands; in these data, urban density is measured as the per square kilometer density of addresses within a one-kilometer radius from a reference address. Urban densities are averaged at the level of grid cells with a resolution of 500 × 500 m. Using these data, we are able to construct two measures of urban density: urban density at property location in the 500 × 500 m grid cell and the average urban density in the NVMs local property market (see Figure 1a), where the observed property is located. Following definitions by Statistics Netherlands, our analysis mostly refers to urban densities as: ‘non-urban’ (density < 500), ‘little urban’ (500 ≤ density < 1000), ‘moderately urban’ (1000 ≤ density < 1500), ‘highly urban’ (1500 ≤ density < 2500), or ‘very highly urban’ (density ≥ 2500). Furthermore, since apartments are mostly located in ‘very highly urban’ areas (Figure 1c), we consider apartments separately from single family properties. This allows us to necessarily pay close attention to results for single family properties, since these are likely to be more heterogeneous due to variation in urban density—as comparisons of Figure 1a,b suggest.
3. Results
3.1. Main Results
Our aim is to determine how green the present-day the rich live and to compare this finding with how green the more general population lives. We first examine some of the basic characteristics of single family properties that have sold for 1 million Euros or higher, and compare these with the characteristics of single family properties that sold for lower prices (Table 1). A similar analysis is performed for a sample of apartments at the end of this section.
The first main finding is that the mean selling price of ‘1 million Euro properties’ (€1,425,815) is about five times higher than the price for properties at lower selling prices (€269,341). Therefore, the difference in mean parcel size is approximately a factor of 8, suggesting that parcel size is elastic with (extreme) wealth. To put this finding into perspective, the consumption of living area responds considerably less to wealth: 1 million Euro properties are, on average, about two times larger than properties with lower selling prices. These findings indicate that higher wealth corresponds to a corresponding higher need for more green surrounding the home rather than additional living space within the home. Kolmogorov-Smirnov tests comparing the distributions of both observed samples for each variable in Table 1 reject the hypothesis that the distributions of these samples are equal (p < 0.01).
As a complementary step, we also consider indices for average living area and average parcel size for property segments across the entire price distribution (Figure 2). The interpretation of these indices is as follows: a parcel area-index value of 700 means that in the associated property segment the average parcel size is seven times larger than in the segment of properties with selling prices below €100,000, the reference group for the indices. Both indices in Figure 2 indicate a smooth relationship with the observed levels of property prices. This smooth relationship gives additional confidence in the presumption that residential preferences of the wealthy for living area and parcel size may be shared by the general population (if its wealth increases), and that these preferences may not be specific only to the most affluent.
However, it is likely that living area and parcel sizes are sensitive to local variations in urban density. We therefore turn to the relation between urban density and how green the rich live. We first examine how million Euro properties are distributed across different degrees of urban density. Table 2 shows how ‘urban’ are the (500 × 500 m) locations of million Euro properties within local property markets of distinct degrees of urbanization, for which the finding yields important insights. With regard to urban density it is clear that the rich avoid the ‘non-urban’ and ‘little urban’ markets; only 5% of the million Euro homes are situated in one of the aforementioned local property markets. Depending on level of urbanization at local property market level, the rich are 2.09 to 5.14 times more concentrated in ‘non-urban’ locations, with such differences being large, especially in ‘highly urban’ and ‘very highly urban’ local property markets. In addition to the figures provided in Table 2, the data show that of all million Euro properties at ‘non-urban’ locations, 57% are located in a ‘very highly urban’ local property market. Furthermore, this share is 88% when ‘non-urban’ locations in at least moderately urban markets are considered. So, although the rich prefer to live at ‘non-urban’ locations, they nevertheless mostly situate themselves close to cities.
When we consider the findings shown in Table 2, one might surmise that wealthy property buyers prefer extremes of urban density; in Table 2 we report that, compared to properties with lower property prices, million Euro properties are most concentrated in ‘very highly urban’ locations (1.44 times more) and ‘non-urban’ locations (1.92 times more). We observe for example, that in ‘little urban’ local property markets the million Euro properties in most cases (73%) have ‘non-urban’ locations. Moreover, according to our results, ‘moderately urban’ locations seem to have little popularity among the rich.
We can now turn to Table 3, which gives sizes of living areas and parcels disaggregated by degree of urbanization at property level. While the average prices and living areas of million Euro properties are similar across degrees of urbanization, the average parcel size of these properties shows considerable variation: they range from 349 m2 (SD = 429 m2) in ‘very highly urban’ locations to 9164 m2 (SD = 22,740 m2) in ‘non-urban’ locations. Across degrees of urbanization, the average parcel sizes of million Euro properties are 2.1 to 7.0 times larger than the average parcel sizes of properties sold for lower prices, a finding which clearly suggests that the rich prefer considerable amounts of green surrounding their homes in any urban density context. For each of the variables in Table 3, Kolmogorov-Smirnov tests reject the hypothesis that the distributions of the two observed property samples (split by urban density) are equal (p < 0.01).
Table 3 also shows the proximity of properties to public green (of any kind, not just so-called attractive green, which we analyze later). For each degree of urbanization measured at the property location, the distance to public green is, on average, somewhat lower for million Euro properties, compared to the distances of properties with lower selling prices. Relative differences seem to gain prominence as population density increases; however, it should be noted that absolute differences in mean distances to public green are consistently below 100 m.
The previous finding merits further scrutiny. Since for any property some type of green may be nearby, it may be more informative to examine the percentage of the observed properties that are very close to public green: within 50 m. In this case we see that 50% of the million Euro properties are within 50 m of public green, whereas only 26% of the properties below 1 million Euros are as closely situated. This indicates that the rich live relatively close to public green. However, when we consider public green space regardless of its amenity-level, it is relatively abundant, and as a result both the affluent and the less affluent may live close to such green space in absolute terms. We can therefore now turn to an examination of distance to green space deemed to be highly attractive: its scarcity allows for more variation in its distance from properties.
To better understand the preference to live near public green, we now focus on one of its special characteristics: highly attractive areas. Figure 3 shows the distribution of the two samples of properties that are analyzed in this study by distance to green perceived as highly attractive by a wider public (comprising about 7% of total public green area). Nearly 30% of these properties are situated within 500 m of attractive green. The distribution of the remaining properties also shows a strong tendency towards relatively lower distances. Figure 3 depicts a much flatter distribution of properties with selling prices below 1 million Euros: of these properties, 75% are located within 6.69 km of attractive green, whereas 75% of the properties of the rich are found within 2.29 km. Our findings suggest that public green spaces, which are attractive to the wider public, indeed seem like caviar to the rich (c.f. [33]).
After having discussed our results for single family properties, we now turn to our findings in relation to million Euro apartments (N = 201). Million Euro apartments are fewer in number than 1 million Euro single family properties (N = 2303) and are very homogenous with respect to urban density: 94% of these apartments are found at ‘very highly urban’ locations (in slight contrast with the 84% of apartments sold at lower prices). The high urbanity of apartments is logical; the development of the apartment as a property structure is the solution to intensive demand for urban land. From this it follows that the highest priced apartments are found in the most highly urban locations. Our findings for apartments in relation to green are consistent overall with the findings for single family properties. The average living area of million Euro apartments is 2.0 times larger than the average living area of apartments sold at lower prices (for single family properties this ratio is 2.2). Also, million Euro apartments are on average somewhat closer to public green (115 m) than apartments sold at lower prices (153 m). We find that 19% of the former are within 50 m of green that is highly appreciated by a wider public, in contrast with 2% of the latter. Thus, while the observed apartments of the rich are more urban than the observed single family properties of the rich, they nevertheless both indicate a relative ‘greenness’.
3.2. Sensitivity Analysis
The sensitivity analysis below investigates whether findings are of a similar magnitude as those in the main analysis when ‘properties of the rich’ are defined in alternative ways. To do so, the key variables of this study on green are examined for three alternative property samples: the most expensive properties stratified by region, new constructions sold for at least 1 million Euros, and properties of millionaires (households with a minimum of capital amounting to 1 million Euros). To understand the level of urbanity for these samples, we assess the mean address density for each sample of the included observations. Given the low number of apartments in ‘new construction’ (n = 15) and ‘millionaire’ samples (n = 10), the analysis of sensitivity is restricted to single family property samples.
Our first alternative sample includes one percent of the properties in each NUTS II region (Province; N = 12) based on the criterion that, within their regions, they sold at the 1% highest price. We differentiate property transactions by NUTS II region because doing so at the (smaller) scale of local property markets could misrepresent the locations where the rich live, as those markets possibly include only the properties selling at relatively average, or even low prices. Moreover, we perform this analysis since the main analysis could overlook properties of rich households located in regions where pressure on property price is relatively low, for example, due to the limited presence of cities and agglomerations. Indeed, mean address densities are considerably lower for single family properties and apartments in the ‘regional top 1%’ sample—as with the million Euro property sample used in the main analysis—see Table 4. This may explain why, in the regional top 1% sample, mean parcel size is about 1.5 times larger than that of 1 million Euro properties. Furthermore, both single family properties and apartments in the regional top 1% sample are farther away from attractive nature than similar structures sold for 1 million Euros or more, but are nevertheless still in close proximity to these amenities. The extent to which results for the regional top 1% sample and the million Euro properties differ from results for their reference samples is proportionate to the difference between both samples of interest themselves—indeed, results for the reference samples, which include the large mass of properties sold for lower prices are similar.
We now consider whether the preference of the rich, in relation to parcel size, changes over time. We would assert, however, that preference is not reflected in the characteristics of properties sold on the secondary market (for the existing property stock), since these reflect preferences at the time of their construction. If parcel sizes of expensive properties sold on the secondary market are not satisfactory, by being either too large or too small, the rich may nevertheless still buy these properties. Such may be the case if any disutility associated with parcel size is somehow compensated by utility from other characteristics of the property. Most relevant to our analysis therefore, is the possibility that the rich buy properties with large parcels not because they prefer large parcels but because they prefer the properties that come with large parcels on the secondary market. To explore this, we analyze a sample of newly built single family properties, as these constructions are likely to reflect recent preferences for parcel size. Table 4 shows that, on average, the parcels (mean = 5417 m2) associated with new construction in our property transaction data are larger than those observed in the main analysis (mean = 3944 m2). This finding seems to suggest that the rich prefer even larger parcels than concluded in the main analysis. What is important here, however, is the robustness of the results, i.e., we do find broad similarity among the average parcel sizes in both analyses.
Finally, it may be the case that some of the rich do not live in ‘expensive’ properties. To check if this factor influences our main results, we analyze how millionaires live. To do so, we draw from a 2012 national survey, ‘WoON2012’ on housing situations gathered by Statistics Netherlands and the Dutch Ministry of the Interior and Kingdom Relations. This survey (N = 69,339) is representative for Dutch households in general. Survey responses are enriched with capital tax data in order to identify the responses of millionaire households (N = 287). Following Statistics Netherlands, millionaire households are defined as households with capital of at least €1,000,000. Of the 287 millionaire households observed, 10 live in apartments and 277 live in single family properties. We focus on single family properties in the WoON2012 sample. As with the main sample, we are only able to analyze green in the form of parcels. The observed parcels cover, on average, a 1644 m2 area (Table 4), which is considerably less than the 3944 m2 area reported in the main analysis for parcels of million Euro properties. But on average the parcels of millionaire properties are still about four times larger than the 426 m2 parcels of non-millionaire properties. Unfortunately, the property data do not include precise information on their locations, so we do not know whether the results presented here differ from the main results if we account for variation in parcel sizes with urban density. Importantly, however, by using this alternative definition of ‘properties of the rich’, and consistent with our main findings, we have determined that parcel sizes are considerably larger than parcels of the general population’s properties.
Although the millionaire-based definition, as applied in the analysis applied above, has its merits, it overlooks certain ‘rich’ households, such as households whose capital is less than €1,000,000 but whose income is high. In fact, some of the rich may not be defined as ‘millionaires’ due to having invested their capital in their homes. With this possibility in mind, the definition of ‘properties of the rich’ as properties that sold for at least 1 million Euros, seems to be reasonable. This definition can also be understood from the WoON2012 data, which show that among the households owning or renting property with an assessed value of 1 million Euros (N = 234), the share of millionaire households is equal to 18.8%. Importantly, the average income of the aforementioned owner or renter households, but excluding millionaires, is €137,692. This income is 3.2 times higher than the median income in the WoON2012 data. Thus, the non-millionaire households living in 1 million Euro properties are nevertheless relatively rich. The abovementioned findings underline the usefulness of observing the 1 million Euro property sample in the main analysis, as it may cover properties of households that are ‘rich’ in different ways.
3.3. What If We All Start Living Like the Rich?
What if, over the long-term, say in 2100, a higher share of the total Dutch population was to demand the same space for green living as the present-day rich do if general wealth increases over time? In this subsection we analyze how much residential space would be required to satisfy such a ‘forecasted’ demand, and whether this is a feasible notion, given the supply of developable land in the Netherlands. We are referring here to the spatial intensity of possible future demand for land. Such demand may, however, remain latent in the future property market because due to competition for land it is unlikely that a widespread demand for properties as spacious as those bought by the present-day rich could effectively materialize. As a result, widespread aspirations for green living and the actual residential structures may diverge over time if general wealth increases. Grasping the magnitude of such a divergent process, should it occur, gives additional meaning to the implications of our main results for spatial planning, which balances levels of urbanity and the supply of green.
We begin with the simplest of all calculations. What if the whole Dutch population turned to present-day rich residential tastes? Would the Netherlands be able to accommodate such a fit? The entire land area of the Netherlands amounts to 33,686 km2. Of this area, 5358 km2 is developed, 22,478 km2 has an agricultural use, and the remainder is comprised of non-agricultural nature. If the total Dutch population in 2100 were to have residential demands like the present-day rich, the total amount of land needed, parcels only, would be 27,700 km2. This area for parcels is similar to the area of all present-day developed land and agricultural land combined—no space would remain for the homes themselves, or for shops, or infrastructure. There is clearly insufficient space in the Netherlands for everyone to live like the present-day rich. We are aware that this analysis is extremely simple but it also has a subtle inconsistency related to what seems to be the core of present-day rich residential tastes: they tend to live as green and non-urban as possible within urban regions. But if most of the population were to move away from urban centers, these population concentrations would no longer remain. Let us now take a more modest approach: what if, by 2100, not the whole population but a fair share of it were to adopt the residential standards of the present-day rich? If, say, 25% of the total population had a parcel of land in size that is common to the rich and, importantly, lived within the local property markets where present-day rich live, what might we see then? We are able to construct forecasts for the demand for space for any share of the population, higher or lower, than 25%. The simple analysis here is linear, so if one wishes to know the outcome, for example, of a ‘50% forecast,’ we can achieve this by multiplying the results by 2.
Our approach to forecasting is as follows. As an experiment, we distribute 25% of all Dutch households (as per 2012) across local property markets in proportion to the distribution of rich households in single family properties. Next, we assume that in each local property market the redistributed households demand a parcel of the equivalent size owned by rich households. As a final step, the aggregate demand for parcel space within a local property market is compared with the supply of developable land at locations likely to be desirable to rich households—based on the criterion that locations must be close to an urban population core, to attractive nature, or to both (in both cases cut-off values are based on mean distances, plus one standard deviation, as observed for the sample of properties of the rich—and thus pertain to preferences of a majority of the observed rich). The resulting ratio is ‘1’ if the forecast indicates that, within the observed local property market, the area of developable land equals the demand for parcel space. If demand for parcel space is forecasted to be higher relative to the supply of developable land, the ratio is higher.
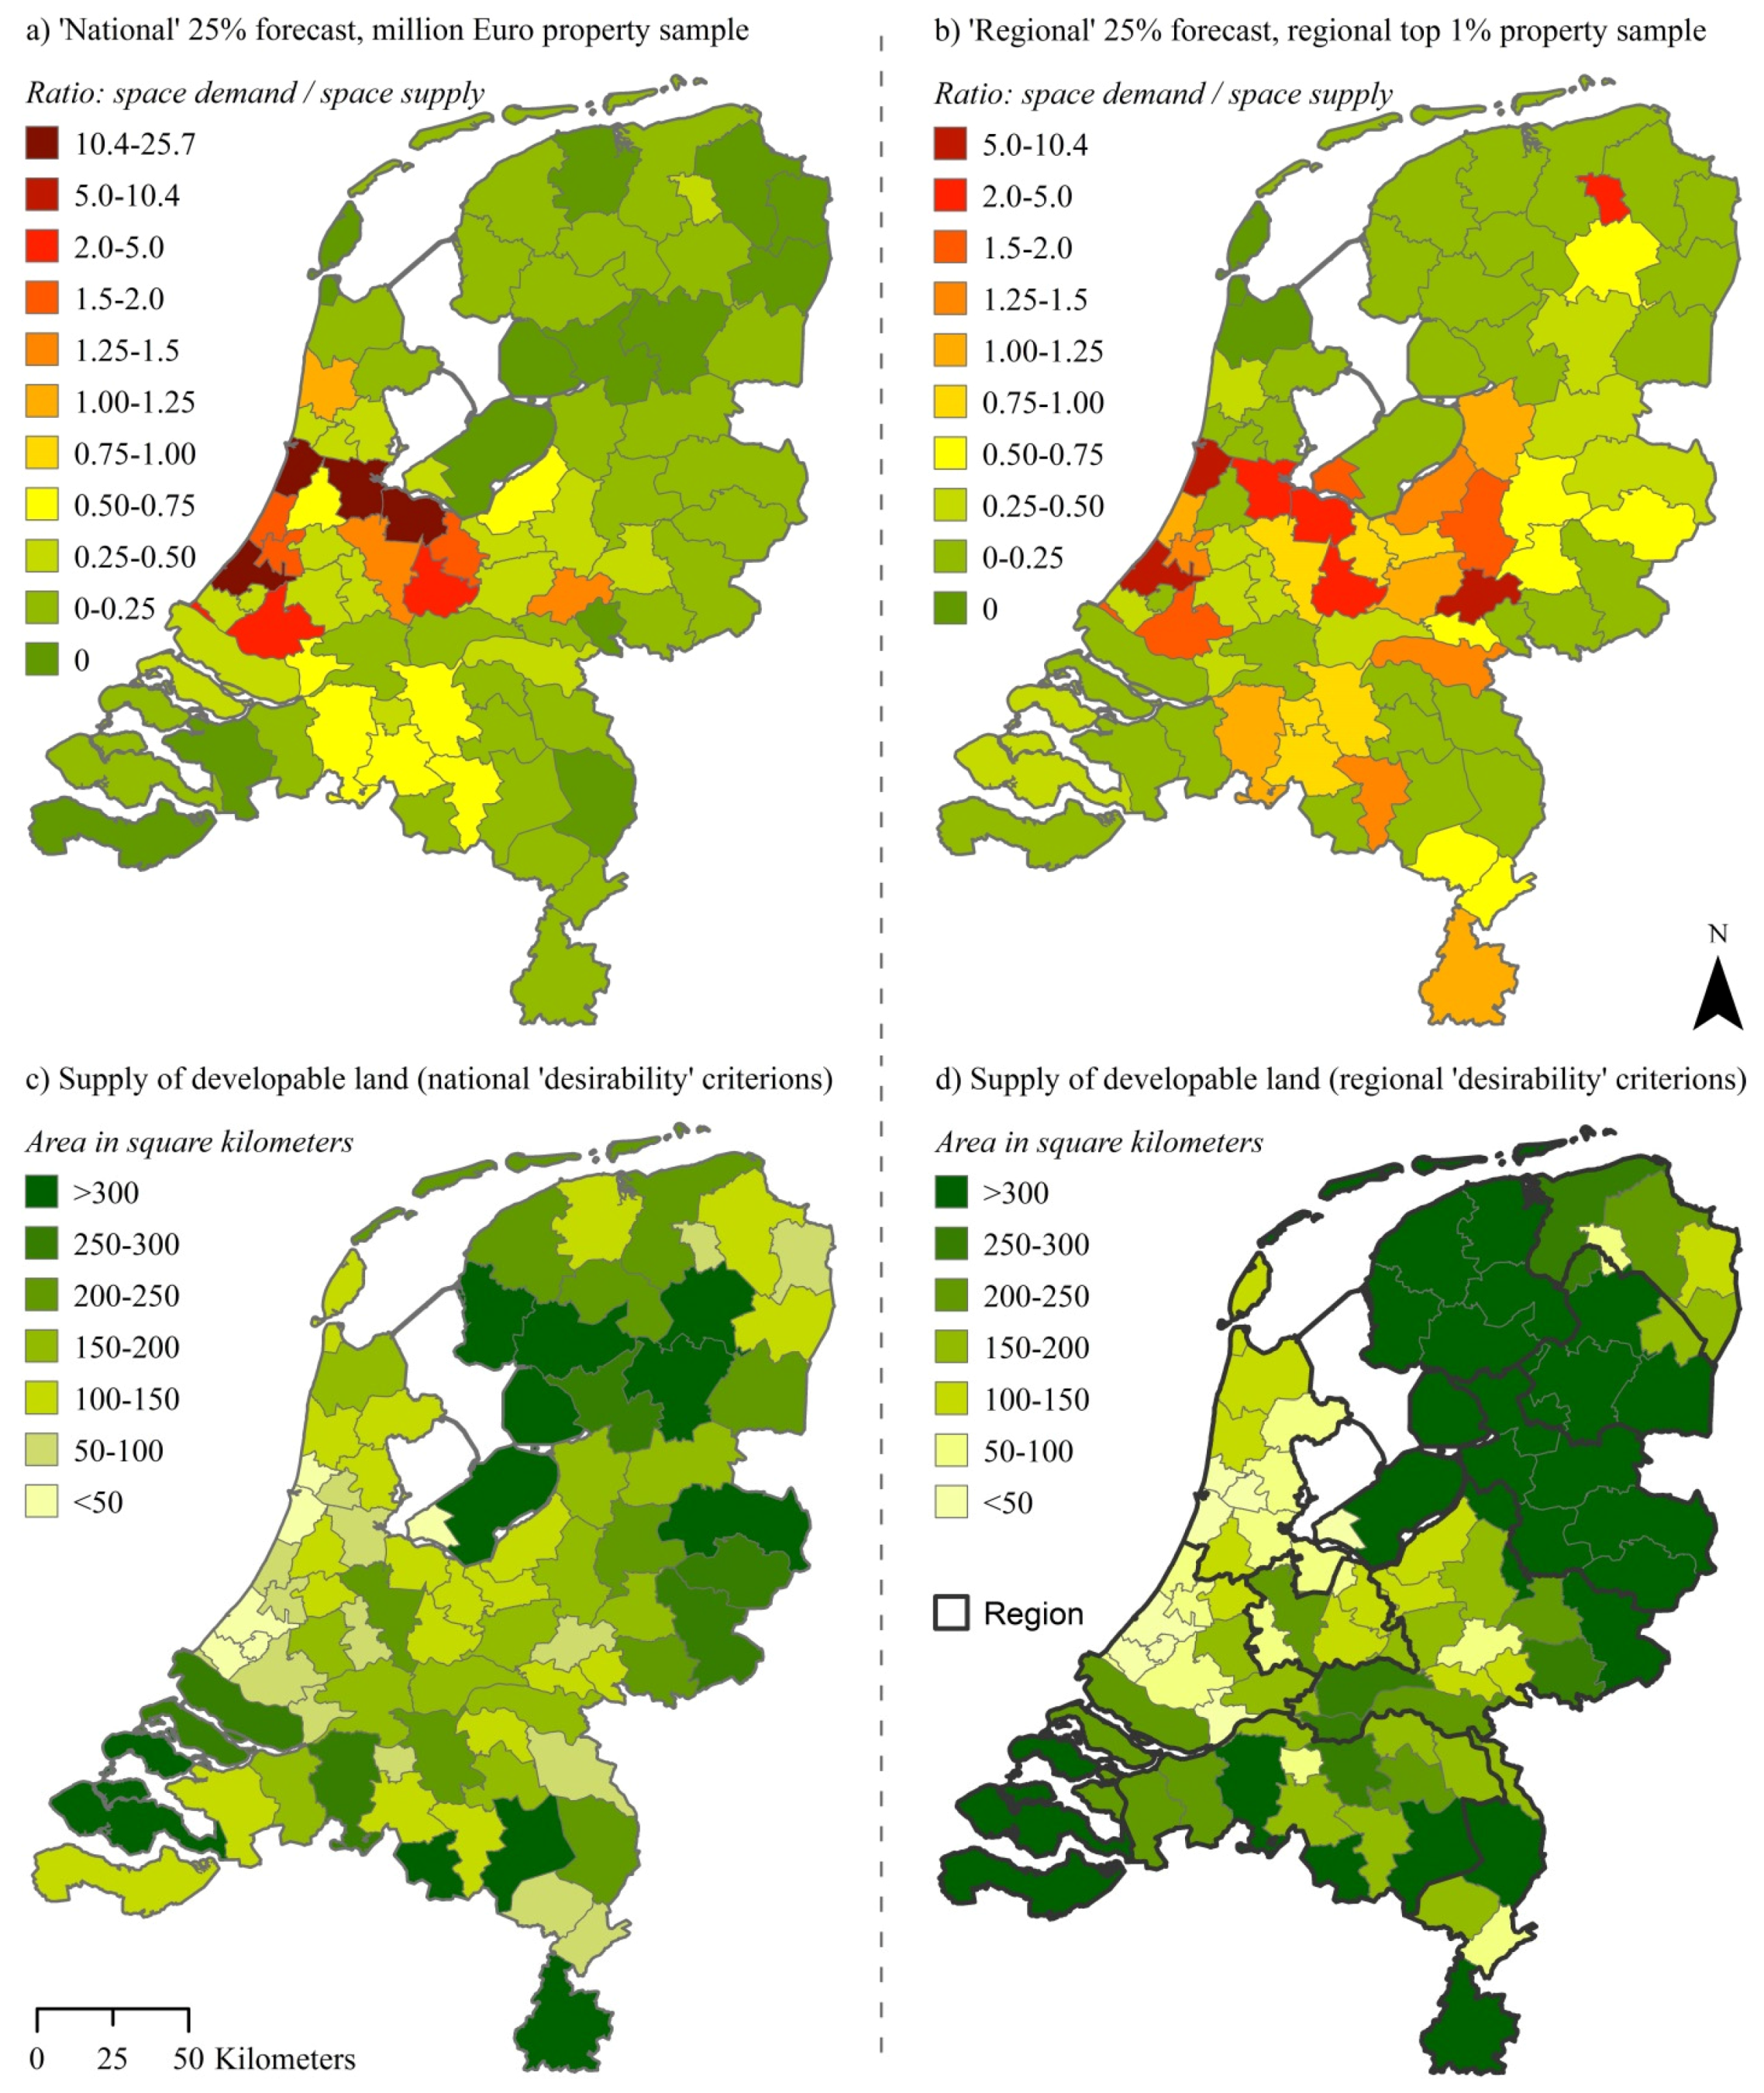
Using the above approach, two slightly different country-wide forecasts can be generated. The first forecast has a more national character (Figure 4a), and assumes that, as people become richer over time, they will move to the local property markets where the present-day rich live and then demand parcels equivalent in size to the average of the rich parcels. Hence, this forecast reflects that the highest priced properties in the Netherlands are found in or near highly urban population cores in the west of the Netherlands (Figure 1). The second forecast has a more regional character (Figure 4b). It assumes that as people become richer over time they are likely to choose more preferable residential locations in local property markets in the region where they live, rather than consider long distance migration, as assumed in the first forecast.
The difference in regional or national orientation is also reflected in the property samples and parameters used to generate both forecasts. The forecast with the national character, in Figure 4a, is based on the sample of million Euro properties—the properties sold at the highest prices in the Netherlands as a whole. The distribution of these properties across local property markets is followed if and when all Dutch households are redistributed. These households’ demands for parcel space is based on the national average of parcel size indicated by the data for million Euro properties (3944 m2 per household—see Table 1). Accordingly, the criterion used to define developable land at desirable locations (Figure 4c) is set at the national scale. The second forecast, in Figure 4b, is based on regional parameters and draws on the sample of properties with the 1% percent highest transaction prices in each NUTS II region (N = 12; Province). This regional stratification allows us to distribute Dutch households over local property markets from the NUTS II level downward. Here, parcel sizes and the criterion on the desirability of the locations of developable lands are differentiated by NUTS II region.
The results are depicted in the four maps across Figure 4 and a number of observations can be drawn. First, in both forecasts, several local property markets comprise a considerable amount of developable land at locations that are desirable to the rich due to being near an urban population core or to attractive nature (Figure 4c,d). However, many of these local property markets remain green as our 25% forecasts materialize (Figure 4a,b), since relatively few of the present-day rich households currently live in those markets. Thus, in these markets, future demand for parcel space is forecasted to be lower than the supply of developable land—even while this land may be in locations that appear to be desirable. The bottleneck here seems to be that the markets that remain green are too peripheral for the tastes of the rich. This offers little perspective for local property markets in the outer peripheries, which in the present-day are already associated with population decline [37].
Second, we can clearly see that in both 25% forecasts of Figure 4a,b, pressure on the land market is depicted to concentrate in central and relatively urban (c.f. Figure 1), property markets. Most distinctive about the pattern in the regionally sensitive forecast (Figure 4b), as compared to the more nationally determined pattern in Figure 4a, is that it shows a higher dispersion of the intensity of demand for space around the most urban cities in the west. Such a pattern may arise in future if conditions develop consistently with the assumptions of the ‘regional’ forecast. Even over the long-term, people may give little consideration to long distance migration due to an attachment to their home regions. We incorporate this in the ‘regional’ forecast by sorting households into local property markets popular among the rich into households’ current (NUTS II) regions of residence.
Third, both of the 25% forecasts (Figure 4a,b) indicate that in a large share of local property markets the forecasted demand for parcel space exceeds the supply of developable land at desirable locations by factors up to 25.7, see Figure 4a. The consequence of 25% of the population adopting the housing tastes of the current-day rich means that there is insufficient space to accommodate demand. The implication here is that unsatisfied demand would spillover to nearby markets which have surpluses of developable land. Moreover, this analysis accommodates the notion that the forecasted demand for space within local property markets, given their present-day quality, may deteriorate if more people start to live in these markets.
The forecasts presented here certainly do not reflect a likely pattern of parcel space consumption in the future. In local markets, (expectations of) dramatically higher demand for land lead to upward corrections in land prices, which in turn decrease the sizes of realized parcels. What is important here is that the forecasts suggest that, in the Netherlands, preferences for green living and the extent to which these are accommodated by the actual residential structure, may increasingly diverge over time.
3.4. Summary of Empirical Results
The value of this study rests in the magnitude of its findings in relation to land use: we found that the very rich live with more green surrounding their homes than the more general population does, and if these rich tastes become increasingly common, there is insufficient space for aspirations to materialize. In the main analysis, properties of the rich are defined as properties sold for at least 1 million Euros. Depending on local degree of urbanization, average parcel sizes of the observed million Euro properties are 2.1 to 7.0 times larger than the average parcel sizes of properties transacted for less than 1 million Euros. Results also suggest that higher wealth corresponds to a relatively high need for more green surrounding the home compared to the need for additional living space. In the case of green associated with parcel area, we make clear that the underlying motivations for buying specific properties are not observed in this study. We can conjecture that some rich households prefer properties with relatively large parcels, as these may decrease negative externalities from neighbors or signal prestige to others, in addition to enjoying the direct benefits bestowed by green surrounding the home. With regard to public green, on average, million Euro properties are closer to such places than lower priced properties, signaling that the rich appreciate living nearby public green. Public green spaces that are highly appreciated by the wider public seem to be particularly attractive to the rich. Furthermore, with regard to urban density, the data show that the rich prefer extremes: they tend to live in either very highly urban locations or in the least urban locations—if they are nearby cities.
Perhaps the single most important insight in this study stems from a basic forecasting analysis. We have inquired into what may happen if, over the long-term, say in 2100, 25% of the total Dutch population acquires parcels of a size common to the present-day rich under the assumption that general wealth increases over time. The hypothetical demand for parcel space was compared with areas of developable land and yielded the conclusion that if 25% of the total population begins to live like the present-day rich, the available space will be insufficient to accommodate future demand for green surrounding homes. The forecasted shortage of space varies considerably across local property markets. The intensity of forecasted demand in a specific local property market depends on the number of transactions of expensive properties observed in that market. Since expensive properties are few in number, the amount of sales in a particular market may vary across years. As our transaction data span across four years, it seems reasonable to assume that they give a fair representation of the size of the markets for expensive properties in each market. Our forecasts lead us to expect that preferences for green living and the extent to which these are accommodated by the actual residential structure will increasingly diverge over time. A study of the specific motives of the rich for buying homes surrounded by considerable amounts of green is beyond the scope of this paper. However, the results presented here clearly suggest that, as we grow richer over time, more green should be provided within the mostly urban living environments of the Netherlands.
4. Discussion
4.1. Should We ‘Compromise’ Urbanity and Green?
Ever since Howard wrote about the Garden City, the ideal combination of urbanity and green, i.e., the ‘marriage of town and country’ has been a hot topic of research and policy debate. The seminal paper by Breheny [25] analyses this debate in terms of centralists versus decentralists: is the future of the urban form an extremely centralized and agglomerated one or are decentralizing forces predominant? Breheny shows the still vivid potential and need for compromise: an urban form that overall is neither extremely centralized nor extremely dispersed, but rather one that combines both of these forms to harness their merits. We certainly enjoy the many amenities and benefits that urban agglomerations offer [4], but we also seek to combine an urban lifestyle with our longing for green (e.g., [25,26,27]). The present paper underlines the relevance of Breheny’s compromise position. If we interpret the present-day preferences of the Dutch rich as signposts, as indicators of our actual future residential wishes, then we are on the compromise track: we will yearn for green living, yes, but we will also desire to live in or near high-density cities. In fact, after more than 100 years, the marriage of town and country that Howard envisaged may still hold important inspirational value as we decide how green to build our cities.
4.2. Greener Designs of Urban Residential Areas
Our forecasts carried out here have illustrated that, if economic growth continues, not all citizens of the Netherlands will be able to live as spaciously as the present-day rich because the amount of available space is insufficient. Specifically, in several local property markets, especially in the most urban ones, green may in the future be underprovided compared to people’s demands for green as they grow richer over time. An open challenge to urban planning thus arises: can residential areas be designed to be highly green and at the same time accommodate preferences for high urbanity? We may be required to rethink conventions in urban planning such as, for example, the supply of private gardens in urban areas. To cite Ewing [38] (p. 109): “if you count people’s yards, there is abundant open space”. This seems inefficient, since “an acre of land used as a pleasure garden for the enjoyment of a single family can never rise above its initial productivity in that use,” as Hirsch [16] (p. 20) has remarked. Perhaps gardens should more often be substituted for public green in order to increase the leisure productivity of involved lands; such a notion seems reasonable if demand for land is high [14]. Public green may, however, not offer precisely those amenities that private green can offer. Even so, it seems worthwhile to study within an actual market whether a ‘Park City’ design, as a highly urban variation on the Garden City design, appeals to people. Furthermore, to arrive at a ‘compromise’ with high-density cities, would it be desirable to develop residential property in the middle of nature, in the hinterlands of these cities? Such questions matter, especially since in urban regions both the supply of space is likely to be limited and the demand for green living may increase over time, as this paper strongly suggests. We encourage further debate on this important topic.
4.3. Monitoring How and Where the Rich Live
Due to the longevity of residential real estate, the characteristics of the existing supply of homes inherently lags behind changes in residential preferences, if any, over time. Given that long-run changes in income is a powerful predictor of how we wish to live (c.f. [2]), why not monitor how and where the rich live, and why? Such monitoring could then also examine the determinants (other than green) that motivate where the rich decide to live, such as costs of commuting and the spatial distribution of historical and consumer amenities [6,39]. Such a study could provide insights to help urban planners account for residential preferences as the Dutch population grows richer over time that may be more robust. It is noteworthy that observable trends in how and where the rich live may differ between countries. Indeed, findings for the Netherlands may only be transferrable, for example, to the United States in a limited way; between the two countries the preferences of the rich are likely to differ (c.f. [30]). The restrictions imposed by institutional development regimes also differ between the Netherlands and the US. However, we would argue that the method itself, the analysis of the properties of the rich, can be applied more widely internationally. As an extension of the analysis in this paper, future research could evaluate whether the rich buy second homes in rural areas in order to compensate for highly urban primary residential locations, and vice versa.
Acknowledgements
The authors gratefully acknowledge the Dutch Association of Real Estate Agents (NVM).
Author Contributions
Michiel N. Daams and Frans J. Sijtsma conceived and designed the analysis; Michiel N. Daams analyzed the data; both authors contributed in writing the paper.
Conflicts of Interest
The authors declare no conflict of interest.
References
- Batty, M. When all the world’s a city. Environ. Plan. A 2011, 43, 765–772. [Google Scholar] [CrossRef]
- Clark, G. A Farewell to Alms: A Brief Economic History of the World; Princeton University Press: Princeton, NJ, USA, 2007. [Google Scholar]
- Bettencourt, L.; West, G. A unified theory of urban living. Nature 2010, 467, 912–913. [Google Scholar] [CrossRef] [PubMed]
- Glaeser, E.L.; Kolko, J.; Saiz, A. Consumer city. J. Econ. Geogr. 2001, 1, 27–50. [Google Scholar] [CrossRef]
- Anderson, S.T.; West, S.E. Open space, residential property values, and spatial context. Reg. Sci. Urban Econ. 2006, 36, 773–789. [Google Scholar] [CrossRef]
- Brueckner, J.K.; Thisse, J.F.; Zenou, Y. Why is central Paris rich and downtown Detroit poor? An amenity-based theory. Eur. Econ. Rev. 1999, 43, 91–107. [Google Scholar] [CrossRef]
- Zietz, J.; Zietz, E.N.; Sirmans, G.S. Determinants of house prices: A quantile regression approach. J. Real Estate Financ. Econ. 2008, 37, 317–333. [Google Scholar] [CrossRef]
- Horowitz, J.K. Preferences in the future. Environ. Resour. Econ. 2002, 21, 241–258. [Google Scholar] [CrossRef]
- Myers, D.; Gearin, E. Current preferences and future demand for denser residential environments. Hous. Policy Debate 2001, 12, 633–659. [Google Scholar] [CrossRef]
- Chen, Z.; Cho, S.H.; Poudyal, N.; Roberts, R.K. Forecasting housing prices under different market segmentation assumptions. Urban Stud. 2009, 46, 167–187. [Google Scholar] [CrossRef]
- James, P.; Tzoulas, K.; Adams, M.D.; Barber, A.; Box, J.; Breuste, J.; Thompson, C.W. Towards an integrated understanding of green space in the European built environment. Urban For. Urban Green. 2009, 8, 65–75. [Google Scholar] [CrossRef]
- Luiten van Zanden, J.; Van Leeuwen, B. Persistent but not consistent: The growth of national income in Holland 1347–1807. Explor. Econ. Hist. 2012, 49, 119–130. [Google Scholar] [CrossRef]
- Statistics Netherlands. National Accounts of the Netherlands 2011; Statistics Netherlands: The Hague/Heerlen, The Netherlands, 2012. [Google Scholar]
- Cheshire, P.; Sheppard, S. Land markets and land market regulation: Progress towards understanding. Reg. Sci. Urban Econ. 2004, 34, 619–637. [Google Scholar] [CrossRef]
- Rietveld, P.; Wagtendonk, A.J. The location of new residential areas and the preservation of open space: Experiences in the Netherlands. Environ. Plan. A 2004, 36, 2047–2064. [Google Scholar] [CrossRef]
- Hirsch, F. The Social Limits to Growth; Harvard University Press: Cambridge, MA, USA, 1976. [Google Scholar]
- Easterlin, R.A. Income and happiness: Towards a unified theory. Econ. J. 2001, 465–484. [Google Scholar] [CrossRef]
- Somerville, P.; Smith, R.; McElwee, G. The dark side of the rural idyll: Stories of illegal/illicit economic activity in the UK countryside. J. Rural Stud. 2015, 39, 219–228. [Google Scholar] [CrossRef] [Green Version]
- Green, D.R.; Owens, A. Geographies of wealth: Real estate and personal property ownership in England and Wales, 1870–1902. Econ. Hist. Rev. 2013, 66, 848–872. [Google Scholar] [CrossRef]
- Pow, C.P. Living it up: Super-rich enclave and transnational elite urbanism in Singapore. Geoforum 2011, 42, 382–393. [Google Scholar] [CrossRef]
- Woods, M. The Elite Countryside: Shifting Rural Geographies of the Transnational Super-Rich. In Geographies of the Super-Rich; Hay, I., Ed.; Edward Elgar: Abingdon, UK, 2013; pp. 123–136. [Google Scholar] [CrossRef]
- Daams, M.N.; Sijtsma, F.J.; Van der Vlist, A.J. The effect of natural space on property prices: Accounting for perceived attractiveness. Land Econ. 2016, 92, 389–410. [Google Scholar] [CrossRef]
- Palmquist, R.B. Property value models. In Handbook of Environmental Economics; Göran-Mähler, K., Vincent, J.R., Eds.; North Holland: Amsterdam, The Netherlands, 2005; Volume 2, pp. 763–819. [Google Scholar]
- Ferreira, S.; Moro, M. Income and preferences for the environment: Evidence from subjective well-being data. Environ. Plan. A 2013, 45, 650–667. [Google Scholar] [CrossRef]
- Breheny, M. Centrists, decentrists and compromisers: Views on the future of urban form. In The compact City: A sustainable form? Jenks, M., Burton, E., Williams, K., Eds.; E. and F.N. Spon.: London, UK, 1996; pp. 13–35. [Google Scholar] [CrossRef]
- Kühn, M. Greenbelt and green heart: Separating and integrating landscapes in European city regions. Landsc. Urban Plan. 2003, 64, 19–27. [Google Scholar] [CrossRef]
- Matsuoka, R.H.; Kaplan, R. People needs in the urban landscape: Analysis of landscape and urban planning contributions. Landsc. Urban Plan. 2008, 84, 7–19. [Google Scholar] [CrossRef]
- Hay, I.; Muller, S. That tiny, stratospheric apex that owns most of the world: Exploring geographies of the super-rich. Geogr. Res. 2012, 50, 75–88. [Google Scholar] [CrossRef]
- Beaverstock, J.V.; Hubbard, P.; Short, J.R. Getting away with it? Exposing the geographies of the super-rich. Geoforum 2004, 35, 401–407. [Google Scholar] [CrossRef]
- Brueckner, J.K.; Rosenthal, S.S. Gentrification and neighborhood housing cycles: Will America’s future downtowns be rich? Rev. Econ. Stat. 2009, 91, 725–743. [Google Scholar] [CrossRef]
- Kahneman, D.; Snell, J. Predicting a changing taste: Do people know what they will like? J. Behav. Decis. Mak. 1992, 5, 187–200. [Google Scholar] [CrossRef]
- Venkatachalam, L. The contingent valuation method: A review. Environ. Impact Assess. Rev. 2004, 24, 89–124. [Google Scholar] [CrossRef]
- Graves, P.E. Migration with a composite amenity: The role of rents. J. Reg. Sci. 1983, 23, 541–546. [Google Scholar] [CrossRef] [PubMed] [Green Version]
- De Vries, S.; Buijs, A.E.; Langers, F.; Farjon, H.; Van Hinsberg, A.; Sijtsma, F.J. Measuring the attractiveness of Dutch landscapes: Identifying national hotspots of highly valued places using Google Maps. Appl. Geogr. 2013, 45, 220–229. [Google Scholar] [CrossRef]
- Bijker, R.A.; Sijtsma, F.J. A portfolio of natural places: Using a participatory GIS tool to compare the appreciation and use of green spaces inside and outside urban areas by urban residents. Landsc. Urban Plan. 2017, 158, 155–165. [Google Scholar] [CrossRef]
- Davis, N.; Daams, M.N.; Sijtsma, F.J.; Van Hinsberg, A. How deep is your love-of nature? A psychological and spatial analysis of the depth of feelings towards Dutch nature areas. Appl. Geogr. 2016, 77, 38–48. [Google Scholar] [CrossRef]
- Haartsen, T.; Venhorst, V. Planning for decline: Anticipating on population decline in the Netherlands. J. Econ. Soc. Geogr. 2010, 101, 218–227. [Google Scholar] [CrossRef]
- Ewing, R. Is Los Angeles-style sprawl desirable? J. Am. Plan. Assoc. 1997, 63, 107–126. [Google Scholar] [CrossRef]
- Alonso, W. A theory of the urban land market. Pap. Reg. Sci. 1960, 6, 149–157. [Google Scholar] [CrossRef]
Figure 1.
Urban density and million Euro transactions of single family properties (N = 2303) and apartments (N = 201), per local property market; (a) How urban; (b) €1,000,000 single family property; (c) €1,000,000 apartments.
Figure 1.
Urban density and million Euro transactions of single family properties (N = 2303) and apartments (N = 201), per local property market; (a) How urban; (b) €1,000,000 single family property; (c) €1,000,000 apartments.
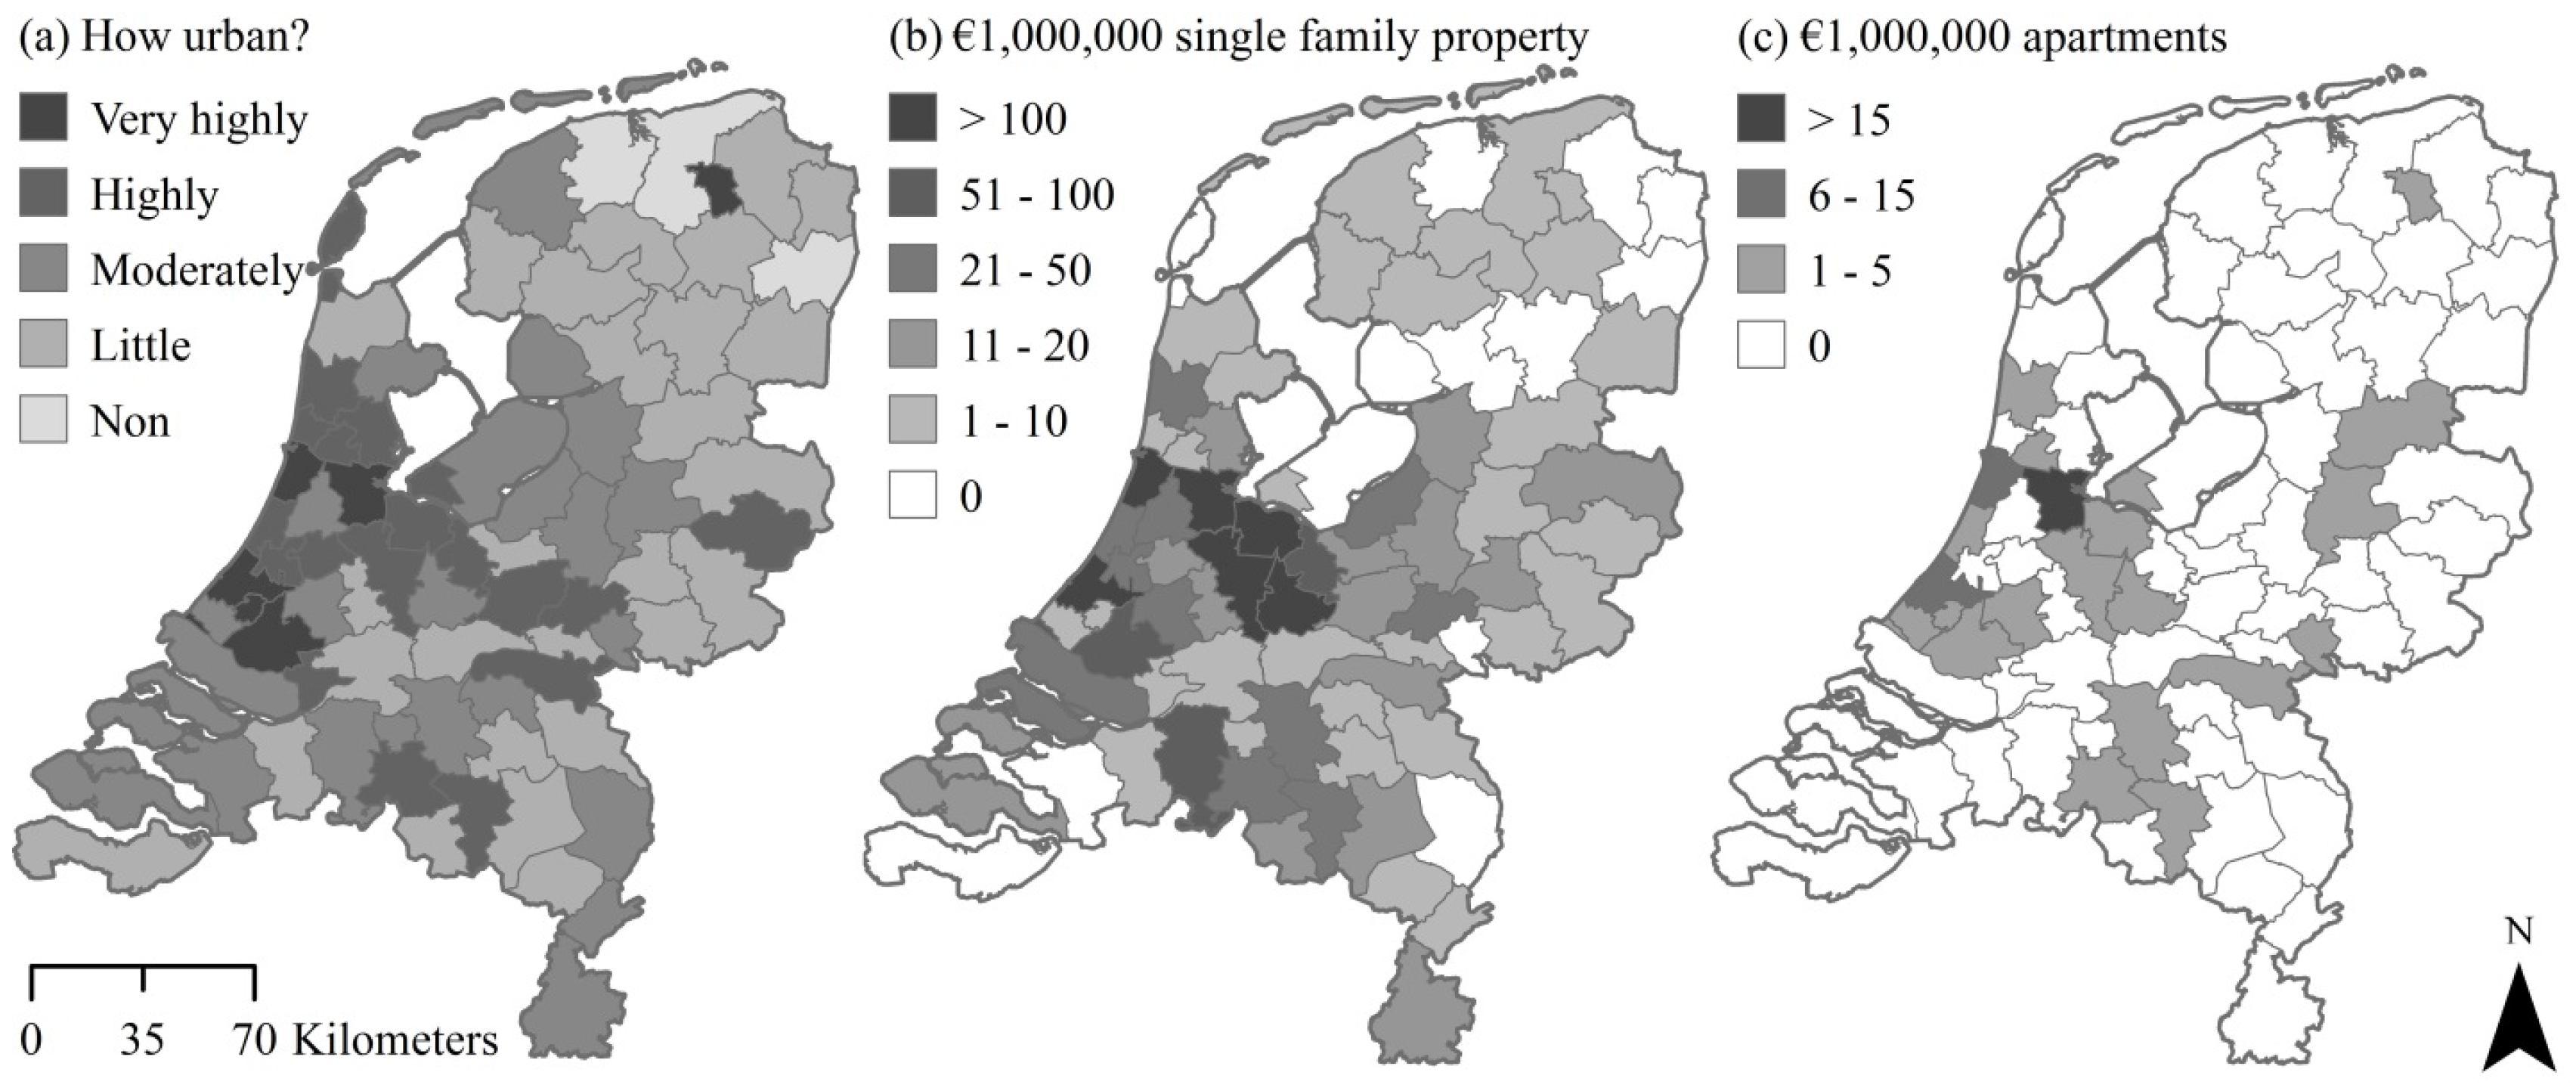
Figure 2.
Index of mean floor area and mean parcel size by property price segment (the index-base is set at 100 in regard to the segment of properties with prices below €100,000).
Figure 2.
Index of mean floor area and mean parcel size by property price segment (the index-base is set at 100 in regard to the segment of properties with prices below €100,000).
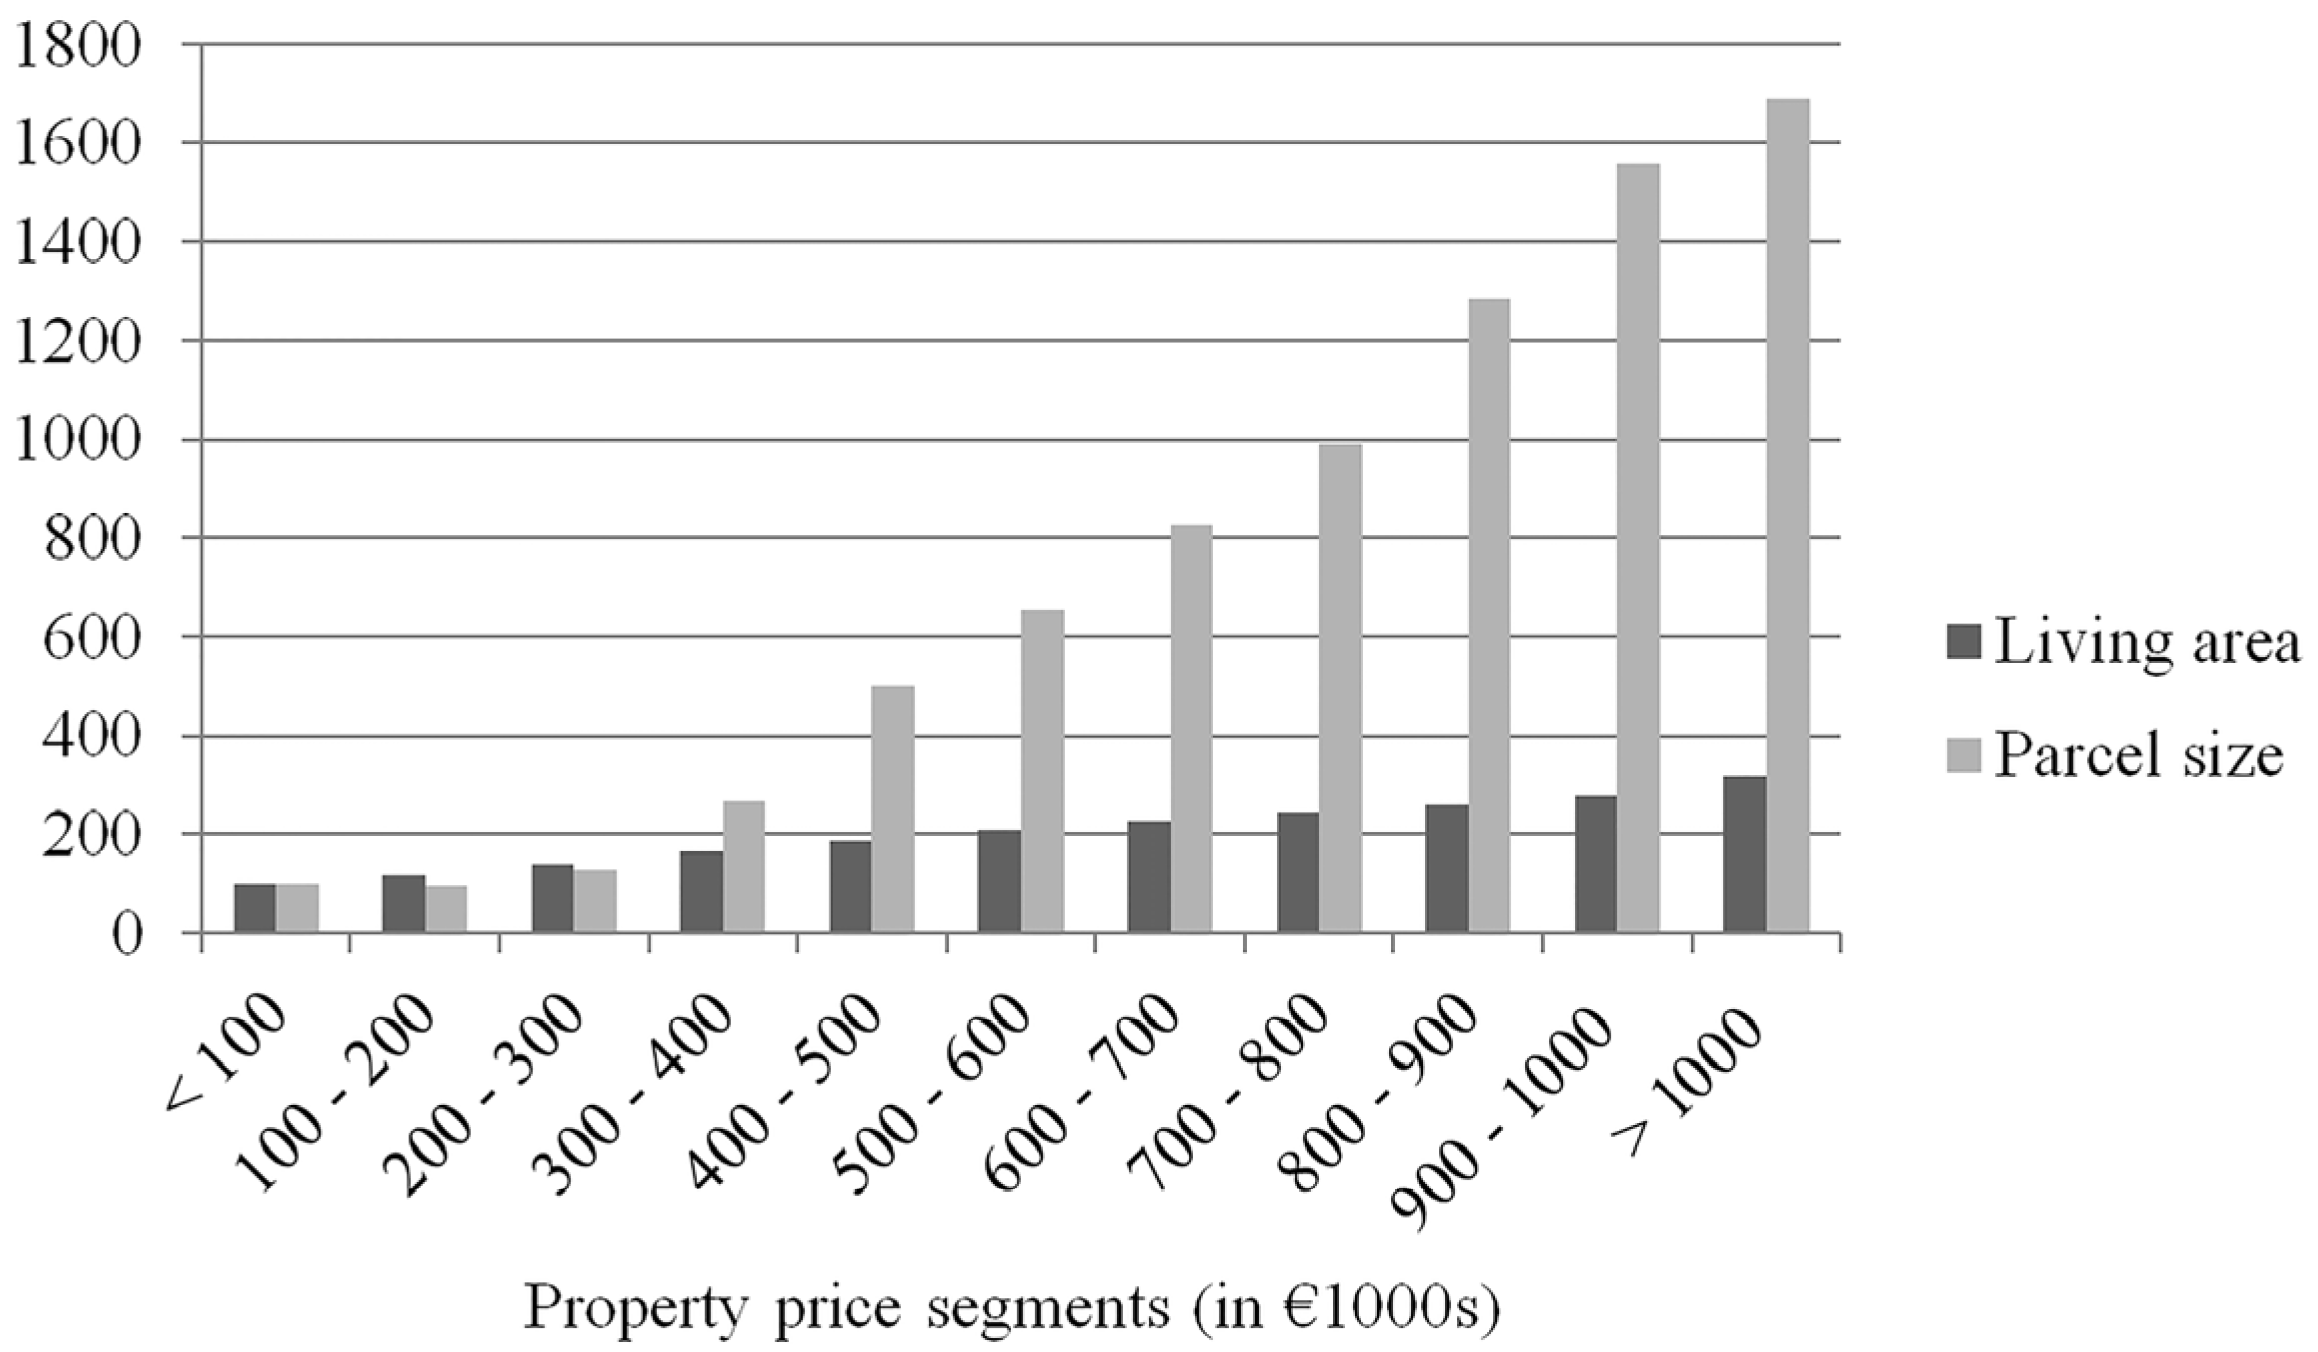
Figure 3.
Sample distribution by distance to nearest attractive nature, per 0.5 km (km) interval. The 0.25, 0.50, and 0.75 quartiles are within the sample of million Euro properties, 0.39 km, 1.17 km, and 2.29 km, respectively, and in the same order, 1.79 km, 3.71 km, and 6.69 km in the case of the sample of lower priced properties (transaction prices below 1 million Euros).
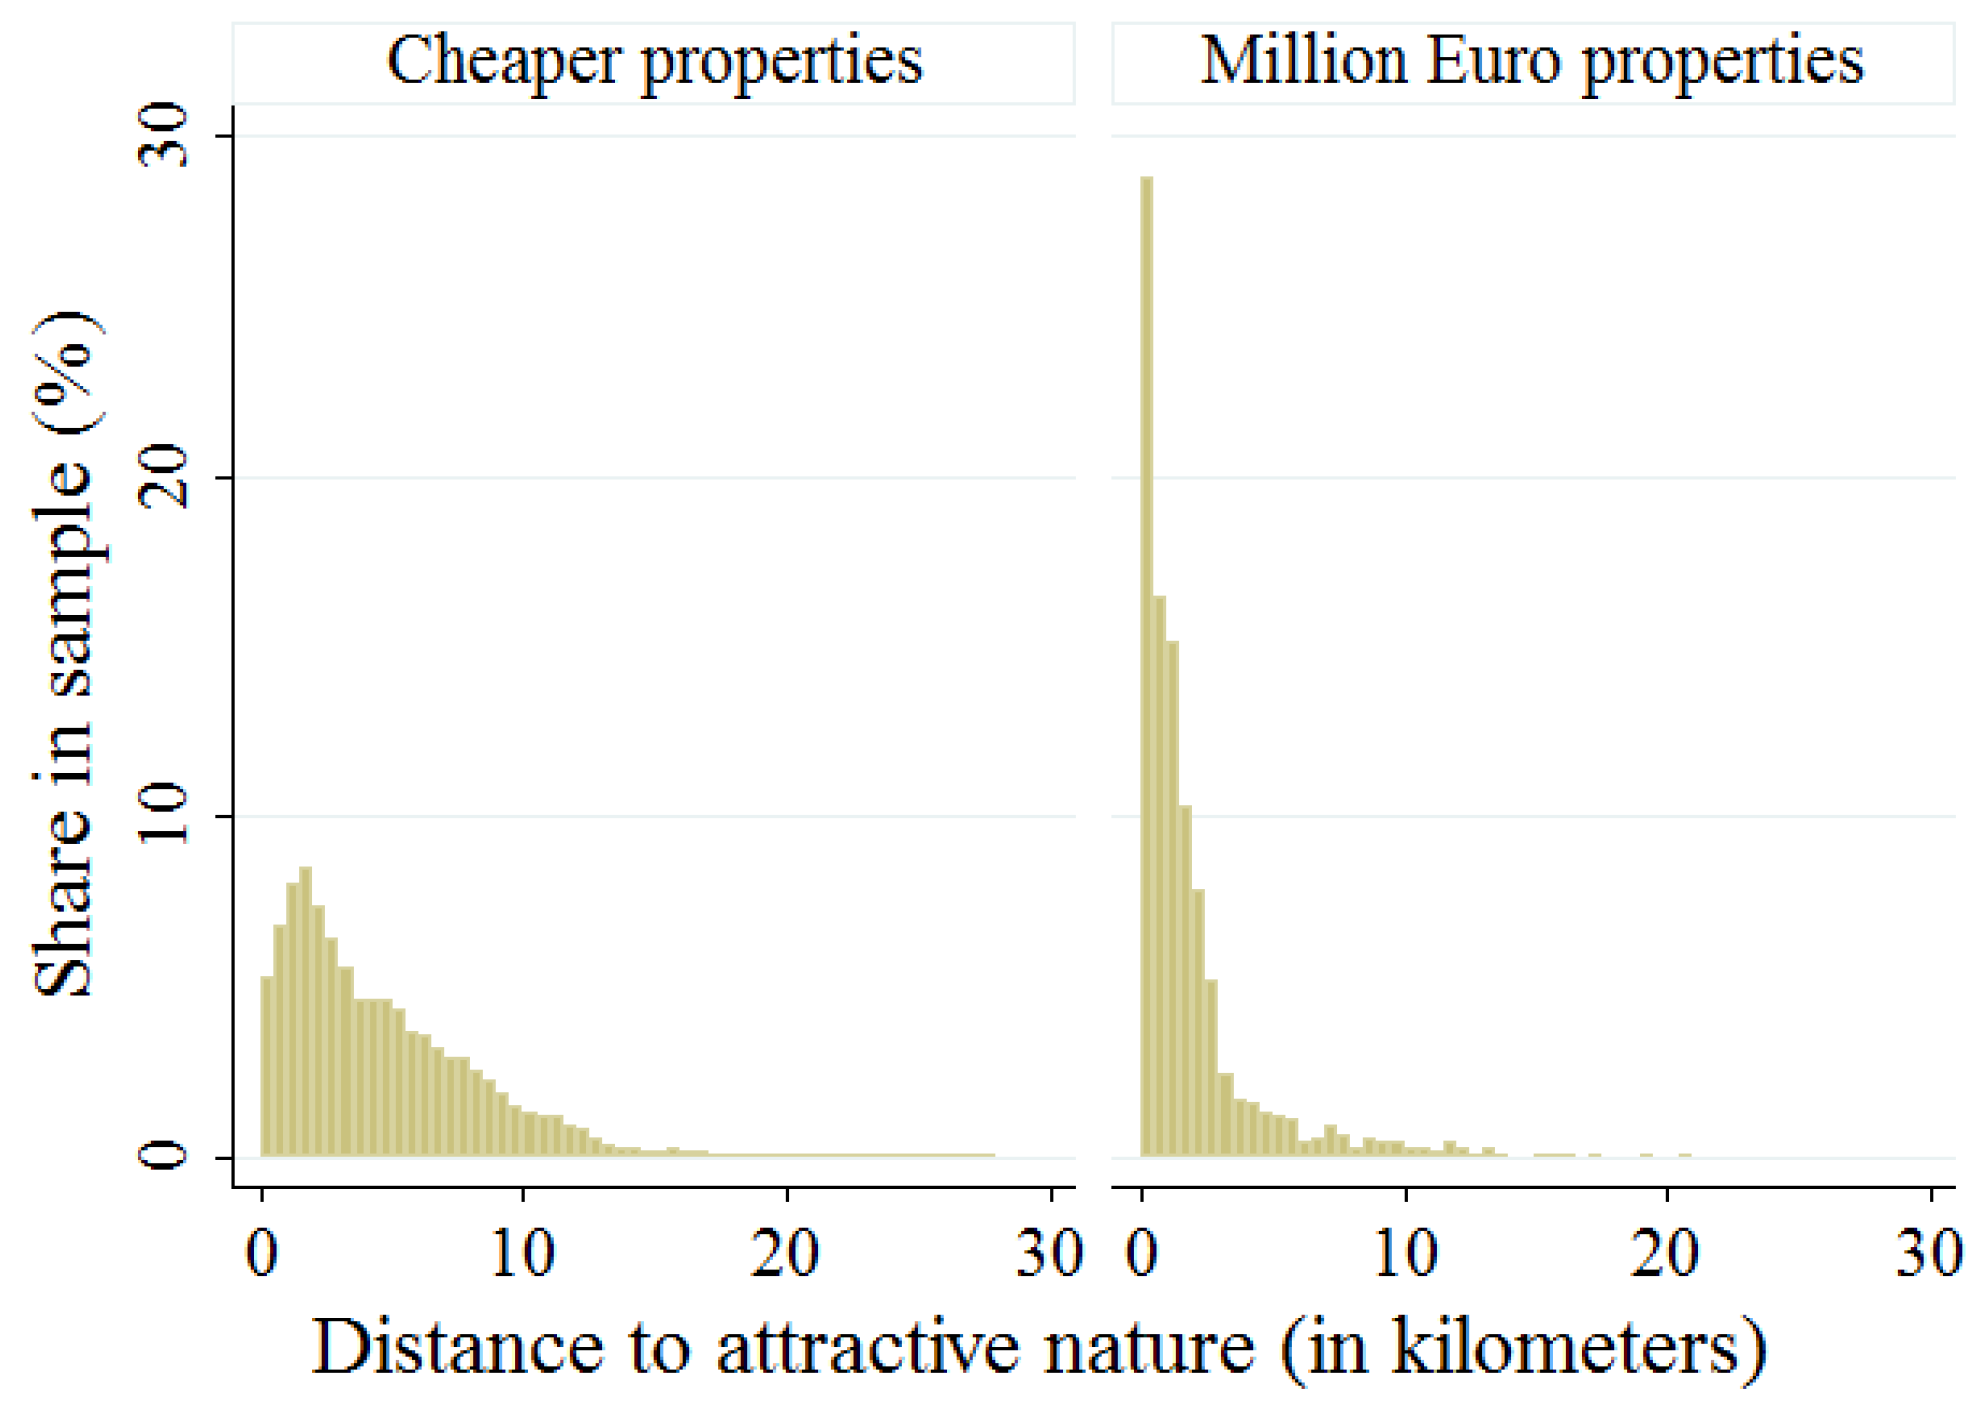
Figure 4.
Two forecasts (a,b) on how future demand for parcel space and the supply of agricultural land at desirable locations in (c,d) relate. The premise is that 25% of the total Dutch population would start to live like the present-day rich, and do so while being distributed across local property markets in proportion to the present-day rich.


Table 1.
Property characteristics. i
| Characteristic | Million Euro Properties (N = 2303) | Lower-Priced Properties (N = 254,871) | ||
|---|---|---|---|---|
| Mean | SD | Mean | SD | |
| Price (€) | 1,425,815 | 803,741 | 269,341 | 137,644 |
| Living area (m2) | 287 | 83 | 130 | 41 |
| Parcel (m2) | 3944 | 14,293 | 487 | 2156 |
Note: i The current sample is national in scope, thus no price-based regional stratification is shown.
Table 2.
Distribution of properties across degrees of urbanization. i
| Local property market level | Property Location within 500 × 500 m Grid Cell | |||||||||||||
| (a) Distribution of 1 + million Euros homes | Ratio of (a) and the distribution of properties with selling prices <1 MM € | |||||||||||||
| (1) | (2) | (3) | (4) | (5) | Total | (1) | (2) | (3) | (4) | (5) | Total | |||
| Very highly urban | (1) | 0.42 | 0.21 | 0.08 | 0.13 | 0.16 | 0.36 | 1.13 | 0.63 | 0.46 | 1.37 | 5.14 | 2.85 | |
| Highly urban | (2) | 0.10 | 0.15 | 0.13 | 0.27 | 0.35 | 0.37 | 0.51 | 0.43 | 0.61 | 1.64 | 5.01 | 1.13 | |
| Moderately urban | (3) | 0.03 | 0.09 | 0.10 | 0.30 | 0.48 | 0.21 | 0.39 | 0.34 | 0.41 | 1.26 | 2.74 | 0.73 | |
| Little urban | (4) | - | 0.03 | 0.06 | 0.18 | 0.73 | 0.05 | - | 0.27 | 0.30 | 0.56 | 2.09 | 0.23 | |
| Non-urban | (5) | - | - | - | - | - | 0.00 | - | - | - | - | - | 0.02 | |
| Total | 0.19 | 0.15 | 0.10 | 0.22 | 0.33 | 1.00 | 1.44 | 0.58 | 0.47 | 1.02 | 1.92 | 1.00 | ||
Note: i Ratios are calculated by dividing the shares of million Euro homes by the shares of non-million Euro homes. The number assigned to each property level density class corresponds to the labels for density classes at local property market level, indicating the same degree of urbanization but at another spatial scale. The ‘non-urban’ local property markets includes only a single 1 million Euro property; thus, for non-urban markets only ‘totals’ are shown.
Table 3.
Property characteristics by local degree of urbanization. i
| Characteristic | Very Highly Urban | Highly Urban | Moderately Urban | Little Urban | Non-Urban | |||||
|---|---|---|---|---|---|---|---|---|---|---|
| Mean | SD | Mean | SD | Mean | SD | Mean | SD | Mean | SD | |
| Million Euro homes | ||||||||||
| Price (€) | 1,478,833 | 1,027,750 | 1,357,455 | 722,239 | 1,392,331 | 607,333 | 1,390,937 | 589,546 | 1,459,801 | 862,762 |
| Living area (m2) | 284 | 74 | 283 | 75 | 285 | 83 | 293 | 86 | 288 | 89 |
| Parcel (m2) | 349 | 429 | 969 | 828 | 1558 | 2750 | 2465 | 9275 | 9164 | 22,740 |
| Distance to nearest public green (m) | 111 | 107 | 124 | 110 | 113 | 108 | 103 | 107 | 42 | 66 |
| Non-million Euro homes | ||||||||||
| Price (€) | 280,998 | 150,268 | 256,647 | 126,333 | 255,208 | 122,111 | 271,537 | 133,404 | 294,433 | 160,915 |
| Living area (m2) | 124 | 45 | 125 | 34 | 128 | 35 | 132 | 39 | 140 | 52 |
| Parcel (m2) | 170 | 1538 | 216 | 844 | 257 | 837 | 353 | 837 | 1604 | 4560 |
| Distance to nearest public green (m) | 197 | 157 | 161 | 128 | 142 | 107 | 120 | 91 | 61 | 64 |
Note: i The overall mean distance to the nearest green is 88 m for million Euro homes, and 136 m for lower priced homes.
Table 4.
Sample means for alternative samples.
| Characteristic | Main Analysis Sample | Alternative Specifications of Properties of the ‘Rich’ | ||||
|---|---|---|---|---|---|---|
| Million Euro properties | Regional top 1% | New construction | Millionaires | |||
| Single family | Apartments | Single family | Apartments | Single family | Single family | |
| Price (€) | 1,425,815 | 1,415,068 | 1,256,413 | 771,560 | 1,750,184 | 715,622 b |
| Living area (m2) | 287 | 171 | 288 | 165 | 263 | 227 |
| Parcel size (m2) | 3944 | - | 5882 | - | 5417 | 1644 |
| Dist. to green (m) | 88 | 115 | 74 | 119 | 101 | - |
| Dist. to attractive green (m) a | 1912 | 749 | 2645 | 1646 | 1770 | - |
| Address density (within 1 km) | 1758 | 6898 | 1183 | 4163 | 1383 | - |
| Observations | 2303 | 201 | 2594 | 1140 | 84 | 277 |
Notes: a mean distance to attractive green is not reported in the main analysis. For samples of single family properties and apartments considered in the main analysis, the data show mean distances of 1912 m and 749 m, respectively. b Transaction prices are unknown for this sample because the WoON 2012 survey data include assessed property values only, which we have used to calculate this average.
© 2017 by the authors. Licensee MDPI, Basel, Switzerland. This article is an open access article distributed under the terms and conditions of the Creative Commons Attribution (CC BY) license (http://creativecommons.org/licenses/by/4.0/).
Share and Cite
MDPI and ACS Style
Daams, M.N.; Sijtsma, F.J. How Green Do We Want to Live in 2100? Lessons Learned from the Homes of the Present-Day Rich. Buildings 2017, 7, 97. https://doi.org/10.3390/buildings7040097
AMA Style
Daams MN, Sijtsma FJ. How Green Do We Want to Live in 2100? Lessons Learned from the Homes of the Present-Day Rich. Buildings. 2017; 7(4):97. https://doi.org/10.3390/buildings7040097
Chicago/Turabian StyleDaams, Michiel N., and Frans J. Sijtsma. 2017. "How Green Do We Want to Live in 2100? Lessons Learned from the Homes of the Present-Day Rich" Buildings 7, no. 4: 97. https://doi.org/10.3390/buildings7040097
Note that from the first issue of 2016, this journal uses article numbers instead of page numbers. See further details here.