1. Introduction
Over the last few decades, media, lawmakers and scientific researchers have paid great attention to green roofs. There is extensive bibliographic and scientific literature on this subject emphasizing the different positive purposes it may serve. These include, the reduction of annual energy consumptions in buildings related to both summer cooling [
1,
2,
3,
4] and winter heating [
2,
4], the contribution to the reduction of both greenhouse gas emissions [
5] and urban canyon temperatures [
4,
6,
7,
8], the management of atmospheric precipitation [
9] and urban runoff problems [
10], noise absorption [
11,
12], support of biodiversity, and the creation of new natural habitats [
13,
14].
Nevertheless, most of the analyses found in the current literature focus on green roof systems in their entirety, both in the case of new buildings [
15] and of building renovations [
16]. Evaluations are primarily concerned with thermal energy performance and the related positive effects in different ways; in absolute terms, such as the study of single technological solutions installed on specific and experimental sites [
15], or by comparing different solutions [
2,
3,
17]. The methodological approaches can be very different, from dynamic energy simulations [
17,
18,
19], to the monitoring of specific experimental sites—in this case, monitored data can be used for model validation [
20], or for studying variables related to energy and environmental indoor and outdoor topics [
21,
22]—to laboratory tests [
23,
24,
25,
26].
Recently, several studies have focused on the energy and environmental effects of green roofs by investigating single key elements, such as the vegetative layer [
24,
27] and growing media [
27].
As far as growing media are concerned, their composition differs from naturally occurring soils [
28], they are not homogeneous materials and the water content considerably influences the behavior of the medium [
23].
Therefore, the analysis of the thermal performance of growing media, which is also reported in subsequent recent studies, was carried out by adapting methods and regulations in force, but relating to testing naturally occurring soils.
The most important international studies concern thermal measurements on growing media carried out using probe systems [
23,
29,
30,
31] and the hot wire method [
32]—these are generally applied to naturally occurring soils according to American Society for Testing and Materials (ASTM) standards [
33,
34]. In these cases, experimental devices such as the cold plate apparatus [
25,
26] or the low speed wind tunnel [
29] were used instead for the analysis of green roof stratigraphy (comprehensive of the vegetative layer).
Those studies underline how, at national and international level, a common, standardized laboratory procedure to evaluate the thermal properties of growing media is missing. Consequently, an instrument that helps designers with agronomic and hydraulic assessments, and also thermal evaluations, is not yet available.
The present article concerns the laboratory results achieved under the first Framework Agreement between the National Research Council of Italy (CNR) and the Lombardy Region (2008–2013). During the agreement period, the Construction Technologies Institute (ITC-CNR), located in San Giuliano Milanese (Milan), has carried out an experimental campaign based on laboratory tests. Currently in progress, these tests focus on the definition of a laboratory procedure for the evaluation of the thermal resistance of different growing media for green roofs as a function of thickness, compaction and moisture level.
The research objective is to specify thermal performances curves to support the decision-making and design process for defining the thermal resistance of the entire green roof as a function of different climate conditions.
The experimental campaign described here represents the first step of the ongoing laboratory research activity.
2. Method
The laboratory activity proposed and carried out by ITC-CNR immediately attracted the interest and the cooperation of some major Italian producers of growing media and green roofs. It is based on the following three and complementary phases.
The first phase (
Section 2, Method), the preparatory phase, is based on:
analysis of existing regulations and standards concerning growing media
definition of the standard references for the laboratory measurement of the thermal conductivity and necessary procedural adjustments
definition of the experimental test campaign
choice of the laboratory devices for the execution of thermal tests (sample dimension and shape, containment systems, sample compaction, etc.).
The second phase (
Section 3, Results) is related to the launch and the conduct of the experimental laboratory campaign including; thermal conductivity measurement of growing media in different configurations (thickness and moisture levels), calculation of the thermal resistance as a function of thickness, and definition of the thermal performance curves.
The third and final phase, still ongoing, is based on the definition/validation of a preliminary procedure to test and to calculate the thermal conductivity of growing media.
2.1. Current Legislation in Force for Growing Media on Green Roofs
Growing media are defined by Orfeo and Notaristefano as “
a different material from the natural soils, composed of one or more organic and inorganic components, eventually corrective, fertilizer and other additive added, dedicated to the support of the vegetative layer” [
35]. The growing media performance depends on their composition, chemical and physical properties and on their end use. Hence, it has become essential to associate each substrate with a specific label containing the main information about the product: main components, pH, mean value of specific electrical conductivity, dry bulk density, total pore space, and commercial volume [
36]. In Italy, the label must comply with the provisions of Legislative Decree D.Lgs. 75/2010 [
37]. Crippa [
36] emphasizes that different methods are used across Europe to determine these properties, which influence the numerical value and the comparability of the outputs. For this reason, the international trend is towards compliance with the European standard (EN) method developed by CEN TC223 “Soil improvers and growing media”. Many EN methods are adopted nationally (UNI EN); they are aimed at determining every feature [
38] and refer to growing media in general. The only Italian regulation about green roofs is standard UNI 11235:2015 [
39], concerning growing media, amended and chemically corrected in order to be used as green roofs. The regulation specifies that the green roof has to respect certain requirements and the growing media must be designed for the purpose of: agronomy capacity, control of the drainage capacity and water permeability, aeration control and water retention. The agronomy capacity involves a series of verifications, some of which are of particular interest for this study, namely: particle size distribution (UNI EN 15428:2008 [
40]), degree of volume reduction by compression of the culture layer (DIN 18035-4:1991-2007 [
41]), dry bulk density and potential saturated weight (calculated) (UNI EN 13041:2012 [
42]).
Standards UNI EN 13041:2012 [
42] and UNI EN 13040:2008 [
43]are reference regulations for the preparation of samples for conductivity tests, as pointed out on the website of AIPSA (Italian Association of Growing media and soil improvers’ producers) [
44] and in UNI 11235 [
39]. In the literature, Sailor et al. [
31] measure the thermal conductivity and specific heat with the Dual Needle Probe System, adapting the IEE 442-1981 [
45] and ASTM D5334 [
46] methods. IEE specifies that “
test soils that have been re-compacted in the laboratory to a density that corresponds to the maximum density that can be achieved in the field”. IEE also underlines that ANSI/ASTM D 698-78 (standard Proctor test) [
47], ANSI/ASTM D 1557-78 (Modified Proctor Test) [
48] or ANSI/ASTM D 2049-69 [
49] (now replaced by ASTM D4253 “
Standard Test Methods for Maximum Index Density and Unit Weight of Soils Using a Vibratory Table” and by ASTM-D 4254 “
Standard Test Methods for Minimum Index Density and Unit Weight of Soils and Calculation of Relative Density”), “
should be followed to determine the moisture content at which the maximum density can be obtained”. Moisture content and dry unit weight are associated in a compaction curve. However, these requirements refer to naturally occurring soils (e.g., road surfaces, dams, foundations), which are different from growing media. In Bristow et al. [
50] and Campbell et al. [
30] the dual-probe heat-pulse technique was used to make measurements of soil thermal properties. Abu-Hamdeh et al. [
32] used the hot-wire method.
2.2. Thermal Conductivity Measurements: Standard References and Necessary Procedural Adjustments
Thermal Conductivity (λ) is a measure of the ability of a substance to conduct heat. It represents the amount of heat per unit time per unit area that can be conducted through a plate of unit thickness of a given material, the faces of the plate differing by one unit of temperature:
where:
| Φ = heat flow rate | (W) |
| DT = temperature difference (usually T1 − T2) | (K) |
| Ds = average thickness of a specimen | (m) |
Instead, thermal resistance of a material (R) is the temperature difference across a substance when a unit of heat energy flows through it in unit time. It is expressed in terms of a ratio between the material thickness (S) and the correspondent thermal conductivity (1).
The thermal resistance of a multi-layer material corresponds to the sum of the thermal resistances of the single layers. The thermal conductivity of a homogeneous material can be experimentally quantified through laboratory measurements, following different methodological approaches.
The physical criterion on which the experimental measures are based is a sample is placed in contact with two thermostated plates, the first cold, the latter hot. The hot plate and the cold plate generate a steady state temperature difference between the two faces of the sample and a consequent heat flux from the hot face to the cold one.
This methodological approach is described in various UNI EN ISO standards, as a function of the main characteristics of the materials and samples. The standards describe two main different methodologies of measurement. The first one measures the thermal flux from the hot plate to the cold one (the heat flow meter method), on the contrary, the latter measures the power supplied to the hot plate to maintain a constant temperature (the guarded hot plate method).
ITC-CNR has several years of experience in the calculation of thermal resistance of homogenous materials in steady state conditions, using laboratory devices according to ISO 8301 [
51] and ISO 8302 [
52] (the guarded hot plate and the heat flow meter, respectively), based on standards relating to thermal properties of homogenous and compact materials such as:
UNI EN ISO 12667 [
53]: for determining thermal resistance and thermal conductivity of building materials and products characterized by high and medium thermal resistance (thickness less than or equal to 10 cm) by means of the guarded hot plate and heat flow meter methods.
UNI EN ISO 12939 [
54]: same as above for thickness greater than 10 cm.
UNI EN ISO 12664 [
55]: for determining thermal resistance and thermal conductivity of dry and moist building materials and products characterized by low and medium thermal resistance by means of the guarded hot plate and heat flow meter methods.
Considering the characteristics of the growing media samples—in other words, a disaggregated material with variable moisture content and without specific standard references—ITC-CNR provided some necessary procedural adjustments. At the same time, based on UNI EN 13041:2012 [
42] and UNI EN 13040:2008 [
43] standards, the described procedure had to be adapted to samples of different dimensions due to the laboratory test devices used.
The first adjustment outside the reference standards was the study of a specific system of containment of the growing media samples, because samples cannot be directly inlaid in the laboratory test devices.
Secondly, the standards establish the test samples maximum thickness as a function of the sample surfaces. On the contrary, to better reproduce real operating conditions, the thickness of the test samples must be greater than the maximum thickness specified in the standards.
The final deviation from the standard is represented by testing wet test samples under different moisture content levels to saturation.
All three factors were carefully analyzed and evaluated with corrective actions in the results calculation.
2.3. Definition of the Laboratory Measurements
ITC-CNR started a collaboration with four of the most important Italian factories (Factory 1, 2, 3 and 4 in the following) for growing media for green roofs. Each provided two typologies of growing media, the former extensive, the latter intensive, for a total of eight different samples to be tested. Five different thicknesses were tested for each sample: 3, 6, 8, 13 and 16 cm. The 6 cm thickness was tested for different water contents: 0%, 10%, 20%, 35% and 50% by weight with respect to the dry value. On the basis of standard CEN ISO/TS 17892-1:2005 [
56] it was decided to achieve different moisture levels by adding water by weight with respect to the dry value, rather than by volume [
23]. The heat flow meter method was applied to samples up to 8 cm. The guarded hot plate method was applied to 13 and 16 cm samples. In total, 108 tests were performed, 72 of which were direct tests (following the
Table 1 scheme) and 36 were sampling repetitions.
The thermal tests were performed after a thermal characterization phase on growing media containment systems.
Following the 72 direct tests, the activities described below were carried out:
verification of the repeatability of the results by performing tests on selected samples according to specific characteristics identified during the preliminary phase (36 repetitions)
elaboration of performance curves of the thermal resistance as a function of thickness, compaction and moisture levels
definition of sensitive parameters and unexpected behaviors
analysis of the correlation between density variation and thermal resistance, and the variation of the thermal conductivity with respect to water content according to the Pearson correlation coefficient.
2.4. Test Laboratory Devices
The growing media samples were analyzed under controlled and stationary environmental conditions using the guarded hot plate and the heat flow meter. The latter can test samples up to a maximum of 9 cm in thickness, the former allows testing of greater thicknesses (up to 20 cm).
The heat flow meter method, according to ISO 8301 [
51], provides a measure of the sample thermal conductivity/resistance comparing the sample’s behavior with that of a calibrated specimen. The heat flow meter apparatus determines the heat flow rate transmitted through a sample: it is composed of a hot plate, a cold plate, the specimen and two heat flow meters. When the set temperatures and the thermal equilibrium are achieved, the software produces a data set that is used to calculate the thermal conductivity (1) with the following formula:
where,
| ei = heat flow meter output voltage | (mV) |
| f = calibration factor of the heat flow meter | (W/(mV∙m2)) |
| d = thickness; average thickness of a specimen | (m) |
| DT = temperature difference (usually T1 − T2) | (K) |
This method was applied to samples of size 290 mm × 290 mm of three different thicknesses: 3, 6 and 8 cm. Tests were performed with a temperature variation between 5 and 15 °C or 5 and 25 °C for dry, wet and water-saturated samples, with no percolation, with expected thermal conductivity values not significantly greater than 1 W/mK (loss of sensitivity of the heat flow meter method).
The guarded hot plate method, according to ISO 8302 [
52], by contrast, provides an absolute measure of the thermal conductivity/resistance of samples. The test procedure described in the International Standard is based upon the application of the Fourier law on a unidirectional uniform density of heat flow rate at steady state conditions. When the set temperatures and the thermal equilibrium are obtained, the thermal conductivity (1) is calculated with the following formula:
where,
| p = average power supplied to the metering section of the heating unit | (W) |
| d = average specimen(s) thickness | (m) |
| A = metering area | (m2) |
| T1 = average specimen(s) hot side temperature | (K) |
| T2 = average specimen(s) cold side temperature | (K) |
The growing media samples are of size 500 mm × 500 mm, and two different thicknesses, 13 and 16 cm. Tests were performed with a temperature variation between 5 and 15 °C or 5 and 25 °C. The calculated trends were included in the graph together with those obtained for the thicknesses 3, 6 and 8 cm, in performance curves that are individually related to a specific sample.
2.5. The Containment System
Different options were considered for the construction of the containment systems for non-homogeneous growing media, that were also able to resist high stove temperatures used for drying the samples and subsequent wetting-drying cycles. The final choice was to produce 20 containment systems made of marine plywood, 12 for the heat flow meter method tests (270 mm × 270 mm, thicknesses 3, 6 and 8 cm) and 8 for the guarded hot plate device (480 mm × 480 mm, thicknesses 13 and 16 cm), with their lids. The plywood thickness was dimensioned to ensure good mechanical resistance.
In order to better evaluate the contribution of wood to the final test results, each containment box was characterized as a function of weight and thermal performances, and then each was associated with every single growing medium sample during the whole test session.
The calculation of the thermal conductivity of wood using the finite element method applying the software Flixo 5 [
57], according to UNI EN ISO 10211-1 [
58] and UNI EN ISO 10077-2 [
59], is based on the thermal conductivity average value obtained by the experimental tests carried out on the lids. Flixo 5 was used to calculate the thermal transmittance of the containment systems under both dry and wet conditions. By combining the results of the thermal tests with the results obtained with Flixo it was possible to determine the average nominal resistance of the containment systems calculated net of air resistance. Both the thermal resistance under dry conditions and the environmental temperature for testing the wet samples were then determined (
Table 2). This value was subtracted from the thermal resistance obtained from tests on dry or wet samples, in order to determine the thermal resistance only of the growing medium.
The calculation of the thermal resistance of the containment systems allowed determining the growing medium value:
where,
| Rt = total thermal resistance of the sample(s) | (m2∙K/W) |
| Rsi = inside surface thermal resistance | (m2∙K/W) |
| R1 = thermal resistance of the bottom of the containment boxes | (m2∙K/W) |
| R2 = thermal resistance of the air inside the containment boxes | (m2∙K/W) |
| R3 = thermal resistance of the cover of the containment boxes | (m2∙K/W) |
| Rse = thermal resistance of the external surface | (m2∙K/W) |
2.6. Sample Preparation
The growing media analyzed are very different in composition (
Table 3).
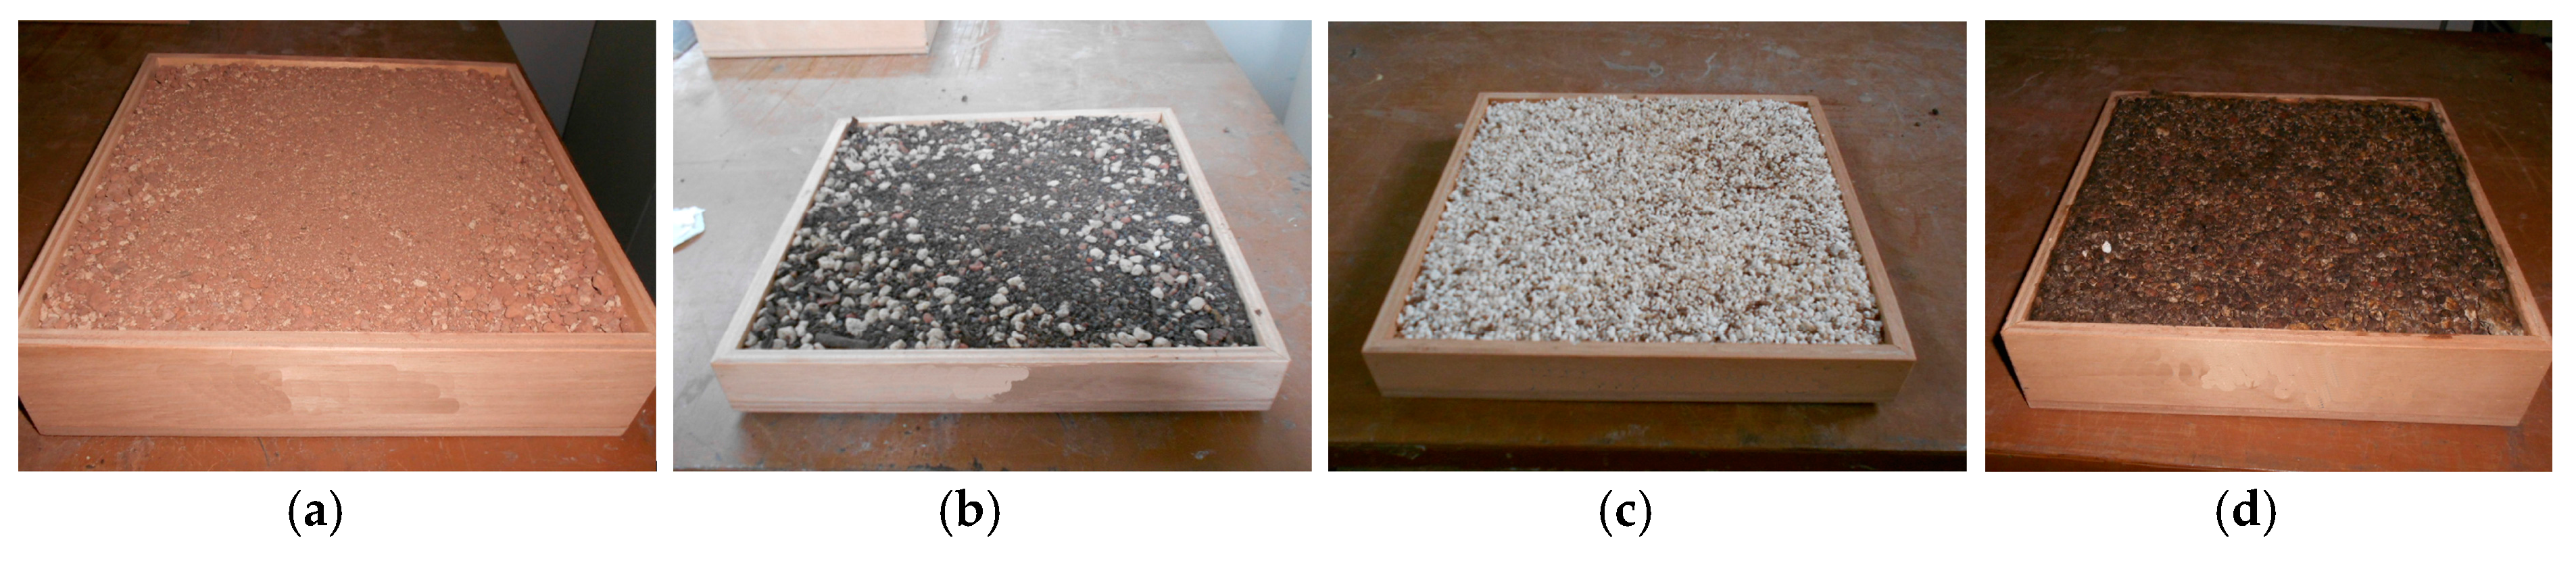
The dry test was performed by filling each containment box with the selected growing medium (
Figure 1). Compression was then exerted to reproduce the load applied during installation: 100 g/cm
2 (10 kPa) applied for 2 min [
60]. The test carried out using the guarded hot plate method revealed some problems related with the sample compaction, due to both the containment box size and the growing medium composition. The compaction of some of the growing media samples, characterized by a high percentage of the organic or lightweight portion, was repeated several times due to significant substrate level depressions. Repetition was carried out by performing growing medium addition/compression cycles to obtain maximum planarity of the sample and good contact between the ground and the lid of the containment system, thereby minimizing the presence of air. This caused some differences in compaction and resulted in non-linear variations in density. This was more pronounced in less homogeneous soils containing high percentages of organic material, such as moisture or lightweight lacquers, and less marked in more homogeneous soils.
Some growing media, mostly samples characterized by a high percentage of the organic portion, show materials with the largest grain size collected at the corners of the containment systems as noted above. However, this does not compromise the results because the thermal flow is measured at several monitored points in the center, not in the corners.
Once the compression phase is complete, samples were dried in a stove at 105 °C and weighed every 24 h to control the weight variation due to the internal moisture evaporation. The related variation in the volume of the samples was adjusted by adding some extra growing medium to fill the air gap between the sample and the lid of the containment system during the execution of the laboratory test. Once filled up and weighed, the samples were dried in the stove and weighed once more. Once the thickness and weight of the sample reached stability after 24 h, the sample was allowed to dry in the stove at 40 °C for 24 h more.
where,
| Psample = sample total weight—growing medium + containment boxes + water— | (kg) |
| Pgm = net weight of the growing medium | (kg) |
| Pcont = weight of the dry containment boxes | (kg) |
| %water = water content in percentage with respect to the dry sample weight (10%, 20%, 35%, 50%) |
After determining both the values of thermal conductivity and thermal resistance of the dry samples, the wet samples were tested to simulate the behavior of growing media in working conditions subjected to natural rainfall, then with a modified retained water content.
Distilled water was added to the dry sample in a weight fraction of 10% of the tested medium. Then the sample was weighed and placed in the laboratory test device (thermal flow meter) after verifying the absence of water percolation from the joints of the containment box. The same procedure was applied to samples by adding 20, 35 and 50% of water in weight with respect to the dry samples. Water was added homogenously to the samples, checking for percolation from the joints.
The double weighing, at room temperature and in dry conditions, allowed the calculation of the amount of growing medium by weight in order to determine the amount of retained water.
3. Results
Outcomes matched expectations and are briefly summarized below:
Thermal conductivity values of dry (intensive and extensive) samples analyzed are remarkably different from naturally occurring soil values laid down in UNI EN ISO 13370:2008 [
61].
As shown in
Table 4 and
Figure 2, extensive samples are characterized by a density between 800 and 1000 kg/m
3 when the thermal conductivity varies from 0.118 to 0.17 W/mK. Extensive lightweight samples characterized by a density between 100 and 500 kg/m
3 have thermal conductivities from 0.049 to 0.089 W/mK. Intensive samples characterized by a density between 750 and 950 kg/m
3 have thermal conductivities from 0.102 to 0.128 W/mK, respectively, while extensive lightweight samples with densities between 450 and 650 kg/m
3 have thermal conductivities from 0.075 to 0.097 W/mK, respectively. The more effective thermal performances of growing media with respect to naturally occurring soils (
Figure 3) confirms the importance of defining a laboratory test procedure to measure thermal conductivity values of growing media. These could be useful in the design of a green roof and in the evaluation of its thermal performance.
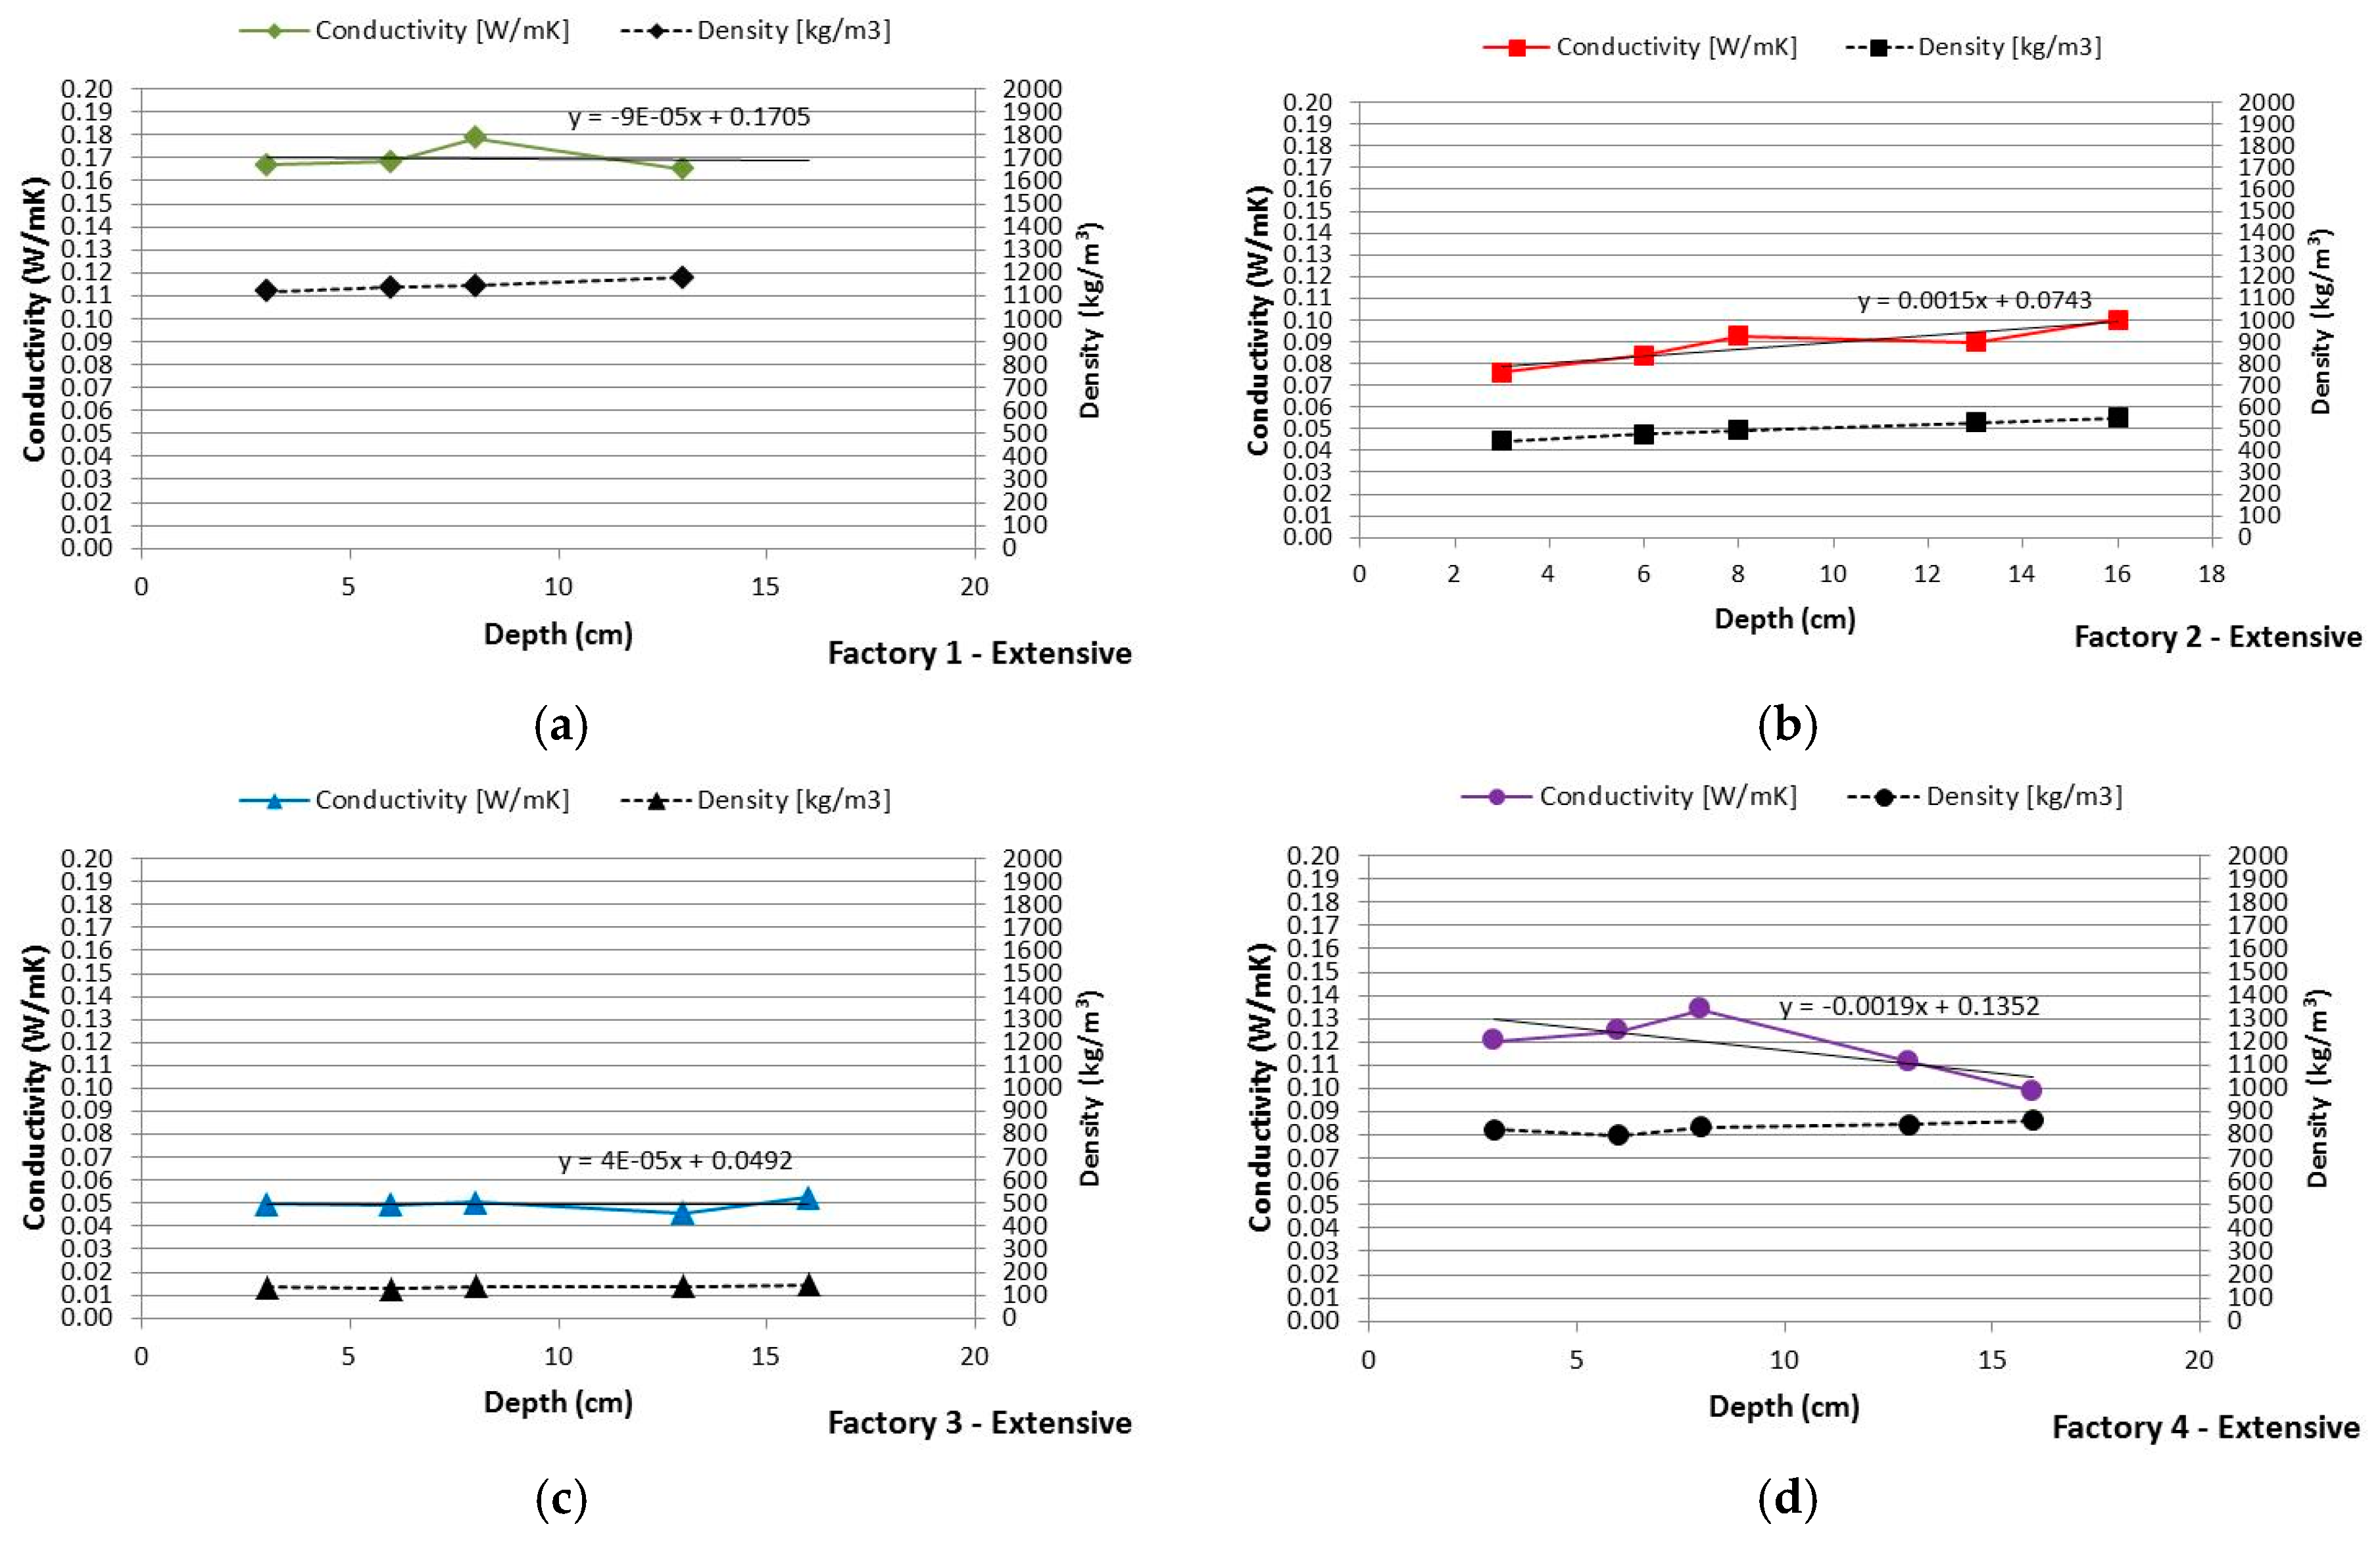
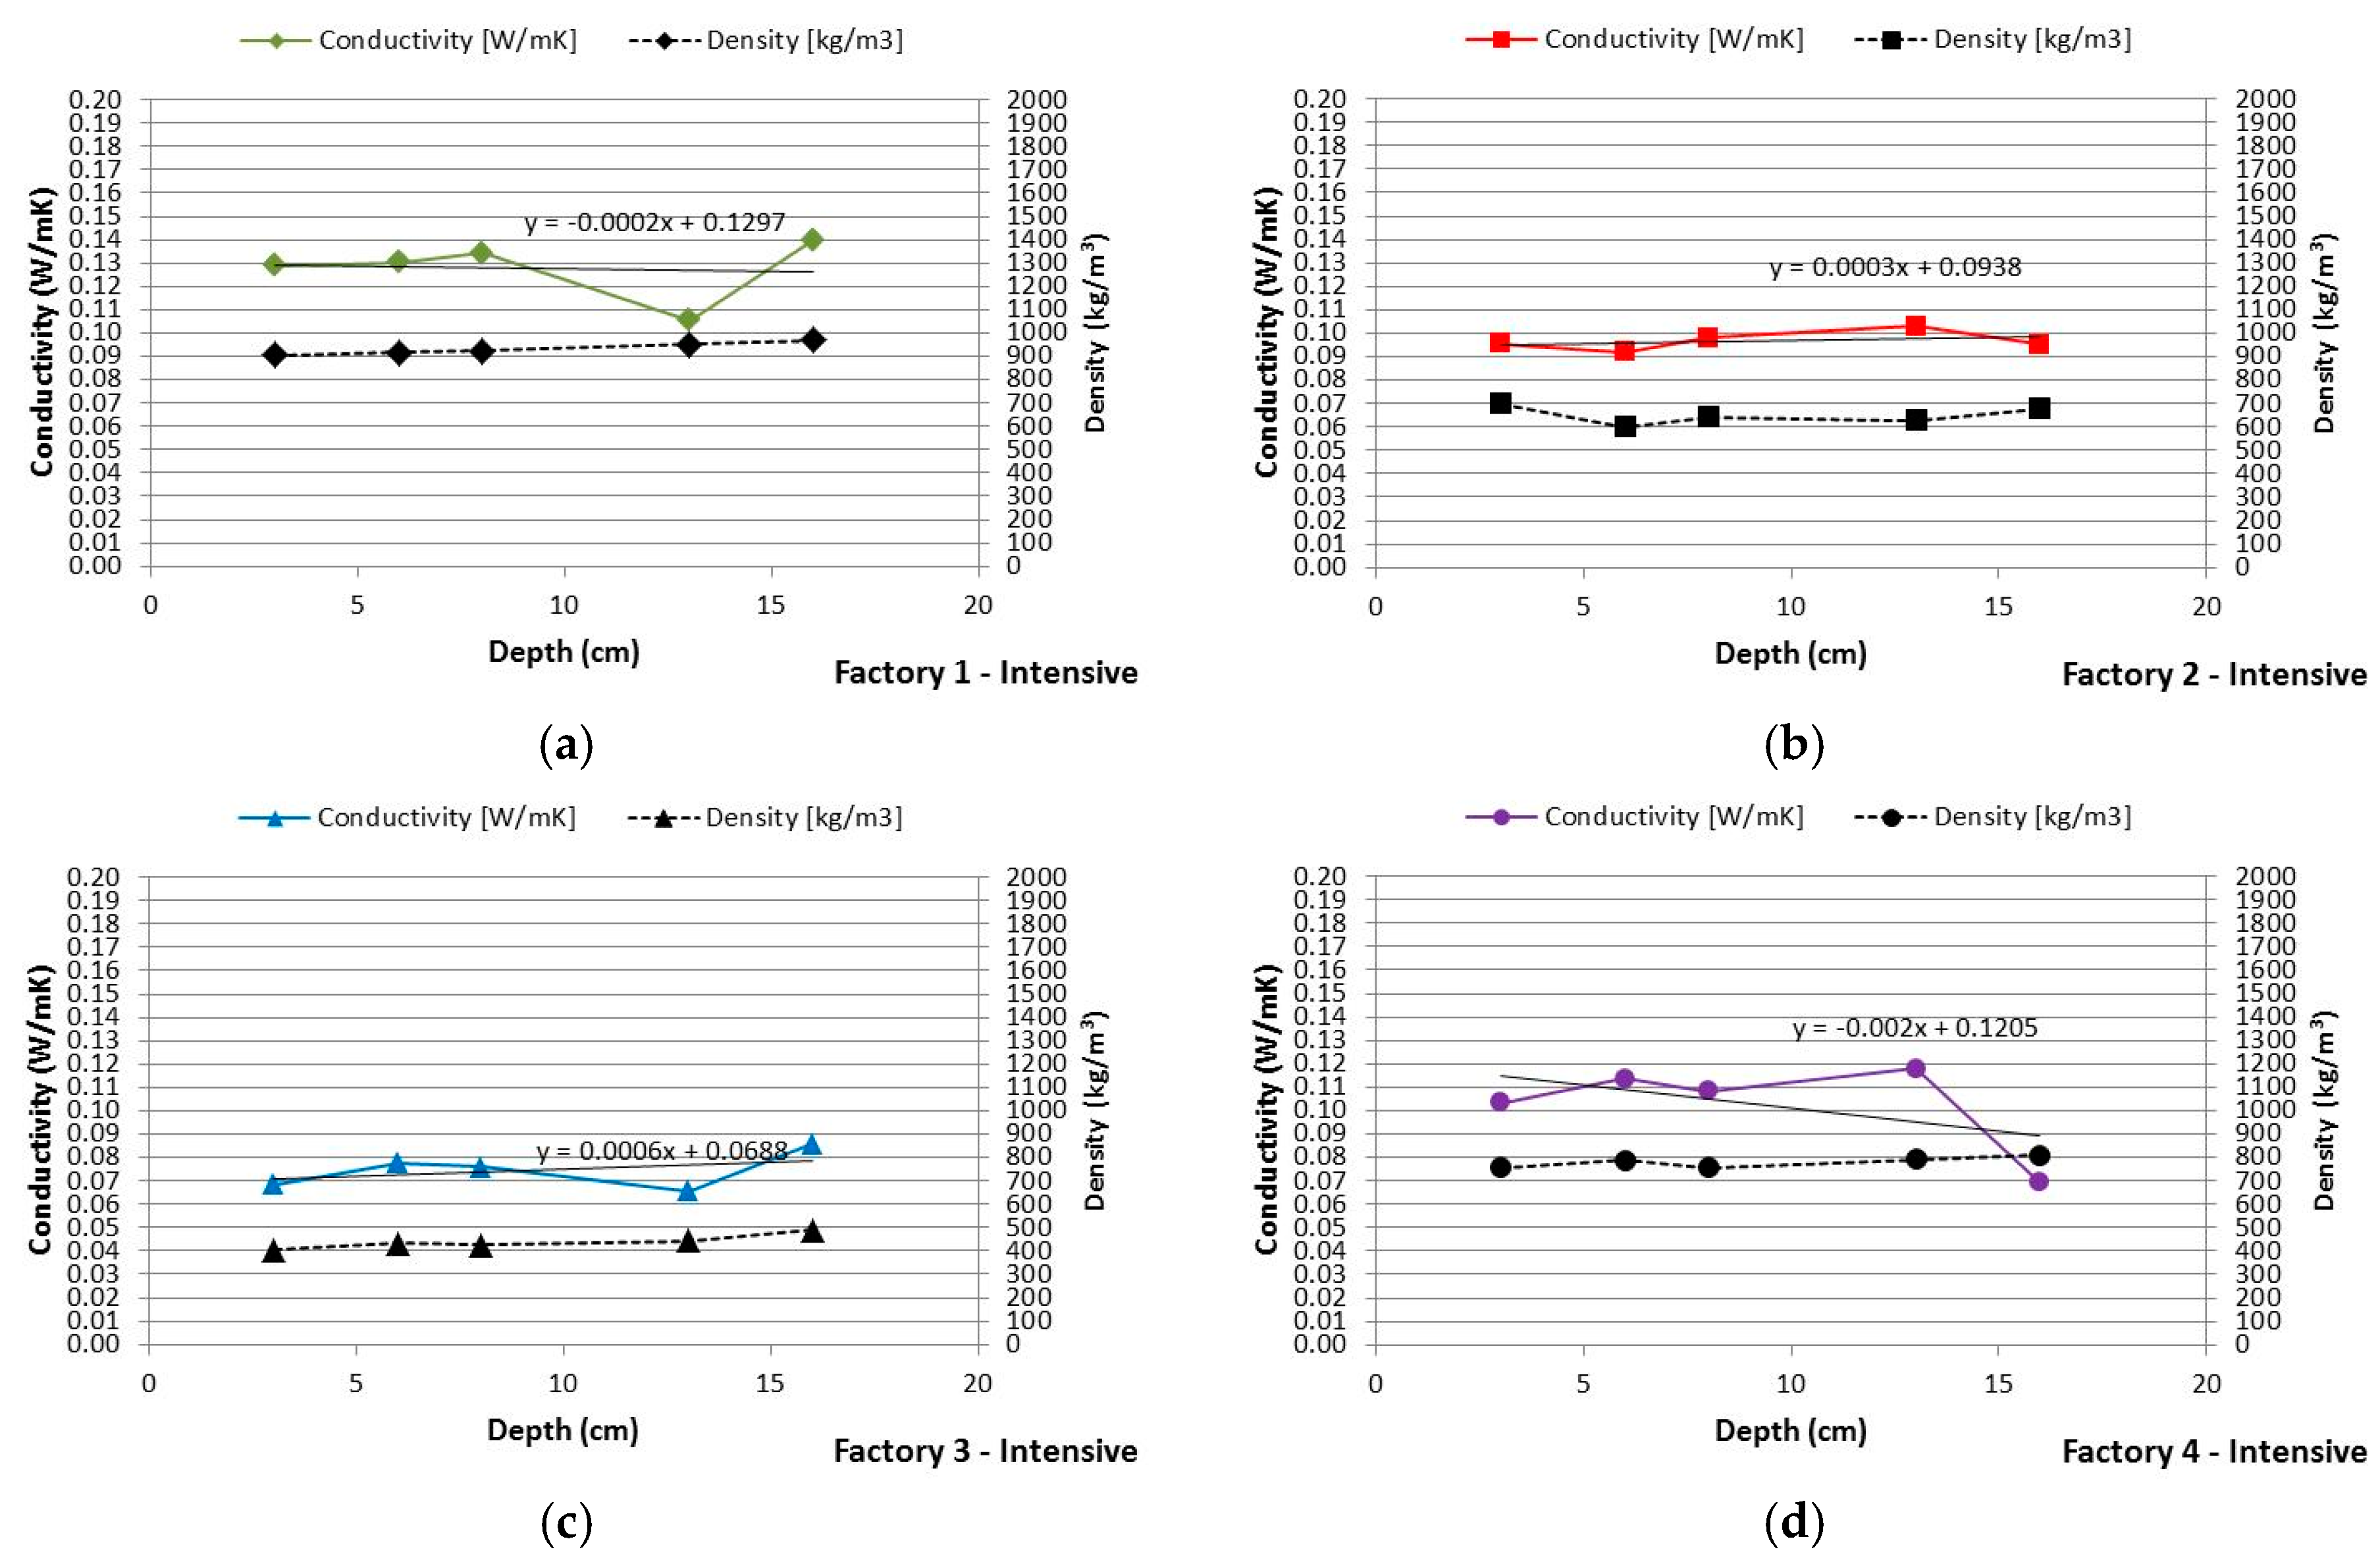
The comparison between the values of
Table 5,
Table 6,
Table 7 and
Table 8 with the graphs of
Figure 4 and
Figure 5 shows that thermal conductivity and density tend to be stable with respect to the thickness variation. Density variation between 5% and 7% occurs in lightweight samples (samples 2 and 3), where the organic or light particles prevail and a uniform compaction is more difficult to obtain. Based on the analysis of the average values, it is not possible to identify greater variations in the conductivity of the specimens with a given density, since the variation compared to the average value is often greatly affected by one individual test. The reason is also to be found in the extremely varied composition of the growing medium, each sample can differ from another. For this reason, some tests have been repeated and repeatability verified (
Section 2.3).
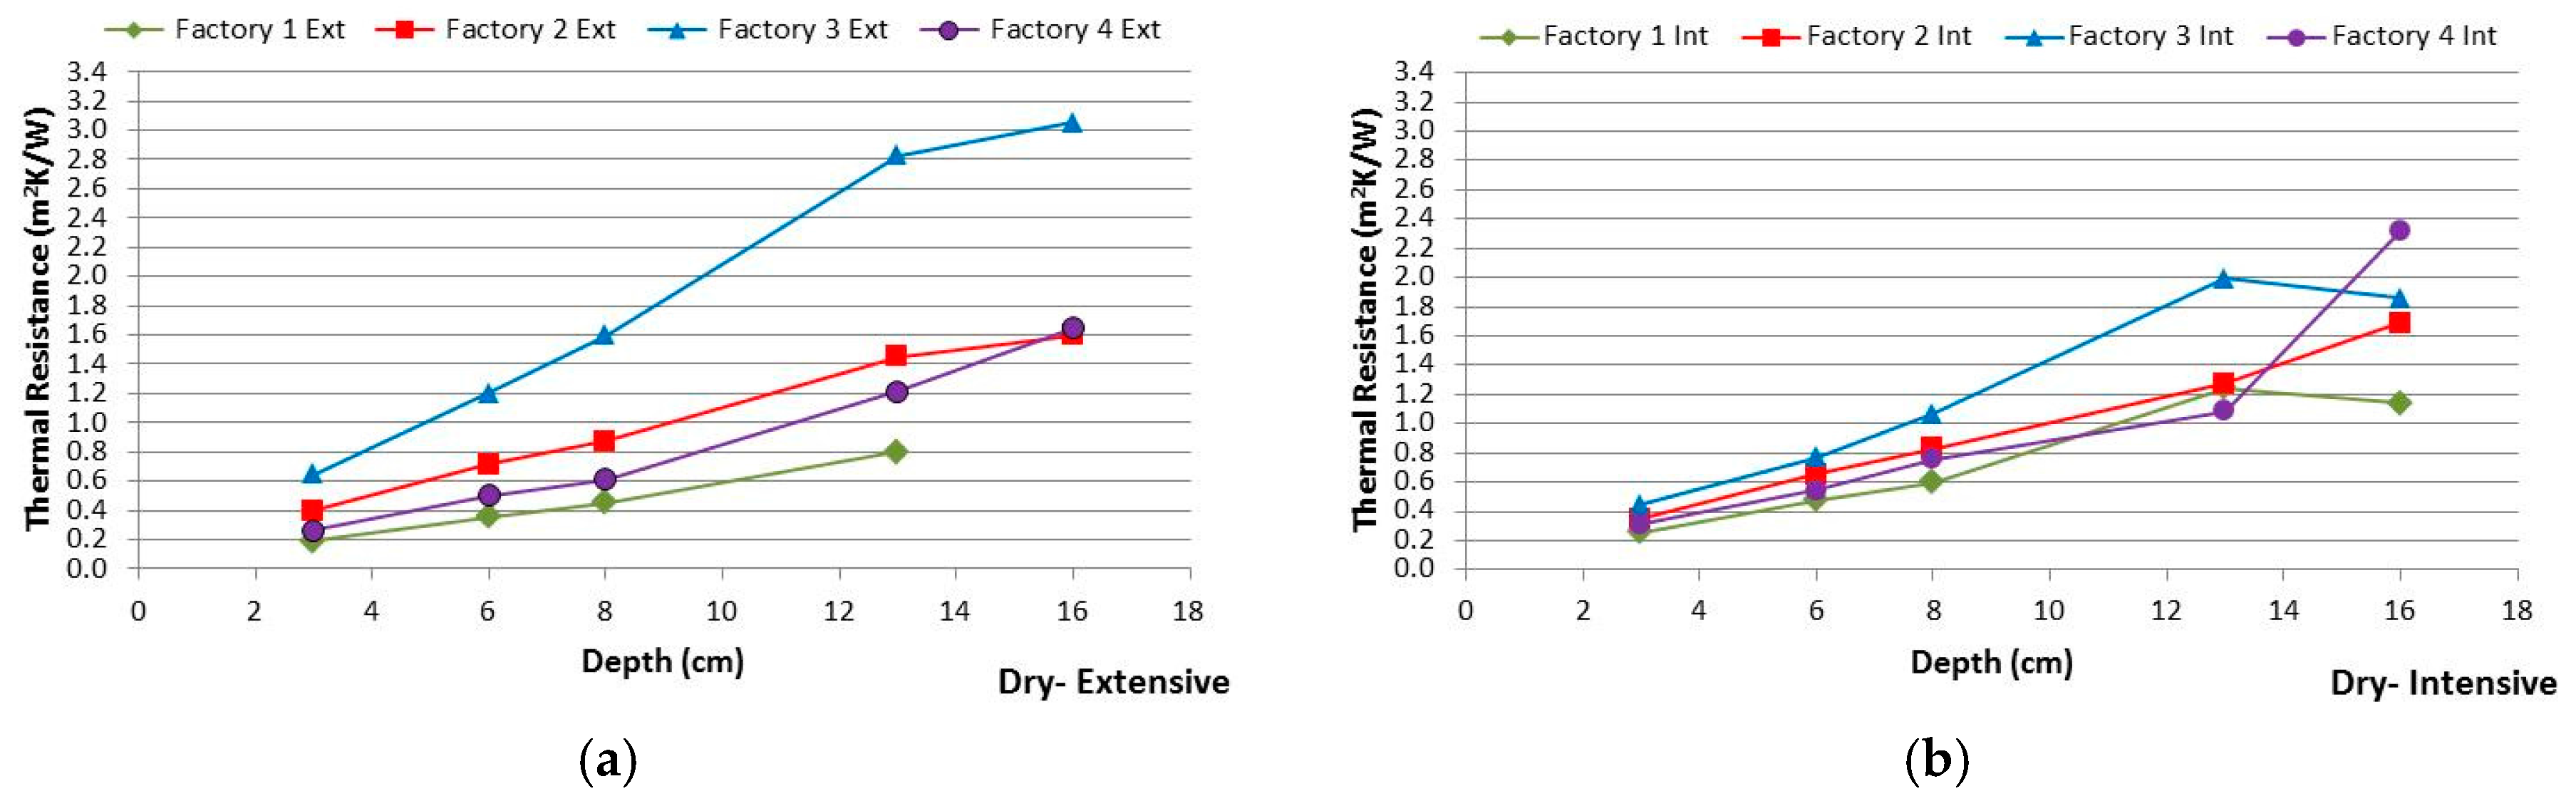
The thermal resistance increases linearly along with the increase in the substrate thickness both for extensive and intensive samples, as shown in
Figure 3. The 16 cm-thick samples show the greatest variation from the trend line in most cases, due to compaction problem during the laboratory tests.
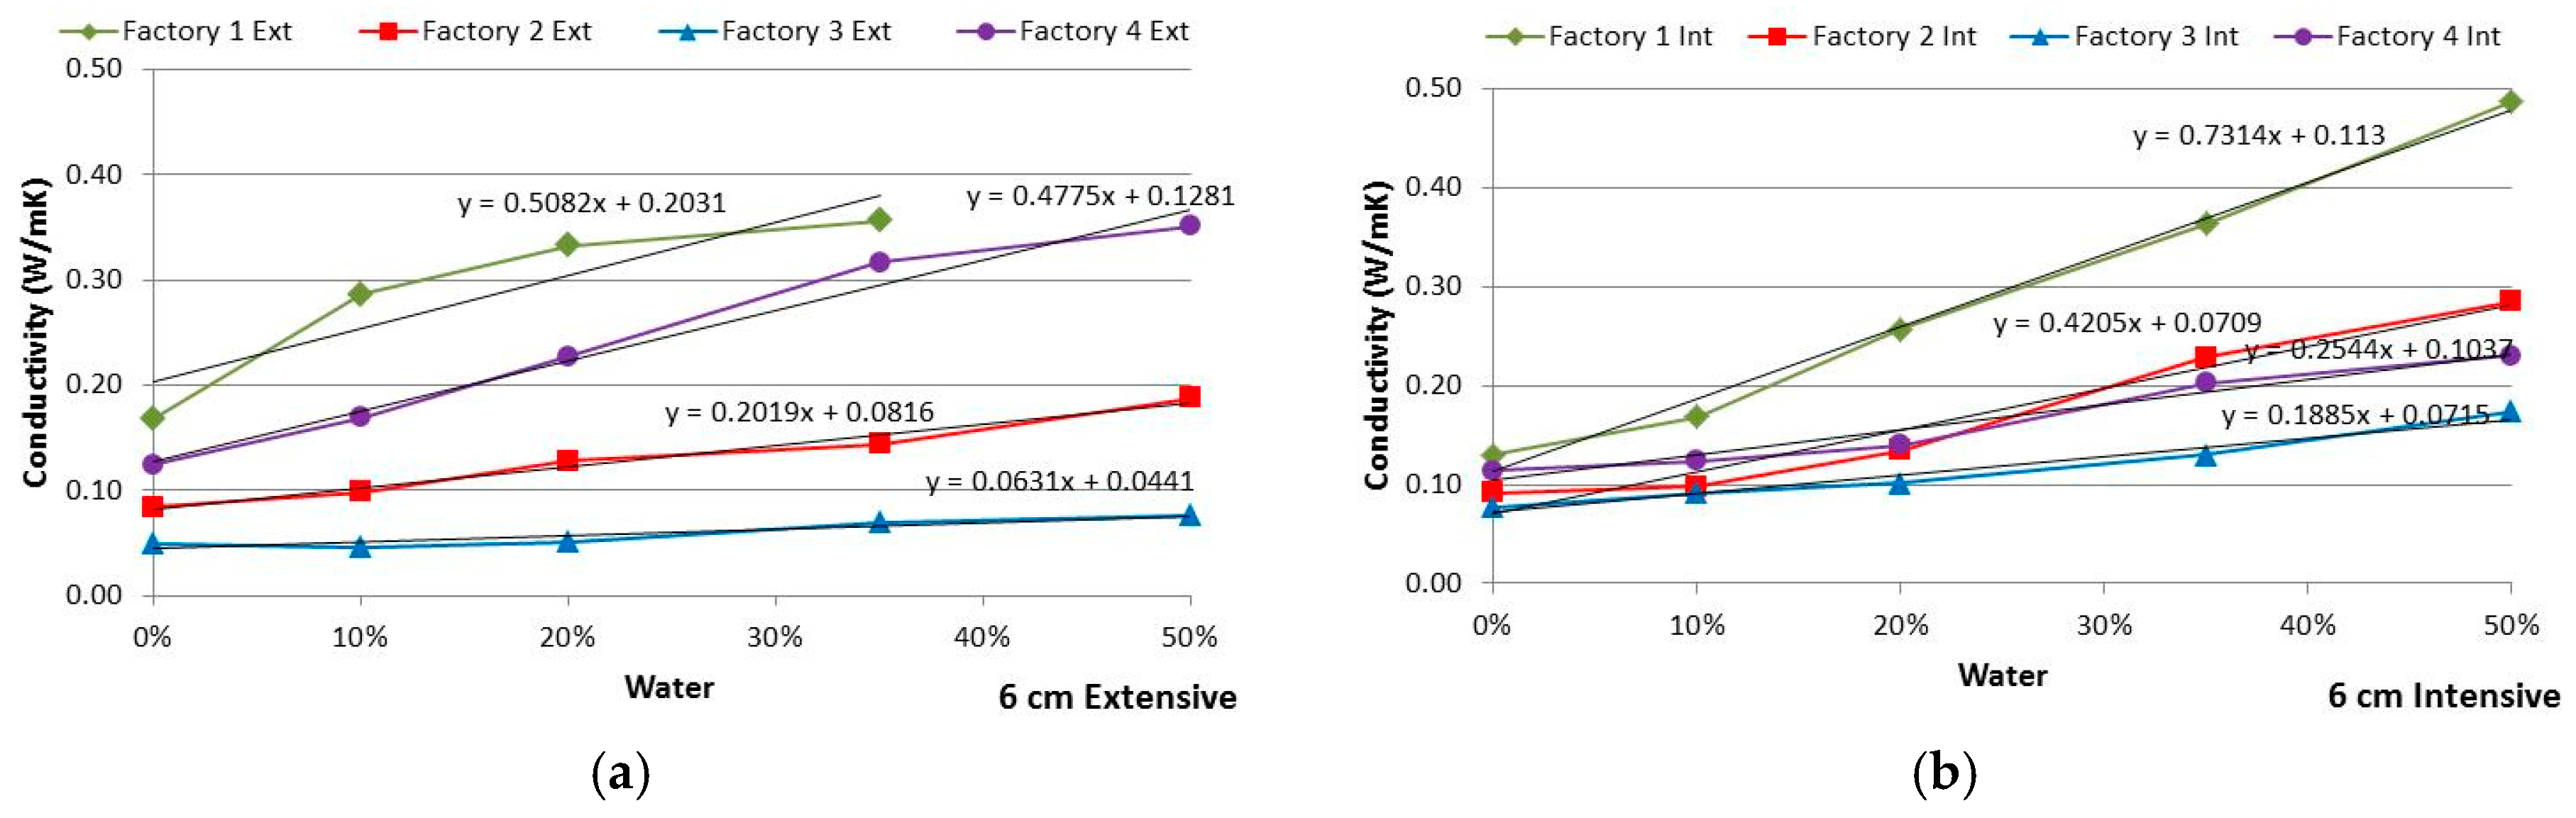
Analyzing the thermal conductivity variation depended on the variation of the water content by weight (
Figure 6), the thermal conductivity of the denser extensive samples (Factory Ext 1 (a) and Factory Ext 4 (d)) increased by 0.05 W/mK as the water content increased by 10%. In lighter samples (Factory Ext 2 and Factory Ext 3,
Table 7), the conductivity increase is affected to a lesser degree by the water content because a smaller amount is added; the thermal conductivity of Factory Ext 2 increased by 0.021 W/mK and that of Factory Ext 3 only by 0.006 W/mK.
Comparing density and conductivity of the intensive samples shown in
Table 8, the densities of Factory Int 2 and Factory Int 3 are similar. For this reason, their thermal conductivity variations almost overlap, although Factory Int 2 shows a greater slope. Indeed, except for Factory Int 4, the thermal conductivity increase depending on the percent increase of water shows a greater slope than that of the extensive samples: for every 10% of water added, the thermal conductivity of Factory Int 1 increases by 0.073 W/mK, that of Factory Int 2 by 0.042 W/mK, that of sample 3 by 0.019 W/mK and that of Factory Int 4 by 0.025 W/mK.
3.1. The Pearson Correlation Coefficient
The correlation, whether direct or indirect, between two or more variables can be analyzed and quantified by applying some statistical indexes.
The Pearson correlation coefficient (rXY), statistically measures the existence of a linear correlation between two variables.
The correlation value is between −1 and +1, where rXY > 0 is a positive linear correlation, rXY < 0 is a negative linear correlation and rXY = 0 is no linear correlation.
As a function of the values between −1 and +1, the Pearson correlation coefficient is considered ‘weak’ if 0 < rXY< 0.3; ‘moderate’ if 0.3 < rXY < 0.7; ‘strong’ if rXY > 0.7.
The Pearson correlation coefficient was assumed to confirm the correlation obtained from the experimental data, and also to check any discrepancies in behavior depending on the compositional characteristics of the different growing media under study.
Table 9 and
Table 10 show the results obtained from the evaluation of the linear correlation between thermal resistance and thickness with dry samples, and between thermal conductivity and water content by weight for wet samples, respectively.
The calculated data clearly demonstrates a direct and strong correlation between the considered variables, according to the results obtained during the laboratory experiments.
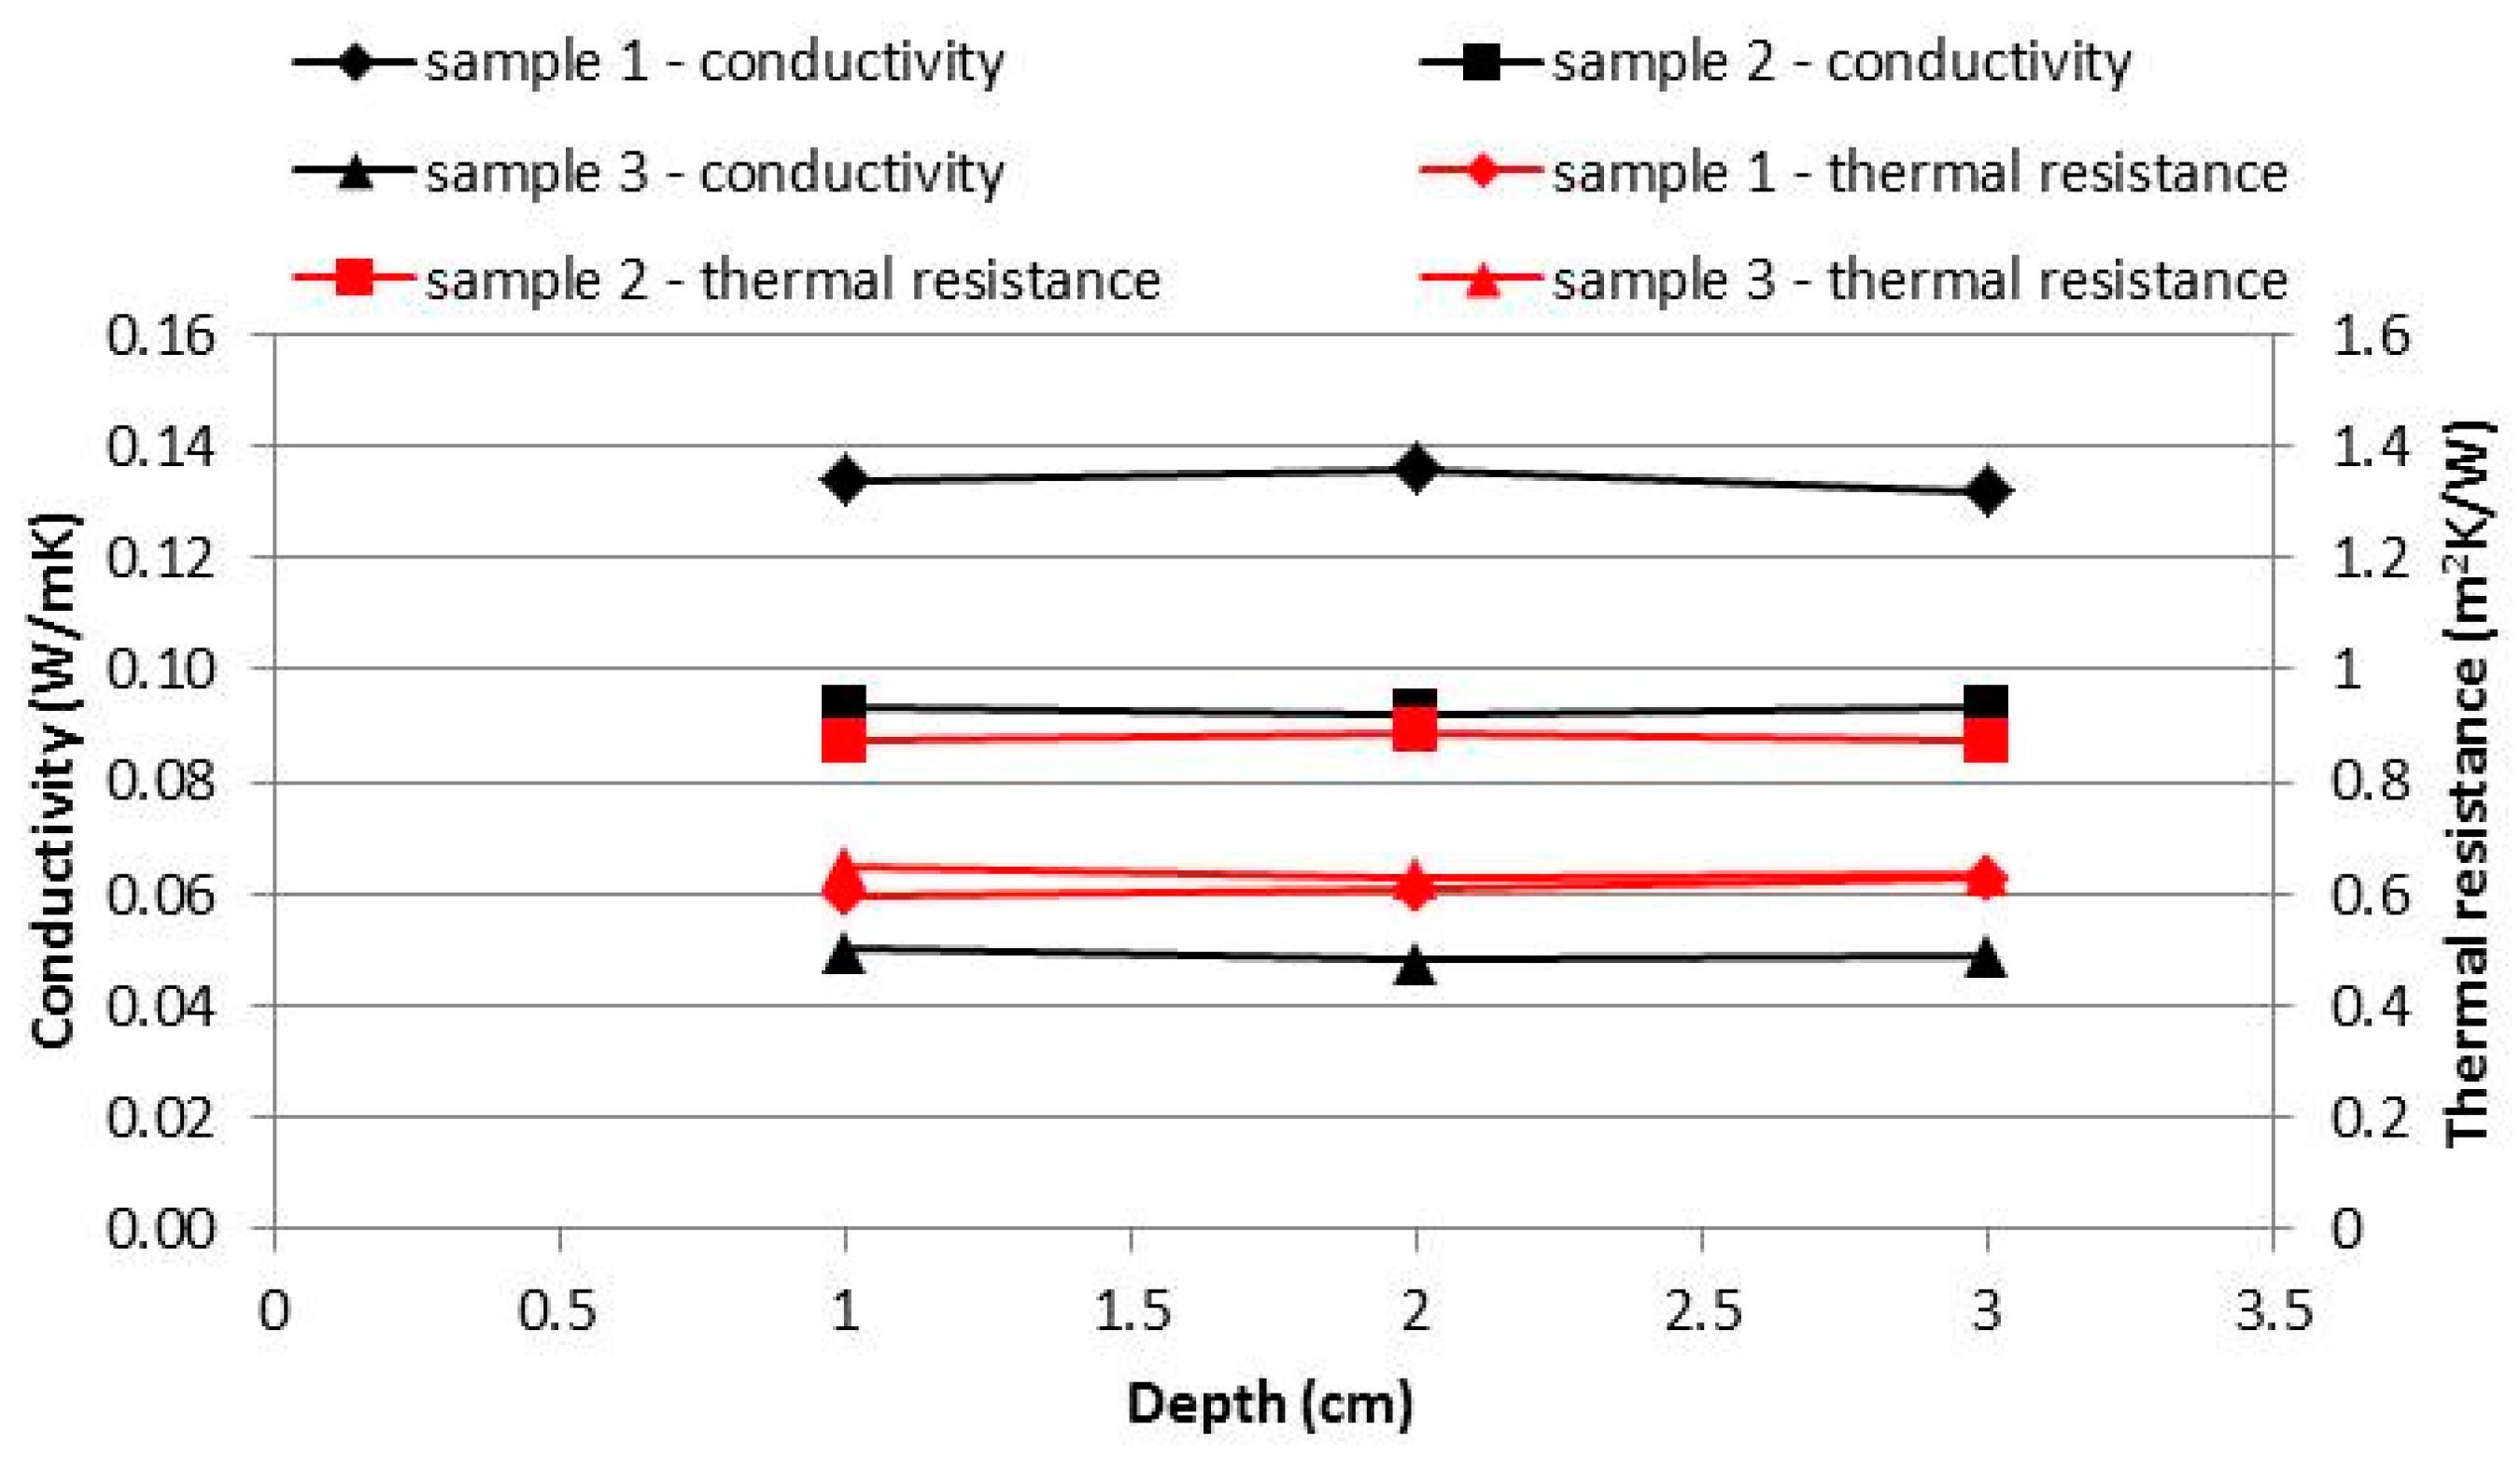
3.2. Repeatability of Results
Tests with the heat flow meter method were carried out to validate the previous outcomes. Tests for three substrates were repeated based on specific features shown in the first round of tests. In particular:
Factory 1 intensive: A sample with high density and conductivity, with good repeatability in the results, the thermal conductivity variation remains within the limit of 3% using the same device and varying the sample thickness.
Factory 2 extensive: A sample with medium density and conductivity, outcomes are highly variable depending on the thickness variation;
Factory 3 extensive: The most insulated sample with the most stable outcome.
For each kind of sample, two new tests were conducted, a test with the previous growing media removed from the containment systems, and then a test that repeated the test procedure with a new sample. For each sample, repeatability was determined using the standard deviation:
Table 11 and
Figure 7 show high repeatability of the results obtained from the initial tests compared with those obtained from the tests performed for verification.
4. Conclusions
The measurements carried out were used to quantify the thermal conductivity and thermal resistance of green roof growing media as a function of density, water content and composition. In general, correlating best or worst performance to the intensive or extensive substrate is not possible, because the insulation properties depend on composition and texture parameters [
31].
The thermal conductivity of dry growing media calculated with a heat flow meter and guarded hot plate is consistent with tests conducted in Sailor et al. [
31] with the density of the samples varying between 800–1000 kg/m
3. The maximum values of 0.21–0.18 W/mK, for dry shale and pumice-based soils, respectively, are comparable with ITC-CNR test outcomes, both for extensive samples (0.118–0.17 W/mK) and intensive samples (0.102–0.128 W/mK).
On the contrary, the values of the thermal conductivity of samples with a density variation between 100–500 kg/m
3 are significantly lower than those reported in the literature [
31]; 0.049–0.089 W/mK for extensive samples (100–500 kg/m
3) and 0.075–0.097 W/mK for intensive ones (450–650 kg/m
3). However, the density of the samples reported in the literature [
31] have values varying between 760 and 1470 kg/m
3, so they are not directly comparable.
In addition, Sailor [
31] states that “
in general the thermal conductivity increased at a rate of approximately 0.038 W/mK per 0.1 increase in fractional soil saturation”. The results of the research carried out by ITC-CNR have shown different performance curves depending on the type of substrate. Excluding Factory 3, the range varies between a minimum value of 0.019 W/mK and a maximum value of 0.073 W/mK, under the same increase in water content. Sailor’s trend line reveals that the behavior is just slightly lower (about 17%) than the mean value found during this research, 0.046 W/mK.
The confirmation of the test results is all the more interesting because the laboratory equipment used for this research (a heat flow meter and hot guarded plate) is based on a physical principle that is significantly different from the methods previously described in the literature.
One other innovative feature is that thermal conductivity and resistance performance curves of different samples of growing media are defined as a function of the variation of thickness and humidity, rather than yielding absolute values. This is an original, flexible and dynamic instrument for designers to evaluate the thermal insulating performance of green roofs for buildings. Especially with regard to the moisture content, designers should use the thermal conductivity (or resistance) that better represents the most probable value in operating conditions, for example taking into account the annual, or seasonal, precipitation average. The thermal conductivity of the growing medium in dry condition represents, in fact, a conservative value and it could overestimate the thermal behavior of the whole roof on an annual basis.
An interesting experimental campaign carried out by ITC-CNR in outdoor test cells in Milan has demonstrated, for example, that on an annual basis, the moisture content of a selected growing medium, 8 cm in depth, varies between 10–20% in spring and summer seasons, and 40–50% during autumn and winter. So, designers should consider that the thermal conductivity of the growing medium increased 0.046 W/mK × 0.2 in spring and summer and 0.046 W/mK × 0.5 in winter and autumn, with respect to the dry value.
However, the correlation between growing medium density and thermal conductivity proved to be less consistent, which confirms that the composition of growing media strongly affects their performance. For this reason, the performance of growing media is different from those of naturally occurring soils, characterized by a more homogenous texture. Furthermore, the better performance of growing media compared to natural soils confirms the importance of carrying out further research in this area.
5. Discussion and Future Work
The results achieved and discussed are extremely relevant. Nevertheless, the tests performed revealed that some features are still to be improved, and are currently being implemented by ITC-CNR with new research with the aim to validate the proposed methodological.
Firstly, as Sailor et al. highlight [
23], results are strongly affected by the compaction level. It is for this reason that ITC-CNR decided to act in two ways. Firstly, by designing and building a prototype pneumatic compactor capable of applying an exact, quantifiable and homogenous pressure on samples. Secondly, by compacting and placing the growing media samples in the containment systems, exposing them for a number of years to outdoor weather conditions to simulate and study natural compaction effects. This allowed the identification of the correct pressure values to be applied during a compaction test, and thus, laboratory outcomes as similar as possible to working conditions. Regarding this, Sailor et al. [
23] refer to in situ soil compaction measurements of a green roof five years after its installation.
Furthermore, the calculation of the mean thermal conductivity of five different thickness using two different apparatus leads to an increase in the uncertainty of test outcomes. ITC-CNR has recently purchased a new heat flow meter able to test 20 cm-thick samples which is being used to ensure a greater uniformity in test results.
Finally, the square shape of the containment systems proved to be unsuitable for testing the growing media because of the collection of materials with the greatest grain size at the containment systems’ joints and due to water seepage. For this reason, new circular containment systems were developed, with an internal ring able to control the water seepage and to avoid the uneven distribution of the particles.


