Assessment of Energy Credits in LEED-Certified Buildings Based on Certification Levels and Project Ownership

1
Department of Civil Engineering, Yildiz Technical University, Davutpasa Campus, Esenler, Istanbul 34220, Turkey
2
Department of Civil, Architectural and Environmental Engineering, Illinois Institute of Technology, Chicago, IL 60616, USA
*
Author to whom correspondence should be addressed.
Buildings 2018, 8(2), 29; https://doi.org/10.3390/buildings8020029
Submission received: 26 December 2017
/
Revised: 4 February 2018
/
Accepted: 6 February 2018
/
Published: 9 February 2018
Abstract
:Compared to other categories, the Energy and Atmosphere category contributes the most to the maximum obtainable points in the Leadership in Energy and Environmental Design (LEED) certification system. The objective of the study was to identify the extent to which project teams take advantage of the credits in the Energy and Atmosphere category of LEED. This study analyzes the performance of practitioners in achieving points in the Energy and Atmosphere credits of LEED-New Construction (NC) 2009 for 1500 buildings that received LEED certification in the US. For a better understanding of the credit patterns, the differences in the performance of practitioners are investigated relative to certification levels and project ownership. Achievement in credits is calculated in terms of percent of maximum points (PMP), since the maximum achievable points differ for each credit. Practitioners’ achievements in the credits were ranked as follows: (1) enhanced commissioning, (2) optimized energy performance, (3) enhanced refrigerant management, (4) green power, (5) measurement and verification, and (6) on-site renewable energy. The largest achievement differences were observed in the on-site renewable energy credit. Concerning building ownership, investors were found to optimize mostly energy efficiency and on-site renewable energy, but to mostly skip enhanced refrigerant management. Performance in the measurement and verification credit was similar for all owner types, whereas investors performed differently from corporations, and government agencies in the enhanced commissioning credit. Practitioners who recognize these priorities and differences are expected to be better positioned to make sustainability-related decisions in building design and construction.
1. Introduction
Buildings consume a considerable amount of energy and constitute one of the major sources of adverse impacts on the environment. Buildings account for 19% of global greenhouse gas emissions [1]. In the US, the residential and commercial businesses are responsible for 12% of the total greenhouse gas emissions due to heating and cooking needs, management of waste and wastewater, and leaks from refrigerants in homes and businesses [2]. It is essential to ensure sufficient energy supply in the future [3], and it is also necessary to incorporate measures for energy efficiency into the design and construction processes [4]. A major objective of sustainable design and construction is to minimize the adverse impacts of excessive energy consumption.
Federal, state and local authorities either incentivize or mandate sustainable design and construction in the US [5]. In addition to such programs, marketing demands and environmental concerns also affect the growing interest in sustainable buildings and systems that certify projects as green buildings. Leadership in Energy and Environmental Design (LEED) has been used as a green building certification system since the 2000s in the US and other parts of the world. According to the United States Green Building Council (USGBC) project directory [6], 107,383 projects are registered for the certification process across the globe and more than 62,000 of them are located in the US. LEED is a verification system that consists of several categories organized with prerequisites and credits for rating the sustainability performance of buildings. It was launched by USGBC and is flexible enough for use in different type of projects. Building design and construction (LEED BD + C), interior design and construction (LEED ID + C), operating and maintenance (LEED O + M), and neighborhood development (LEED ND) are the rating systems applicable to new construction, existing buildings, schools, healthcare facilities, data centers, warehouses, hospitality facilities, homes, commercial interiors, multifamily midrise and retail buildings [6].
LEED BD + C: New Construction (NC) is the system applicable to new construction projects. Buildings can achieve four certification levels—certified, silver, gold and platinum—after earning points from credit categories in the system. Since its introduction, the system has been updated many times. The Energy and Atmosphere category accounts for the maximum possible points compared to the contribution of the other categories in LEED for new construction. The credits in this category address energy use reduction, energy-efficient design strategies, and renewable energy sources. In LEED-NC 2009, the Energy and Atmosphere category consists of three prerequisites and six credits. The prerequisites are mandatory conditions to earn points in every credit. The six credits account for 35 of the maximum 110 points. According to Illankoon et al. [7], energy related credits are the key credit criteria not only in LEED-NC 2009, but among other international green building rating tools. The prerequisites and credits in the Energy and Atmosphere category of LEED-NC 2009 are shown in Table 1.
The level of achievement in LEED points has been analyzed in past studies by different researchers. The level of achievement in the credits offers insights into projects with LEED certification and provides patterns and trends about green building design and construction. Todd et al. [8] analyzed the LEED-NC and Existing Building Operations and Management (EBOM) systems to identify patterns, trends and strategies in credit achievement changes at different locations in the world, and found that “EA1—Optimizing energy efficiency” occupied the first rank in the top five highest achieved credits list. Ma and Cheng [9] used scorecards of 1000 LEED-NC 2009-certified buildings to understand the achievement of individual credits and related credits. Cheng and Ma [10] analyzed 1381 LEED-certified buildings to explore the interrelationships between credits and to highlight the high-scoring sustainable design strategies. Sullivan and Oates [11] examined 53 LEED-NC 2.0, 2.1 and 2.2-certified buildings in Arizona to identify credit achievement patterns and found that the percentage of possible credits earned in the Energy and Atmosphere category was 48%. Similarly, Kim and Cheung [12] examined 43 LEED-NC 2.0-certified buildings and found that the achievement in the Energy and Atmosphere category was 43% on average, but also observed significant differences between projects. Da Silva and Ruwanpura [13] investigated 42 buildings across Canada certified with earlier versions of LEED for new construction, and found that the greatest percentage of points in the Energy and Atmosphere category was “EA1—Optimizing energy efficiency”. Wu et al. [14] report that energy-related credits remain difficult to obtain for developers based on their research including LEED 2009-certified projects.
The objective of this study is to analyze quantitatively the information about a building inventory of 1500 silver, gold, and platinum-certified buildings in the US in order to understand energy and atmosphere related practices. The building scorecards used in the research were registered to projects available on the USGBC website. The study highlights designers’ performance in Energy and Atmosphere credits. It identifies and discusses patterns in achieving points relative to certification levels and building ownership; it pinpoints the strategies currently adopted by practitioners to earn points; and it explores the challenges that are encountered in undertaking energy efficient design and construction. After describing the methodology used in the research, the paper presents the findings, and the analysis of the levels of achievement in the different credits in the Energy and Atmosphere category. It also examines variations in achievement levels attributable to certification levels (silver, gold, platinum) and type of ownership. The detailed discussion of the findings is followed by conclusions and recommendations.
2. Methodology of the Study
The methodology relies on scorecards of the Energy and Atmosphere credits that were extracted from the USGBC project database. The database of USGBC includes LEED-certified buildings located all around the world. The database was filtered for the purposes of the study. Only buildings that were constructed in the US and that received LEED-NC 2009 platinum, gold, and silver certification were considered. Other countries and regions were not included because the underlying reasons in the achievement levels can vary based on local parameters as reported by some researchers [14,15,16]. The data were downloaded and transferred manually to an Excel file by using a macro. Ma et al. [17] and Todd et al. [8] used similar but automated procedures to perform the transfer. Information about 1500 buildings was collected, which represents over 103.4 million gross square feet of building construction in the US. The breakdown of the buildings by certification level is presented in Table 2.
After extracting the data, three types of analyses were conducted to analyze credits in the Energy and Atmosphere category:
- (i)
- Calculation of percent of maximum points (PMP) attained in each credit: This part analyzes all buildings regardless of the certification levels they achieved. The PMPs attained were calculated to identify achievements in each credit independently.
- (ii)
- Calculation of percent of maximum points (PMP) in each credit by certification level: In this section, the PMPs of the building inventory were analyzed for three certification levels separately. First, the PMPs were evaluated for each certification level in order to reveal differences between levels. Then, the PMPs were assessed to identify how achievements and application trends vary from one certification level to another.
- (iii)
- Analyzing percent of maximum points (PMP) based on building ownership: This was done to identify the differences in trends, based on owner type.
3. Analysis of the Findings
The points obtained in each credit are evaluated in Section 3.1. The average achieved points and the percent of the maximum achievable points (PMP) are recorded. The differences in the PMPs of different credits are examined based on the level of certification (Section 3.2) and on building ownership (Section 3.3) to understand achievement patterns using non-parametric statistical tests. Finally, assessments of each credit are provided separately in Section 4. This part also includes examples of strategies adopted in real-life projects for improved energy efficiency, which brought points.
3.1. Percent of Maximum Points (PMP) Attained in Each Credit
The average points obtained in each credit indicate the relative convenience with which credit requirements are satisfied. The higher the average point, the more convenient it is to satisfy the credit requirement. The analysis reported in this section could improve practitioners’ understanding of the six credits in the Energy and Atmosphere category, and streamline their strategies in planning how they will get the necessary points for a desired level of certification. Each credit has a different maximum achievable point. Therefore, average achieved points in different credits have no comparative value [9]. In this study, the average achieved points were divided by the maximum achievable points to calculate the percent of maximum points (PMP) for each credit, as in Equation (1):
where ci is the average achieved points in credit i for the whole building inventory, and cimax is the maximum achievable point for that credit as specified by LEED. For example:
Table 3 shows the related information about the six credits in the Energy and Atmosphere category. It can be seen that not a single credit resulted in high scores, which suggests that no credit is intensely pursued, which in turn reflects the prudent tendencies of project owners and developers in energy related applications.
In Table 3, 59% of the maximum two points offered by “EA3—Enhanced commissioning” was attained in the buildings studied. Since the maximum achievable point is two in this credit, a 59% achievement rate does not directly indicate that this credit is a commonly pursued credit in this category. There is a prerequisite of this credit that mandates the fundamental commissioning of building energy systems, for which all registered buildings should qualify. The state-of-the-art heating, ventilation, and air conditioning (HVAC) and automation applications pose additional risks to sustainable building projects, which can be best managed with a commissioning procedure [18]. Benefits of enhanced commissioning include operational cost savings, catching installation mistakes, addressing occupant discomfort, enhancing indoor air quality and thermal comfort, prolonging equipment lifespan, lowering the risk of litigation, and training users to operate the building more efficiently by outlining the processes to the contractor, the owner, and end users according to the goals of the project [19]. This credit requires further professional consultancy to verify if there are gaps between the design intents and the owner’s requirements. Professional commissioning is increasingly recognized as an effective means of ensuring quality and maximizing energy performance [20]. The analysis suggests that professional commissioning services are indeed commonly utilized by project owners and developers to mitigate such risks.
According to Table 3, for “EA1—Optimizing energy performance”, 54% of the maximum 19 points were achieved in the buildings under study, making EA1 the second most achieved credit. Several strategies are adopted in this credit such as highly efficient HVAC and lighting systems, sophisticated controls, strategic location of windows, solar light tubes, exterior sunscreens and selecting LED fixtures [21,22,23]. Many of these strategies are not difficult to implement, which can lead to earning higher points. In LEED-NC 2009, Energy and Atmosphere credits account for approximately 32% of all achievable points. According to USGBC, LEED-certified buildings report 20% lower maintenance cost than typical commercial buildings. It is reasonable to pursue this EA1 credit seriously since it can contribute 19 of the 35 credits achievable, with significant cost savings. This result can be interpreted to mean that energy efficiency measures were commonly implemented in the projects.
This credit was closely followed by “EA4—Enhanced refrigerant management” with 53% of the maximum two points. The intent here is to reduce ozone depletion. It is surprising that certified buildings did not achieve a higher percentage of the maximum two points, since most new facilities use appropriate equipment [21].
“EA6—Green power”, which encourages the development and use of grid-source and renewable energy technologies received 50% of the maximum two points (Table 3). This credit requires that at least 35% of the electricity usage be offset with a minimum commitment of two years. Strategies that can be used to achieve this credit include use of renewable energy credits (RECs) and signing up for green power programs. The cost and availability of these methods are the major factors affecting the decision to pursue this credit [24].
Only 34% of the maximum three points offered by “EA5—Measurement and verification” was achieved in the buildings studied. Despite the frequent use of energy efficient technologies and equipment, the gap between actual and targeted performance was not measured extensively in the buildings considered in the study.
Finally, Table 3 also shows that the credit that was least well addressed in the certified buildings considered in this study was “EA2—On-site renewable energy credit” with 22% of the maximum seven points achieved on average (Table 3). This corresponds to as little as 1.6 out of the maximum seven points. LEED promotes the “EA2—On-site renewable energy” credit to encourage the use of renewable energy technologies in sustainable construction because there is evidence that the adverse environmental impacts of renewable energy technologies are much lower compared to conventional energy technologies. Several alternative energy sources can be adopted such as the use of sunlight, wind, geothermal sources, and even tidal and ocean waves. The factors that contribute to achieving lower points in this credit can be related to difficulties in producing renewable energy economically and technical risks involved in rather novel renewable technologies [25].
As seen in Table 1, the thresholds and maximum achievable points have been slightly modified in LEED v4. For example, “EA2—Optimizing energy performance” that can receive up to 19 points in LEED-NC 2009, can get a maximum of 18 points in LEED v4. The analysis presented above and in later sections is not diminished by these differences because both LEED-NC 2009 and LEED v4 address the same energy and atmosphere issues.
3.2. PMPs Attained in Each Credit by Certification Level
Analyzing the percent of maximum points (PMP) in each credit in Section 3.1 does not consider the differences between different certification levels (silver, gold, platinum). The findings in Table 3 outline the general application trends when certification levels are analyzed all together. However, there can be significant differences in the preferences of users when they attempt to earn points for different certification levels. For example platinum level requires a minimum of 80 points whereas silver level can be achieved with a minimum 50 points. In this section, PMP values are determined for each credit with respect to certification levels, and analyzed to understand how PMP values differ between levels, hence pointing out the commonly pursued credits in each certification level.
3.2.1. PMPs within Certification Levels
Table 4 shows the descriptive statistics, the number of buildings that earned “zero” and the maximum points earned for each certification level. The trends in Figure 1 show that, as expected, more points were earned at platinum level than gold level, and more points were earned at gold level than silver level in all Energy and Atmosphere credits. There seems to be reasonable consensus between gold and silver levels with almost parallel trend lines, while at platinum level, a different trend is noted.
The results of the analysis show that silver certified projects do not achieve high scores in any of the credits in the Energy and Atmosphere category. Many buildings received zero points. For example, in EA2—On-site renewable energy, EA3—Enhanced commissioning, EA4—Enhanced refrigerant management, EA5—Measurement and verification, and EA6—Green power, the number of buildings scoring zero ranged between 369 and 640. According to Figure 1, “EA3—Enhanced commissioning” was found to be the most convenient credit to pursue when silver certification is desired, with 55% of the maximum points in EA3 obtained in projects that aimed for silver certification (Table 4). This result concurs with the distribution presented in Table 1 that shows that EA3 allows easy points probably because commissioning services are used often. On the other hand, Figure 1 also shows that “EA1—Optimizing energy performance” (not EA3) was the most convenient credit to pursue when platinum and gold certifications are sought, with a PMP of 94% and 62%, respectively, similar to the findings obtained by Todd et al. [8] and Da Silva and Ruwanpura [13]. As stated in Table 1, EA1 solely accounts for the major portion of the energy and atmosphere credits (19 of the 35 points) and as such is an obvious target when platinum or gold certifications are desired since both require a large number of points. For example, as seen in Table 4, 89 out of the 129 platinum certified buildings (70%) attained the maximum achievable 19 points.
EA2 is related to installing on-site renewable energy means to cover the specified amount of energy required during the life cycle of a building. However, Figure 1 shows that only projects pursuing platinum certification attained a significant number of points in this credit (80% of the maximum seven points). Projects that sought gold and silver certifications attained the lowest percent of points (26% and 9%, respectively) compared to other credits. Platinum certification seekers prefer to get their points from credits with highly achievable points, namely “EA1—Energy performance” which offers a maximum of 19 points, and “EA2—On-site renewable energy technologies” which offers a maximum of seven points. Gold and silver certification seekers, on the other hand, prefer not to take advantage of the seven points of “EA2—On-site renewable energy technologies” because these technologies require additional sizeable investments.
The remaining credits in this category (i.e., EA4–6) can provide two or three points each, the sum of which accounts for a relatively small portion of the Energy and Atmosphere category. It was found in Figure 1 that “EA4—Enhanced refrigerant management” has received close achievement percentages in platinum, gold and silver-certified buildings with 59%, 55% and 51%, respectively. It is surprising that platinum-certified buildings, which have to use the most advanced technologies, methods and tools to earn the largest number of points record achievements as low as the points received by gold and silver-certified buildings. This can be related to platinum-certified buildings investing more in the first two credits (EA1 and EA2) jointly that amount to a maximum of 26 points corresponding to 74% of the points in the Energy and Atmosphere category. Another outcome of the analysis is that more points are obtained in “EA5—Measurement and verification” in buildings with platinum certification, compared to fewer points in gold and silver-certified buildings. Given the fact that they have to obtain a larger number of points, projects seeking platinum certification need to focus on discrepancies between actual and intended energy consumption.
3.2.2. PMPs between Certification Levels
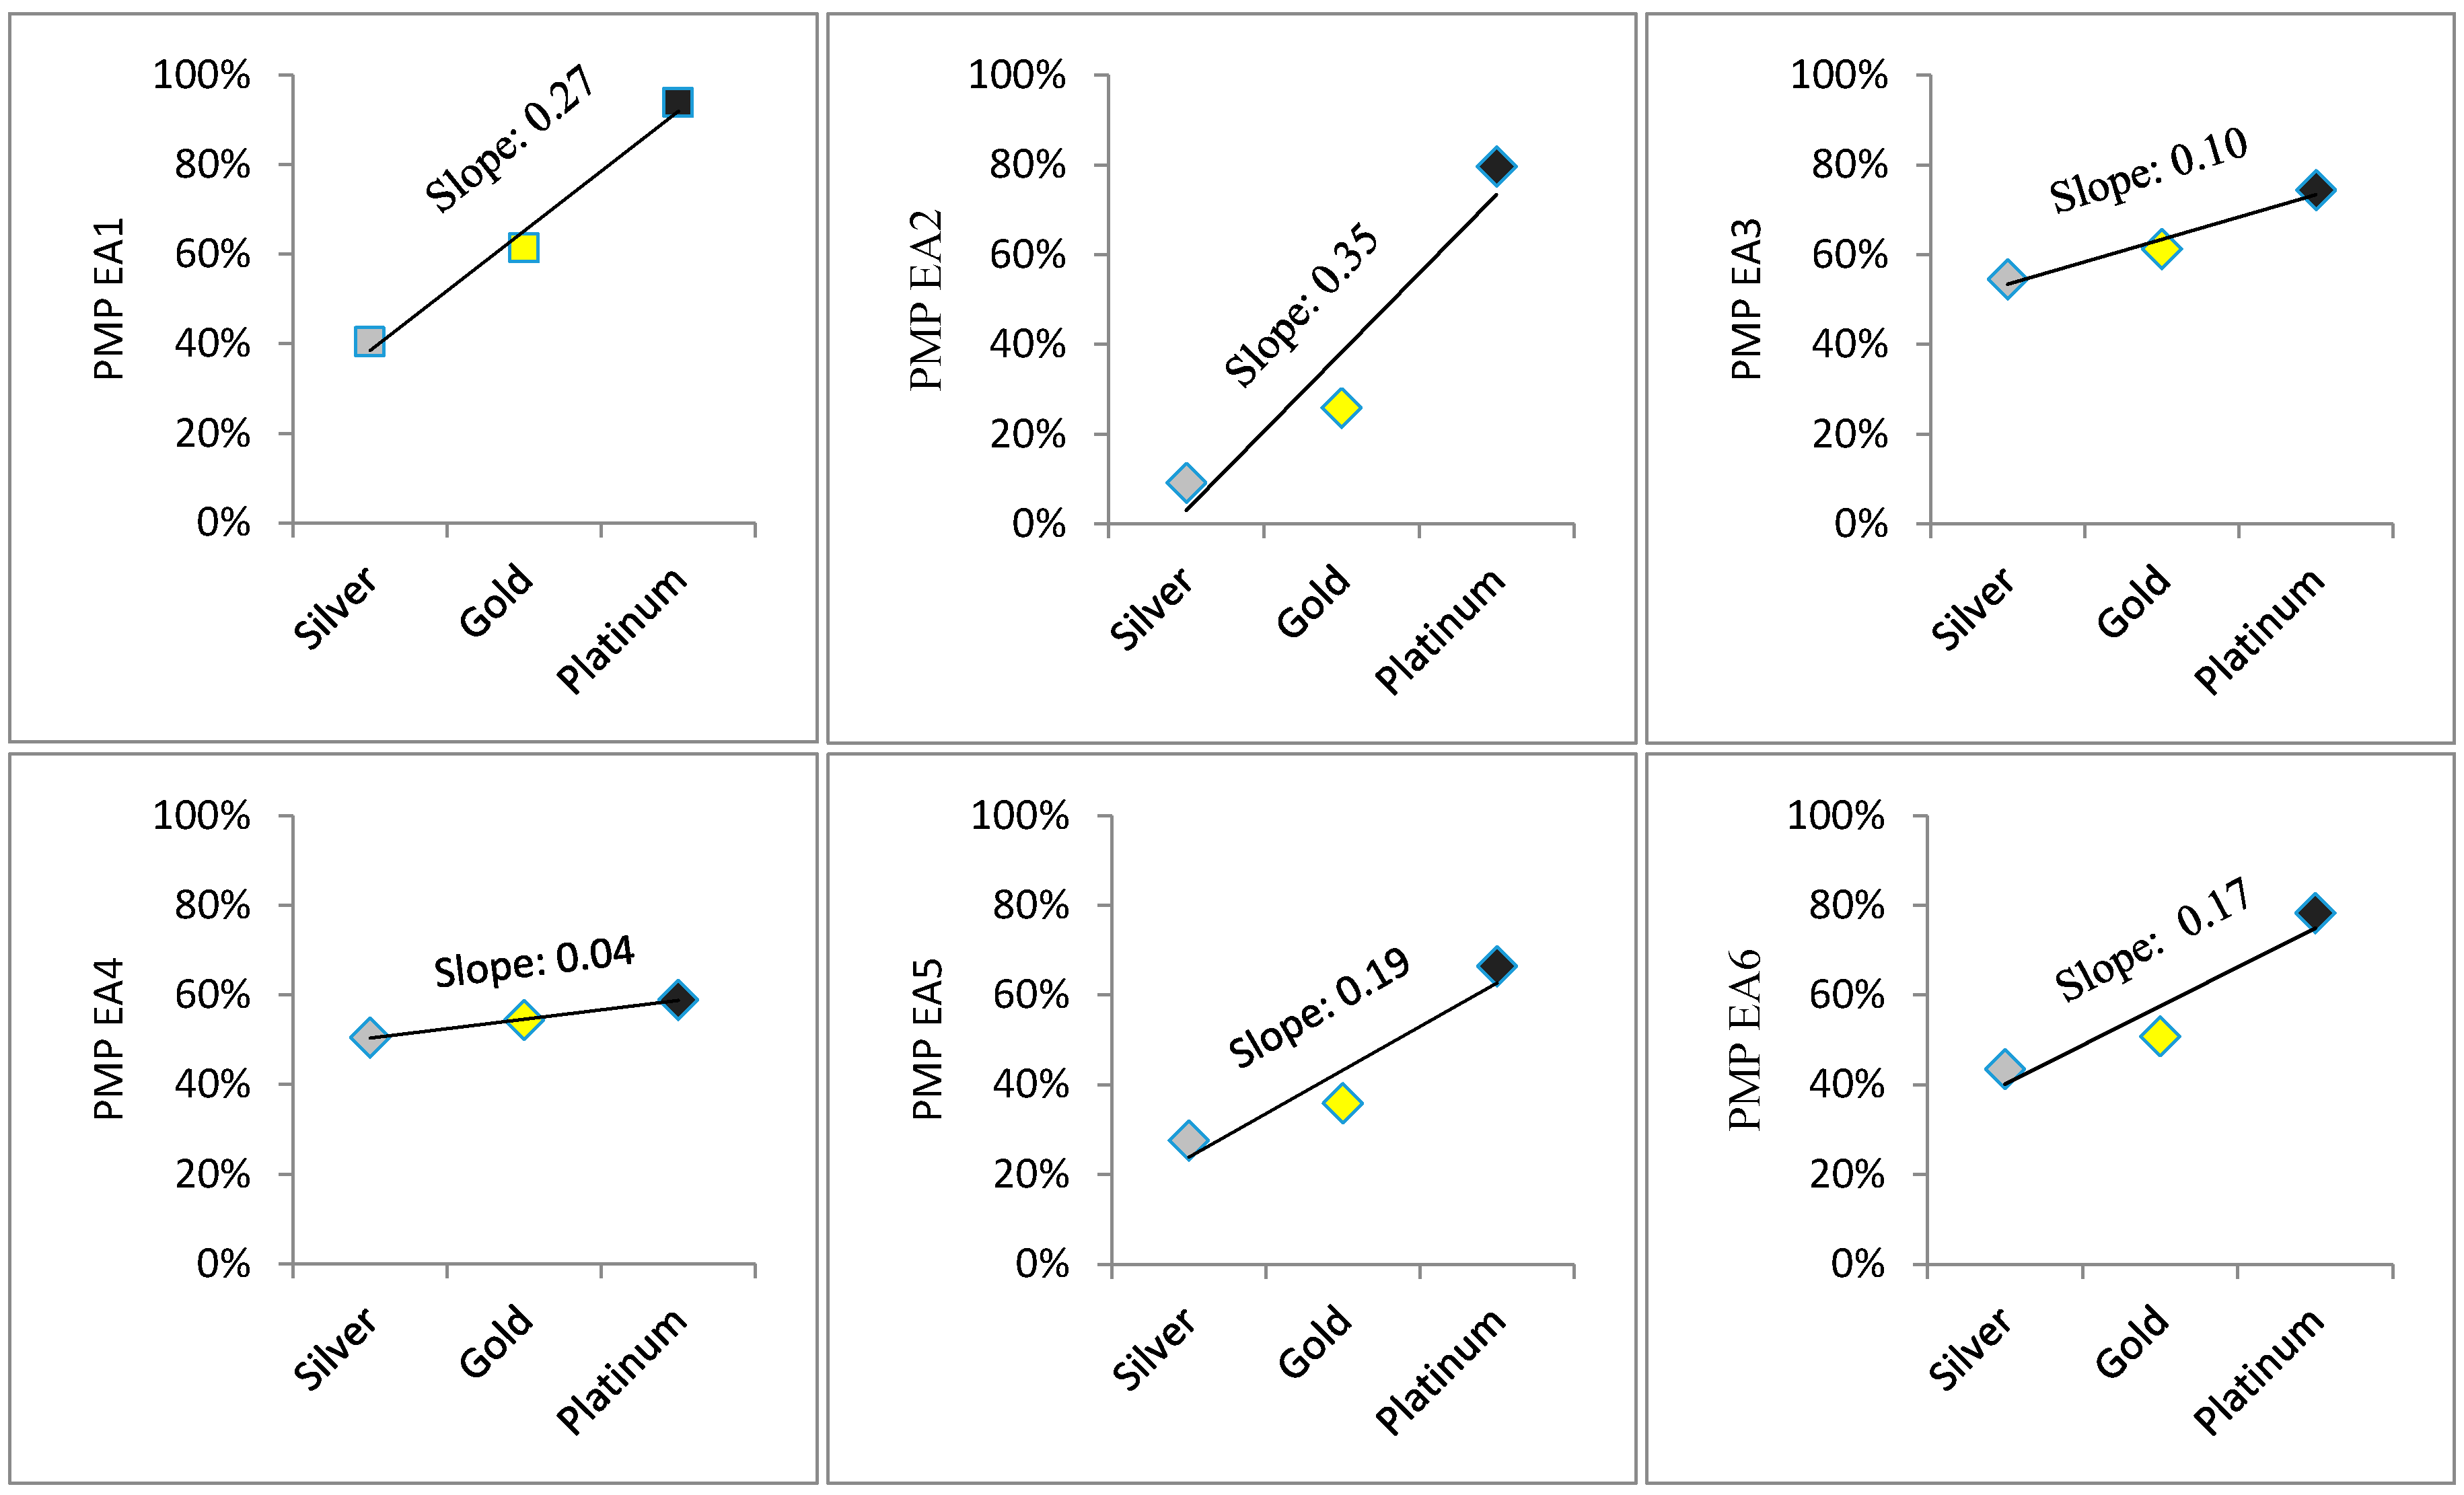
In order to quantify the differences between certification levels, the silver, gold, and platinum certifications were represented by an approach similar to the approach Ma and Cheng [9] used in their study. In this approach, 1 represents silver, 2 gold, and 3 platinum certification. A linear regression line is defined to find the slope of PMP and certification levels, shown in Equation (2):
where PMP is the percent of maximum points achieved, L denotes the certification levels, and is the error term. The slopes of the six Energy and Atmosphere credits are shown in Figure 2. As an example, the percent maximum point (PMP) of “EA2—On-site renewable energy” for silver, gold and platinum-certified buildings was 9%, 26%, and 80%, respectively (Figure 3). According to regression analysis results, this credit exhibited the highest differences between certification levels, having the steepest slope of 0.35 of all credits. In other words, this credit was exploited at platinum level rather than lower levels, resulting in a steeper than in other credits. The flattest slope was attained in “EA4—Enhanced refrigerant management” as 0.04. This value confirms the findings in the previous section that this credit received close achievement percentages regardless of certification levels.
3.3. PMP by Building Ownership
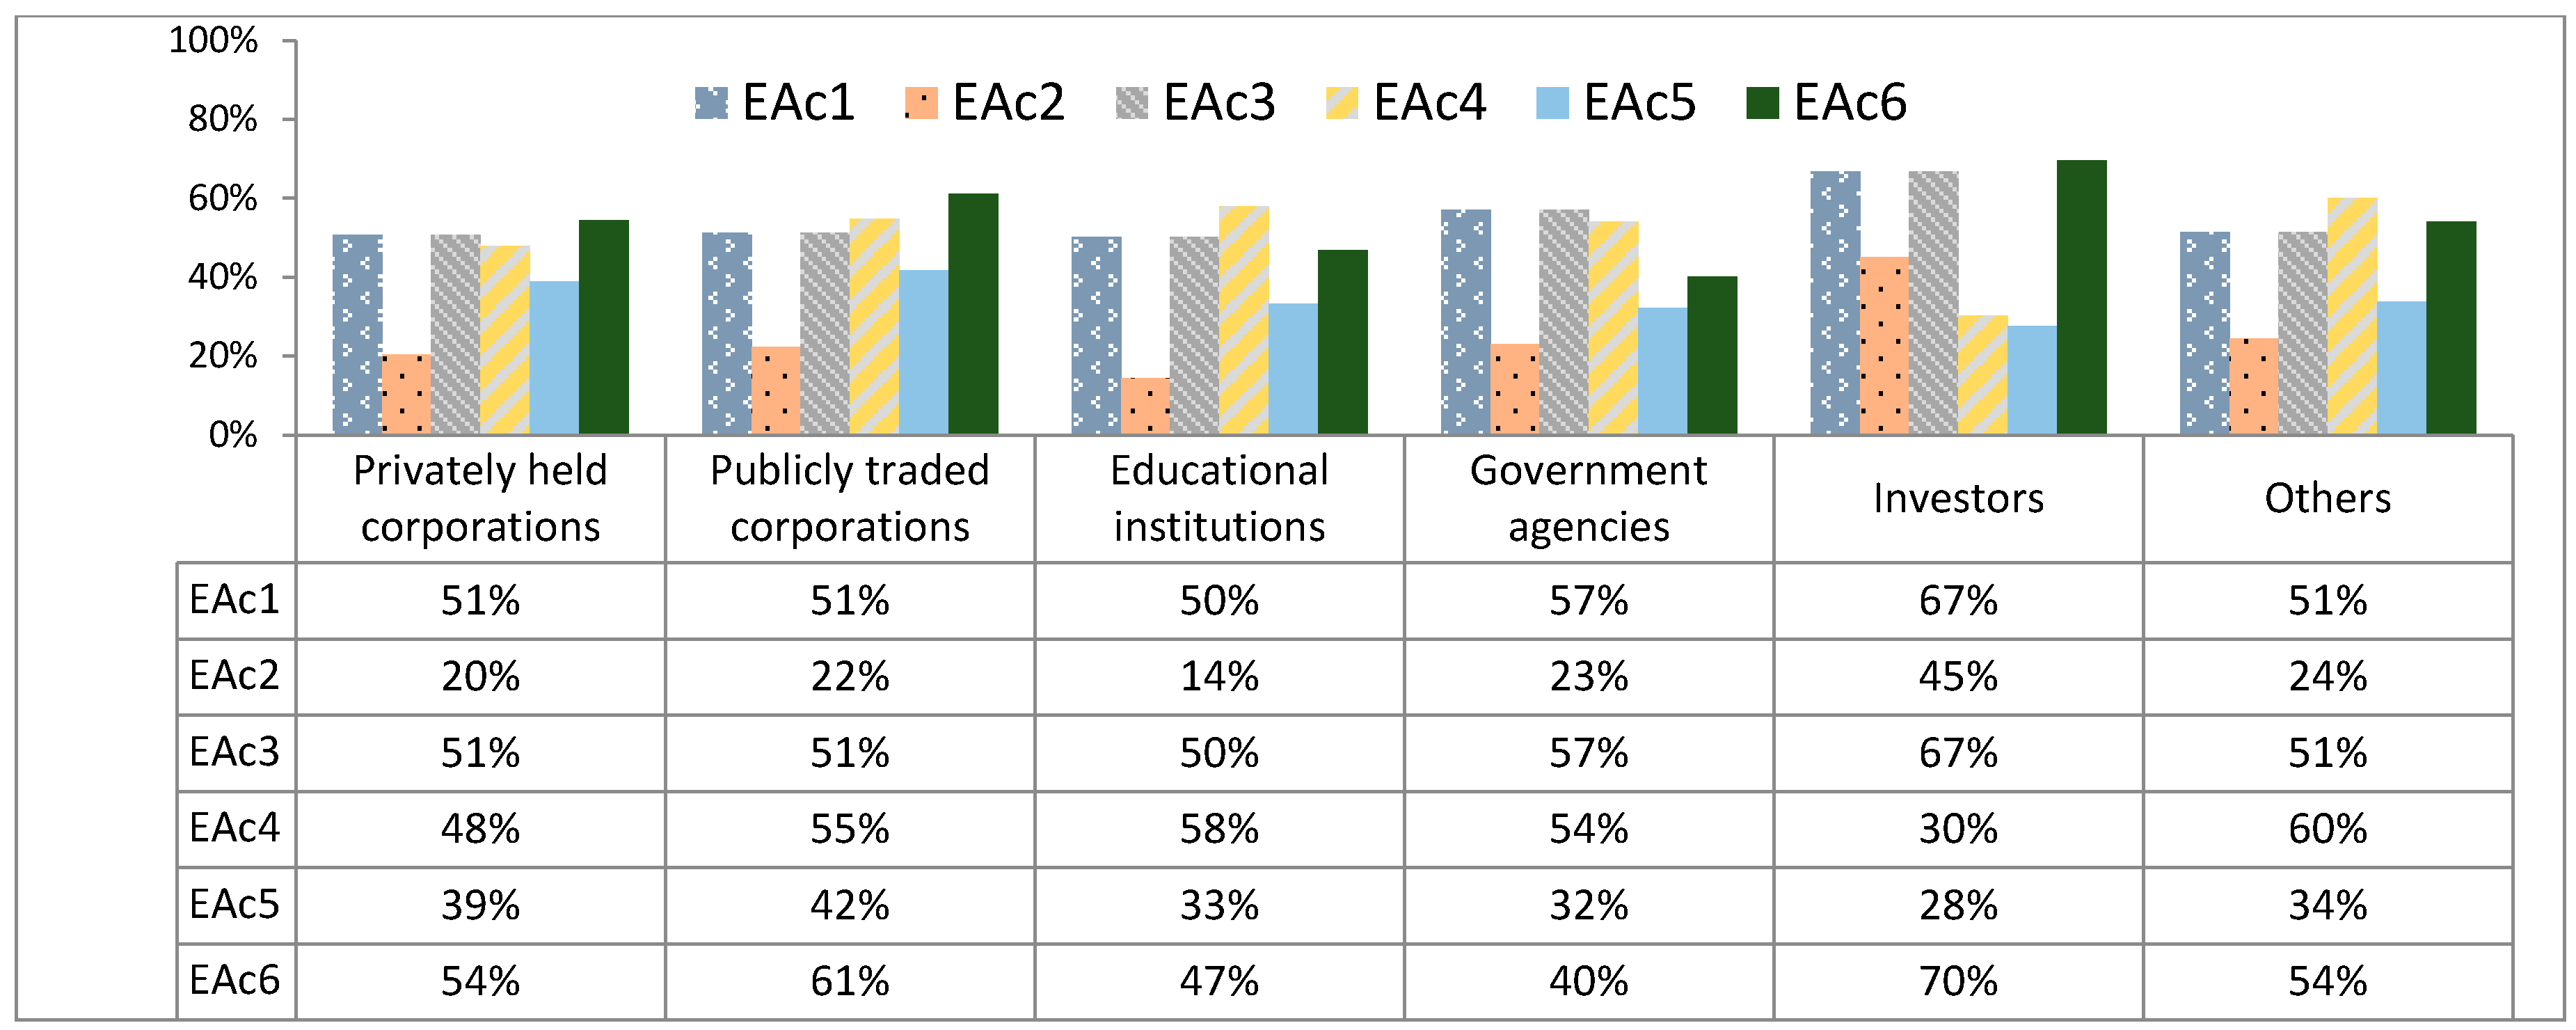
Sectors with a growing number of certified buildings include education, government, industrial, office, healthcare, hospitality, and retail [26]. In this section, the building inventory was analyzed by looking into differences in PMPs by building ownership. Table 5 illustrates the number of LEED-certified buildings by building ownership, based on the classification in the USGBC project database. Corporate owners are privately held or publicly traded. Educational institutions represent both public and private facilities including colleges, k12 schools, and universities. Government buildings involve all buildings owned by federal, state, and local (city and county) governments. Investors consist of banks, individuals, and both publicly traded and non-traded real estate investment trusts. The projects which do not fit in any of these classes are grouped as others.
PMP values based on building ownership defined in USGBC’s database are illustrated in Figure 3 for each credit in the Energy and Atmosphere category. There are six credits in the Energy and Atmosphere category of LEED-NC 2009 and six different building owner types.
Several researchers conducted statistical analysis to compare the achievements in credits in the assessment of LEED-certified buildings. Kim and Cheung [12] analyzed 43 LEED-NC-certified buildings using ANOVA to test if there were statistical differences in the mean points obtained in different credits. They also conducted Tukey’s post hoc test to analyze the differences in pairwise comparisons. Lee and Guerin [27] compared the credits in the Indoor Environmental Quality category relative to five different office types with uneven sample sizes. Choi et al. [28] used ANOVA to investigate the economic impacts that two LEED-certified public transportation access facilities have on the appraised values of land parcels. In our study, since the distribution of existing data does not satisfy the requirements of parametric tests, the Kruskal–Wallis test was used to assess differences in PMP values relative to building ownership. The Kruskal–Wallis test is a non-parametric test of one-way analysis of variance on ranks, which is a procedure that makes minimal assumptions about the underlying distribution of the data. The null hypothesis was that the means of PMP values do not significantly differ from each other between owner types. The results obtained using the Statistical Package for Social Sciences (SPSS) indicated that PMP values differed between different building ownerships for all credits, having asymptotic significance values less than 0.05 (Table 6). The results indicate that the means of the achieved values are statistically different between building owners in only in the “EA5—Measurement and verification” credit.
The Kruskal–Wallis test was followed by Bonferroni’s Mann–Whitney post-hoc test to compare the mean points in pairs of buildings with different ownership. This is a non-parametric test for comparing two independent groups and if the Bonferroni result is lower than the selected significance value, it can be assumed that the means of the groups are significantly different than the others. The results are tabulated and statistically significant differences are bolded in Table 7. It can be seen that some pairwise differences of the mean points obtained by buildings with different ownership are statistically significant at α = 0.10. For example, for “EA2—On-site renewable energy”, PMP values earned by buildings owned by privately held corporations significantly differ from buildings owned by educational institutions and investors with values 0.0747 and 0.0000, respectively (Table 7). This result can be verified by PMP values shown in Figure 3, where the PMP value is 20% for privately held corporations, while PMP values for educational institutions and investors are 14% (lowest value) and 45% (highest value).
4. Discussion of the Findings
The findings of this study are discussed in this section by category (EA1 to EA6), always in the light of the literature relevant to the issues discussed. In other words, the statements about the reasons and/or impacts of the findings are not based on speculation, but on a thorough discussion that draws extensively from past research.
EA1—Optimize Energy Performance
In LEED-NC 2009, the EA1 credit references the ASHRAE 90.1-2007 standard. To reduce environmental and economic impacts, the EA1 credit aims to achieve high levels of energy performance beyond the prerequisite mentioned in the ASHRAE standard. As seen in Table 1, EA1 consists of minimum energy cost savings, each of which deserves different points. It has the maximum achievable points of 19 for all contributions in the Energy and Atmosphere category in LEED-NC 2009. Therefore, it is important for LEED managers to focus on this credit for earning higher points. There are several strategies adopted by project owners and developers to earn points. For example:
- Cedar Rapids Public Library in Iowa targeted platinum certification after being damaged by a major flood. For this purpose, energy and cost-saving features were integrated into the building and roof design [29]. Setting the Iowa Energy Code standards as a baseline, it was aimed to exceed the baseline by 55%. This was achieved by several strategies such as strategic location of windows, solar light tubes, exterior sunscreens, and use of high-efficiency T5 HE florescent bulbs [22]. Also, storm water on site was effectively managed. As a result, the maximum achievable 19 points were earned, which contributed a great deal to obtaining platinum certification.
- University of Arkansas at Little Rock constructed a new residential student housing with sustainable attributes. Highly efficient HVAC and lighting systems were used to reduce the consumption of energy by 32% [30]. This implementation provided cost savings through energy efficiency and brought 10 points to the project, which at the end was awarded a gold certificate.
- The Sarasota National Guard Armory in Florida earned 14 points out of 19 by implementing a combination of highly efficient lighting and HVAC system designs [31]. In this project, LED fixtures were selected for all internal and external lighting. The control of lighting was further enhanced by an advanced automation system. The building received silver certification.
Further suggestions for energy efficiency include improving equipment efficiency, such as increased duct size leading to reduced fan power requirements, variable frequency drives for motors, condensing stack boilers, and sophisticated controls [21]. Projects aiming to achieve higher energy efficiency can benefit not only from the financial and environmental implications, but also can earn more points in this credit. According to Table 4, all platinum-certified projects earned points in EA1 with 89 of 129 platinum-certified projects earning the maximum 19 points. However, the findings indicate that there are a few buildings that received zero points in EA1 (14 buildings with silver certification, and one building with gold certification). In such cases, the projects tend to compensate with points earned in other credits.
Earning higher points in this category mostly depends on targeted energy efficiency in the project. Therefore, it would be useful for project owners, managers, and LEED consultants to calculate the costs and benefits of implementing different alternatives, and then make a decision about the implementation that promote sustainability goals in the most cost effective way. Figure 3 shows the achieved percentages of the maximum points in each credit categorized by building ownership. Projects owned by investors and government agencies attain higher percentages than projects owned by other types of owners (Figure 3). The Bonferroni post-hoc test results presented in Table 1 show that the differences are consistently and statistically significant at α = 0.10. This finding can be the result of investors and government agencies generally occupying the constructed facilities themselves rather than immediately selling or renting, and expecting economic benefits in the long run. Buildings under the other types of ownership display achievement rates that are quite similar to each other, that fall around 51%, still not a low performance as it corresponds to cost savings in energy not less than 30%.
EA2—On-Site Renewable Energy
Energy consumption creates one of the most significant environmental impacts during a building’s life cycle [32]. Use of renewable energy is an option to overcome the adverse impacts. This credit’s objective is to promote the use of energy sources that are not depleted and to avoid the use of sources such as fossil fuels that can be depleted. The LEED system encourages the implementation of strategies that address on-site renewable energy policies that reduce the environmental and economic impacts related to the use of energy generated by fossil fuels. As seen in Table 1, the maximum number of points that a building can achieve is seven. EA2 specifies the percentage of on-site renewable energy for each point threshold. Several technologies and strategies can be used such as solar, wind, geothermal, low-impact hydro, biomass, and bio-gas [33]. Using on-site renewable energy in a project that aims to achieve LEED certification enhances the project’s green image and decreases the consumption of grid-purchased electricity [24]. Different cases exist where efforts were spent to produce on-site renewable energy with varying degrees of success. For example:
- The design of Project Vida Community Wellness Center, a platinum-certified building, included a photovoltaic array to produce approximately 40% of the energy necessary to operate the building and earned the maximum seven points in this credit [34].
- The SUNY-ESF College of Environmental Science & Forestry Gateway Center, another LEED platinum building also received the maximum seven points by designing a combined heat and power plant to produce 60% of campus heating needs and 20% of its electricity requirements using natural gas cogeneration, biomass, photovoltaic, and solar thermal systems [35].
- The Bend Broadband Vault project in Oregon, a gold-certified building, installed photovoltaic arrays and all power consumed that was not produced by the photovoltaic system was offset by renewable energy purchased through the Pacific Blue Sky Renewable Energy Program [36]. The implementation brought one point.
- Table 4 shows that out of the 129 platinum-certified buildings, only 8% (10 buildings) received zero, while 67% (86 buildings) scored the maximum seven points. Out of 617 gold-certified buildings, 66% (404 buildings) received zero, while 20% (121 buildings) scored the maximum seven points. If one considers the 747 silver-certified buildings, as many as 86% (640 buildings) received zero and only as few as 5% (39 buildings) earned the maximum seven points. These values show that buildings aiming at higher certification take better advantage of renewable energy sources.
The total investment in renewable energy is reported as $54.2 billion in 2013 in the US [37]. Although the US takes place in the list of top countries for total investment of installed renewable electric capacity, the “EA2—On-site renewable energy” credit is underutilized in LEED-certified buildings. Table 3 shows that the buildings that received zero points in EA2 correspond to 71% of the buildings in the analyzed set, indicating that renewable energy is not a credit that is vigorously pursued by owners, designers, and contractors probably because providers of on-site renewable energy are rare and because acquiring these new technologies is cumbersome and expensive. One of the main reasons for not using renewable energy systems more extensively is that investments require substantial implementation costs followed by a long period of recovering the invested capital through savings in utilities bills [25]. According to Karystas and Choropanitis [38], barriers against renewable energy systems can be classified as financial, technical, regulatory, and market related issues, such as lack of qualified personnel to install and promote the systems, limited space for installation and inadequate or unclear financing options.
Active solar energy methods (converting solar energy for heating and cooling), passive solar energy methods that take better advantage of local climate conditions (design of building, windows, walls and floors to keep heat in the winter and reject heat in the summer), and the use of wind and geothermal energy can contribute to lowering energy consumption costs [39]. However, economic and non-economic barriers such as high initial costs, low cost effectiveness, high technical risks, high market risks, and lack of specialized knowledge negatively affect the adoption of these systems [25,40,41].
Figure 3 shows the percentage of the maximum seven points achieved in EA2, categorized with respect to type of ownership. The highest percentage is recorded for investors. The Bonferroni post-hoc test confirms that the differences between investors and other types of owners are statistically significant. Figure 3 also shows that educational institutions underperform in this credit, achieving only 14% of the maximum points. It should also be noted that the maximum achievable point in this credit is lowered to three in LEED v4, from 7 in LEED-NC 2009, probably as a response to the generally low percentages observed in Figure 3.
EA3—Enhanced Commissioning
Commissioning is a verification process that a building undergoes to make sure that the design objectives and the owner’s requirements are in agreement. LEED-NC 2009′s intention is that the commissioning process be initiated early in the design phase and that additional activities be executed after the systems’ performance verification is completed. LEED v4 expands on this intent by further supporting the design, construction, and eventual operation of a building such that the owner’s project requirements for energy, water, indoor environmental quality, and durability are met. Both of these explanations suggest that the project’s energy, water, and indoor air quality systems and the exterior envelope assemblies and systems are designed, installed, and calibrated to perform according to the owner’s requirements, basis of design, and construction documents [42]. The operation of key systems in the building is checked systematically to close the gap between the design team and subcontractors. An independent commissioning agency is required for better objectivity. The scope of the commissioning process involves verification of heating, cooling, refrigeration, ventilation systems and controls, lighting and day-lighting controls, domestic hot water systems, and renewable energy systems [43].
The maximum achievable point in EA3 is two points in LEED-NC 2009, but is higher (between two and six points) for new construction in LEED v4. According to the information in Table 4, 41% of the buildings received zero points in all certification levels combined. This indicates that even though all buildings satisfy the fundamental commissioning prerequisite, not too many seek enhanced commissioning.
The commissioning of systems in buildings depends on the extent and complexity of the systems used in the building [44]. For example:
- Hillsborough Area Regional Transit 21at Avenue received silver certification and earned two out of the six points in this credit. The systems commissioned in the building consisted of an air cooled chiller, chilled water pumps, water handling units, energy recovery units, a chiller with an integral pumping package, air conditioning units in a computer room, exhaust/supply fans, and a water heater [45].
- The Bendbroadband Vault project is a data center building project in Oregon, which received gold certification. The project owner aimed to incorporate the most energy-efficient HVAC system possible due to heavy energy consumption in data centers. Complexities surrounding the mechanical and electrical systems were critical. However, challenging design strategies, such as integration of various control technologies, were implemented in early stages by the commissioning agent and the project received two points in this credit [36].
- Commissioning in the Largo Community Center in Florida, which is a platinum-certified building involved efficient mechanical, plumbing, and fire safety designs [45].
Fundamental commissioning is a prerequisite and is mandatory for LEED certification. “EA3—Enhanced commissioning” contributes additionally to the energy performance of the building. The possible benefits of enhanced commissioning include improved building system control and performance, improved efficiency and maintainability, early detection of potential problems, and improved occupant comfort and productivity [44,46]. On the other hand, commissioning is a costly process [47]. Owners typically select commissioning agents based on their fee, their qualifications, and their experience [20]. According to Figure 3, publicly traded corporations and educational institutions recorded the highest PMP compared to other owners.
Several researchers point out that the perception of additional costs and the lack of experience of project owners and contractors affect the use of commissioning services [13,25,48,49]. In addition, inadequacy in establishing and distributing a commissioning plan to project participants, and shortcomings in integrating a commissioning plan into the project schedule also constitute barriers to the implementation of this credit [50]. Continuing the trend in EA1 and EA2, buildings owned by investors seemed to achieve significantly higher points in EA3 also. The results of Bonferroni’s post-hoc test in Table 7 confirms this finding, which indicates that investors are more informed about commissioning services than other types of owners.
EA4—Enhanced Refrigerant Management
This credit accounts for two points. It intends to reduce ozone depletion, and to support early compliance with the Montreal Protocol while minimizing direct contributions to climate change. The credit basically aims at designing and operating without mechanical cooling and refrigeration systems [33]. If use of a mechanical system is essential, it suggests utilizing heating, ventilation, air conditinioing, and refrigerating (HVAC&R) systems for the refrigeration cycle, selecting equipment with reduced refrigerant charge and increased equipment life, maintaining equipment to prevent leakage of refrigerant to the atmosphere, and using fire suppression systems that do not contain Hydrochlorofluorocarbons (HCFCs) or halons. A prerequisite is also defined for fundamental refrigerant management in both versions of LEED.
According to the information presented in Table 4, buildings achieved 1.0, 1.1 and 1.2 points on average in silver, gold and platinum-certified buildings, respectively. These values correspond to 51%, 55%, and 59% of the maximum two points at each level, respectively. Compliance with this credit requires either avoiding refrigerants altogether or using HVAC systems that have low impact on ozone depletion and global warming. Despite the best of intentions, attaining points in this credit can be challenging, since higher efficiency equipment systems generally use larger heat exchangers and require larger refrigerant charges [51]. For example, the University of Texas at Austin decided to eliminate all CFC refrigerants in chiller systems and started a phase-out plan to convert from dichlorodifluoromethane (CFC-12) to Hydrochlorofluorocarbon-134a (HFC-134a) refrigerant. Also a refrigerant leakage detection and management process was launched to ensure that refrigerant leakage to the atmosphere is kept to a minimum [52]. Even though the use of complex formulas can act as a barrier to less experienced consultants [11], it is not difficult to achieve points if manufacturers provide compliant equipment [21]. According to Table 3 and Table 7, investor-owned buildings perform significantly better in EA4, again indicating that investors are more informed about alternative refrigerants than other building owners.
EA5—Measurement and Verification
This credit intends to provide ongoing accountability for building energy consumption over time. The difference between the intended and actual energy consumption should be tracked to evaluate the energy efficiency of the building. The accurate quantification of energy use is measured by installing metering equipment [33]. According to LEED-NC 2009, the measurement and verification period should cover at least one year of post-construction occupancy. This credit was revamped in LEED v4 and was renamed “advanced energy metering” [53].
The maximum contribution of this credit is three points (Table 1). According to Table 4, 0.8, 1.1 and 2.0 points were achieved on average in silver, gold and platinum-certified buildings, respectively. The number of projects with zero points in all three certification levels add up to 830 corresponding to 56% of the whole building inventory. Only 441 buildings (30%) earned the full three points. Such a finding indicates that in general, this credit is either underperformed or most of the time not performed at all. The cost of advanced meters and the cost of hiring consultants for the measurement and verification process can be the reasons why owners do not fully take advantage of this credit [54].
In order to earn points, a measurement and verification plan should be introduced to monitor the end uses in the building. Any discrepancies between actual energy use and the original model should be detected. For example:
- It was found in a police station that was constructed on the campus of the University of Massachusetts, Amherst that actual electricity use in the first year of occupancy was 70% more than modeled. After identifying HVAC/control issues, the contractor made corrections [54]. It is argued in this case that if full measurement and verification had been performed, the discrepancy and its causes might have been detected earlier.
- In another project at the University of Texas at Austin, building site metering and generation source metering were made available to establish a metric for cooling and combined heat and power systems [52]. The aim was to quantify and verify the performance of these systems. For example, each building’s chilled water consumption for cooling purposes was digitally metered. Similarly, steam and electricity consumption were also metered for heat and power facilities. These measures were collected and reported monthly to determine total thermal efficiency and electrical generation heat rate to compare actual energy use and the original model.
Table 7 indicates that, the points obtained by publicly traded corporation-owned buildings are significantly different from the points obtained by buildings with different ownership. Publicly traded corporation-owned buildings scored higher points in general, probably because they need to be transparent vis-à-vis their shareholders by putting in place measurement and reporting routines.
EA6—Green Power
This credit aims to encourage the development and use of grid-source, renewable energy technologies on a net zero pollution basis. It requires engagement in at least a two-year renewable energy contract to provide at least 35% of the building’s electricity from renewable sources, as defined by the Center for Resource Solutions’ Green-e Energy product certification requirements [33]. It corresponds to two points. The intent has been described similarly in LEED-NC 2009 and in LEED v4, but the term of the energy contract has been increased to five years in LEED v4 with the provision of at least 50% (earns one point) or 100% (earns two points) of the project’s energy from green power, carbon offsets, or renewable energy certificates. The newer version increases support for growth in clean energy.
According to the information presented in Table 4, platinum-certified buildings achieved an average of 1.6 out of the maximum points, whereas gold and silver-certified buildings attained only 1.0 and 0.9 points, respectively. Investors achieved a higher percentage than the other types of owners, a PMP value of 70% (Figure 3). Governmental buildings significantly underperformed in this credit and achieved lower points (Figure 3).
This credit encourages the use of off-site renewable energy, which can be administered by several options such as enrolling in the Green Power Program, selecting a Green-e-certified power provider, or purchasing Green-e-certified Renewable Energy Certificates (RECs) [55]. A REC represents the environmental attributes of the electricity produced from a renewable energy source and is a separate commodity from the electricity [56]. Each of these options has its own advantages and disadvantages. Enrolling in the Green Power Program is simple and monthly payment of bills is possible, but can be expensive; month-to-month enrollment can often be an option [24]. Selecting a Green-e-certified power provider may not be the most cost effective alternative and may not be regionally available, which usually results in a lack of communication and support [24]. Purchasing a REC can be often the least expensive option as it involves simple contracting procedures, but may not be regionally available. Thus, the strategies addressing a solution can change depending on project characteristics and location. Building energy and economic analysis software can be used to model a building’s base line and to support the decision of selecting the applicable option.
5. Summary and Conclusions
Energy efficiency is essential in sustainable construction. LEED-NC 2009 awards the largest portion of achievable points to the credits in the Energy and Atmosphere category. Energy and Atmosphere is the major driver for implementing sustainable solutions most of the time. Since a considerable amount of energy is used during the construction and occupation phases of a building project, efforts to reduce energy consumption are valued in the certification process. LEED is the most commonly used system for green building certification in the US. LEED-NC 2009 has been in effect for more than five years. The inventory of LEED-NC 2009-certified buildings in this study consists of 1500 buildings, far more than the number of buildings certified under the new version LEED v4. The large number of buildings considered provided an in-depth understanding of the efforts to earn points, and of how essential activities were practiced and rated in the industry. Pointing out challenges and barriers to credit realization can provide suggestions for improvement to move forward in green construction endeavors. Furthermore, discussing relevant examples can provide insights for future practices in green construction.
The performance of the project in energy aspects heavily relies on the owner/developer’s expectations of the building in addition to characteristics of the project. Concerns related to cost, particularly the amount of upfront cost of recent technologies for energy efficiency is considered to be the major issue in sustainable energy installations. The market and technical risks of the technologies used also contribute to the limited implementations resulting in fewer earned points. Still, significant savings in energy use in new buildings are possible using existing technologies [57]. The concerns also extend to non-economic barriers such as lack of technical expertise for advanced tools and services needed for improving energy efficiency.
Based on an analysis of 1500 LEED-NC 2009-certified project scorecards obtained from USGBC’s project directory, the following findings are highlighted in this study:
- The percent of the maximum achievable points (PMP) in the Energy and Atmosphere credits earned by the LEED-certified buildings considered in the study are ranked as “EA3—Enhanced commissioning” (59%), “EA1—Optimize energy performance” (54%), “EA4—Enhanced refrigerant management” (53%), “EA6—Green power” (50%), “EA5—Measurement and verification” (34%), and “EA2—On-site renewable energy” (22%). Project teams that obtained LEED-certification have often used commissioning services that are commonly available and economical (EA3), whereas they stayed away from difficult-to-obtain and costly on-site renewable energy (EA2) that may face technical, regulatory, and market related obstacles as well as limited space for installation [38].
- The number of points earned in Energy and Atmosphere credits depends on whether silver, gold, or platinum certification was sought. For example, linear regression analysis shows that platinum-certified buildings take full advantage of “EA2—On-site renewable energy” whereas silver-certified buildings practically ignore it. The credits that displayed the largest difference in the average points attained in different certification levels was “EA2-On-site renewable energy” credit followed by EA1, EA5, EA6, EA3, and EA4.
- The number of points that is earned in the Energy and Atmosphere credits is related to the type building ownership. The Kruskal-Wallis test shows statistically significant differences in the means. For example, investors mostly optimize energy efficiency (EA1), on-site renewable energy (EA2), enhanced commissioning (EA3), and green power (EAC6), whereas publicly held corporations perform better in measurement and verification (EA5).
The overall conclusions of the study include:
- Sustainable projects involve activities, implementations, and processes that might differ from traditional projects. There are several barriers in the green building certification process. Proceeding through the cumbersome certification process itself, using complex technological tools and services for higher energy efficiency, and considering renewable energy alternatives require adequate technical experience and background. These technical risks along with market-driven risks can influence the design and implementation of sustainable practices. These tools and services can also be seen as economic challenges, since they require additional and/or up-front costs for project owners. All of these challenges and barriers should be discussed at the design and construction stages, and appropriate strategies should be adopted to satisfy project owners’ expectations.
- Even though renewable power source investments in the US are substantial, on-site renewable energy solutions are not utilized extensively enough in LEED-NC 2009-certified projects in the US. The use of renewable energy can be encouraged by providing substantial incentives.
- Cost savings generated by energy efficient systems is one of the primary drivers of sustainable buildings. For this reason, all certification systems including LEED consider rating efforts that encourage the efficient use of energy. “EA1—Optimizing energy efficiency” is the credit that assesses these efforts in LEED-NC 2009. The analysis shows that the majority of the LEED-certified buildings benefitted from this credit in different proportions. Regardless of the points earned and certification levels (platinum, gold, silver), cost savings through energy efficiency have been achieved in many of the projects, as well as lower adverse environmental impacts, hence fulfilling the original intent of the “EA1—Optimizing energy efficiency” credit in LEED-certified projects.
- Alternative rating tools have been developed and used in different countries, providing guidelines for sustainable construction to practitioners in those countries. According to Berardi [15], building energy performance is the most important but the least achieved criterion in the currently available sustainability rating systems when compared to criteria such as water efficiency or indoor air quality. LEED is one of the most commonly used rating tools, not only in the US but also in other regions of the world. As in most rating systems, energy issues constitute an important part of the requirements of LEED (about a third of the total achievable points in LEED-NC 2009). Building “green” is a growing trend in the construction sector and rating systems like LEED facilitate this endeavor, but the findings indicate that optimizing energy performance (EA1) and using non-depletable energy sources (EA2) are hard to achieve especially if the objective is a rather modest silver certification.
This study aimed to analyze information about LEED-NC 2009 silver, gold and platinum-certified buildings in the US. The findings indicate that not all Energy and Atmosphere credits receive equal treatment by project owners. A larger percentage of the maximum achievable points is attained in some credits depending on the level of certification and on the type of ownership. Practitioners who recognize those differences are expected to be in a better position when making decisions in sustainable building design and construction. The limitation of this study is that it analyzes only one of the credit categories of LEED. For an overall understanding of sustainable construction practices, achievements in other categories can and should be assessed too. Therefore, further studies may involve the evaluation of credits in categories other than Energy and Atmosphere for an overall understanding of sustainable construction practices. Also, this study covers buildings constructed only in the US. Energy efficiency practices for LEED certification in countries other than the US can be reviewed for a worldwide analysis.
Conflicts of Interest
The authors declare no conflicts of interest.
References
- Intergovernmental Panel on Climate Change, Climate Change in 2014. Available online: https://www.ipcc.ch/pdf/assessment-report/ar5/syr/SYR_AR5_FINAL_full_wcover.pdf (accessed on 8 February 2017).
- United States Environmental Protection Agency. 2014. Available online: https://www.epa.gov/ghgemissions/sources-greenhouse-gas-emissions (accessed on 8 February 2017).
- Gonzalez, A.B.R.; Diaz, J.J.V.; Caamano, A.J.; Wilby, M.R. Towards a universal energy efficiency index for buildings. Energy Build. 2011, 40, 980–987. [Google Scholar] [CrossRef]
- Robichaud, L.B.; Anantatmula, V.S. Greening project management practices for sustainable construction. J. Manag. Eng. 2011, 27, 48–57. [Google Scholar] [CrossRef]
- Anderson, M.K.; Bidgood, J.K.; Heady, E.J. Hidden risks of green building. Fla. Bar J. 2010, 84, 35–41. [Google Scholar]
- USGBC. Benefits of Green Building. 2017. Available online: http://www.usgbc.org/projects (accessed on 13 September 2017).
- Illankoon, I.M.C.S.; Tam, V.W.Y.; Le, K.N.; Shen, L. Key credit criteria among international green building rating tools. J. Clean. Prod. 2017, 164, 209–220. [Google Scholar] [CrossRef]
- Todd, J.A.; Pyke, C.; Tufts, R. Implications of trends in LEED usage: Rating system design and market transformation. Build. Res. Inf. 2013, 41, 384–400. [Google Scholar] [CrossRef]
- Ma, J.; Cheng, J.C.P. Data-driven study on the achievement of LEED credits using percentage of average score and association rule analysis. Build. Environ. 2016, 98, 121–132. [Google Scholar] [CrossRef]
- Cheng, J.C.P.; Ma, J. A study of the relationship between credits in the LEED-EB & OM green building rating system. IACSIT Int. J. Eng. Technol. 2013, 5, 438–442. [Google Scholar]
- Sullivan, K.T.; Oates, H.D. Analysis of Arizona’s LEED for new construction population’s credits. J. Constr. Eng. Manag. 2012, 138, 1386–1393. [Google Scholar] [CrossRef]
- Kim, J.; Cheung, S.L. Evaluation of green project rating system for new construction projects. In Proceedings of the Integrating Sustainability Practices in the Construction Industry, Kansas City, MO, USA, 23–25 March 2011. [Google Scholar]
- Da Silva, L.; Ruwanpura, J.Y. Review of the LEED points obtained by Canadian building projects. J. Arch. Eng. 2013, 5, 38–54. [Google Scholar] [CrossRef]
- Wu, P.; Song, Y.; Shou, W.; Chi, H.; Chong, H.Y.; Sutrisna, M. A comprehensive analysis of the credits obtained by LEED 2009 certified green buildings. Renew. Sustain. Energy Rev. 2017, 68, 370–379. [Google Scholar] [CrossRef]
- Berardi, U. Sustainability assessment in the construction sector: Rating systems and rated buildings. Sustain. Dev. 2012, 20, 411–424. [Google Scholar] [CrossRef]
- Wu, P.; Song, Y.; Wang, J.; Wang, X.; Zhao, X.; He, Q. Regional variations of credits obtained by LEED 2009 certified green buildings—A country level analysis. Sustainability 2018, 10, 20. [Google Scholar] [CrossRef]
- Ma, J.; Cheng, J.C.P. Analysis of the related credits in LEED green building rating system using data mining techniques. In Proceedings of the International Conference on Computing in Civil and Building Engineering, Orlando, FL, USA, 23–25 June 2014. [Google Scholar]
- Kantora, M.; Saari, A. Commissioning for nearly zero-energy building projects. Constr. Innov. 2014, 14, 373–382. [Google Scholar]
- Kuo, R.; Low, B. Comprehensive commissioning benefits for building owners during design, construction, and beyond. In Proceedings of the Port Planning and Development, Seattle, WA, USA, 12–15 June 2016. [Google Scholar]
- Elzarka, H.M. Best practices for procuring commission services. J. Manag. Eng. 2007, 25, 155–164. [Google Scholar] [CrossRef]
- Langdon, D. Cost of Green Revisited. 2007. Available online: http://sustainability.ucr.edu/docs/leed-cost-of-green.pdf (accessed on 10 August 2016).
- Cedar Rapids Public Library. 2015. Available online: http://connect.crlibrary.org/tag/leed-platinum-library (accessed on 15 August 2016).
- Moeck, M.; Yoon, Y.J. Green buildings and potential electric light energy savings. J. Arch. Eng. 2004, 10, 143–159. [Google Scholar] [CrossRef]
- 3Degrees. Demystifying the On-site/Off-site Renewable Energy Credit for LEED®. 2012. Available online: https://www.usgbc-ncc.org/storage/documents/Presentations/SAC/2012-1-19_demystifying.pdf (accessed on 21 June 2015).
- Kashani, H.; Ashuri, B.; Shahandashti, S.M.; Lu, J. Investment valuation model for renewable energy systems in buildings. J. Constr. Eng. Manag. 2015, 141. [Google Scholar] [CrossRef]
- USGBC. Green Building Facts. 2009. Available online: http://www.usgbc.org/articles/green-building-facts (accessed on 10 August 2015).
- Lee, Y.S.; Guerin, D.A. Indoor environmental quality differences between office types in LEED-certified buildings in the U.S. Build. Environ. 2010, 45, 1104–1112. [Google Scholar] [CrossRef]
- Choi, K.; Son, K.; Woods, P.; Park, Y.J. LEED public transportation accessibility and its economic implications. J. Constr. Eng. Manag. 2012, 138, 1095–1102. [Google Scholar] [CrossRef]
- OPN Architects. 2015. Available online: http://www.opnarchitects.com/work/cedar-rapids-public-library-downtown/ (accessed on 9 March 2015).
- USGBC. LEED BD + C: New Construction v3—LEED 2009. UALR West Hall. 2017. Available online: http://www.usgbc.org/projects/ualr-west-hall (accessed on 15 August 2017).
- USGBC. LEED BD + C: New Construction v3—LEED 2009. Sarasota National Guard Armory. 2017. Available online: http://www.usgbc.org/projects/sarasota-national-guard-armory (accessed on 15 August 2017).
- Komurlu, R.; Arditi, D.; Gurgun, A.P. Applicability of LEED’s energy and atmosphere category in three developing countries. Energy Build. 2014, 84, 690–697. [Google Scholar] [CrossRef]
- LEED-NC. LEED 2009 for New Construction and Major Renovations; LEED: Washington, DC, USA, 2009. [Google Scholar]
- Builduncommon.com. Project Vida Community Center. 2015. Available online: http://builduncommon.com/wp-content/uploads/2013/12/VIDA-Case-Study_Final.pdf (accessed on 13 August 2016).
- USGBC. LEED BD + C: New Construction v3—LEED 2009. SUNY-ESF Gateway Center. 2017. Available online: http://www.usgbc.org/projects/suny-esf-gateway-center?view=overview (accessed on 1 August 2017).
- USGBC. LEED BD + C: New Construction v3—LEED 2009. BendBroadband Vault. 2017. Available online: http://www.usgbc.org/projects/bendbroadband-vault (accessed on 13 July 2017).
- REN21. Renewables 2014 Global Status Report. 2014. Available online: http://www.ren21.net/portals/0/documents/resources/gsr/2014/gsr2014_full%20report_low%20res.pdf (accessed on 3 June 2015).
- Karytsas, S.; Choropanitis, I. Barriers against and actions towards renewable energy technologies diffusion: A Principal Component Analysis for residential ground source heat pump (GSHP) systems. Renew. Sustain. Energy Rev. 2017, 78, 252–271. [Google Scholar] [CrossRef]
- Lipu, M.S.H.; Jamal, T.; Karim, T.F. An approach towards sustainable energy performance by green building: A review of current features, benefits and barriers. Int. J. Renew. Sustain. Energy 2013, 2, 180–190. [Google Scholar] [CrossRef]
- Luthra, S.; Kumar, S.; Garg, D.; Haleem, A. Barriers to renewable/sustainable energy technologies adoption: Indian perspective. Renew. Sustain. Energy Rev. 2015, 41, 762–776. [Google Scholar] [CrossRef]
- Kim, K.; Lee, D.J.; Park, S.; Zhang, Y.; Sultanov, A. Measuring the efficiency of investment for renewable energy in Korea using data envelopment analysis. Renew. Sustain. Energy Rev. 2015, 47, 694–702. [Google Scholar] [CrossRef]
- Enck, J. LEED 2012 Commissioning. Available online: http://webcache.googleusercontent.com/search?q=cache:XWVoNwJam7EJ:www.commissioning.org/downloads/2011/Enck_LEED_2012_Cx.ppt+&cd=3&hl=tr&ct=clnk&gl=tr (accessed on 14 August 2016).
- LEEDuser, NC-2009 EAp1: Fundamental Commissioning of Building Energy Systems. 2015. Available online: http://www.leeduser.com/credit/nc-2009/eap (accessed on 13 August 2016).
- Portland Energy Conservation INC. Establishing Commissioning Costs. 2002. Available online: http://labs21.lbl.gov/DPM/Assets/PECI%20newconst%20commissioning%20costs.pdf (accessed on 14 April 2016).
- Consulting Engineering Associates, Inc. LEED/Commissioning (Cx) Projects. 2015. Available online: http://cea-engineers.com/leed.htm (accessed on 16 June 2016).
- Sullivan, J.G. Decision Model for Public Sector Assessment of Sustainable Buildings in Florida. Ph.D. Thesis, University of Florida, Gainesville, FL, USA, 2007. [Google Scholar]
- D’Antonio, P.C. Costs and benefits of commissioning LEED-NCTM buildings. In Proceedings of the National Conference on Building Commissioning, Chicago, IL, USA, 2–4 May 2007. [Google Scholar]
- Mapp, C.; Noce, M.C.; Dunbar, B. The cost of LEED—An analysis of the construction costs of LEED and Non-LEED banks. J. Sustain. Real Estate 2011, 3, 254–273. [Google Scholar]
- Lohiya, G. Contractors and LEED credits: Towards sustainable construction. In Proceedings of the Developing the Frontier of Sustainable Design, Engineering, and Construction, Fort Worth, TX, USA, 7–9 November 2012. [Google Scholar]
- Szydlik, C. Identifying and Overcoming the Barriers to Sustainable Construction; Ph.D. Thesis, Missouri University of Science and Technology, Rolla, MO, USA, 2014. [Google Scholar]
- Hsieh, C. Top Ten Frequently Asked Questions (FAQ) on LEED and HVAC. Available online: http://www.trane.com/Commercial/Uploads/PDF/978/News-%20LEED%20&%20HVAC-%20Top%20Ten%20FAQs.pdf (accessed on 21 March 2015).
- Reid, R.; Thompson, R. The Utilities and Energy Management Department Carl J Eckhardt Heating and Power Complex, Supporting the District and Energy Requirements of LEED0NC 2009, Demonstration of M$V Requirements for EA5. 2013. Available online: https://utilities.utexas.edu/sustainability/leed/EAc5-MeasurementandVerification-UTguidelines.pdf (accessed on 9 August 2016).
- Kessler, H. Measurement and Verification Can Help Maintain Efficiency, Improve LEED Scores. 2013. Available online: http://www.facilitiesnet.com/green/article/Measurement-and-Verification-Can-Help-Maintain-Efficiency-Improve-LEED-Scores-Facilities-Management-Green-Feature--14148 (accessed on 15 August 2016).
- University of Massachusetts Amherst Measurement and Verification Guidelines and Template Plan. 2013. Available online: https://www.umass.edu/sustainability/sites/default/files/UMASS%20M%26V%20Guide%20and%20Template%20Plan.pdf (accessed on 15 July 2016).
- LEED. Reference Guide for Building Design and Construction; Updated V4; LEED: Washington, DC, USA, 2014. [Google Scholar]
- Renewable Choice Energy. Earning LEED Credits While Selling Back S-RECS. 2015. Available online: https://www.slideshare.net/RenewableChoice/leed-s-rec-infosheet (accessed on 8 February 2018).
- Harney, L.D.D. Reducing energy use in building sector: Measures, costs and examples. Energy Effic. 2009, 2, 139–163. [Google Scholar]
Figure 1.
Performance of Energy and Atmosphere credits with respect to certification levels.
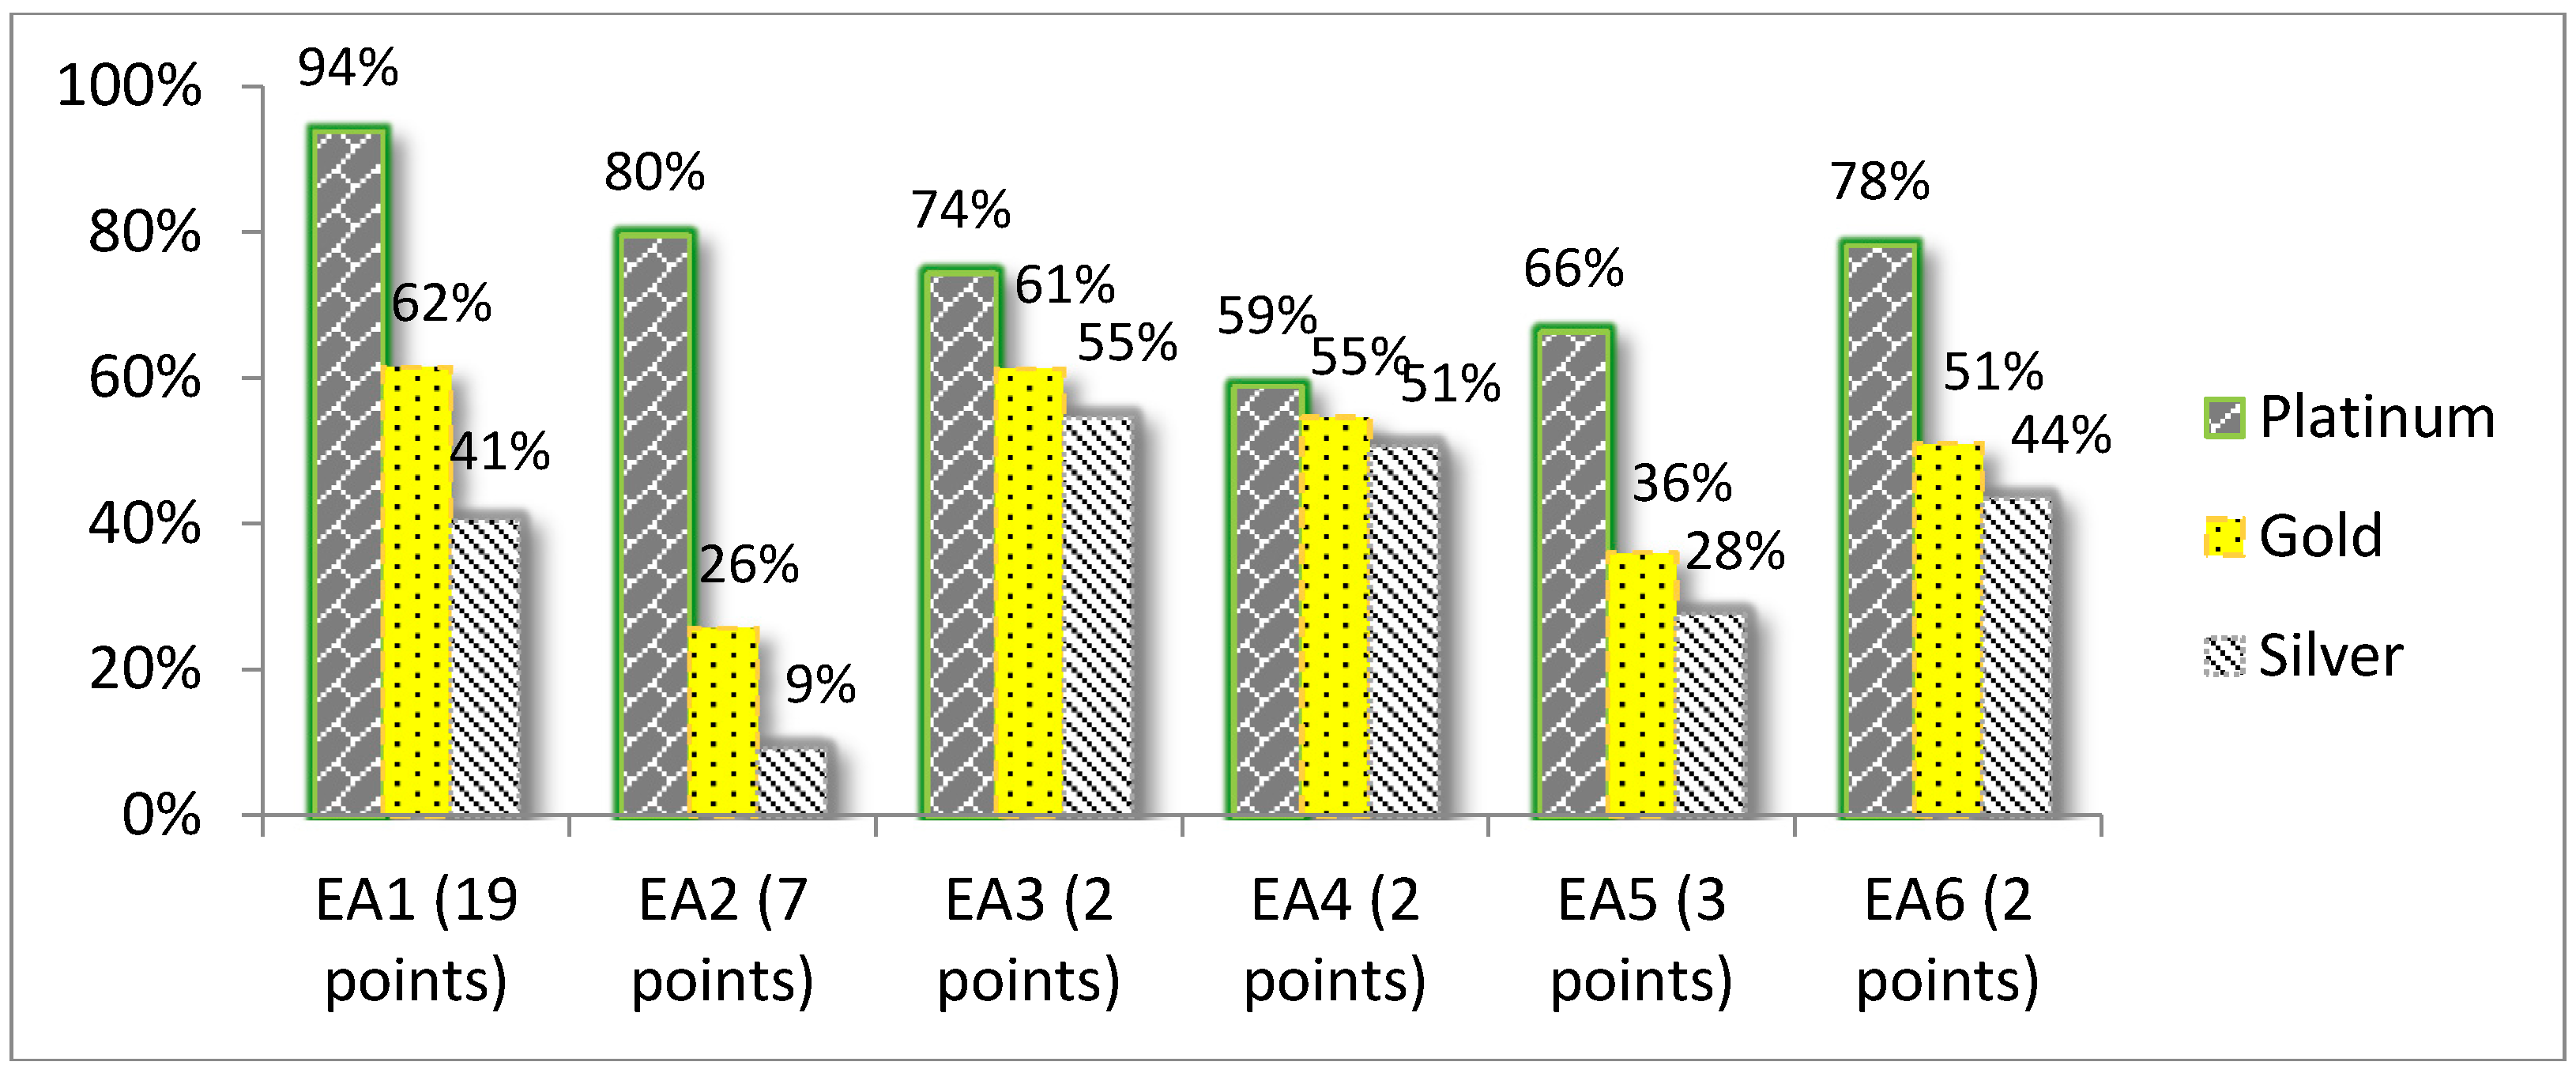
Figure 2.
Regression analysis plots for EA1 to EA6.

Figure 3.
Percent maximum points (PMP) based on building ownership.

Table 1.
Energy and atmosphere credit category of Leadership in Energy and Environmental Design, New Construction (LEED-NC) 2009.
Table 1.
Energy and atmosphere credit category of Leadership in Energy and Environmental Design, New Construction (LEED-NC) 2009.
| Prerequisites and Credits | Points |
|---|---|
| Prerequisite 1. Fundamental commissioning of building energy systems | - |
| Prerequisite 2. Minimum energy performance | - |
| Prerequisite 3. Fundamental refrigerant management | - |
| EA1—Optimize energy performance | 1–19 |
| The minimum energy cost savings percentage | |
| 12% | 1 |
| 14% | 2 |
| 16% | 3 |
| 18% | 4 |
| 20% | 5 |
| 22% | 6 |
| 24% | 7 |
| 26% | 8 |
| 28% | 9 |
| 30% | 10 |
| 32% | 11 |
| 34% | 12 |
| 36% | 13 |
| 38% | 14 |
| 40% | 15 |
| 42% | 16 |
| 44% | 17 |
| 46% | 18 |
| 48% | 19 |
| EA2—On-site renewable energy | |
| Percentage renewable energy | |
| 1% | 1 |
| 3% | 2 |
| 5% | 3 |
| 7% | 4 |
| 9% | 5 |
| 11% | 6 |
| 13% | 7 |
| EA3—Enhanced commissioning | 2 |
| EA4—Enhanced refrigerant management | 2 |
| EA5—Measurement and verification | 3 |
| EA6—Green power | 2 |
Table 2.
Breakdown of buildings by certification level.
| Certification Level Awarded | Achievable Points | Number of Buildings |
|---|---|---|
| Silver | 50–59 | 747 |
| Gold | 60–79 | 624 |
| Platinum | 80 and above | 129 |
| Total | 110 | 1500 |
Table 3.
Descriptive statistics of Energy and Atmosphere credits in LEED-NC 2009-certified buildings in the US.
Table 3.
Descriptive statistics of Energy and Atmosphere credits in LEED-NC 2009-certified buildings in the US.
| Points Received | Credits in the Energy and Atmosphere Category | |||||
|---|---|---|---|---|---|---|
| EA1 | EA2 | EA3 | EA4 | EA5 | EA6 | |
| Max. achievable points | 19 | 7 | 2 | 2 | 3 | 2 |
| Average achieved points | 10.2 | 1.6 | 1.2 | 1.1 | 1.0 | 1.0 |
| Standard deviation | 5.5 | 2.7 | 1.0 | 1.0 | 1.3 | 1.0 |
| Percent of maximum points achieved (PMP) | 54% | 22% | 59% | 53% | 34% | 50% |
Table 4.
Average points earned in the Energy and Atmosphere credits for new construction in the US.
| Certification Level Awarded | Number of Buildings | Points Earned | Credits in the Energy and Atmosphere Category | ||||||
|---|---|---|---|---|---|---|---|---|---|
| EA1 (19 pts) | EA2 (7 pts) | EA3 (2 pts) | EA4 (2 pts) | EA5 (3 pts) | EA6 (2 pts) | Total (35 pts) | |||
| Silver Certification (50–59 points) | 747 | Average points earned | 7.7 | 0.6 | 1.1 | 1.0 | 0.8 | 0.9 | 12.2 |
| PMP | 41% | 9% | 55% | 51% | 28% | 44% | |||
| Standard deviation | 4.6 | 1.8 | 1.0 | 1.0 | 1.2 | 1.0 | |||
| Number of buildings that earned “0” points | 14 | 640 | 339 | 369 | 462 | 422 | |||
| Number of buildings that earned “maximum” points | 28 | 39 | 408 | 378 | 167 | 324 | |||
| Gold Certification (60–79 points) | 624 | Average points earned | 11.7 | 1.8 | 1.2 | 1.1 | 1.1 | 1.0 | 17.9 |
| PMP | 62% | 26% | 61% | 55% | 36% | 51% | |||
| Standard deviation | 4.9 | 2.8 | 1.0 | 1.0 | 1.3 | 1.0 | |||
| Number of buildings that earned “0” points | 1 | 404 | 238 | 279 | 336 | 301 | |||
| Number of buildings that earned “maximum” points | 90 | 121 | 378 | 337 | 194 | 313 | |||
| Platinum Certification (80 points and beyond) | 129 | Average points earned | 17.8 | 5.6 | 1.5 | 1.2 | 2.0 | 1.6 | 29.6 |
| PMP | 94% | 80% | 74% | 59% | 66% | 78% | |||
| Standard deviation | 2.3 | 2.4 | 0.9 | 1.0 | 1.3 | 0.8 | |||
| Number of buildings that earned “0” points | 0 | 10 | 33 | 53 | 32 | 28 | |||
| Number of buildings that earned “maximum” points | 89 | 86 | 96 | 76 | 80 | 101 | |||
Table 5.
Certification level by building ownership.
| Building Ownership | Certification Level | Total | ||
|---|---|---|---|---|
| Silver | Gold | Platinum | ||
| Privately held corporations | 156 | 111 | 19 | 286 |
| Publicly traded corporations | 64 | 51 | 11 | 126 |
| Educational institutions | 156 | 148 | 27 | 331 |
| Government agencies | 248 | 200 | 37 | 485 |
| Investors | 40 | 47 | 12 | 99 |
| Others | 83 | 67 | 23 | 173 |
| Total | 747 | 624 | 129 | 1500 |
Table 6.
Kruskal–Wallis test statistics of Energy and Atmosphere credits for building ownership.
| Statistics | Credits in the Energy and Atmosphere Category | |||||
|---|---|---|---|---|---|---|
| EA1 | EA2 | EA3 | EA4 | EA5 | EA6 | |
| H-statistics | 35.525 | 37.057 | 23.276 | 30.636 | 12.529 | 45.235 |
| degree of freedom | 5 | 5 | 5 | 5 | 5 | 5 |
| Asymp. Sig. | 0 | 0 | 0 | 0 | 0.028 | 0 |
Table 7.
Post-hoc test Bonferroni Mann–Whitney U test results.
| Type of Ownership | p-Values at 10% Significance | ||||||
|---|---|---|---|---|---|---|---|
| EA1 | EA2 | EA3 | EA4 | EA5 | EA6 | ||
| Privately held corporations | Publicly traded corporations | 0.9079 | 0.8531 | 0.0059 | 0.2002 | 0.5172 | 0.1930 |
| Educational institutions | 0.8865 | 0.0747 | 0.0067 | 0.0122 | 0.0763 | 0.0682 | |
| Government agencies | 0.0014 | 0.1210 | 0.2095 | 0.1008 | 0.0231 | 0.0001 | |
| Investors | 0.0000 | 0.0000 | 0.0569 | 0.0024 | 0.0183 | 0.0071 | |
| Others | 0.9507 | 0.4025 | 0.6613 | 0.0112 | 0.1750 | 0.9276 | |
| Publicly traded corporations | Educational institutions | 0.8647 | 0.1213 | 0.4444 | 0.5319 | 0.0414 | 0.0064 |
| Government agencies | 0.0304 | 0.3553 | 0.0429 | 0.8821 | 0.0161 | 0.0000 | |
| Investors | 0.0003 | 0.0005 | 0.0001 | 0.0003 | 0.0100 | 0.1818 | |
| Others | 0.9892 | 0.6245 | 0.0296 | 0.3558 | 0.0874 | 0.2059 | |
| Educational institutions | Government agencies | 0.0003 | 0.0002 | 0.0796 | 0.2609 | 0.7249 | 0.0531 |
| Investors | 0.0000 | 0.0000 | 0.0001 | 0.0000 | 0.2448 | 0.0001 | |
| Others | 0.8751 | 0.0153 | 0.0586 | 0.6485 | 0.8971 | 0.1401 | |
| Government agencies | Investors | 0.0031 | 0.0002 | 0.0040 | 0.0000 | 0.3251 | 0.0000 |
| Others | 0.0130 | 0.7222 | 0.5628 | 0.1664 | 0.6728 | 0.0017 | |
| Investors | Others | 0.0002 | 0.0007 | 0.0363 | 0.0000 | 0.2461 | 0.0101 |
© 2018 by the authors. Licensee MDPI, Basel, Switzerland. This article is an open access article distributed under the terms and conditions of the Creative Commons Attribution (CC BY) license (http://creativecommons.org/licenses/by/4.0/).
Share and Cite
MDPI and ACS Style
Gurgun, A.P.; Arditi, D. Assessment of Energy Credits in LEED-Certified Buildings Based on Certification Levels and Project Ownership. Buildings 2018, 8, 29. https://doi.org/10.3390/buildings8020029
AMA Style
Gurgun AP, Arditi D. Assessment of Energy Credits in LEED-Certified Buildings Based on Certification Levels and Project Ownership. Buildings. 2018; 8(2):29. https://doi.org/10.3390/buildings8020029
Chicago/Turabian StyleGurgun, Asli Pelin, and David Arditi. 2018. "Assessment of Energy Credits in LEED-Certified Buildings Based on Certification Levels and Project Ownership" Buildings 8, no. 2: 29. https://doi.org/10.3390/buildings8020029
Note that from the first issue of 2016, this journal uses article numbers instead of page numbers. See further details here.