An Image-Based Gamut Analysis of Translucent Digital Ceramic Prints for Coloured Photovoltaic Modules


School of Engineering and Architecture, Lucerne University of Applied Sciences and Arts, Technikumstrasse 21, CH-6048 Horw, Switzerland
*
Author to whom correspondence should be addressed.
Buildings 2018, 8(2), 30; https://doi.org/10.3390/buildings8020030
Submission received: 17 January 2018
/
Revised: 2 February 2018
/
Accepted: 5 February 2018
/
Published: 12 February 2018
Abstract
:Colouring the frontglass of photovoltaic (PV) modules via digital ceramic printing aids in concealing the PV modules when integrated into existing building façades as building-integrated photovoltaics (BIPV), while admitting sufficient light to produce electricity. This promotes the visual acceptance and adoption of PV modules as a source of renewable energy in urban environments. The effective colour of the PV laminate is a combination of the transparent colour on glass and the colour of the PV cells. This colour should ideally match the architect’s visual expectations in terms of fidelity, but also in terms of relative PV efficiency as a function of print density. In practice, these requirements are often contradictory, particularly for vivid colours, and the visual results may deviate significantly. This paper presents an objective analysis of how colours appear on ceramically printed frontglass when laminated with a PV module, using an image-based colour acquisition process. Given a set of 1044 nominal colours uniformly distributed in the RGB colour space, each printed in 10 opacities, we quantify the range of effective colours observed when printed on glass and combined with a PV module, and their deviation from the nominals. Our results confirm that the effective colour gamuts are significantly constrained and skewed, depending on the ink volume and glass finish used for printing. In particular, blue–magenta hues cannot be reliably rendered with this process. These insights can serve as guidelines for selecting target colours for BIPV that can be well approximated in practice.
1. Introduction
Photovoltaic (PV) modules installed on building envelopes as building-integrated photovoltaics (BIPV) have increasingly attracted the attention of architects, urban planners and engineers. The dark appearance of PV modules can however compromise the visual appeal of the building in the context of its surroundings, particularly in heritage sites [1], thus limiting the adoption of BIPV.
Recent studies have demonstrated the use of coloured photovoltaics for improved visual integration using different technologies [2,3,4]. Coating the frontglass using a digital ceramic printing process [5] is beneficial as the print is partially transparent in the infrared range (depending on the dye), within which PV modules generate a significant amount of their energy [6].
The viability of the digital ceramic printing approach was demonstrated with an image-based acquisition and visual validation of computationally matched target colours from the NCS Exterior Set [7]. In this paper, we apply a similar image-based process to a wider range of colours to quantify the fidelity with which they are rendered by digital ceramic printing after lamination with a PV module.
Regardless of the technology employed to implement the coloured photovoltaics, no systematic assessment of the gamut of colours effectively achieved after lamination with PV modules has been published. To our knowledge, this is the first such survey. We also lay claim to an innovative image-based bulk acquisition method to extract the colours as they appear on a simulated laminate, without actually laminating the printed frontglass with a PV module. We note, however, that our results are exemplary for a digital ceramic printing process, and may differ with other technologies.
We refer to the colours specified for printing on the frontglass as nominal colours. These are specified with a variable print density and a fixed (per print) ink volume that determine the colour’s translucency to the underlying PV module. Since the colours printed on the frontglass will be combined with the transmitted opaque colours of the PV cells, the observed colours will be considerably different. We refer to these as the effective printed colours. These colours may appear dark and desaturated, depending on the translucency. On the other hand, lowering the translucency decreases the electrical efficiency of the PV module [8]. This implies a trade-off between colour rendering fidelity and PV performance. As such, the effective printed colours are often the result of a compromise between aesthetics and function.
Architects and planners are accustomed to specifying colours using prevailing colour nomenclature such as RAL or NCS, which convey precise expectations for the effective colour of the PV module. Our goal is to quantify the deviations between the expected and effective colours as well as the range of useful colours (gamut) obtained with our process, factoring in the ink volume and frontglass finish. This enables us to predict appropriate choices for coloured BIPV that can meet the architects’ expectations.
2. Materials and Methods
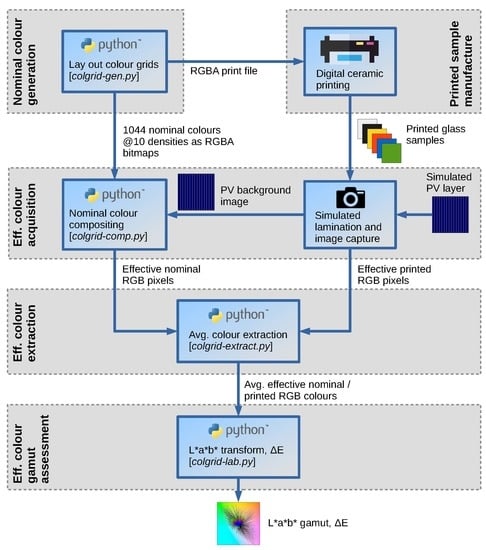
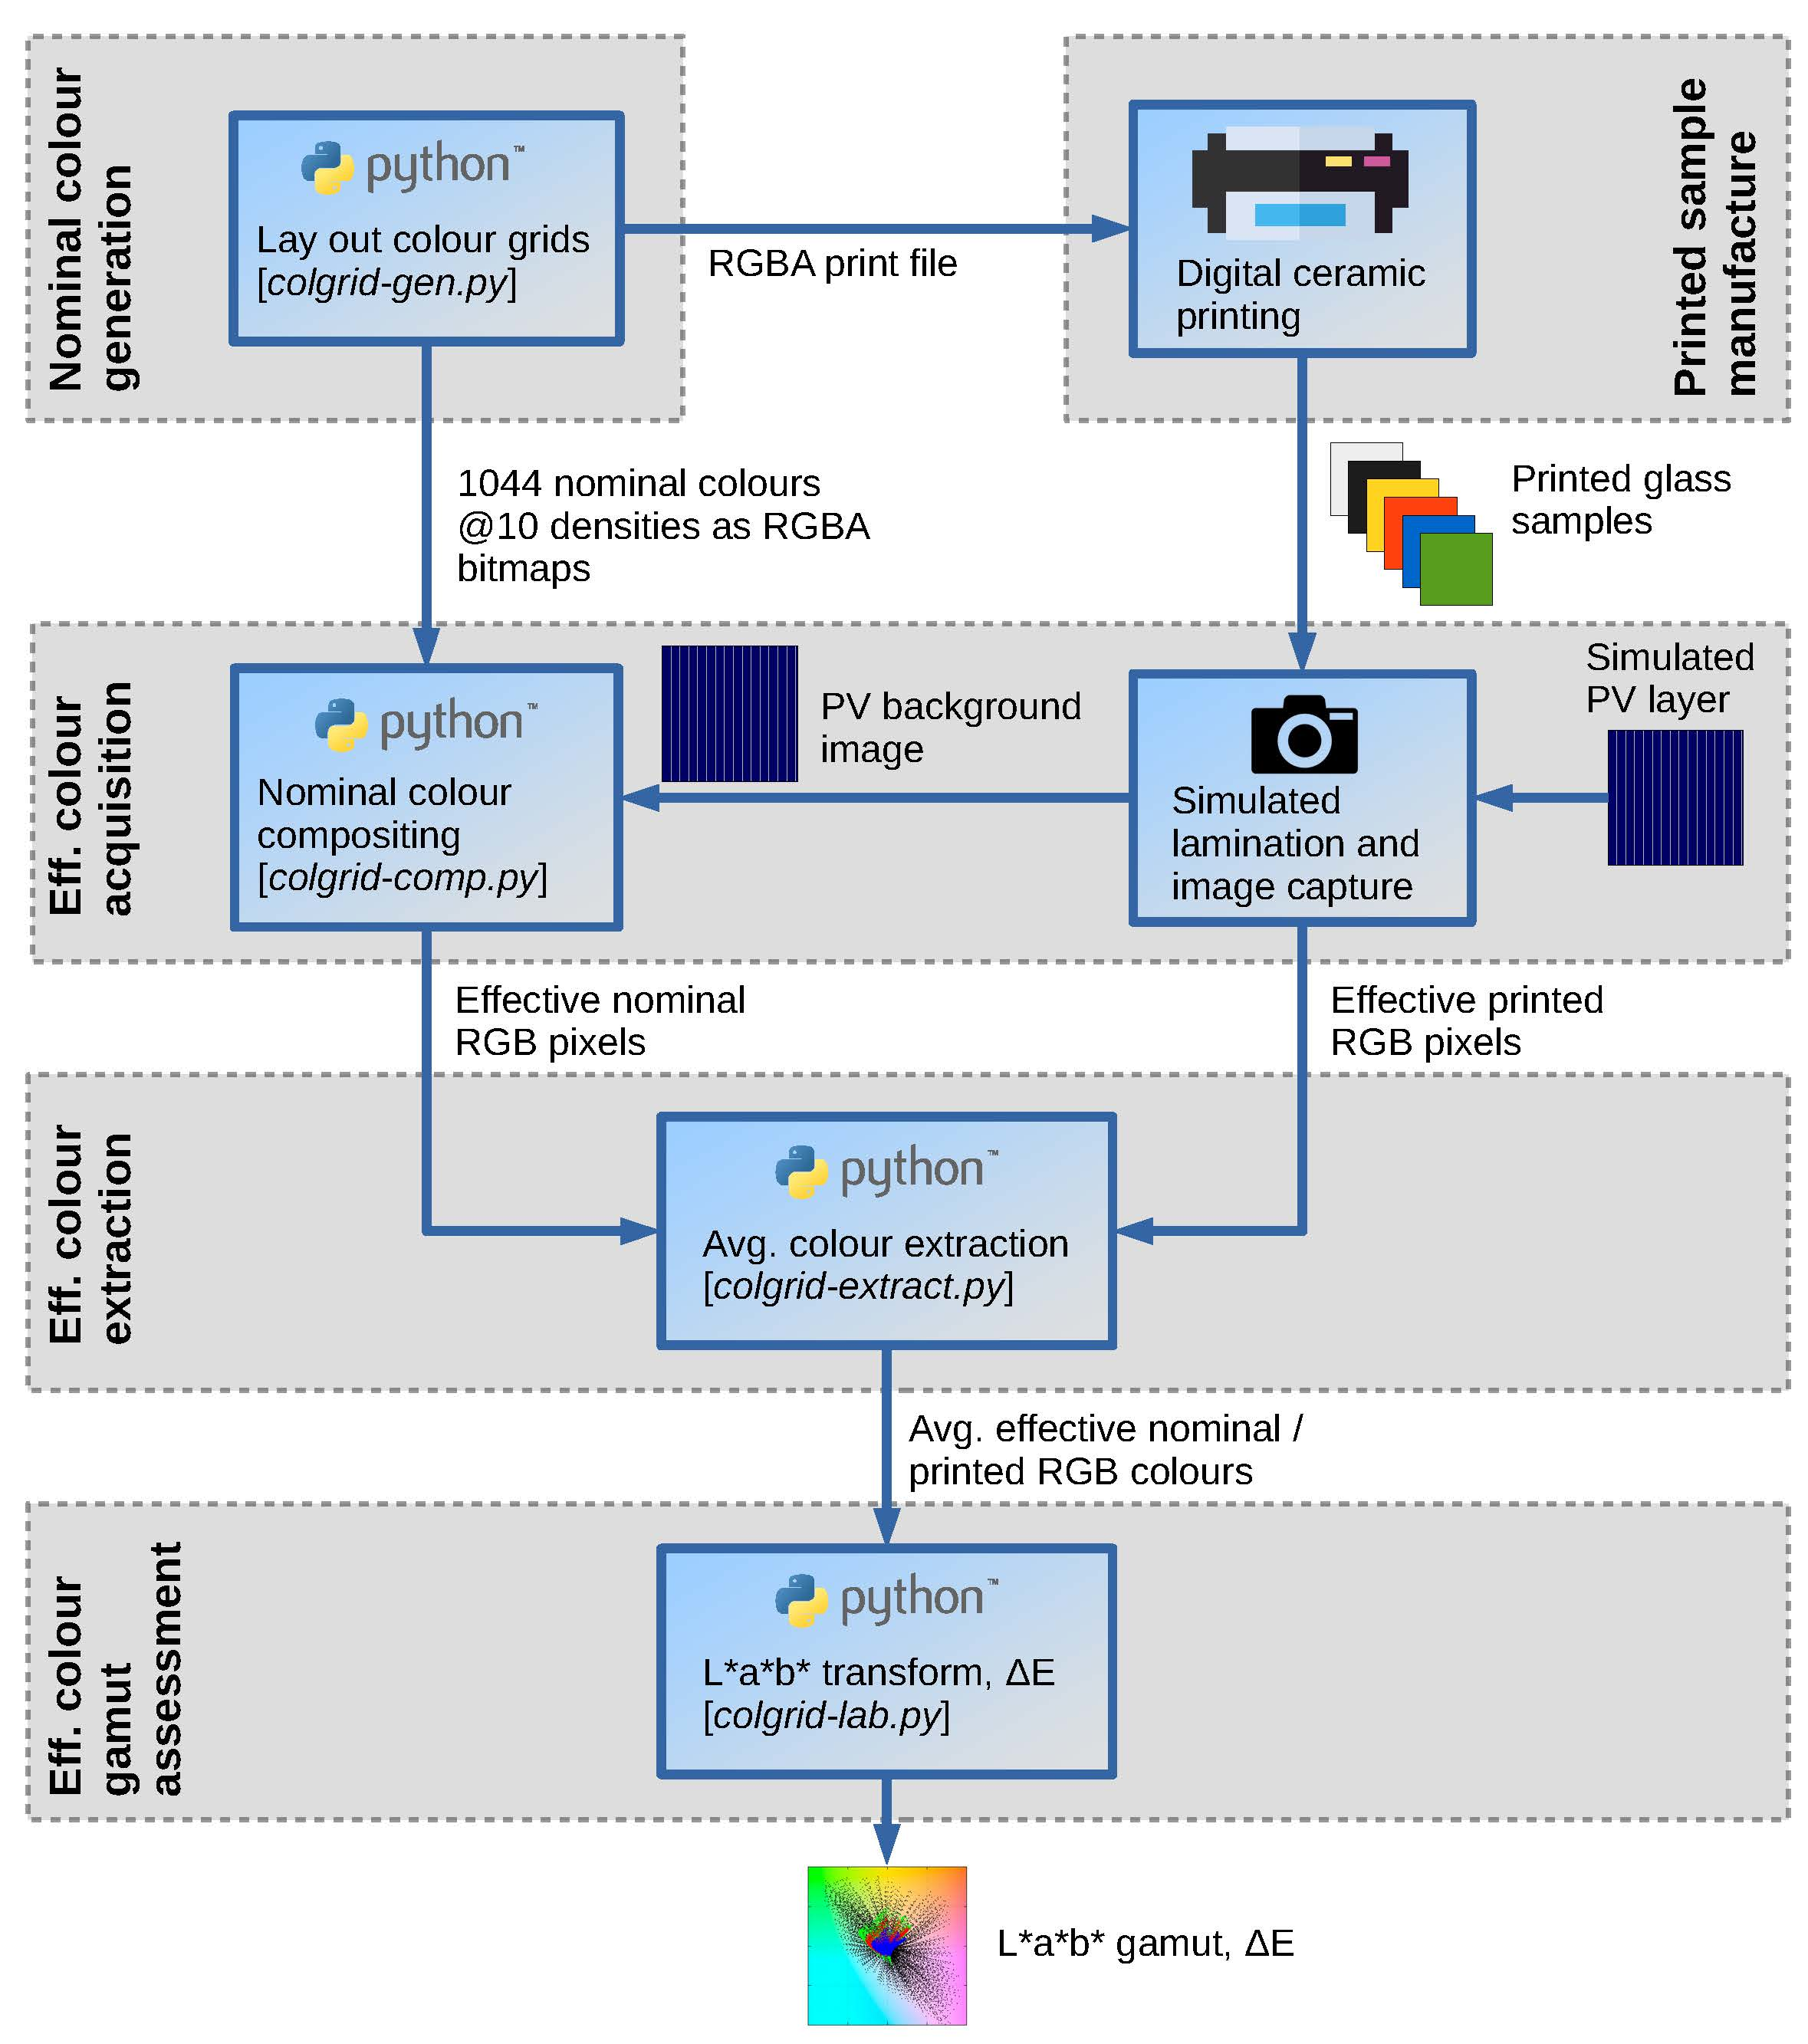
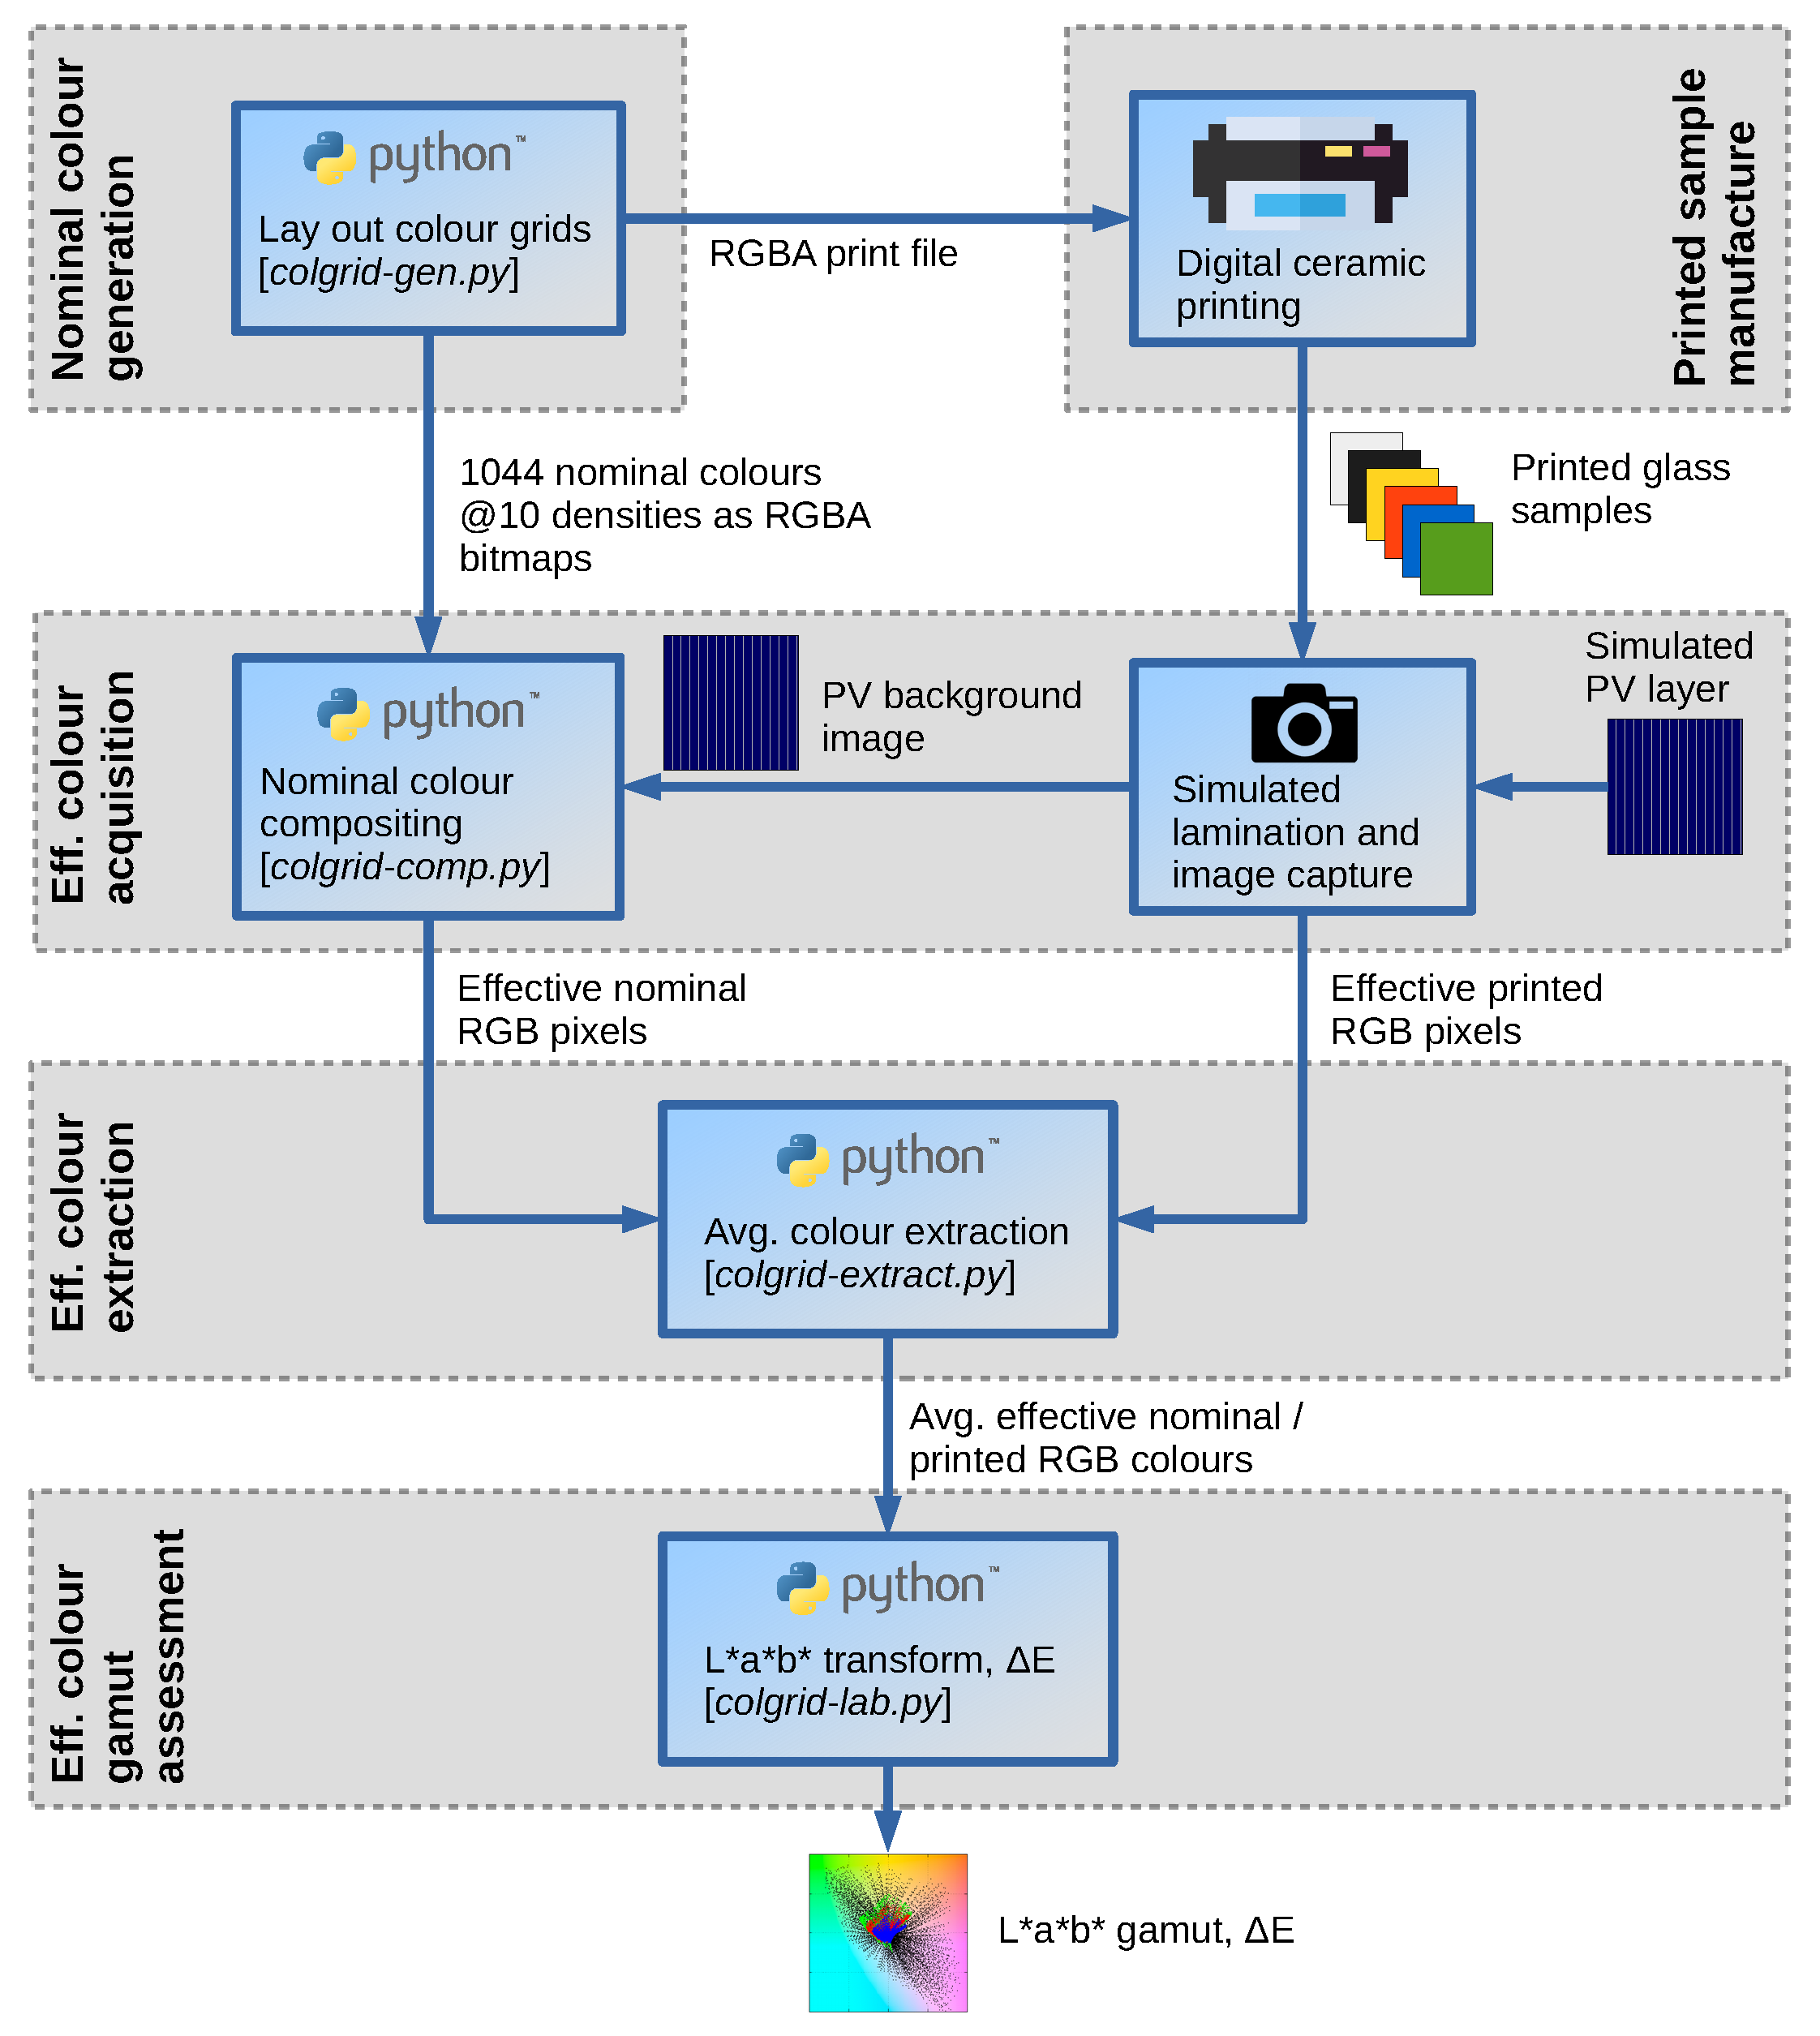
Our analysis methodology is summarised in Figure 1. It is similar to the process employed in [7] in that we also use an image-based colour acquisition and a semi-automatic process to extract and process the effective colours from the captured images. However, we only assess the results objectively rather than also visually. More significantly, our method systematically explores the entire gamut attainable within the physical limits imposed by the ceramic printing process, rather than attempting to approximate a selected subset of target colours.
Our methodology is comprised of five steps, which are detailed in the following sections:
- nominal colour generation,
- printed sample manufacture,
- effective colour acquisition,
- effective colour extraction, and
- effective colour gamut assessment.
2.1. Nominal Colour Generation
We selected a set of ca. 1000 colours uniformly distributed in the RGB colour space and arranged them on 12 grids, each 60 × 60 cm in size, for printing on separate glass panels. Each colour was rendered in 10 print densities of 10–100% for a total of ca. 10,000 samples. While these colours served as source data for the printing process, they also acted as reference for comparison with the printed colours, and are referred to as nominal colours.
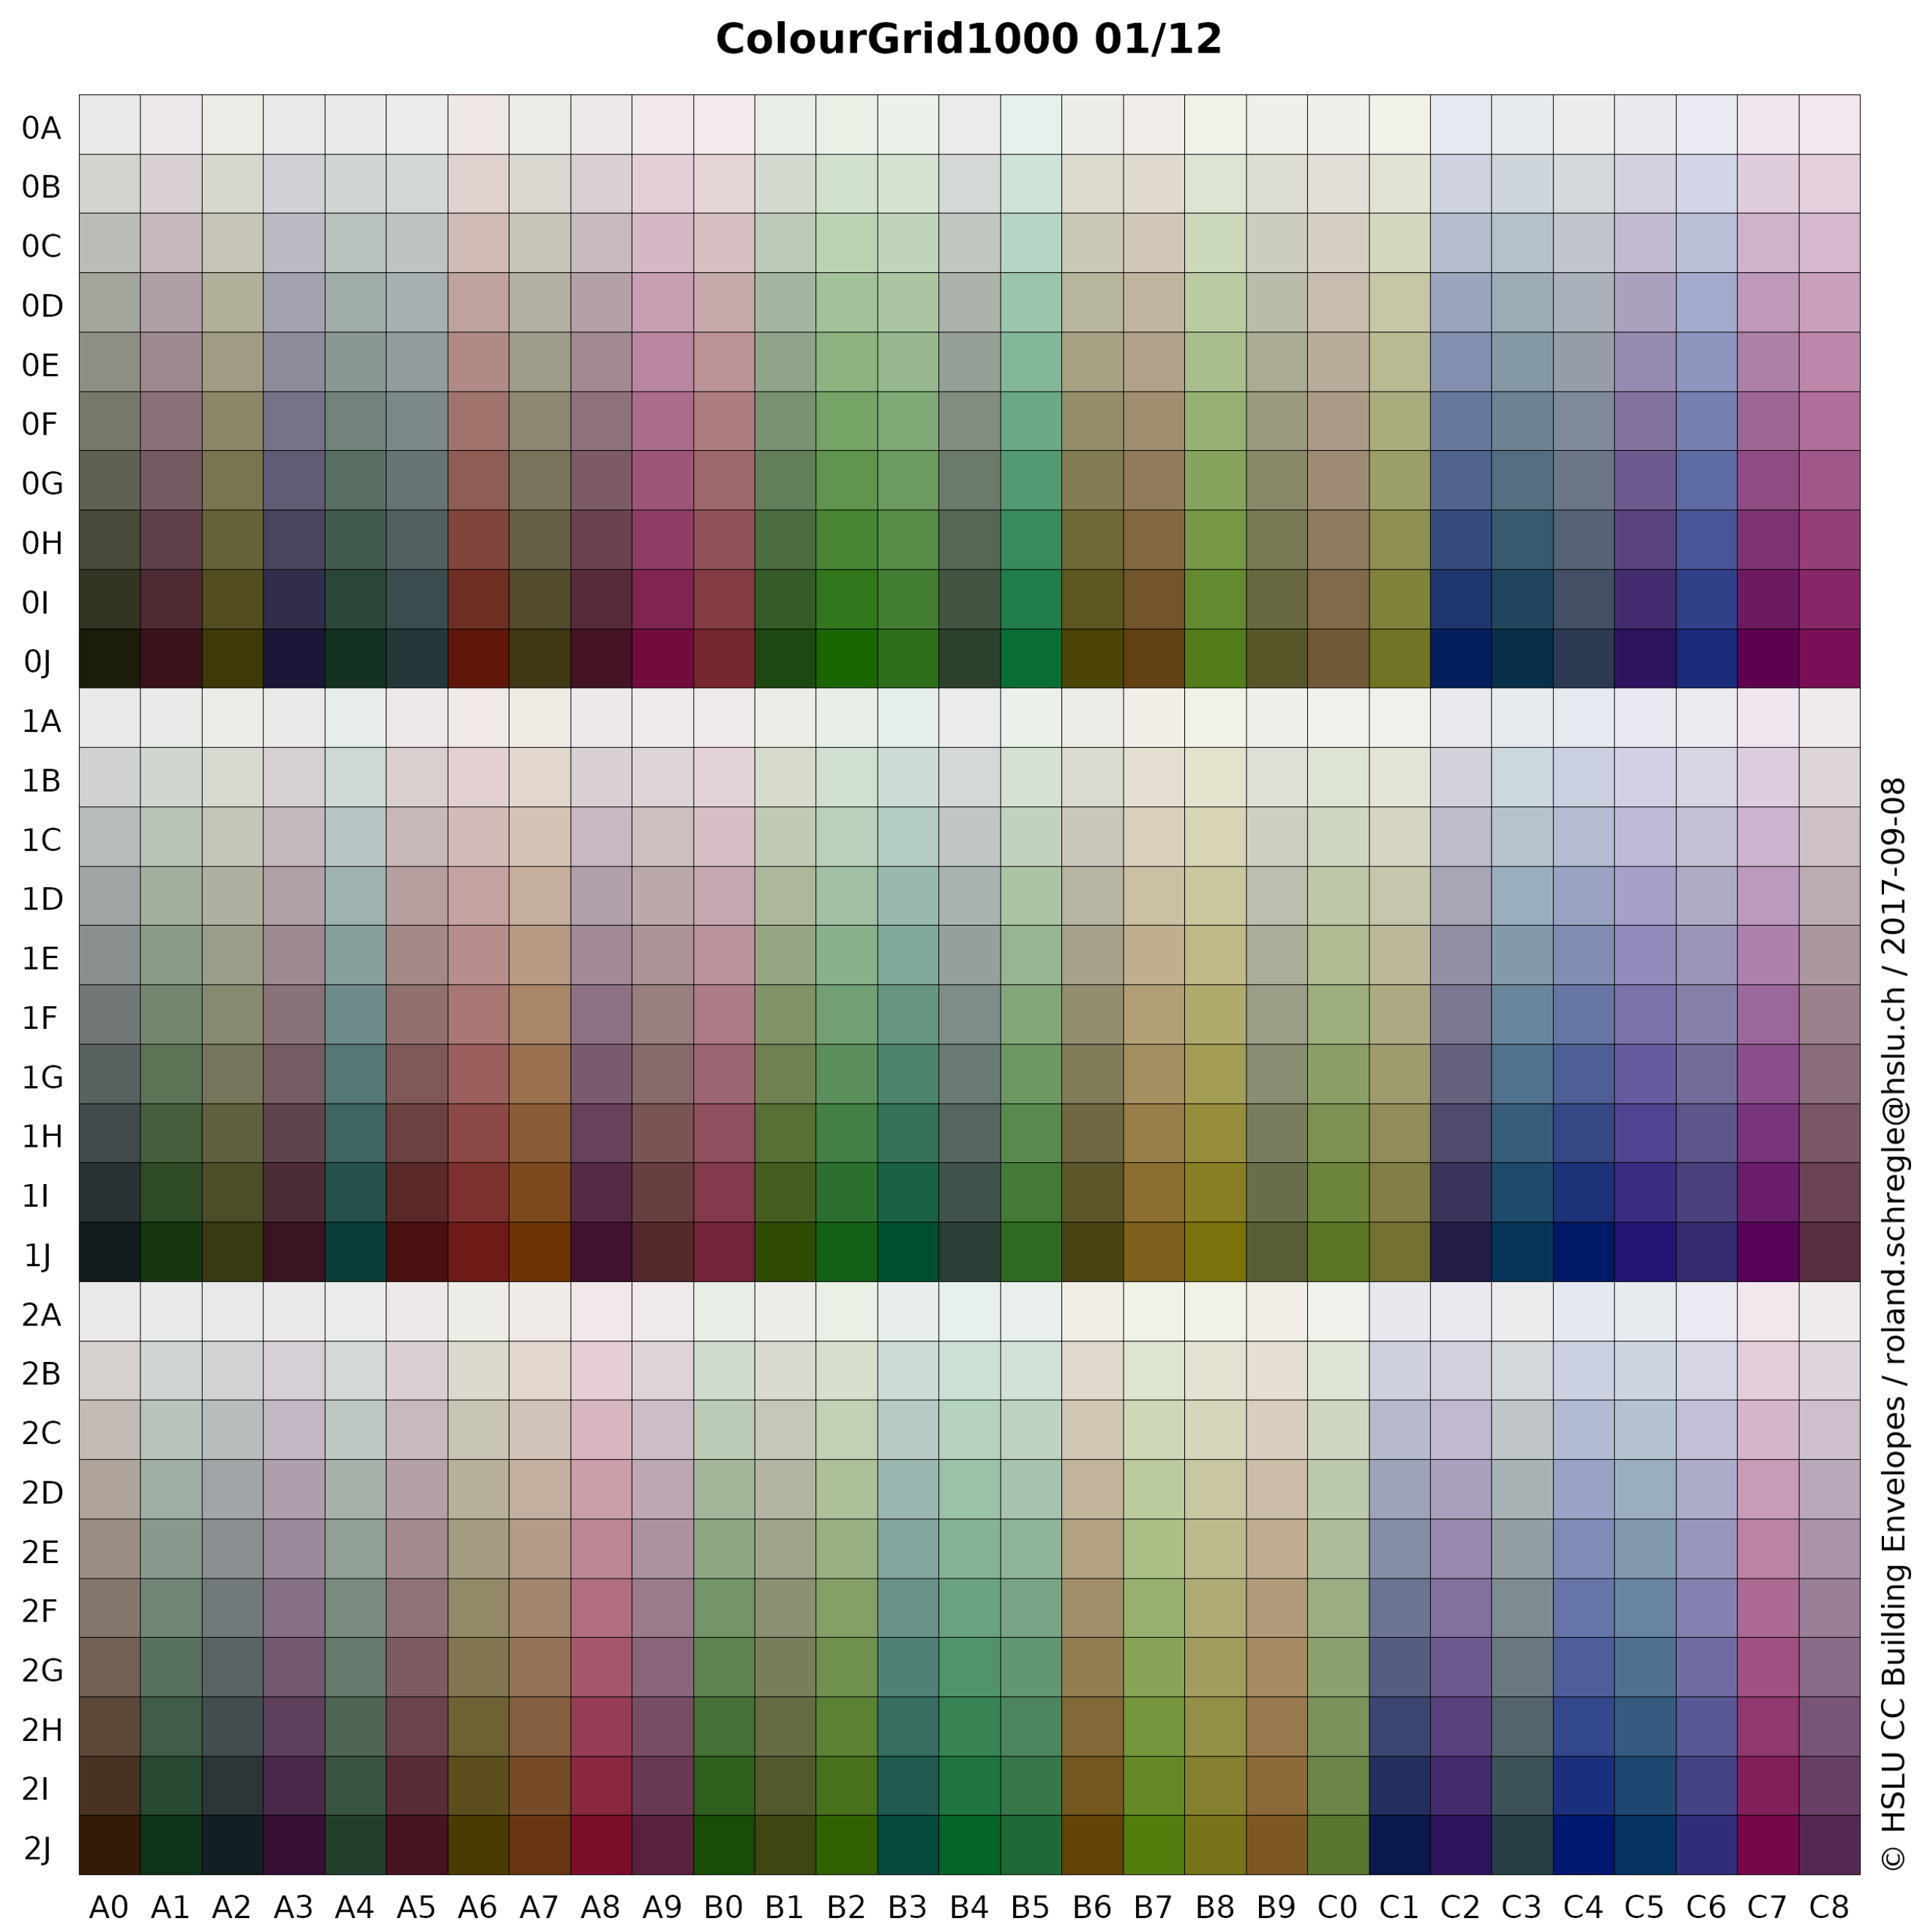
The colours were generated by a Python script (colgrid-gen.py) which renders them in grids and exports them as RGBA TIFFs using the Python Imaging Library (PIL) [9], with the print density encoded in the alpha channel. Figure 2 shows a sample grid generated with our script. The full set of image files is available for download as supplementary data in Figures S1–S12. This is accompanied by Table S1 listing the corresponding RGBA values for each grid colour, indexed by X and Y coordinates.
The script selects the colours to uniformly cover the cubic RGB space. This is achieved by linearising the 3D RGB coordinates and enumerating them along a space subdividing curve using Morton codes [10,11]. The corresponding Z-curve meanders through the RGB cube, and is iteratively traversed in intervals of equal length (see Figure 3). The cumulative traversed curve length at each iteration serves as a scalar index (the Morton code) associated with the curve segment’s endpoint. This index is then mapped to the endpoint’s 3D coordinates in RGB space.
Given the desired number of colours and glass panels for the sample set, the script arranges a subset of the colours in a grid on each panel. The grid layout is optimised to fully utilise the available space, with the number of colours padded to ensure the layout is consistent over all panels. As such, the total number of colours is typically rounded up, and as a result our sample set actually contained 1044 colours. In addition, the number of grid rows and columns is adjusted such that each grid cell (containing a colour sample) is approximately square. In our sample set, each cell measured 20.7 × 20.0 mm.
2.2. Printed Sample Manufacture
The nominal colours generated by our script were forwarded to the glass manufacturer as an RGBA bitmap for printing on glass. Low-iron, high-clarity glass was used in the production of the printed glass samples. The samples were manufactured by Glas Trösch AG, Bützberg, Switzerland, by means of a digital ceramic printing technique on a 6-colour DipTech printer. Because the ink volume used for printing affects the translucency and therefore the saturation of the effective colours, two sample sets were printed at ink volumes of 10 and 20 picolitres (pl).
While prints on clear glass render colours with optimum contrast, the glass is a potential source of glare in the built environment when installed as BIPV. In such cases, scattering frontglass surfaces can be used, which we addressed by including a third set of samples printed on satinated glass with 10 pl. The outer scattering surface significantly reduces the contrast of the effective colours, thus rendering them less vividly. The satinated glass finish was manufactured using a chemical etching process.
2.3. Effective Colour Acquisition
In this step, we acquired colour calibrated photographs of the printed glass samples manufactured in the previous step. Using an image-based approach instead of individual colorimetric readings from the printed glass samples enabled us to efficiently obtain and automatically process the colours in bulk.
2.3.1. Simulated Lamination
As a prerequisite to the actual capture process, the printed glass samples were prepared to appear as if they were laminated with PV modules to obtain the effective printed colours.
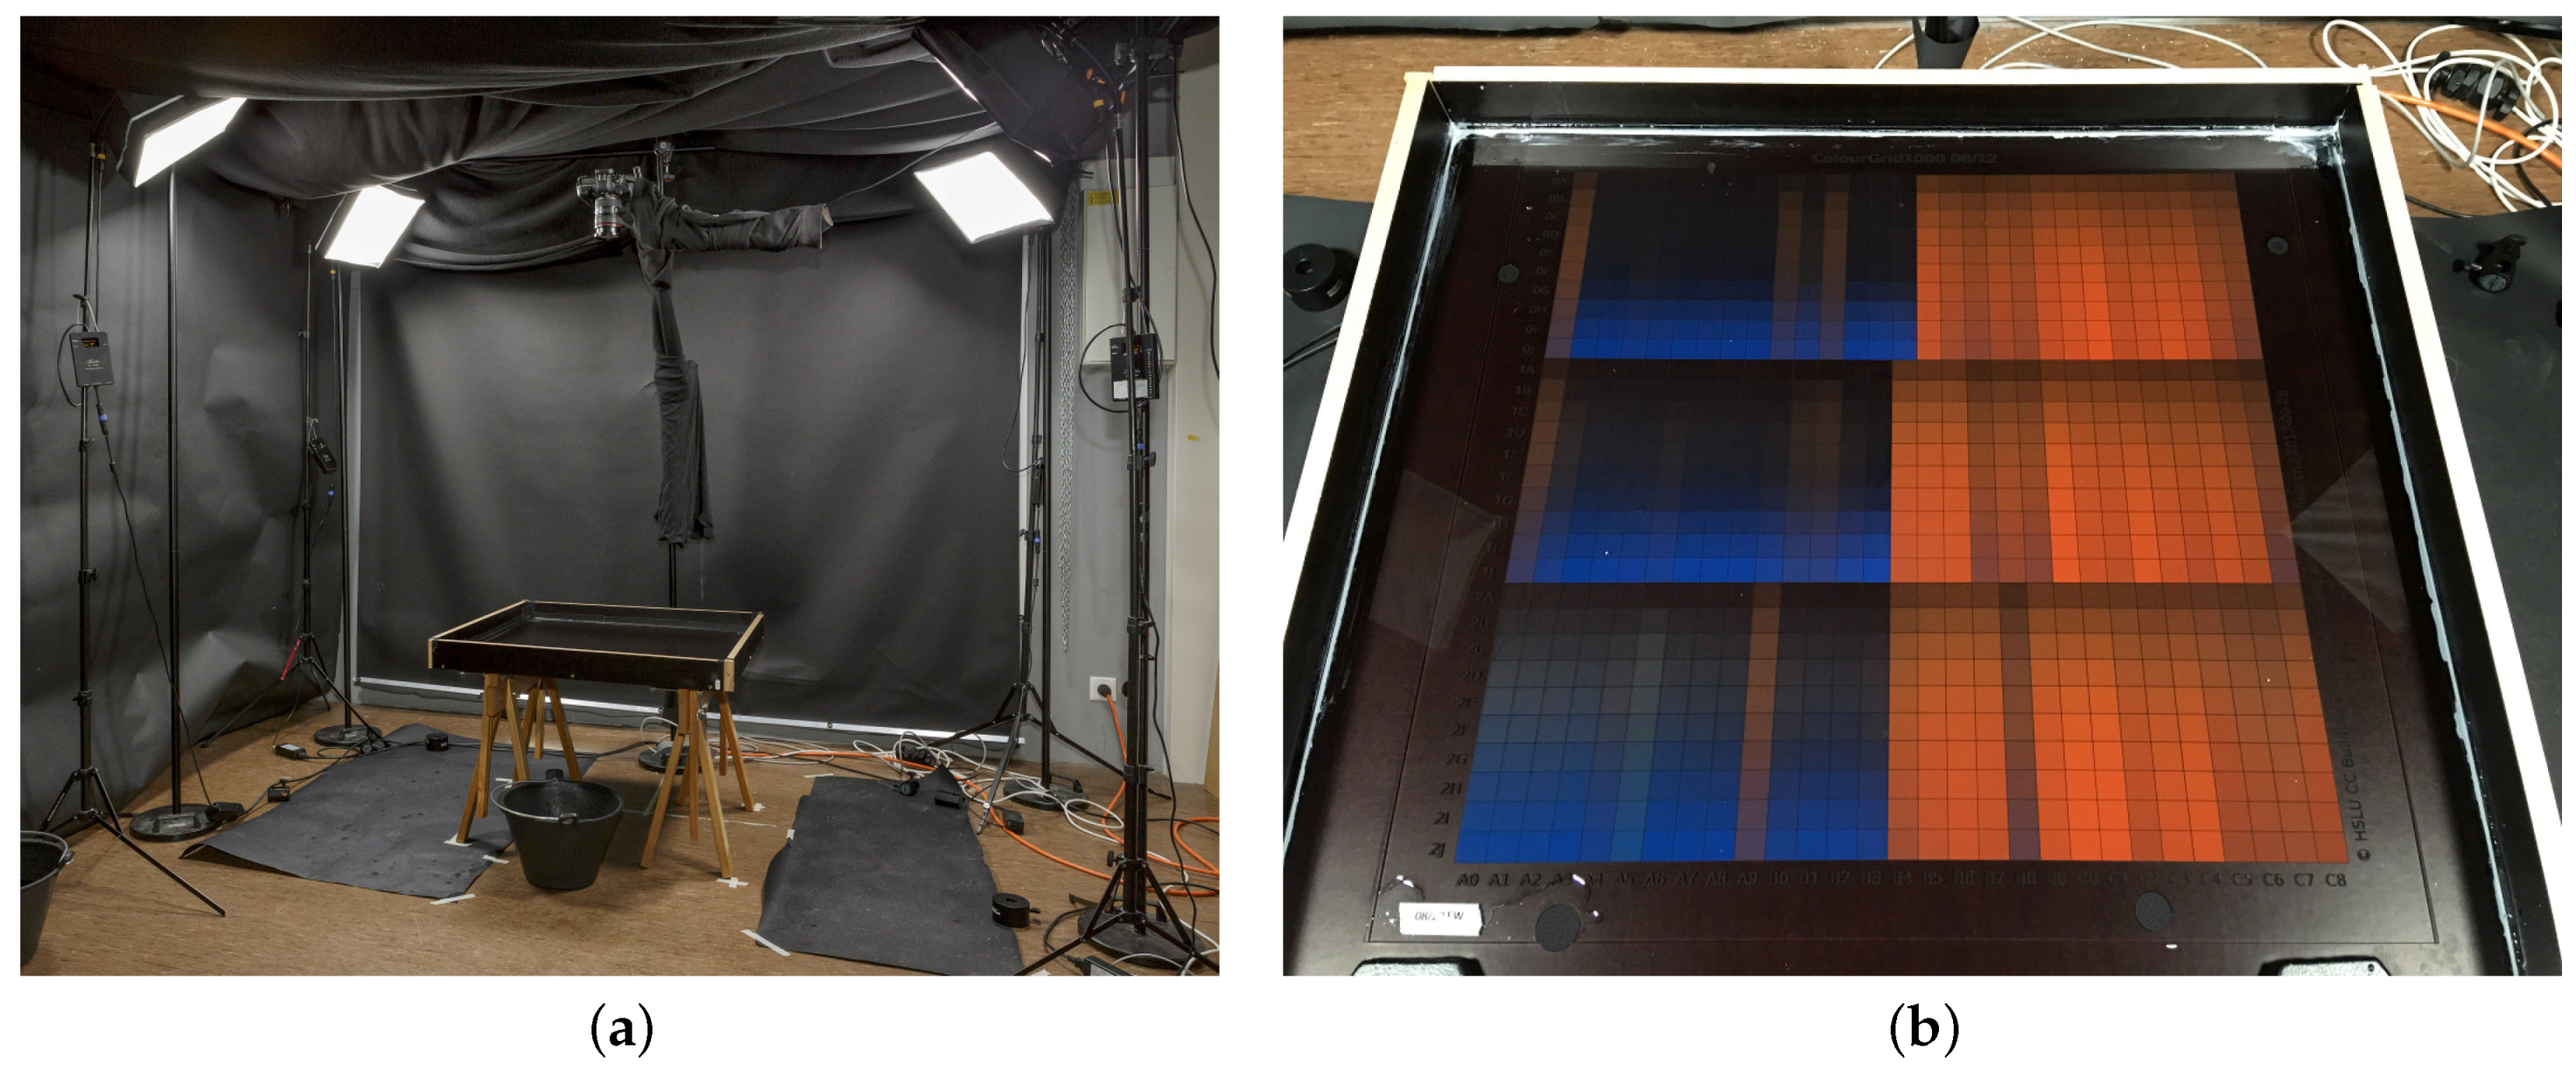
The absence of an air gap between a laminated frontglass and its PV module results in lower scattering on the interface and therefore higher contrast. Rather than actually laminating each printed glass sample with a PV module of sufficient size, a more cost effective alternative was employed to simulate a laminated appearance. To this end, the samples were placed in a water basin and floated by 2 mm rubber spacers, thereby displacing the air gap, as shown in Figure 4b.
The basin was constructed from black PVC-covered plywood panels with a semi-matte finish, thus providing a convenient and acceptable visual substitute for a dark gray monocrystalline PV module. The samples were carefully immersed at an angle to prevent the accumulation of air bubbles. For the satinated samples, the waterline was lowered to just cover the lower printed glass surface, leaving the upper scattering surface dry.
2.3.2. Image Capture
Photographs of each printed glass sample immersed in the basin were taken under identical and reproducible conditions. An overview of our capture setup is shown in Figure 4a. We obtained RAW images from a Canon EOS 5D MkIV DSLR with 24–70 mm lens and fixed exposure setting. The camera was mounted vertically over the water basin containing the sample. A quartet of Aladdin Bi-Flex LED studio lights served as illuminants, with a correlated colour temperature (CCT) of 6170 K measured by a spectrometer (Sekonic Spectromaster C-700). The illuminants were positioned symmetrically at the corners of the sample, and their individual brightness was adjusted for even illuminance using a photometer. The acquisition setup was shielded from stray light and reflections with black drapes.
The captures were colour corrected with a custom ICC (International Colour Consortium) profile generated with the Argyll Colour Management System [12] from a RAW capture of an IT8.7 calibration target. The ICC profile was then applied to all RAW sample captures in RawTherapee [13]. In addition, a fixed black point and exposure compensation was applied to match the minimum and maximum luminances of the IT8.7 target’s neutral patches. These patches were also checked for a linear luminance distribution in CIE L*a*b* space using ImageJ’s colour transform plugin [14,15,16].
The colour corrected images were exported as linear 48-bit RGB TIFFs for the effective colour extraction. Lens distortion was minor and not problematic for the extraction process owing to its built-in tolerance, and therefore not corrected.
2.3.3. Nominal Colour Compositing
In a process analogous to that described in Section 2.3.1, we simulated a laminate of the nominal colours with a PV module. Each nominal colour grid generated in Section 2.1 was alpha-composited with an image capture of the simulated PV module, i.e., the empty water basin shown in Figure 4b. In analogy to the physical translucency of the printed glass samples, the pixels from the simulated PV module bitmap were weighted by the alpha channel in the nominal colour bitmaps. We thus obtained a reference for comparison against the effective printed colours.
We again used a Python script (colgrid-comp.py) with PIL’s alpha compositing function to blend the nominal colour grid and the background photograph. The resulting composite images were saved as 48-bit TIFFs. Because the composites convey the combined appearance of the nominal colours and PV module, we refer to them as effective nominal colours in analogy to the effective printed colours obtained from captures of the simulated printed glass laminates. Figure 5d shows the sample grid in Figure 2 after compositing it with the simulated PV module background used in our captures.
The subsequent effective colour extraction process treated the printed sample captures and the nominal colour composites analogously; for its intents and purposes, the latter were also considered photographic captures.
2.4. Effective Colour Extraction
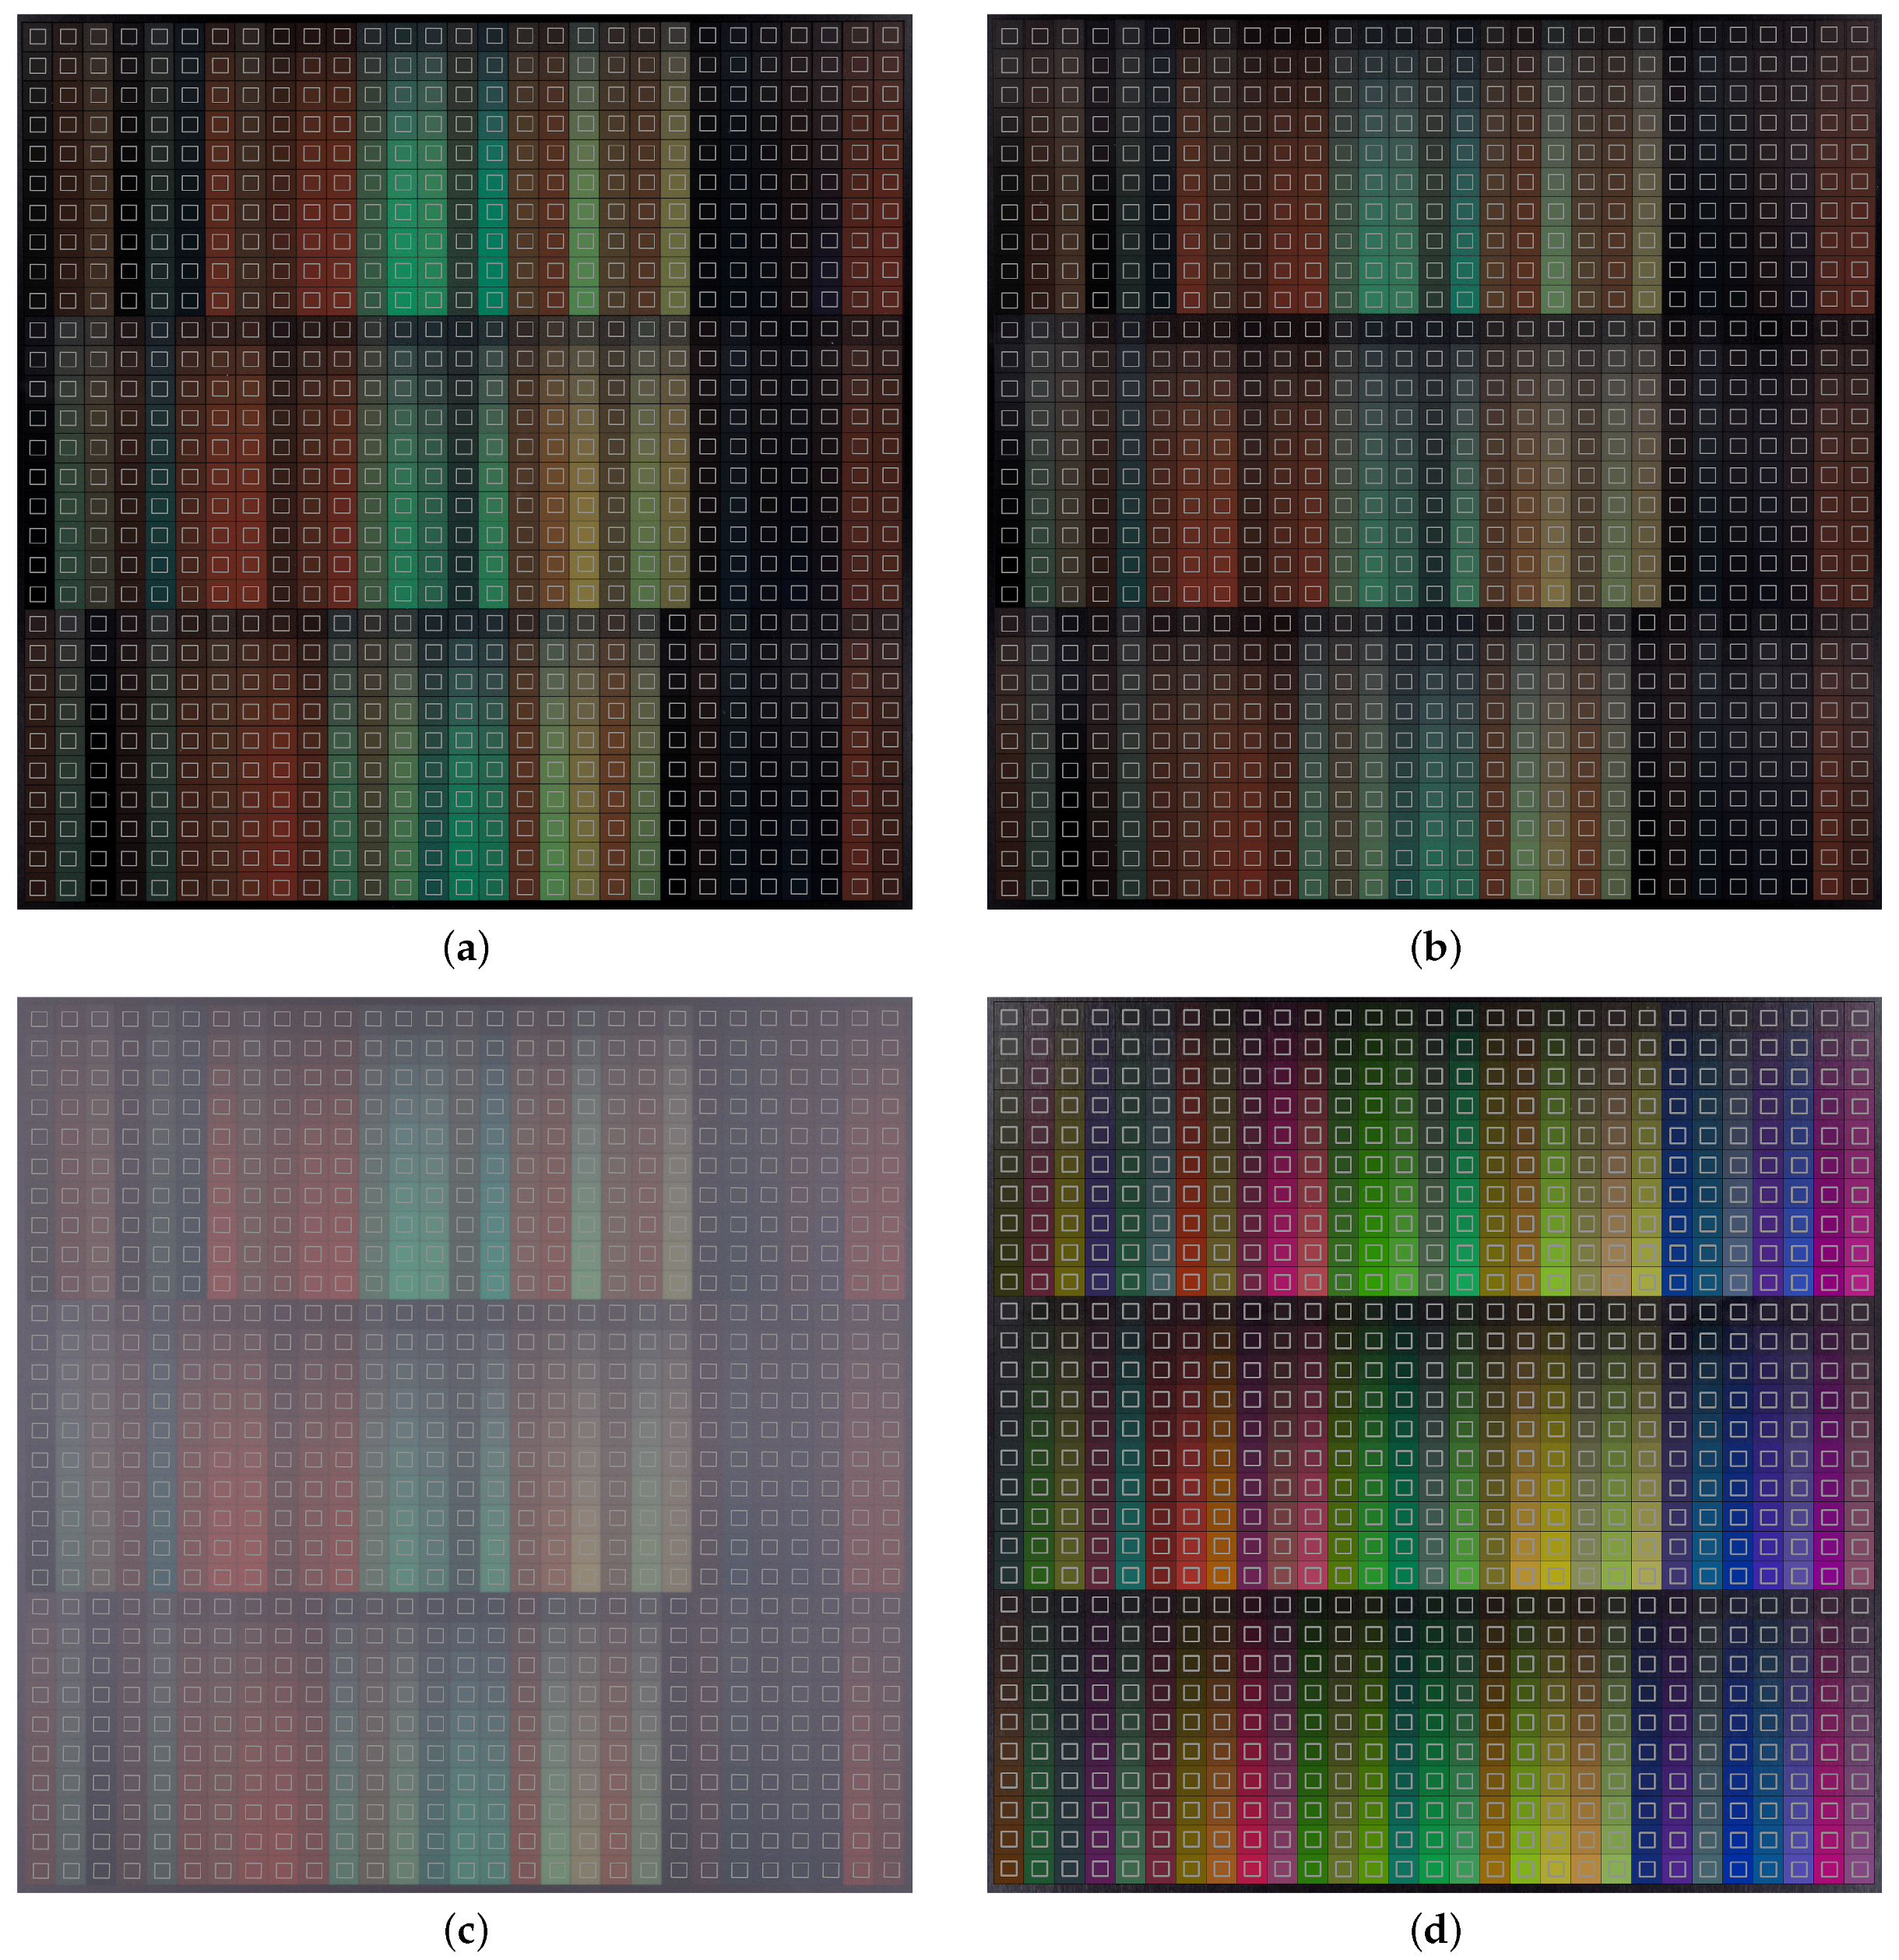
Having acquired colour-calibrated captures of all simulated printed glass laminates, as well as the nominal colour composites as reference, we extracted their effective pixel values in RGB colour space. To this end, we defined regions of interest (ROIs) for each of the 29 × 30 effective printed sample colours in a captured image, and averaged the pixels within them. This masks pixel noise and minor printing flaws from contaminants and scratches on the glass substrate. Each ROI covered ca. 50% of a sample colour’s area to avoid overlapping its neighbour due to inherent positioning errors. In our acquisition process, a ROI covered ca. 60 × 60 pixels from an overall capture resolution of 4200 × 4200. Figure 5a–c shows the effective colours extracted from the sample grid in Figure 2 printed on clear and satinated glass.
We partly automated the extraction process through another Python script (colgrid-extract.py) using OpenCV’s high-level GUI [17]. The script prompts the user to mark three corners of the sample grid in each image, and derives the positions of each ROI from these. Minor misalignment due to rotation of the sample is accounted for with individual vertical and horizontal offsets for each ROI. The images are imported as matrices, averaged over RGB using Python’s numeric processing library [18] and exported as text files for subsequent analysis. In addition, the script warns if the standard deviation over RGB for a cell exceeds a threshold, indicating that its ROI potentially overlaps with a neighbour.
2.5. Effective Colour Gamut Assessment
Given the extracted effective nominal and printed RGB colours, we converted them to the CIE L*a*b* colour space with the last Python script in our toolchain (colgrid-lab.py), which performs a colour space transform using the Python colormath module [19]. In addition, it computes the pairwise colour difference between corresponding effective nominal and printed colours according to the perceptually motivated CIE metric [20] to quantify the fidelity of the effective printed colours.
3. Results
3.1. Effective Colour Gamuts
The gamuts of the effective nominal and printed colours are shown as scatter plots in the CIE L*a*b* colour space in Figure 6. The colour space is depicted as a 2D projection onto the [a*, b*] chromatic plane as seen along the L* luminance axis. Neutral grays lie at the origin in the chromatic plane, while saturation corresponds to radial distance. As a projection, this depiction ignores the luminance L* since it is under heavier influence of the PV module than the hue, and we assume that architects are more tolerant towards deviations in perceived brightness than colour shifts.
3.2. Effective Colour Difference
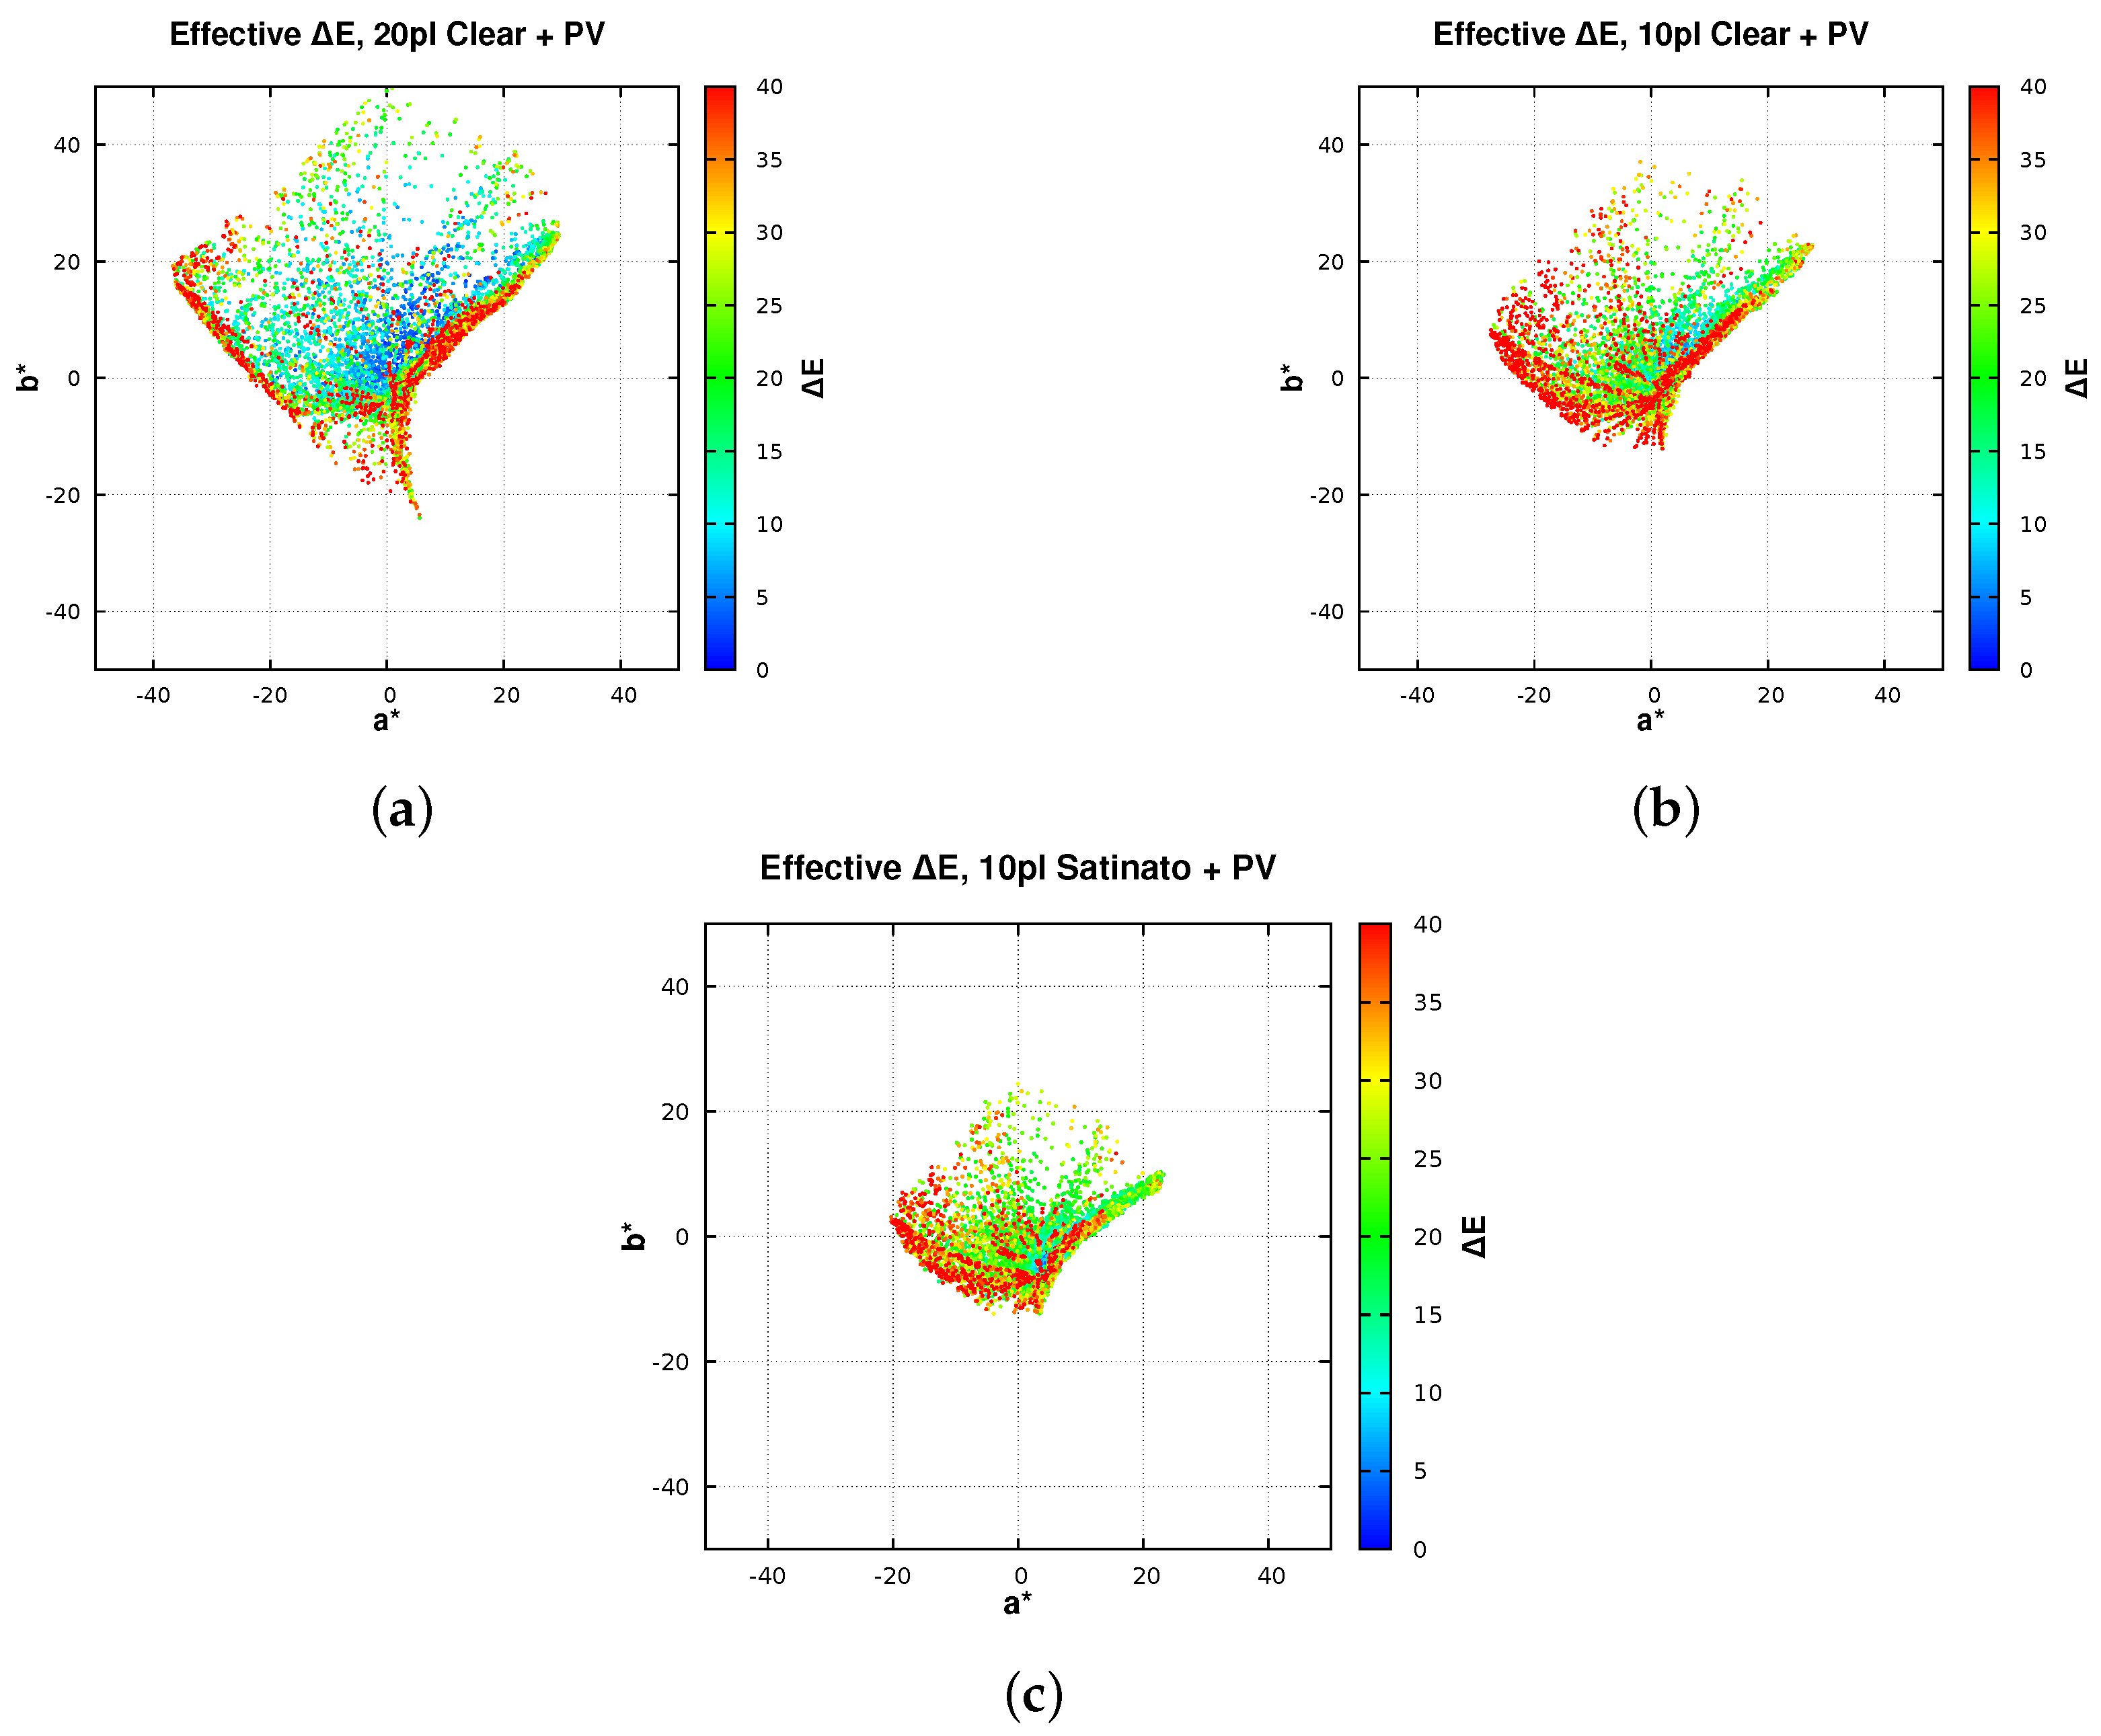
The pairwise colour difference between an effective printed colour and its corresponding effective nominal colour in L*a*b* space is depicted as scatter plots in Figure 7. This data was obtained from our colour transform script described in Section 2.4 and categorised by ink volume and surface finish.
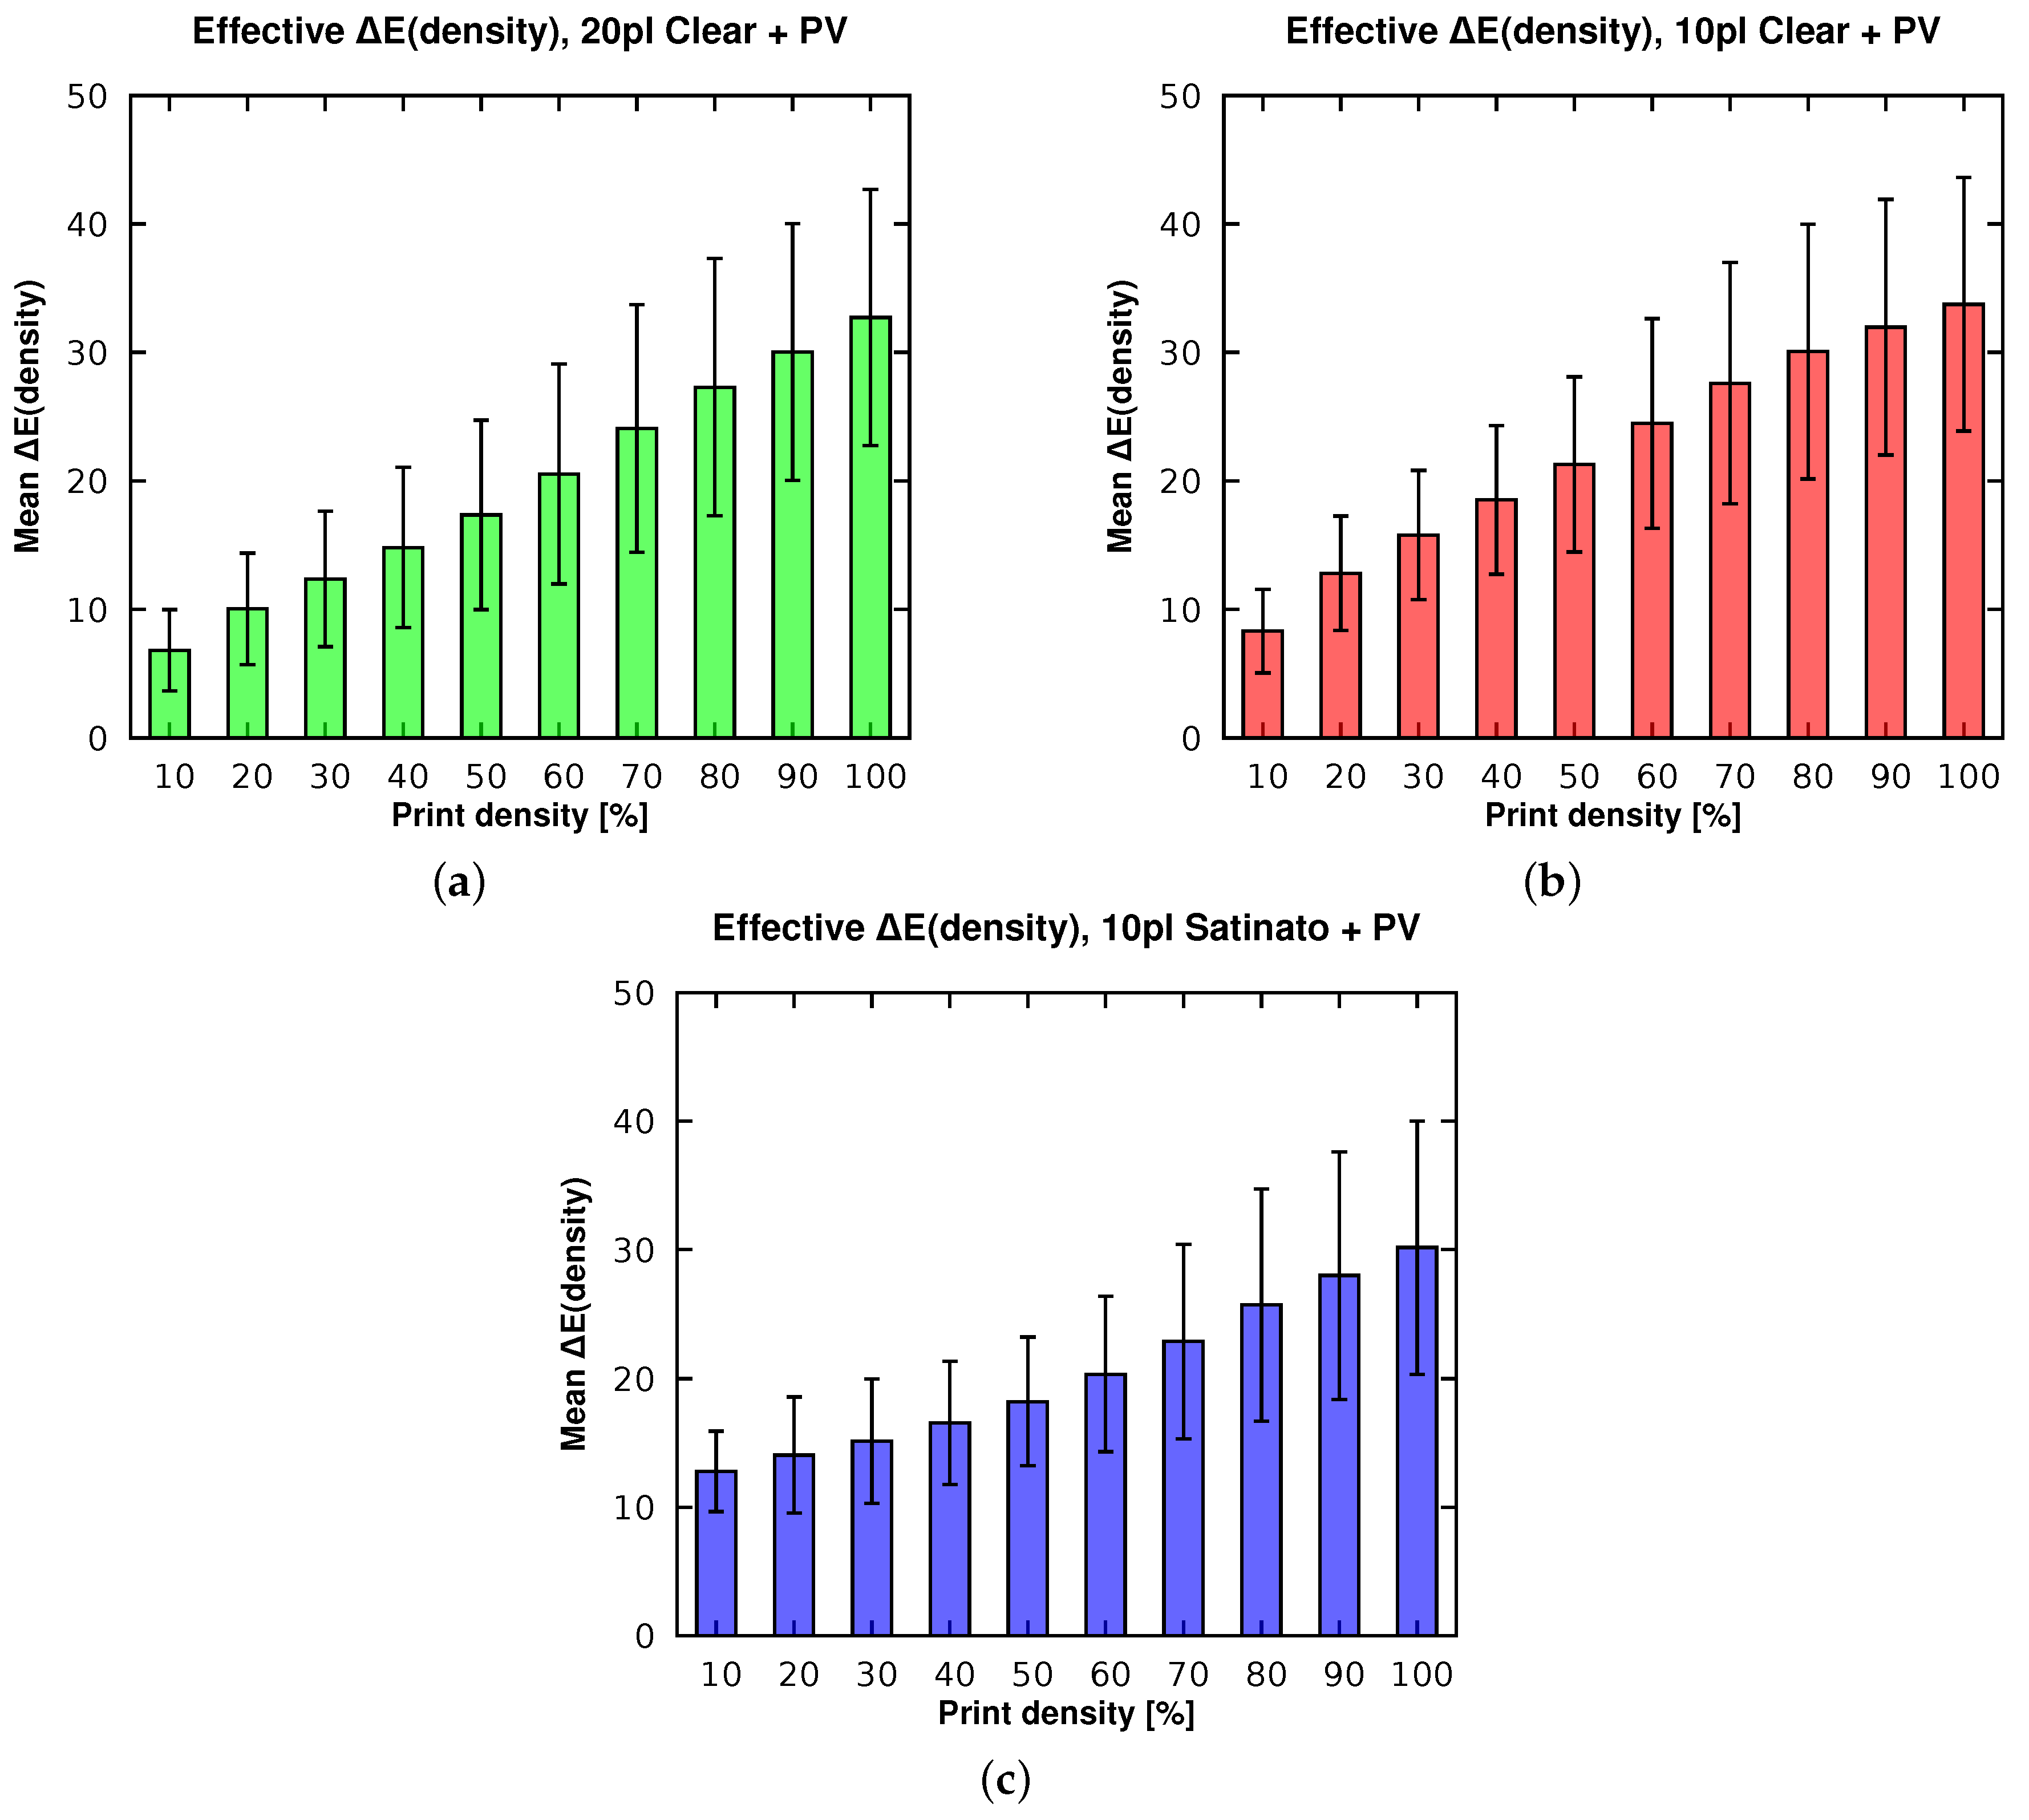
These results are further evaluated statistically according to print density in Figure 8. Each plot depicts the mean for all effective colours extracted for a given print density, as well as their population standard deviation as a measure of error margin. The latter is defined as follows for the set of pairs of corresponding effective printed and nominal colours :
where is the arithmetic mean colour difference between all effective colour pairs in .
4. Discussion
From the effective colours extracted from the sample grid in Figure 5, it is already apparent that there are substantial deviations between the effective nominal and printed colours. As expected, all prints appear noticeably darker and less vivid compared to the corresponding nominal colours due to the influence of the PV module. More significantly, some colours, notably blue and magenta, are almost indiscernible, the former being all but absent, while the latter is rendered as similar shades of red. There are also differences due to ink volume and glass finish; while the 10 pl print is only slightly less saturated than the 20 pl due to the increased translucency to the PV module, the print on satinated glass appears substantially desaturated due to scattering on the front surface, and diminished transmission of the printed backface and PV module.
These initial subjective findings are objectively confirmed by the gamut scatter plots in the projected L*a*b* colour space shown in Figure 6. It is evident that the effective printed gamuts are dramatically smaller compared to the effective nominal gamut, the latter covering the RGB volume as it appears when embedded in L*a*b* [21]. In particular, the printed gamuts for 20 pl and 10 pl on clear glass, and 10 pl on satinated glass, are progressively reduced. While the nominal colours are equidistributed within the RGB space, the corresponding printed colours are asymmetrically distributed, with a skew towards +b* (red–yellow–green) and obvious compression in the [+a*, −b*] quadrant (magenta). Consequently, blue–magenta hues are notably under-represented in the effective printed colours we extracted.
The colour difference distributions in Figure 7 corroborate the gamut findings. increases dramatically with saturation (distance from neutral gray at origin), particularly towards the lower right (magenta) and lower left (blue) quadrants. To put these deviations into perspective, we note that a colour difference above 5 is generally considered perceptible by an average observer [22]. With the exception of moderately saturated reds, yellows, and greens printed with 20 pl on clear glass, the majority of the printed colours deviate well above this threshold. In extreme cases (blue, magenta), the printed colours bear little resemblance to their nominal counterparts. The colour fidelity of the 10 pl prints on clear and satinated glass, and that of saturated colours in the periphery of the plots, is particularly poor.
The statistical analysis in Figure 8 clearly shows that the colour difference increases monotonically with the print density for all ink volumes and glass finishes. This further substantiates the evidence that saturated colours, resulting from high print densities, exhibit higher deviations. On clear glass, a reasonable colour fidelity can only be achieved with a print density of up to 20% using 20 pl, or 10% using 10 pl. While this results in high electrical PV efficiency, the resulting colours are extremely muted. However, it should also be noted that these statistics are slightly distorted by the disproportionately large deviations of the blue and magenta hues.
We attribute the generally constrained gamuts to the influence of the PV module at low ink volumes, as well as surface scattering on satinated glass. The colours are further desaturated, darkened, and possibly shifted in hue by the tempering and shock cooling of the glass that concludes the digital ceramic printing process. The problematic gamut skew in the blue–magenta region is attributed to a relatively low opacity of the blue primary printing colour for a given ink volume, thereby imposing a physical limit on the density of the blue component.
5. Conclusions
We have presented a quantitative analysis of effective colours from ceramically printed glass as they appear when combined with a PV module as a simulated laminate. Our image-based approach allows bulk capture and semi-automatic extraction for comparison with the nominal colours specified for printing. To serve as a reference for comparison, the latter were composited with a capture of the simulated PV module.
Our results show that the gamut of effective colours is significantly constrained compared to their nominal counterparts due to the print’s translucency and resulting visual impact of the PV module. Reducing the ink volume and/or print density, while increasing the PV efficiency, further constrains the gamut. Our analysis also revealed that blue and magenta hues are rendered particularly poorly. Printing on satinated glass offers opportunities for BIPV in environments sensitive to potential glare, but at the expense of a vastly reduced gamut compared to clear glass.
These findings are further substantiated in our colour fidelity assessment based on the CIE colour difference metric. We conclude that, without adequate printer calibration and process control, specific target colours can only be approximated at best. Only moderately saturated shades of red, yellow, and green printed with 20 pl are rendered within a generally accepted tolerance relevant for the target group, namely casual observers. Blue and magenta hues are not recommended as the former render too dark, while the latter render as barely distinguishable shades of red.
We emphasise that these results are representative of the digital ceramic printing technology used to manufacture the coloured PV samples. To put the results into a broader context for the sake of comparison, a similar gamut assessment with other coating technologies should also be undertaken.
In the future, these findings may serve as a basis for guidelines in advising architects seeking innovative BIPV solutions on the choice of colours, and how they will be rendered for a given target PV efficiency. Such design decisions could be supported with the creation of a colour catalogue containing a selection of rendered samples from the effective colours extracted with our process.
Supplementary Materials
The following are available online at https://www.mdpi.com/2075-5309/8/2/30/s1. Figures S1–S12: nominal colour grid bitmaps used for printing, Table S1: nominal colour RGBA values.
Acknowledgments
This research was supported by the Swiss National Science Foundation as part of the project ACTIVE INTERFACES—Holistic strategy to simplify standards, assessments and certifications for building integrated photovoltaics (#153849). We would like to thank Glas Trösch AG, Bützberg, Switzerland for providing the printed glass samples, our colleague Markus Käch for photographing the samples in his studio as part of our image capture process, and our colleague Jeeyoung Park for assisting with the latter.
Author Contributions
Stephen Wittkopf initiated this research and supported it with consultations. Roland Schregle wrote the article, implemented all scripts in the toolchain, generated the graphs and analysed the results. Both authors conducted the image captures and reviewed the publication.
Conflicts of Interest
The authors declare no conflict of interest.
References
- Eidgenössische Kommission für Denkmalpflege. Energie Und Baudenkmal—Empfehlungen Für Die Energetische Verbesserung Von Baudenkmälern; Technical Report; Bundesamt für Energie: Bern, Switzerland, 2009. Available online: https://www.admin.ch/gov/de/start/dokumentation/medienmitteilungen.msg-id-28129.html (accessed on 31 January 2018).
- Lee, K.T.; Lee, J.Y.; Seo, S.; Guo, L.J. Colored ultrathin hybrid photovoltaics with high quantum efficiency. Light Sci. Appl. 2014, 3, e215. [Google Scholar] [CrossRef]
- Escarré, J.; Li, H.Y.; Sansonnens, L.; Galliano, F.; Cattaneo, G.; Heinstein, P.; Nicolay, S.; Bailat, J.; Eberhard, S.; Ballif, C.; et al. When PV modules are becoming real building elements: White solar module, a revolution for BIPV. In Proceedings of the 42nd Photovoltaic Specialist Conference (PVSC), New Orleans, LA, USA, 14–19 June 2015; pp. 1–2. [Google Scholar] [CrossRef]
- Wittkopf, S. Coloured Photovoltaics; Advanced Building Skins: Bern, Switzerland, 2016; Available online: https://zenodo.org/record/399209 (accessed on 1 February 2018).
- Manwiller, R. Digital Ceramic Printing. In Advances in Porcelain Enamel Technology; John Wiley & Sons, Inc.: Hoboken, NJ, USA, 2010; pp. 155–156. [Google Scholar] [CrossRef]
- Green, M.A.; Emery, K.; Hishikawa, Y.; Warta, W.; Dunlop, E.D. Solar cell efficiency tables (Version 45). Prog. Photovolt. Res. Appl. 2015, 23, 1–9. [Google Scholar] [CrossRef]
- Schregle, R.; Krehel, M.; Wittkopf, S. Computational Colour Matching of Laminated Photovoltaic Modules for Building Envelopes. Buildings 2017, 7, 72. Available online: https://www.mdpi.com/2075-5309/7/3/72 (accessed on 1 February 2018). [CrossRef]
- Wittkopf, S. Colored Cover Glass for Photovoltaic Module. Patent DE 102016001628 A1, 17 August 2017. Available online: https://www.google.com/patents/DE102016001628A1?cl=en (accessed on 31 January 2018).
- Clark, A. Pillow: The friendly PIL fork. 2016. Available online: https://zenodo.org/record/44297 (accessed on 1 February 2018).
- Morton, G. A Computer Oriented Geodetic Data Base; and a New Technique for File Sequencing; Technical Report; IBM Ltd.: Ottawa, ON, Canada, 1966. [Google Scholar]
- Verbitsky, A. morton-py: Morton Code Pack/Unpack Library. 2017. Available online: https://github.com/gojuno/morton-py (accessed on 1 February 2018).
- Gill, G. Argyll Colour Management System. 2017. Available online: https://www.argyllcms.com (accessed on 1 February 2018).
- RawTherapee Development Team. 2017. Available online: http://rawtherapee.com/ (accessed on 1 February 2018).
- Schneider, C.A.; Rasband, W.S.; Eliceiri, K.W. NIH Image to ImageJ: 25 years of image analysis. Nat. Methods 2012, 9, 671–675. [Google Scholar] [CrossRef] [PubMed]
- Rasband, W. ImageJ—A Java Image Processing Program Inspired by NIH Image. 2017. Available online: https://imagej.nih.gov/ij/ (accessed on 1 February 2018).
- Barilla, M.E. ImageJ Colour Transformer Plugin. 2013. Available online: https://imagej.nih.gov/ij/plugins/color-transforms.html (accessed on 1 February 2018).
- Bradski, G. The OpenCV Library. Dr. Dobb’s J. Softw. Tools 2000, 25, 120–126. [Google Scholar]
- Rougier, N.P. From Python to Numpy; Zenodo, 2016. Available online: https://zenodo.org/record/225783 (accessed on 1 February 2018).
- Taylor, G. Python Colormath Module. 2015. Available online: https://zenodo.org/record/16007 (accessed on 1 February 2018).
- Sharma, G.; Wu, W.; Dalal, E.N. The CIEDE2000 color-difference formula: Implementation notes, supplementary test data, and mathematical observations. Color Res. Appl. 2005, 30, 21–30. [Google Scholar] [CrossRef]
- Lindbloom, B. RGB Working Space Information–Gamut Projections. 2017. Available online: http://www.brucelindbloom.com/WorkingSpaceInfo.html (accessed on 1 February 2018).
- Mokrzycki, W.S.; Tatol, M. Color difference ΔE: A Survey. Mach. Graph. Vis. 2011, 20, 383–411. Available online: www.researchgate.net/publication/236023905_Color_difference_Delta_E_-_A_survey (accessed on 1 February 2018).
Figure 1.
Overview of our coloured photovoltaic (PV) rendering analysis methodology.

Figure 2.
A sample grid of 29 × 30 nominal RGBA colours as generated by our script for printing on glass. Each column contains three unique hues whose print density is varied per row in 10% increments via the alpha channel. Each colour is indexed by a unique pair of X and Y coordinates.
Figure 2.
A sample grid of 29 × 30 nominal RGBA colours as generated by our script for printing on glass. Each column contains three unique hues whose print density is varied per row in 10% increments via the alpha channel. Each colour is indexed by a unique pair of X and Y coordinates.

Figure 3.
Z-curve subdividing the normalised RGB colour space for nominal colour generation. Each 3-dimensional RGB coordinate maps to a unique linearised index, the Morton code, corresponding to the cumulative length of the curve starting at the origin (bottom left) and ending at unity (upper right).

Figure 4.
Image capture setup for effective colour acquisition from simulated printed glass PV laminates (a); Each printed glass panel was immersed in a black semi-matte water basin to simulate the appearance of a laminated PV module (b).
Figure 4.
Image capture setup for effective colour acquisition from simulated printed glass PV laminates (a); Each printed glass panel was immersed in a black semi-matte water basin to simulate the appearance of a laminated PV module (b).

Figure 5.
Averaged effective colours extracted from the sample grid in Figure 2 printed with 20 pl (a) and 10 pl (b) on clear glass, and with 10 pl on satinated glass (c). The corresponding effective nominal colours are shown in (d). Note that these images include the superimposed ROIs from the extraction script, and are equalised for clarity.

Figure 6.
Scatter plots of effective nominal (black) vs. printed (red, green, blue) colours in projected L*a*b* space. The background colours are representative and for orientation only.
Figure 6.
Scatter plots of effective nominal (black) vs. printed (red, green, blue) colours in projected L*a*b* space. The background colours are representative and for orientation only.
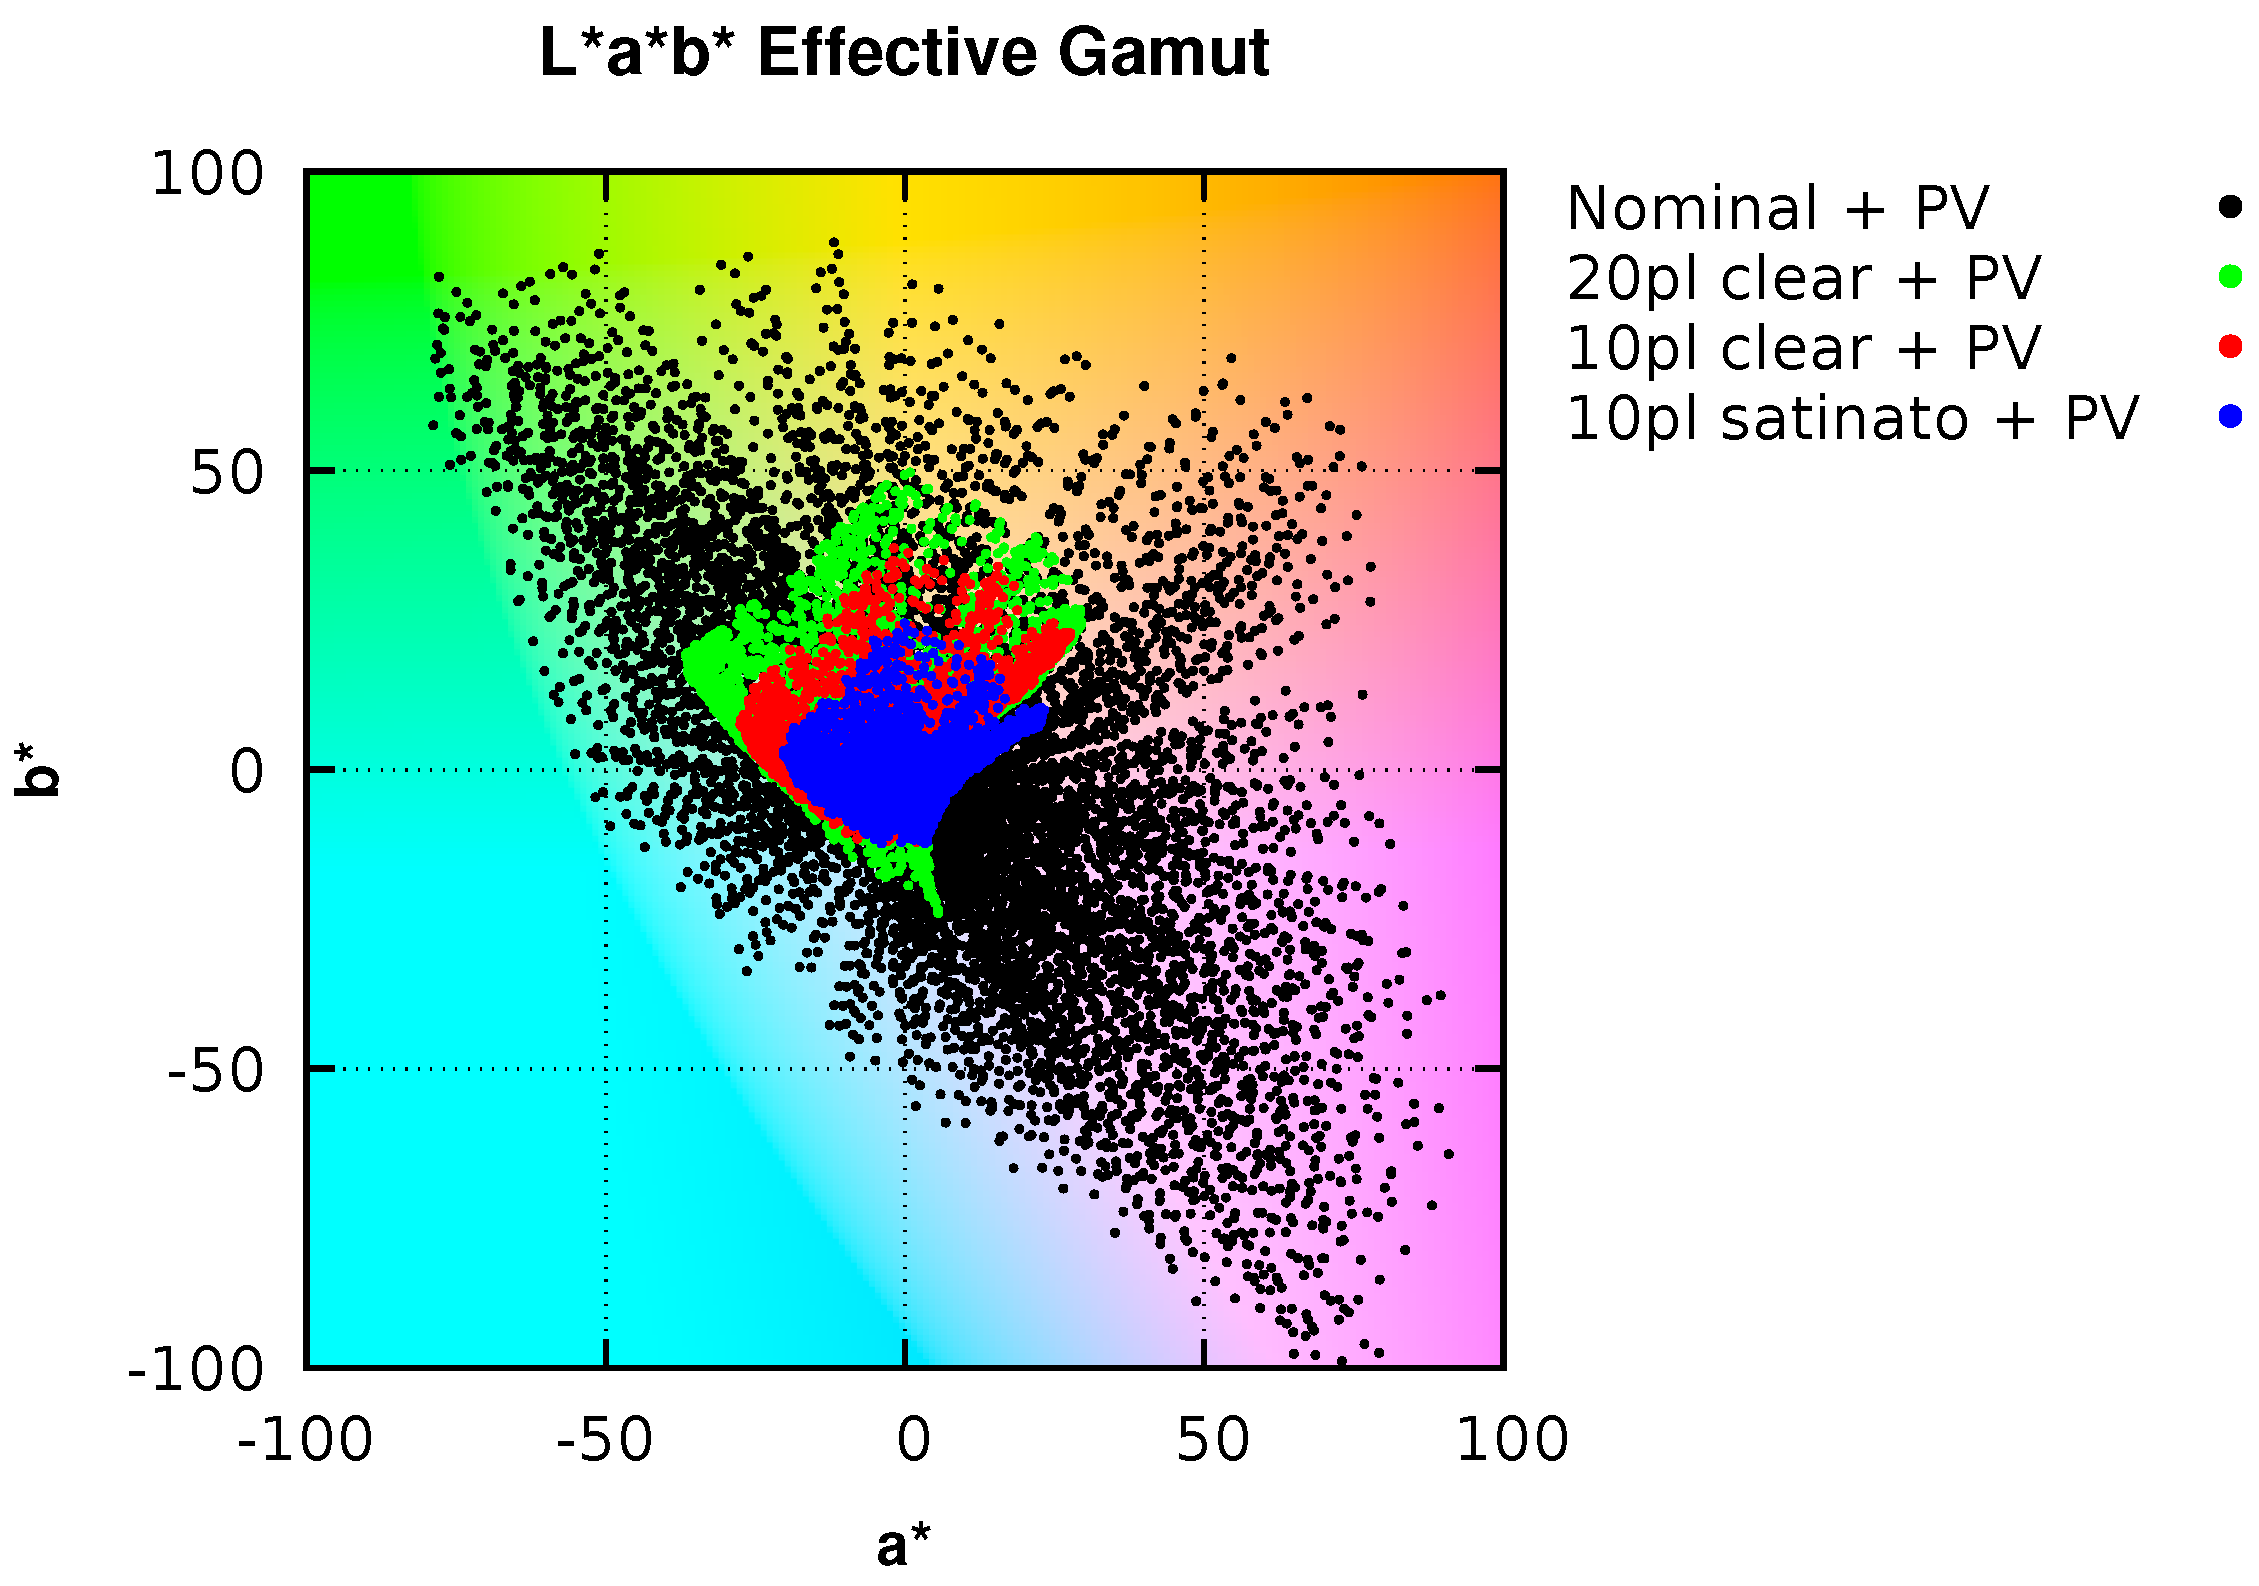
Figure 7.
Colour difference between effective printed and nominal colours in L*a*b* space for 20 pl (a) and 10 pl (b) on clear glass, and 10 pl on satinated glass (c). The locations of the points correspond to the effective printed colours.
Figure 7.
Colour difference between effective printed and nominal colours in L*a*b* space for 20 pl (a) and 10 pl (b) on clear glass, and 10 pl on satinated glass (c). The locations of the points correspond to the effective printed colours.

Figure 8.
Mean and standard deviation of colour difference between effective printed and nominal colours as a function of print density for 20 pl (a) and 10 pl (b) on clear glass, and 10 pl on satinated glass (c).
Figure 8.
Mean and standard deviation of colour difference between effective printed and nominal colours as a function of print density for 20 pl (a) and 10 pl (b) on clear glass, and 10 pl on satinated glass (c).
© 2018 by the authors. Licensee MDPI, Basel, Switzerland. This article is an open access article distributed under the terms and conditions of the Creative Commons Attribution (CC BY) license (http://creativecommons.org/licenses/by/4.0/).
Share and Cite
MDPI and ACS Style
Schregle, R.; Wittkopf, S. An Image-Based Gamut Analysis of Translucent Digital Ceramic Prints for Coloured Photovoltaic Modules. Buildings 2018, 8, 30. https://doi.org/10.3390/buildings8020030
AMA Style
Schregle R, Wittkopf S. An Image-Based Gamut Analysis of Translucent Digital Ceramic Prints for Coloured Photovoltaic Modules. Buildings. 2018; 8(2):30. https://doi.org/10.3390/buildings8020030
Chicago/Turabian StyleSchregle, Roland, and Stephen Wittkopf. 2018. "An Image-Based Gamut Analysis of Translucent Digital Ceramic Prints for Coloured Photovoltaic Modules" Buildings 8, no. 2: 30. https://doi.org/10.3390/buildings8020030
Note that from the first issue of 2016, this journal uses article numbers instead of page numbers. See further details here.