Energy and Economic Performance of Solar Cooling Systems in the Hot-Summer and Cold-Winter Zone

Faculty of Architecture, Civil Engineering College, Ningbo University, Ningbo 315211, China
*
Author to whom correspondence should be addressed.
Buildings 2018, 8(3), 37; https://doi.org/10.3390/buildings8030037
Submission received: 17 January 2018
/
Revised: 16 February 2018
/
Accepted: 26 February 2018
/
Published: 2 March 2018
(This article belongs to the Special Issue Application of Renewable Energy Sources in Buildings)
Abstract
:Building energy consumption has distinctly increased in the hot-summer and cold-winter zone in China. Solar cooling technology has been developed to reduce the increasing electricity consumption for air conditioning and to shift the peak load during hot summer days. This paper presents a performance simulation and economic analysis for both photovoltaic (PV) and thermal solar cooling systems compared to a reference system, which is composed of two electric heat pumps. The results show that 30.7% and 30.2% of primary energy can be saved by using the PV and the thermal system, respectively. The payback time is 6–7 years for the PV system, but more than 20 years for the thermal system based on current conditions in China. Therefore, the PV system is more suitable for practical application in the hot-summer and cold-winter zone. The thermal system could be an alternative when middle- and high-temperature solar thermal collector technology has been further developed, as well as following mass production of small- and middle-sized chillers.
1. Introduction
In recent years, building energy consumption has been steadily increasing due to recent economic development and improved living standards in China. Building energy consumption accounts for 30% of total energy consumption in China [1], 50–60% of which is attributable to air conditioning units in public buildings located in the hot-summer and cold-winter zone [2]. Conventional air conditioning systems use electricity to drive a compressor that circulates a refrigerant, absorbing and removing heat from a space. A rapid increase in both the number and use of air conditioning units results not only in a considerable increase in power consumption, but also in a power peak demand during the hottest hours of summer days, which has a strong impact on the existent power grid and often results in power blackouts during this time.
Solar cooling technology has been developed to reduce the increased electricity consumption associated with air conditioning and to shift the peak load on hot summer days. This technology uses solar energy to drive a refrigerator for cooling the space. Compared to conventional compressed air conditioning systems, solar cooling systems have the following advantages:
- Cooling capacity increases in proportion to rising solar radiation, concurrent to demand for cooling in summer;
- Solar energy is used to reduce the consumption of primary energy and consequently reduces greenhouse gas emissions.
There are two methods to use solar energy for air conditioning applications, namely solar photovoltaic (PV)-based electrical cooling systems and collector-based thermal cooling systems. Many studies have been carried out to promote the development of solar cooling techniques.
Hartmann et al., present a comparison of solar thermal and solar electric cooling for a typical small office building exposed to two different European climates (Freiburg and Madrid) [3]. They found that, for large collector areas, up to 40% (Freiburg) and 60% (Madrid) of primary energy can be conserved via a solar thermal system and solar electrical system. To do so, the collector area of the solar thermal system must be more than six times larger than the corresponding solar electrical collector field to achieve the same amount of saved primary energy.
Boopathi Raja et al. review the past efforts of solar assisted-single effect vapor absorption cooling systems using a LiBr-H2O mixture for residential buildings [4]. Their results suggest that two important parameters determine the most economical solar cooling systems. They are (1) the cost of the solar collection and storage technologies and (2) the performance of the cooling technologies.
Noro et al., evaluated the potential of integrated solar absorption cooling and heating systems with sensible vs. PCM (Phase Change Material) heat storage tanks by TRNSYS tool [5], which is an graphically based software environment used to simulate the behavior of transient systems. An economic analysis reveals that the greater investment costs of PCM technology are justified in a solar cooling plant only in the case of a higher natural gas tariff or a significantly lower PCM cost.
Beccali et al. compared the energy and performance of two families of solar-assisted cooling systems (with solar thermal or PV) to conventional ones by means of the Life Cycle Assessment (LCA) methodology [6]. The results indicate that the systems with the PV grid-connected plant frequently performed best.
Eicker et al., compared the primary energy and economy of two solar cooling systems with the simulation programs TRANSOL and INSEL [7], which is a dynamic simulation model for transport and transformation of solutes in soils and a simulation system for renewable electrical energy supply systems respectively. One cooling system was a compression cooling machine fed with electricity provided by photovoltaic (PV) modules; the second an absorption cooling machine operated by solar-collected heat. The results show that the photovoltaic cooling system is favorable in comparison with the thermal solar cooling system. The initial investment costs strongly influenced both the payback and cost of saved primary energy.
Izquierdo et al., carried out theoretical–experimental research by feeding a reversible air–water pump through a solar photovoltaic (PV) micro grid [8]. It was found that the system could maintain a comfortable internal temperature during days with values of minimum-maximum outdoor temperatures between 1 °C and 16 °C. The global efficiency was about 18.2%.
Roselli et al. investigated a solar electric-driven heat pump for an office building located in southern Italy, which resulted in low energy demand compared to the most common type of Italian buildings [9]. It was found that the system based on the solar electric-driven heat pump resulted in a saving of primary energy and equivalent CO2 emission reduction of about 81% when compared to the reference conventional system based on a boiler fueled by natural gas and an electric-driven chiller.
Khan et al., developed configurations based on TRNSYS models to evaluate the thermal performance of a solar-based single effect absorption cooling system with a peak cooling capacity of 298 kW [10]. Simulation results showed a marked difference of up to 30% between monthly collector efficiencies of evacuated tube collectors (ETCs) and a flat plate solar collector (FPC). It can be concluded that FPC is not a preferred choice for current systems, due to the requirement of a high driving temperature of over 100 °C.
Although many studies have been carried out, solar cooling systems have not been widely used due to the high investment cost and a long payback period. There have been less than 10 demonstration projects built and operated in China. Most of them are solar thermal cooling systems. A new system has been planned for the city of Ningbo, Zhejiang Province, which is located in the hot-summer and cold-winter zone in China. To determine which technology will be used, the authors have simulated different solar cooling systems by using the Vela Solaris Polysun® tool, comparing both technical and economic factors.
2. Simulation Method and Considerations
2.1. Simulation Tool
All simulations in this paper were carried out using the Vela Solaris Polysun®, which is a well-established software tool in the field of planning and optimization of building energy systems [11]. The simulation kernel is based on a plug-flow simulation of the thermal system, and it uses statistical meteorological data as an input [12,13].
2.1.1. Solar PV Model
Polysun calculates the yield of a solar PV system by means of the H.G. Beyer model [14]. This model relies on the following inputs [11]:
- Three efficiency readings for the module at different irradiance conditions;
- Three efficiency readings for the inverter with different loads;
- The installed power;
- The module’s temperature coefficient.
Such interpolation nodes enable an efficiency curve to be identified for the module and the inverter. These curves, the installed power, and the temperature coefficients allow the yield to be calculated depending on the irradiance and module temperature. The module temperature can be calculated from ambient temperature, irradiance, and gamma parameter for rear ventilation:
Module temperature = ambient temperature + gamma × irradiance/1000 W/m2
The following factors may be inferred from the resulting yield:
- Soiling (default value 2%; it can be defined in the PV field);
- Degradation (default value 0.2%; it can be defined in the PV field);
- Standard deduction for piping losses, module mismatch and module derating: 4% + 4% × inverted load.
2.1.2. Solar Thermal Cooling Model
In accordance with the standards for measurement (EN 12975), non-covered collectors are given an additional parameter. The efficiency function curve has the following form [11]:
The coefficients η0, bu, b1 and b2 are calculated by means of the adaption of the curve. G is the total irradiance which is determined on the basis of the following equation:
EL is the measurement of the intensity of long-wave irradiance onto the collector area and Ta is the outdoor temperature. For ε/α, the value is fixed at 0.85, if the supplier has not given other indications.
The heat-driven chiller in Polysun is based on the absorption chiller cycle. An analytic solution of the governing equations of the single-effect closed-cycle absorption chiller has been suggested by Kim et al. [15], which is used in Polysun. The main advantage of this model is that it can enable a quick simulation of the absorption system with minimal information on working fluids and operation condition. The model is based on the heat exchanger effectiveness definition, Duehring equation, and thermodynamic principles of the main constitutive components. The absorption machine model has three pairs of connecting ports enabling heat exchange between heat source, heat sink, and cooling load fluid domains over the component. Energy and mass balance equations of each existing component in the system are solved in a certain manner using the Explicit Plug-flow Technique.
2.2. Climate Conditions
Weather in China's hot-summer and cold-winter zone is severe. The average outdoor temperature during July, the hottest month, is 27.6 °C, while the average outdoor temperature during January, the coldest month, is 6 °C. Furthermore, the relative air humidity in most cities of this region is 75–80% and is about 75.6% in Ningbo. Thus, air conditioning systems are necessary both for cooling in summer and for heating in winter.
The location of numerous cities falls within the hot-summer and cold-winter zone, in which annual total solar radiation is between 1000–1500 kWh/m2. Average sunshine hours in Ningbo are 1855.6 h per year and average daily sunshine hours are 5.41 h. The annual total solar radiation is 1280.5 kWh/m2, 78% of the average value of 1627.8 kWh/m2 in China. The total solar irradiation is 378.3 kWh/m2 during the four coldest months (November to February), and is 559.8 kWh/m2 during the hottest months (July to September).
2.3. Building Characteristics
The solar cooling system will be installed and operated in a newly built activity center for a residential community of senior citizens. The single-story building is oriented along the north–south axis. It has a usable floor area of 420 m2 and an interior height of 4.2 m. One part of the roof with an area of 200 m2 will be used for the solar cooling system, with the rest designated for a green roof. The building includes different rooms, e.g., clinic, office, reading room, etc. The construction characteristics of this building are shown in Table 1.
2.4. System Definition
A reference system and two solar cooling systems have been defined for the energy flows simulation and economic analysis. In order to compare the two systems, the maximum number of PV panels/solar collectors will be installed on the 200 m2 area of the roof.
2.4.1. Reference System
The reference system consists of two heat pumps. They produce warm or chilled water for building heating and cooling through fan coils. The entire electricity demand of the heat pumps is covered by the public grid. The nominal cooling capacity of the heat pumps is 28 kW and 65 kW, respectively, and the nominal heat capacity is 30 kW and 69 kW. The average rated COP values were taken as 2.82 for cooling operation and as 3.11 for heating operation during the simulation process.
2.4.2. PV Solar Cooling System
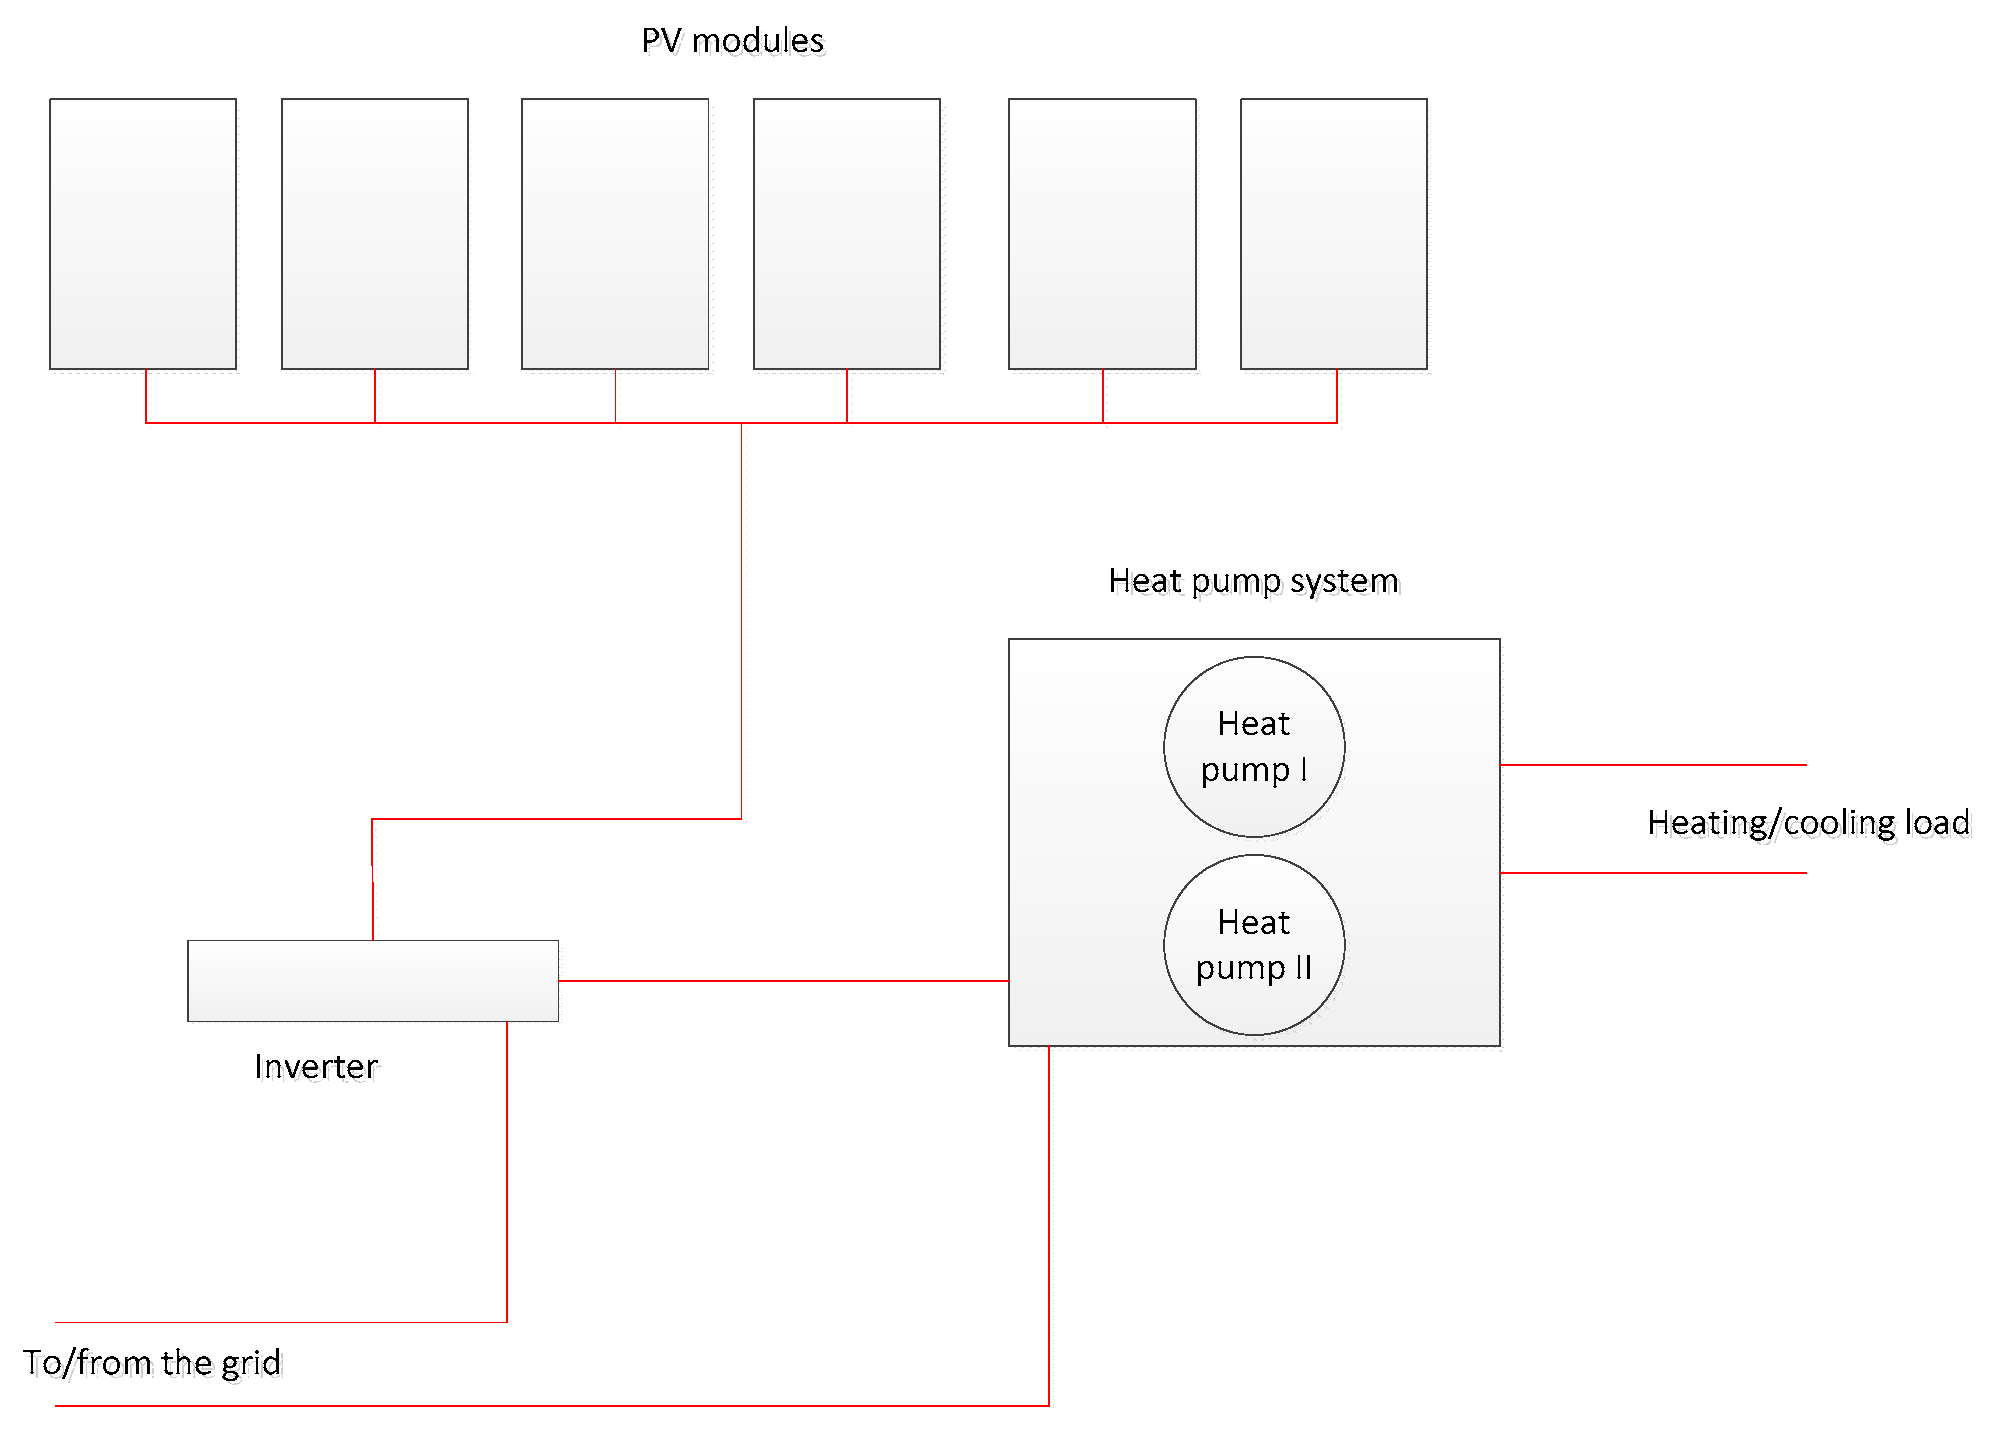
This system uses the same heat pumps as the reference system. However, electricity demand is obtained, preferably, by PV modules and from the public grid, if required. If the electricity produced by the PV is higher than the electricity demand, the surplus can be fed into the public grid. Figure 1 shows the schematic of the PV solar cooling system. This system is composed of 80 PV modules and 1 inverter. A PV module has a dimension of 1650 × 992 × 45 mm. The 80 modules are arranged in three rows (26 modules in one row and 27 modules in each of the other two rows) and the distance between the rows is 0.91 m. Their tilt angel is 25°. The maximum power of the PV modules is 195 W at standard test conditions and the module efficiency is 14.8%. The inverter has the maximum DC power of 20.4 kW and the rated AC output power of 20.0 kW. Its maximum efficiency is 98.2%.
2.4.3. Solar Thermal Cooling System
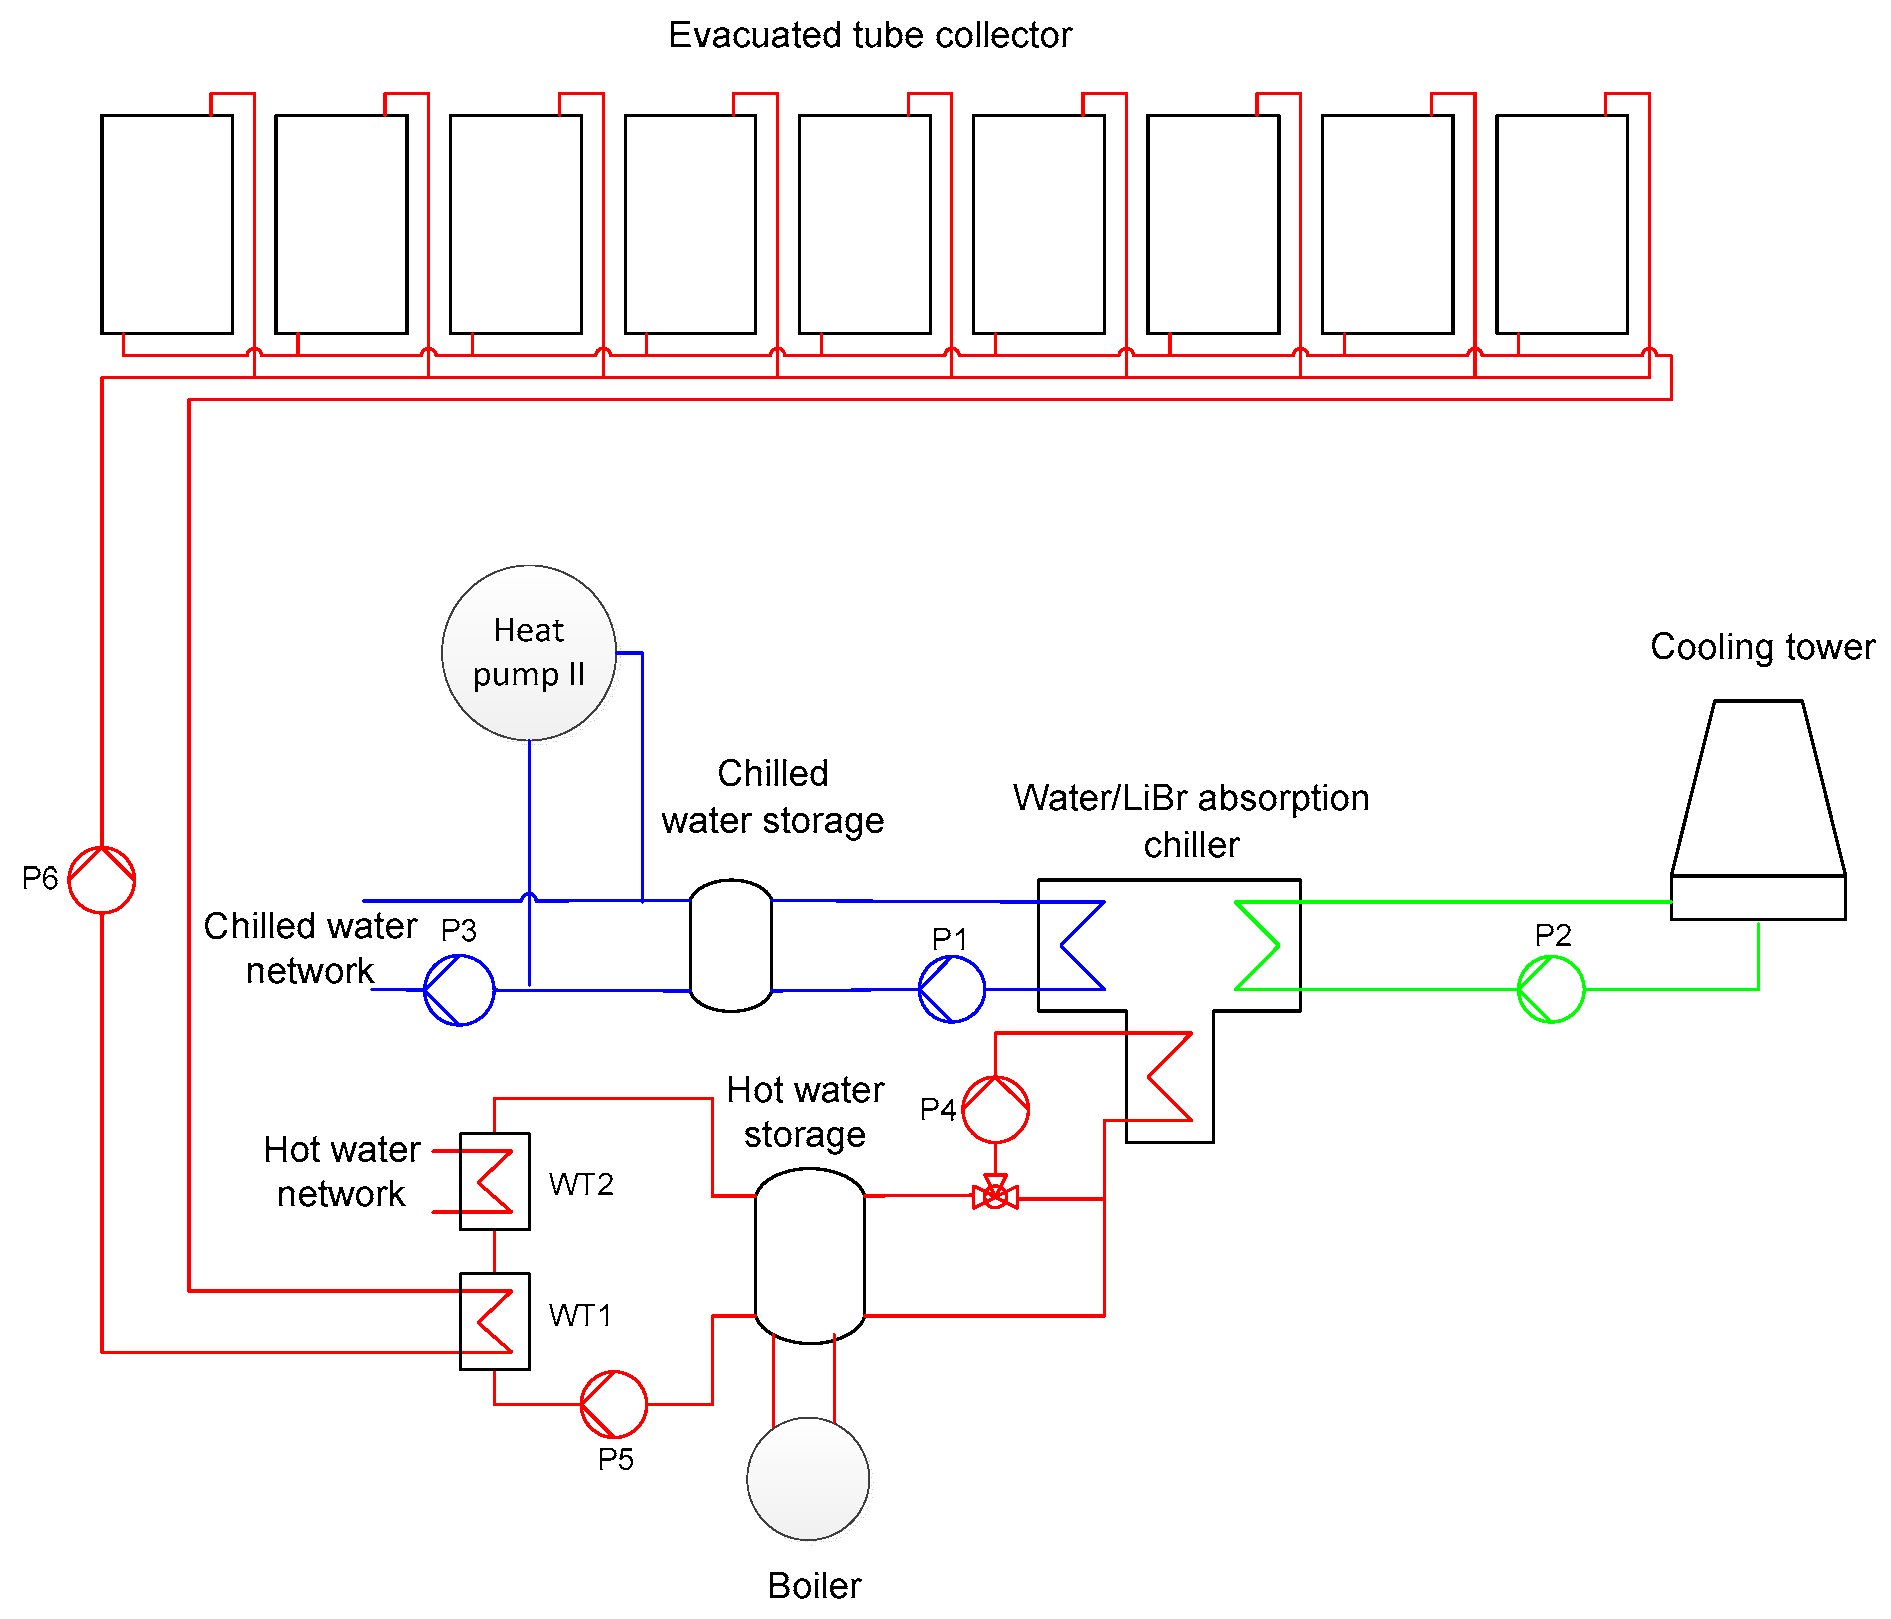
The other system is a solar collector-based thermal cooling system, in which a water/lithium bromide (LiBr) absorption chiller is driven by hot water obtained by solar collectors. As shown in Figure 2, the system consists of 36 evacuated tube collectors with a total aperture area of 120 m2, an absorption chiller with a nominal cooling capacity of 35 kW, a cooling tower as well as hot water and chilled water storages. A solar collector has a dimension of 2085 × 1640 × 103 mm. The 36 collectors are arranged in four rows and the distance between the rows is 2 m. Their tilt angel is 42° to get more solar radiation in summer. They transfer solar radiation into thermal energy to produce hot water at a temperature range of 70–95 °C, which is stored in the hot water storage area. The absorption chiller is driven by the hot water and produces chilled water at a temperature of 10 °C, which is stored in the chilled water storage area for cooling the building. A cooling tower is used to extract waste heat from the chiller. In winter, the hot water can be used directly for heating the building. A boiler with a heating capacity of 40 kW is used as a backup system, which provides hot water for the chiller in summer or for heating in winter.
3. Results and Discussion
3.1. Building Energy Consumption
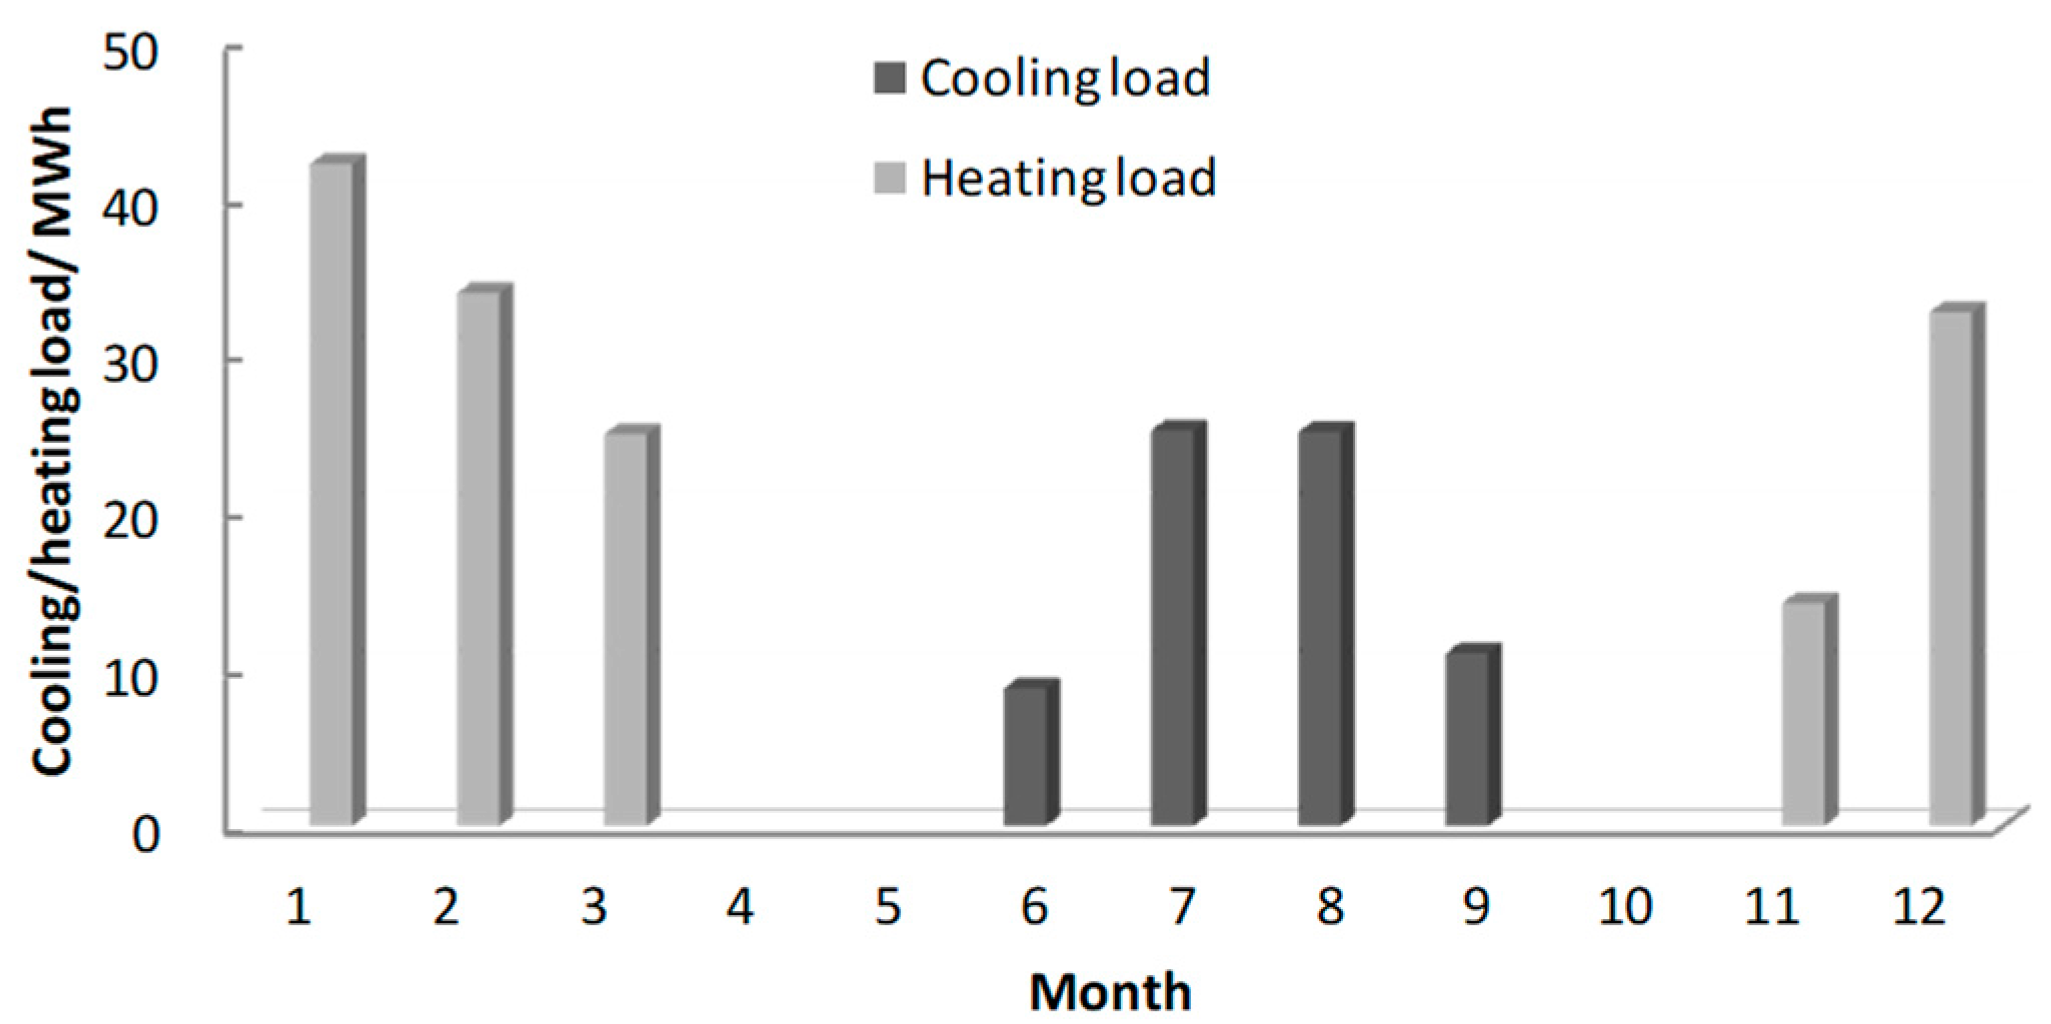
The building will be occupied consistently by 50 people between 08:00 and 20:00 for 12 h every day, which has been considered as the operation period of heating and cooling systems. The total internal cooling loads have been taken as 58 KW in the simulation, including 2 kW caused by lighting, 3 kW by electric appliances, 7.5 kW by people and 45.5 kW by ventilation. The cooling and heating temperatures are set to 23 °C and 18 °C, respectively, according to the GB 50189-2005 “Design standard for energy efficiency of public buildings” and JGJ 134-2010 “Design standard for energy efficiency of residential buildings in hot-summer and cold-winter zone”.
Figure 3 shows the cooling and heating energy consumption during a typical meteorological year. It can be seen that the annual cooling load is 70.16 MWh/y and the heating load 148.20 MWh/y. The annual electricity consumption is 24.88 MWh/y for cooling and 47.65 MWh/y for heating according to the COP values of the reference system. The demand for domestic hot water has not been considered in this paper.
3.2. Energy Performance
The simulation results of the PV solar cooling system are shown in Table 2. The annual energy production of alternating current is 22.3 MWh, which can cover 30.7% of the building's electricity consumption for cooling/heating. From Figure 4, it can be seen that electricity produced by the PV system is lower than the electricity demand for cooling/heating in most months. Thus, the heat pump system will additionally use 59.4 MWh/y of electricity from the public grid to cover the complete cooling/heating load of the building.
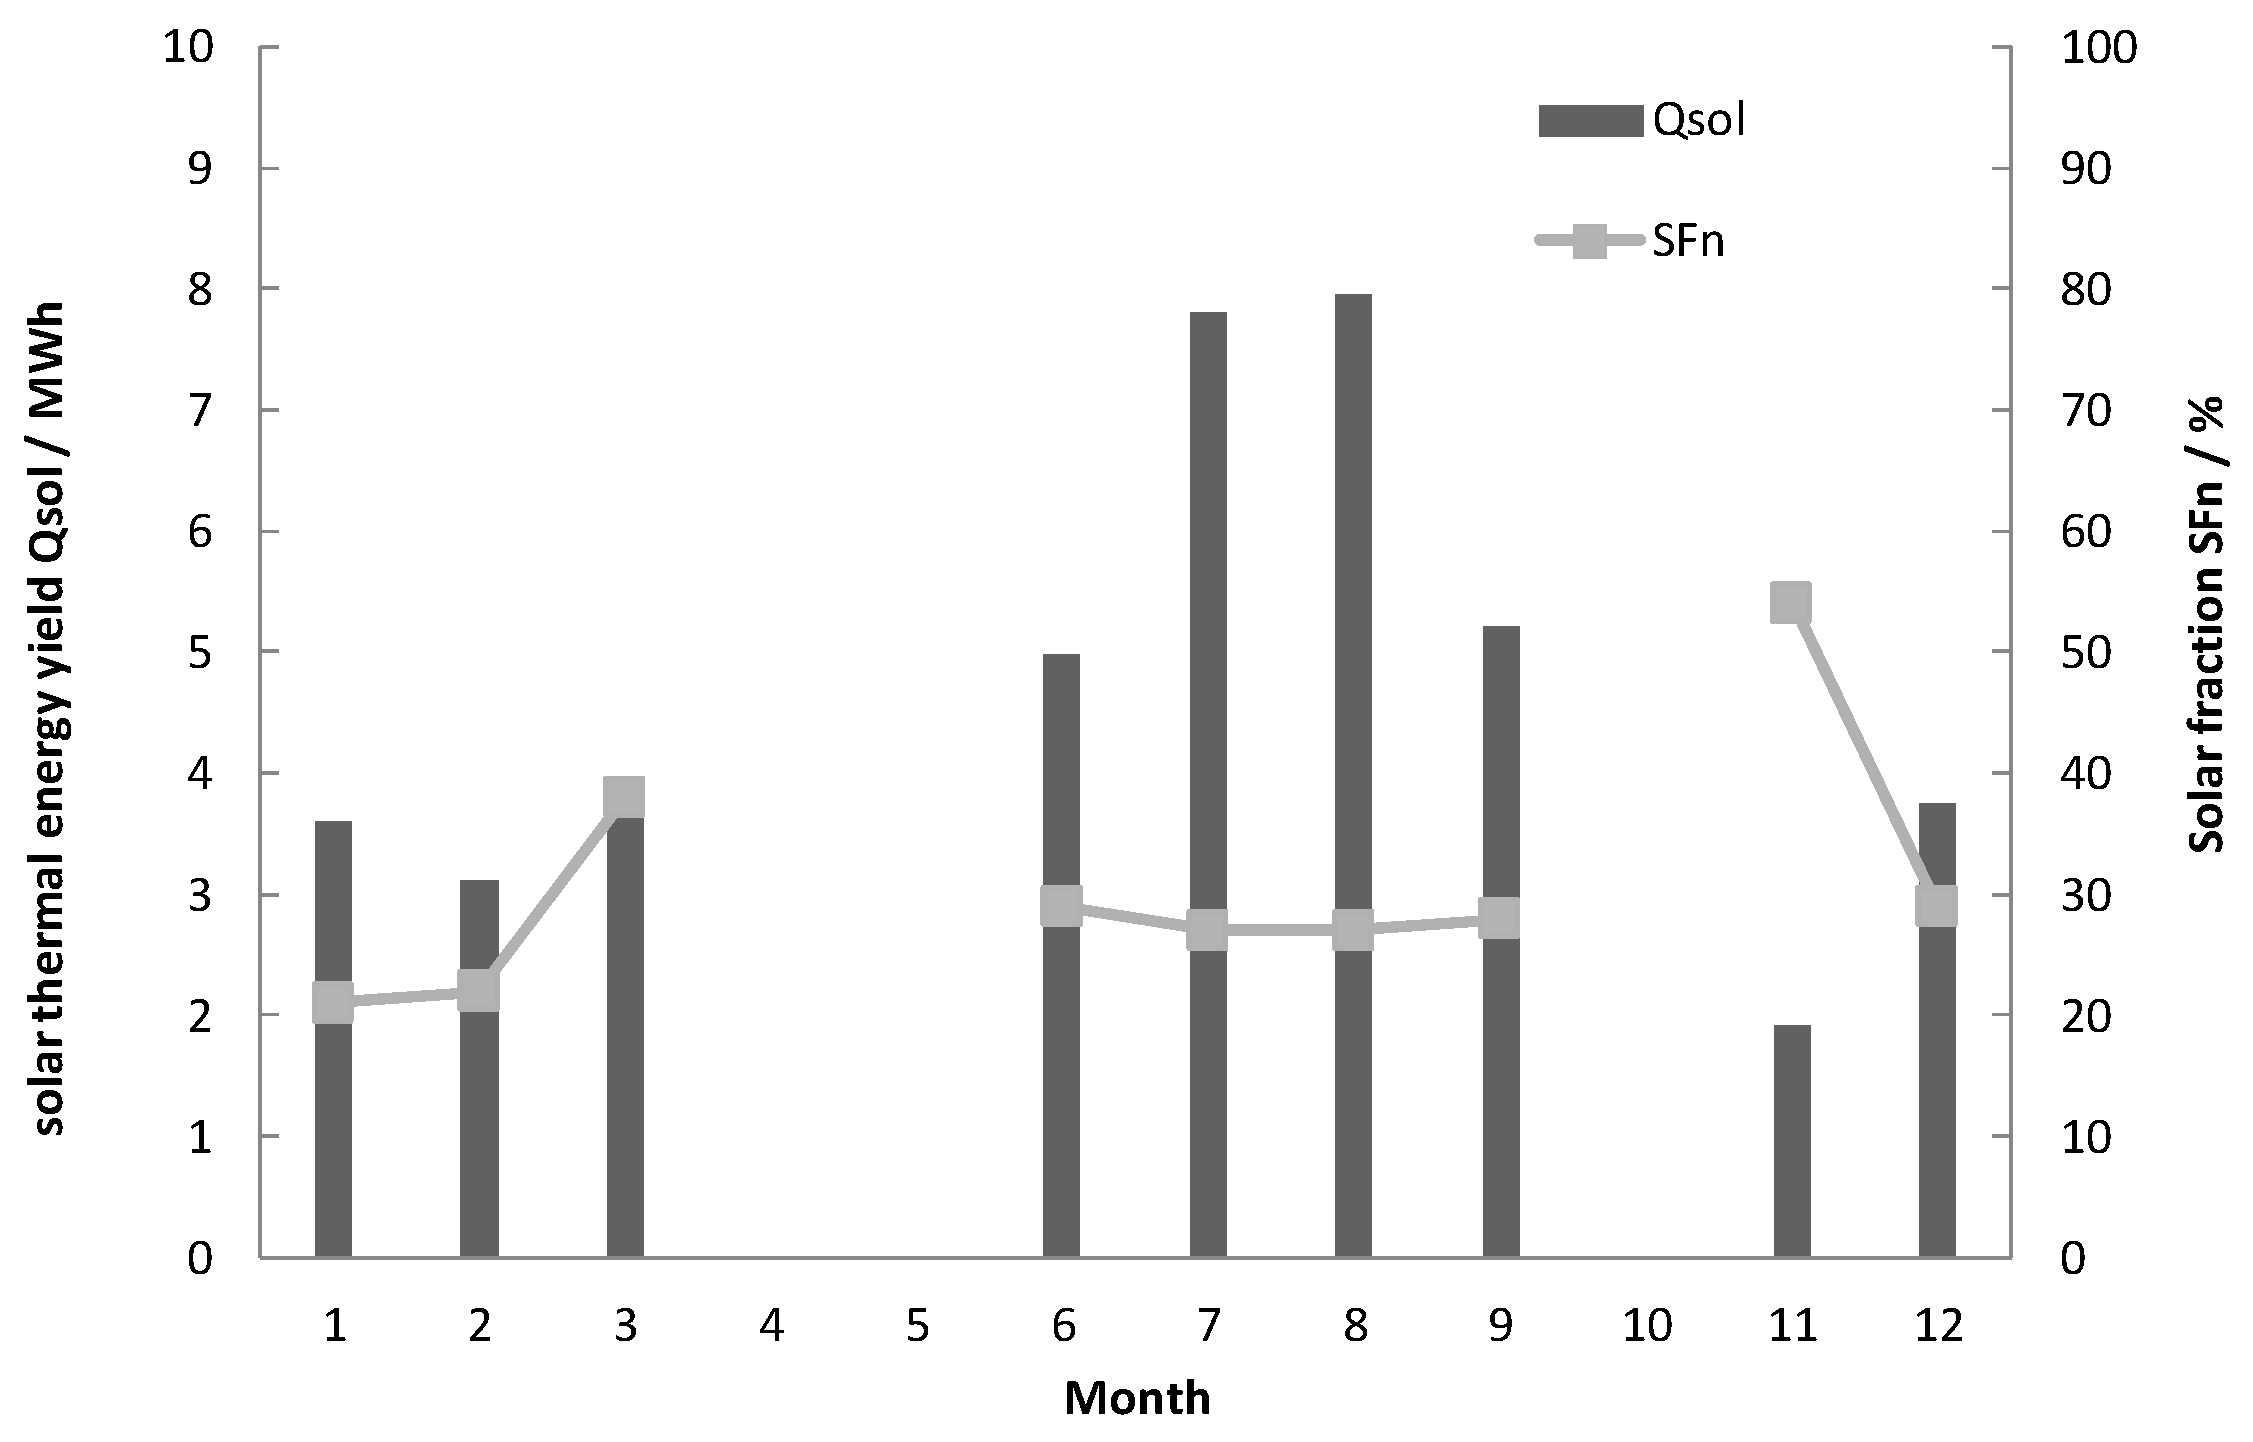
The simulation results of the solar thermal cooling system are shown in Table 3. The annual solar thermal energy yield is 52.8 MWh and the average solar fraction is 30.6%. As shown in Figure 5, the system yields the most thermal energy during the hottest summer days from July to September and the solar thermal energy covers 27.75% of the total energy consumption for cooling. The fraction of solar energy to the total energy consumption is about 32.80% during the coldest winter days from November to March. The system will not be operated in April, May, and October due to the low demand on domestic hot water. However, the average solar fraction would be increased to 40% if a higher than anticipated domestic hot water demand occurs during these months.
In order to compare the two solar cooling systems with the reference system, all the energy consumption has been converted into primary energy. The conversion factor of electricity to primary energy is 0.36 and the factor of gas to primary energy is 1 [16].
Table 4 presents the primary energy savings of the two systems compared to the reference system. The annual electricity consumption of the reference system is 72.53 MWh, corresponding to 201.47 MWh primary energy. The PV system produces 22.30 MWh electricity per year, corresponding to 61.94 MWh primary energy. The energy saving rate is 30.7% compared to the reference system. The solar thermal cooling system has the maximal energy savings of 58.13 MWh per year, which would consume 60.81 MWh gas by using the boiler shown in Table 3. It corresponds to 60.81 MWh primary energy. The energy saving rate is 30.2% compared to the reference system. It can be seen that the two systems have a similar energy saving effect.
3.3. Economic Analysis
The additional costs of the PV system and solar thermal system compared to the reference system are shown in Table 5. The reference system and PV system use the same heat pumps, while the thermal system uses a boiler as the backup system. Therefore, the cost for the heat pumps was deducted from the total additional costs of thermal system. It can be seen that the thermal system has the additional costs of 569,800 Yuan, which is 2.8 times higher than the PV system.
The weight of components costs on the total investment for the two system is shown in Figure 6 and Figure 7. It reveals that PV panels/solar collectors comprise the highest proportion of the total cost of the system, which account for 65% and 42% of the total investment, respectively. The absorption chiller and control system are also the main expenses for the thermal system, which account for 21% and 16% of the total cost, respectively.
Although all solar energy application systems are promoted by the Chinese government, most financial programs have been conducted only for PV systems. A distributed PV system could benefit from 0.42 Yuan per kWh produced electricity in China. The economic analysis has been conducted based on the commercial electricity price of 1.00 Yuan/kWh and on a life span of 20 years.
It is supposed that the efficiency of the both systems decreases by 1% in the first 5 years and by 0.8% in the following 15 years due to the component aging. The benefits of the PV system and thermal system during the life span are shown in Figure 8 and Figure 9. It can be seen that the total electricity yield of the PV system is 408.98 MWh within 20 years. The sum of the cumulative cost saving and funding are 229,400 Yuan until the end of the 7th year. Therefore, the payback time is 6–7 years for the PV system.
On the other hand, the thermal system has a payback time of more than 20 years because the initial investment is much higher and there is no funding for the system. The total cost saving is 400,000 Yuan within 20 years, which does not cover the additional cost of 569,800 Yuan.
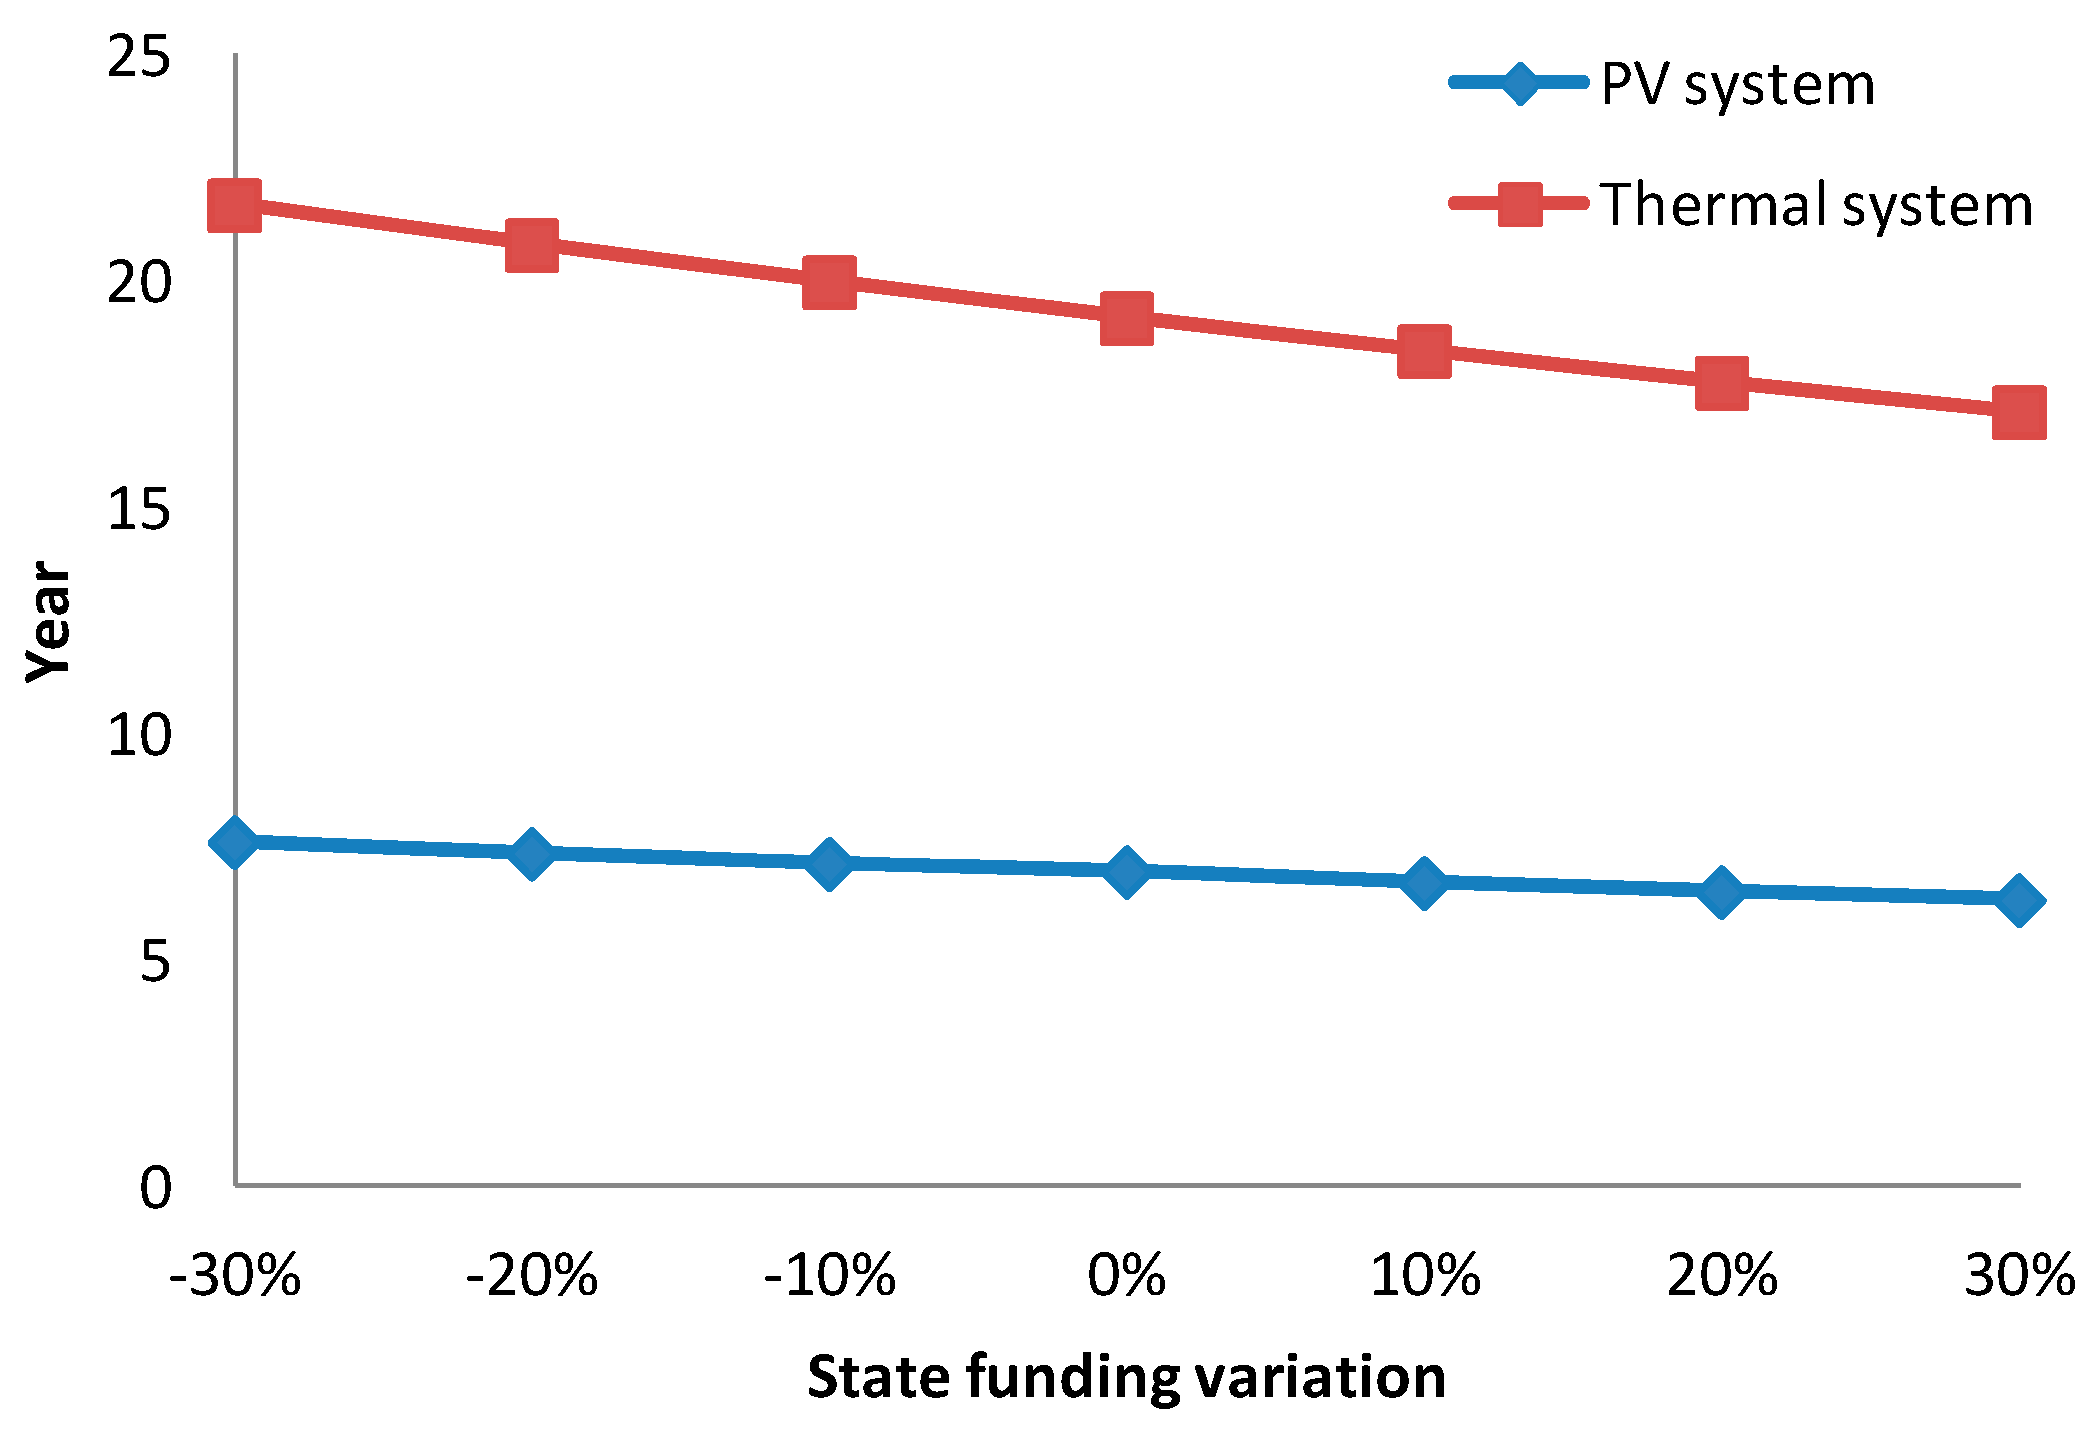
Figure 10 shows the payback time sensitivity analysis with electricity cost variation. It can be seen that the electricity cost makes a stronger impact on the thermal system than on the PV system. Figure 11 presents the payback time sensitivity analysis with state funding variation under the assumption that both the solar PV and thermal systems have the same state funding of 0.42 Yuan/kWh as the base. The payback time of the thermal system would be reduced to 20 years if it receives the same state funding as the PV system.
4. Conclusions
This paper presents a performance simulation and economic analysis for both PV and thermal solar cooling systems in the hot-summer and cold-winter zone in China. It was determined that 30.7% of the annual primary energy can be saved by the PV system and 30.2% by the thermal system compared to the heat pump system. However, the payback time of the PV system is 6–7 years and that of the thermal system is more than 20 years. The main reason for this is that the thermal system has high initial investment and is short of financial support from the government. Therefore, the PV system is more suitable for utilization in the hot-summer and cold-winter zone in China at present. The thermal system could be an attractive alternative when the middle- and high-temperature solar thermal collector technology has been further developed, as well as following mass production of small- and middle-sized chillers.
Acknowledgments
This work was developed within the framework of the research project 2013BAJ10B06 “The integration and demonstration of construction technology on the ecosystem villages and towns and well-off residence in the southeast coastal area” funded by a grant from the National Key Technology Support Program of the Twelfth Five-Year of the People's Republic of China.
Author Contributions
Li Huang performed the simulation, analyzed the data and wrote the paper; Rongyue Zheng conceived and designed the reference system and two solar cooling systems.
Conflicts of Interest
The authors declare no conflict of interest.
Nomenclature
| b1 | Coefficient in uncovered collector models measured with no wind |
| b2 | Coefficient in uncovered collector models measured in normal ventilation conditions |
| bu | Wind reduction coefficient for uncovered collectors |
| Eaux | Auxiliary energy of the respective system |
| Einv | Generated/saved energy of the system |
| EL | Measurement of the intensity of long-wave irradiance onto the collector area |
| Epar | Parasitic energy of the respective system |
| Etot | Total fuel and electricity consumption of the system |
| G | Total irradiance |
| Gk | Total irradiated energy |
| Qinv | Energy production of alternating current AC |
| Qinva | Apparent energy |
| Qinvr | Reactive energy |
| Qpvf | Energy production of direct current DC |
| Quse | Effective energy consumption |
| SFn | Fraction of solar energy to system |
| ta | Average outdoor temperature |
| tm | Average collector temperature |
| u | Air flow rate |
| ε/α | Coefficient in uncovered collector models |
| η | Collector efficiency |
| η0 | Collector efficiency achieved when the average temperature of the collector and the outdoor temperature are equal |
References
- Cao, Y. Building energy consumption and energy-saving potential. Mod. Prop. Manag. 2017, 5, 66–73. [Google Scholar]
- Yang, X.M. The Energy Consumption and Savings of Public Buildings in Shanghai. Master’s Thesis, Tongji University, Shanghai, China, 2007. [Google Scholar]
- Hartmann, N.; Glueck, C.; Schmidt, F.P. Solar cooling for small office buildings: Comparison of solar thermal and photovoltaic options for two different European climates. Renew. Energy 2011, 36, 1329–1338. [Google Scholar] [CrossRef]
- Boopathi Raja, V.; Shanmugam, V. A review and new approach to minimize the cost of solar assisted absorption cooling system. Renew. Sustain. Energy Rev. 2012, 16, 6725–6731. [Google Scholar] [CrossRef]
- Noro, M.; Lazzarin, R.M.; Busato, F. Solar cooling and heating plants: An energy and economic analysis of liquid sensible vs phase change material (PCM) heat storage. Int. J. Refrig. 2014, 39, 104–116. [Google Scholar] [CrossRef]
- Beccali, M.; Cellura, M.; Finocchiaro, P.; Guarino, F.; Longo, S.; Nocke, B. Life cycle performance assessment of small solar thermal cooling systems and conventional plants assisted with photovoltaics. Sol. Energy 2013, 104, 93–102. [Google Scholar] [CrossRef] [Green Version]
- Eicker, U.; Colmenar-Santos, A.; Teran, L.; Cotrado, M.; Borge-Diez, D. Economic evaluation of solar thermal and photovoltaic cooling systems through simulation in different climatic conditions: An analysis in three different cities in Europe. Energy Build. 2014, 70, 207–223. [Google Scholar] [CrossRef]
- Izquierdo, M.; de Agustín, P.; Martín, E. A micro photovoltaic-heat pump system for house heating by radiant floor: Some experimental results. Energy Procedia 2014, 48, 865–875. [Google Scholar] [CrossRef]
- Roselli, C.; Sasso, M.; Tariello, F. Dynamic simulation of a solar electric driven heat pump for an office building located in Southern Italy. Int. J. Heat Technol. 2016, 34, 496–504. [Google Scholar] [CrossRef]
- Khan, M.S.A.; Badar, A.W.; Talha, T.; Khan, M.W.; Butt, F.S. Configuration based modeling and performance analysis of single effect solar absorption cooling system in TRNSYS. Energy Convers. Manag. 2018, 157, 351–363. [Google Scholar] [CrossRef]
- Vela Solaris, AG. Polysun Simulation Software User Manual; Vela Solaris AG: Winterthur, Switzerland, 2014. [Google Scholar]
- Duffie, J.; Beckman, W. Solar Engineering of Thermal Processes, 3rd ed.; Wiley Interscience: Hoboken, NJ, USA, 2006. [Google Scholar]
- Witzig, A.; Foradini, F.; Probst, M.C.M.; Roecker, C. Simulation tool for architects. In Proceedings of the 2009 CISBAT International Conference on Renewables in a Changing Climate, Lausanne, Switzerland, 2–3 September 2009. [Google Scholar]
- Beyer, H.G.; Betcke, J.; Drews, A.; Heinemann, D.; Lorenz, E.; Heilscher, G.; Bofinger, S. Identification of a general model for the MPP performance of PV-modules for the application in a procedure for the performance check of grid connected systems. In Proceedings of the 19th European Photovoltaic Solar Energy Conference & Exhibition, Paris, France, 7–11 June 2004. [Google Scholar]
- Kim, D.S.; Infante Ferreira, C.A. Analytic modeling of steady state single-effect absorption cycles. Int. J. Refrig. 2008, 31, 1012–1020. [Google Scholar] [CrossRef]
- Eicker, U.; Pietruschka, D. Design and performance of solar powered absorption cooling system in office buildings. Energy Build. 2009, 41, 81–91. [Google Scholar] [CrossRef]
Figure 1.
Schematic of the photovoltaic (PV) solar cooling system.

Figure 2.
Schematic of the solar thermal cooling system.

Figure 3.
The monthly energy consumption for cooling and heating during a typical meteorological year in Ningbo City.
Figure 3.
The monthly energy consumption for cooling and heating during a typical meteorological year in Ningbo City.

Figure 4.
The monthly electricity production AC by the PV solar cooling system and the electricity demand for heating/cooling.
Figure 4.
The monthly electricity production AC by the PV solar cooling system and the electricity demand for heating/cooling.
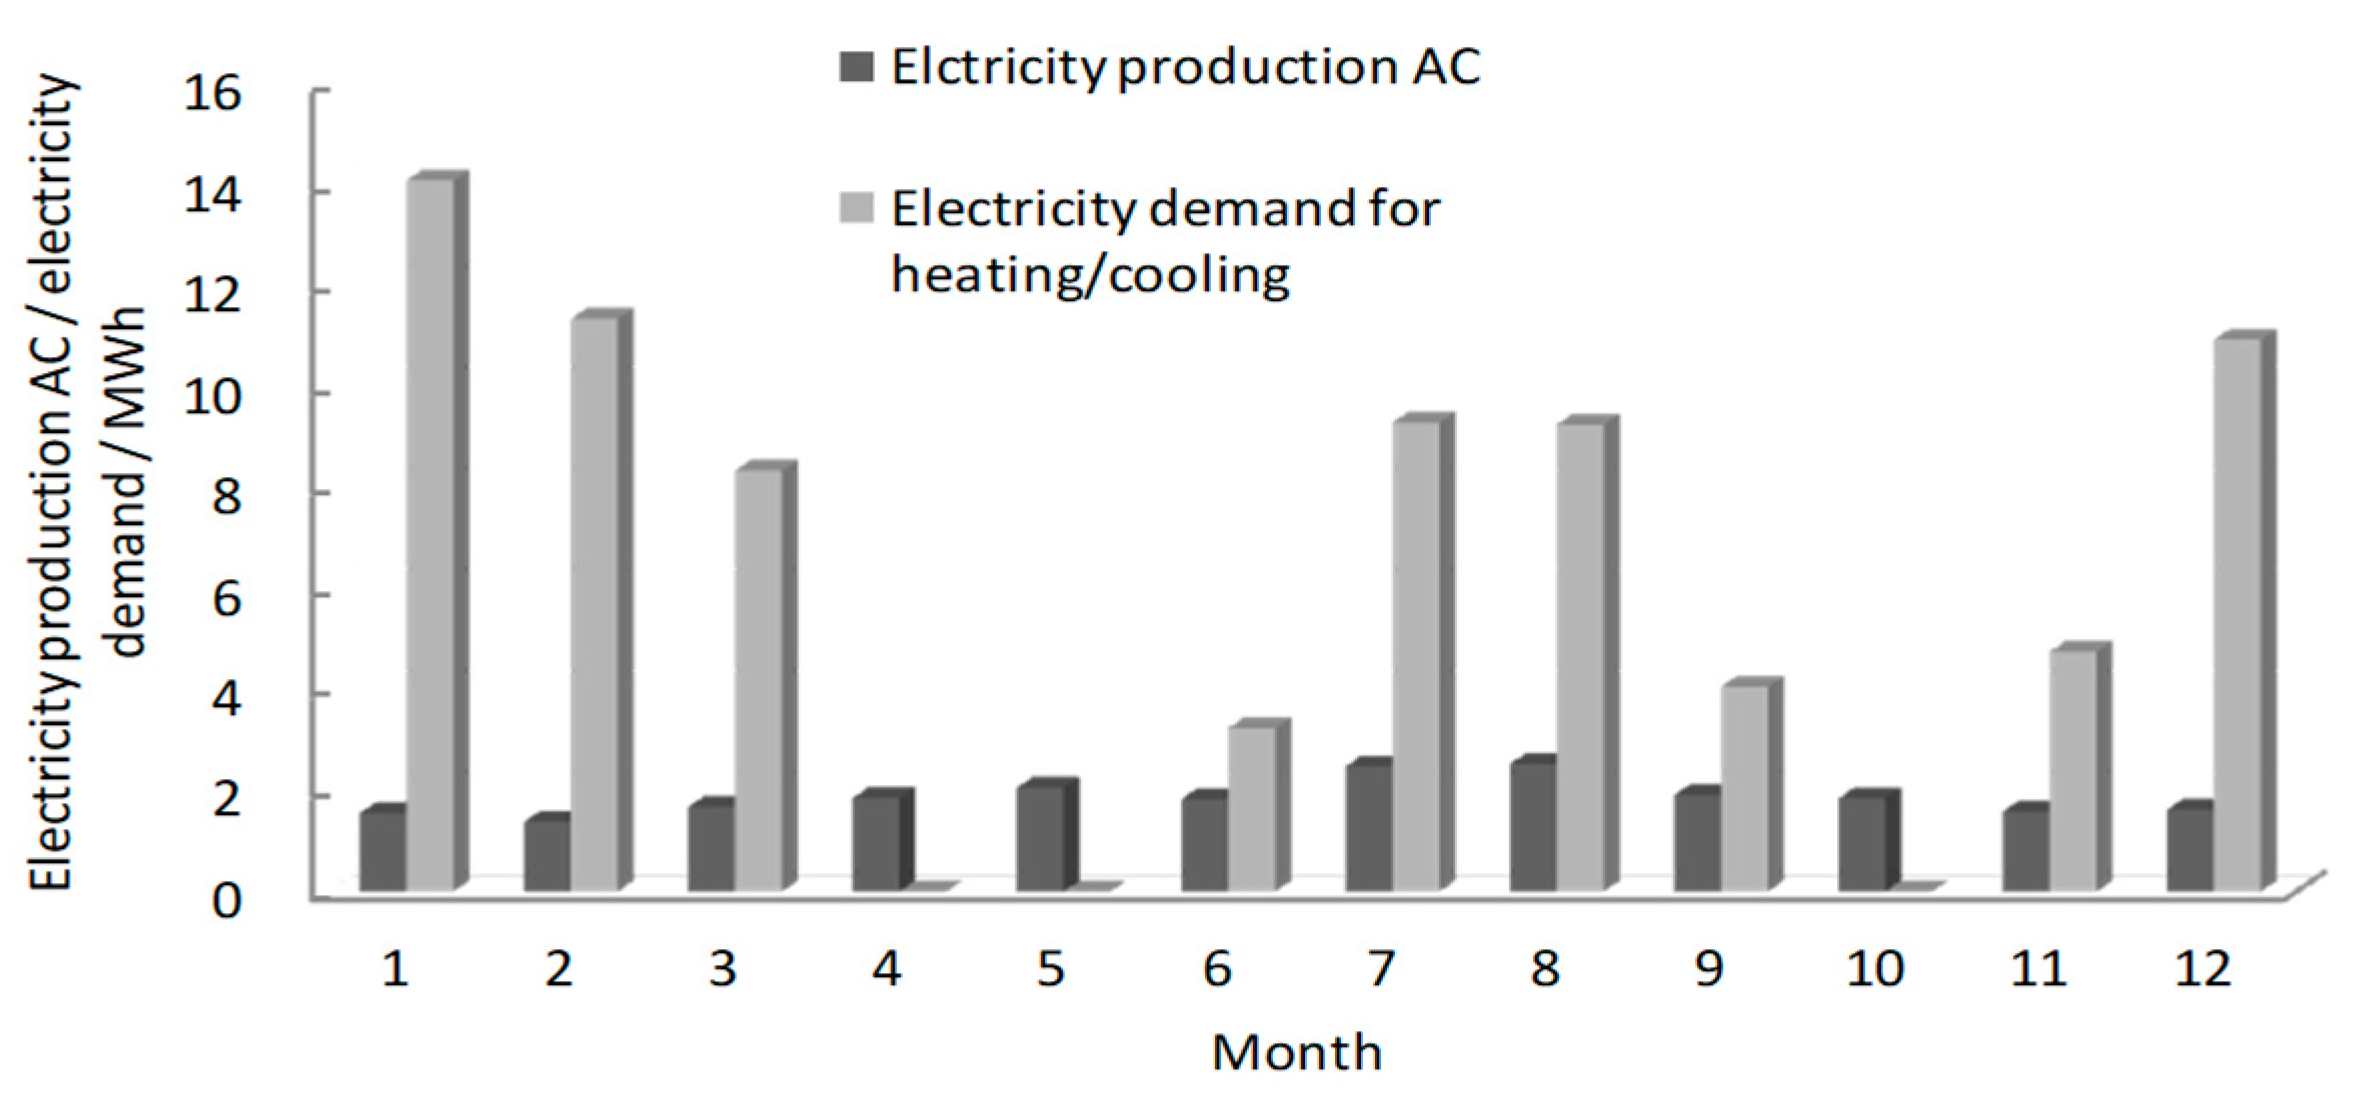
Figure 5.
The monthly solar thermal energy yield and solar fraction of the solar thermal cooling system.
Figure 5.
The monthly solar thermal energy yield and solar fraction of the solar thermal cooling system.

Figure 6.
The component costs of the PV system.
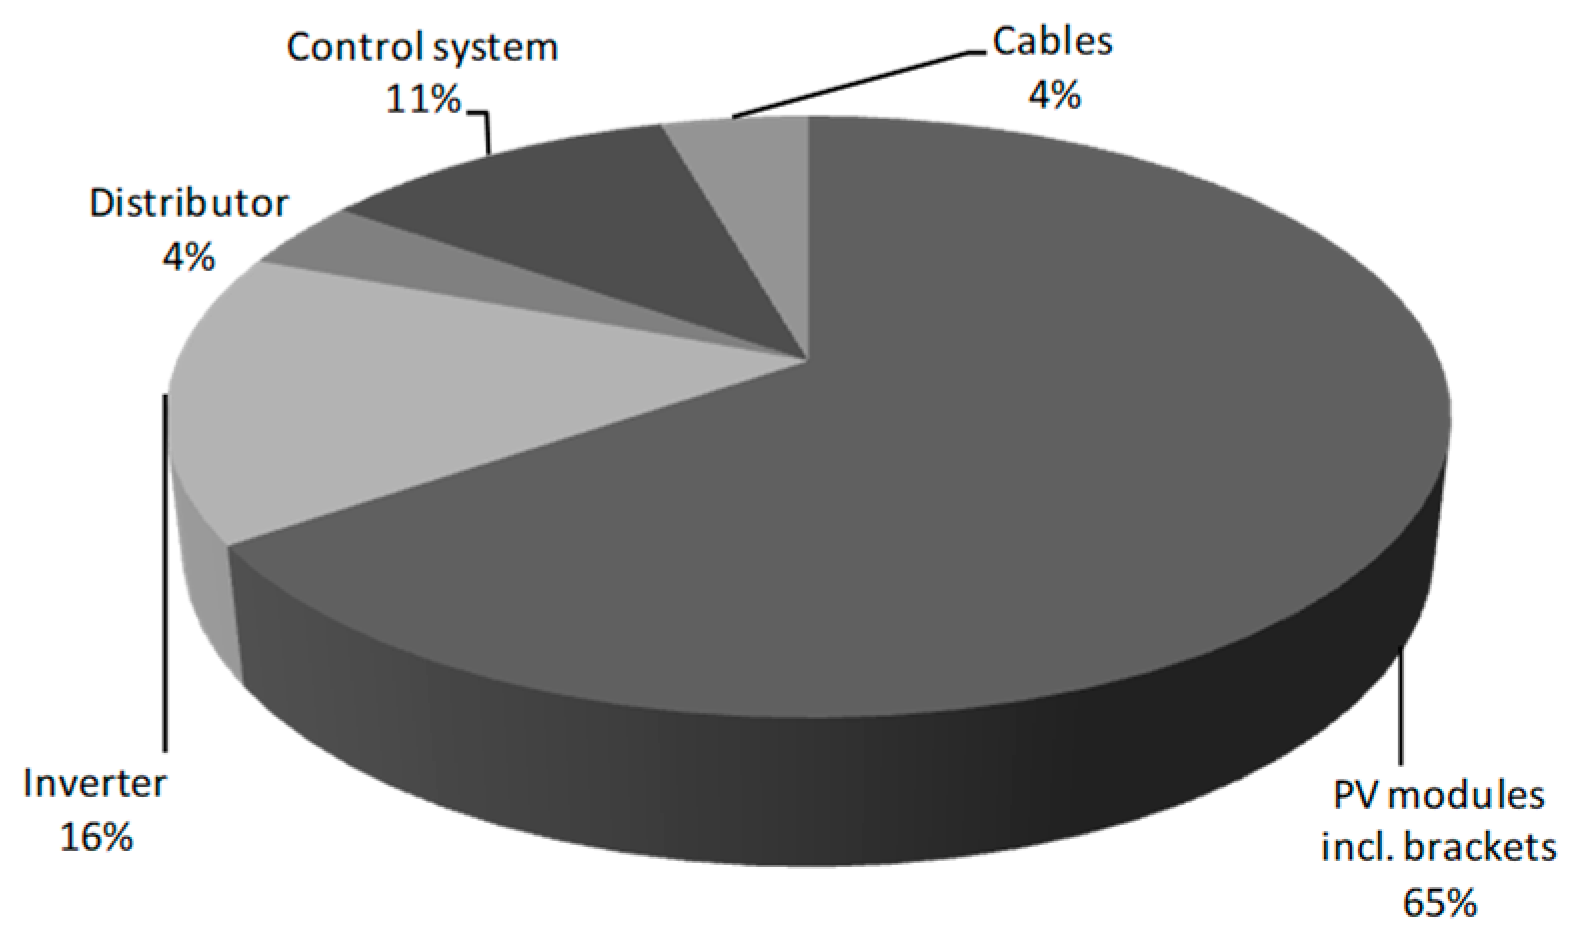
Figure 7.
The component costs of the thermal system.
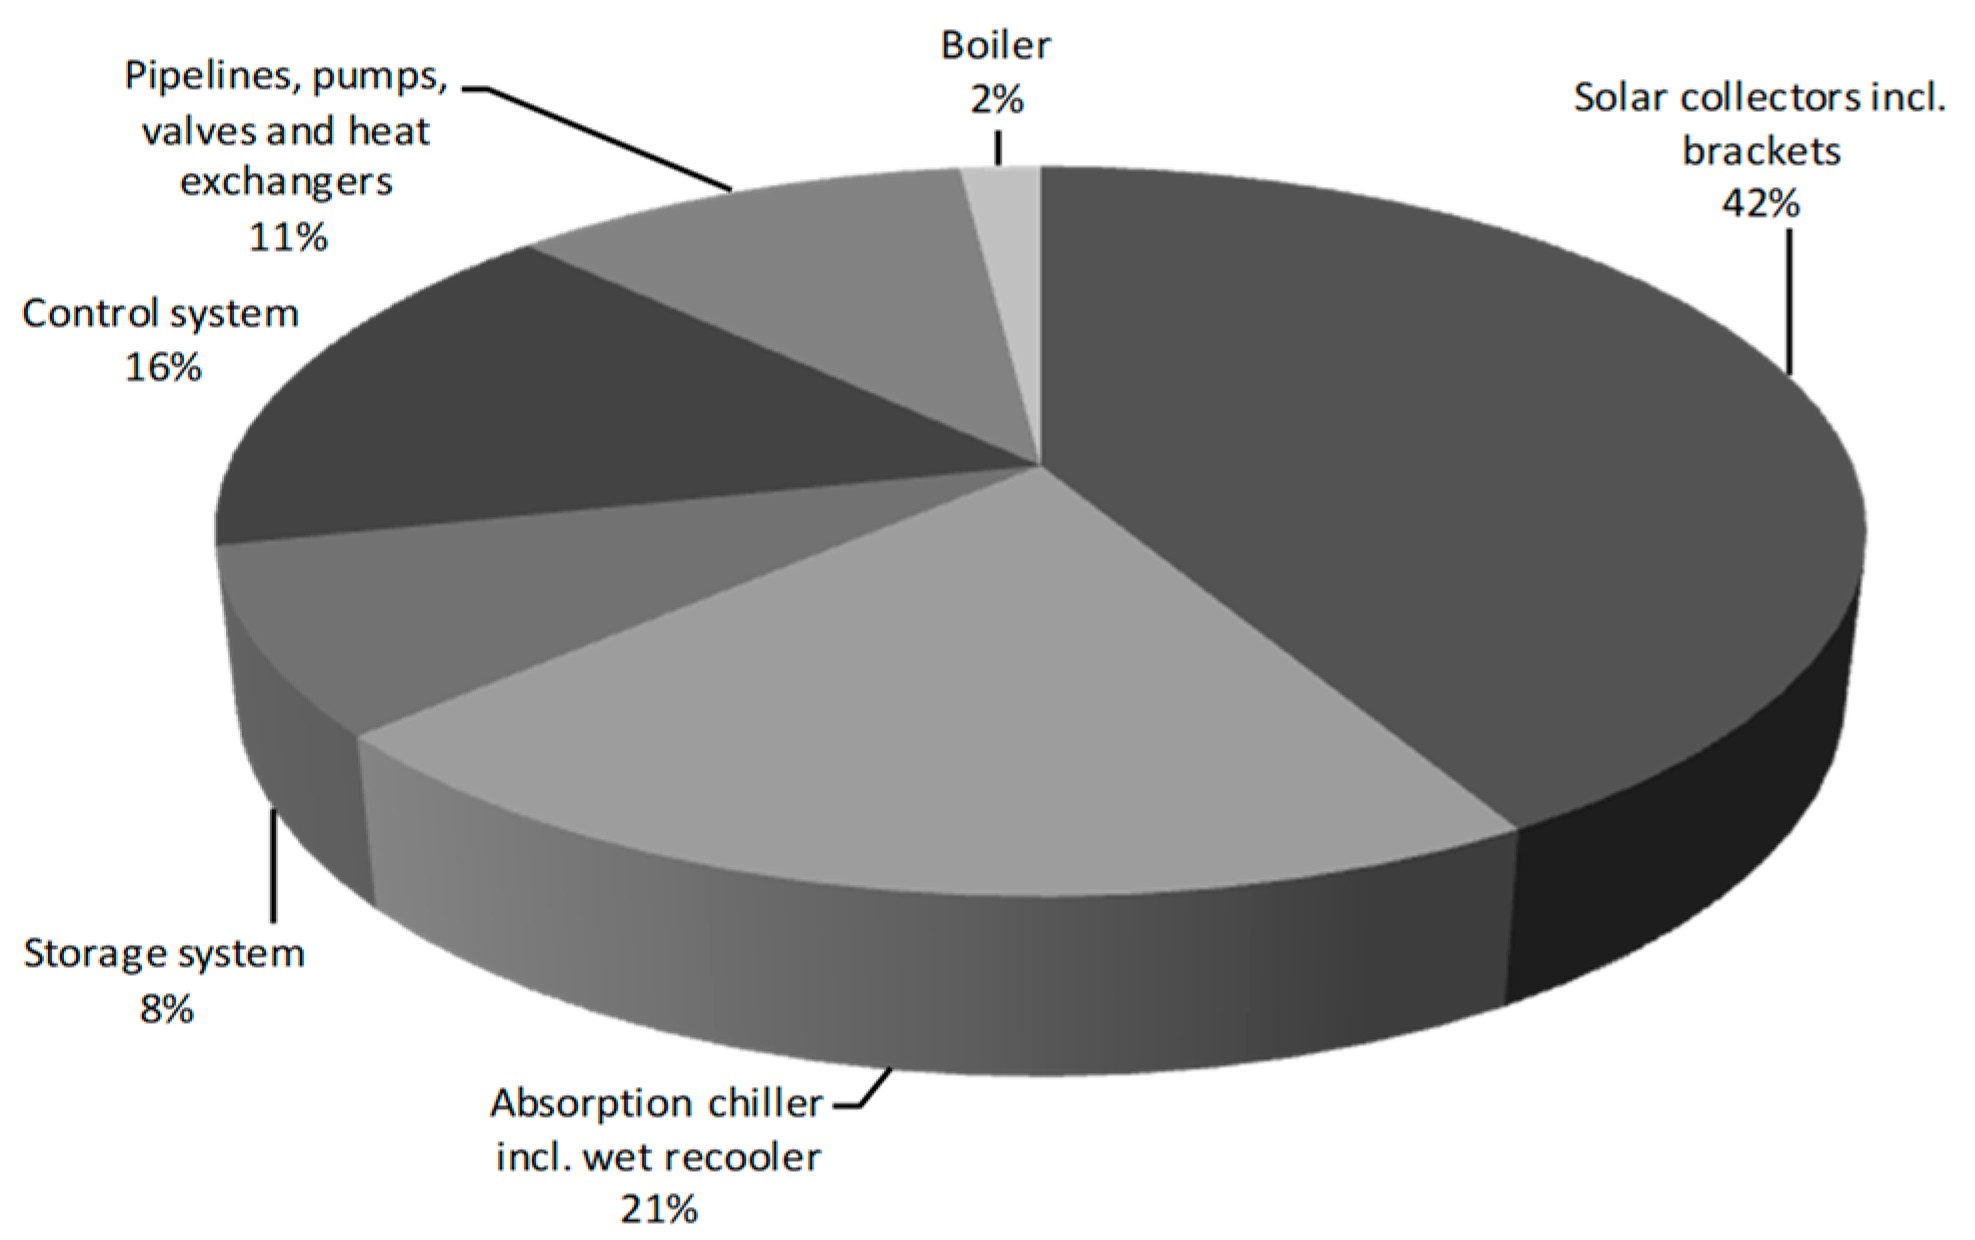
Figure 8.
The cost saving and payback time of the PV solar cooling system.
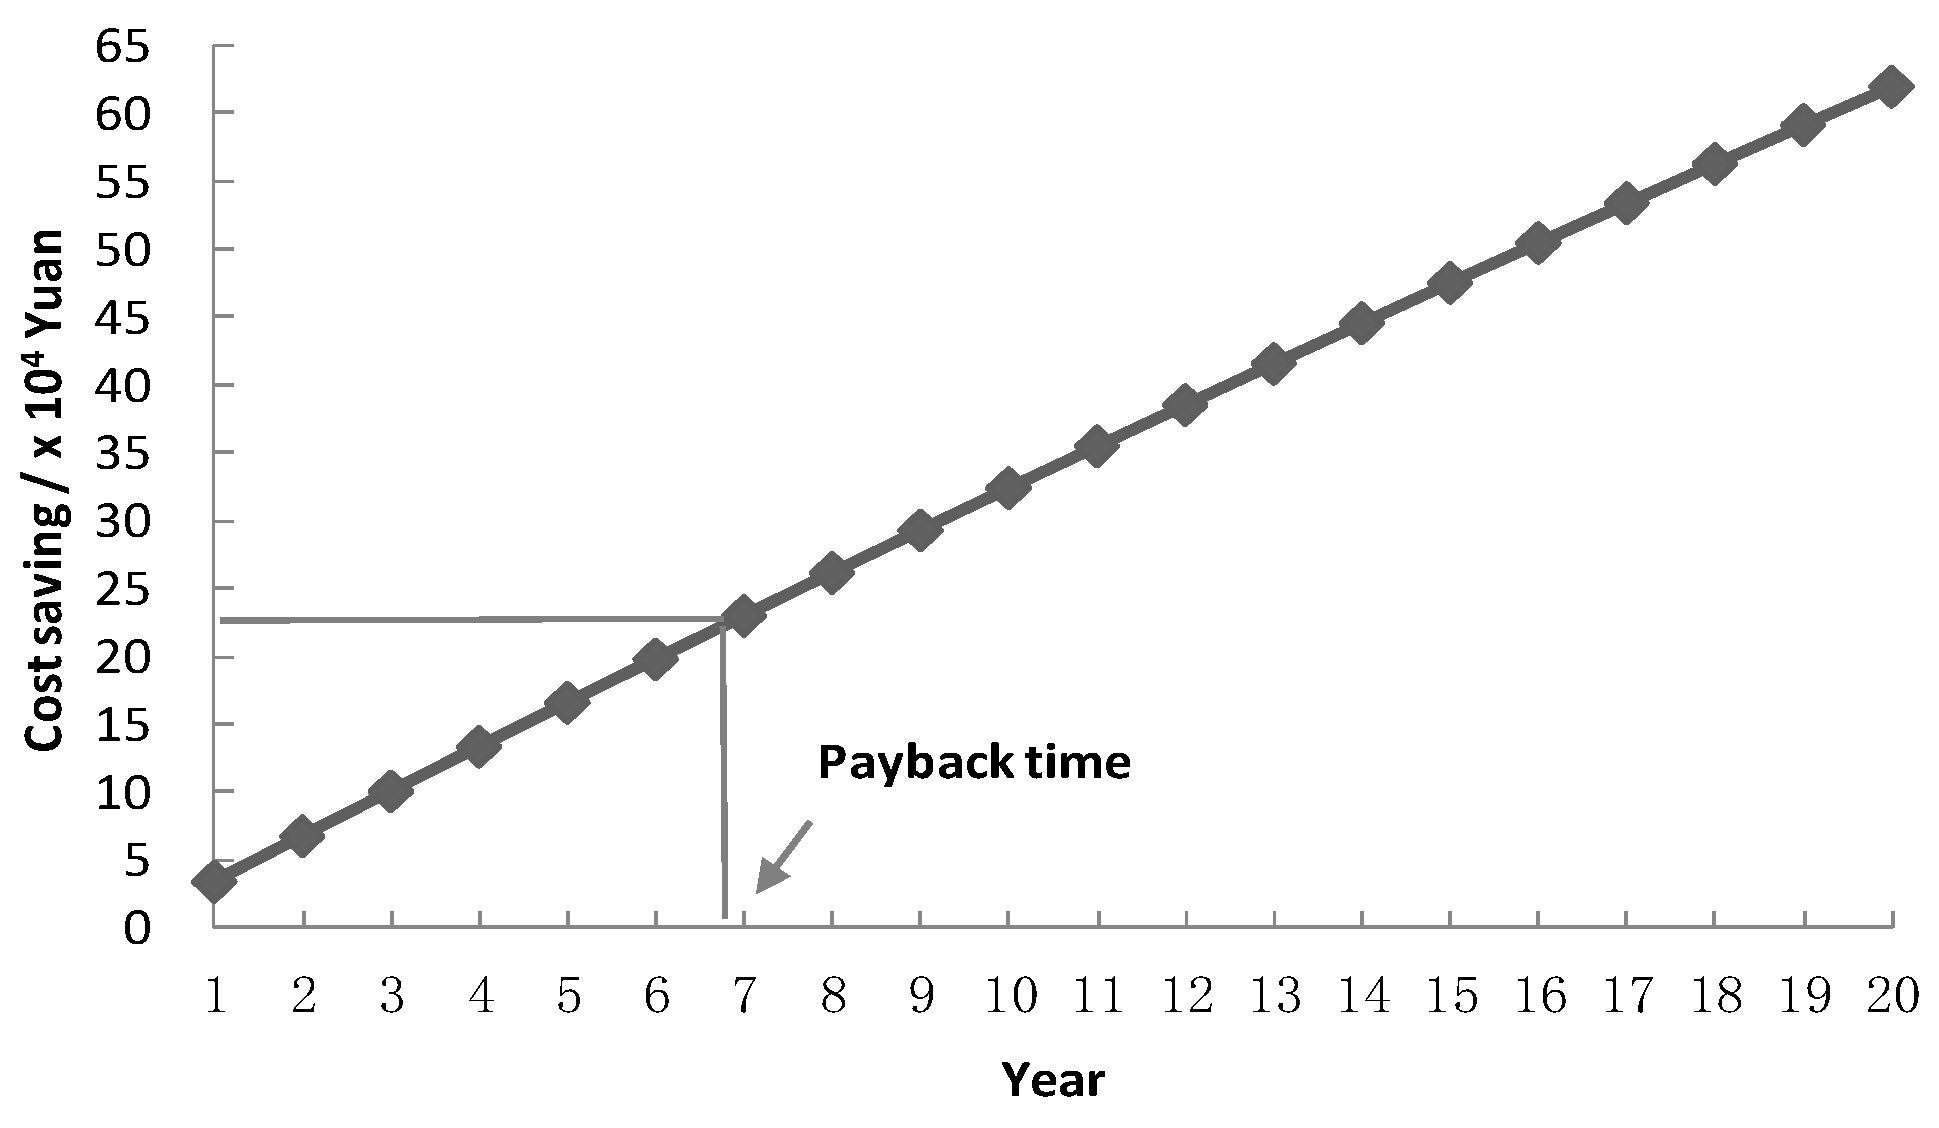
Figure 9.
The cost saving of the thermal solar cooling system.

Figure 10.
Payback time sensitivity analysis with electricity cost variation.
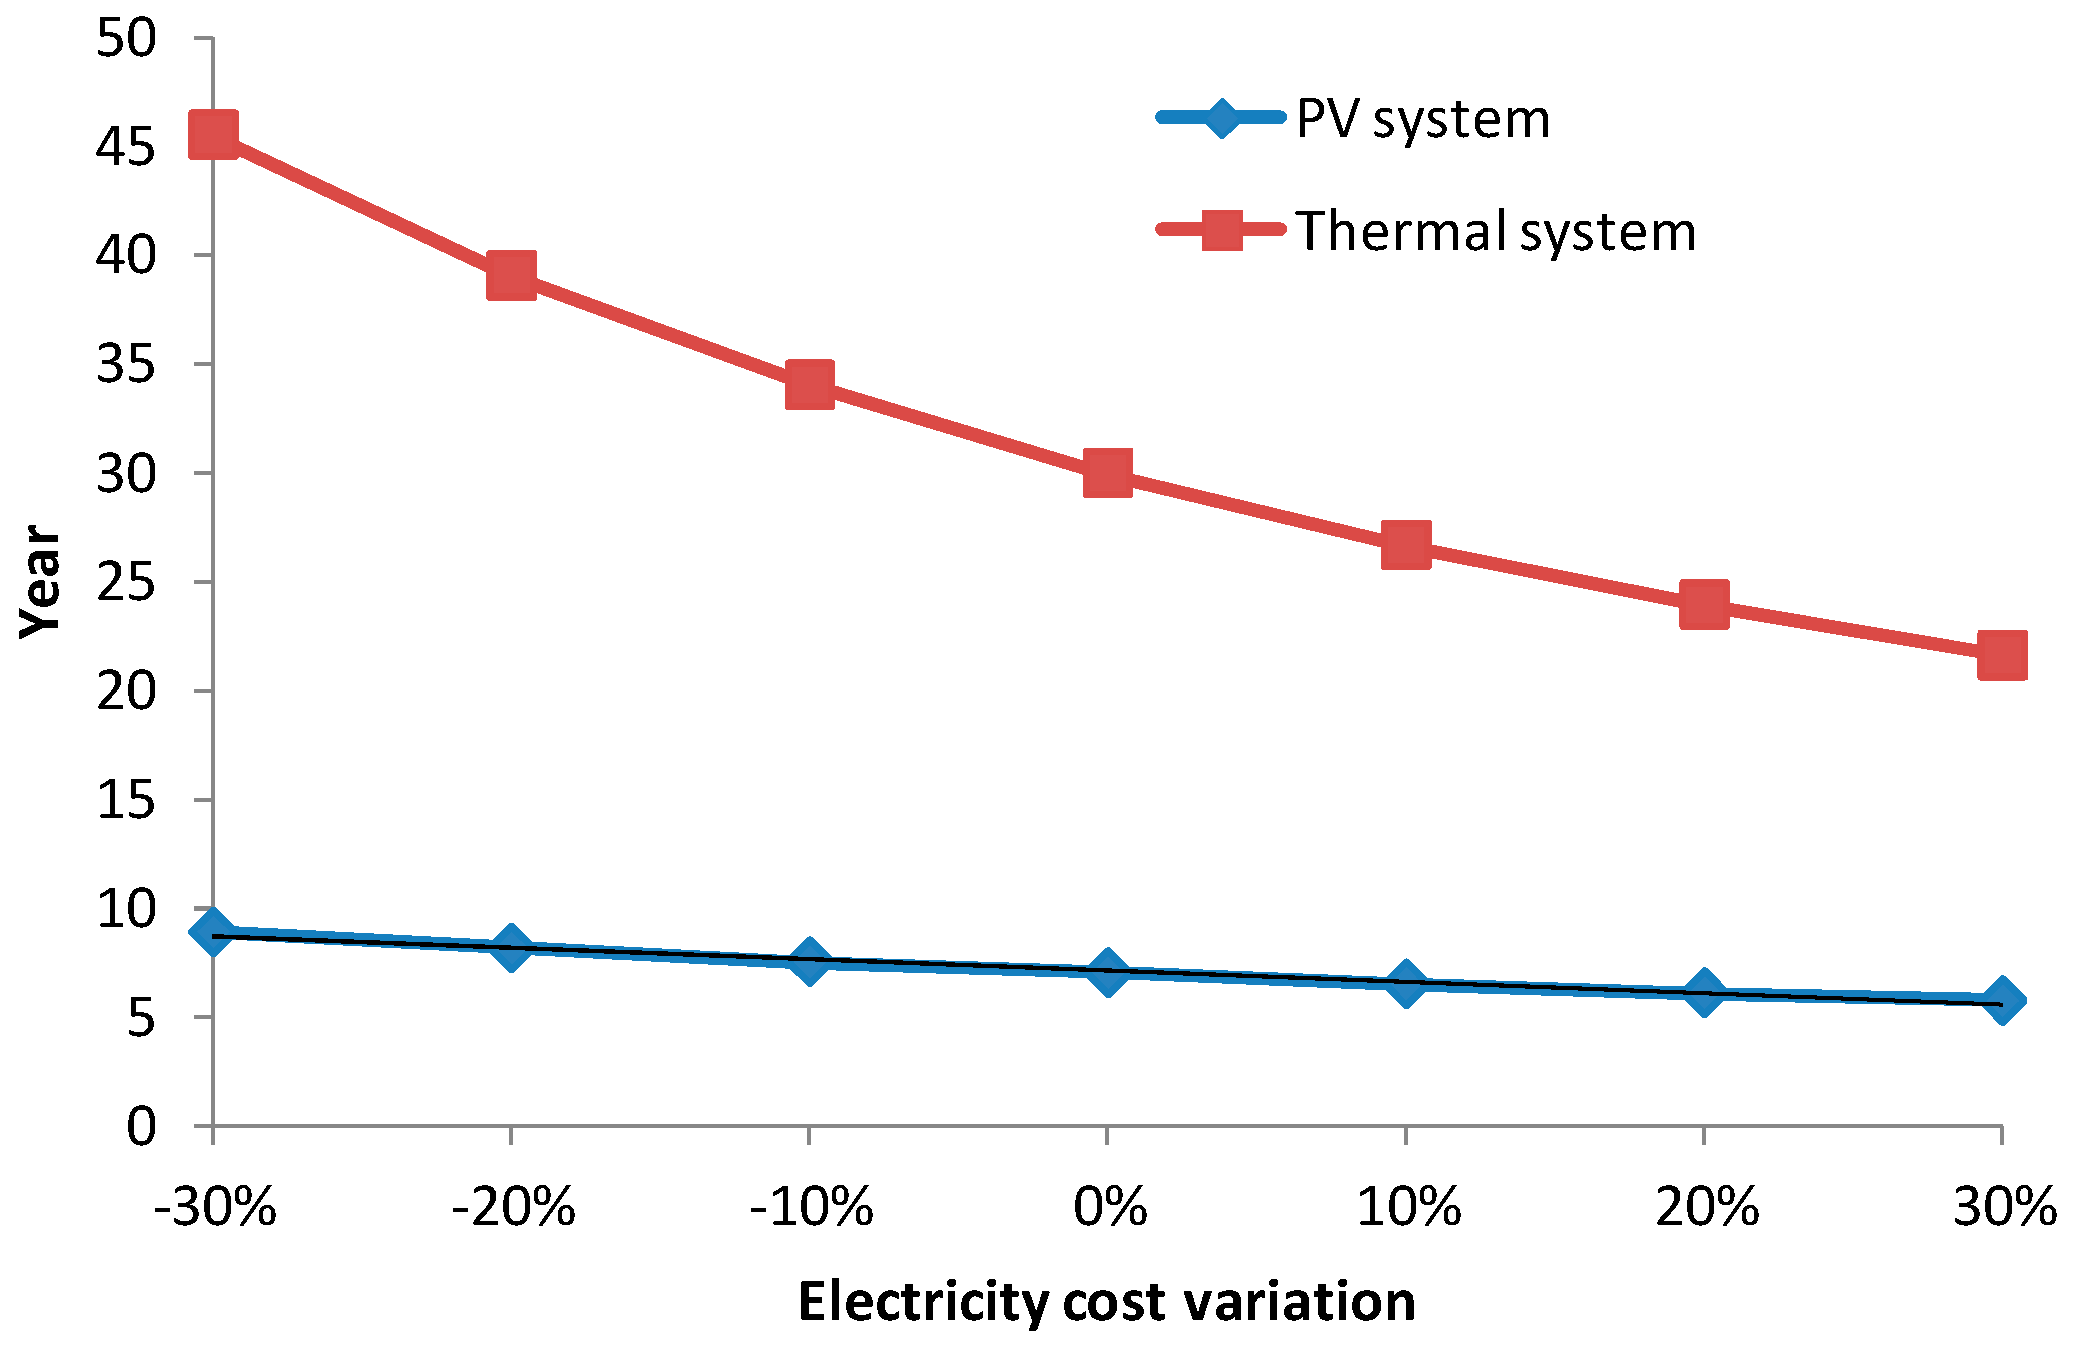
Figure 11.
Payback time sensitivity analysis with state funding variation under the assumption that both the solar PV and thermal systems have the same state funding of 0.42 Yuan/kWh as the base.
Figure 11.
Payback time sensitivity analysis with state funding variation under the assumption that both the solar PV and thermal systems have the same state funding of 0.42 Yuan/kWh as the base.


Table 1.
The construction characteristics of the building.
| Parameter | Value | |
|---|---|---|
| Total U-value (W/m2·K) | 1.38 | |
| Percentage of openings on external walls (%) | North | 21 |
| West | 0 | |
| East | 7 | |
| South | 19 | |
| Type of window | Frame | PVC-U |
| Glass | Double clear (5/9/5) | |
| U-window (W/m2·K) | 3.0 | |
| g-value window (-) | 0.8 | |
| Air change (1/h) | 1.0 | |
Table 2.
Annual overview of the PV solar cooling system.
| Parameter | Value |
|---|---|
| Total gross area | 128.4 m2 |
| Energy production DC (Qpvf) | 23.10 MWh/y |
| Energy production AC (Qinv) | 22.28 MWh/y |
| Total nominal power generator field | 20.4 kW |
| Performance ratio (ratio between the effective and the theoretically possible energy yield of the system) | 80.5% |
| Specific annual yield | 1.09 MWh/kWp/y |
| Phase imbalance | 0 kVAh |
| Reactive energy (Qinvr) | 0 kVarh |
| Apparent energy(Qinva) | 22,280.9 kVAh |
Table 3.
Annual overview of the solar thermal cooling system.
| System Overview | |
|---|---|
| Total fuel and electricity consumption of the system (Etot) | 151.5 MWh |
| Total energy consumption (Quse) | 126.3 MWh |
| System performance ((Quse + Einv)/(Eaux + Epar)) | 0.83 |
| Solar Collector | |
| Total gross collector area | 133 m2 |
| Total annual field yield | 52.8 MWh/y |
| Average Solar fraction (SFn) | 30.6% |
| Max. fuel savings (Annual fuel savings through use of solar thermal technology) | 5535.9 m3 (natural gas) |
| Max. energy savings (Annual fuel savings through the use of solar thermal technology, converted into kWh. These values can be higher than the collector field yield as this is also divided by boiler efficiency.) | 58.13 MWh/y |
| Absorption chiller | |
| Seasonal performance factor—Cooling | 0.68 |
| Total cooling energy yield | 71.78 MWh/y |
| Heat supplied in generator | 104.8 MWh/y |
| Boiler | |
| Power | 40 kW |
| Total efficiency | 86.9% |
| Energy to the system | 119.6 MWh |
Table 4.
Annual overview of the solar thermal cooling system.
| Parameter | Reference System | PV System | Thermal System |
|---|---|---|---|
| Primary energy consumption (MWh/y) | 201.47 | 139.53 | 140.66 |
| Primary energy savings (MWh/y) | - | 61.94 | 60.81 |
| Relative primary energy savings (%) | - | 30.7 | 30.2 |
Table 5.
The additional costs of the PV system and solar thermal system compared to the reference system.
Table 5.
The additional costs of the PV system and solar thermal system compared to the reference system.
| Component | PV System (×104 Yuan) | Thermal System (×104 Yuan) |
|---|---|---|
| PV modules incl. brackets/solar collectors incl. brackets | 13.46 | 26.63 |
| Inverter | 3.22 | - |
| Distributor | 0.77 | - |
| Absorption chiller | - | 13.71 |
| Storage systems (incl. hot water and chilled water storages) | - | 5.27 |
| Control system | 2.22 | 10.12 |
| Cables/pipelines, pumps, valves and heat exchangers | 0.92 | 6.86 |
| Heat pumps | 0 | −6.81 |
| Boiler | - | 1.20 |
| Total | 20.59 | 56.98 |
© 2018 by the authors. Licensee MDPI, Basel, Switzerland. This article is an open access article distributed under the terms and conditions of the Creative Commons Attribution (CC BY) license (http://creativecommons.org/licenses/by/4.0/).
Share and Cite
MDPI and ACS Style
Huang, L.; Zheng, R. Energy and Economic Performance of Solar Cooling Systems in the Hot-Summer and Cold-Winter Zone. Buildings 2018, 8, 37. https://doi.org/10.3390/buildings8030037
AMA Style
Huang L, Zheng R. Energy and Economic Performance of Solar Cooling Systems in the Hot-Summer and Cold-Winter Zone. Buildings. 2018; 8(3):37. https://doi.org/10.3390/buildings8030037
Chicago/Turabian StyleHuang, Li, and Rongyue Zheng. 2018. "Energy and Economic Performance of Solar Cooling Systems in the Hot-Summer and Cold-Winter Zone" Buildings 8, no. 3: 37. https://doi.org/10.3390/buildings8030037
Note that from the first issue of 2016, this journal uses article numbers instead of page numbers. See further details here.