The Effects of Low Air Temperatures on Thermoregulation and Sleep of Young Men While Sleeping Using Bedding

1
Department of Architecture and Civil Engineering, Toyohashi University of Technology, 1-1 Hibarigaoka, Tempaku-cho, Toyohashi, Aichi 441-8580, Japan
2
Human Informatics Research Institute, National Institute of Advanced Industrial Science and Technology (AIST), AIST Tsukuba Central 6, 1-1-1, Higashi, Tsukuba, Ibaraki 305-8566, Japan
3
Kansei Fukushi Research Center, Tohoku Fukushi University, 1-149-6 Kunimigaoka, Aoba, Sendai, Miyagi 989-3201, Japan
4
Department of Education, Tohoku Fukushi University, 1-149-6 Kunimigaoka, Aoba, Sendai, Miyagi 989-3201, Japan
*
Author to whom correspondence should be addressed.
Buildings 2018, 8(6), 76; https://doi.org/10.3390/buildings8060076
Submission received: 23 April 2018
/
Revised: 25 May 2018
/
Accepted: 26 May 2018
/
Published: 29 May 2018
(This article belongs to the Special Issue Occupant Comfort and Well-Being)
Abstract
:Most people do not use heating systems during nocturnal sleep in their bedrooms during the cold season in Japan; instead, they like to use extra blankets and quilts for sleeping. To investigate the effect of low air temperature (Ta) on sleep and thermoregulation when sleeping with bedding, 12 healthy young men participated in sleep experiments over three non-consecutive nights. The experimental conditions were at a Ta of 3 °C, 10 °C and 17 °C, with a relative humidity (Rh) of 50% and an air velocity of <0.2 m/s in the climatic chambers. The 4.3-clo bedding consisted of cotton sheets, an acrylic blanket, a down-filled quilt and a futon mattress. The average sleep efficiency index (SEI) remained >94% for each of the three Tas, and no disturbances were found by Ta in the sleep parameters, although the duration of rapid eye movement (REM) sleep showed variations at 3 °C. The skin temperature (Ts) of the forehead decreased in proportion to Ta and remained stable. The decreasing rate in rectal temperature (Tre), Ts of forehead and thigh during sleep were significantly greater at 3 °C than at 10 °C and 17 °C. The innermost microclimate temperature (Tmicro) made by the bedding did not correlate with the Tre. The young men were significantly more dissatisfied with 3 °C in the sleep quality evaluation.
1. Introduction
The thermal environment is a key determinant of sleep because thermoregulation is strongly linked to the mechanism regulating sleep [1,2,3]. Most of the sleep research to investigate the effects of the thermal environment on human sleep and thermoregulation had been carried out using naked subjects. Cold air temperatures (Ta) were generally more disruptive to sleep than warm Ta [4]. However, in a colder environment, people can sleep well by using bedding. The bedding microclimate created by both the bedding and the human body can influence sleep quality and thermoregulation during sleep because the bedding microclimate indicates temperature and humidity in the spaces between the human body and the bedding. There is little experimental data on the effects of this microclimate on human sleep and thermoregulatory responses during sleep through the use of bedding. On the other hand, from field measurements in a rural area, it was observed that elderly people had slept in bedrooms where the temperature was less than 10 °C [5]. Simultaneously, it was found that extra blankets and quilts or electric heating blankets had been used for sleeping in rooms without heating. While sleeping in cold environments, people usually cover their entire body, excluding their head, with bedding. It is unclear whether sleep and thermoregulation are influenced by the microclimate created by the bedding, as suggested by a previous paper [6], or if a cold environment is a factor, through the head being uncovered by bedding and thus being exposed.
According to the documents, in naked subjects exposed to cold (Ta, 21 °C) for one night, the durations of Stage 2 (S2) and rapid eye movement (REM) sleep were found to be disturbed [4]. However, exposure to a Ta of 21 °C for five consecutive nights increased the wakefulness period after sleep onset [7], but did not modify slow-wave sleep (SWS) or REM sleep [4,7]. While the skin temperature (Ts) of the peripheral extremities decreased and the forehead Ts increased during REM sleep in nude subjects exposed to Ta of 21 °C for five consecutive nights, rectal temperature (Tre) decreased throughout the night [7]. These studies suggest that sleep is disturbed by a cold environment for a single night, while a continuous cold environment increases the waking period. SWS and REM sleep are not disturbed, although Ts responses are still influenced during REM sleep. These results are based on nude subjects and exclude the effects of bed covers and clothing. In contrast, with subjects using a highly insulated sleeping bag (9 clo), arctic night exposure to cold (i.e., Ta ranging from −29 to −35 °C) mainly affects REM sleep, owing to the suppression of thermoregulatory shivering and body movements [7]. Resulting REM sleep deprivation is proportional to the intensity of cold exposure, although SWS is well preserved [8]. During REM sleep, mean skin temperature (mean Ts) increases when Tre is high and decreases when Tre is <36 °C, when using a 9-clo sleeping bag in the arctic night [9]. When the subjects slept underneath bedding, both the number and duration of the periods of wakefulness increased at 13 °C, and the length of the REM cycle at 13 °C was greater than that at 16 °C–25 °C; further, REM sleep remained undisturbed [10]. Although thermal insulation provided by bedding was not shown, Tre corresponded better to microclimatic temperatures (Tmicro) ranging from 26 °C to 31 °C than to ambient Ta ranging from 13 °C to 25 °C [6]. When sleep quality was investigated recently among three Ta of 17 °C, 20 °C and 23 °C, 23 °C using bedding of 3.12 clo showed the highest sleep quality and satisfaction [11]. These results suggest that the microclimate produced by bedding supports sleep and thermoregulation. However, there is little experimental data on the human thermoregulatory responses during sleep between 13 °C and −29 °C with the use of bedding.
Alternatively, a cold bedroom with highly insulated bedding might decrease energy use and associated costs, allowing for affordable thermal comfort without compromising the occupant’s health. The present study aims to investigate the effects of low Ta on sleep stages and body temperature during nocturnal sleep in subjects who sleep underneath bedding.
2. Method
2.1. Participants
This study was approved by the Human Ethics Committee of the National Institute of Advanced Industrial Science and Technology (AIST). Twelve Japanese male volunteers took part in this within-participant repeated-measures study design as subjects for this study. The mean and standard deviation of their physical characteristics were as follows: age, 25 ± 3 years; height, 174 ± 5 cm; weight, 67 ± 8 kg; and body surface area, 1.75 ± 0.12 m2. We explained the protocol to the volunteers and obtained written consent. Prior to the experiment, we conducted physical examinations, psychological tests and administered the eveningness-morningness [12] and sleep questionnaires; the results of the aforementioned investigations revealed that all subjects were in good physical and mental health. A polysomnographic (PSG) recording prior to the experiment revealed no sleep disturbances. The experiments were conducted from February to March, when the minimum temperature ranged from −7.3 °C to 8 °C, and the average ± SD was −0.9 ± 3.6 °C, shown in the data of the neighborhood meteorological observatory.
2.2. Experimental Protocol
The experiment conditions were determined on the basis of the previous studies [5,10]. Most Japanese people sleep without room heating in winter. The room temperature changes depending on the outdoor air temperature of the season. The room temperatures were found between 10 °C and 17 °C during the daytime when we visited 10 senior citizens’ homes [5]. Moreover, average Ta in the bedrooms of 10 senior citizens homes was 7.6 °C when the average of the outdoor Ta around their dwellings was 3.6 °C at 5 p.m. Subsequently, the average Ta in the bedroom continued to go down to 1.4 °C while the outdoor Ta changed to −4.5 °C at 7 a.m. in the morning. Therefore, 3 °C, 10 °C and 17 °C were chosen as the experimental conditions.
The experimental conditions were set at three different ambient Ta of 3 °C, 10 °C and 17 °C with 50% relative humidity (Rh) in the climatic chamber. The air velocity was <0.2 m/s, and the mean radiant temperature was equal to the Ta. The Ta of the climate chamber was stable and always within ±0.5 °C from the predetermined Ta conditions. The subjects were monitored on four nonconsecutive nights during sleep. On the first night, the subjects slept at 17 °C with 50% Rh in the climatic chamber, for the purpose of adaptation. The subjects were not informed of the order in which they would be subjected to the three randomly-determined conditions. There was an interval of at least 2 to 3 days between the three experimental nights. The subjects were asked to follow a regular sleep-and-wake schedule and maintain a sleep diary, starting one week prior to the experiment and lasting until the end of the entire experimental period.
In the experimental night, the subjects entered the pre-test room, which was 22 °C, at 20:45 and donned pajamas after having their body weights measured. Electrodes were attached to the subjects while they remained seated in a chair, and the subjects rested for 2 h. The subjects needed to acclimatize themselves to a neutral environment because this study was carried out in a cold season. Indeed, the subjects travelled some distance by bicycle from a university in the evening. At 22:45, the subjects walked from the 22 °C pre-test room to the preset climatic chamber and sat, with only their lower body covered by the blanket and quilt. At this time, they answered a questionnaire about thermal sensation and sleepiness for about 20 min before going to sleep. The subjects laid down after filling it out and were completely covered with the bedding, except for the head. The measurement apparatus, such as the polygraph with EEG, EOG and EMG, recorders of Ts and Tre for the lying posture on the bed, were checked by the experimenter. Polysomnographic (PSG) recordings were then initiated. After a period of over half an hour since the subjects moved to the set Ta in the climatic chamber, the subjects were finally permitted to go to sleep. The subjects were instructed to sleep for 8 h, and the light was then turned off, with the sleep session beginning when the investigator said “good night”. Following the 8-h sleep session, the investigator said “good morning” through an intercom at the same time as the light was turned on, and subjects were instructed to answer a third questionnaire regarding the retrospective sensation of the sleeping period, to evaluate the thermal environment, subject sleepiness and the subject’s sleep experience during the sleep session. A total of four sets of answers to the questionnaire were obtained from each subject, regarding subjective sensations in the pre-test room (22 °C), before sleep, during and after sleep, under the test conditions. The subjects wore shorts, long pants and long-sleeved pajamas (all 100% cotton), for which the clothing insulation was 0.46 clo measured by a thermal manikin [13]. The subjects slept on a futon mattress (50% cotton and 50% acrylic) covered with a bed sheet (100% cotton), a blanket (100% acrylic) and a quilt (100% down). The thermal insulation was 4.3 clo, as measured by the thermal manikin method [14].
2.3. Measurements
Electroencephalograms (EEG) (C3-A2, C4-A1, O1-A2), electrooculograms (EOG), submental electromyograms (EMG) and electrocardiography (ECG) were continuously recorded throughout the night with an 18-channel EEG machine (EEG-4317; Nihon-Kohden, Tokyo, Japan). Sleep recordings were blind scored visually every thirty seconds based on the standard manual of Rechtschaffen and Kales [15]. Temperature data were also continuously recorded with thermistor probes (401 J, Nikkiso-YSI, Tokyo, Japan) and a data logger (LT8A, Gram Corporation, Saitama, Japan) at 30-s intervals. Tre, as a measure of core body temperature, was determined by inserting a thermistor probe 12 cm beyond the anal sphincter. Ts values were measured by attaching thermistors with thin, air-permeable, adhesive surgical tape (Micropore™, 3M Health Care, Tokyo, Japan) to the skin surface of the mid-portion of each of the forehead, chest, forearm, dorsal hand, anterior thigh, lateral leg and dorsal foot. Mean Ts was calculated according to the formula of Ramanathan (1964) [16].
mean Ts = 0.3 × chest + 0.3 × arm + 0.2 × thigh + 0.2 × leg
In this sleep study, we defined two microclimates. The first is the clothing climate, which is the innermost climate between the skin and pajamas. The second is the bedding climate, which is between the pajamas and bedding. We measured the temperature (Tmicro) and humidity (Hmicro) in each microclimate from the chest area of each subject. Heat-proof, small board sensors were placed on the surface of the skin and pajamas to measure Tmicro and Hmicro. Sensors on the pajamas did not touch the skin and were not affected by Ts. A second pair of Tmicro and Hmicro measurements was acquired from sensors placed on the dorsal part of the foot. A third pair of Tmicro and Hmicro measurements was acquired from sensors fixed to the bedding, though Candas did not show the locations of the Tmicro in detail [6]. Prior to and after the sleep-recording sessions, we measured the tympanic temperature and whole-body mass of the subjects with an infrared thermometer (3000A, First Temp, Huntsville, AL, USA) and a sensitive platform balance (ID3S, Mettler Toledo, Tokyo, Japan), respectively; the latter measurement was performed with the subjects not wearing pajamas. The whole-body mass loss was calculated from the weights determined prior to and after the sleep sessions. The thermal comfort questionnaire contained the following items: thermal sensations (−4: very cold, −3: cold, −2: cool, −1: slightly cool, 0: neutral, 1: slightly warm, 2: warm, 3: hot, 4: very hot) for the whole body, head and foot and thermal comfort sensations (−3: very uncomfortable, −2: uncomfortable, −1: slightly uncomfortable, 0: neutral, 1: slightly comfortable, 2: comfortable, 3: very comfortable) for the whole body. A subjective evaluation of sleep was carried out in the morning after the experimental night utilizing the questionnaire from the semantic differential method using seven scales. The questionnaire consists of five factors, 1: sleep onset (hard-easy), 2: refresh (uncomfortable-comfortable), 3: sleeping time (not sufficient-sufficient), 4: sleeping depth (lighter-deeper), 5: satisfaction (dissatisfied-satisfied).
2.4. Data Analysis and Statistics
The results are expressed in the tables as the means ± standard deviation (SD), and the mean and SD values are denoted in the figures by symbols and bars, respectively. Sleep recordings were visually blind-scored every 30 s, based on the standard procedure [15]. Sleep-onset latency was normalized prior to statistical analysis, via logarithmic transformation. One-way analysis of variance (ANOVA) was used to determine the effects of temperature on sleep parameters and whole-body mass loss. ANOVA was used to confirm the thermal comfort in the 22 °C pretest room among the three nights before going to sleep in the set Ta in the climatic chamber. Two-way repeated-measures ANOVA was used to assess the effect of Ta (3 °C, 10 °C and 17 °C) and timing (before sleep, after sleep and retrospective sensation during sleep) on thermal sensation for whole body, head, feet and thermal comfort. To reduce short-term fluctuations and the number of time segments involved, the temperatures (Tre, mean Ts, local Ts and Tmicro) and humidity (Hmicro) were averaged into 5-min blocks; at 30-min intervals, they were analyzed using two-way repeated-measures ANOVA. Following ANOVA, whenever the F-ratio proved significant, a Bonferroni correction was applied, for a post-hoc pairwise comparison. The level of significance adopted was p < 0.05. One-way repeated-measures ANOVA was used to compare Tmicro1, Tmicro2 and the relevant chest Ts and Tmicro3, Tmicro4 and the relevant foot Ts at each Ta condition during the sleeping period.
3. Results
3.1. Sleep Parameters
The results of the sleep-parameter measurements are shown in Table 1. No significant differences were observed among the three Ta conditions (3 °C, 10 °C and 17 °C), with respect to the sleep efficiency index, sleep-onset latency or total duration of each sleep stage. In addition, the sleep-distribution percentage for each stage was calculated from the total sleep time and the duration of each sleep cycle, and no significant differences were observed in the sleep-distribution percentages for each stage, among the three Ta conditions. The average durations of the REM period in each sleep cycle for the three Ta conditions are shown in Table 2. We observed clearly a main effect of cycle (F4,104 = 60,695, p < 0.0001) and an interaction between the sleep cycle and Ta (F8,104 = 2.048, p = 0.0478), as reflected in the duration of the REM period. Post-hoc comparison revealed that both the REM periods in the first and fifth cycles were significantly shorter than in the second, third or fourth (p < 0.05). The post-hoc comparison revealed that the durations of the REM period in the first and fifth cycles were significantly shorter than in the third cycle at 17 °C (p < 0.05). At 10 °C, the duration of the REM period was significantly shorter in the first cycle than in the third or fourth cycles, and in the fifth cycle, it was shorter than in the second, third or fourth (p < 0.05). At 3 °C, the duration of the REM period was significantly shorter in the first and third cycles than in the second or fourth cycles and shorter in the fifth than in the fourth (p < 0.05). However, there were no significant differences among the three Ta conditions with respect to the number of REM periods or the length of the REM cycle.
3.2. Body Temperature and Microclimate
Figure 1 shows the time course of changes in Tre, mean Ts and local Ts, at seven sites for the three Ta conditions. The subjects filled out the questionnaire for about 15 min, while exposed to a low temperature before sleep. All Ts values decreased under the three different Ta conditions at the −30-min and −15-min time points. Then, they laid on a bed and covered themselves with the bedcovering; all the Ts values except that of the forehead increased quickly after −15 min. The forehead Ts initially decreased in proportion to the Ta when the subjects moved to the colder room. After the lights were turned out, the forehead Ts did not continue to decrease during the sleep sessions; instead, it remained stable under all three Ta conditions. After the lights were turned out, those Ts except forehead continued to increase and stabilized at 32 to 35 °C during sleep in all three Ta conditions. No significant differences were observed among the three Ta conditions with respect to Tre or mean Ts, although the main effect of Ta on the change rate in Tre (F2,33 = 4.13, p = 0.025) was significantly observed. Post-hoc comparison shows that the decrease in Tre at 3 °C was significantly greater than that at 17 °C (p = 0.0084) and 10 °C (p = 0.57). The interaction of Ta and time on Tre (F64,1024 = 1.57, p = 0.0034) and the change rate in Tre (F64,1024 = 1.31, p = 0.056) were also found. Under the three Ta conditions, the main effects of Ta on the local Ts on the forehead (F2,33 = 36.86, p < 0.0001) and thigh (F2,33 = 4.91, p = 0.013) were found to be significant, while no differences were observed on the chest, arm, hand, leg or foot. Post-hoc comparisons showed that the Ts of the forehead was the lowest at 3 °C, and it was significantly lower at 10 °C than at 17 °C. The Ts of the thigh was significantly lower at 3 °C than at 10 °C or 17 °C, but no significant difference was observed between 10 °C and 17 °C. A significant difference was observed in the decreasing rate of Tre (F2,33 = 3.89, p = 0.030), which was significantly greater at 3 °C than at 10 °C or 17 °C; however, there was no significant difference between 10 °C and 17 °C. The effects of Ta on the increasing rate in Ts on the arm (F2,33 = 3.7, p = 0.035) and hand (F2,33 = 6.71, p = 0.003) were found, while no differences were observed with respect to the forehead, chest, thigh, leg or foot. Post-hoc comparisons showed that the increasing rate in Ts of the arm and hand were significantly greater at 3 °C than at 17 °C, and no significant difference was observed between 10 °C and 17 °C or between 3 °C and 10 °C.
Table 3 shows the microclimate temperature (Tmicro) and humidity (Hmicro) at the chest and foot area during the sleeping period. No significant differences were observed among the three Ta conditions, with respect to the innermost Tmicro1 and Hmicro1 between the skin and pajamas; Tmicro2 and Hmicro2 between pajamas and bedding at the chest area; and Tmicro3 and Hmicro3 between bedding and skin at the foot area. Table 3 shows the average (SD) Tmicro and Hmicro values for the chest and foot, under the three Ta conditions. At 3 °C, chest Ts was significantly higher than Tmicro2 (p < 0.05), and no significant differences were found between Ts and Tmicro1 or between Tmicro1 and Tmicro2 at the chest area. At 10 °C, the chest Ts and Tmicro1 were significantly higher than Tmicro2 (p < 0.05), but there was no significant difference between Ts and Tmicro1 at the chest area. At 17 °C, chest Ts was significantly higher than Tmicro1 and Tmicro2 (p < 0.05), and Tmicro1 was significantly higher than Tmicro2 (p < 0.05) at the chest area. At the foot area, Ts was significantly higher than Tmicro3 and Tmicro4 under all three Ta conditions (p < 0.05), but no significant differences were found between Tmicro3 and Tmicro4.
The average ± SD of the tympanic temperatures at 3 °C, 10 °C and 17 °C before (after) the sleep session were 36.6 ± 0.8 °C (36.0 ± 0.9 °C), 36.9 ± 0.6 °C (36.4 ± 0.5 °C) and 36.9 ± 0.6 °C (36.8 ± 0.8 °C), respectively. The average ± SD of changes in tympanic temperature during sleep were −0.6 ± 0.7 °C, −0.5 ± 0.6 °C and −0.4 ± 0.5 °C at 3 °C, 10 °C and 17 °C, respectively. No differences were observed among the conditions with respect to tympanic temperatures prior to (F2,33 = 0.643, p = 0.53) or after (F2,33 = 3.043, p = 0.061) sleep or in temperature change observed during sleep (F2,33 = 1.504, p = 0.237).
3.3. Whole-Body Mass Loss
Average ± SD of whole-body mass loss was 18.6 ± 5.0 g·h−1·m–2, 21.5 ± 4.7 g·h–1·m–2 and 24.5 ± 6.9 g·h–1·m–2 at 3 °C, 10 °C and 17 °C, respectively. A significant difference was observed among the conditions with respect to whole-body mass loss (F2,33 = 3.29, p = 0.049): It was significantly higher at 17 °C than at 3 °C. No significant difference was observed between 10 °C and 17 °C or 3 °C and 10 °C.
3.4. Subjective Sensations
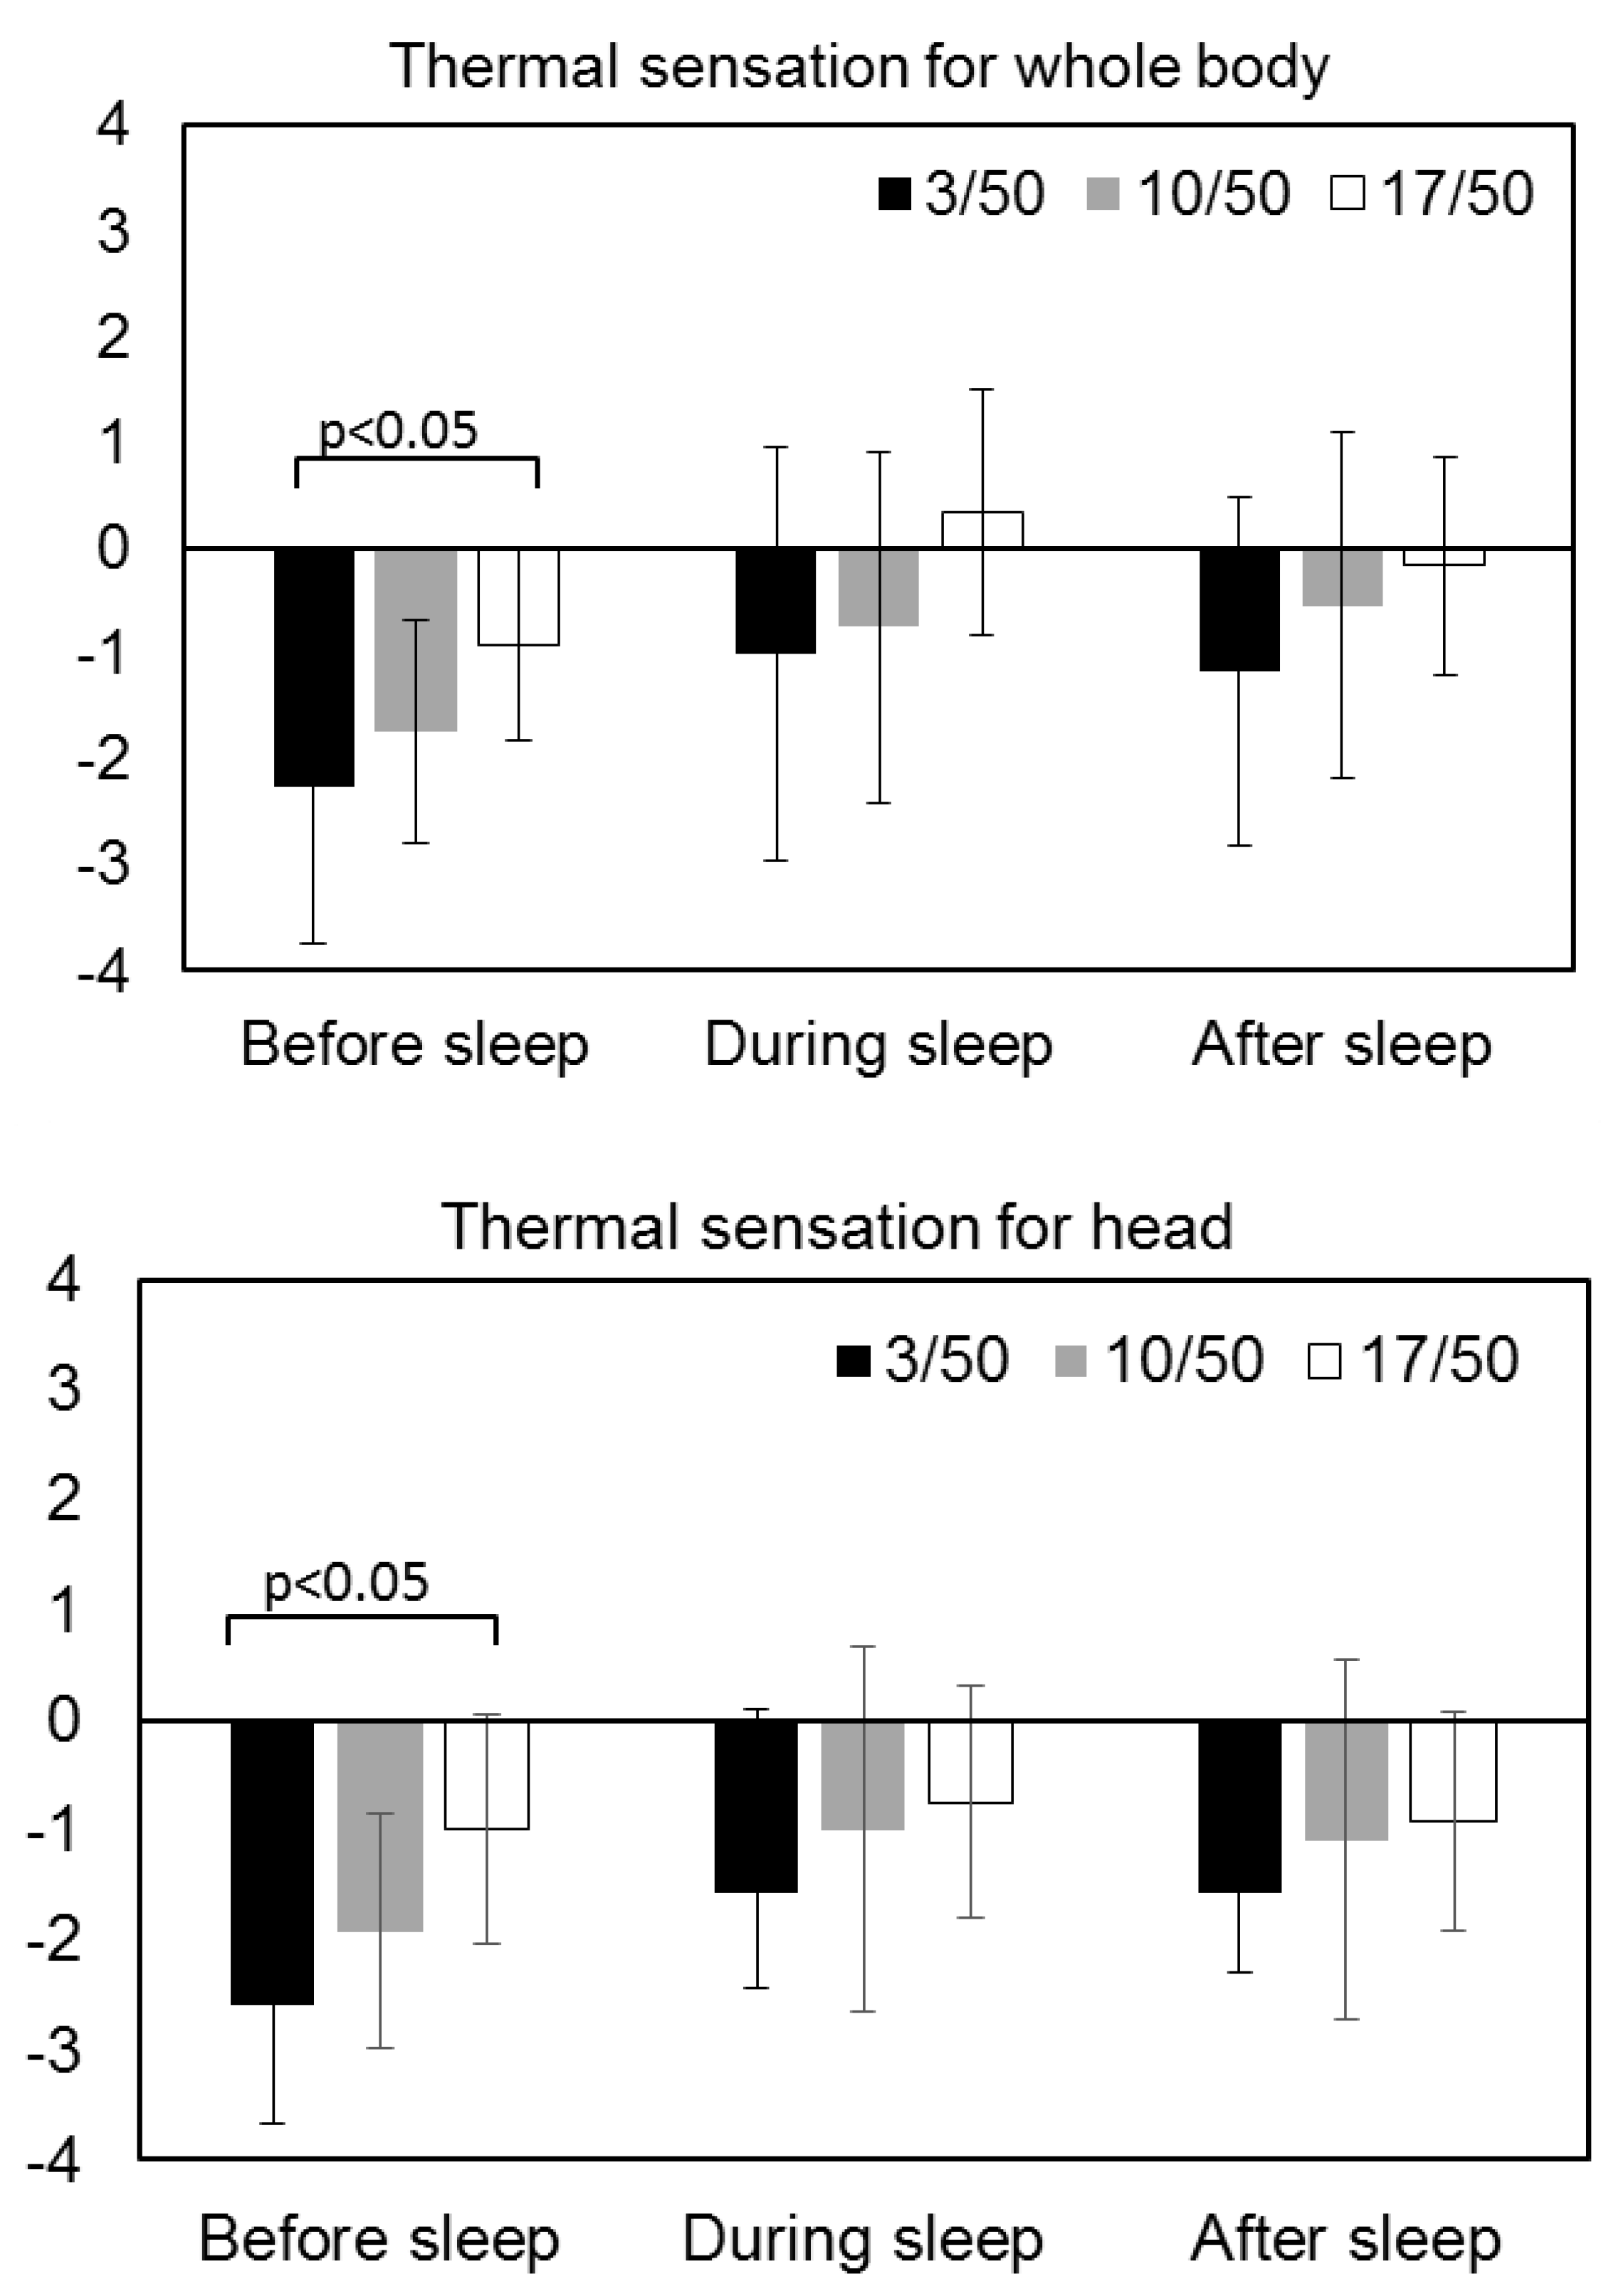
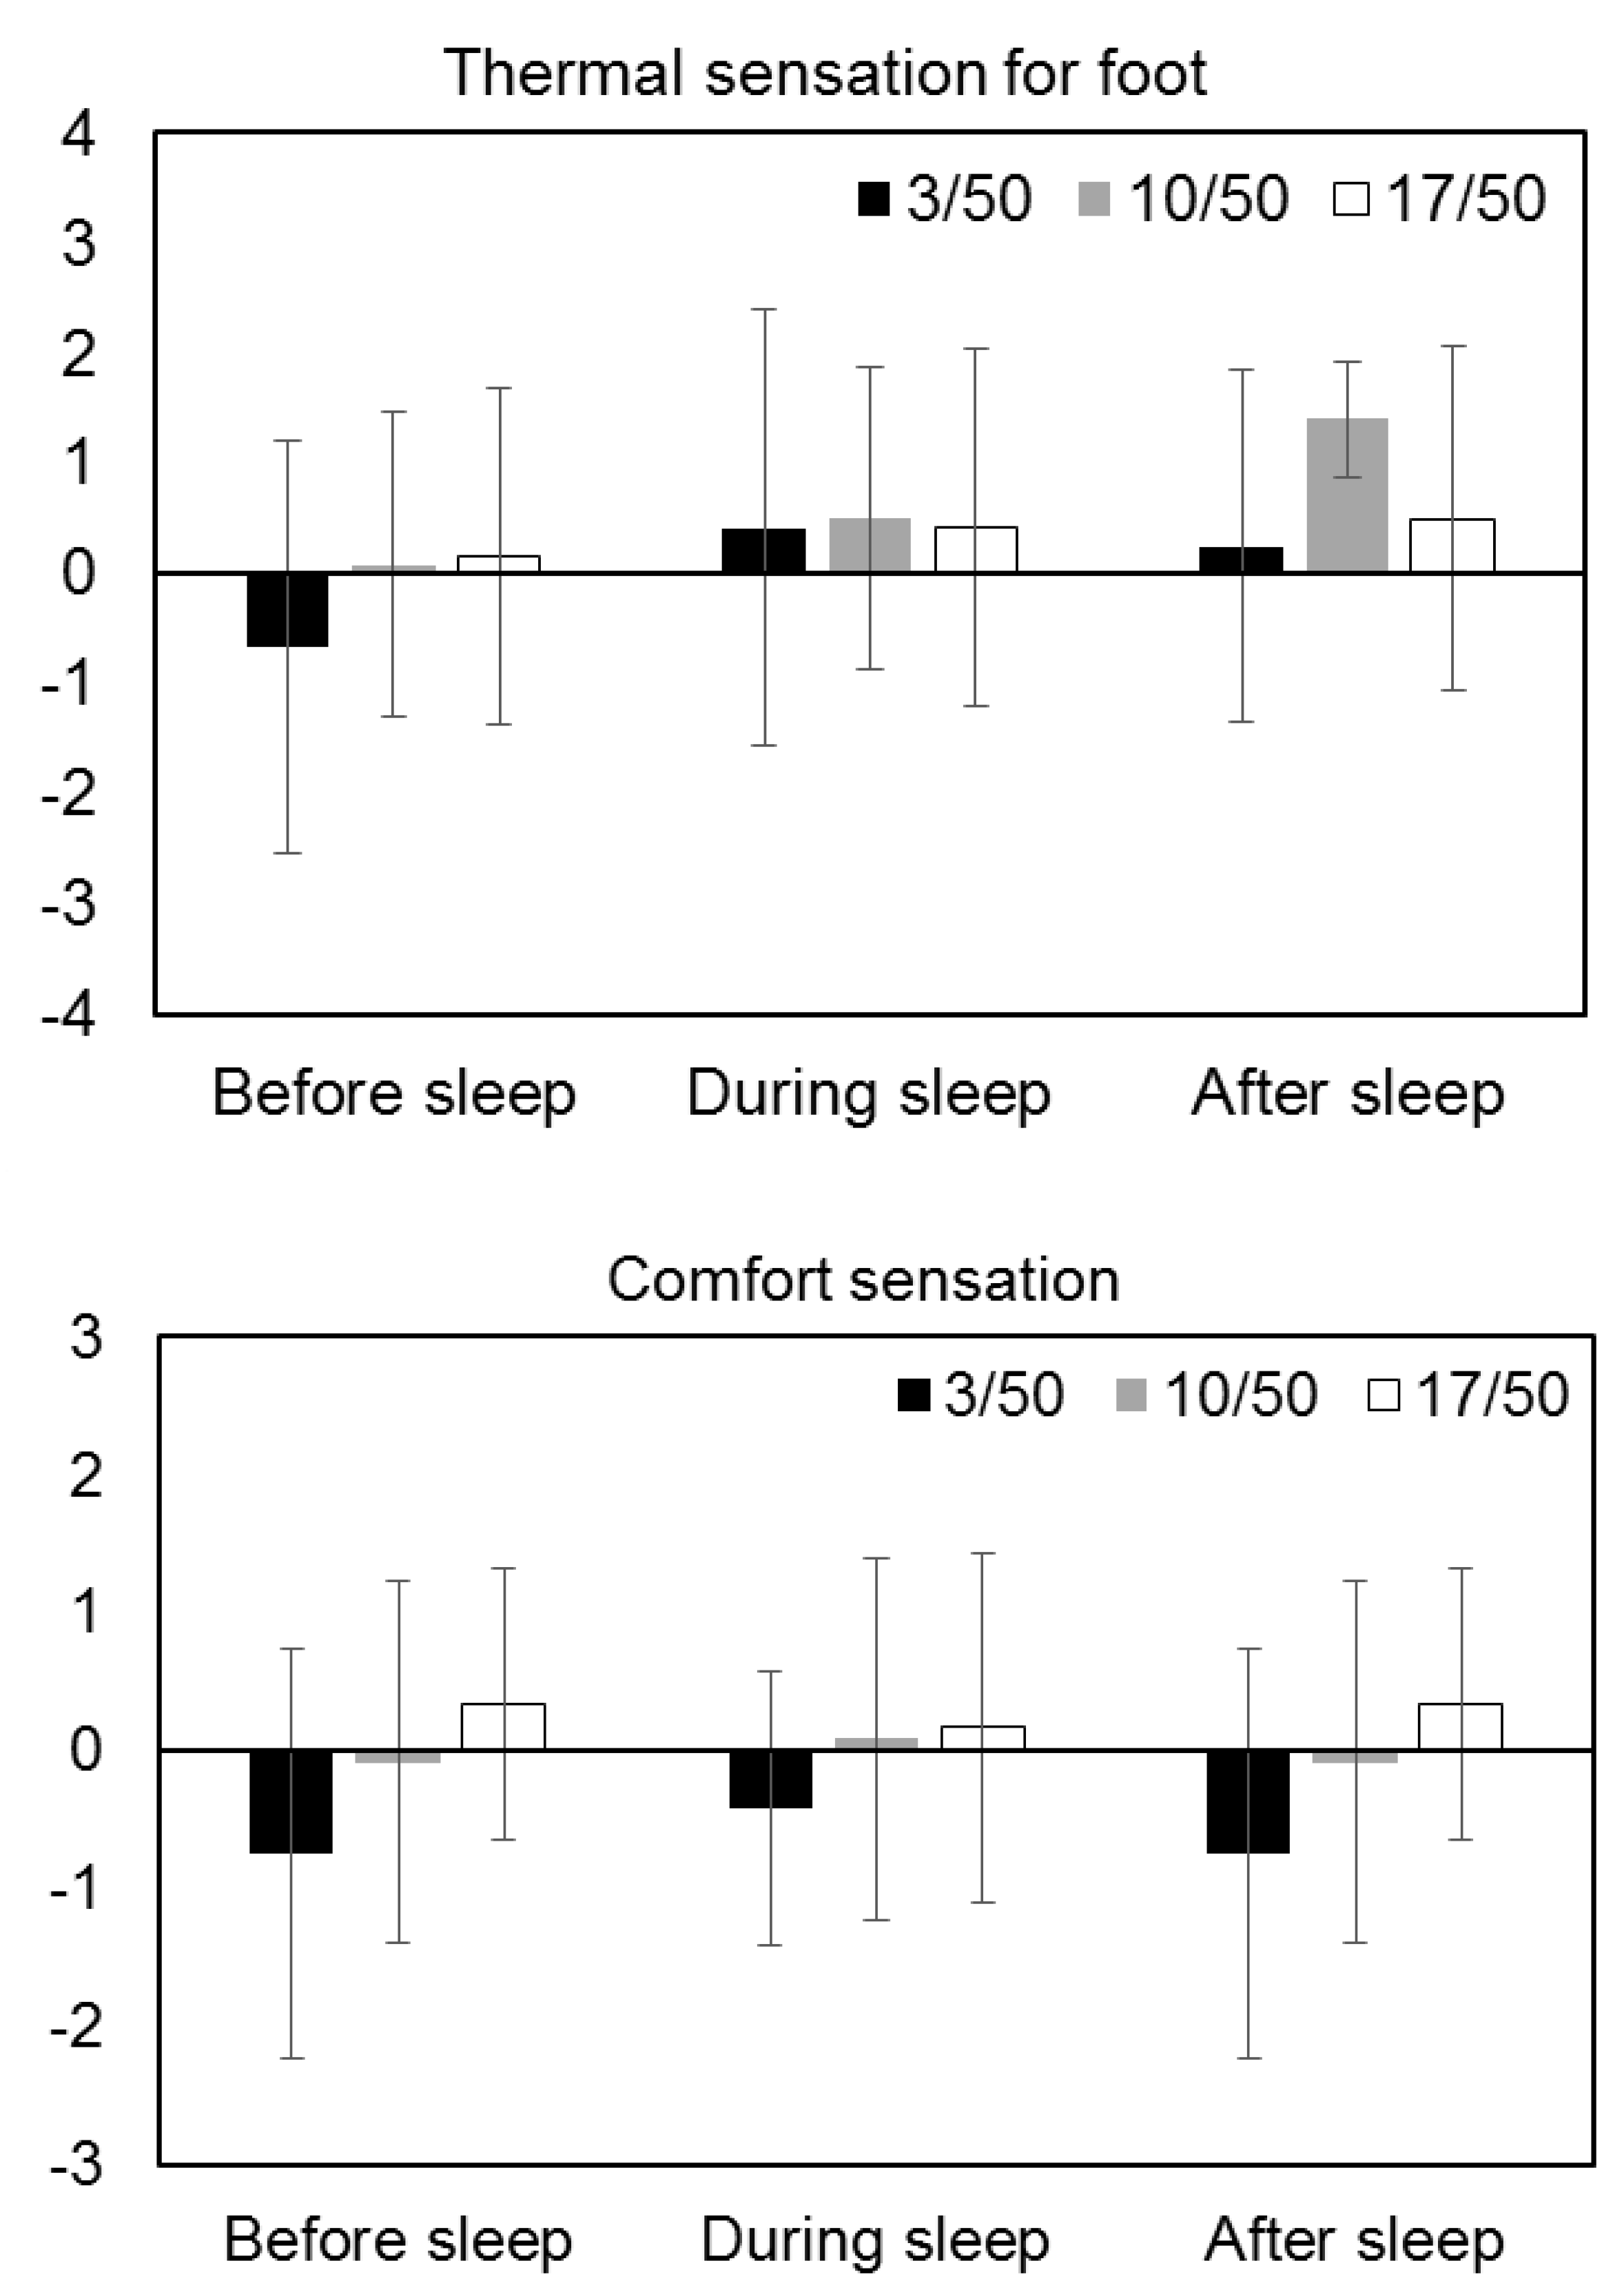
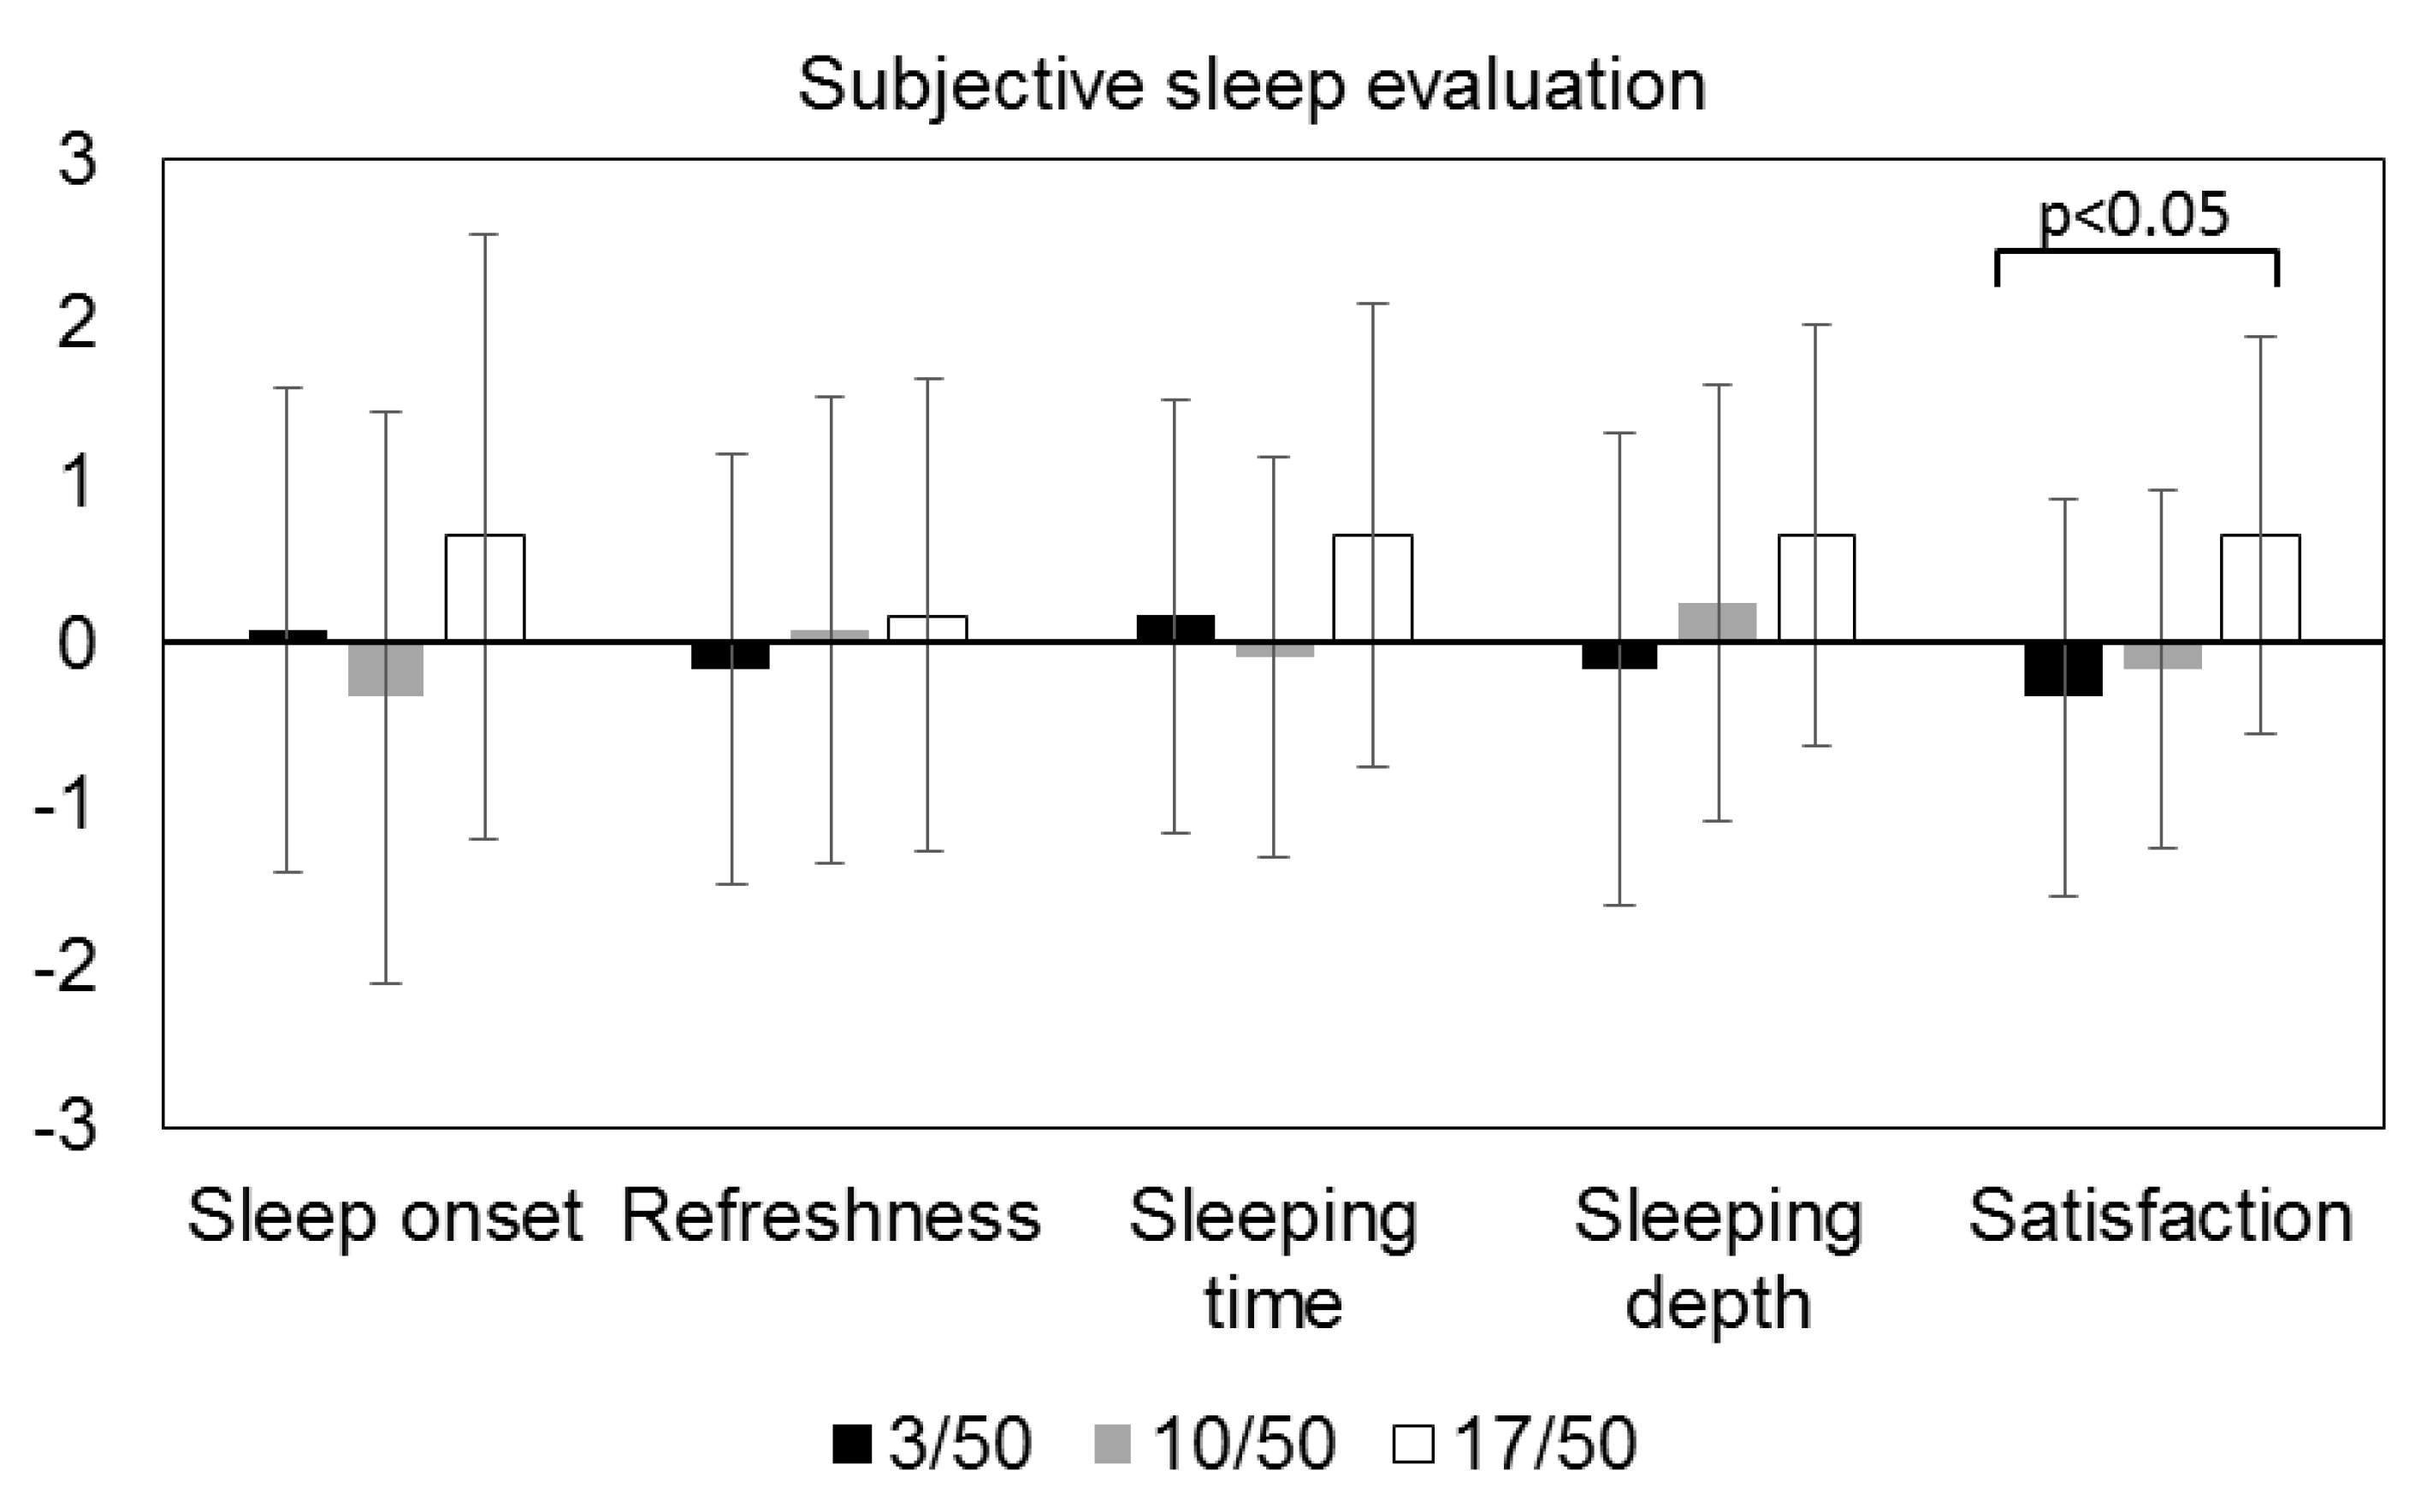
In the 22 °C pretest room, the average (SD) of thermal sensation for the whole body was 0.7 (1.4), 0.7 (1.2) and 0.7 (1.1) before being exposed to the Ta of 3 °C, 10 °C and 17 °C in the climatic chamber, respectively. Similarly, averages (SD) of thermal sensation were 0.7 (0.9), 0.6 (1.2) and 0.4 (0.8) for head and 0.4 (1.2), 0.8 (1.2) and 0.4 (1.4) for foot. Averages (SD) of comfort sensation were 0.4 (1.2), 0.5 (1.4) and 0.4 (1.2) in the pretest room before exposure to 3 °C, 10 °C and 17 °C. There were no significant differences on thermal sensation for whole body, head, foot and thermal comfort at 22 °C in the pretest room among the three different nights. A two-way repeated measures ANOVA revealed significant main effects of timing for thermal sensation (TS) for whole body, head and foot in Table 4. TS for whole body, head and foot before sleep are significantly cooler than that after sleep and retrospective assessment during sleep in Figure 2. Another main effect of Ta was marginally significant on thermal sensation for whole body and head; however, post-hoc comparison showed that thermal sensation at 3 °C was significantly colder than that at 17 °C. An interaction effect of Ta and timing was not statistically found. In the sleep evaluation by subjective sensation, there were no significant differences in the four factors, sleep onset, refresh, sleeping time and sleeping depth, among the 3 °C, 10 °C and 17 °C conditions (Figure 3). However, a significant difference was found in satisfaction, and the feeling of satisfaction was significantly lower at 3 °C than that at 17 °C.
4. Discussion
The most important result of this study was that no disturbances were caused by Tas of 3 °C, 10 °C and 17 °C in the latencies of sleep onset, at each sleep stage, as well as in the total durations of each sleep stage. This is contrary to some of the previous studies where the durations of Stage 2 and REM sleep were found to be disturbed for naked subjects exposed to cold (Ta, 21 °C) [8], that arctic night exposure to cold (i.e., Ta ranging from −29 to −35 °C) mainly affected rapid eye movement (REM) sleep in subjects using highly insulated sleeping bags (9 clo), owing to the suppression of thermoregulatory shivering and body movements [8], and the total duration of awaking after sleep onset was shortest at 16 °C than 13 °C, 19 °C, 22 °C and 25 °C while using bedding; although, the longest total duration of waking was observed at 13 °C [10]. The reason why no disturbance was found by the low Ta in the present study is thought to be due to the mean Ts being maintained at a thermally comfortable level (34–35 °C), and the skin temperature (Ts) of the chest, arm, hand, leg and foot did not differ significantly during sleep among Tas of 3 °C, 10 °C and 17 °C under highly insulated bedding, except for that of the forehead and thigh. Before the lights went out, all of the subjects’ Ts decreased while filling out the questionnaire in the low-Ta condition. Subsequently, as the subjects lay down and drew up their bedding, their Ts, excluding the head, started to increase. This increase in Ts was attributable to the cutaneous vasodilation induced by postural change [17] and to the reduction of heat loss. Such skin-warming may have increased neuronal activity in those brain areas involved in sleep regulation [18,19] and therefore may have facilitated better sleep quality.
The forehead Ts decreased when the subject moved to the low-Ta climatic chamber and lay down under the bedding. However, the forehead Ts did not continue to decrease as sleep progressed; instead, it remained stable under all three Ta conditions. This finding may be explained by the lack of peripheral vasoconstriction in the forehead [20,21]. An interesting result was that Tre decreased during sleep at Tas of 3 °C, 10 °C and 17 °C; notably, the decrease in Tre was significantly greater at 3 °C than that at 10 °C or 17 °C, although, as previously indicated, the mean Ts, the Ts of the chest, arm, hand, leg and foot, as well as Tmicro did not differ significantly due to highly insulated bedding during sleep among Tas of 3 °C, 10 °C and 17 °C. The decreasing rate in Tre significantly correlated with Ta and both Ts of forehead and thigh, the latter of which also correlated with Ta. Therefore, these interesting results suggest that the decrease in Tre might be attributed to heat loss from the head region, i.e., heat was continuously lost from the skin of the face and respiratory tract during sleep. The Ts of thigh was found to decrease a little bit for the beginning and stay for the remaining time of sleep after the Ts of foot increased for the first two hours of the sleep. Therefore, the Ts of the thigh at 3 °C might have been influenced by decreasing rectal temperature.
In the previous study, Candas had showed that Tmicro at the leg and the variations in Tre were found to be strongly correlated [6]. However, the present results found that Tre has only a correlation with Tmicro at the chest between the pajamas and the bedding, but not for the foot and chest between the skin and pajamas. A possible reason for this discrepancy might be the higher insulating value of the bedding used in the present study. The minimum value of Tre is significantly lowest at 3 °C, although the time of minimum value for Tre was not significantly different among the three Tas. The circadian profile of Tre was thought to be masked by the ambient Ta using the bedding. In the previous study, unmasking conditions show that the circadian variation in Tre is a consequence of endogenous circadian rhythms in both heat production and heat loss [22]. In the present study, the Ts at distal regions did not show any significant difference over time among the three Ta. Although the changes in heat loss are reflected by Ts at distal regions, the Ts for hands and feet did not change so much and kept warmer due to being covered by the bedding during the sleeping period. However, interestingly, the rate of decrease in the Ts of both the arm and hand was significantly greater at 17 °C than at 3 °C during mid-sleep. This is due to the subjects often keeping their upper extremities on top of the bedcovers at a Ta of 17 °C, so that their upper extremities were exposed to the Ta. The subjects might feel considerably warmer when sleeping at 17 °C, although no significant differences in thermal and comfort sensations were found between 17 °C and 3 °C after waking up in the morning, supported by the fact that body mass loss was significantly higher by getting a bit sweaty at 17 °C than at 3 °C. Body movements and the adjustment of the bed coverings are conceivable behavioral thermoregulatory mechanisms during sleep [23]. The morning surge, such as an increase in Tre before getting up, is known to be dependent on the endogenous mechanism. In this study, a slight increase in Tre was apparently observed among the three Tas before morning awakening; however, neither an increase in heart rate nor a decrease in distal Ts were clearly found antecedently to increase in Tre. That means that the microclimate made by bedding in the low Ta bedroom is also one of the masking factors. As a result, a striking increase in Tre was not observed in this study, which was contradictory to the unmasking condition in the previous study [22].
It is known that REM periods are initially brief, lasting for a duration of several minutes, and increase in duration with every successive non-REM-to-REM sleep cycle. It has been reported that in very cold environments, the total duration of REM sleep decreases [4]; the latency period of REM sleep increases [2]; the length of the REM cycle increases [24]; and thermoregulatory shivering and body movements disappear during REM sleep [8]. Cold stimulation is known to disrupt sleep more than heat stimulation; especially during REM sleep [25]. In this study, neither the numbers and aggregate lengths of the REM sleep periods, nor the lengths of the REM cycles varied among the three Ta conditions. At Tas of 3 °C and 10 °C, the duration of REM sleep was significantly shorter in the first cycle than in the other sleep cycles; moreover, variation in the duration of the REM period was greatest at a Ta of 3 °C. The second REM sleep period was prolonged and may have compensated for the relative brevity of the first period at a Ta of 3 °C. Further, the third REM period was shortened, and the fourth period was prolonged again. Therefore, a possible rebound phenomenon has been found therein. In view of the Ts response to REM sleep, previous studies reported that the Ts of the forehead increased and the Ts of the limbs decreased during REM sleep at 21 °C [7,10], while at 21 °C and 24 °C, Ts did not change at the onset of REM sleep [2]. In the present study, some changes were observed in the Ts of the forehead and limbs at a Ta of 3 °C, 10 °C and 17 °C after the onset of the first or last REM sleep period. However, systemic changes in Ts after the first and last REM sleep episode onset were not observed at any time in the present study against the previous studies [7,10].
The subjects felt significantly more dissatisfied at 3 °C than at 17 °C in sleep evaluation by subjective sensation, although there were no significant differences in the four factors of sleep onset, refresh, sleeping time and sleep depth among the 3 °C, 10 °C and 17 °C conditions. Moreover, the sleep efficiency index (SEI) and sleeping time for total sleep or each sleep stage did not differ at 3 °C, 10 °C or 17 °C. One possible explanation was that the surface of the body for a sleeping person was kept warmer under insulated bedding; however, the internal body was cooled by head-cooling, which facilitated the decrease in Tre at 3 °C. Such decreasing Tre and warmer Ts might cause dissatisfaction after sleep. Generally, for a waking person, Ts quickly reduces in proportion to the decrease in Ta in a cold environment, and afterwards, Tre also decreases. For sleeping persons, when the Ts were kept at a higher level in the hot environment, the Tre did not decrease so much and were kept at a higher level [26]; or Ts changed following the Ta, and the Tre varied in accordance with the Ts [27]. However, it is intriguing in the present study that when the Ts was kept at a higher level by using the bedding, except for the head, the internal body was cooled by head-cooling. The head region contains a high concentration of thermoreceptors, especially cold receptors [28]. Sympathetic activity in the face increased to cold temperature immediately upon entering the climatic chamber, and Ts on the forehead decreased dependently on the Ta, while the subjects rated the cold for their head and whole body as shown in Figure 1 and Figure 3. A possible reason for this was that the subjects were thought to be unaccustomed to the low temperature during the night sleep and the head was exposed to 3 °C in this experiment. The participants who have not experienced Ta of 3 °C in their bedrooms might have complained about their sleep.
In this study, the effects of low air temperature (Ta; 3 °C, 10 °C and 17 °C) on the human sleep stage and thermoregulation were examined while sleeping with highly insulated bedding. Although mean Ts did not differ among the three Tas, both the Ts of the forehead not covered by bedding and Tre decreased in proportion to the Ta. The observed decrease in Tre might be the result of head-cooling. However, the sleep efficiency index remained >93% for each of the three Tas and sleep onset latency, and the total duration of each sleep stage was not disturbed by warmer Ts and Tmicro, nor were they influenced by head-cooling. This study suggests that the sleeping environment of healthy young men with sufficiently insulated bedding allowed a Ta of 3 °C to ensure thermal comfort during sleep. However, even in young men, there were variations in the period of REM sleep, and more dissatisfaction occurrences were found at 3 °C. Moreover, in our previous results [29] for the heart rate variability (HRV), a marked decrease in the low-frequency to the high-frequency power ratio (LF/HF) and the ratio of low-frequency to low-frequency plus high-frequency power (LF/(LF + HF)) during Stage 2 and SWS, with an abrupt increase during REM and intrasleep awakenings, was observed, as well as in those of other studies [30,31]. It is extremely important to mention that low-ambient temperature alters HRV during Stage 2 and SWS without affecting the sleep stages [29]. To avoid fluctuations in REM sleep and marked variations in cardiac autonomic activity during transitions of the sleep stages, even if the thermoregulation was preserved during the sleep by the use of bedding, ambient temperature should be maintained at a level higher than 10 °C.
Some limitations to the present study must be considered. First, the present subjects were young healthy men who have strong sleep pressure when they go to bed and never wake due to uresiesthesia during the sleep. Rather, when more highly insulated bedding was used, persons accustomed to getting up in the middle of the night to go to the bathroom or those vulnerable to fragmented sleep might be affected by a lower Ta, such as elderly or poor sleepers. Second, this study was performed to investigate the effect of low temperature on sleep and thermoregulation with the use of bedding in the winter season. It is necessary to compare the sleep and thermoregulation in the winter season with those responses for other neutral conditions in the summer season or intermediate seasons without using heating or cooling systems.
5. Conclusions
The low Ta cooled the forehead, which was not covered by the insulated bedding, resulting in a decrease in Tre. Moreover, the sleep onset latency, sleep efficiency index and sleep durations of each sleep stage were unaffected by short-term exposure to low temperature before sleep or head-cooling during sleep, and the insulated bedding created a comfortable Tmicro and mean Ts. However, low Ta did cause variations in observed REM sleep of each sleep cycle despite this comfortable Tmicro and mean Ts being maintained. The young male participants felt significantly more dissatisfied with the 3 °C than 17 °C in the subjective sleep quality evaluation even though the sleep onset latency, sleep efficiency index and sleep durations of each sleep stage were not different among the three Ta. Collectively integrating the present results with the cardiac autonomic activity in our previous study, ambient temperature should be maintained at a level higher than 10 °C in the bedroom.
Author Contributions
All authors contributed equally in this research.
Acknowledgments
This work was supported by JSPS KAKENHI Grant Number 17300234, 21300271, 25282016 and LIXIL JS Foundation.
Conflicts of Interest
The authors declare no conflict of interest.
Nomenclature
| Ta | air temperature, °C |
| Rh | relative humidity, % |
| Ts | skin temperature, °C |
| mean Ts | mean skin temperature, °C |
| Tre | rectal temperature, °C |
| Tmicro | microclimate temperature, °C |
| Hmicro | microclimate humidity, Torr |
| SEI | sleep efficiency index, % |
| REM | rapid eye movement |
| SWS | slow wave sleep |
| S2 | Stage 2 |
| PSG | polysomnographic |
| EEG | electroencephalogram |
| EOG | electrooculogram |
| EMG | electromyogram |
| ECG | electrocardiography |
References
- Van Someren, E.J. More than a marker: Interaction between the circadian regulation of temperature and sleep, age-related changes, and treatment possibilities. Chronobiol. Int. 2000, 17, 313–354. [Google Scholar] [CrossRef] [PubMed]
- Krauchi, K.; Deboer, T. The interrelationship between sleep regulation and thermoregulation. Front. Biosci. 2010, 15, 604–625. [Google Scholar] [CrossRef]
- Gilbert, S.S.; van den Heuvel, C.J.; Ferguson, S.A.; Dawson, D. Thermoregulation as a sleep signalling system. Sleep Med. Rev. 2004, 8, 81–93. [Google Scholar] [CrossRef]
- Haskell, E.H.; Palca, J.W.; Walker, J.M.; Berger, R.J.; Heller, H.C. The effects of high and low ambient temperatures on human sleep stages. Electroencephalogr. Clin. Neurophysiol. 1981, 51, 494–501. [Google Scholar] [CrossRef]
- Tsuzuki, K.; Yokoyama, K.; Yokoi, T.; Ogi, H.; Taya, H.; Yoshioka, M.; Nakamura, K. Thermal environments and indoor air quality in the elderly houses in a rural area. Jpn. J. Biometeorol. 2001, 38, 23–32. [Google Scholar]
- Candas, V.; Libert, J.P.; Vogt, J.J.; Ehrhart, J.; Muzet, A. Body temperature during sleep under different thermal conditions. In Indoor Climate; Fanger, P.O., Valbjorn, O., Eds.; Danish Building Research Institute: Copenhagen, Denmark, 1979; pp. 763–778. [Google Scholar]
- Buguet, A.C.; Livingstone, S.D.; Reed, L.D.; Limmer, R.E. EEG patterns and body temperatures in man during sleep in arctic winter nights. Int. J. Biometeorol. 1976, 20, 61–69. [Google Scholar] [CrossRef] [PubMed]
- Buguet, A.G.; Roussel, B.H.; Watson, W.J.; Radomski, M.W. Cold-induced diminution of paradoxical sleep in man. Electroencephalogr. Clin. Neurophysiol. 1979, 46, 29–32. [Google Scholar] [CrossRef]
- Buguet, A.G.; Livingstone, S.D.; Reed, L.D. Skin temperature changes in paradoxical sleep in man in the cold. Aviat. Space Environ. Med. 1979, 50, 567–570. [Google Scholar] [PubMed]
- Muzet, A.; Elirhart, J.; Libert, J.P.; Candas, V. The effect of thermal environment on sleep stages. In Indoor Climate; Fanger, P.O., Valbjorn, O., Eds.; Danish Building Research Institute: Copenhagen, Denmark, 1979; pp. 753–762. [Google Scholar]
- Pan, L.; Lian, Z.; Lan, L. Investigation of sleep quality under different temperatures based on subjective and physiological measurements. HVAC&R Res. 2012, 18, 1030–1043. [Google Scholar]
- Horne, J.A.; Ostberg, O. Self-assessment questionnaire to determine morningness-eveningness in human circadian rhythms. Int. J. Chronobiol. 1976, 4, 97–110. [Google Scholar] [PubMed]
- International Organization for Standardization. ISO15831, Clothing—Physiological Effects—Measurement of Thermal Insulation by Means of a Thermal Manikin; International Organization for Standardization: Geneva, Switzerland, 2004. [Google Scholar]
- ASTM International. ASTM F1729-06, Standard Test Method for Measuring Thermal Insulation of Sleeping Bags Using a Heated Manikin; ASTM International: West Conshohocken, PA, USA, 2006. [Google Scholar]
- Rechtschaffen, A.; Kales, A. A Manual of Standardised Terminology, Technique and Scoring System for Sleep Stages of Human Subjects; Public Health Service, U.S. Government Printing Office: Washington, DC, USA, 1968. [Google Scholar]
- Ramanathan, N.L. A new weighting system for mean surface temperature of the human body. J. Appl. Physiol. 1964, 19, 531–533. [Google Scholar] [CrossRef] [PubMed]
- Tikuisis, P.; Ducharme, M.B. The effect of postural changes on body temperatures and heat balance. Eur. J. Appl. Physiol. Occup. Physiol. 1996, 72, 451–459. [Google Scholar] [CrossRef] [PubMed]
- Van Someren, E.J.W. Sleep propensity is modulated by circadian and behavior-induced changes in cutaneous temperature. J. Therm. Biol. 2004, 29, 437–444. [Google Scholar] [CrossRef]
- Raymann, R.J.; Swaab, D.F.; van Someren, E.J. Skin deep: Enhanced sleep depth by cutaneous temperature manipulation. Brain 2008, 131 Pt 2, 500–513. [Google Scholar] [CrossRef] [PubMed]
- Hertzman, A.B.; Roth, L.W. The absence of vasoconstrictor reflexes in the forehead circulation. Effects of Cold. Am. J. Physiol. 1942, 136, 692–697. [Google Scholar] [CrossRef]
- Steegmann, A.T., Jr. Human facial temperatures in natural and laboratory cold. Aviat. Space Environ. Med. 1979, 50, 227–232. [Google Scholar] [PubMed]
- Krauchi, K.; Wirz-Justice, A. Circadian rhythm of heat production, heart rate, and skin and core temperature under unmasking conditions in men. Am. J. Physiol. 1994, 267 Pt 2, R819–R829. [Google Scholar] [CrossRef] [PubMed]
- Okamoto-Mizuno, K.; Tsuzuki, K.; Mizuno, K. Effects of head cooling on human sleep stages and body temperature. Int. J. Biometeorol. 2003, 48, 98–102. [Google Scholar] [CrossRef] [PubMed]
- Muzet, A.; Ehrhart, J.; Candas, V.; Libert, J.P.; Vogt, J.J. REM sleep and ambient temperature in man. Int. J. Neurosci. 1983, 18, 117–126. [Google Scholar] [CrossRef] [PubMed]
- Candas, V.; Libert, J.P.; Muzet, A. Heating and cooling stimulations during SWS and REM sleep in man. J. Therm. Biol. 1982, 7, 155–158. [Google Scholar] [CrossRef]
- Tsuzuki, K.; Okamoto-Mizuno, K.; Mizuno, K. Effects of humid heat exposure on sleep, thermoregulation, melatonin, and microclimate. J. Therm. Biol. 2004, 29, 31–36. [Google Scholar] [CrossRef]
- Okamoto-Mizuno, K.; Tsuzuki, K.; Mizuno, K.; Iwaki, T. Effects of partial humid heat exposure during different segments of sleep on human sleep stages and body temperature. Physiol. Behav. 2005, 83, 759–765. [Google Scholar] [CrossRef] [PubMed]
- Crawshaw, L.I.; Nadel, E.R.; Stolwijk, J.A.J.; Stamford, B.A. Effect of local cooling on sweating rate and cold sensation. Pflugers Arch. 1975, 354, 19–27. [Google Scholar] [CrossRef] [PubMed]
- Okamoto-Mizuno, K.; Tsuzuki, K.; Mizuno, K.; Ohshiro, Y. Effects of low ambient temperature on heart rate variability during sleep in humans. Eur. J. Appl. Physiol. 2009, 105, 191–197. [Google Scholar] [CrossRef] [PubMed]
- Viola, A.U.; Simon, C.; Ehrhart, J.; Geny, B.; Piquard, F.; Muzet, A.; Brandenberger, G. Sleep processes exert a predominant influence on the 24-h profile of heart rate variability. J. Biol. Rhythms 2002, 17, 539–547. [Google Scholar] [CrossRef] [PubMed]
- Elsenbruch, S.; Harnish, M.J.; Orr, W.C. Heart rate variability during waking and sleep in healthy males and females. Sleep 1999, 22, 1067–1071. [Google Scholar] [CrossRef] [PubMed]
Figure 1.
The time course of changes in Tre, mean Ts and local Ts, at seven sites for the three Ta conditions.
Figure 1.
The time course of changes in Tre, mean Ts and local Ts, at seven sites for the three Ta conditions.

Figure 2.
Average (SD) of thermal sensation (TS) and comfort sensation (CS) before, after and during the sleep. TS was asked for the whole body, head and foot, respectively.
Figure 2.
Average (SD) of thermal sensation (TS) and comfort sensation (CS) before, after and during the sleep. TS was asked for the whole body, head and foot, respectively.


Figure 3.
Average (SD) rating of sleep evaluation, sleep onset, refresh, sleeping time, sleeping depth and satisfaction.
Figure 3.
Average (SD) rating of sleep evaluation, sleep onset, refresh, sleeping time, sleeping depth and satisfaction.


Table 1.
Sleep parameters under 3 °C, 10 °C and 17 °C. Results are shown as the average ± SD. REM: rapid eye movement, TST: total sleep time, SEI: Sleep efficiency index.
Table 1.
Sleep parameters under 3 °C, 10 °C and 17 °C. Results are shown as the average ± SD. REM: rapid eye movement, TST: total sleep time, SEI: Sleep efficiency index.
| 3 °C | 10 °C | 17 °C | F (2,33) | p | |
|---|---|---|---|---|---|
| Latency [min] | |||||
| Sleep Onset | 10 ± 9.8 | 6.7 ± 5.9 | 9.8 ± 6.6 | 0.16 | 0.84 |
| Stage REM | 92.1 ± 30.9 | 90.7 ± 27.8 | 105.6 ± 37.6 | 1.38 | 0.26 |
| Time spend for [min] | |||||
| Stage W | 26.4 ± 12.2 | 27.6 ± 22.3 | 26.4 ± 24.4 | 0.29 | 0.74 |
| Stage 1 | 40.2 ± 11.8 | 33.9 ± 11.6 | 35.4 ± 11 | 0.92 | 0.40 |
| Stage 2 | 233.1 ± 37.6 | 232.7 ± 25.7 | 239.3 ± 23.3 | 0.34 | 0.71 |
| Stage 3 | 42.1 ± 19.3 | 38.7 ± 12.3 | 39.7 ± 9.5 | 0.07 | 0.93 |
| Stage 4 | 31.2 ± 20.5 | 38.5 ± 21.3 | 37.3 ± 22.9 | 0.29 | 0.74 |
| Stage 3 + 4 | 73.3 ± 29.8 | 77.2 ± 26.4 | 77 ± 23.8 | 0.11 | 0.89 |
| Stage REM | 107 ± 16 | 108.6 ± 20.5 | 102 ± 17.9 | 0.18 | 0.83 |
| TST | 453.6 ± 12.2 | 452.4 ± 22.3 | 453.7 ± 24.4 | 2.11 | 0.13 |
| SEI [%] | 94.5 ± 2.5 | 94.2 ± 4.6 | 94.5 ± 5.1 | 0.01 | 0.99 |
Table 2.
Duration of the REM period of the sleep cycle at 3 °C, 10 °C and 17 °C. Results are shown as the average ± SD in [min].
Table 2.
Duration of the REM period of the sleep cycle at 3 °C, 10 °C and 17 °C. Results are shown as the average ± SD in [min].
| [min] | 1st | 2nd | 3rd | 4th | 5th | F | p |
|---|---|---|---|---|---|---|---|
| 3 °C | 11.5 ± 6.5 bd | 30.4 ± 16.0 ac | 16.9 ± 6.5 bd | 32.1 ± 16.2 ace | 18.1 ± 15.5 d | (8,32) 3.97 | 0.0099 |
| 10 °C | 12.3 ± 9.2 cd | 22.0 ± 12.6 e | 25.7 ± 19.2 ae | 32.6 ± 19.3 ae | 7.3 ± 10.2 bcd | (10,40) 4.67 | 0.0034 |
| 17 °C | 16.9 ± 9.6 c | 20.2 ± 7.0 | 27.1 ± 12.3 | 22.9 ± 12.2 | 16.3 ± 12.2 c | (8,32) 1.66 | 0.18 |
a: Differs from 1st cycle at the same Ta (p < 0.05), b: Differs from 2nd cycle at the same Ta (p < 0.05), c: Differs from 3rd cycle at the same Ta (p < 0.05), d: Differs from 4th cycle at the same Ta (p < 0.05), e: Differs from 5th cycle at the same Ta (p < 0.05).
Table 3.
Average (SD) of microclimate temperature and humidity at the chest and foot area during the sleeping period.
Table 3.
Average (SD) of microclimate temperature and humidity at the chest and foot area during the sleeping period.
| Location | Measurement | 3 °C | 10 °C | 17 °C | F (2,32) | p |
|---|---|---|---|---|---|---|
| Chest | Ts (°C) | 35.1 (0.7) | 35.1 (1.0) | 35.2 (0.9) | 0.025 | 0.97 |
| Tmicro1 (°C) | 34.5 (3.6) | 33.9 (2.8) | 33.6 (2.8) | 0.52 | 0.59 | |
| Tmicro2 (°C) | 33.3 (2.6) | 32.4 (2.9) | 31.8 (3.5) | 0.85 | 0.43 | |
| Foot | Ts (°C) | 34.1 (1.3) | 34.3 (1.2) | 34.8 (1.1) | 2.36 | 0.1 |
| Tmicro3 (°C) | 29.6 (5.1) | 31.0 (3.6) | 32.3 (2.6) | 1.11 | 0.34 | |
| Tmicro4 (°C) | 28.8 (6.1) | 31.1 (3.6) | 31.2 (3.3) | 1.92 | 0.16 | |
| Chest | Hmicro1 (Pa) | 16.9 (5.2) | 17.7 (9.7) | 18.2 (13.2) | 0.21 | 0.81 |
| Hmicro2 (Pa) | 14.1 (5.5) | 15.9 (5.9) | 15.5 (6.3) | 0.25 | 0.77 | |
| Foot | Hmicro3 (Pa) | 12.6 (3.8) | 14.4 (4.5) | 16.8 (5.7) | 1.22 | 0.3 |
| Hmicro4 (Pa) | 12.6 (6.3) | 13.8 (8.0) | 14.7 (4.4) | 3.33 | 0.048 |
At chest Tmicro1 and Hmicro1 were measured between skin and pyjama, and Tmicro2 and Hmicro2 were measured between pyjama and bedclothes. At foot Tmicro3 and Hmicro3 were measured between skin and the bedclothes, and Tmicro4 and Hmicro4 were fixed inside the bedclothes.
Table 4.
Effects of Ta and timing on thermal comfort.
| Ta | Time | Ta × Time | ||||
|---|---|---|---|---|---|---|
| Variable | F (2,32) | p | F (2, 64) | p | F (4,64) | p |
| Thermal sensation for whole body | 3.269 | 0.051 | 15.291 | <0.0001 | 0.233 | 0.918 |
| Thermal sensation for head | 3.057 | 0.061 | 12.913 | <0.001 | 1.965 | 0.11 |
| Thermal sensation for foot | 1.52 | 0.234 | 4.193 | 0.019 | 0.64 | 0.635 |
| Comfort sensation | 2.259 | 0.128 | 0.592 | 0.556 | 0.466 | 0.76 |
Ta, 3 °C, 10 °C, 17 °C; time, before sleep, after sleep, retrospective assessment during sleep.
© 2018 by the authors. Licensee MDPI, Basel, Switzerland. This article is an open access article distributed under the terms and conditions of the Creative Commons Attribution (CC BY) license (http://creativecommons.org/licenses/by/4.0/).
Share and Cite
MDPI and ACS Style
Tsuzuki, K.; Okamoto-Mizuno, K.; Mizuno, K. The Effects of Low Air Temperatures on Thermoregulation and Sleep of Young Men While Sleeping Using Bedding. Buildings 2018, 8, 76. https://doi.org/10.3390/buildings8060076
AMA Style
Tsuzuki K, Okamoto-Mizuno K, Mizuno K. The Effects of Low Air Temperatures on Thermoregulation and Sleep of Young Men While Sleeping Using Bedding. Buildings. 2018; 8(6):76. https://doi.org/10.3390/buildings8060076
Chicago/Turabian StyleTsuzuki, Kazuyo, Kazue Okamoto-Mizuno, and Koh Mizuno. 2018. "The Effects of Low Air Temperatures on Thermoregulation and Sleep of Young Men While Sleeping Using Bedding" Buildings 8, no. 6: 76. https://doi.org/10.3390/buildings8060076
Note that from the first issue of 2016, this journal uses article numbers instead of page numbers. See further details here.