Improving the Energy Efficiency of the Residential Buildings in Jordan

Department of Mechanical Engineering, Jordan University of Science and Technology, Irbid 22110, Jordan
*
Author to whom correspondence should be addressed.
Buildings 2018, 8(7), 85; https://doi.org/10.3390/buildings8070085
Submission received: 15 May 2018
/
Revised: 6 June 2018
/
Accepted: 13 June 2018
/
Published: 25 June 2018
Abstract
:The purpose of this study is to investigate the impact of energy retrofit programs for the existing residential buildings under the typical Jordanian climate. The Jordanian climate has mild heating season and a hot (and usually dry) cooling season. Several building types located in Jordan were considered as case study. The household sector in Jordan accounts for almost 43% of the total electricity consumption. Three levels of energy retrofit programs have been proposed. The economic, environmental and social benefits of the programs have been analyzed. Parametric analyses have been performed to determine the impact of each energy efficiency measure on the energy performance of residential buildings. The payback period for each level have been determined for several regions located in Jordan. The results proved the feasibility of the program except for implementing the third level on a traditional house. The results show that implementing level 3 energy efficiency measures can save up to 43% of the annual electricity consumption, save up to 842 MW on peak demand energy, and 2190 kilo-ton/year reduction of CO2 emission. That is equivalent to 3.37 TWH of electricity consumption compared to the base case. The total jobs created will be 80,769 job/year when performing the retrofit program.
1. Introduction
The energy requirement for buildings consumes around 40% of the world’s total energy consumption [1]. One-third of the harmful gas emissions around the world is generated by the energy used in buildings [2]. Energy demand is increasing due to population growth [3]. Heat gains and heat losses through the building envelope are responsible for high-energy consumption. Improving the energy efficiency of the building reduces both gains and losses through the envelope.
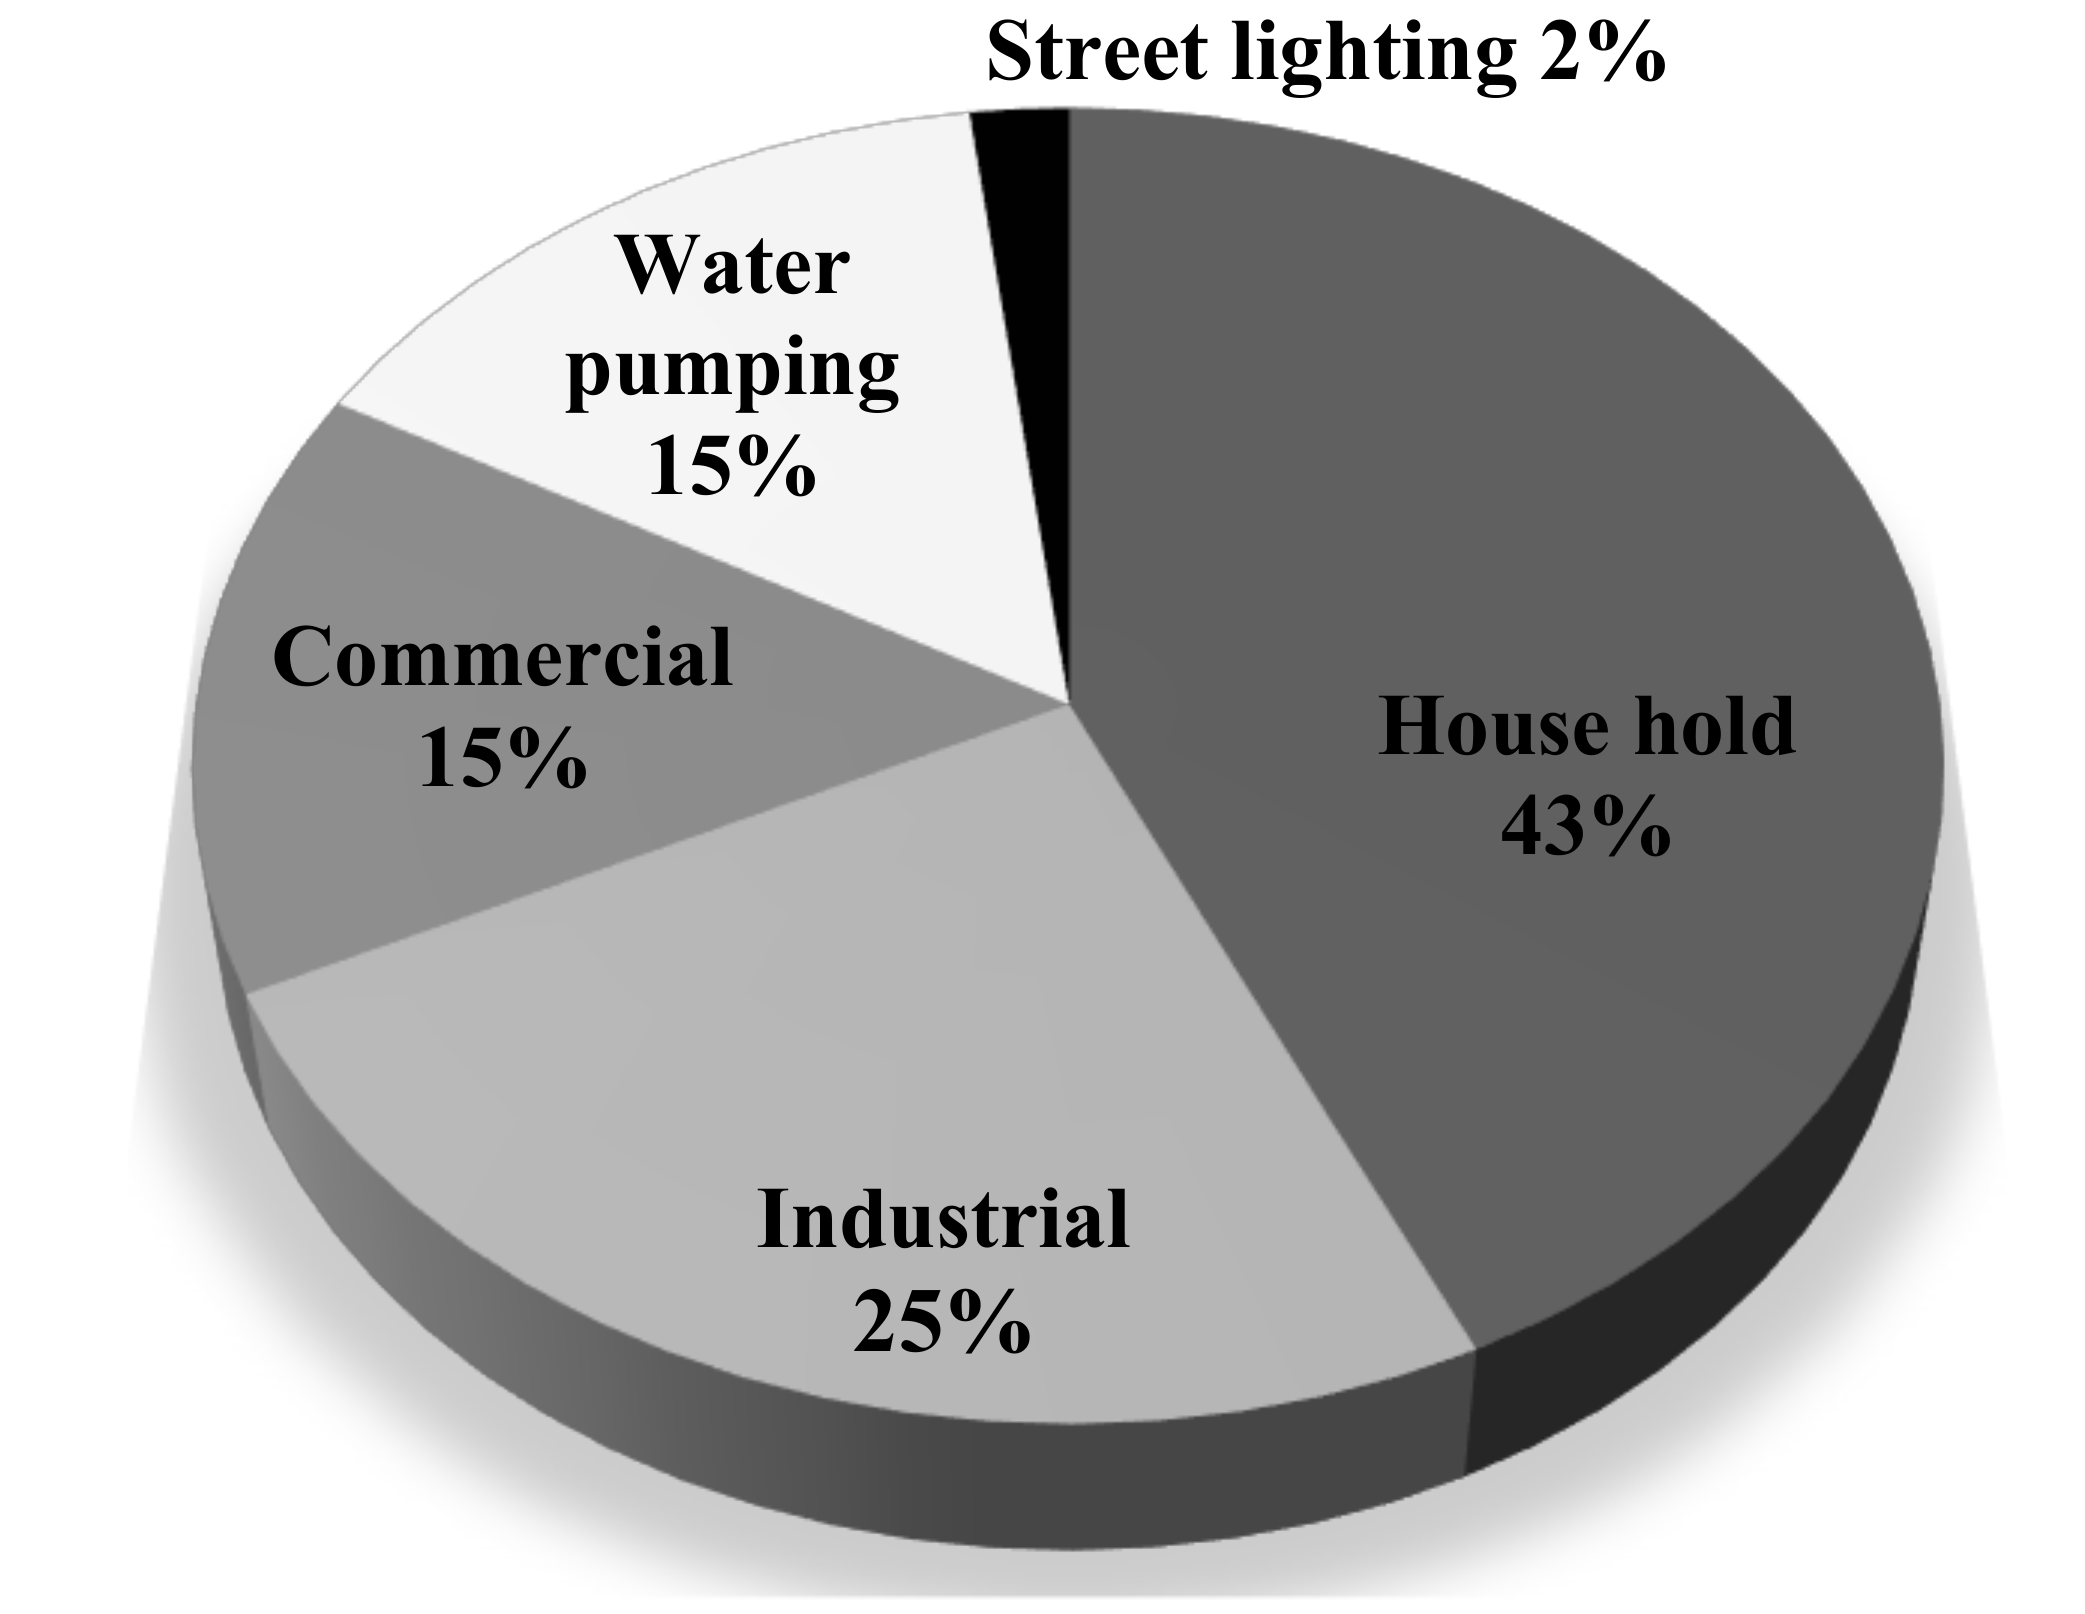
Jordan depends on imported fuel to meet its energy demand. Jordan’s annual bill exceeds 20% of its GDP [4]. The demand for primary energy has increased from 2.4 million ton of oil equivalent (Toe) in 1982 to 7.5 million Toe in 2011.The total electricity generation was approximately 8447 GWh in 2004 and it reached 17,261 GW h in 2013 [5]. Figure 1 shows the electrical energy distribution in Jordan [6]. The household sector accounts for the largest portion of energy consumption in 2016. Hence, reducing the energy consumption in the building sector will have a large impact in the economic, social, and environmental sectors.
Improving energy efficiency in building has received significant attention by many researchers [7,8,9,10,11,12]. The objectives of improving the energy efficiency in building will result in (a) less energy consumption while maintaining comfort level, (b) saving energy and money, and (c) minimizing harmful emissions. Wilhelm A. Friessa and Kambiz Rakhshanb [7] reviewed a number of passive measures dedicated to the hot climate in the United Arab Emirates (UAE). They found that proper building orientations and utilizing thermal insulation could achieve up to 20% energy saving. Rajeev Ruparathna et al. [8] provided a comprehensive review to improve the energy efficiency of commercial and residential buildings. They implied that most of the current energy efficiency projects are being implemented in a random manner. Anisah et al. [9] applied different zero cost energy saving alternatives to decrease the annual energy consumption for office buildings in Jakarta. They found that changing the room set point, replacing lamp bulbs with LED, and upgrading the HVAC system-operating schedule demonstrated the greatest saving potential. Minoo Mardookhy et al. [10] studied the impact of human behavior on energy consumption. They found out that resident behavior has a significant impact on the energy saving of a building.
An energy audit was performed by K.Hassouneh et al. for one department at the University of Jordan [11]. They studied the impact of glazing, wall insulation, and the lighting system on the annual energy consumption. It was found that the payback period for such modifications was less than three years. Nikolaidis et al. examined the effects of all kinds of insulation; upgrades to the heating system; use of thermal solar systems; lighting upgrades; electric appliances upgrades; and upgrading the cooling system on energy savings in a typical Mediterranean climate [12]. It has been found that the most effective energy saving methods are the upgrading of lighting, the insulation of the roof of the building, and the installation of an automatic temperature control system. Ingy El-Darwish and Mohamed Gomaa investigated the most significant retrofit strategy for public building in Egypt [13]. They concluded that solar shading has the largest contribution of the total energy saving followed by double glazing. They reported that the final energy saving is 33% in an arid climate of Egypt.
It has been reported that wall insulation plays significant role in reducing energy loss and gain through the building envelope. Friessa and Rakhshanb found out that 20% of energy savings can be achieved using thermal insulation for residential buildings in the UAE [7]. Furthermore, proper glazing type can save energy up to 55%. Jianen Huang et al. found out that the optimal economic thermal insulation thickness varies depending on the window to wall ratio for different orientations [14]. Meral Ozel studied the impact of the wall orientation on the optimal wall insulation thickness [15]. He found that the optimum thickness for the extruded polystyrene is 5.5 cm for the south oriented wall. For the north, east, and west oriented walls, 6 cm was found to be the optimum thickness. L.F. Cabeza et al. experimentally examined three insulation materials found in typical Mediterranean construction materials [16]. The results showed that polyurethane provides the lowest energy consumption when compared with mineral wool and polystyrene. Furthermore, they found out that energy saving can reach up to 64% in summer and 37% in winter. Dionysios I. Kolaitis et al. provided a comparative assessment of internal versus external thermal insulation systems for the energy efficient retrofitting of residential buildings [17]. They found out that both external and internal thermal insulation configurations have significantly reduced the total energy requirements. On average, external insulation outperforms the internal insulation configuration by 8%. Moreover, it was found that internal insulation requires approximately 50% less investment cost than external insulation.
Windows can cause significant thermal heat gain or losses in buildings. It has been documented that windows are responsible for a significant portion of energy losses in building. It was found that windows are responsible for almost 20% to 40% of energy losses in buildings [3]. Michele Zinzi et al. found that double glazing with a shading device in the gap improved the total energy performance by significantly reducing the cooling loads compared to the relative increase in the heating load [18]. It was found that reducing the window to wall ratio from 40% to 30% reduces energy consumption by 4.3% in residential buildings in Egypt [19]. A study conducted for various locations across Europe found that triple glazing had the best performance [20].
Window shading can cause significant thermal heat gain or losses in buildings. Allen Khin Kiet Lau et al. implied that energy saving potential is more significant when using shading devices for low performance glazing in a hot and humid environment [21]. Yunyang Ye et al. proved that a properly designed internal shading device could be as efficient as an external one [22]. Ebrahimpour and Maerefat studied the effect of advanced glazing and overhangs on the solar energy transmitted into or lost from the room through the fenestration areas for typical residential buildings in Tehran [23]. It was found that appropriate overhangs or side fins in the south, west and east windows would lead to the optimal reduction of the annual energy transferred into the buildings and can have an energetic behavior equivalent to high performance glazing. Al-Tamimia and Fadzila studied the effect of shading devices on the indoor temperature for high rise residential building in Malaysia [24]. Their results indicated that an egg-crates device (a combination of both overhangs and fins) significantly reduced discomfort hours.
Heat gain or losses through the roofs are significant. A studied conducted by Jawdat Goussous et al. in Jordan concluded that a green roof (consists of clay and grass) has better thermal performance than a regular roof [25]. Chao Zeng et al. examined the different parameters that affect comfort and the level of energy consumption in a green roof [26]. They found that the optimal soil thickness is 0.3 m. Jinghua Yu et al. determined the optimum roof insulation thickness for a residential building located in China by using the life cycle cost principle [27]. The optimum thickness ranged between 6.5 cm and 18.7 cm with a payback period ranging between 0.9 and 2.3 years. Aynur Ucar determined the optimum roof insulation thickness for different locations in Turkey [28]. He found out that the optimum thickness ranged from 3.8 to 7.39 cm. On the other hand, excess insulation thickness reduced the effectiveness of the passive cooling strategies.
Several energy efficiency programs at the country level have been proposed. These programs determined the cost effectiveness of the measures at the country level scale. Moncef Krarti [29] suggested an energy efficient retrofit program for a Kuwaiti residential building. The objective of the program was to overcome intensive Kuwaiti energy consumption in three stages. The simulation results showed that considerable economic and environmental benefits can be achieved. Moncef Krarti and Kankana Dubeyb [30] suggested an energy retrofit program for the building stocks in Oman. The program saved 957 GWH of annual electricity consumption and 214 MW of peak demand. Another retrofit program suggested by Moncef Krarti et al. [31] for Saudi Arabia saved 62,839 GWH of electricity per year.
The objective of this study is to propose several effective economic effective conservation energy conservation measures that reduce the total energy consumption of typical residential buildings under Jordanian climate conditions. Typical residential buildings located in several regions in Jordan are taken as case studies. Energy consumption saving, peak demand saving, and harmful emission reduction are determined. Energy consumption profiles for each of the proposed measures are determined using dynamic simulation software. The savings are determined for each level to determine the cost-effectiveness of each stage. Finally, the total number of the job creation potential for each stage will be determined.
2. Methodology
Three typical, existing residential building types were selected as case studies for this work. The energy used within the building was analyzed using DesignBuilder software. The simulation uses measured hourly weather data.
2.1. Simulation Models
Design Builder has been successfully used to evaluate (ECMs) for various types of buildings [32]. Design Builder is GUI software that allows more flexibility on geometry inputs and has extensive material libraries and load profiles. The inputs for the simulation model are: building model, usage pattern, and hourly weather data. The energy consumption required for the operating of various loads is calculated on an hourly basis.
Simulation models for three typical existing residential building types are built according to current construction details, materials, and systems in the considered regions. These models are; traditional family house, five-story apartment with ten housing units, and two-story villa. These models are considered as base models for further evaluations of the effectiveness of the proposed retrofit programs on total energy consumption. Table 1 lists the total number of the housing unit in 2015 [33].
2.2. The Building Characteristics
The three typical buildings specifications and characteristics are listed in Table 2 [34,35,36,37]. Table 3 lists the typical load scheduling for all building types considered. Both heating and cooling systems are utilized in the building models. Air heat pumps were used as the cooling systems in these models. On the other hand, for the heating system, electric heaters were used in the traditional house, and a boiler was used for the Villa and the apartment. The villa is a fully heated and cooled space.
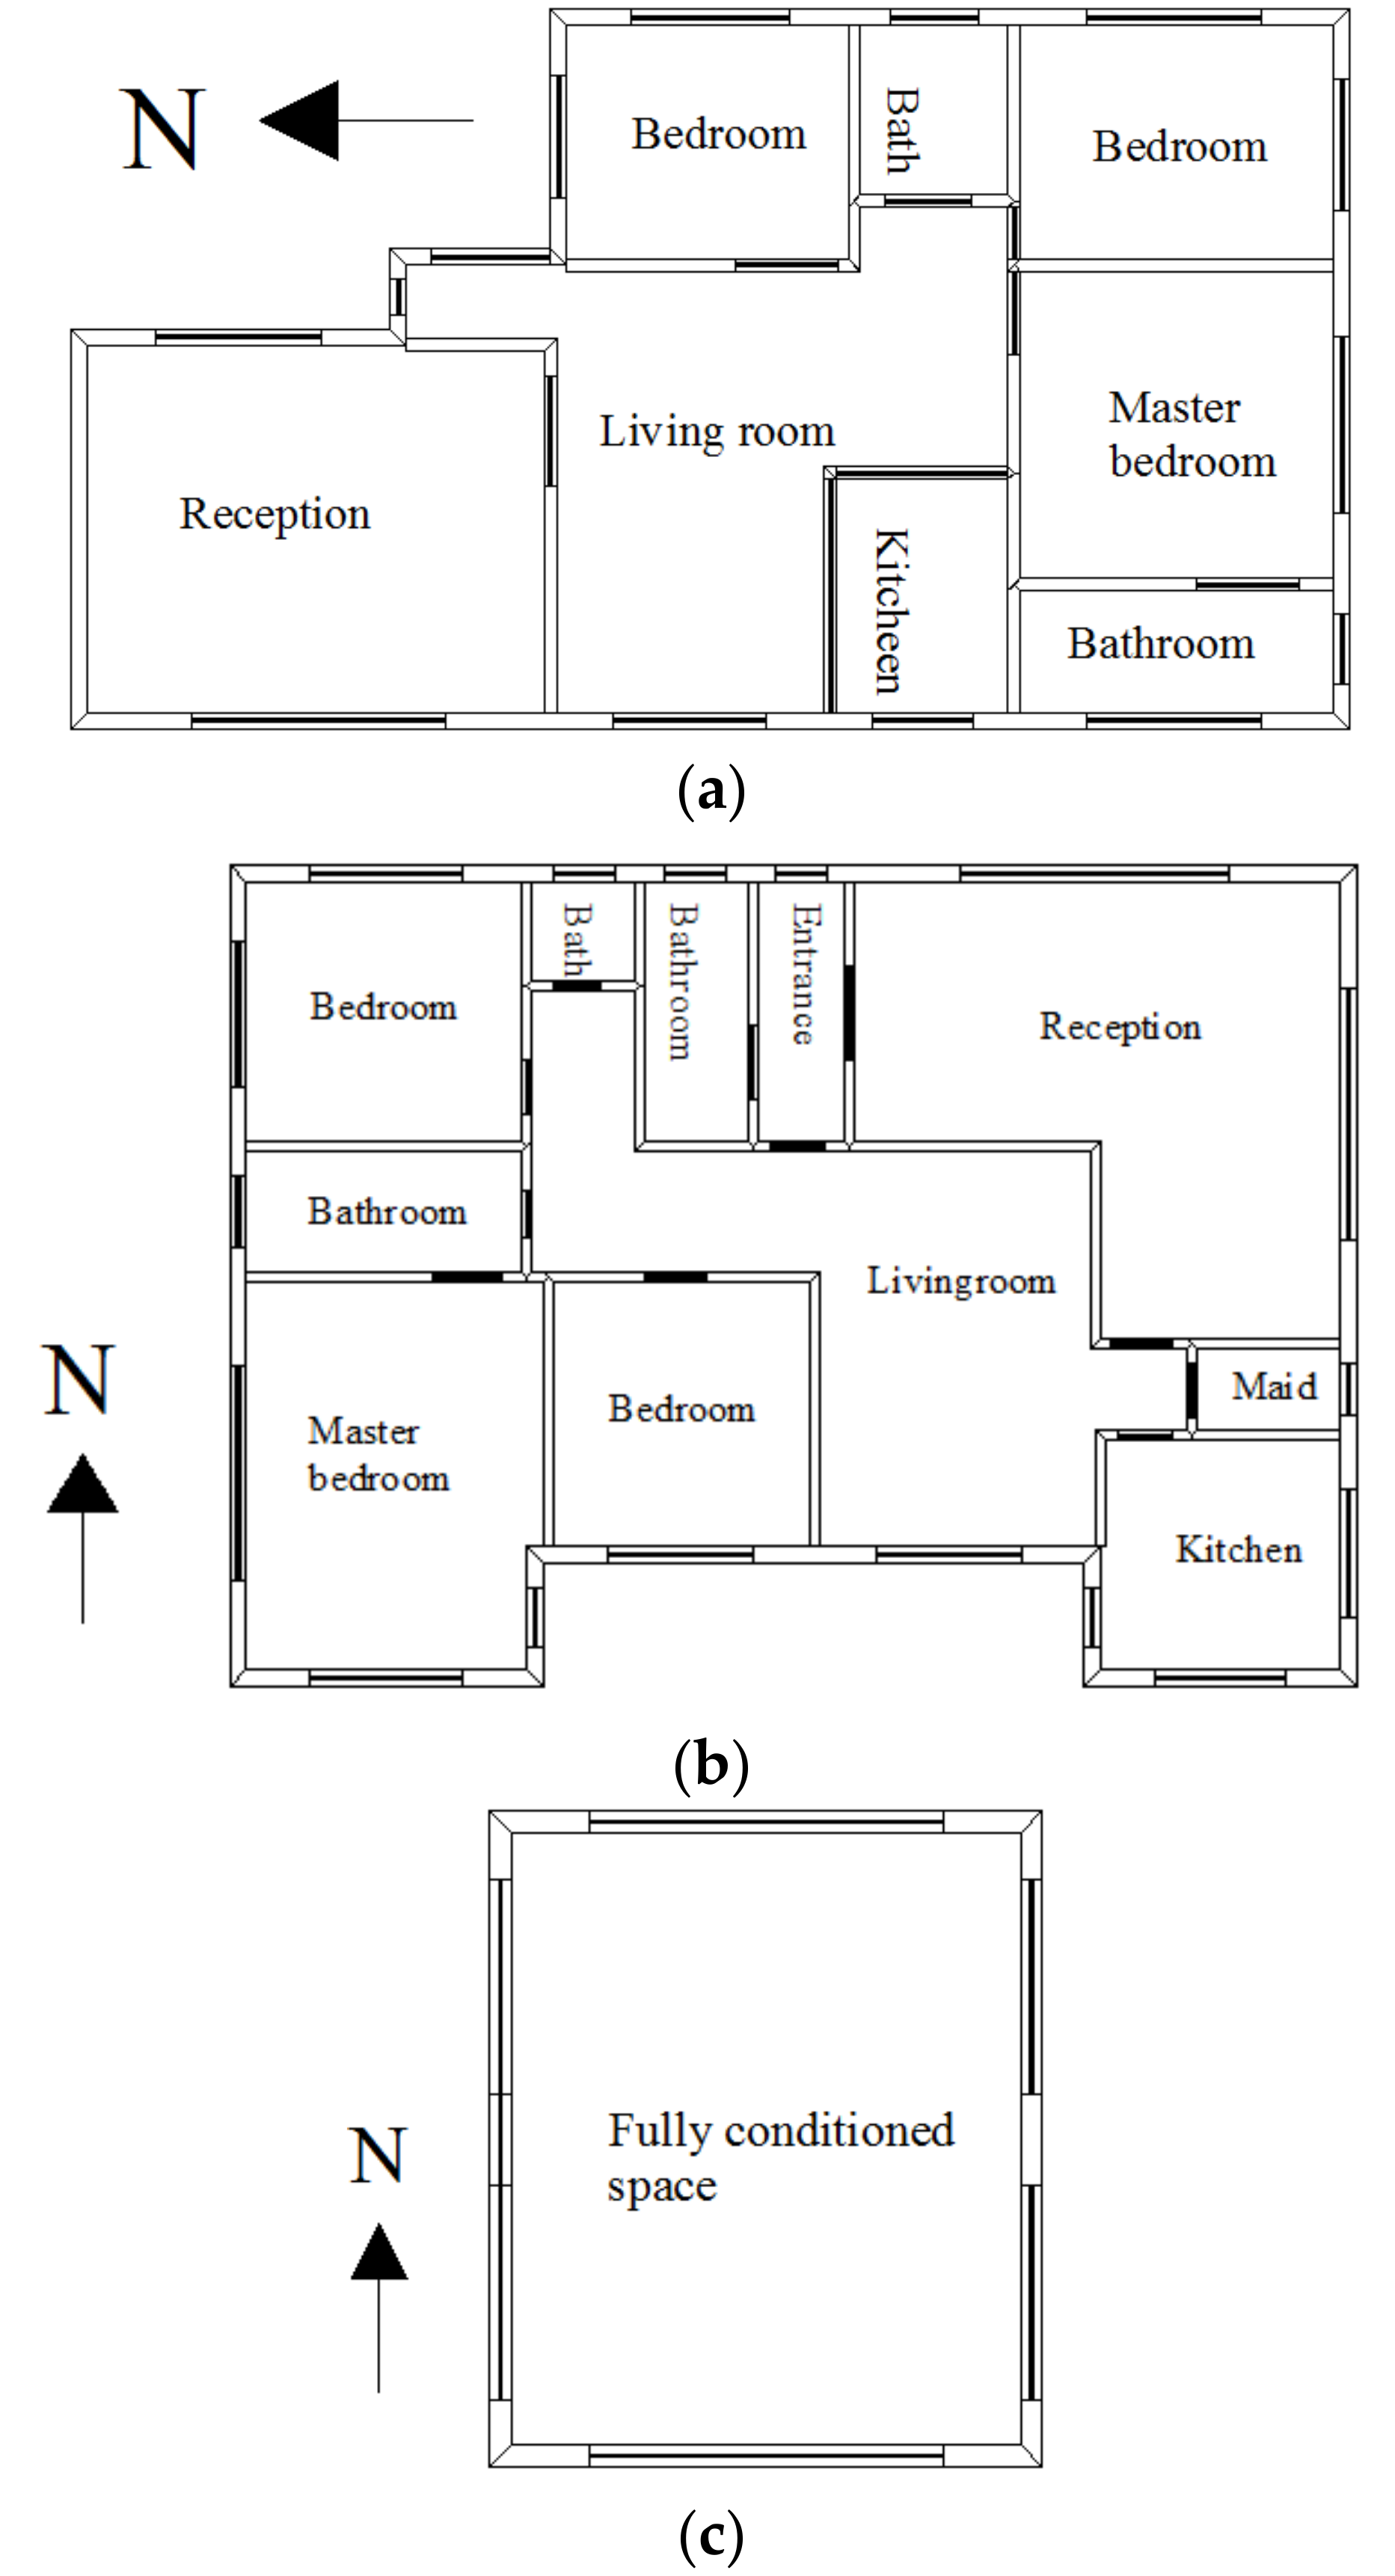
Figure 2 represents the floor plan for the three building types studied.
2.3. Energy-Efficient Retrofitting Strategies
To improve energy efficiency in the three building types studied, retrofit programs that are divided into three levels were proposed. The idea behind dividing energy efficiency measure into levels is to study the impact of each level individually. Money saved from each level will cover a reasonable portion from the cost of the measures in the next level. These levels are divided based on their cost, the higher the level the more expensive it will be. These levels are divided as follows:
Level 1 energy retrofit program: including no cost and low-cost energy efficiency measures. It involves:
- (a)
- Reducing heating set point temperature
- (b)
- Increasing cooling set point temperature
- (c)
- Weatherization of the building shell to reduce infiltration
Level 2 energy retrofit program: involving medium cost energy efficiency measures which are:
- (a)
- Replacing the current glazing type with an efficient type
- (b)
- Overhang shading installation
- (c)
- Replacing the lighting system with a more efficient system
- (d)
- Installation of roof and wall insulation
Level 3 energy retrofit program: this includes the implementation of capital-intensive measures. These measures will be as follows:
- (a)
- Use double, low emissive technology (LOE) clear glazing.
- (b)
- Replacing of old and inefficient HVAC system with an efficient system. This will be achieved by increasing the coefficient of performance (COP).
Table 4 below lists the energy measures divided into the three levels as shown previously. It is worth mentioning that level 2 includes all retrofits of level 1, and level 3 includes level 1 and 2.
2.4. Energy and Economic Analysis
As mentioned previously, Jordan residential buildings are divided in three types. Total energy consumption for the various models is:
where, i is the level number, n is number of building exists in the whole country, X is the energy consumption for single building, and m is the building type. The total energy saving ES is:
where ECB is the baseline energy consumption. Peak demand is estimated to be one-fourth of the sum of all devices found in the building. The cost of electricity is set equal to 0.074 JD/kW [38]. Moreover, the construction cost of the power plant is set equal to 790 JD/kW ([39]). The annual money saved MS through various retrofit levels is
The saving in construction cost of the power plant PS is
Total Carbon Dioxide CO2i emission for various models and levels is:
where C(m,i) is CO2 emission for the single level and model type. The present CO2 saving for the various levels is:
where, CO2B is the total CO2 emission for the base case models. The total implementation cost Yi of the proposed measures is:
where y(m,i) is the total implementation cost for the required level and model. The total job opportunities Ji created is given as [31]:
where J(m,i) is the job opportunities for the single unit. The payback period is given as:
where, I is the real discount rate, i is the interest rate which assumed to be 5%, r is the inflation rate. CI is the initial cost of the investment, BA is the annual benefit, mCI is the maintenance cost.
3. Results and Discussions
Simulation model verifications were performed. The current results are compared against several studies and found to be in good agreement with previously published data (see Table 5). The validation models are summarized in more detail in Table 5.
In Ref. [30], a simulation analysis was performed in Oman to find the baseline energy consumption using Design Builder [30]. The simulation was performed on a one story traditional house. The baseline energy consumption was 36,926 kWh and 13,849 kWh after the implementation of the energy measures. Our validation model is built with the same characteristics and annual weather data. Our results are 37,299 kWh for the baseline and 13,405 kWh after the implementation of the energy measures. It is clear that our results are in good agreement with Ref. [30]. For the optimization analysis using the sequential search method, in Ref. [41] Alaa Alaidroos and Moncef Krarti performed an optimization analysis to reach the net-zero energy building for a villa located in KSA. The baseline consumption was estimated to be 119,700 kWh [41]. Our simulation results for the same building and weather data using the BEopt software was found to be 110,000 kWh, which matches very well with Ref. [41].
In Ref. [29], a simulation analysis is performed on a two-story villa in Kuwait. The annual energy consumption is estimated to be 92,000 kWh. We simulated their building types, and observed results very close to their results. In Ref. [29], Al-Mumin et al. summarized the occupants’ behavior for Kuwaiti residential buildings [43]. The lighting system remains on when the rooms are empty and the occupants tend to set the thermostat to 22 °C instead of 24 °C. After simulating these conditions, the annual energy consumption is found to be 88,132 kWh.
The energy model developed for a villa located in Abu Dhabi has been simulated in the present study [40]. The annual energy consumption for the Villa was 140,000 kWh. The simulation performed shows an annual consumption of 133,459 kWh. The proposed retrofit measures for the same villa provide 100,000 annual energy consumption. After performing the simulation on the validation model, an annual consumption of 107,041 kWh has been achieved.
To determine the impact of the individual efficiency measures on the total energy consumption, comprehensive parametric analyses have been performed. The analyses were performed using the hourly weather data for Jordan. One analysis was performed for Irbid, which is a mild climate region located in the north part of Jordan. From the hourly weather data used in the analysis, the cooling degree days were 3011 based on 10 °C. On the other hand, the heating degree days estimated to be 1068 °C based on 18 °C. The maximum dry bulb temperature reaches 36 °C in the summer, compared with 2 °C minimum dry bulb during winter. Table 6 shows the saving achieved from each measure for a villa located in Irbid. The efficiency of the HVAC system has the most significant impact on reducing the annual energy consumption. Replacing the lighting system archives 10.9% in savings. Increasing the cooling set point temperature from 23.5 °C to 24.5 °C reduces 1.6% of the total energy consumption. The roof insulation has a more significant impact on the total energy consumption than the wall insulation. It should be mentioned that reducing the lighting density for various models increases the cooling load and vice versa.
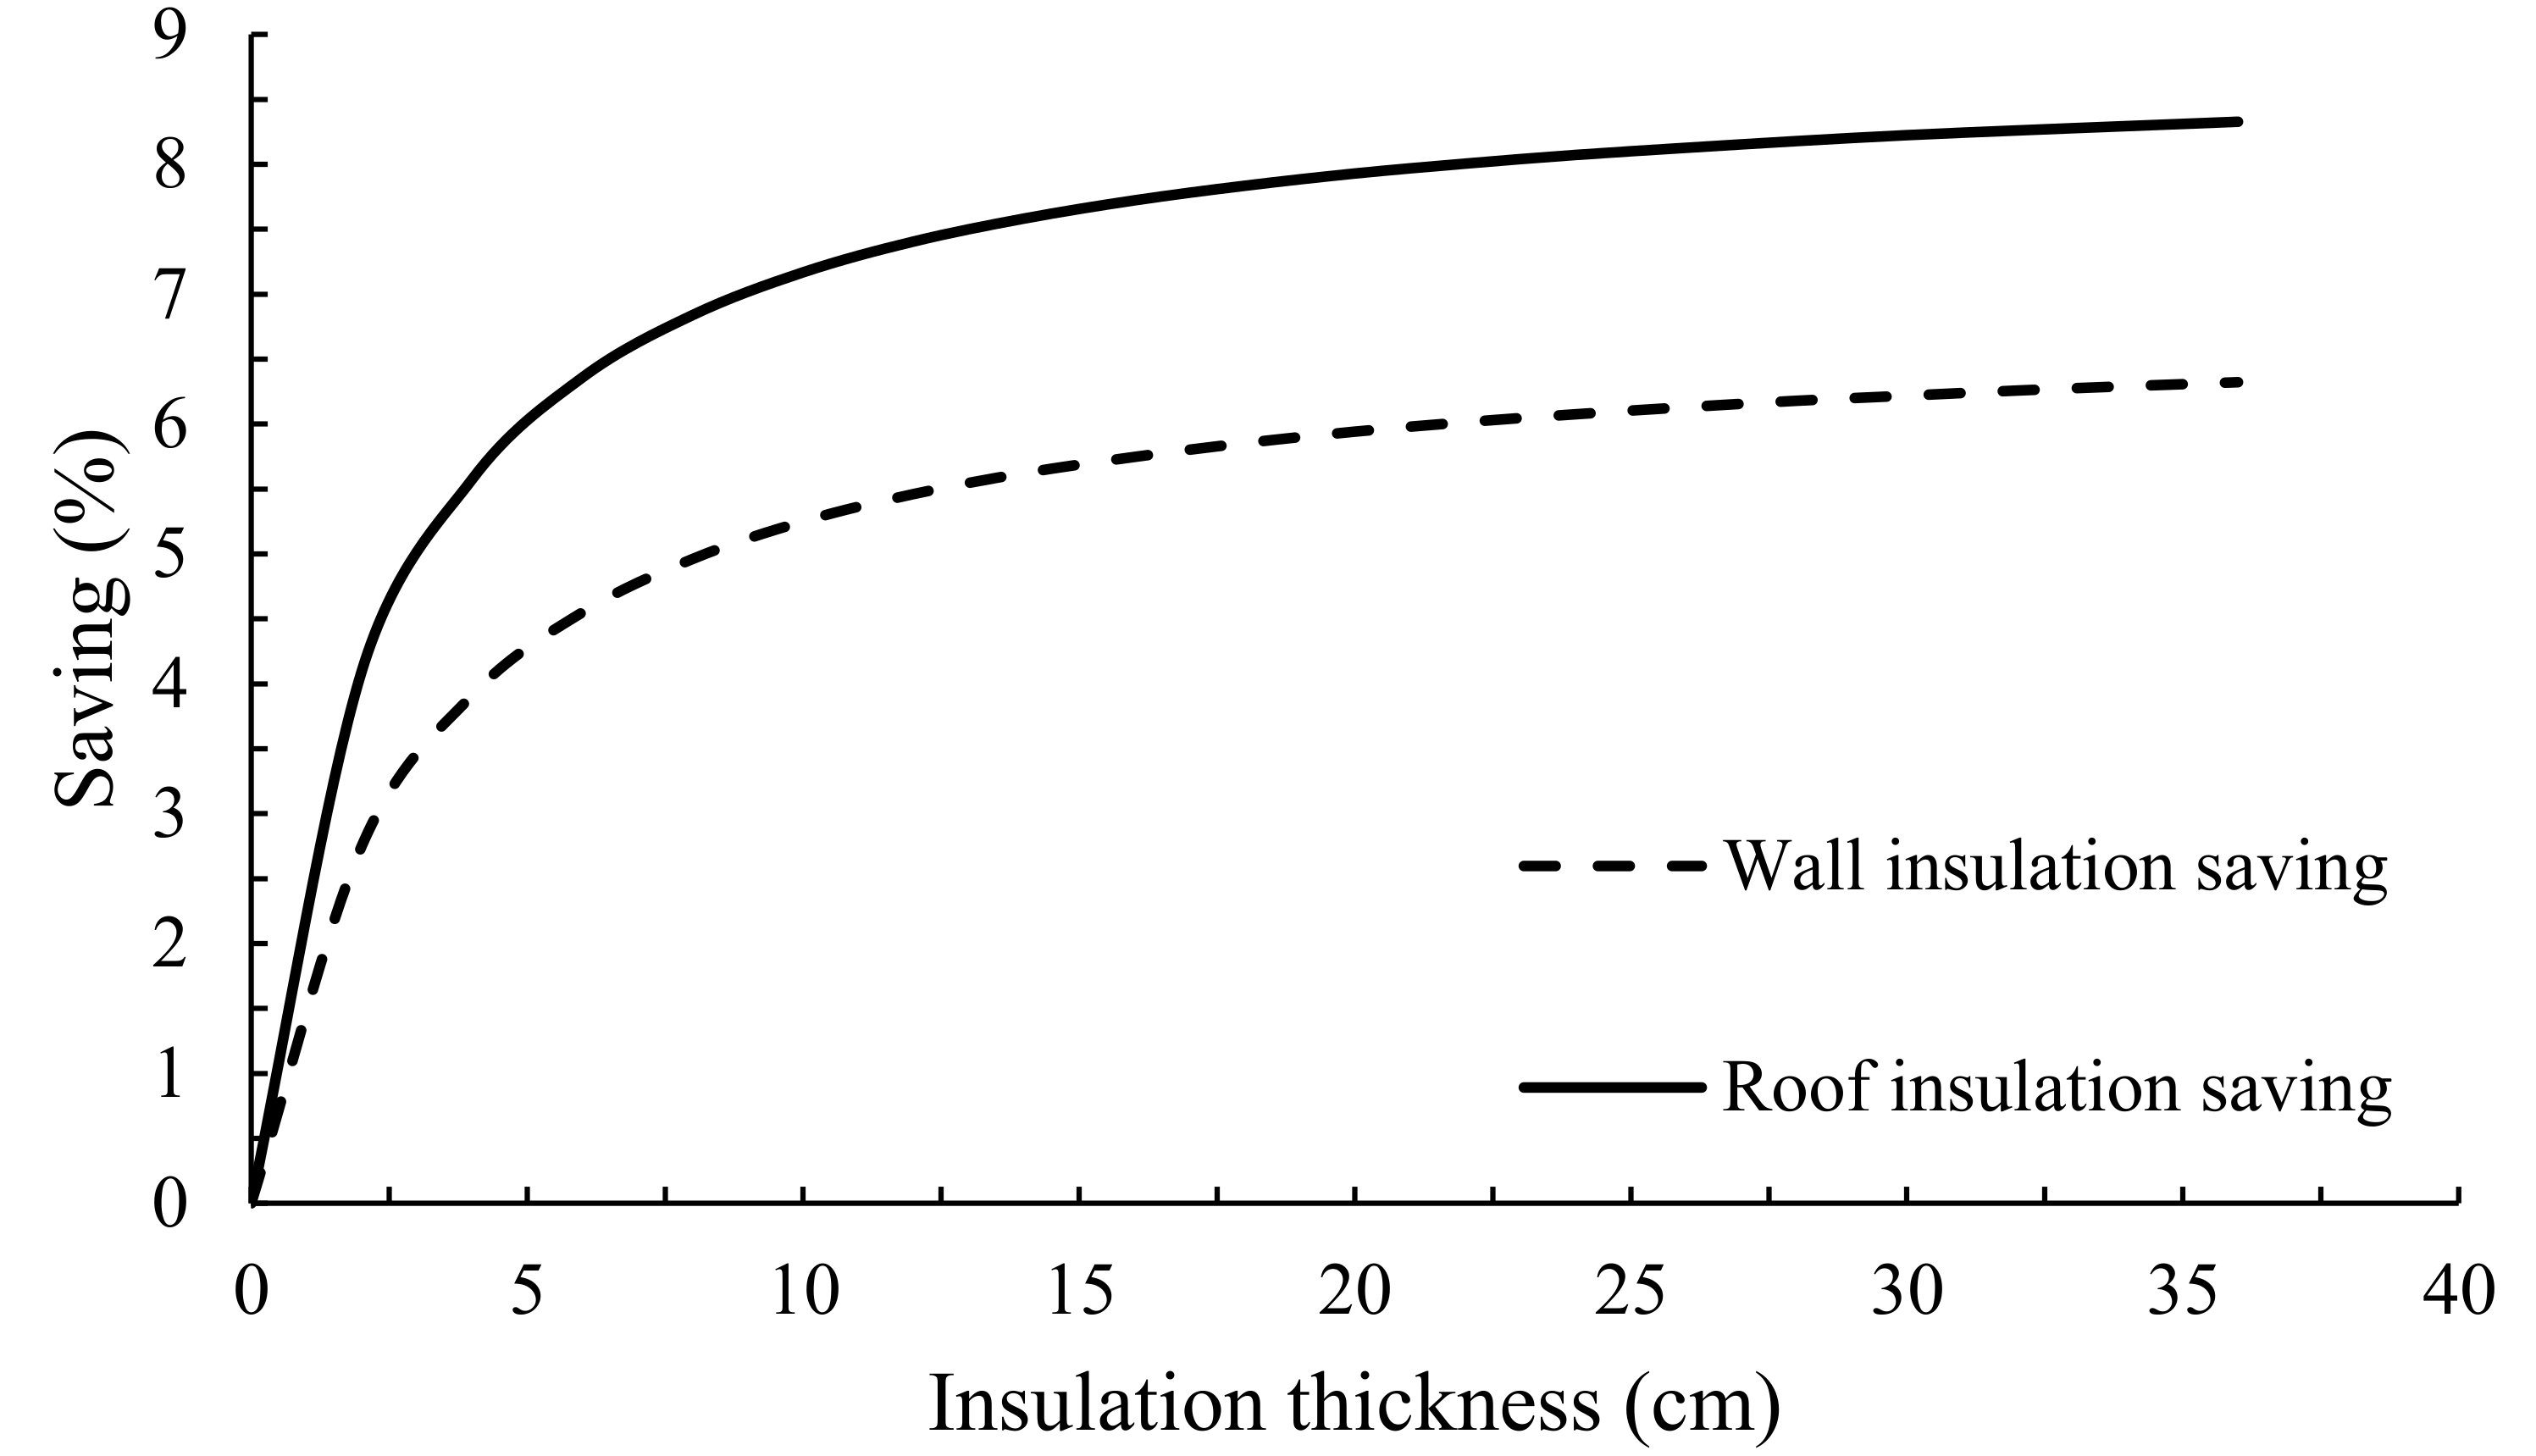
The impact of wall insulation, roof insulation, cooling, and heating set point on the annual energy consumption for the baseline villa model have been examined. Figure 3 shows the impact of the insulation thickness on the annual energy consumption for the baseline villa model.
As shown in Figure 3, most of the energy saving is achieved through the first 5 cm thickness. After that there is a diminishing return pattern observed as the wall insulation thickness increases. The figure shows the roof insulation thickness impact on the annual energy consumption for the villa baseline model. Various insulation thicknesses have been examined from 2 cm to 38 cm. The maximum saving achieved for the villa model was 8% for the roof insulation.
Several heating and cooling set point temperatures have been implemented to examine their impact on the annual energy consumption for the villa model. As shown in Figure 4, a maximum saving of 5% was achieved for a temperature of 28 °C. On the other hand, up to 6.6% saving could be achieved for a 18 °C heating set point. The baseline set point temperature is defined when the curve intersects with the X-axis. The negative saving percent means an increase in energy consumption.
3.1. Economic and Environmental Evaluation
Improving the energy efficiency of the building should reduce the annual energy consumption. As a result, harmful emissions will be reduced. Table 7 below shows the economic and environmental benefits achieved by implementing various levels of the proposed program on the building models. The saving percent is calculated relative to the level 3 annual energy consumption. To determine the savings on peak demand, a quarter of the devices are assumed to be running at peak time. It is found that 43.6% is the highest annual energy saving for level 3. When implementing level 3, a traditional house achieved almost 35% saving, while a villa achieved 47%.
3.2. Cost-Effectiveness Analysis
In this section, the cost-effectiveness of the suggested program for the existing Jordanian buildings, the implementation cost required for the various levels, and the job creation potential are estimated in this analysis. The total baseline energy consumption in the analysis is found to be 7.7 tWh. According to the annual report submitted by the Ministry of Mineral and Natural Resources [44], the total electricity consumed in the residential sector reaches 7.4 tWh, which is close to our analysis. Table 8 shows the various energy efficiency measures used in the analysis and their related cost. The measures are related to various building components, such as building design, building envelope, HVAC system, and lighting. The highlighted options represent the baseline building characteristic [1]. The last three rows in Table 8 show the cost for various levels of the retrofit program. The differences in the implementation cost are due to:
- (a)
- Building size and physical conditions for the models
- (b)
- Various efficiency measures applied at different levels that have a different cost.
The costs for different energy measures are obtained from several sources [45,46]. The payback period will be determined to account for the feasibility of the program. The results are summarized in Table 9. The economic benefits are referred to all residential buildings. Through several personal communications, we have developed confidence that Jordanian behavior can be grouped into three main levels. One case can safely represent the behavior of residents in the three types of buildings studied. To further validate our assumption, we have compared our present result with actual data and found it in good agreement. More specifically, the total baseline energy consumption in the analysis is found to be 7.7 tWh. According to the annual report submitted by the ministry of mineral and natural resources [2], the total electricity consumed in the residential sector reaches 7.4 tWh, which is close to our analysis.
The results, summarized in Table 9, indicate that levels one and two of the retrofit program are highly cost-effective when implemented on buildings. Payback periods for level three are found to be long for the traditional house due to the high estimated costs of the energy efficiency measures. Such a high payback period is due to capital investment with low money saved in the traditional house. Low money saved is due to low energy consumption in the model compared to the other models (3-story apartment and 2 story villa). Level one has no payback period as the implementation cost of level 1 would be covered from the peak demand money savings. The significant amount of money saved from this level is recommended to be used as a starting point for funding the next level.
3.3. Social Benefit
The economic and environmental benefits have been summarized. The other impact of the retrofit programs is the potential of creating new jobs in Jordan. It is well known that Jordan is a youthful society with thousands of graduated students every year. Most of them are suffering from unemployment due to a lack of job opportunities. According to the latest figures from the Department of Statistics (DoS), unemployment reached 18.2% during the first quarter of 2017, rising by 3.6% compared with the same period last year [47]. The unemployment in Jordan increases as a result of:
- (a)
- Limited resources and investment projects
- (b)
- The migration of enormous populations due to the Syrian crises
This retrofit program will create thousands of job opportunities. A recent study conducted in Jordan reported that employing energy conservation measures create new jobs for engineers and technicians [48]. It will have a positive impact on the youth unemployment rate in Jordan.
An analysis of the employment impact of investing in the energy efficient renovation of buildings has received special attention [48,49,50]. These studies have concluded that such investments have a significant impact on a variety of socio-economic processes. Estimations of the energy efficiency investments on employment have been conducted by many researchers [48,49,50]. Ürge-Vorsatz et al. reported that on average, 17 jobs will be created per €1 million of investment in energy efficient buildings [49]. Meijer et al. found that 11–19 jobs per €1 million invested will be created [50]. An average of 19 jobs per €1 million of investments can be created according to a study conducted by Janssen and Staniaszek [50].
Polline et al. performed a study to determine the number of direct and indirect full time jobs that will be created [51]. The job creation model was used by several references; for example, [29,30]. Krarti and Dubey outlined that energy retrofit program investment can create 11.9 jobs with 7 direct and 4.9 indirect per every 1 million dollar investment [30]. Direct jobs related to the auditing and the installation of the measures, and indirect jobs related to the production of these measures. Results from different studies are not mutually comparable due to their different coverage and applied methodology. Based on that, Table 10 indicates the number of jobs that could be created for the various level of the program.
When the retrofit program is implemented on Jordanian residential buildings, there will be 80,769 jobs per year once level 3 of the program begins to be performed.
4. Conclusions
Detailed simulation analyses have been performed to investigate the impact of various ECMs on residential buildings in Jordan. ECMs selected for analysis are aimed to improve the performance of the HVAC and lighting systems. The proposed measures reduced annual electricity consumption. Furthermore, the peak demand and amount of carbon emission were also reduced. Level one of the retrofit program, which almost has no cost, resulted in a total of 1955 GWH annual electricity saving, 489 MW peak demand saving, and a 1321 kilo-ton/year CO2 reduction. The retrofit program would create a significant number of job opportunities. It has been concluded that the payback period is acceptable for different levels of the retrofit program, except for the traditional house, which has less savings when compared with the other models. Level 3 has the highest impact with the highest annual energy saving and peak demand reduction. The retrofit program will create a significant number of jobs; a total of 80,769 jobs/year. Shading has shown high feasibility with its low cost and high annual saving. Overhangs achieve 11% saving for the villa model. The usage of a lighting control will reduce heat gain and thus cooling load. A 11% cooling load saving could be achieved as a result of using lighting control. Future work should include applying the sequential search methodology to optimally select the most cost-effective design options that achieve the minimum life cycle cos. The main results of this study indicated that when combing the best strategy, the annual energy consumption for the building could be reduced significantly.
Author Contributions
Formal analysis, A.A.; Supervision, K.B.
Funding
This research received no external funding.
Conflicts of Interest
The authors declare no conflict of interest.
Nomenclature
| ACH | Air Change per Hour |
| AES | Amman East Power Plant |
| CO2 | Carbon Dioxide |
| COP | Coefficient of Performance |
| ECMs | Energy Conservation Measures |
| GDP | Gross Domestic Products |
| VAC | Heating, Ventilation and air Conditioning |
| LED | Light-emitting Diode |
| LOE | Low Emissive Technology |
| NEPCO | National Electric Power Company |
| Toe | ton of oil Equivalent |
| UAE | the United Arab Emirates |
| WWR | Window to Wall Ratio |
References
- Cuce, E.; Cuce, P.M. Vacuum glazing for highly insulating windows: Recent developments and future prospects. Renew. Sustain. Energy Rev. 2016, 54, 1345–1347. [Google Scholar] [CrossRef]
- Choi, A.S.; Song, K.D.; Kim, Y.S. The characteristics of photosensors and electronic dimming ballasts in daylight responsive dimming systems. Build. Environ. 2005, 40, 39–50. [Google Scholar] [CrossRef]
- Hee, W.J.; Alghoul, M.A.; Bakhtyar, B.; Elayeb, O.; Shameri, M.A.; Alrubaih, M.S.; Sopian, K. The role of window glazing on daylighting and energy saving in buildings. Renew. Sustain. Energy Rev. 2015, 42, 323–343. [Google Scholar] [CrossRef]
- Al-Ghandoor, A. Evaluation of energy use in Jordan using energy and exergy analyses. Energy Build. 2013, 59, 1–10. [Google Scholar] [CrossRef]
- Jaber, J.O.; Elkarmi, F.; Alasis, E.; Kostas, A. Employment of renewable energy in Jordan: Current status, SWOT and problem analysis. Renew. Sustain. Energy Rev. 2015, 49, 490–499. [Google Scholar] [CrossRef]
- Annual Report—Ministry of Energy and Mineral Resources, Jordan, 2016. Available online: http://www.memr.gov.jo/echobusv3.0/SystemAssets/333853a2-7d89-4021-80f3-449f89707679.pdf (accessed on 12 December 2017).
- Friess, W.A.; Rakhshan, K. A review of passive envelope measures for improved building energy efficiency in the UAE. Renew. Sustain. Energy Rev. 2017, 72, 485–496. [Google Scholar] [CrossRef]
- Ruparathna, R.; Hewage, K.; Sadiq, R. Improving the energy efficiency of the existing building stock: A critical review of commercial and institutional buildings. Renew. Sustain. Energy Rev. 2016, 53, 1032–1045. [Google Scholar] [CrossRef]
- Inayati, I.; Soelami, F.X.N.; Triyogo, R. Identification of Existing Office Buildings Potential to Become Green Buildings in Energy Efficiency Aspect. Procedia Eng. 2017, 170, 320–324. [Google Scholar]
- Mardookhy, M.; Sawhney, R.; Ji, S.; Zhu, X.; Zhou, W. A study of energy efficiency in residential buildings in Knoxville, Tennessee. J. Clean. Prod. 2014, 85, 241–249. [Google Scholar] [CrossRef]
- Hassouneh, K.; Al-Salaymeh, A.; Qoussous, J. Energy audit, an approach to apply the concept of green building for a building in Jordan. Sustain. Cities Soc. 2015, 14, 456–462. [Google Scholar] [CrossRef]
- Nikolaidis, Y.; Pilavachi, P.A.; Chletsis, A. Economic evaluation of energy saving measures in a common type of Greek building. Appl. Energy 2009, 86, 2550–2559. [Google Scholar] [CrossRef] [Green Version]
- El-Darwish, I.; Gomaa, M. Retrofitting strategy for building envelopes to achieve energy efficiency. Alexandria Eng. J. 2017, 56, 579–589. [Google Scholar] [CrossRef]
- Huang, J.; Lv, H.; Gao, T.; Feng, W.; Chen, Y.; Zhou, T. Thermal properties optimization of envelope in energy-saving renovation of existing public buildings. Energy Build. 2014, 75, 504–510. [Google Scholar] [CrossRef]
- Ozel, M. Effect of wall orientation on the optimum insulation thickness by using a dynamic method. Appl. Energy 2011, 88, 2429–2435. [Google Scholar] [CrossRef]
- Cabeza, L.F.; Castell, A.; Medrano, M.; Martorell, I.; Pérez, G.; Fernández, I. Experimental study on the performance of insulation materials in Mediterranean construction. Energy Build. 2010, 42, 630–636. [Google Scholar] [CrossRef]
- Kolaitis, D.I.; Malliotakis, E.; Kontogeorgos, D.A.; Mandilaras, I.; Katsourinis, D.I.; Founti, M.A. Comparative assessment of internal and external thermal insulation systems for energy efficient retrofitting of residential buildings. Energy Build. 2013, 64, 123–131. [Google Scholar] [CrossRef]
- Zinzi, M.; Ruggeri, P.; Peron, F.; Carnielo, E.; Righi, A. Experimental Characterization and Energy Performances of Multiple Glazing Units with Integrated Shading Devices. Energy Procedia 2017, 113, 1–8. [Google Scholar] [CrossRef]
- Radwan, A.F.; Hanafy, A.A.; Elhelw, M.; El-Sayed, A.E.H.A. Retrofitting of existing buildings to achieve better energy-efficiency in commercial building case study: Hospital in Egypt. Alexandria Eng. J. 2016, 55, 3061–3071. [Google Scholar] [CrossRef]
- Manz, H.; Menti, U.P. Energy performance of glazings in European climates. Renew. Energy 2012, 37, 226–232. [Google Scholar] [CrossRef]
- Lau, A.K.K.; Salleh, E.; Lim, C.H.; Sulaiman, M.Y. Potential of shading devices and glazing configurations on cooling energy savings for high-rise office buildings in hot-humid climates: The case of Malaysia. Int. J. Sustain. Built Environ. 2016, 5, 387–399. [Google Scholar] [CrossRef] [Green Version]
- Ye, Y.; Xu, P.; Mao, J.; Ji, Y. Experimental study on the effectiveness of internal shading devices. Energy Build. 2016, 111, 154–163. [Google Scholar] [CrossRef]
- Ebrahimpour, A.; Maerefat, M. Application of advanced glazing and overhangs in residential buildings. Energy Convers. Manag. 2011, 52, 212–219. [Google Scholar] [CrossRef]
- Al-Tamimi, N.A.; Fadzil, S.F.S. The potential of shading devices for temperature reduction in high-rise residential buildings in the tropics. Procedia Eng. 2011, 21, 273–282. [Google Scholar] [CrossRef]
- Goussous, J.; Siam, H.; Alzoubi, H. Prospects of green roof technology for energy and thermal benefits in buildings: Case of Jordan. Sustain. Cities Soc. 2015, 14, 425–440. [Google Scholar] [CrossRef]
- Zeng, C.; Bai, X.; Sun, L.; Zhang, Y.; Yuan, Y. Optimal parameters of green roofs in representative cities of four climate zones in China: A simulation study. Energy Build. 2017, 150, 118–131. [Google Scholar] [CrossRef]
- Yu, J.; Tian, L.; Yang, C.; Xu, X.; Wang, J. Optimum insulation thickness of residential roof with respect to solar-air degree-hours in hot summer and cold winter zone of china. Energy Build. 2011, 43, 2304–2313. [Google Scholar] [CrossRef]
- Ucar, A. Thermoeconomic analysis method for optimization of insulation thickness for the four different climatic regions of Turkey. Energy 2010, 35, 1854–1864. [Google Scholar] [CrossRef]
- Krarti, M. Evaluation of large scale building energy efficiency retrofit program in Kuwait. Renew. Sustain. Energy Rev. 2015, 50, 1069–1080. [Google Scholar] [CrossRef]
- Krarti, M.; Dubey, K. Energy productivity evaluation of large scale building energy efficiency programs for Oman. Sustain. Cities Soc. 2017, 29, 12–22. [Google Scholar] [CrossRef]
- Krarti, M.; Dubey, K.; Howarth, N. Evaluation of building energy efficiency investment options for the Kingdom of Saudi Arabia. Energy 2017, 134, 595–610. [Google Scholar] [CrossRef]
- DesignBuilder Documentation, DesignBuilder User Manual. Version 2.1; DesignBuilder Software Limited: Gloucestershire, UK, 2009.
- Department of Statitistic DOS, Amman, Jordan, Annual Report 2015. Available online: http://dosweb.dos.gov.jo/annual-report (accessed on 15 November 2017).
- El Hanandeh, A. Environmental assessment of popular single-family house construction alternatives in Jordan. Build. Environ. 2015, 92, 192–199. [Google Scholar] [CrossRef]
- Al-Salaymeh, A.; Al-Hamamre, Z.; Sharaf, F.; Abdelkader, M.R. Technical and economical assessment of the utilization of photovoltaic systems in residential buildings: The case of Jordan. Energy Convers. Manag. 2010, 51, 1719–1726. [Google Scholar] [CrossRef]
- Badran, A.A.; Jaradat, A.W.; Bahbouh, M.N. Comparative study of continuous versus intermittent heating for local residential building: Case studies in Jordan. Energy Convers. Manag. 2013, 65, 709–714. [Google Scholar] [CrossRef]
- Friess, W.A.; Rakhshan, K.; Hendawi, T.A.; Tajerzadeh, S. Wall insulation measures for residential villas in Dubai: A case study in energy efficiency. Energy Build. 2012, 44, 26–32. [Google Scholar] [CrossRef]
- National Electric Power Company NEPCO, Annual Report for Year: 2016, Amman, Jordan. Available online: http://www.nepco.com.jo/store/docs/web/2016_en.pdf (accessed on 15 November 2017).
- The Parent Company and Its Subsidiaries and Affiliates AES Annual Report, 2017. Available online: https://s2.q4cdn.com/825052743/files/doc_financials/annual/2017/81970_FINAL_JL_rev2.pdf (accessed on 20 December 2017).
- Assaf, S.; Nour, M. Potential of energy and water efficiency improvement in Abu Dhabi’s building sector—Analysis of Estidama pearl rating system. Renew. Energy 2015, 82, 100–107. [Google Scholar] [CrossRef]
- Alaidroos, A.; Krarti, M. Optimal design of residential building envelope systems in the Kingdom of Saudi Arabia. Energy Build. 2015, 86, 104–111. [Google Scholar] [CrossRef]
- Krarti, M.; Ali, F.; Alaidroos, A.; Houchati, M. Macro-Economic Benefit Analysis of Large Scale Building Energy Efficiency Programs in Qatar. Int. J. Sustain. Built Environ. 2017. [Google Scholar] [CrossRef]
- Al-Mumin, A.; Khattab, O.; Sridhar, G. Occupants’ behavior and activity patterns influencing the energy consumption in the Kuwaiti residences. Energy Build. 2003, 35, 549–559. [Google Scholar] [CrossRef]
- Memr.gov.jo. Ministry of Energy and Mineral Resources. Available online: http://www.memr.gov.jo (accessed on 26 August 2017).
- Krarti, M.; Ihm, P. Evaluation of net-zero energy residential buildings in the MENA region. Sustain. Cities Soc. 2016, 22, 116–125. [Google Scholar] [CrossRef]
- Ameer, B.; Krarti, M. Impact of subsidization on high energy performance designs for Kuwaiti residential buildings. Energy Build. 2016, 116, 249–262. [Google Scholar] [CrossRef]
- Department of Statitistic, Amman, Jordan, 2016. Available online: http://dosweb.dos.gov.jo/unemp_201806/ (accessed on 15 November 2017).
- Ürge-Vorsatz, D.; Arena, D.; Herrero, S.T.; Burcher, A. Employment Impact of a Large-Scale Deep Building Energy Retrofit Programme in Hungary; Center for Climate Change and Sustainable Energy Policy: Budapest, Hungary, 2010. [Google Scholar]
- Meijer, F.; Visscher, H.; Nieboer, N.; Kroese, R. Jobs Creation through Energy Renovation of the Housing Stock. Working paper No. D14.2. 2012. Available online: http://www.iza.org/conference_files/ neujobs_2014/4.pdf (accessed on 20 November 2017).
- Janssen, R.; Staniaszek, D. How Many Jobs? A Survey of the Employment Effects of Investment in Energy Efficiency of Buildings; The Energy Efficiency Industrial Forum (Hrsg.): Washington, DC, USA, 2012. [Google Scholar]
- Polline, R.; Heintz, J.; Garrett-Peltier, H. The Economic Benefits of Investing in Clean Energy; Center for American Progress: Washington, DC, USA; Political Economy Research Institute: Amherst, MA, USA, 2009. [Google Scholar]
Figure 1.
Electrical energy distribution 2016 [6].
Figure 1.
Electrical energy distribution 2016 [6].

Figure 2.
Floor plan. (a) Typical family home floor plan; (b) Typical apartment floor plan; (c) Villa floor plan.
Figure 2.
Floor plan. (a) Typical family home floor plan; (b) Typical apartment floor plan; (c) Villa floor plan.

Figure 3.
Insulation thickness effect (villa model).

Figure 4.
Cooling and heating set point effect (Villa).


Table 1.
Jordanian housing statistics [33].
Table 1.
Jordanian housing statistics [33].
| Housing Type | Traditional Family House | Apartment | Two Story Villa |
|---|---|---|---|
| Number of houses | 489,364 | 48,081 | 17,094 |
| Floor area percentage | 43.2% | 54.3% | 2.52% |
| Building Model | Traditional House | Apartment | Villa |
|---|---|---|---|
| Number of floors | 1 | 5 | 2 |
| Total floor area | 144 m2 | 368 m2 | 240 m2 |
| Wall (U value) | 2.51 | 1.85 | 1.54 |
| Roof (U value) | 2.36 | 2.36 | 2.36 |
| Glazing | Single clear | Single clear | Double clear |
| WWR | 30% | 30% | 30% |
| Infiltration | 1 ACH | 0.6 ACH | 0.5 ACH |
| Heating set point | 21 °C | 21 °C | 21 °C |
| Cooling set point | 23.5 °C | 23.5 °C | 23.5 °C |
| COP for cooling | 2 | 2 | 2 |
| COP for heating | 1 | 0.8 | 0.8 |
Table 3.
Scheduling for three building types.
| Reception | Living Room | Bedroom | Master Bedroom | Kitchen | Bathroom | |||
|---|---|---|---|---|---|---|---|---|
| Traditional House | Cooling system | No | Yes | No | yes | No | No | |
| Heating system | Yes | Yes | Yes | yes | Yes | No | ||
| Cooling schedule | No | 7:00–22:00 | No | 18:00–6:00 | No | No | ||
| Heating schedule | 16:00–21:00 | 7:00–22:00 | 18:00–22:00 | 18:00–6:00 | 7:00–12:00 | No | ||
| Lighting schedule | 18:00–23:00 | 18:00-23:00 | 18:00–23:00 | 18:00–23:00 | 7:00–19:00 | 7:00–23:00 | ||
| Reception | Living Room | Bedroom | Master Bedroom | Kitchen | Bathroom | Maid Room | ||
| Apartment | Cooling system | Yes | Yes | No | Yes | No | No | No |
| Heating system | Yes | Yes | Yes | Yes | Yes | No | Yes | |
| Cooling schedule | 7:00–22:00 | 7:00–22:00 | No | 18:00–9:00 | No | No | No | |
| Heating schedule | 7:00–22:00 | 7:00–22:00 | 18:00–9:00 | 18:00–9:00 | 7:00–22:00 | No | 7:00–22:00 | |
| Lighting schedule | 18:00–23:00 | 18:00-2:00 | 19:00–23:00 | 19:00–23:00 | 7:00–19:00 | 7:00–22:00 | 19:00–23:00 | |
| First Floor | Second Floor | |||||||
| Villa | Cooling system | Yes | Yes | |||||
| Heating system | Yes | Yes | ||||||
| Cooling schedule | 8:00–23:00 | 22:00–8:00 | ||||||
| Heating schedule | 8:00–23:00 | 22:00–8:00 | ||||||
| Lighting schedule | 8:00–23:00 | 7:00–23:00 |
Table 4.
Proposed efficiency measures.
| EEM | Traditional House | Apartment | Villa | |
|---|---|---|---|---|
| Level 1 | Cooling set point temperature | 24.5 °C | 24.5 °C | 24.5 °C |
| Heating set point temperature | 20 °C | 20 °C | 20 °C | |
| Lighting | 60% reduction | 60% reduction | 60% reduction | |
| Level 2 (level 1 retrofit program is included) | Roof insulation | 6 cm polystyrene layer | 6 cm polystyrene layer | 6 cm polystyrene layer |
| Shading | Overhang 1.5 m | Overhang 1.5 m | Overhang 1.5 m | |
| Wall insulation | 4 cm polystyrene layer | 4 cm polystyrene layer | 4 cm polystyrene layer | |
| Level 3 (level 1 and level 2 are included) | Glazing | Double, LOE, clear, 13 mm air | Double, LOE, clear, 13 mm air | Triple, LOE, clear, 13 mm air |
| Heating COP | 0.95 | 0.95 | ||
| Cooling COP | 3.5 | 3.5 | 3.5 |
Table 5.
Model validation.
| Reference/Year | Method | Type of Building | Total Energy Consumption (kWh) | Current Study | Error % |
|---|---|---|---|---|---|
| [30]/2017 | Design builder simulation optimization | one-story house | 36,926 | 37,299 | 1.0 |
| [29]/2015 | two-story villa | 92,000 | 88,132 | 4.2 | |
| [40]/2015 | two-story villa | 140,000 | 133,459 | 4.7 | |
| [30]/2017 | one-story house | 13,849 | 13,405 | 3.2 | |
| [40]/2015 | two-story villa | 100,000 | 107,041 | 7.0 | |
| [41]/2015 | two-story villa | 120,000 | 129,000 | 7.5 | |
| [42]/2017 | two-story villa | 92,159 | 91,905 | 0.3 |
Table 6.
Total energy saving for the individual measures.
| Saving | Traditional House (%) | Villa (%) |
|---|---|---|
| Wall insulation | 6.2 | 3.8 |
| Roof insulation | 11 | 6.3 |
| Glazing | 2.9 | 6 |
| Shading | −0.4 | 3.7 |
| HVAC COP | 5 | 18.7 |
| Lighting | 12.7 | 10.9 |
| Cooling set point temperature | 3.4 | 1.6 |
| Heating set point temperature | 8.4 | 3.5 |
Table 7.
Economic and environmental benefits for the suggested energy retrofit program.
| Building Type | Base Level Energy Consumption (GWH) | Level 1 | Level 2 | Level 3 | Saving (%) |
|---|---|---|---|---|---|
| Retrofit Program Annual Energy Saving (GWH/year) | |||||
| Traditional family house | 3353 | 764 | 1117 | 1169 | 34.8 |
| apartment | 3795 | 1099 | 1600 | 1932 | 50.9 |
| Villa | 562 | 92 | 183 | 266 | 47 |
| Total | 7710 | 1955 | 2901 | 3368 | 43.6 |
| Peak demand saving (MW) | |||||
| Traditional family house | 838 | 191 | 279 | 292 | 34.8 |
| apartment | 949 | 274 | 400 | 483 | 50.9 |
| Villa | 140 | 23 | 46 | 66 | 47 |
| Total | 1927 | 489 | 725 | 842 | 43.6 |
| Annual CO2 savings (Kilo-tons/year) | |||||
| Traditional family house | 2152 | 523 | 766 | 801 | 37 |
| apartment | 2300 | 738 | 1050 | 1226 | 53 |
| Villa | 334 | 59 | 115 | 162 | 48 |
| Total | 4787 | 1321 | 1931 | 2190 | 46 |
Table 8.
Various energy efficiency measures and their related cost [45].
Table 8.
Various energy efficiency measures and their related cost [45].
| Energy Efficiency Measures (EEM) | Options | Cost [45] | |
|---|---|---|---|
| Roof insulation | 6 cm polystyrene layer | 16 $/m2 | |
| Glazing | Low E double metal air | 102 $/m2 | |
| Triple metal clear air | 130 $/m2 | ||
| Wall insulation | 4 cm Polystyrene | 8.56 $/m2 | |
| Air heat pump | 3.5 COP | 343 $/kW | |
| Lighting | 60% reduction | 4 $/m2 | |
| overhang | 18 $/m2 | ||
| Boiler | 0.95 COP | 2000 $/unit | |
| Total cost | |||
| Level 1 | Level 2 | Level 3 | |
| Traditional house | 230 | 3486 | 4986 |
| Three store apartments | 3237 | 10,771 | 41,332 |
| Two store villa | 750 | 4896 | 22,926 |
Table 9.
Cost effectiveness analysis for the suggested levels in Jordan.
| Retrofit Program | Level 1 | Level 2 | Level 3 |
|---|---|---|---|
| Implementation program cost (million JD) | |||
| * Traditional family house | 112 | 1706 | 2440 |
| * 5 store apartment | 155 | 518 | 1987 |
| * 2 store villa | 13 | 83 | 392 |
| Total residential building | 27 | 1950 | 11,881 |
| Annual Fuel Costs saving (million JD/year) | |||
| * Traditional family house | 56 | 83 | 86 |
| * 5 store apartment | 81 | 118 | 143 |
| * 2 store villa | 7 | 13 | 19 |
| Total residential building | 144 | 214 | 249 |
| Power plants cost saving (million JD) | |||
| * Traditional family house | 151 | 221 | 231 |
| * 5 store apartment | 217 | 316 | 381 |
| * 2 store villa | 18 | 36 | 53 |
| Total residential building | 386 | 573 | 665 |
| Payback period (year) | |||
| * Traditional family house | 0 | 13.9 | 18.58 |
| * 5 store apartment | 0 | 4 | 9.4 |
| * 2 store villa | 0 | 3.3 | 13.9 |
Table 10.
Number of job creation.
| Job Opportunities | |||
|---|---|---|---|
| Level 1 | Level 2 | Level 3 | |
| Traditional house | 1877 | 28,593 | 40,896 |
| Apartment | 2598 | 8682 | 33,303 |
| Villa | 218 | 1391 | 6570 |
| Total | 4693 | 38,667 | 80,769 |
© 2018 by the authors. Licensee MDPI, Basel, Switzerland. This article is an open access article distributed under the terms and conditions of the Creative Commons Attribution (CC BY) license (http://creativecommons.org/licenses/by/4.0/).
Share and Cite
MDPI and ACS Style
Bataineh, K.; Alrabee, A. Improving the Energy Efficiency of the Residential Buildings in Jordan. Buildings 2018, 8, 85. https://doi.org/10.3390/buildings8070085
AMA Style
Bataineh K, Alrabee A. Improving the Energy Efficiency of the Residential Buildings in Jordan. Buildings. 2018; 8(7):85. https://doi.org/10.3390/buildings8070085
Chicago/Turabian StyleBataineh, Khaled, and Ayham Alrabee. 2018. "Improving the Energy Efficiency of the Residential Buildings in Jordan" Buildings 8, no. 7: 85. https://doi.org/10.3390/buildings8070085
Note that from the first issue of 2016, this journal uses article numbers instead of page numbers. See further details here.