Indoor Environmental Quality of Urban Residential Buildings in Cuenca—Ecuador: Comfort Standard


Faculty of Architecture and Urbanism, University of Cuenca, Cuenca 010104, Ecuador
*
Author to whom correspondence should be addressed.
Buildings 2018, 8(7), 90; https://doi.org/10.3390/buildings8070090
Submission received: 9 May 2018
/
Revised: 2 July 2018
/
Accepted: 3 July 2018
/
Published: 6 July 2018
(This article belongs to the Special Issue Occupant Comfort and Well-Being)
Abstract
:A key factor for achieving healthy environments in residential buildings is the provision of high indoor environmental quality (IEQ) with respect to the acceptance by its occupants, based on levels of the physical parameters which contribute to IEQ. This research focuses on defining the comfort standards of indoor environments of urban dwellings in the city of Cuenca—Ecuador. It takes into account factors such as temperature, air quality, and natural lightning through a mixed method of quantitative and qualitative measurements. Results determined the following values: a comfort temperature (Tn) of 20.12 °C (with ranges from 16.62 °C to 23.62 °C for an acceptance of 80% and from 17.62 °C to 22.62 °C for an acceptance of 90%), a relative humidity between 40–65%, a maximum CO2 concentration of 614.25 ppm, a day light factor of ≥5 for the social area and ≥4 for the bedroom, and a minimum illumination level of 300 lux. With these results, it was observed that the comfort levels of temperature, CO2 concentration, and lighting accepted by local users differ from the standards established in local and international regulations. The determined data constitutes a methodological basis for carrying out similar processes in other localities.
1. Introduction
The importance of the indoor environmental quality (IEQ) at houses unquestionably lies in the effects produced upon people. Productivity and health gains have been demonstrated in occupants of buildings with good IEQ and a deficit on it is directly related with sick building syndrome [1]. In this context, a large amount of research has been developed for buildings of different types, with the major ones being offices, commercial buildings, and educational buildings. In 2016, Yousef al horr et al. [2], reviewed the scientific literature of office buildings with the aim of establishing the complex relationships between IEQ parameters and the health and welfare of the occupants. The results determined that it is important to monitor the performance of the building and the occupant during their operations in order to identify comfort and welfare needs that can be incorporated into the design processes.
Regarding educational buildings, the study by Trebilcock et al. (2017) [3], aimed to determine the comfort temperature in unheated schoolrooms located in Santiago, Chile through the application of questionnaires based on the adaptive comfort model and simultaneous measurements of internal environmental variables in winter and spring. This study showed that, in general, students are exposed to high temperature variations, both daily and seasonal, where the comfort ranges are significantly lower than those calculated from the adaptive comfort model established for adults. In addition, it was determined that children tend to adapt to these interior temperatures using strategies especially related to clothing. Regarding this same type of building, a study in the Slovak Republic [4] measured environmental parameters and applied surveys to students and teachers of a school during a week in autumn. The prevalence of some symptoms of the sick building syndrome was observed and, in the results, the close relationship between IEQ and the performance of the occupants of the school was confirmed. Another study in the same locality had the objective of evaluating the IEQ state of the classrooms at the Kosice Technical University campus. In this study, the temperature, relative humidity, and carbon dioxide levels were monitored, with the simultaneous application of subjective questionnaires during the winter and summer semester. This showed that it is important to propose optimization measures to reduce CO2 concentrations and thermal load in the summer period [5]. Finally, to verify compliance with the IEQ parameters in a partially adapted university building in Galway (Ireland) built during the 1970s, evaluations were performed based on the criteria described in EN 15251, the ASHRAE 55 methods, and the IEQ CBE surveys, complemented with physical measurements. It was established that the occupants personalize their adaptation to the existing conditions, since their preferred levels of satisfaction in the survey were lower than the measured thermal sensation [6].
In the field of residential buildings, Diaz Lozano Patino et al. (2018) [7] performed a literary review of 49 articles documenting the IEQ conditions in social housing, focusing on the concentrations of air pollutants and thermal comfort associated with the effects on health. The study determined that residents can remain exposed to high levels of pollutants and low thermal comfort as this is a frequent problem in this type of housing. Additionally, it was established that, for non-social housing, there is not enough data to compare these typologies and give a definitive statement about the relative prevalence of these conditions for housing. Finally, they found that sustainable housing modifications have the potential to improve IEQ conditions but these must be adapted to the specific context of each building.
Based on this and with the purpose of contributing evidences for the IEQ of urban dwellings located in the city of Cuenca, Ecuador, the present investigation has the objective of determining the comfort levels for the parameters of temperature, air quality, and natural lighting through the correlation between subjective perceptions and physical measurements. The established optimal values and ranks, according to international and local regulations, which were considered to analyze these three parameters are shown in Table 1.
2. Materials and Methods
The study place was the residential urban area of the city of Cuenca, Ecuador, at the level of “particular dwelling”. Cuenca City is located in a continental rainy climate zone, with CDD (Cooling degree day) 10 °C < 2500 and HDD (Heating degree day) of 18 °C < 2000. The city has an average annual temperature of 16.3 °C, and varies from 10.1 °C to 21 °C. The climate in the city is mainly cold; however, there are periods that are warmer [17]. The relative humidity fluctuates between 40% and 85%.
The research was developed in two stages. The first stage focused on studying the satisfaction of occupants of the residential sector of the city. In the second stage, the physical environmental conditions and the expectations of the comfort of the users of a group of dwellings were selected as study cases to evaluate.
2.1. Field Studies
2.1.1. Perception Survey
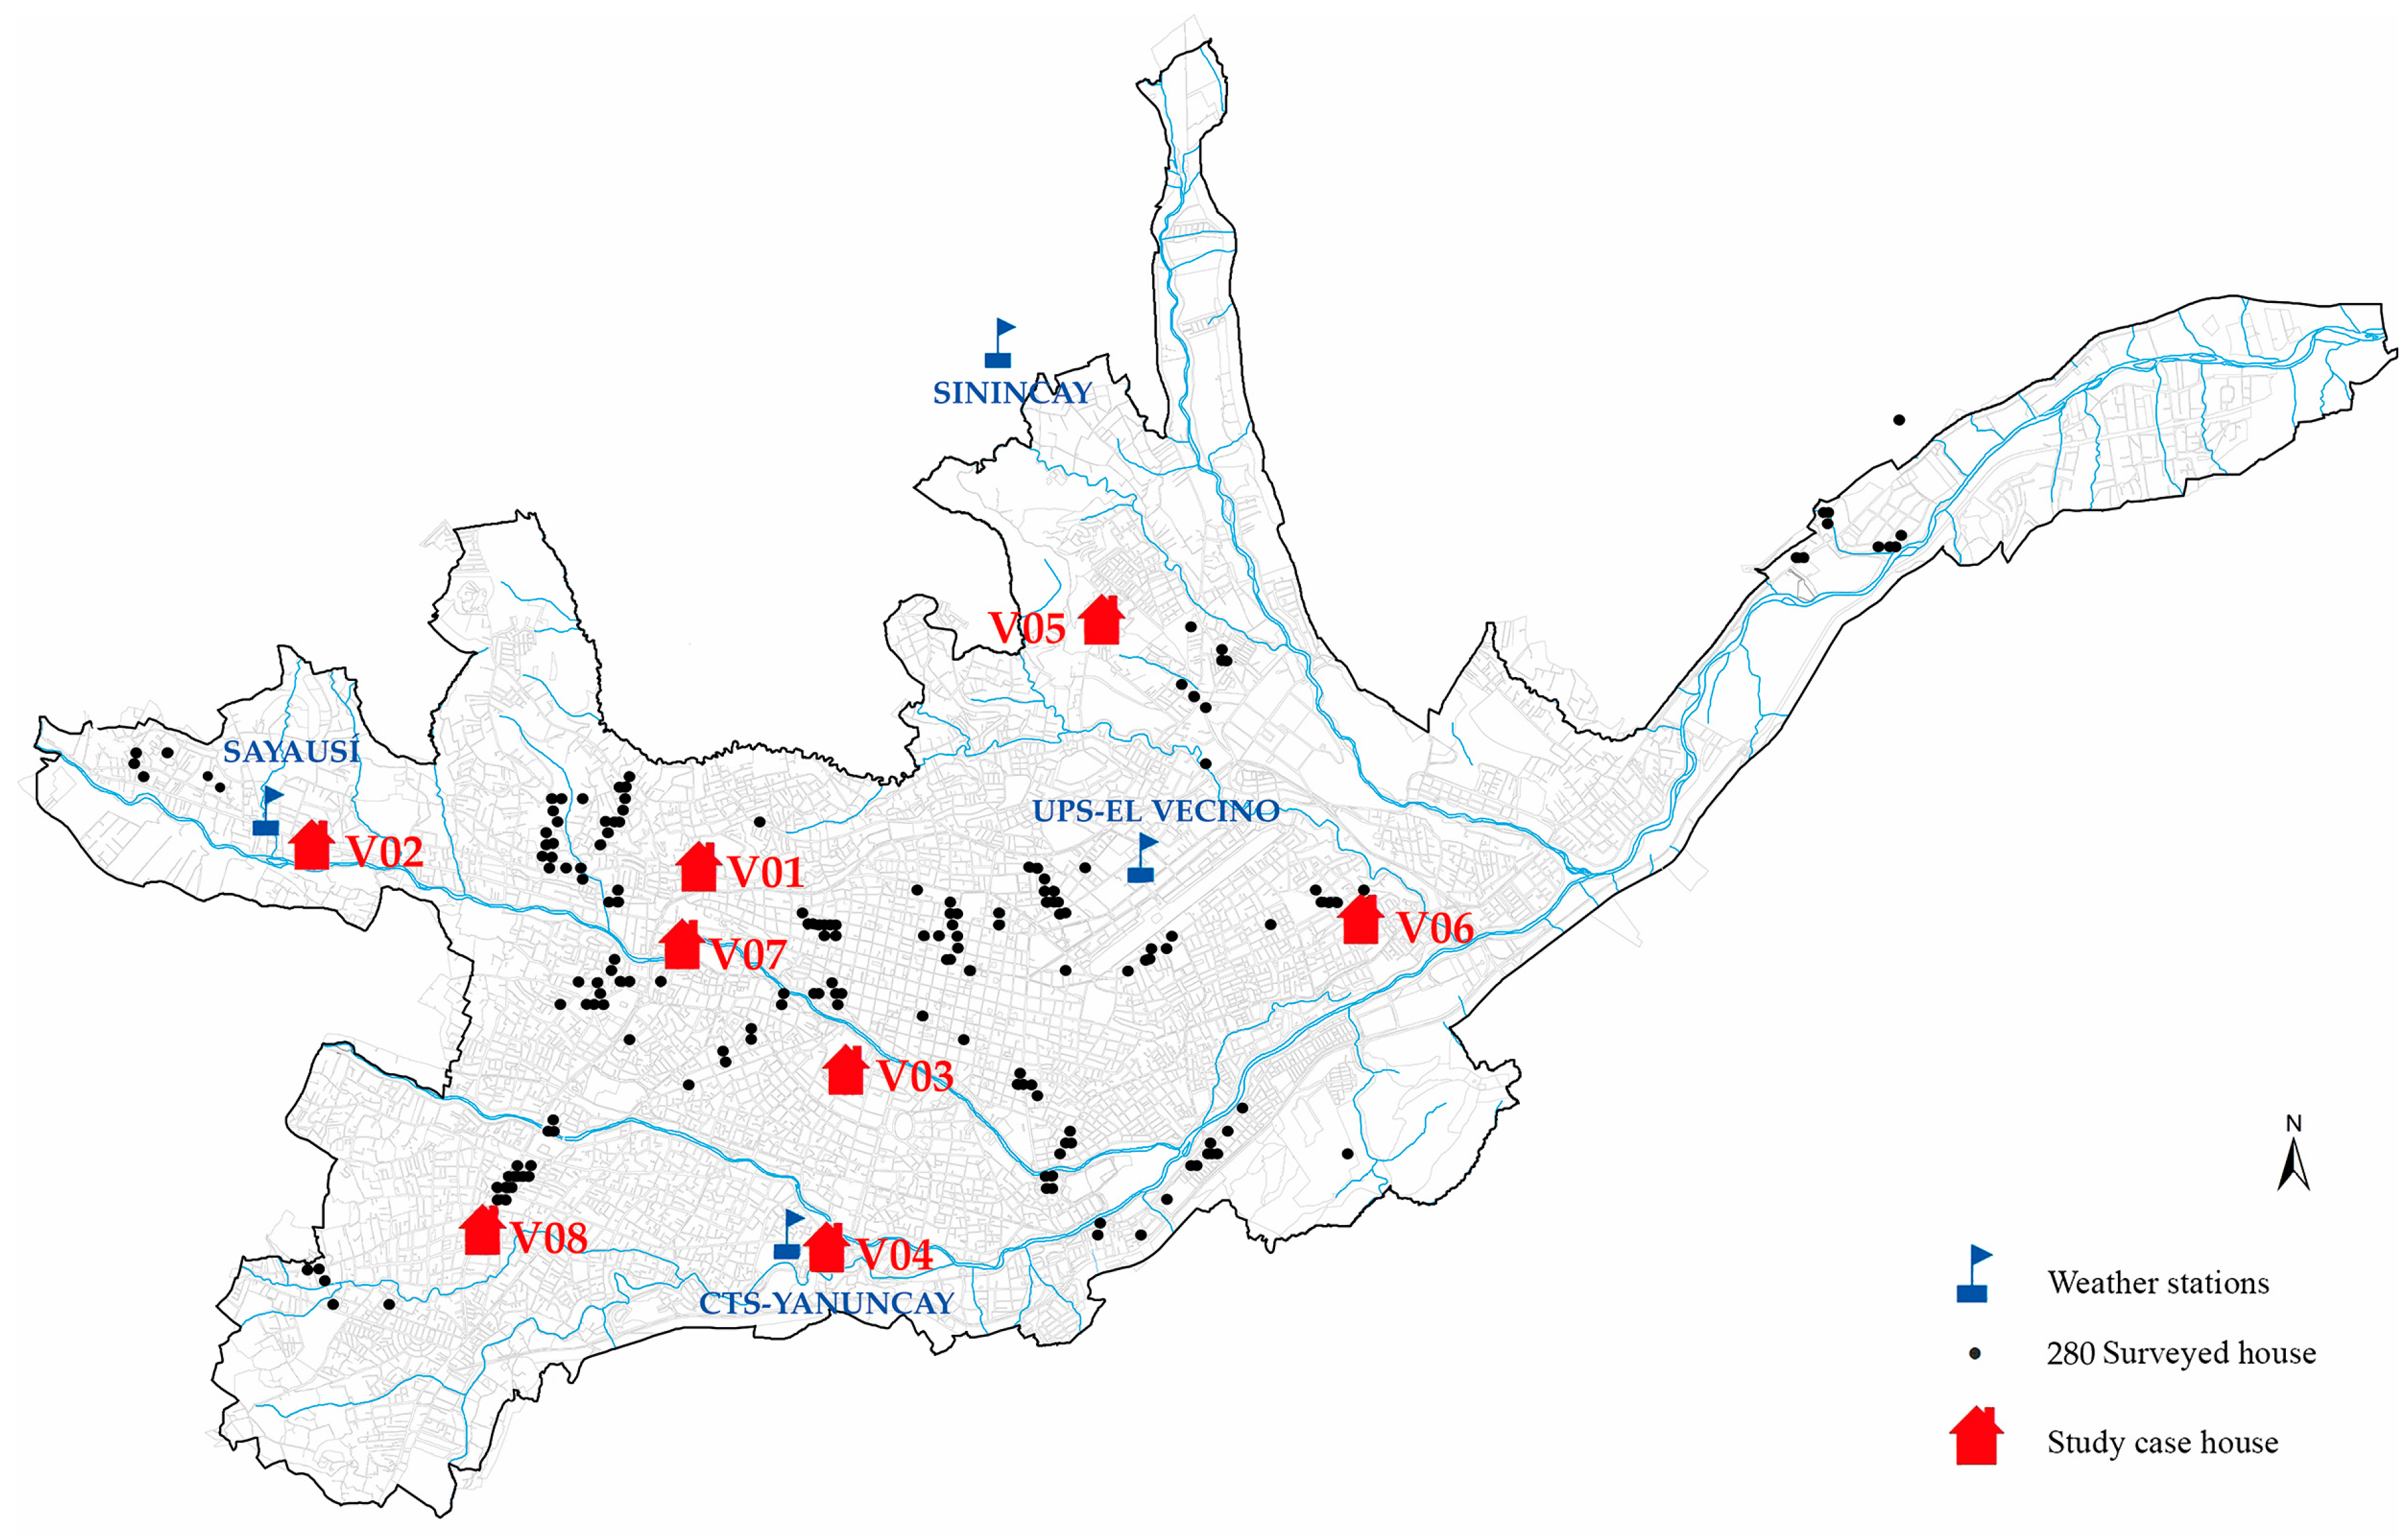
The study analyzed the habits of use and satisfaction of housing users, through a perception survey in the urban sector of the city. Sampling design was probabilistic, stratified (by urban parishes and number of houses), and random. The sampling unit was the census sector (UPM). The sample size was 280 dwellings (location shown in Figure 1), based on the following formula:
where:
np’ = K2 N PQ/K2 PQ + N E2
- np’ = the size of sample to estimate a proportion
- K = confidence coefficient
- N = size of the study universe
- PQ = the variance of the proportion
- E = the maximum permissible error
The confidence level used was 95% and the absolute error was 0.06.
The survey was conducted via personal interviews with household heads, using a work sheet, which was elaborated using closed questions from some revised references [18,19,20]. Two kinds of questions were asked. The first queries registered the physical characteristics of a house and defined the occupation indexes of the users. The second group of questions was related to user satisfaction perceptions of their indoor environments, using a 5-level satisfaction scale (Supplementary 1). Some examples of used questions can be found below:
- How satisfied are you with the size and quality of your house? The answers were: completely unsatisfied, moderately unsatisfied, indifferent, moderately satisfied and completely satisfied.
- Do you consider your house as?

These questions provided quantitative data about qualitative perceptions of indoor comfort: temperature, air quality, and illumination.
2.1.2. Dwellings Assessment
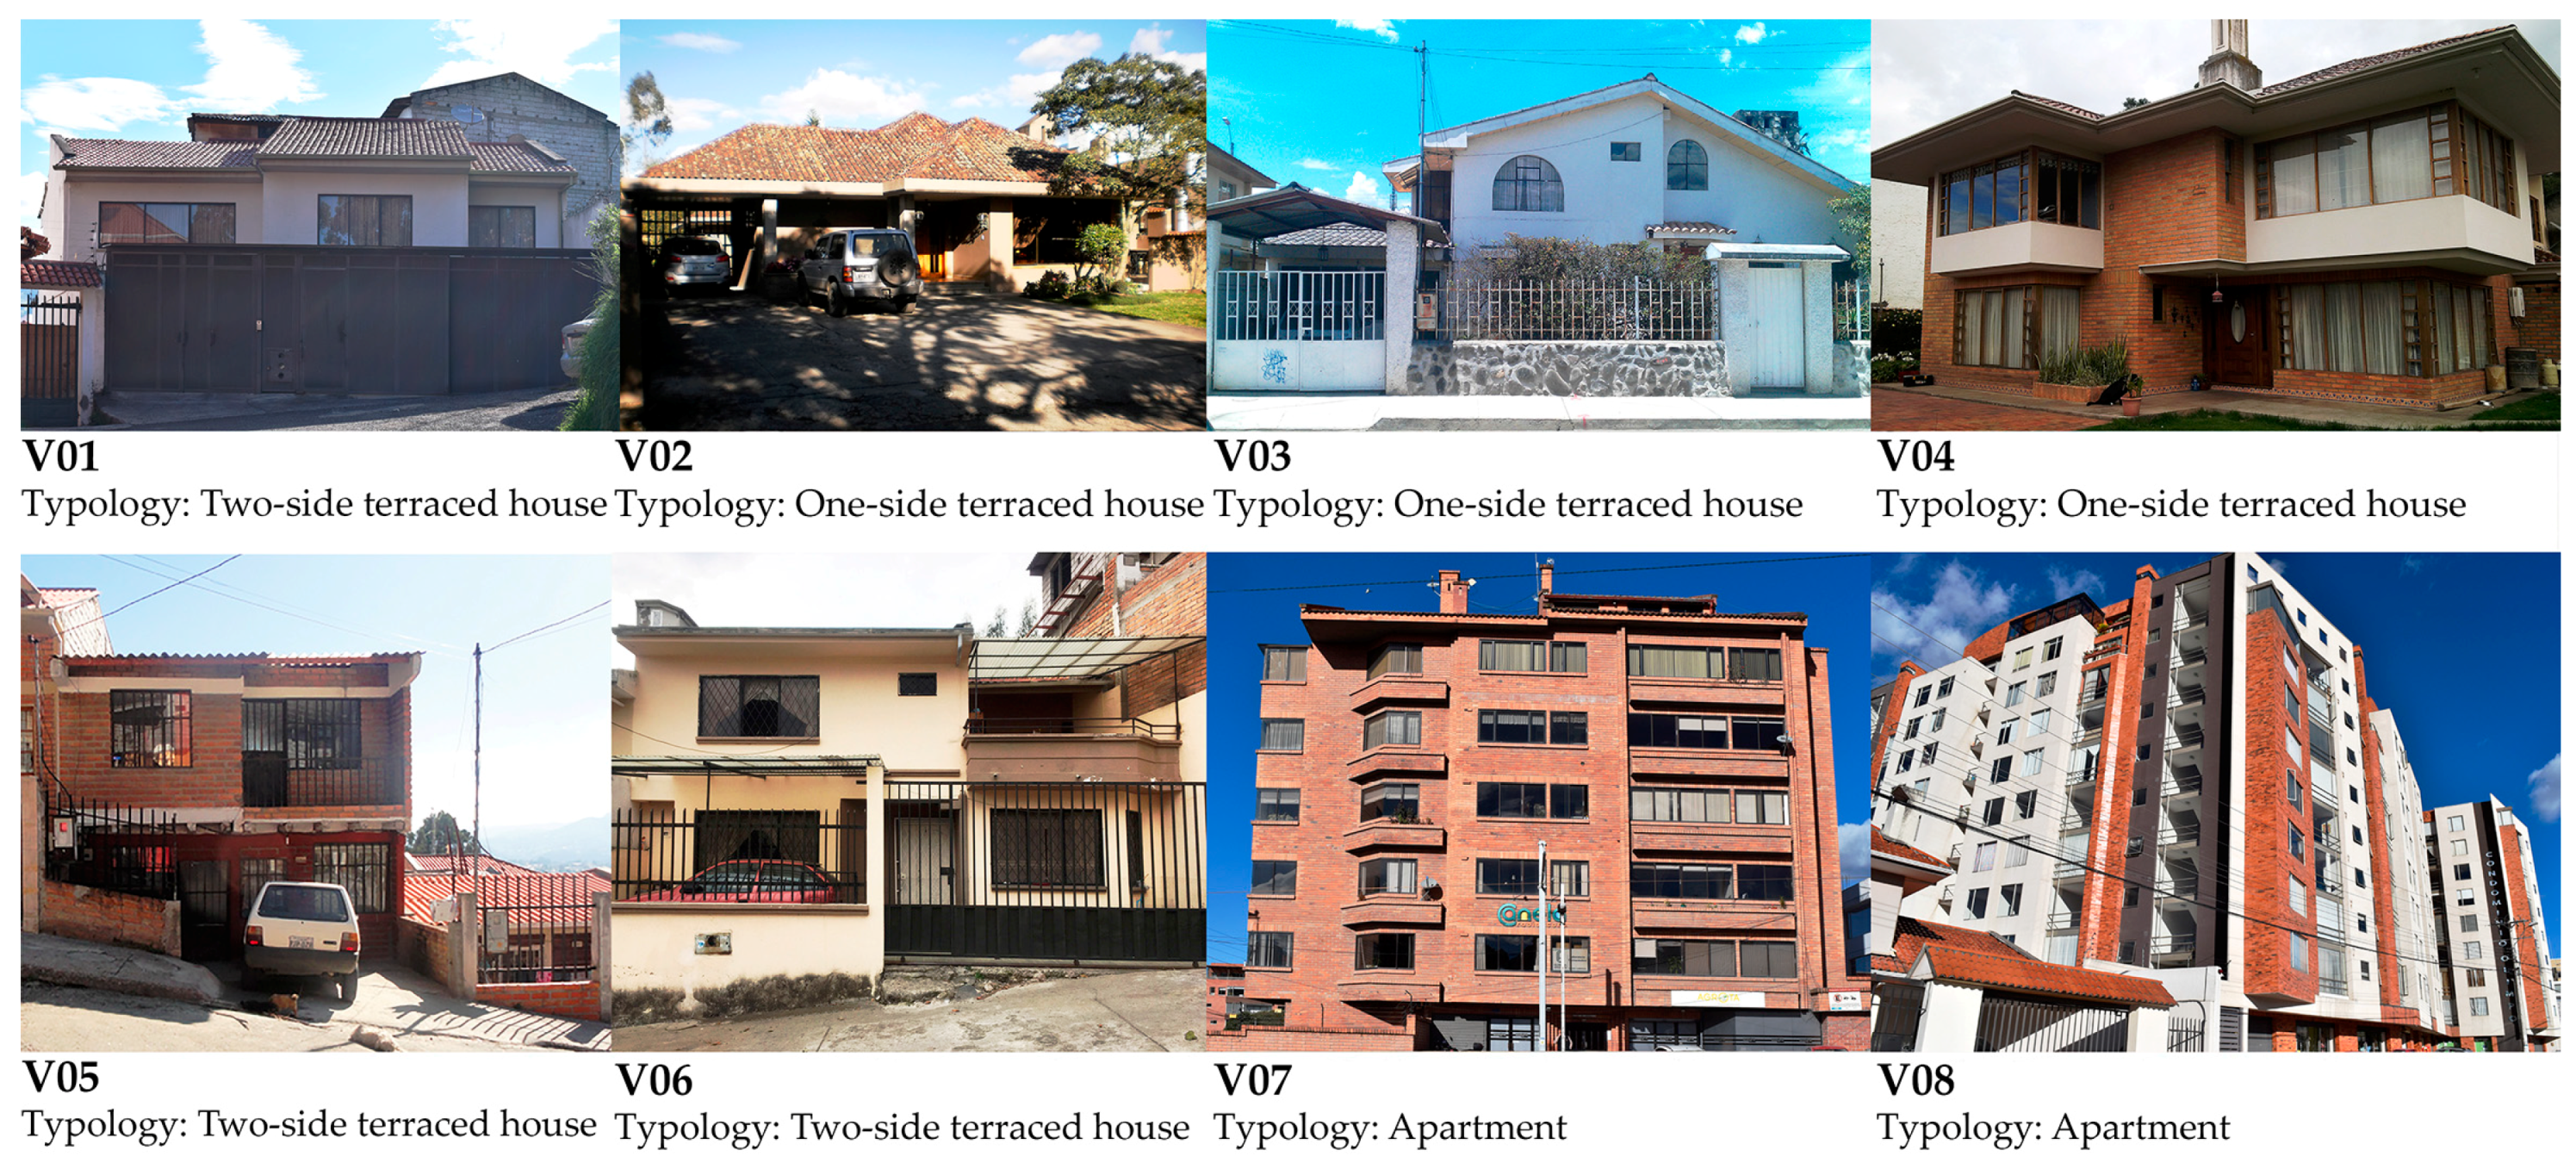
Eight single-unit houses were selected as representative cases after applying some criteria, such as location, typology, the house constructive system, socio-economic profile of the family, and the predisposition of users to collaborate with the present study. Some studies related to indoor comfort have used a similar number of analysis units [3,21,22]. As for the typology and materiality of the dwellings, houses and apartments built with concrete structures and brick walls were chosen because, in the city, most people have houses with these characteristics. Dwellings and their typologies are presented in Figure 2. Their locations are shown in Figure 1.
The field study was performed during two different periods (cold and warm), for one week, respectively. The first period was during September and October 2015, and the second during February and March 2016.
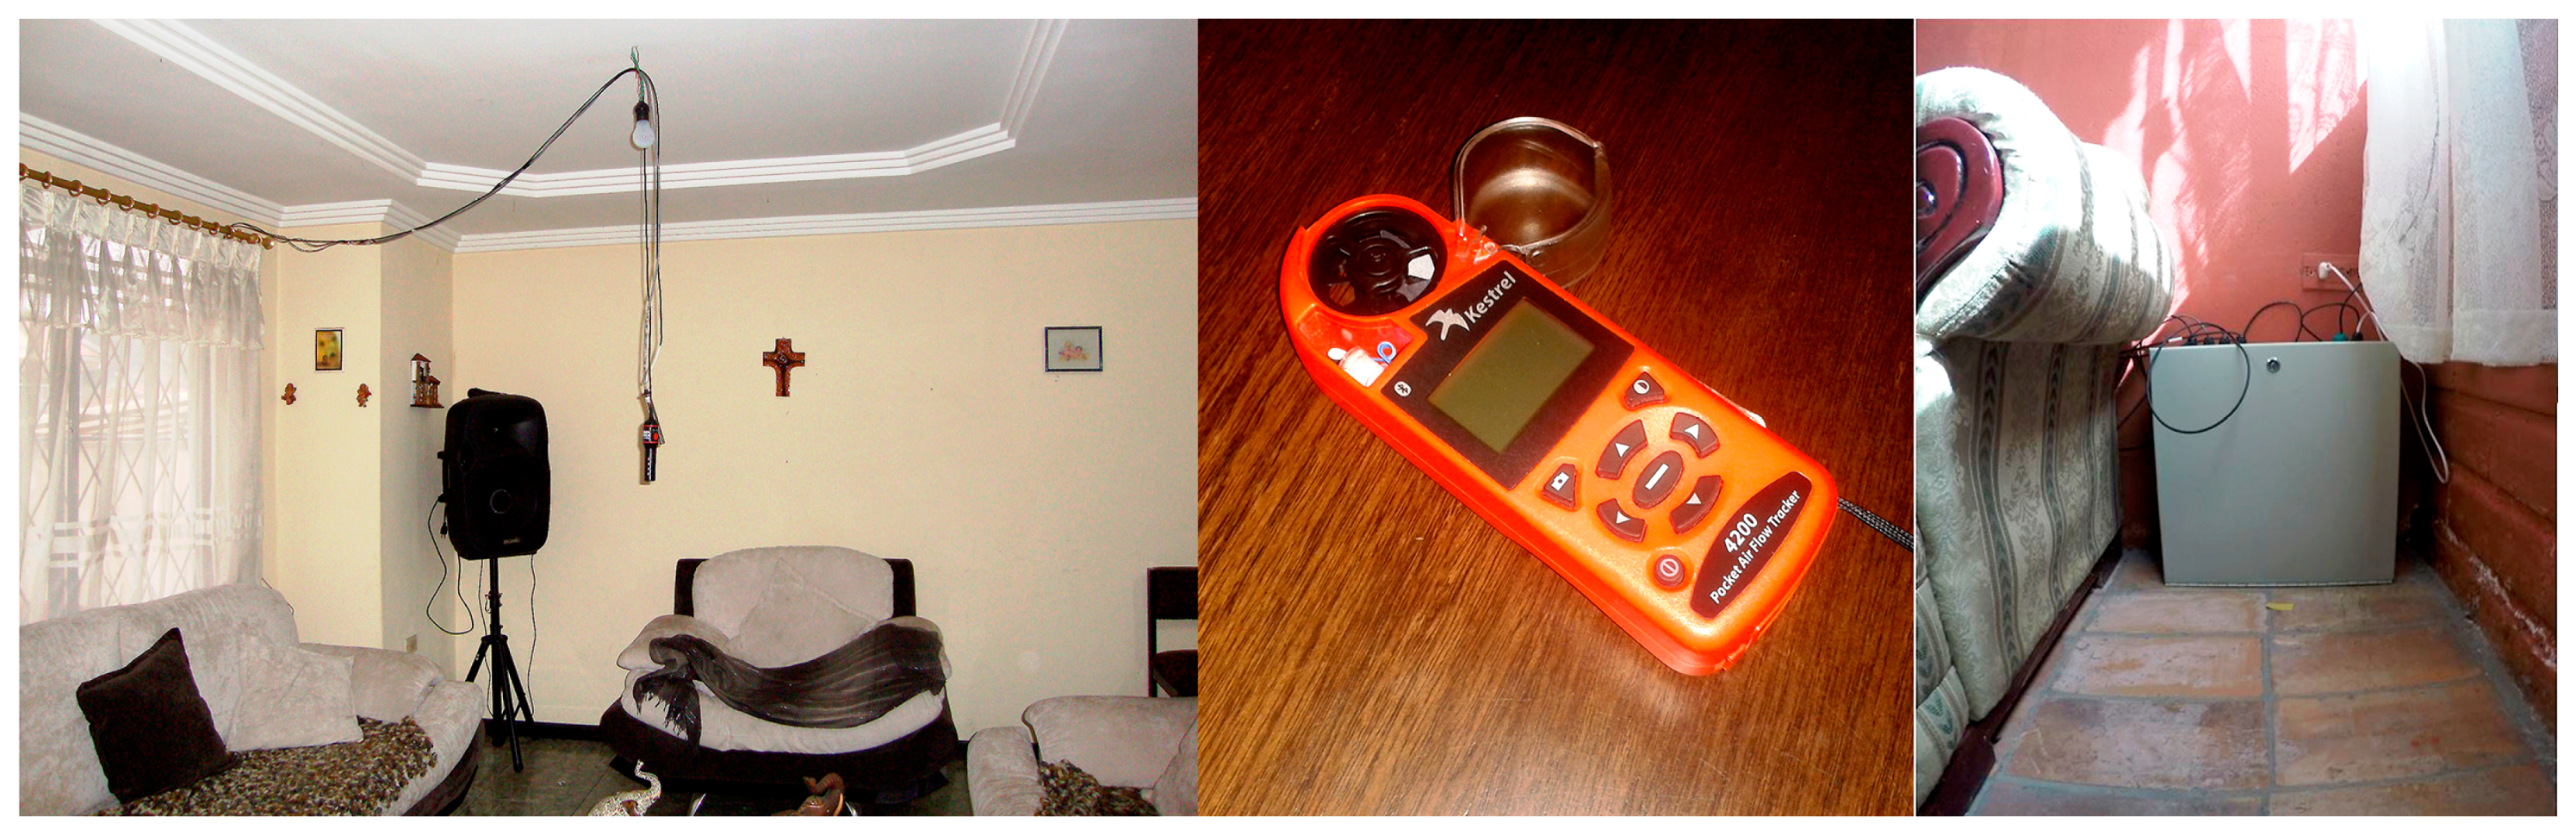
The measurements were made every 5 min, with two devices for each house, for 7 days. Sensors were set at 1.5 m in height from the floor, at the center of the main bedroom and social area, as shown in Figure 3. The devices used are described in Table 2.
The measurement parameters included temperature, CO2 levels, relative humidity, and solar radiation. Indoor air speed values were registered with point measurements during home visits.
External environment registries were obtained from weather stations, located at different areas of the city and near the studied houses (Figure 1). To obtain the levels of natural lighting in the spaces of the houses, simulations were performed using the software Autodesk Ecotect Analysis 2011, which is based on the admittances method that was developed by the Chattered Institute of Building Service Engineers, which obtained “daylight factor values” (DF) and illumination levels.
Users’ subjective experiences about indoor environments were registered in the surveys applied to those studied households while physical monitoring was developed.
The structured survey contained closed (multiple choices) and open questions, so that users could express their points of view in with respect to the studied topics. The questionnaire was translated and adapted for the houses according to the Center for Built Environment’s (CBE’s) survey, which was developed by the University of Berkeley, California. A sample of this survey is presented in Supplementary 2. The questionnaire requested that people identify their levels of satisfaction, based on Finger’s seven-points bipolar scale (from very unsatisfied: −3 to very satisfied: +3), with respect to thermal comfort, light, and air quality. This questionnaire was applied for senior citizens once in each monitoring period. Some examples of these concrete and direct questions were:
- How satisfied are you with the temperature at your bedroom? Please choose a number from a seven-points bipolar (from very satisfied to very unsatisfied) scale.
- What elements are contributing to odor problems?
- What elements do you use to control illumination?
Finally, an additional interview was required to analyze thermal comfort (Supplementary 3). The survey was an “E1. Thermal Environment Point-In-Time Survey” taken from the ANSI/ASHRAE Standard 55–2010 regulation. The aim of this additional survey was to obtain thermal sensation, metabolic rates (met), and clothing isolation (clo) indicators. The survey was applied three times a day for each member of the family during the two monitoring periods (cold and warm).
2.2. Data Analysis
The results of the survey of perception were obtained through a percentage analysis that defined trends in the habits of use in the rooms, and the satisfaction of the occupants regarding the interior environment of the houses.
To establish a user’s real acceptability with respect to the household thermal conditions, as a response to its adaptive capacity, the mean vote (MV) was calculated as an average of registered users’ votes, and the frequencies of −3, −2, +2, and +3 were useful for determining the unsatisfied percentage of users. It was not useful to classify results by monitoring periods because the temperature variations were not significant. Comfort temperature or neutral temperature (Tn) was determined by applying linear regression analyses of users’ TSV (Thermal Sensation Votes) data and indoor air temperature measurements during monitoring. The air temperature, because of its proportional relationship with the globe’s temperature, was used as a measure to more easily compare with other author’s results [23]. In addition, the radiant temperature concords with air temperature when air speed is near to 0 m/s; in the same way, the operative temperature (to) equals to air temperature (ta) [24]. The neutral temperature (Tn) was calculated according to TSV, using the minimum squared method to process the data. The thermal comfort range was determined using two scales to get an acceptability of 90% and 80%, based on previous studies [25] and international regulations. This is related to the adaptive methods that determine a Tn around ±2.5 °C with 90% of satisfied users and a variation of ±3.5 °C for 80% of satisfied users.
Air quality was evaluated using a continuous registry of CO2 concentration values in the social and master bedroom areas; these results were compared with satisfaction indicators (obtained with the surveys) and CO2 maximum concentration levels that were referred by local [13] and international regulations [26,27,28]. An acceptable CO2 level must be under 1000 ppm or 650 ppm over the external environment level in order to avoid any human-associated odor accumulation.
The results of the natural lighting simulations were compared to the international minimum standards of DF and lighting levels. According to the regulations and assessment methods, a minimum DF of 2% is adequate for all indoor house spaces; in addition, illumination levels must be 50–300 lux for social spaces and 100 lux for bedrooms [21,29].
3. Results
3.1. Perception Survey Results
The results of the general survey determined some use characteristics in relation to the indoor environments:
- A total of 65.6% of people use windows as ventilation tools and 33.1% of them use doors.
- A total of 92.5% of users leave the curtains open to take advantage of natural light.
- A total of 98% of houses do not have a heating system and 88% of users consider it unnecessary.
- Regarding comfort perceptions, the following information was gathered:
- A total of 65% of users consider their household indoor temperature as comfortable. Most non-comfortable votes were found to be associated with lower temperatures.
- Household indoor air quality had good subjective perception results. A total of 80% of users did not perceive bad smells because of contamination or lack of ventilation.
- Regarding natural illumination household quality perceptions, 41% of users believed that natural illumination was not sufficient everywhere in their houses.
3.2. Housing Assessment Results
3.2.1. Hygrothermic Comfort
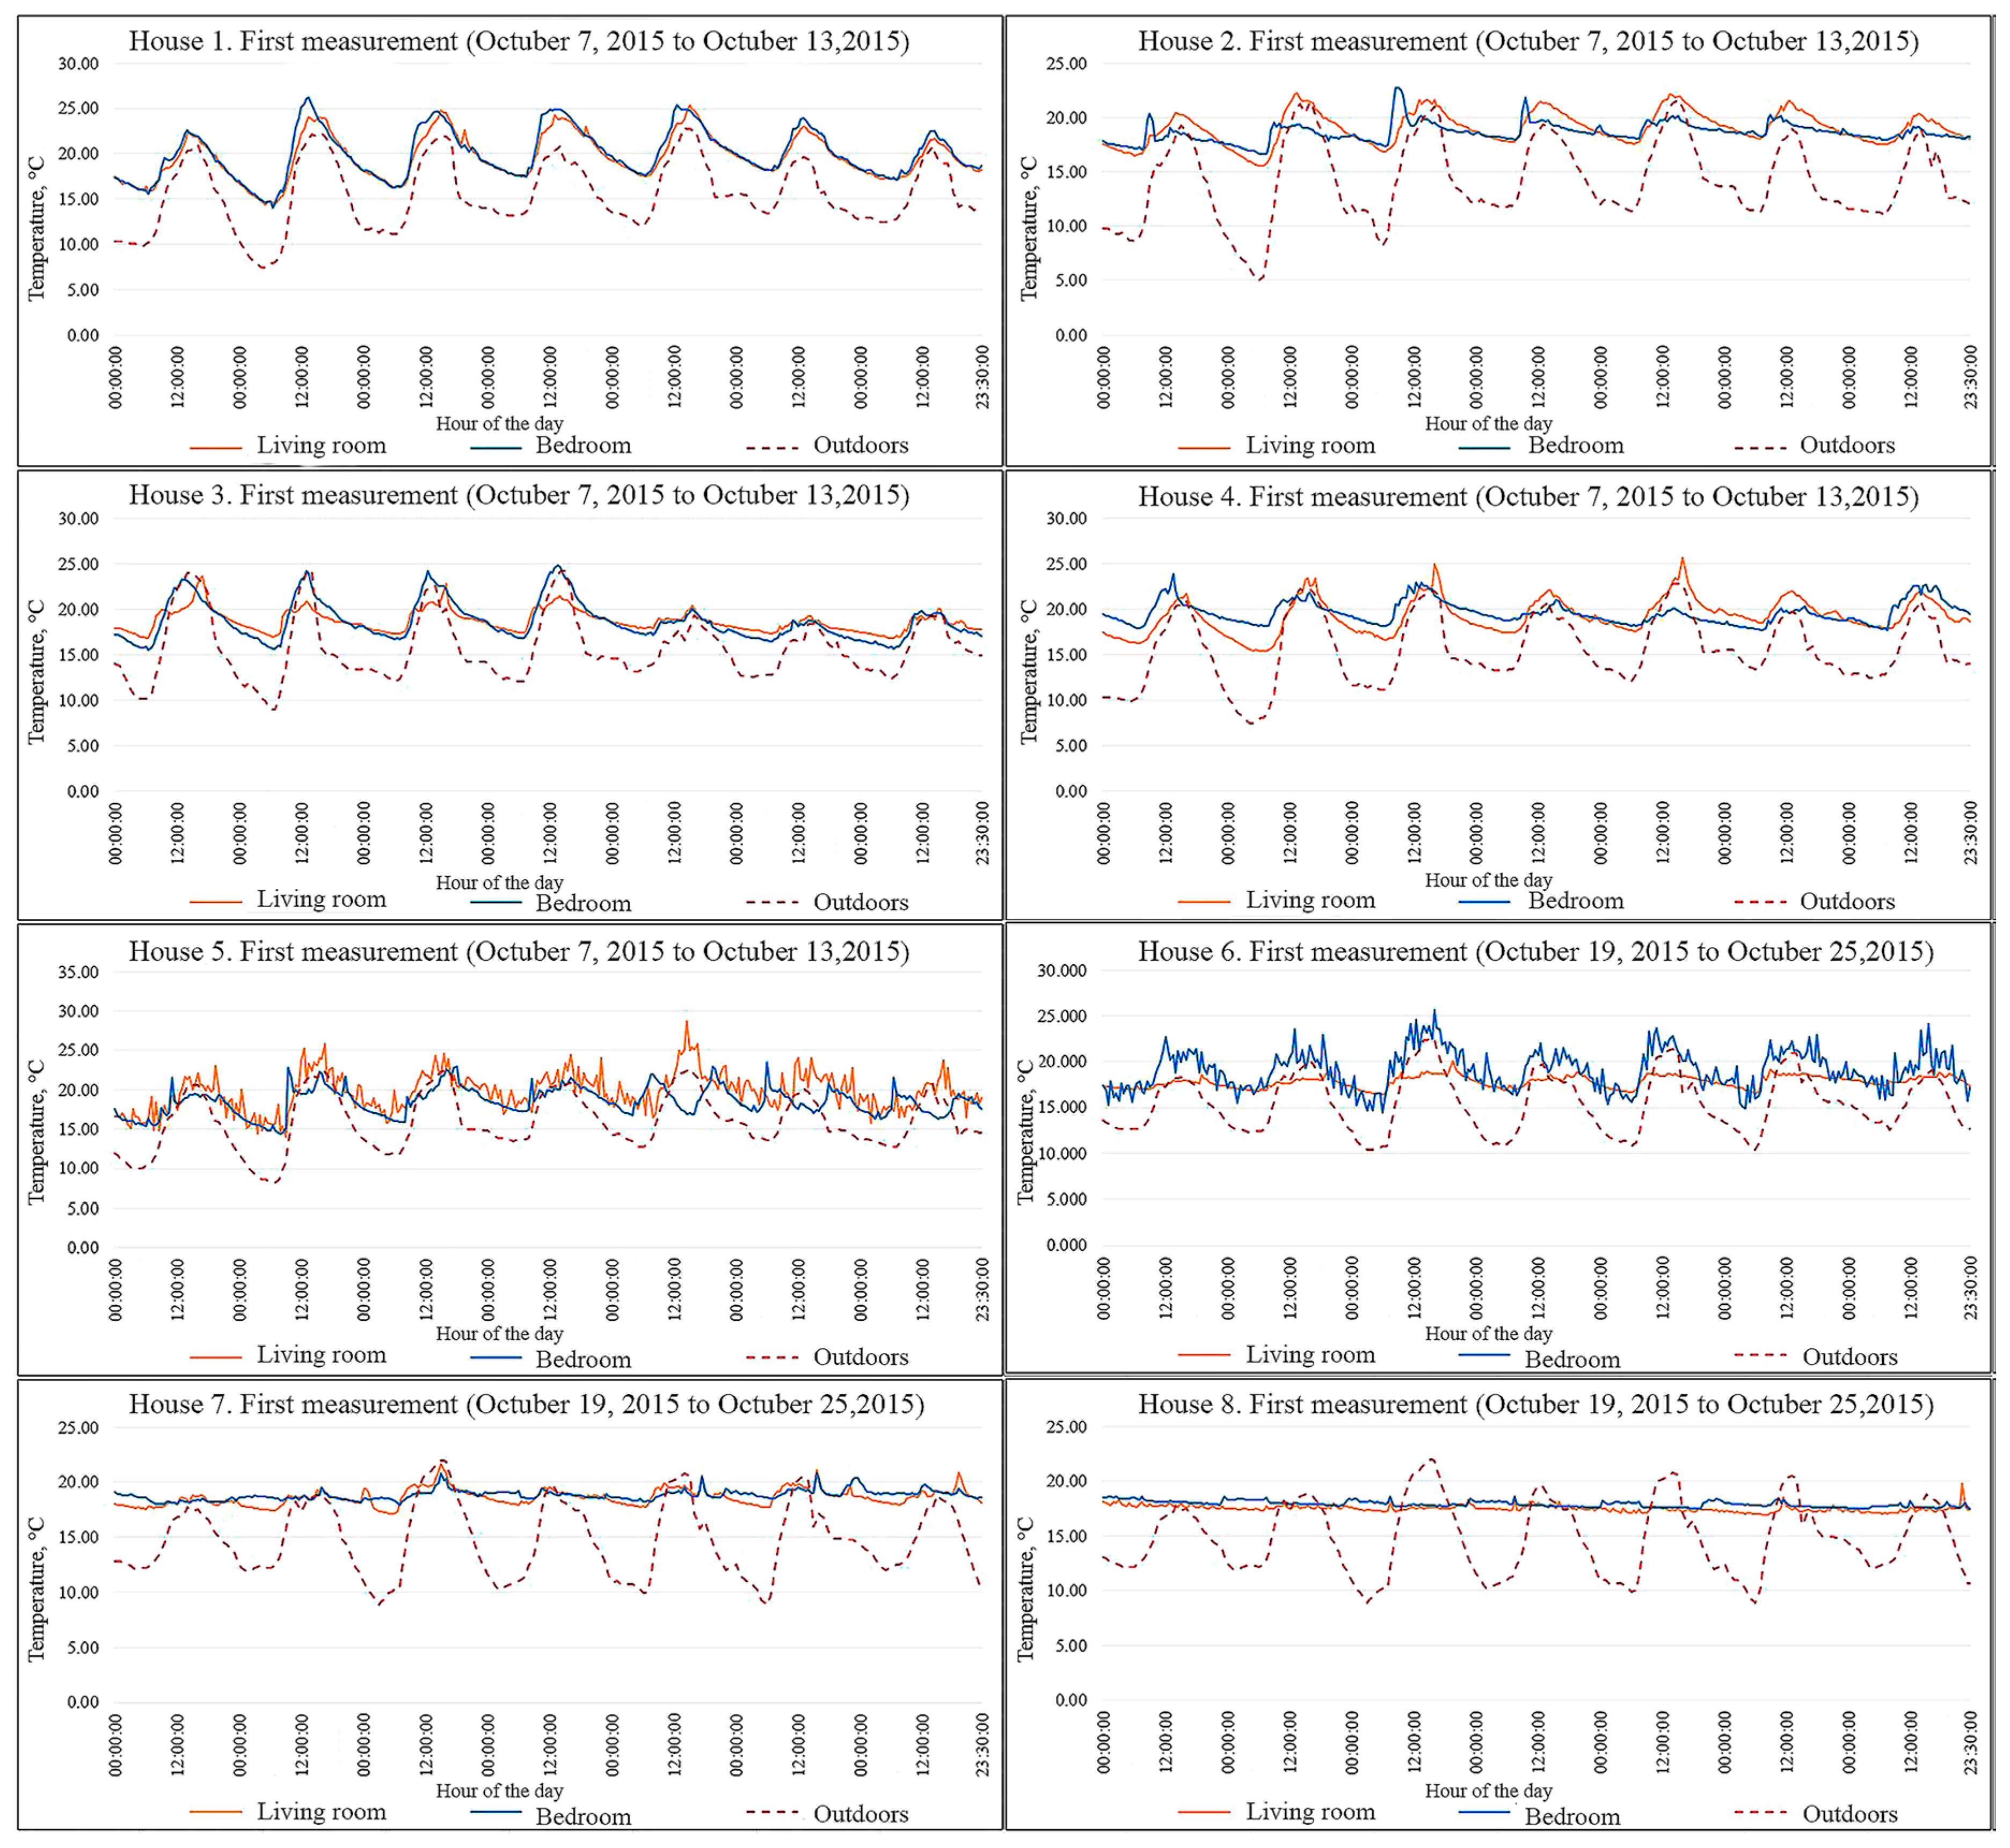
The operating temperature records for each case study, during the first measurement period, are shown in Figure 4. These representations show that the temperature remained higher inside than outside. Indoor temperatures varied between 14 °C and 29 °C. On the other hand, external temperatures varied between 5 °C and 24 °C. Houses 7 and 8 had minor variations. Regarding spaces, the social areas of houses 6, 7, and 8 had better temperature behavior because of their minimum variations; the master bedrooms of houses 2, 7, and 8 maintained constant temperatures, despite external temperature changes.
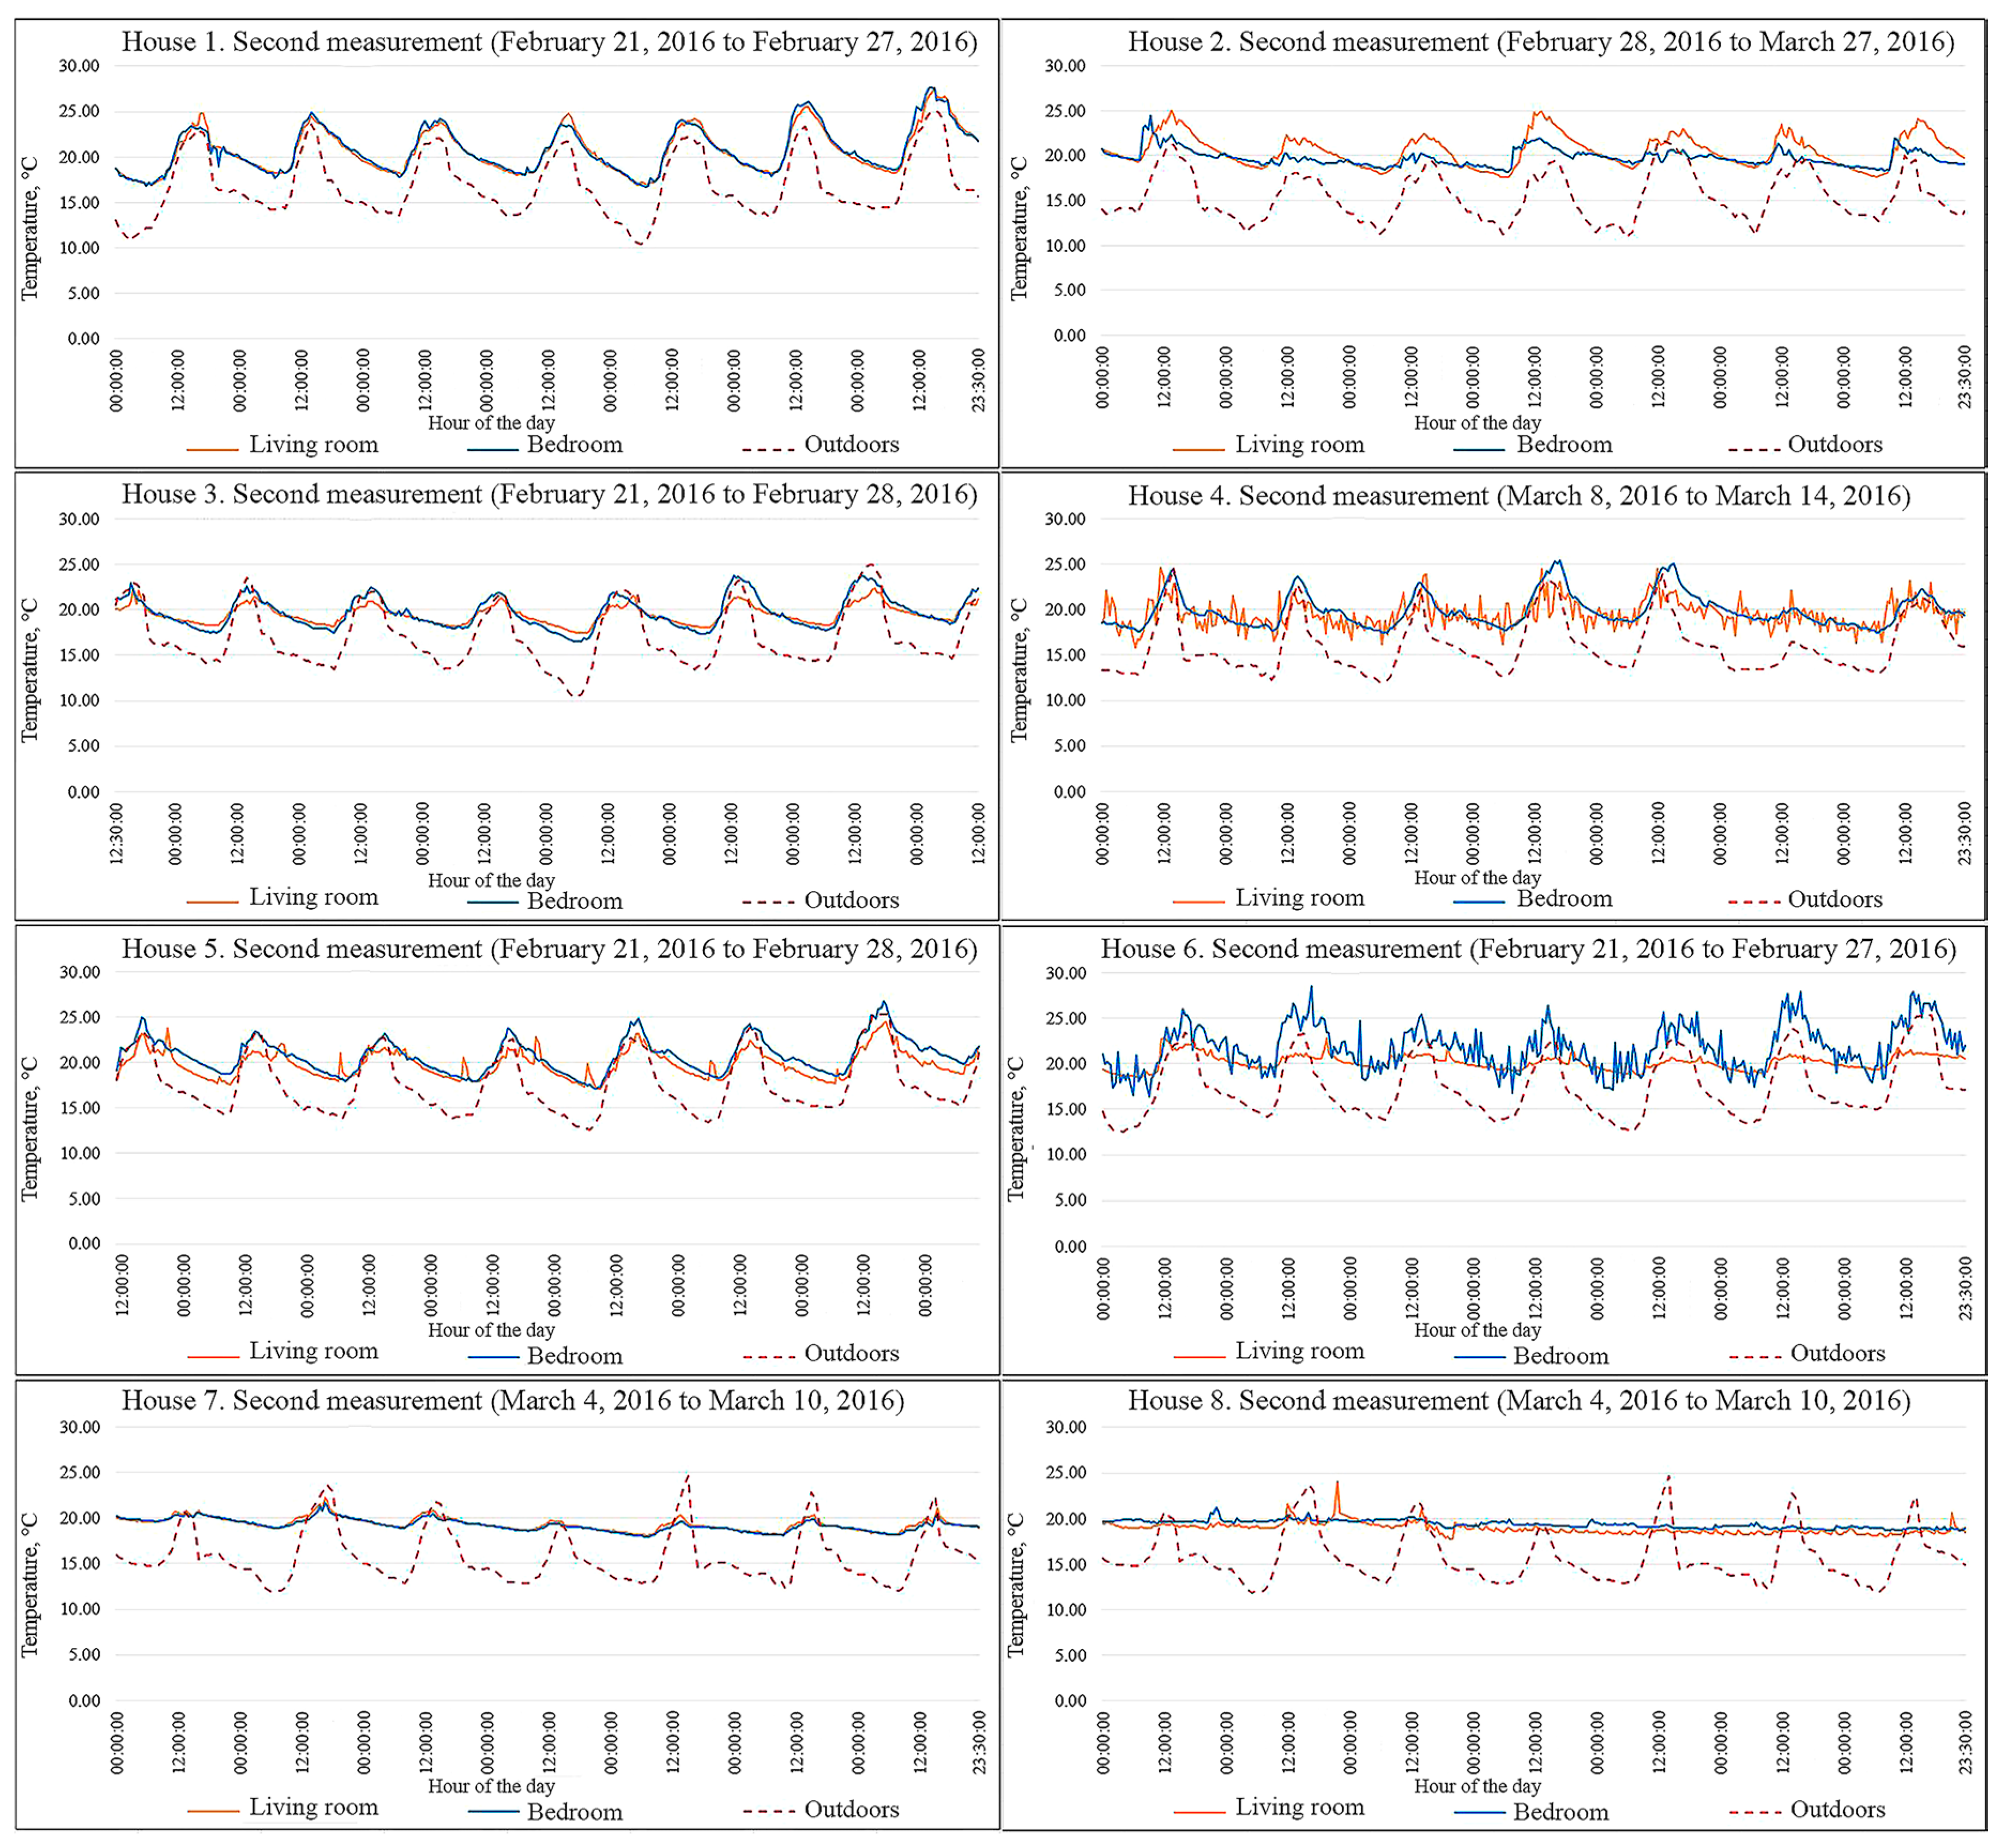
The second period of monitoring registries are denoted in Figure 5. Similar ranks and variations to those in the first monitoring experiment were found; approximate increases of 1 °C were found indoors and outdoors. Houses 7 and 8 had minor indoor temperature variations, so the temperature was around 19 °C. House 2’s bedroom and house 6’s social area had the best conditions with respect to thermal stability.
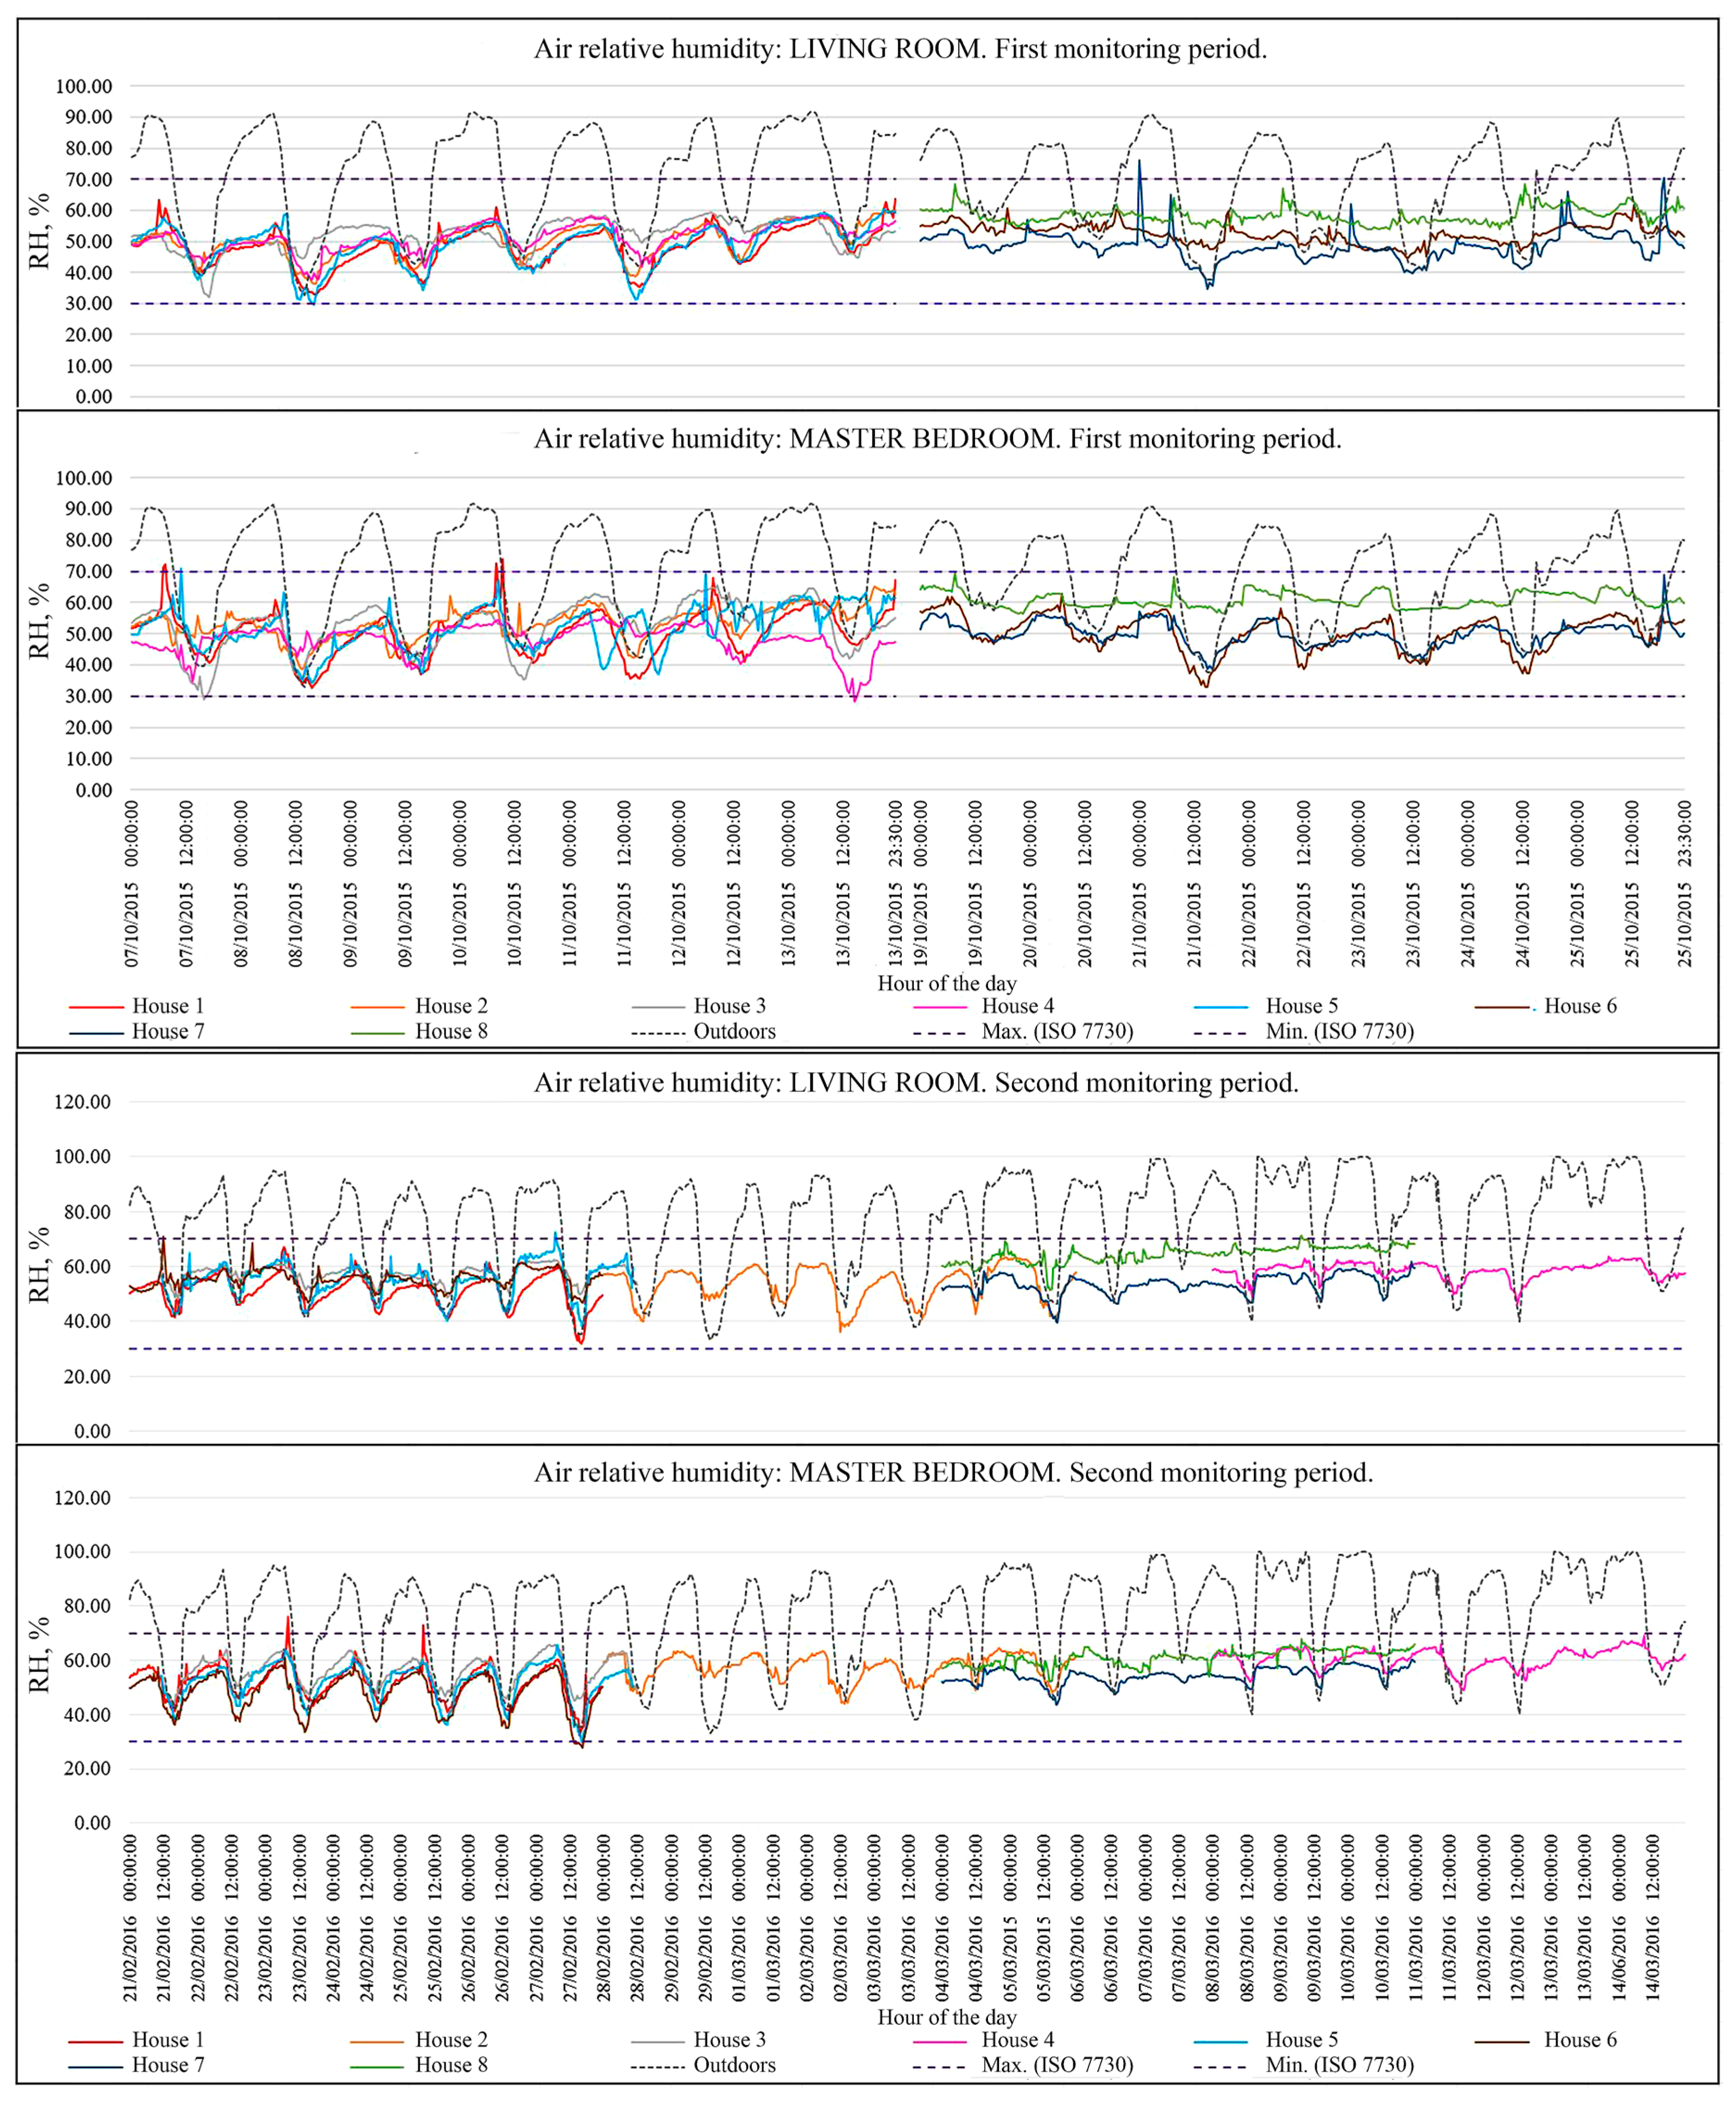
The relative humidity registry during the two monitoring periods is condensed in Figure 6. All studied cases had indoor relative humidity values between ISO 7730 regulation limits (30% to 70%); those values were found within a stricter relative humidity optimal rank (40% to 60%) most of time and maintained a relationship with external relative humidity variations during the daily registries.
Accurate indoor air speed registries of all the studied houses were determined to be near 0.0 m/s speed values for the social areas and bedrooms.
Regarding the perception of thermal sensation, subjective voting confirmed that most of the houses were considered as “thermally comfortable”; houses 5, 6, and 7 produced negative comfort perceptions for their users.
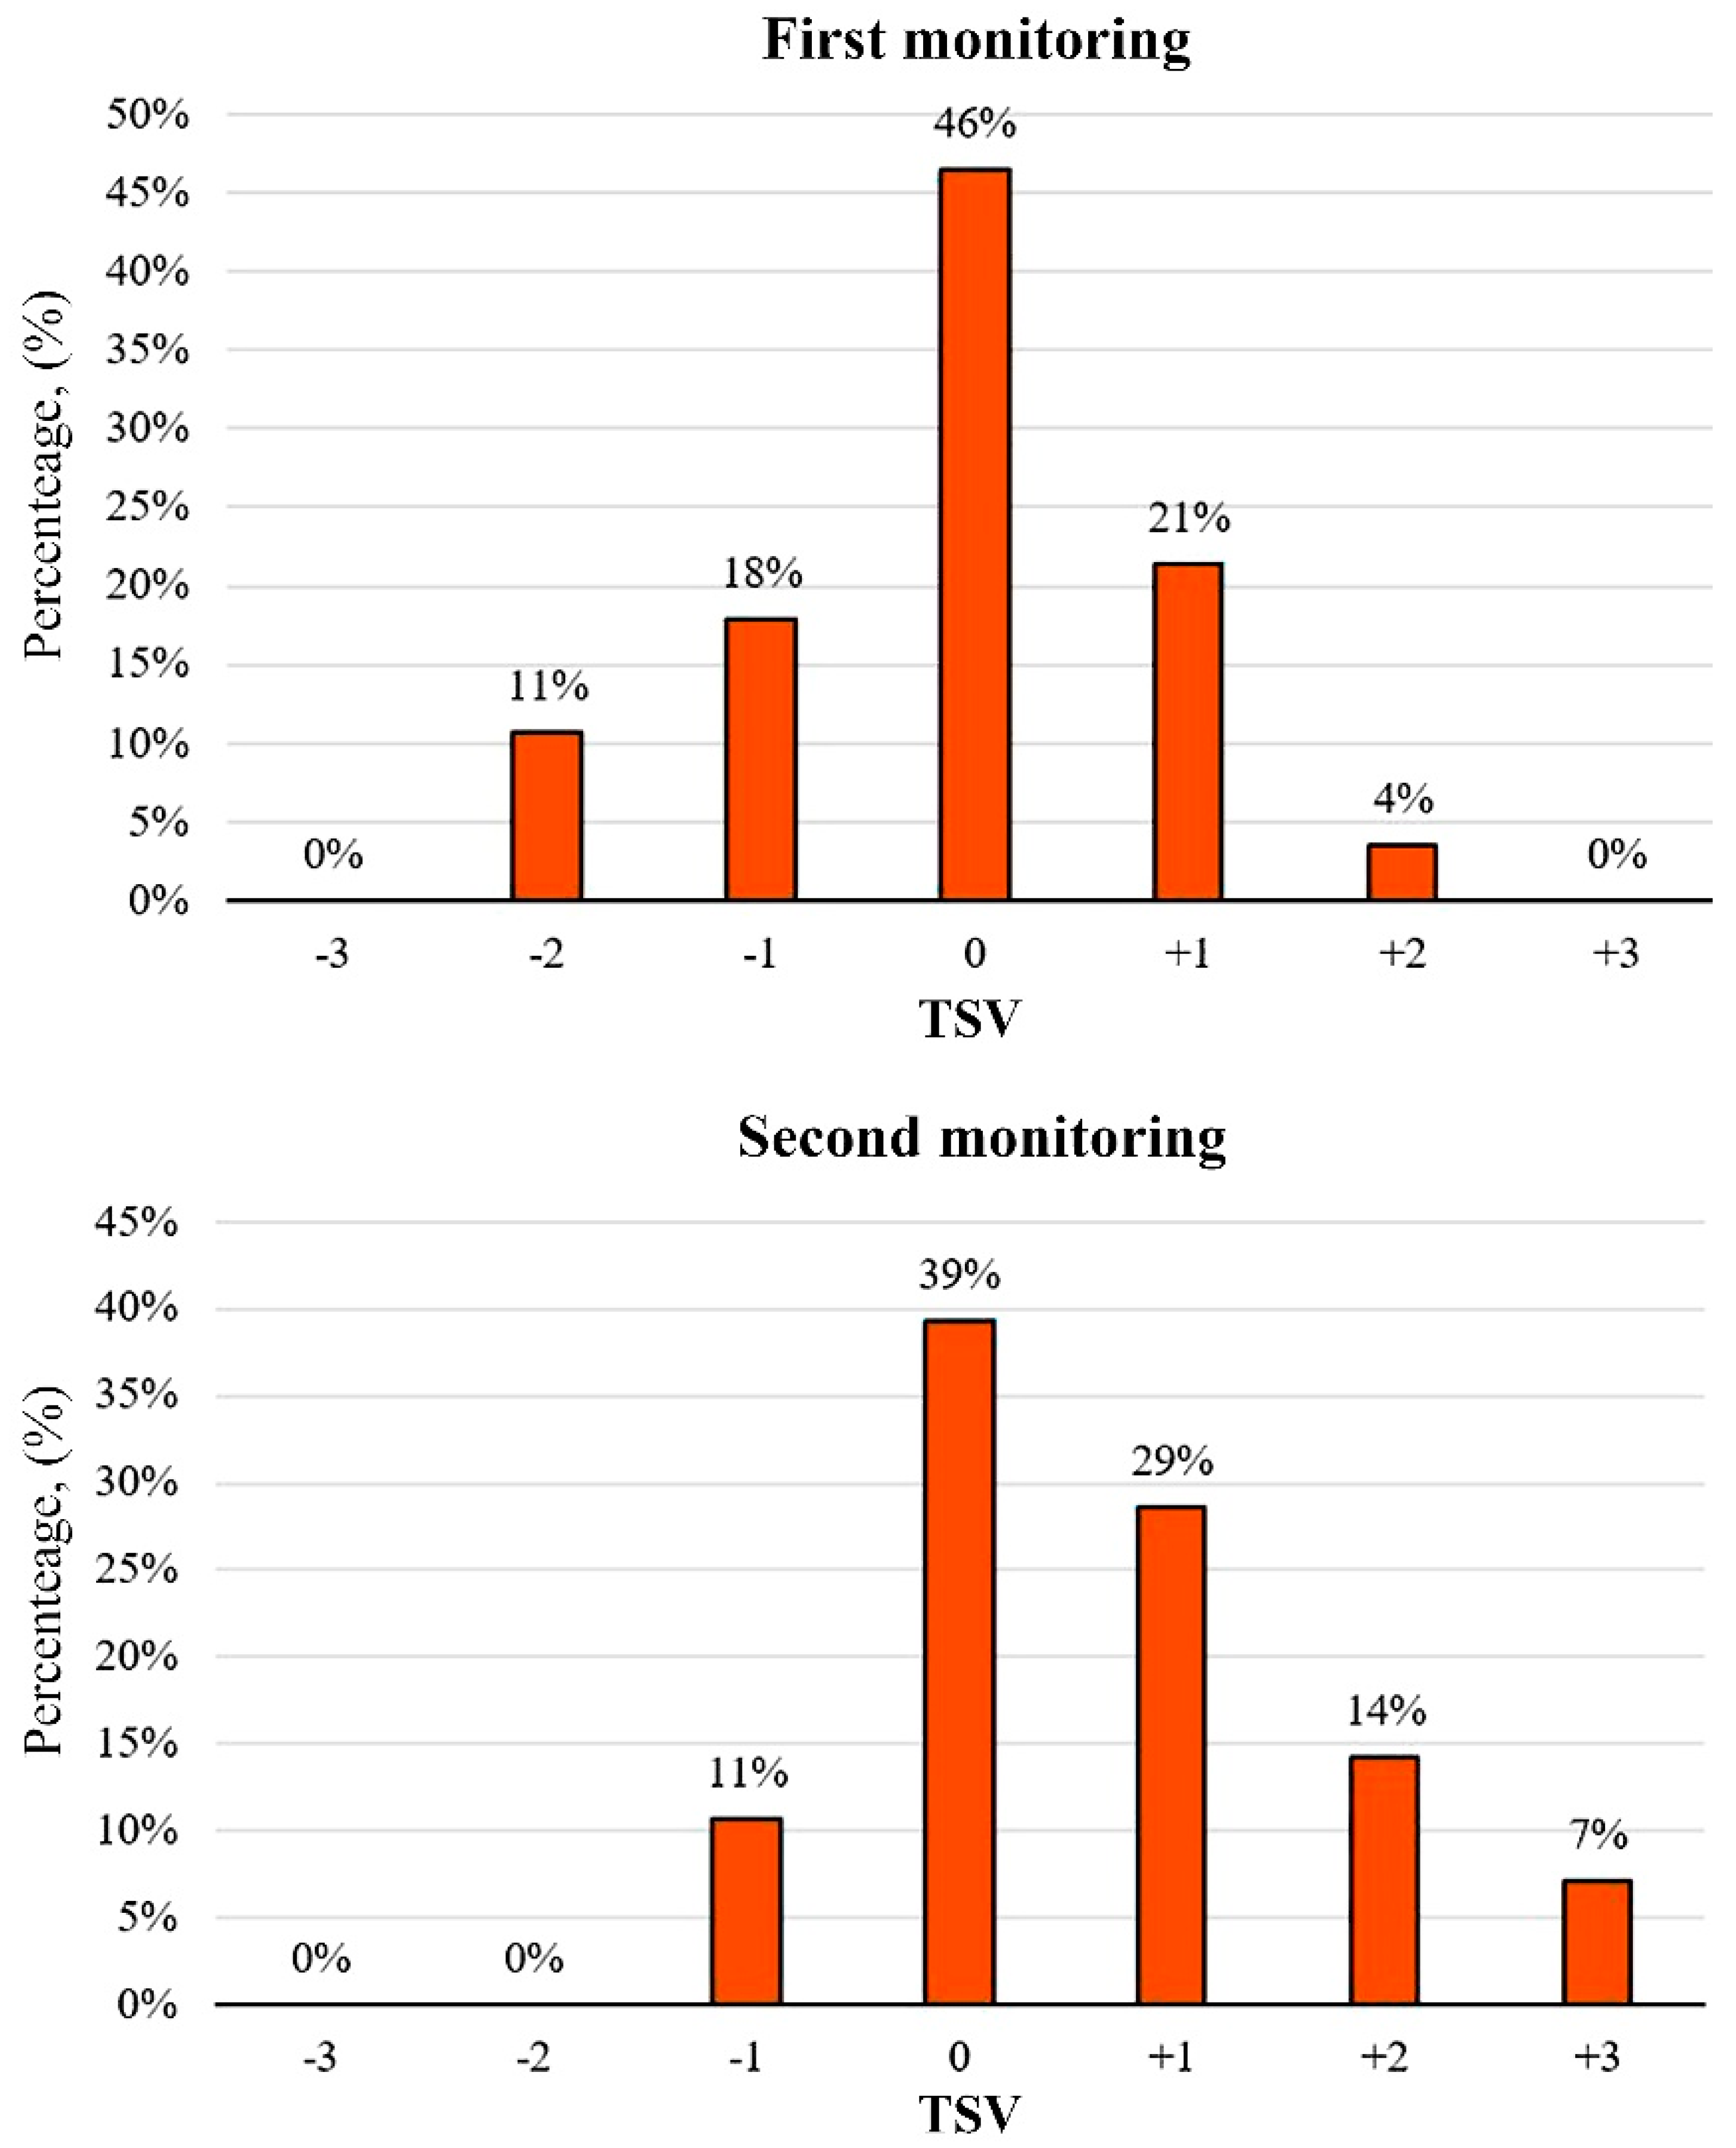
Thermal sensation votes (TSV) results during first and second monitoring periods are described in Figure 7. TSV showed that most of the users chose the neutral category (zero) option regarding thermal sensation perception; however, during the second monitoring period, the responses for the scale’s warmer pole categories increased in agreement with the higher temperatures registered during the second monitoring (approximately 1 °C).
Table 3 summarizes the results of TSV on a case-by-case basis. The average indoor air temperature during the first monitoring period was 15.82–23.51 °C and 17.37–24.94 °C during the second period. The average TSV reached −0.28 for the first period, and 0.49 during the second monitoring period.
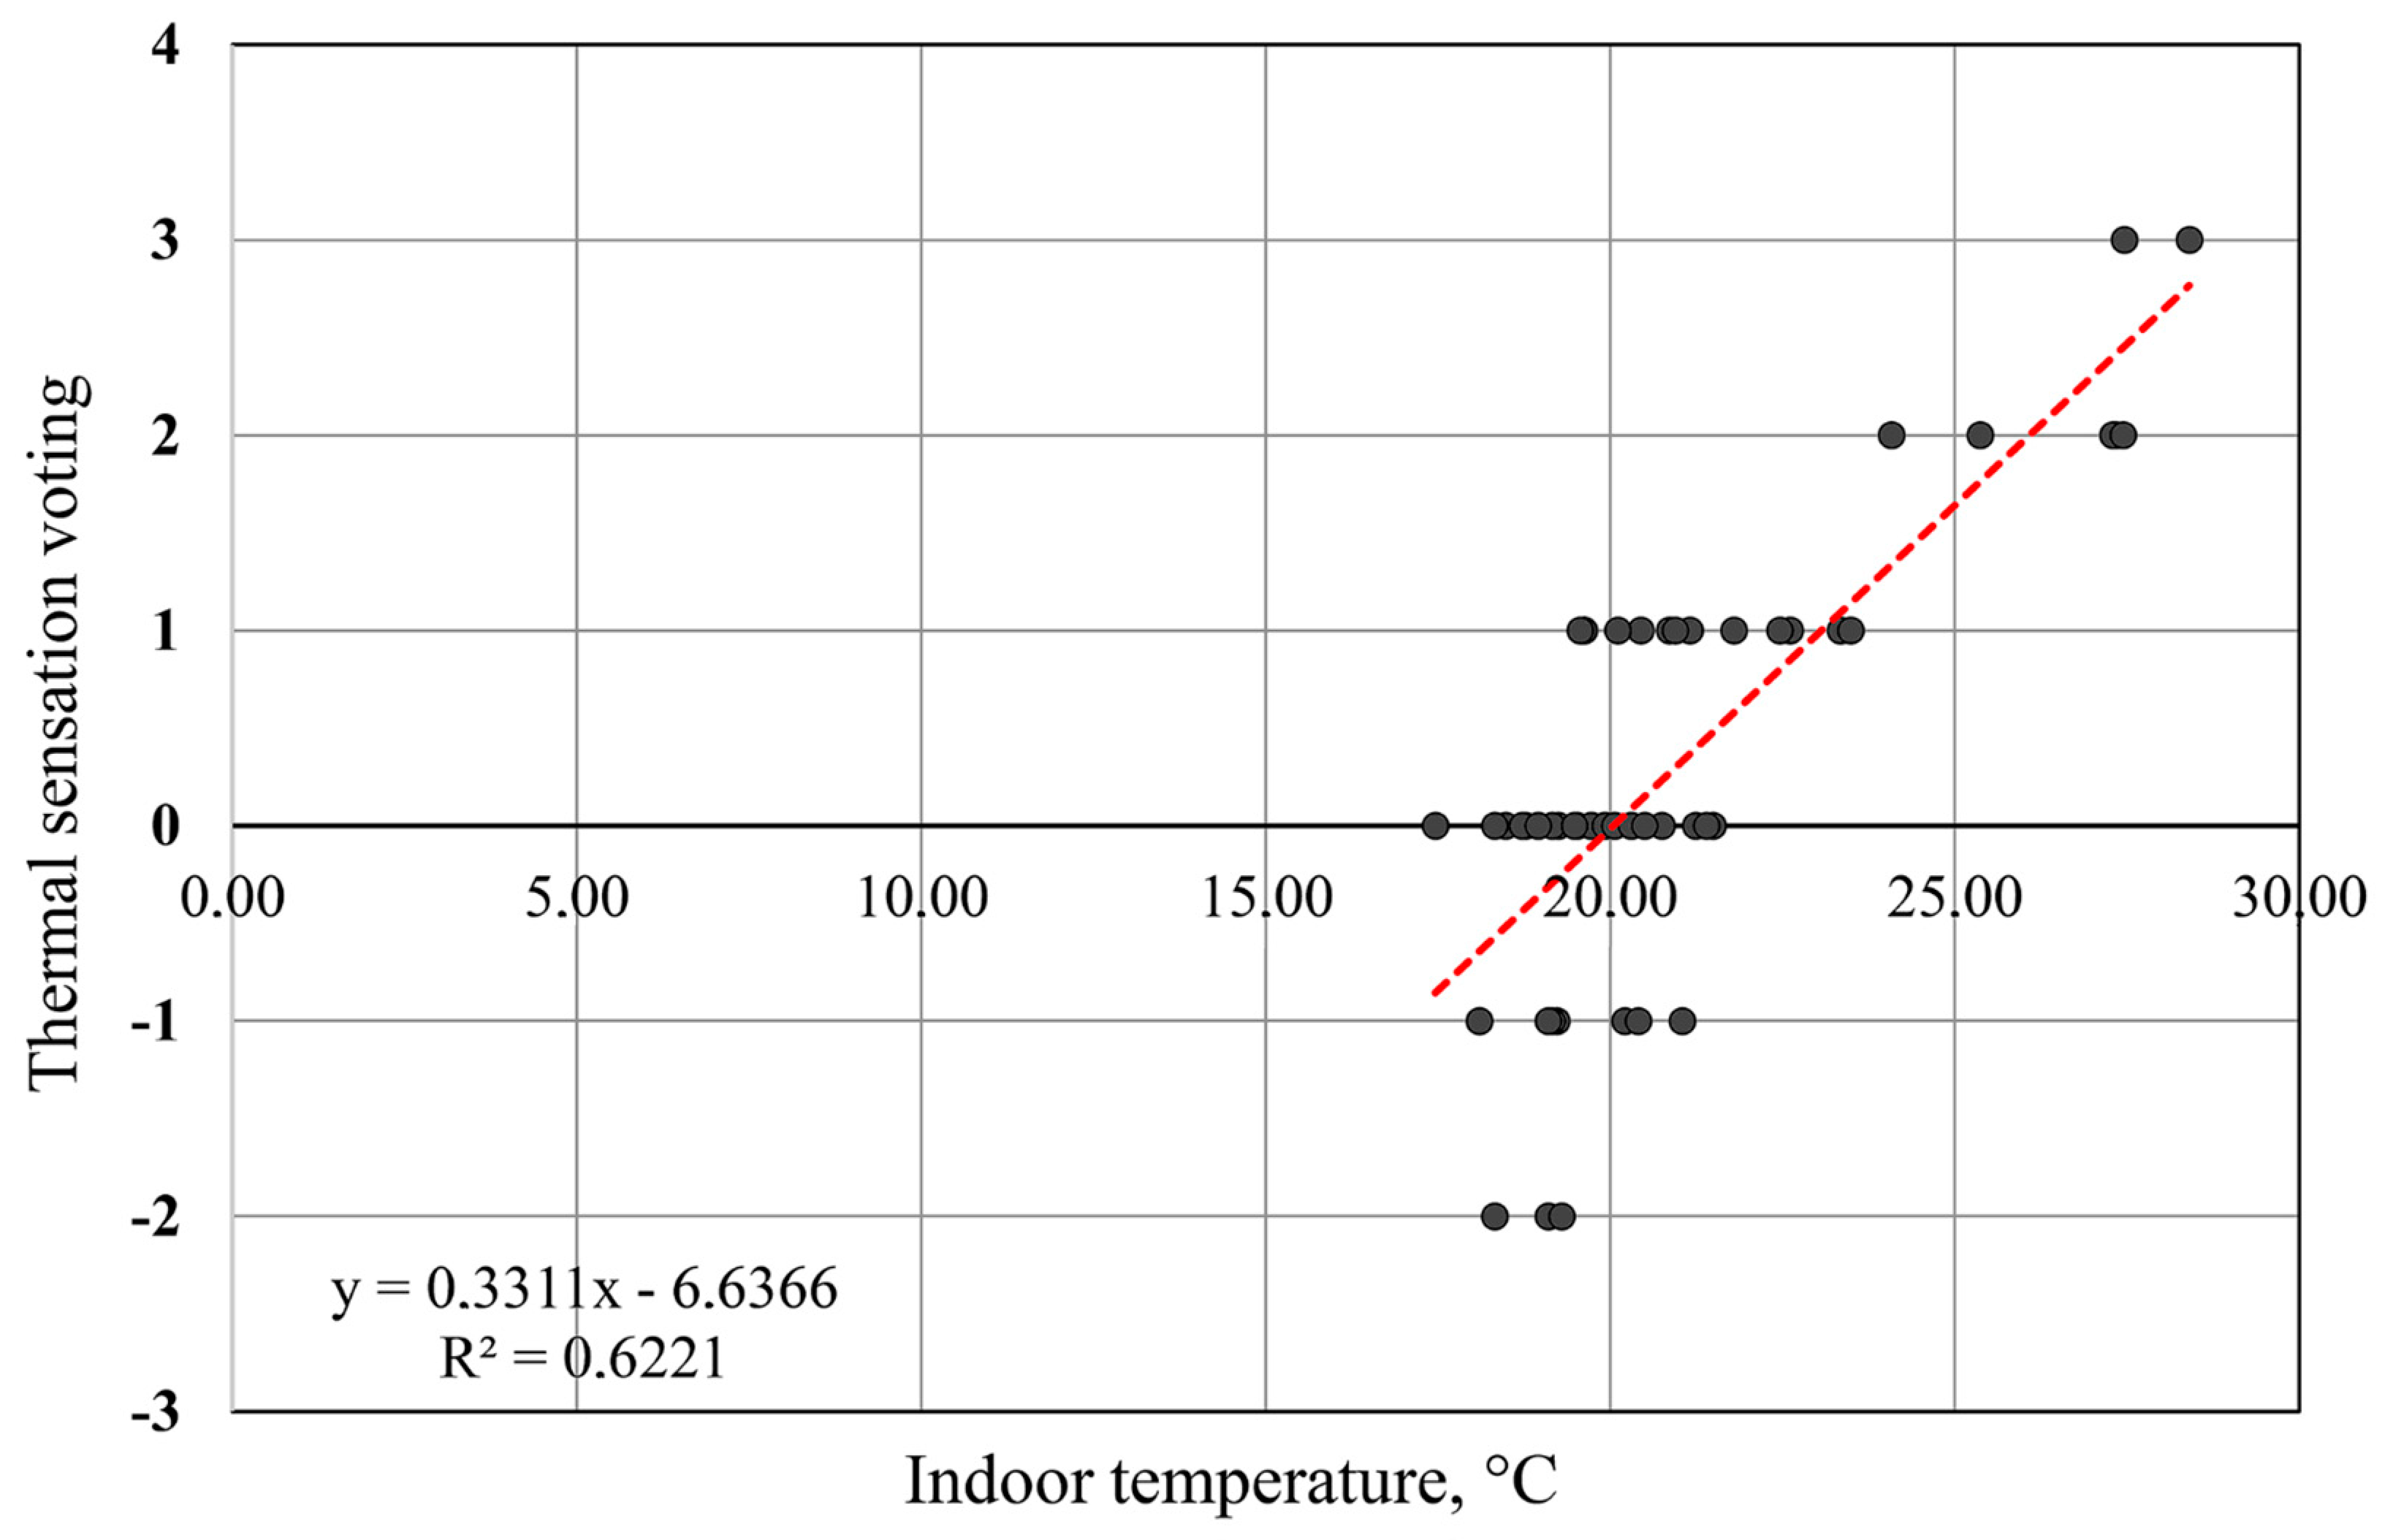
To determine the thermal comfort ranges, the value of Tn = 20.12 °C was considered with a determination coefficient of R2 = 0.62. R2 may vary as 0 ≤ R2 ≤ 1; R2 = 1 depicts the perfect adjustment (Figure 8).
Operative temperature ranges varied between 16.62 and 23.62 °C, with a PPD of 20% and from 17.62 to 22.62 °C with a 10% PPD.
Operative temperature values (To), according to ASHRAE-55 and EN-15251 with an adaptive method, are presented in Table 4. These regulations establish To values according to their own databases in terms of outdoor air temperature. To values can be noticed to be around 4 °C higher than in Tn according to TSV, which could be considered a real warmer thermal perception.
3.2.2. Indoor Air Quality
CO2 concentration registries (ppm) during both monitoring periods are presented in Figure 9. According to the measurements, CO2 concentrations in the social areas were lower than those registered in the master bedrooms; the mean maximum value in the social areas was 689 ppm and that in the master bedrooms was 860 ppm. A CO2 concentration of 454 ppm was obtained from the second monitoring period for both spaces.
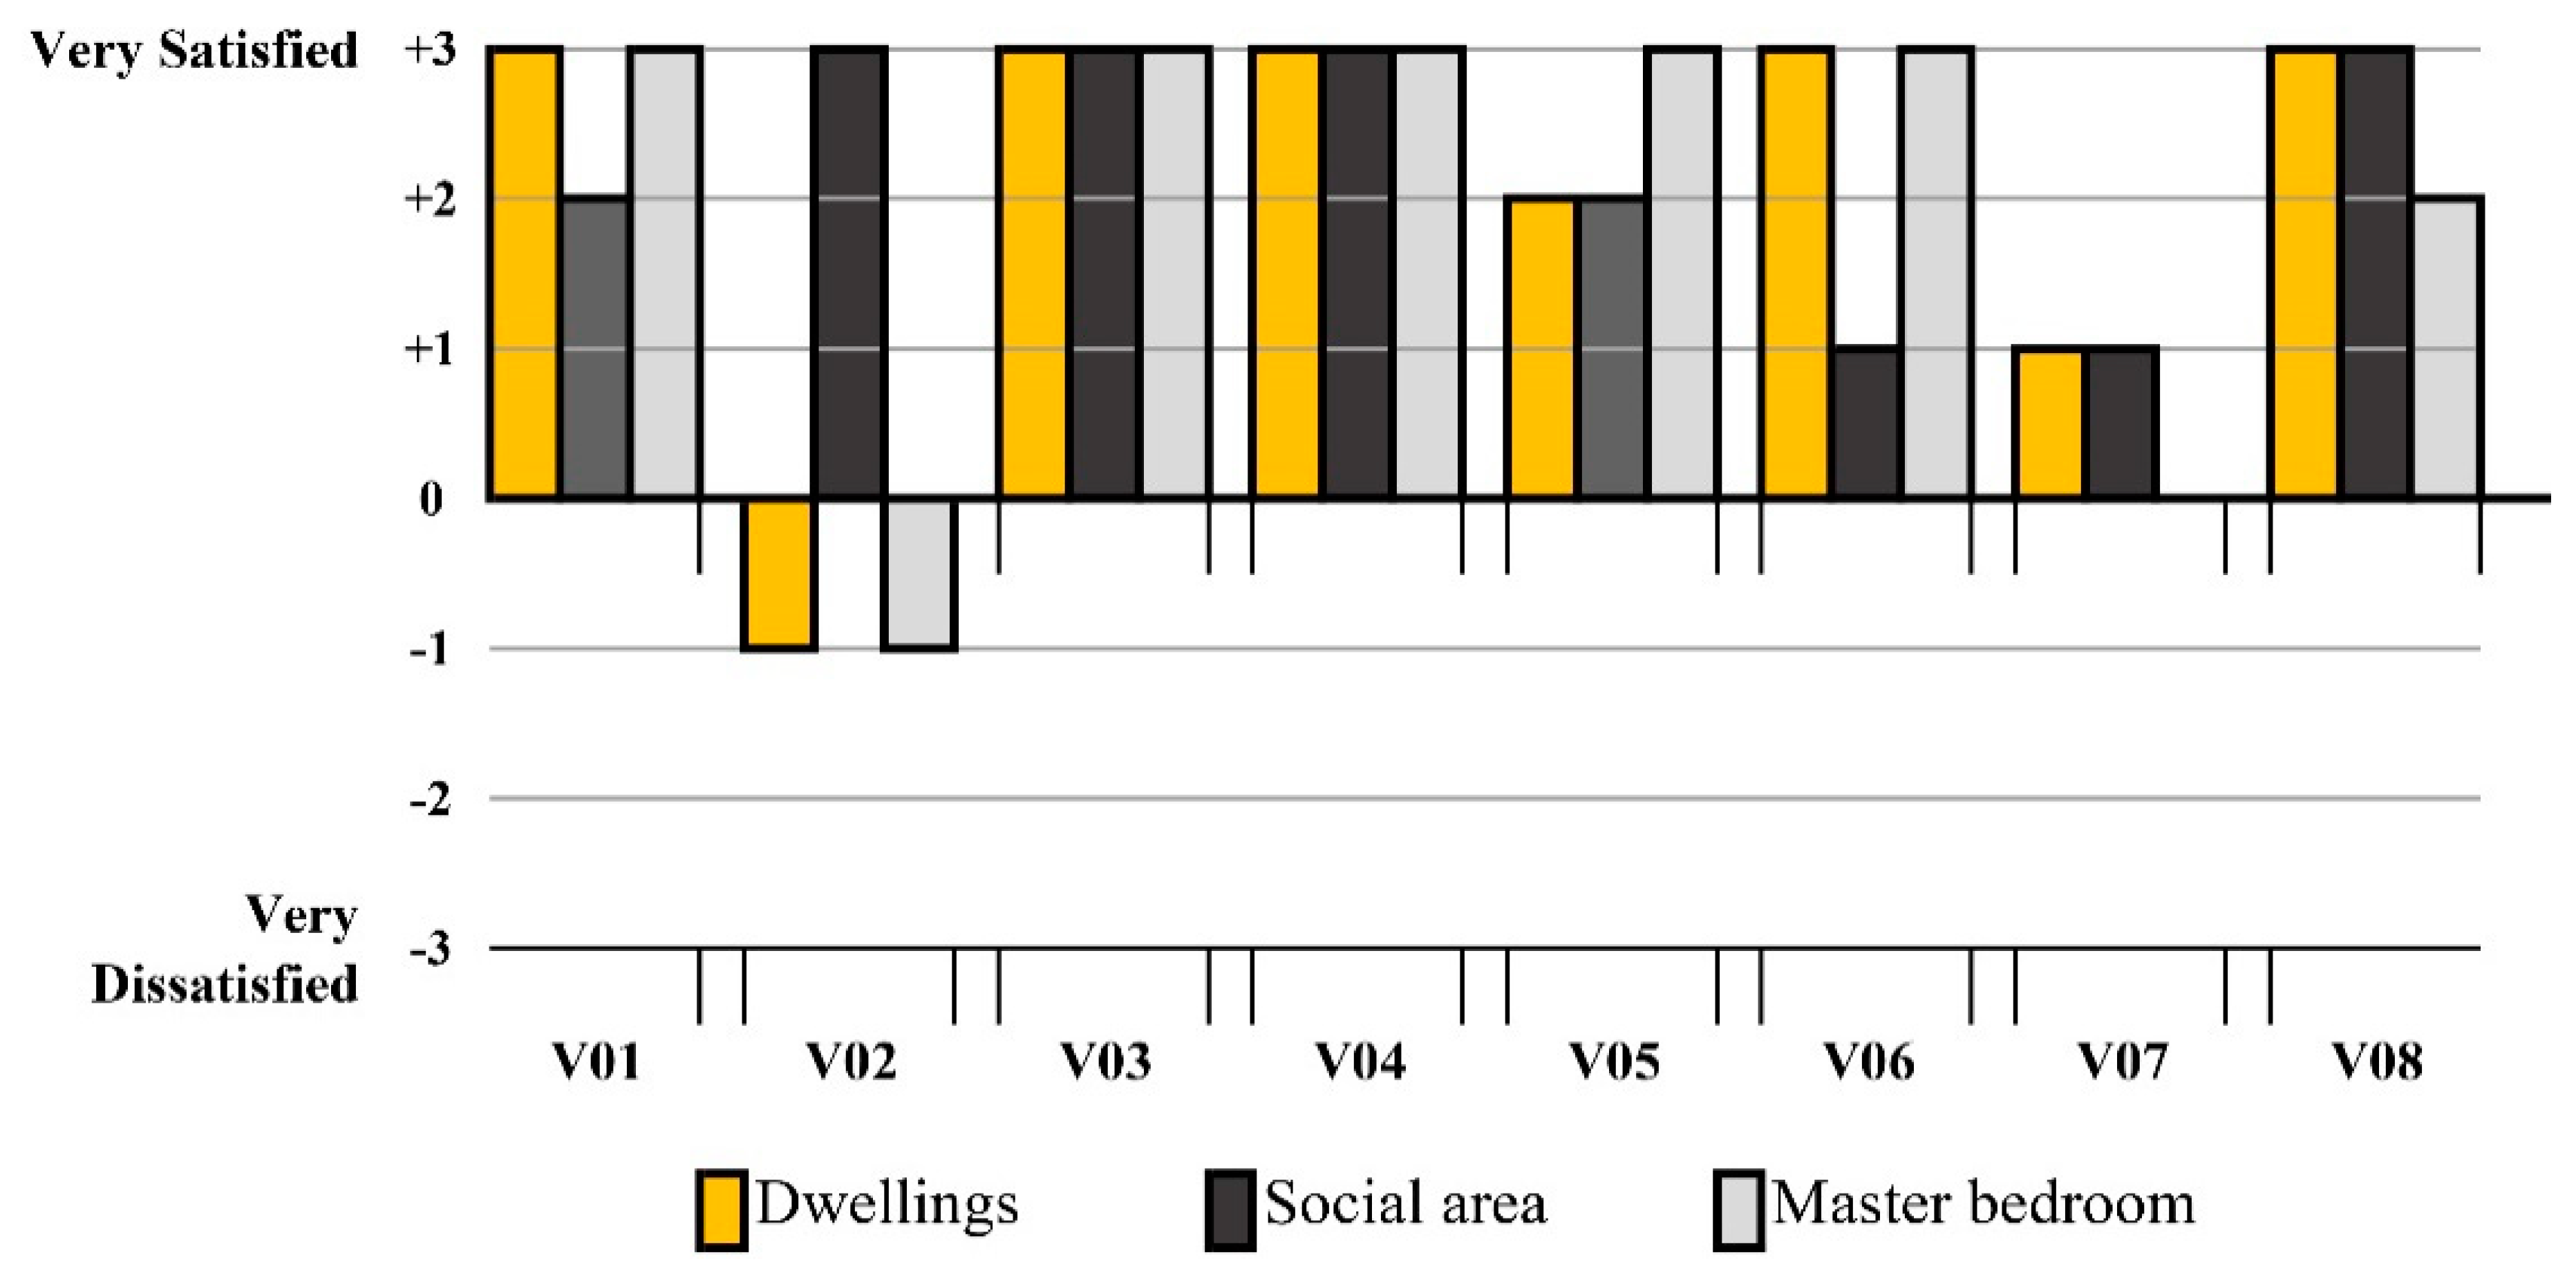
Regarding the comfort perception of indoor air quality, in general, positive answers were registered for analyzed spaces. Some cases, as seen in house 1, had a general perception that was not good, despite positive perceptions of air quality in the social area and the bedroom. Thus, this could be secondary to problems in other spaces, which were not studied. An adverse general perception in house 2 could have been influenced by the perception of the bedroom, and negative spatial perceptions registered in house 5 could have negatively influenced the general household perception. A comparison between of the houses is shown in Figure 9.
3.2.3. Natural Lighting
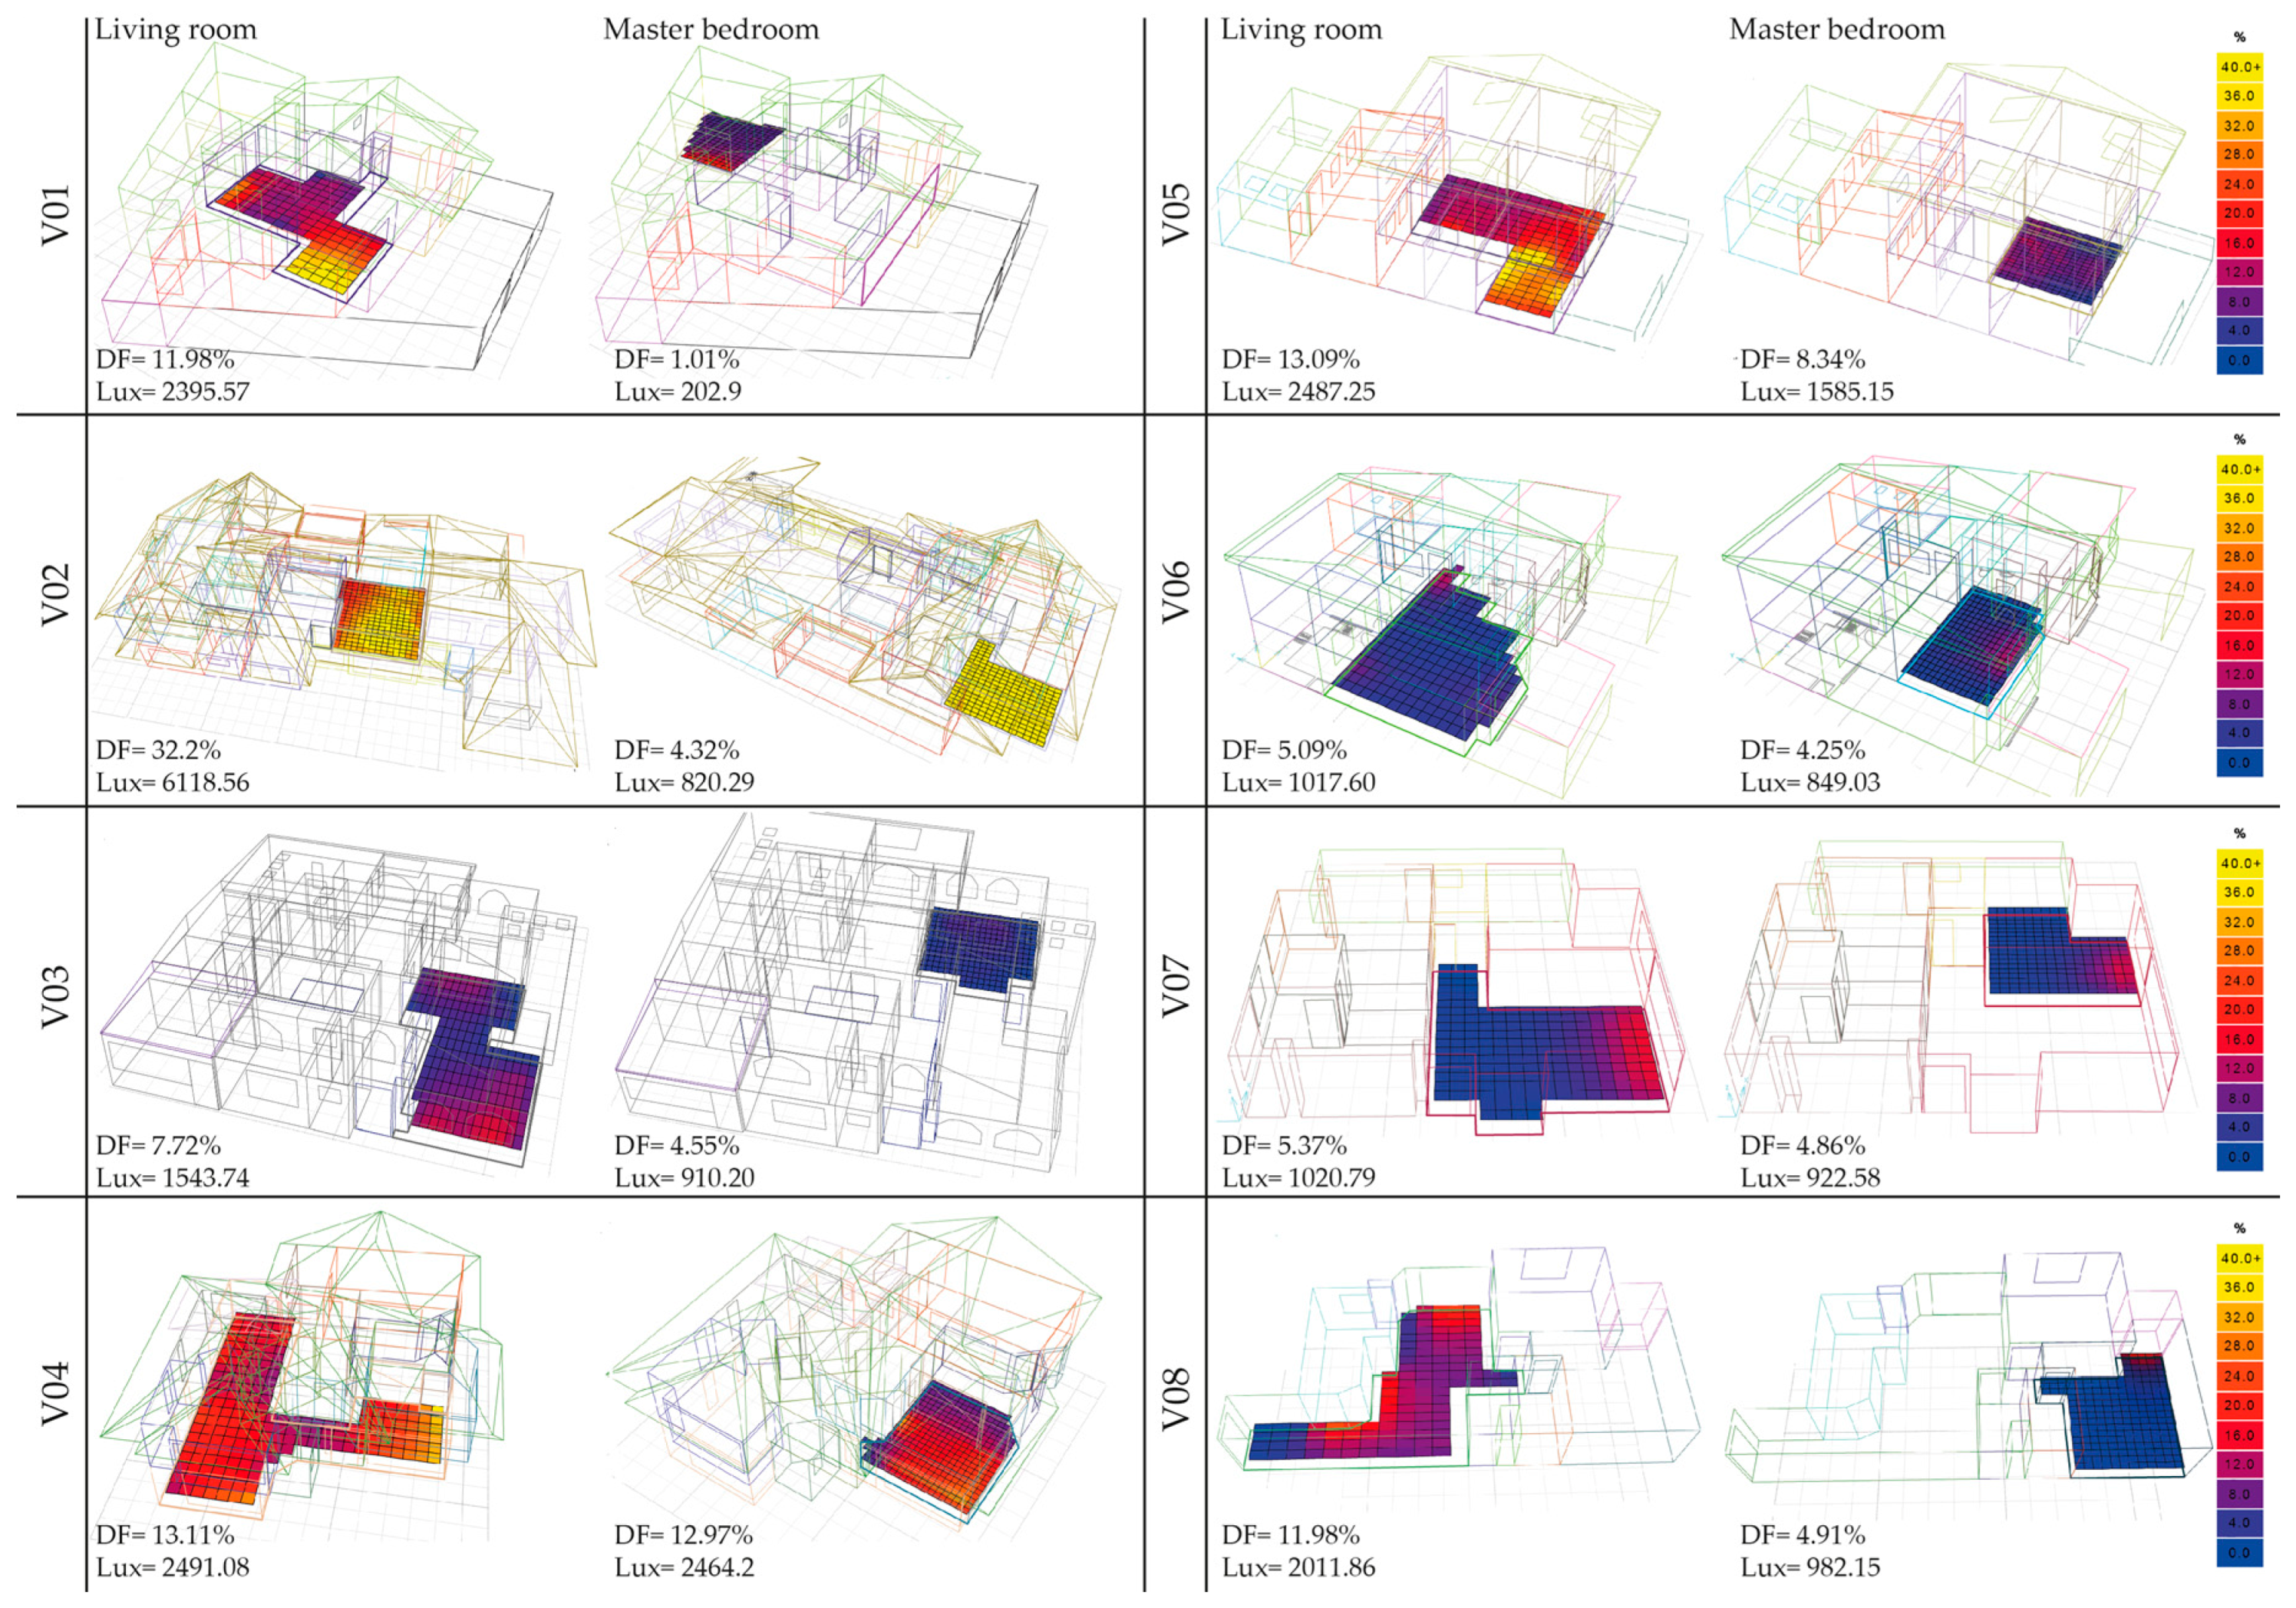
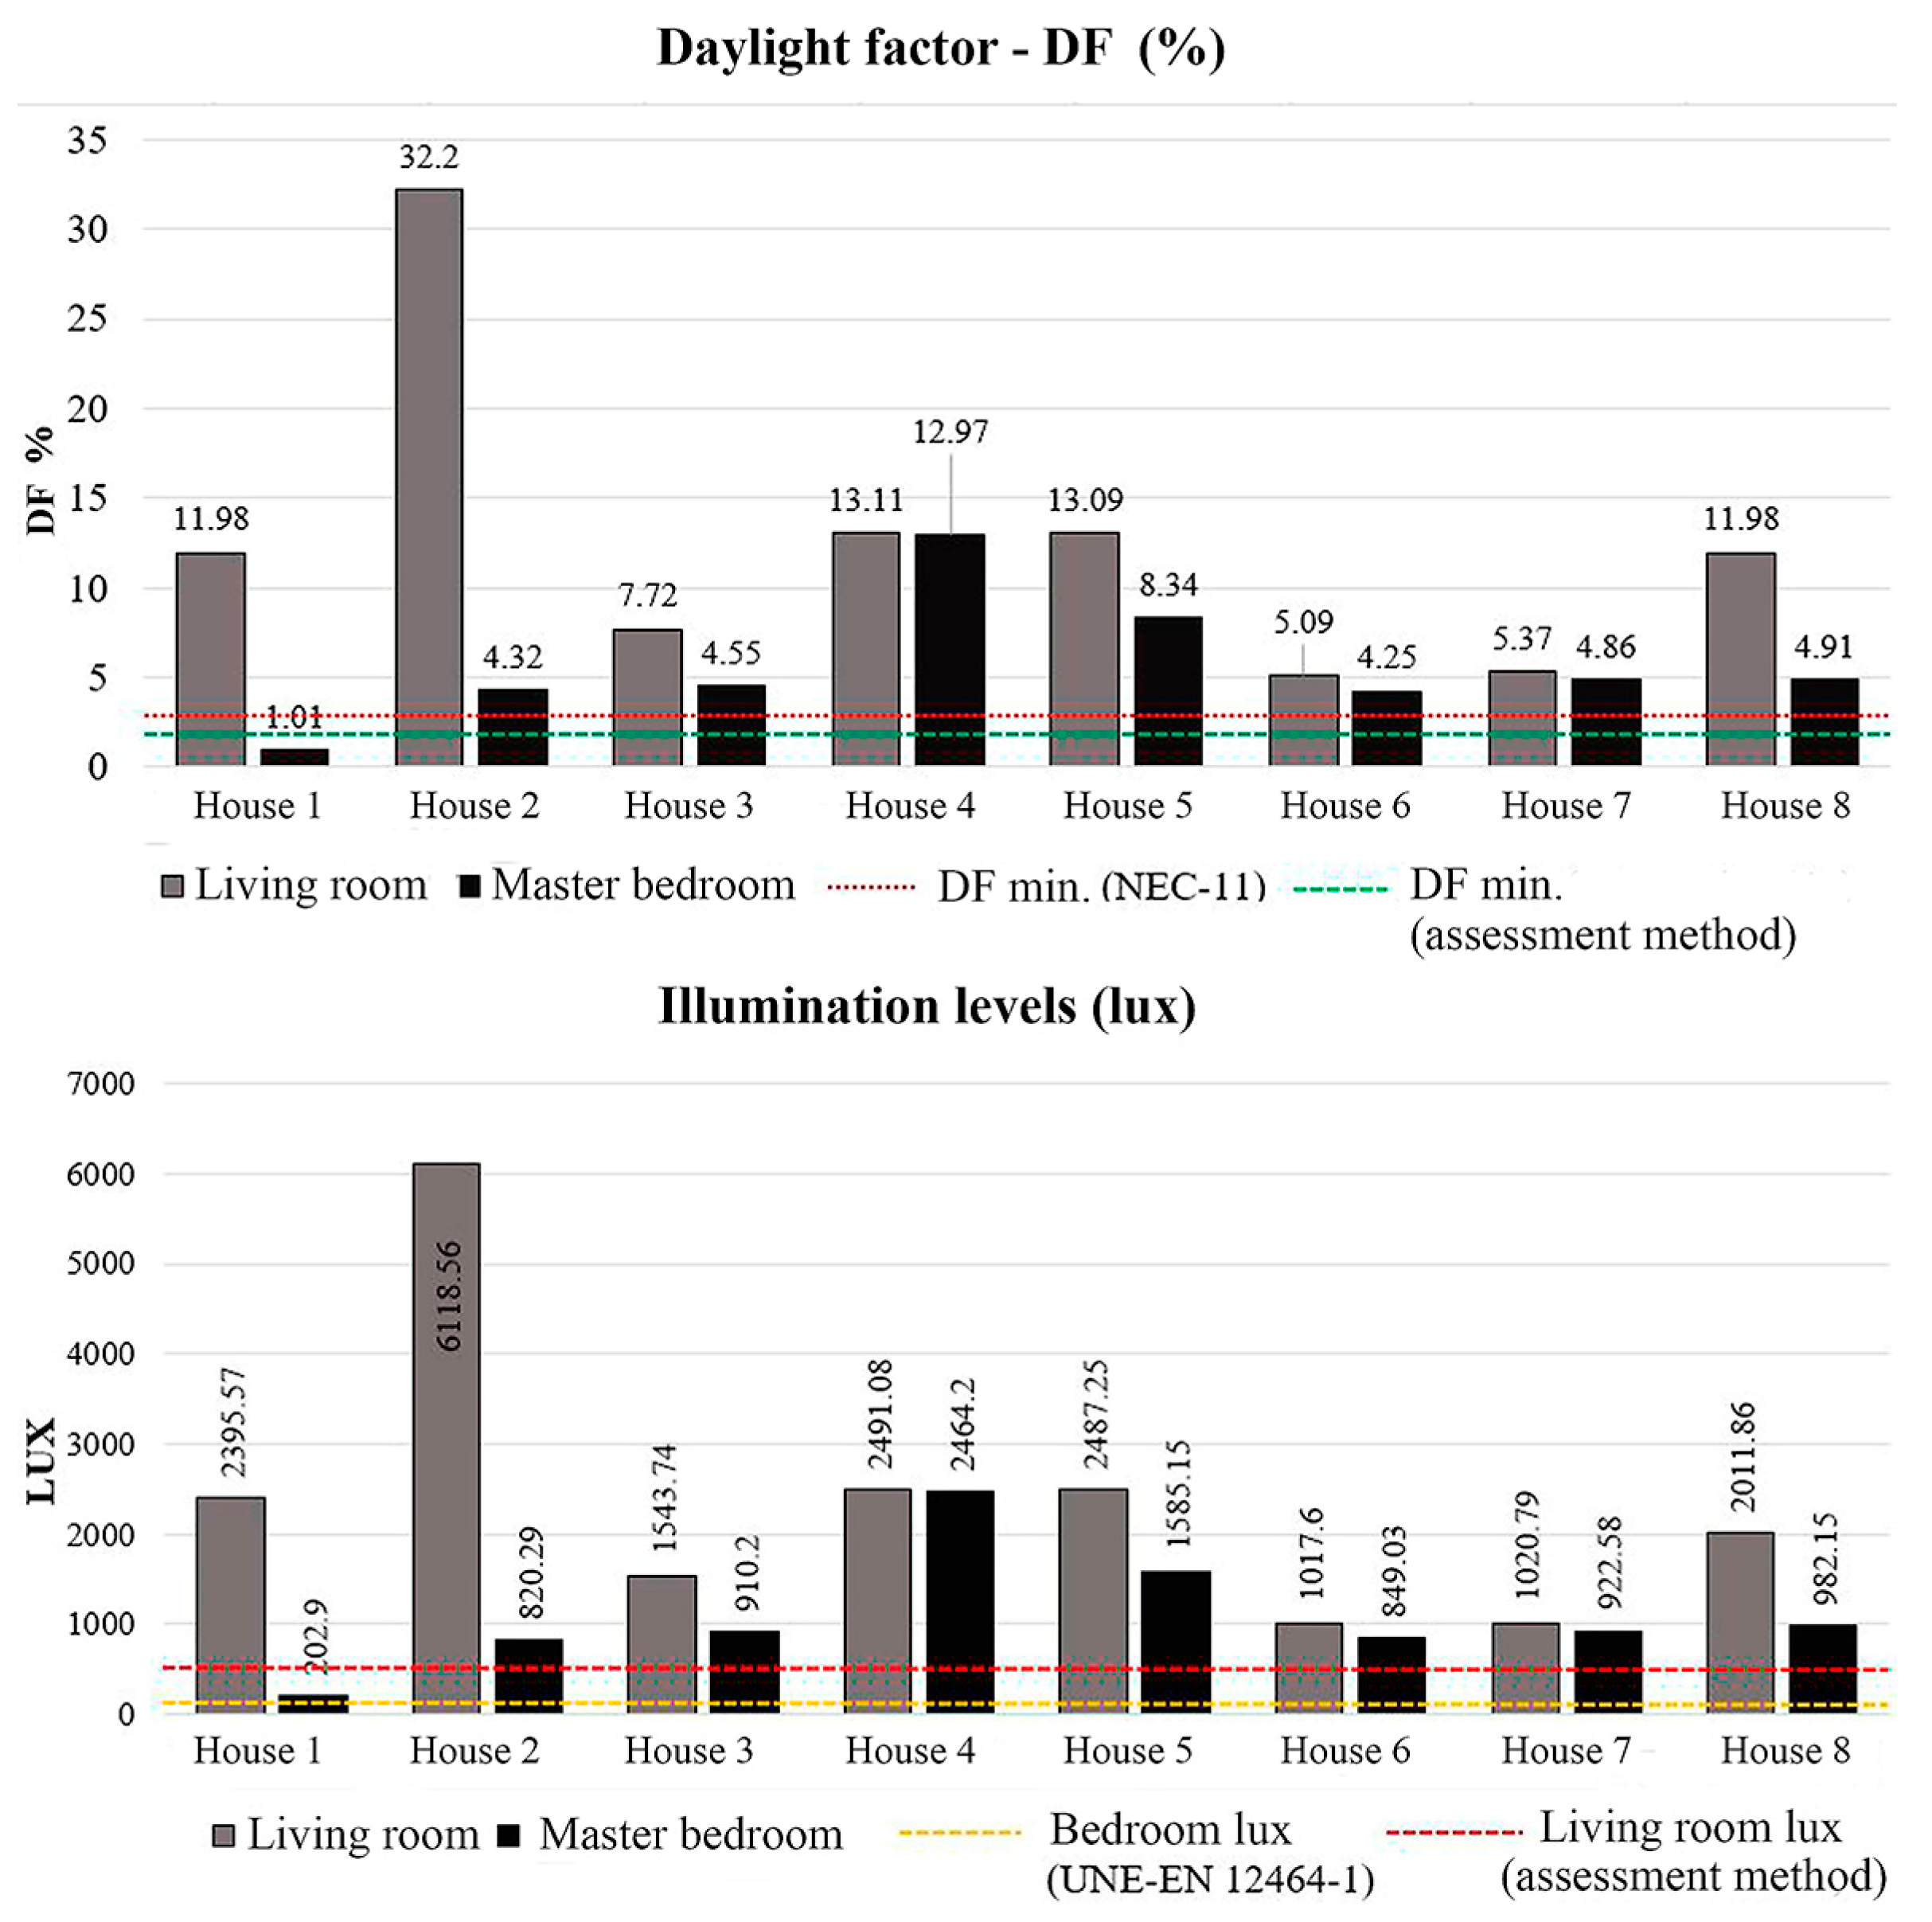
The DF values obtained through the simulations (Figure 10) showed that the bedroom of house 1 was the only room that did not comply with the minimum requirements, while houses 4, 5, and 8 had high DF values. A special case was found in house 2’s social area, with a DF above the mean because it had zenithal direct illumination. All illumination levels of the observed houses fulfilled the minimum requirements for the social areas and master bedrooms. Details of the comparison of the DF simulation values and the regulation limits can be seen in Figure 11.
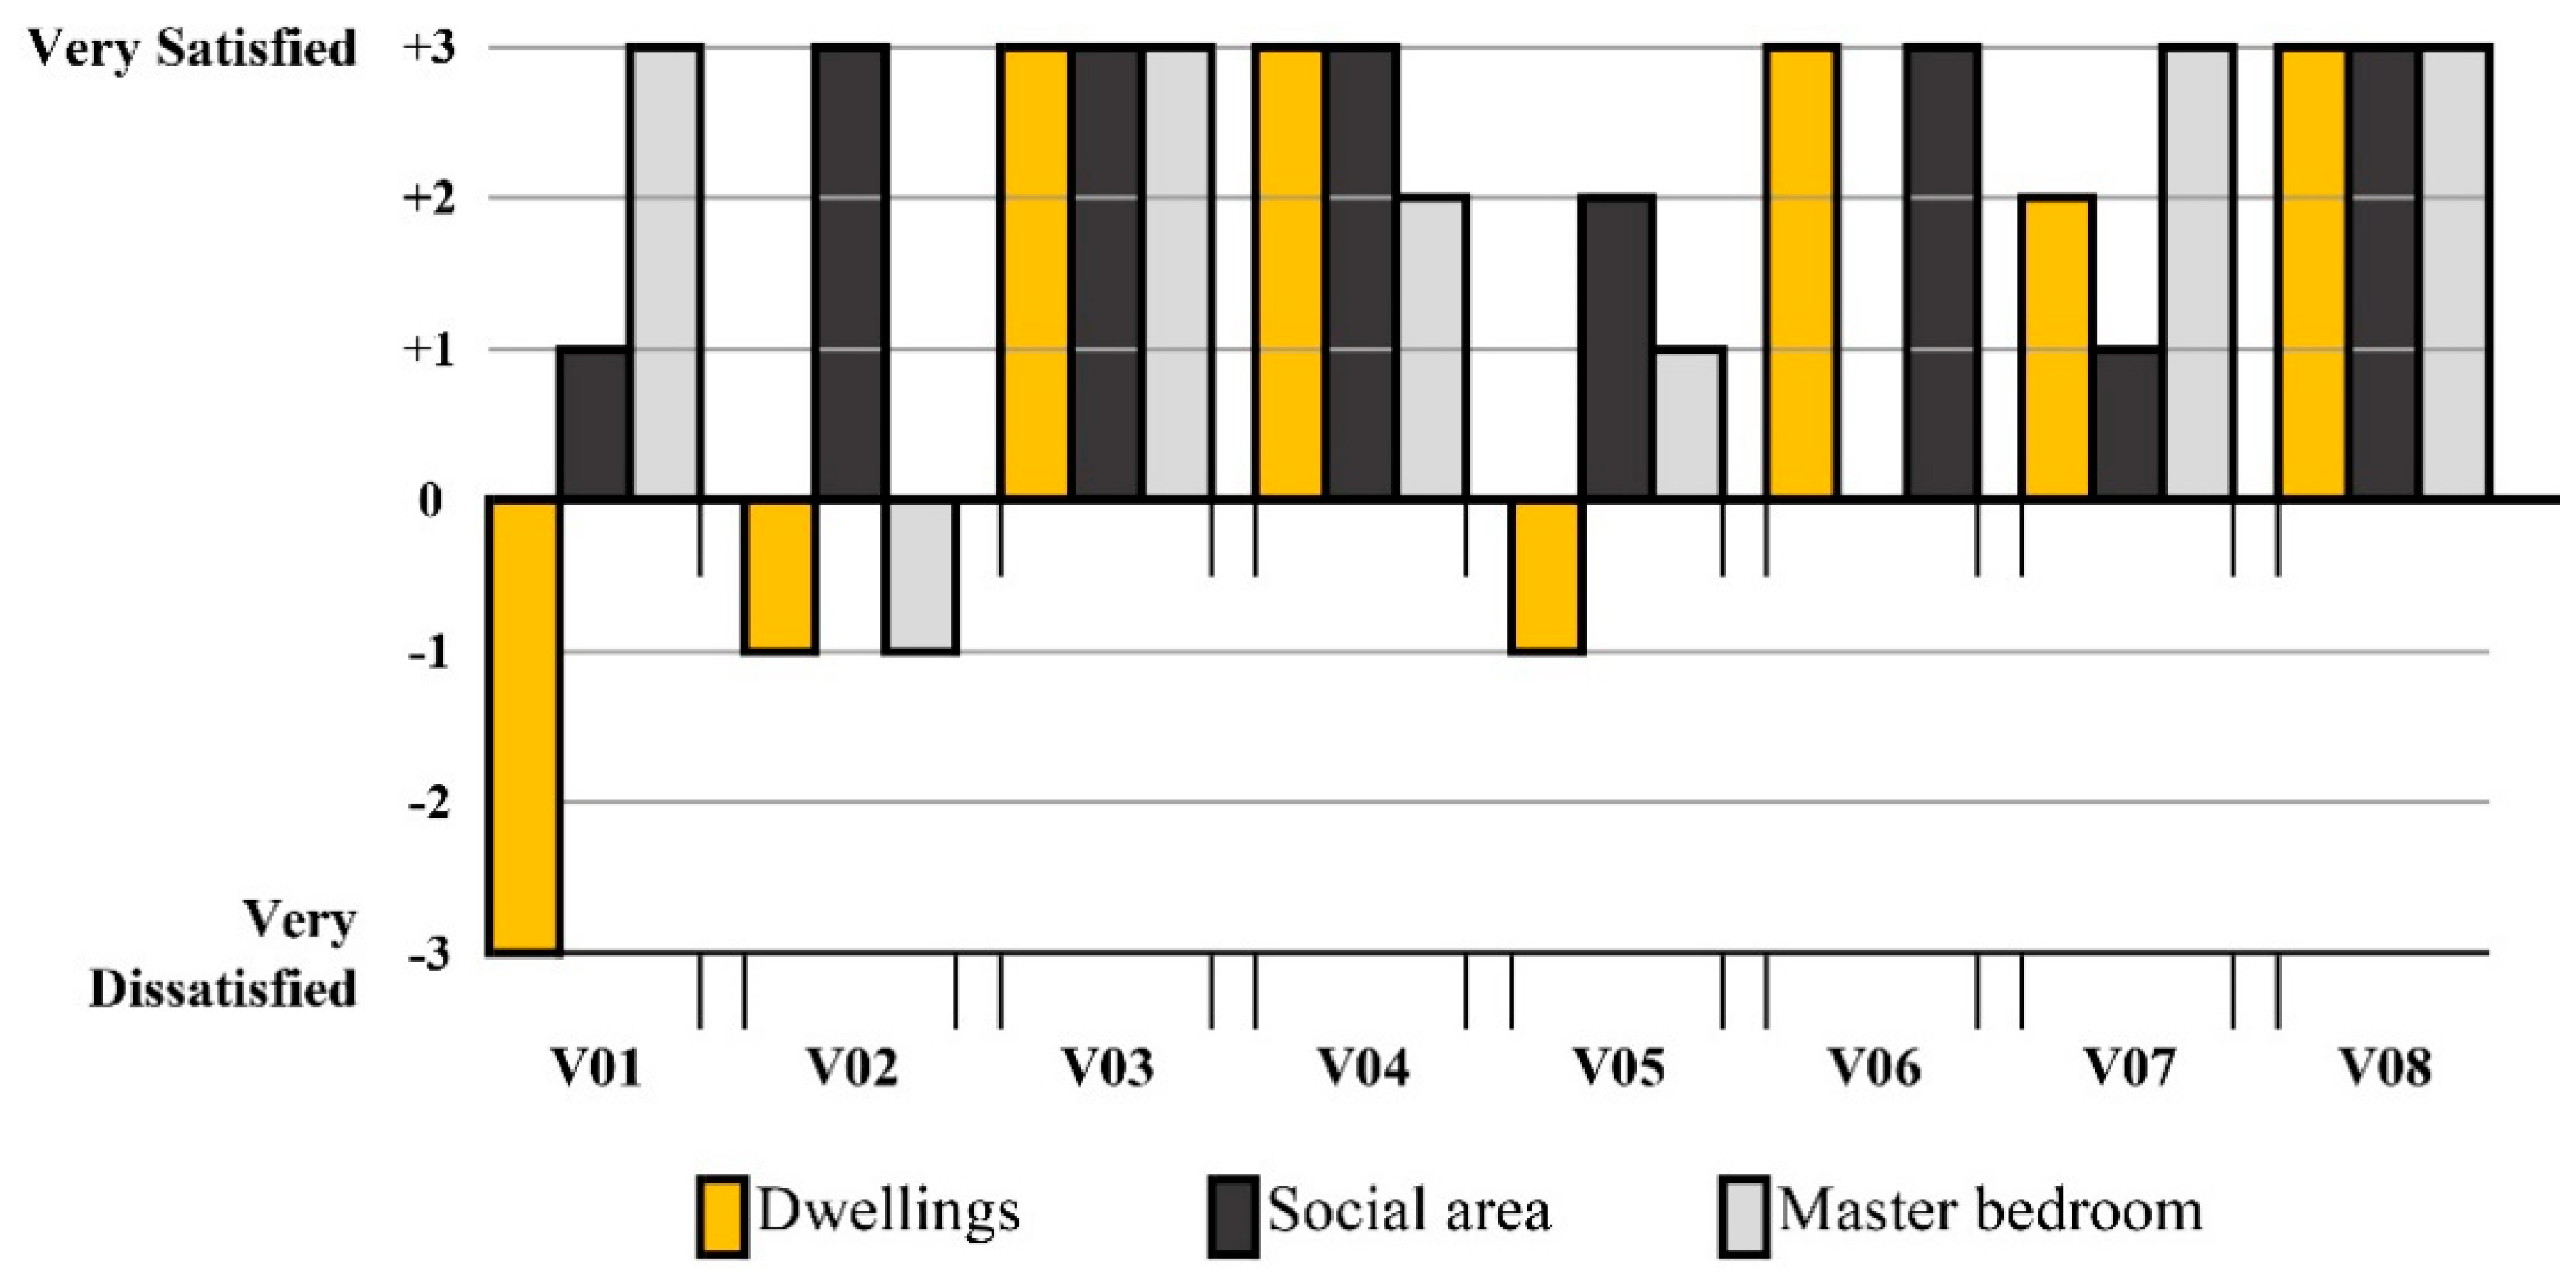
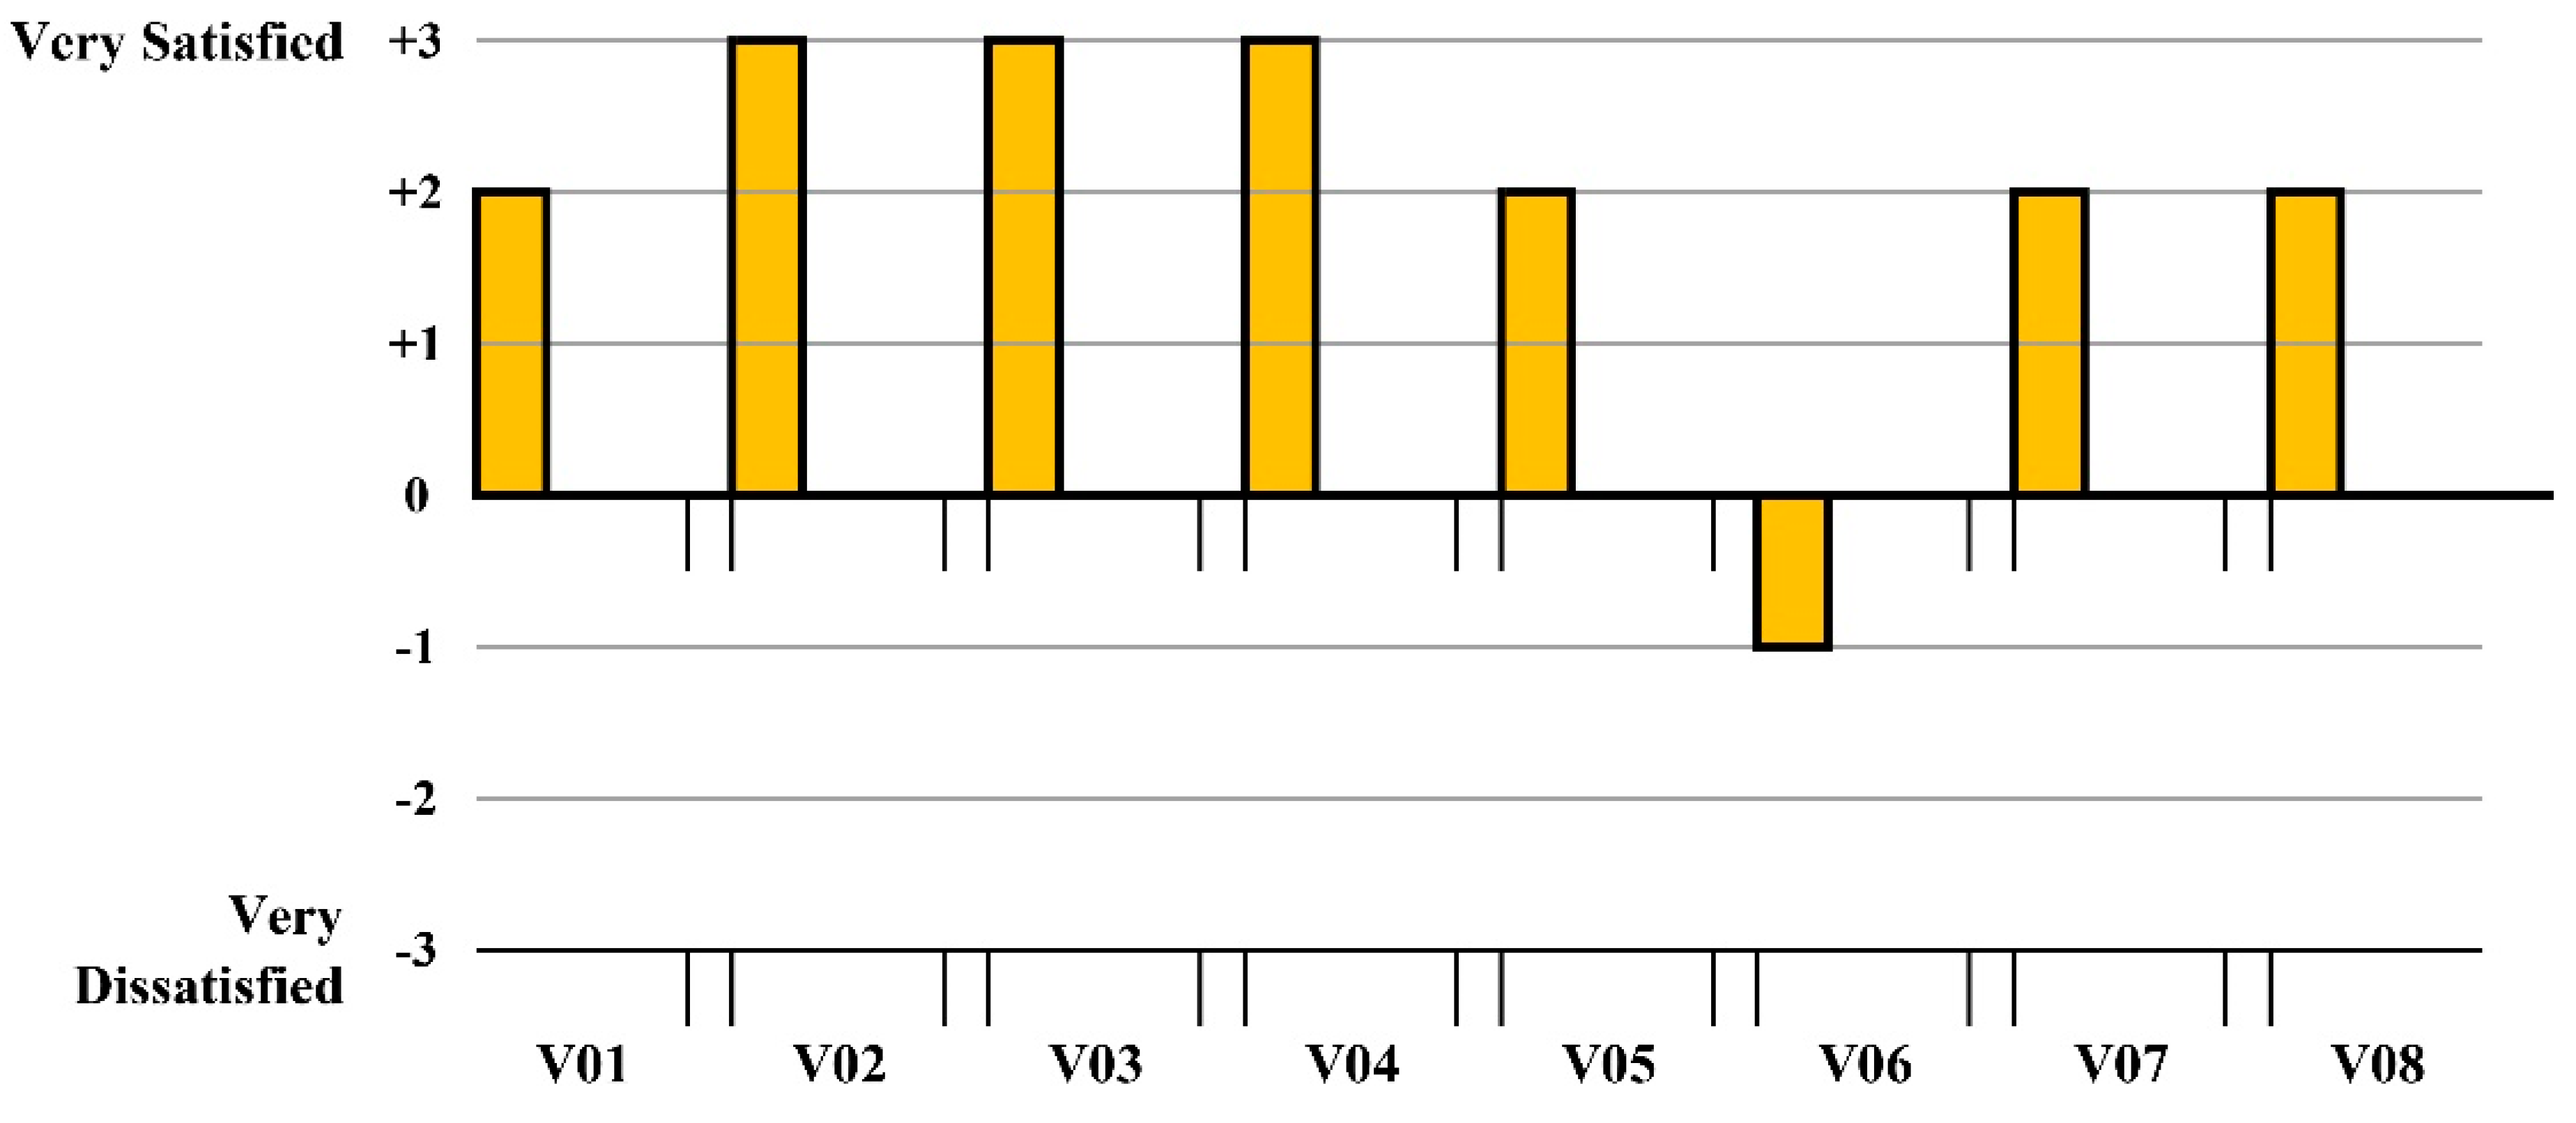
The users’ visual comfort perceptions were assessed with regards to two aspects: natural illumination (Figure 12) and visual comfort (Figure 13) as regards glare control, reflection, and contrast. Positive estimates were found in most houses, but the illumination conditions of house 2’s social area were not satisfactory. Houses 6 and 7 had spaces that could be improved to completely satisfy the users. Regarding visual comfort, house 6 was the only house that users considered unsatisfactory.
4. Discussion
Through a comparison of the level of compliance of each house, based on local and international regulations, with the experiences of the users, it can be seen that these do not maintain a clear relationship. As shown in Table 5, the house that fulfilled all the standards of the analyzed regulations did not receive the highest score in the users’ global satisfaction assessment. Houses 3, 4, and 8 had the best user perception scores, despite their problems with fulfilling regulations.
Data was from applied questionnaires and environmental monitoring. The level of regulation fulfillment and user perceptions suggested that those analyzed characteristics did not have extreme problems with IEQ, because all of them complied (totally or partially) with established standards. Satisfaction, with respect to certain factors, did not have extremely negative scores (−3). The results obtained may be tied with the environmental conditions of Cuenca, which are still within ranges.
Independently analyzing each IEQ aspect, it was determined that users were satisfied with the indoor air quality and natural illumination of their houses, and that indoor temperature was the biggest problem regarding comfort.
4.1. Thermal Comfort
According to the performed measurements during the two stages of monitoring, external mean temperature was determined to be 15.20 °C for the first period, and 16.47 °C for the second period. With regards to indoor temperature, the arithmetic mean was 18.77 °C for the social area and 18.89 °C for the bedrooms. For the second monitoring period, these values were described to be 19.80 °C and 20.16 °C, respectively. An increase of 1 °C was registered between the first and second monitoring periods.
Although there was a minimal difference between the two periods, users’ thermal sensation varied. Comfortable temperature perceptions (0) were reported by 46% of users, and 39% reported it as acceptable (+1, −1). During the second monitoring period, the percentage of comfortable perceptions decreased to 39%, and 40% of people who qualified thermal sensation as acceptable, but with a clear tendency towards the warmer side of the scale. Users showed an adaptive disposition to feel comfort with lower temperatures than those established in regulations as a response to environmental conditions relating to the Andean climate in Cuenca. Nevertheless, all houses were close to the average established comfort temperature most of the time.
Relative humidity values were acceptable during both monitoring periods; in part, because the influence on hygrothermic comfort was not perceptible for users. The maximum and minimum RH values were established as 39.11 and 65.62%, according to average environmental registries during monitoring the period. For local conditions, it was feasible to establish an accurate range between 40 and 65%.
4.2. Indoor Air Quality
Most values kept below the limits, despite some exceptions during non-representative periods. The social areas of the houses had better air quality conditions according to this criterion, because CO2 concentration ranges were lower than the optimal limits described by the NEC-11 regulation [13].
The registries suggested that an increase in CO2 concentrations at certain times of the day corresponded to the use of space instead of constructive characteristics, because those concentrations increased in social areas during the day, and inside bedrooms during the night, which corresponded to the places of permanence during the day.
CO2 concentrations were around 1000 ppm in some cases at night. House 6 had the highest concentrations peaks, which coincided with the lower percentage of opened windows. The optimal maximum CO2 concentration was established as 614.25 ppm for local conditions.
4.3. Visual Comfort
This study found that not all rooms with a minimum DF of 3% fulfilled users’ optimal expectations. Data based on household social areas determined this value as optimal once DF was proven to be above the limit of the registries. A minimum DF of 4% was established for the master bedroom, according to the arithmetic mean of registered values under 5%. Previous studies determined that thermal gains or glare problems must be reviewed when values are above 5%. All houses fulfilled regulations for illumination levels (lux) with higher values than those established. Thus, 300 lux was considered as a convenient local standard for both rooms.
The analysis of comfort perception regarding glare showed that a low rating was related to the absence of shielding systems to reduce glare in windows, especially with an east–west orientation. In addition, it could be noted that the high records of levels of visual comfort (high values of DF and lux), were given due to the process of adaptation to local solar radiation conditions.
4.4. Comfort Levels
The results presented in this study show that appropriate levels of comfort can be defined for the place of study. Table 6 summarizes the adapted standards for urban houses at Cuenca according to all the aspects affecting indoor environment quality.
5. Conclusions
Throughout the study, the aim is to contribute to the field of research in the building assessment, emphasizing the contribution to the understanding of problems present in the interior environment of houses. The results revealed that users showed an adaptation disposition to feel comfort with lower temperatures than those established in regulations as a response to environmental conditions relating to the Andean climate in Cuenca. All houses were close to the average established comfort temperature, most of the time. Nevertheless, there were specific moments with important temperature variations, which caused problems in the thermal comfort of users. It is necessary to implement new conditions that prevent extreme temperature variations, or mechanisms that allow the modification of some housing characteristics, to face high or low outdoor temperatures when necessary. A house with static conditions makes users vulnerable to adverse weather.
Regarding natural lighting, comfort values of daylight and daylight levels were determined as more demanding due to the direct and permanent solar incidence in this geographical latitude.
Finally, as for the results of indoor air quality, there were higher comfort values than those described in regulations because of the non-extreme outdoor pollution indexes and climate conditions, which allow the use of natural ventilation methods at any given time.
This document could be considered as a guide for housing design; however, it is necessary to carry out more research and specific studies according to the type of housing or construction system.
Supplementary Materials
The following are available online at https://www.mdpi.com/2075-5309/8/7/90/s1.
Author Contributions
Conceptualization, D.B., F.Q. and M.L.; Methodology, F.Q.; Software, D.B.; Formal Analysis, D.B.; Investigation, D.B.; Resources, D.B.; Writing-Original Draft Preparation, D.B.; Writing-Review & Editing, D.B.; Visualization, D.B.; Supervision, F.Q.; Project Administration, F.Q.
Funding
This research received no external funding.
Acknowledgments
This study was carried out with the data obtained from the research project “Certificación Edificio Sustentable y Seguro”, supported and financed by the Research Directorate of the University of Cuenca (DIUC).
Conflicts of Interest
The authors declare no conflict of interest.
References
- Wong, S.-K.; Wai-Chung Lai, L.; Ho, D.C.-W.; Chau, K.-W.; Lo-Kuen Lam, C.; Hung-Fai Ng, C. Sick building syndrome and perceived indoor environmental quality: A survey of apartment buildings in Hong Kong. Habitat Int. 2009, 33, 463–471. [Google Scholar] [CrossRef]
- Al horr, Y.; Arif, M.; Katafygiotou, M.; Mazroei, A.; Kaushik, A.; Elsarrag, E. Impact of indoor environmental quality on occupant well-being and comfort: A review of the literature. Int. J. Sustain. Built Environ. 2016, 5, 1–11. [Google Scholar] [CrossRef]
- Trebilcock, M.; Soto-Muñoz, J.; Yañez, M.; Figueroa-San Martin, R. The right to comfort: A field study on adaptive thermal comfort in free-running primary schools in chile. Build. Environ. 2017, 114, 455–469. [Google Scholar] [CrossRef]
- Vilcekova, S.; Meciarova, L.; Burdova, E.K.; Katunska, J.; Kosicanova, D.; Doroudiani, S. Indoor environmental quality of classrooms and occupants’ comfort in a special education school in slovak republic. Build. Environ. 2017, 120, 29–40. [Google Scholar] [CrossRef]
- Vilčeková, S.; Kapalo, P.; Mečiarová, Ľ.; Burdová, E.K.; Imreczeová, V. Investigation of indoor environment quality in classroom—Case study. Procedia Eng. 2017, 190, 496–503. [Google Scholar] [CrossRef]
- Zuhaib, S.; Manton, R.; Griffin, C.; Hajdukiewicz, M.; Keane, M.M.; Goggins, J. An indoor environmental quality (ieq) assessment of a partially-retrofitted university building. Build. Environ. 2018, 139, 69–85. [Google Scholar]
- Diaz Lozano Patino, E.; Siegel, J.A. Indoor environmental quality in social housing: A literature review. Build. Environ. 2018, 131, 231–241. [Google Scholar] [CrossRef]
- Borgeson, S.; Brager, G. Comfort standards and variations in exceedance for mixed-mode buildings. Build. Res. Inf. 2011, 39, 118–133. [Google Scholar] [CrossRef]
- Olesen, B.W.; Parsons, K.C. Introduction to thermal comfort standards and to the proposed new version of en iso 7730. Energy Build. 2002, 34, 537–548. [Google Scholar] [CrossRef]
- American Society of Heating, Refrigerating, & Air-Conditioning Engineers. Thermal Environmental Conditions for Human Occupancy; American Society of Heating, Refrigerating and Air-Conditioning Engineers: Atlanta, GA, USA, 2004; Volume 55. [Google Scholar]
- De Dear, R.J.; Brager, G.S. Thermal comfort in naturally ventilated buildings: Revisions to ashrae standard 55. Energy Build. 2002, 34, 549–561. [Google Scholar] [CrossRef]
- Nicol, F.; Humphreys, M. Derivation of the adaptive equations for thermal comfort in free-running buildings in european standard en15251. Build. Environ. 2010, 45, 11–17. [Google Scholar] [CrossRef]
- Ministerio de Desarrollo Urbano y Vivienda. Norma ecuatoriana de la construcción. In Eficiencia Energética en la Construcción en Ecuador; Ministerio de Desarrollo Urbano y Vivienda: Quito, Ecuador, 2011; Volume NEC-11. [Google Scholar]
- Ministerio para la Transición Ecológica. Reglamento de Instalaciones Térmicas en los Edificios; Ministerio para la Transición Ecológica: Madrid, Spain, 2007; Volume RITE-2007. [Google Scholar]
- Lawrence, G. Comfort; CIBSE: London, UK, 2006. [Google Scholar]
- Rey, F.; Velasco, E. Eficiencia Energética en Edificios: Certifiación y Auditorías Energéticas; Paraninfo, S.A.: Madrid, Spain, 2006. [Google Scholar]
- Climate-Data. Available online: es.climate-data.org/location/875185 (accessed on 2 April 2018).
- Bayulken, B.; Huisingh, D. Perceived ‘quality of life’ in eco-developments and in conventional residential settings: An explorative study. J. Clean. Prod. 2015, 98, 253–262. [Google Scholar] [CrossRef]
- Malmqvist, T. Environmental rating methods: Selecting indoor environmental quality (ieq) aspects and indicators. Build. Res. Inf. 2008, 36, 466–485. [Google Scholar] [CrossRef]
- Ministerio de Vivienda, Construcción y Saneamiento. Resultados de la Encuesta Nacional Sobre la Percepción de las Familias Respecto al Confort Térmico y Lumínico de su Vivienda; Ministerio de Vivienda, Construcción y Saneamiento: Lima, Peru, 2013. [Google Scholar]
- Brunsgaard, C.; Heiselberg, P.; Knudstrup, M.-A.; Larsen, T.S. Evaluation of the indoor environment of comfort houses: Qualitative and quantitative approaches. Indoor Built Environ. 2012, 1, 432–451. [Google Scholar] [CrossRef]
- Molina, C.; Veas, L. Evaluación del confort térmico en recintos de 10 edificios públicos de chile en invierno. Rev. Constr. 2012, 11, 27–38. [Google Scholar] [CrossRef]
- Marincic, I.; Ochoa, J.M.; Río, J.A.d. Confort térmico adaptativo dependiente de la temperatura y la humedad. Arquit. Ciudad Entorno 2012, 7, 27–46. [Google Scholar]
- Godoy, A. El Confort Térmico Adaptativo: Aplicación en la Edificación en España. Master’s Thesis, Universidad Politécnica de Cataluña, Barcelona, Spain, 2012. [Google Scholar]
- De Dear, R.; Brager, G.; Cooper, D. Developing an Adaptative Model of Thermal Comfort and Preference; American Society of Heating, Refrigerating and Air-Conditioning Engineers: Atlanta, GA, USA, 1997. [Google Scholar]
- American Society of Heating, Refrigerating and Air-Conditioning Engineers. Ventilation for Acceptable Indoor Air Quality; American Society of Heating, Refrigerating and Air-Conditioning Engineers: Atlanta, GA, USA, 2007; Volume Standard 62.1-2007. [Google Scholar]
- Comite’Europe’en de Normalisation. Ds/en 15251:2007: Indoor Environmental Input Parameters for Design and Assessment of Energy Performance of Buildings Addressing Indoor Air Quality, Thermal Environment, Lighting and Acoustics; Comite’Europe’en de Normalisation: Brussels, Belgium, 2007. [Google Scholar]
- La Asociación Española de Normalización y Certificación. UNE 100-011-88: Climatización: La Ventilación para una Calidad Aceptable del Aire en la Climatización de los Locales; La Asociación Española de Normalización y Certificación: Madrid, Spain, 1991; Volume UNE 100011:1991. [Google Scholar]
- Quesada, F.; Trebilcock, M. Desarrollo de un Método de Evaluación de la Calidad del Ambiente Interior para el Diseño de Viviendas Sustentables: Caso de Estudio Región del Bío-Bío, Chile. Ph.D. Thesis, Universidad del Bío-Bío, Concepción, Chile, 2015. [Google Scholar]
Figure 1.
Location of houses and weather stations in Cuenca.

Figure 2.
Study cases.

Figure 3.
Installed devices.

Figure 4.
Operative and external temperature measurements (includes all studied cases) during the first monitoring of the cold period in October. Data from: Environmental monitoring.
Figure 4.
Operative and external temperature measurements (includes all studied cases) during the first monitoring of the cold period in October. Data from: Environmental monitoring.

Figure 5.
Operative and external temperature measurements (includes all studied cases) during the second monitoring of the warm period in February. Data from: Environmental monitoring.
Figure 5.
Operative and external temperature measurements (includes all studied cases) during the second monitoring of the warm period in February. Data from: Environmental monitoring.

Figure 6.
Relative humidity variation registry during the first and second monitoring periods (comparison of social areas, master bedrooms, external air, and ISO 7730 comfort ranks). The first monitoring period was from 7 October 2015 to 25 October 2015. The second monitoring period was from 21 February 2016 to 14 March 2016. Data from: Environmental monitoring.

Figure 7.
The distribution of users’ individual thermic sensation perceptions during the first and second monitoring periods. Data from: Environmental monitoring.
Figure 7.
The distribution of users’ individual thermic sensation perceptions during the first and second monitoring periods. Data from: Environmental monitoring.

Figure 8.
TSV according to the indoor temperature and Tn calculation via linear regression. Data from: Applied questionnaires and environmental monitoring.
Figure 8.
TSV according to the indoor temperature and Tn calculation via linear regression. Data from: Applied questionnaires and environmental monitoring.

Figure 9.
Comparison of air quality of the houses.

Figure 10.
Daylight factor (DF) of the living room and master bedroom, obtained from simulations performed in the studied houses. Data from: Simulations.
Figure 10.
Daylight factor (DF) of the living room and master bedroom, obtained from simulations performed in the studied houses. Data from: Simulations.

Figure 11.
Daylight factor and illumination levels (lux) of the studied houses compared with minimum requirements according to regulations. Data from: Simulations.
Figure 11.
Daylight factor and illumination levels (lux) of the studied houses compared with minimum requirements according to regulations. Data from: Simulations.

Figure 12.
Natural illumination levels (lux) of the studied houses.

Figure 13.
Visual comfort levels (lux) of the studied houses.


Table 1.
Summary of established standards according to international and local regulations.
| Regulation | Category | Values | |
|---|---|---|---|
| Hygrothermic Comfort | PPD-PMV ISO 7730 [8,9] | 20% PPD | Winter: Tn = 22 °C. (±3.5 °C). Summer: Tn = 24 °C. (±3.5 °C). |
| 10% PPD | Winter: Tn = 22 °C. (±2.5 °C). Summer: Tn = 24 °C. (±2.5 °C). | ||
| ASRHAE 55 Adaptive [10,11] | 20% PPD | Winter: Tn = 22 °C. (±3.5 °C). Summer: Tn = 17.8 °C + 0.31 Tm (±3.5 °C). | |
| 10% PPD | Winter: Tn = 22 °C. (±2.5 °C). Summer: Tn = 17.8 °C + 0.31 Tm (±2.5 °C). | ||
| EN 15251 [12] | 20% PPD | Tn = 18.8 °C + 0.33 × Trm7 (±3.0 °C). | |
| 10% PPD | Tn = 18.8 °C + 0.33 × Trm7 (±2.0 °C). | ||
| RITE, 2007 | Standard | Winter: Tmin = 20 °C − Tmax = 23 °C/Summer: Tmin = 23 °C − Tmax = 25 °C. | |
| NEC-11, 2011 [13] | Standard | Tmin = 18 °C/Tmax = 26 °C. | |
| EN 1SO 7730, 2006 | Standard | RH 30 to 70%. Air speed 0 to 1 m/s. | |
| RITE, 2007 [14] | Summer | Average air speed 0.18 to 0.24 m/s (max.). RH 40 to 60%. | |
| Winter | Average air speed 0.15 to 0.20 m/s (max.). RH 40 to 50%. | ||
| NEC-11, 2011 | Standard | Air speed between 0.05 and 0.15 m/s. RH between 40 and 65%. | |
| Indoor air quality | ASRHAE 62.1 2007 | Standard | Maximum 1000 ppm or 650 ppm over CO2 outside. |
| EN 15251, 2007 | I | 350 ppm over CO2 outside. | |
| II | 500 ppm over CO2 outside. | ||
| III | 800 ppm over CO2 outside. | ||
| UNE 100011, 1991 | Standard | Maximum 1000 ppm. | |
| NEC-11, 2011 | Standard | Maximum 650 ppm. | |
| Visual Comfort | UNE-EN-12464-1 | Standard | Illumination levels: rest areas 100 lux. |
| Lawrence, 2006 [15] Rey and Velasco, 2006 [16] | Standard | Daylight Factor (DF) ≥ 2% kitchen, living-dining rooms and bedrooms. | |
| Illumination levels: living-dining rooms 50–300 lux, bedrooms 100 lux. | |||
| INEN 1152, 1984 | Standard | DF: rest areas 0.625%, bedrooms 0.313%. | |
| NEC-11, 2011 | Standard | DF ≥ 3% on working plane 3 m clear from the window wall and 1 m sideways. |
Table 2.
Measurement devices.
| Device | Characteristics | Data |
|---|---|---|
| Integration module (Processor) | Brand: DataLights | - |
| Model: DL-Logger2015-mR | ||
| Temperature sensor (Thermistor) | Brand: Apogee | °C |
| Model: ST-100 | ||
| Relative humidity sensor | Brand: Omega | RH (Relative humidity), % |
| Model: HX71-V1 | ||
| Carbon dioxide sensor | Brand: Vernier | CO2, ppm |
| Model: Carbon Dioxide Gas Sensor | ||
| Pyranometer | Brand: Apogee | Radiation, W/m2 |
| Model: SP-212 | ||
| Anemometer | Brand: Kestrel | Air speed, m/s |
| Model: 4200 |
Table 3.
Thermal sensation voting (TSV) and operative temperature statistics during the first and second monitoring periods.
Table 3.
Thermal sensation voting (TSV) and operative temperature statistics during the first and second monitoring periods.
| Study Cases | First Monitoring | Second Monitoring | ||
|---|---|---|---|---|
| TSVmean | Tmean (°C) | TSVmean | Tmean (°C) | |
| House 1 | 0.5 | 19.82 | 2.25 | 27.38 |
| House 2 | −0.50 | 18.29 | 0 | 19.34 |
| House 3 | 0.5 | 20.04 | 0.67 | 22.45 |
| House 4 | 0.5 | 20.46 | −0.50 | 20.9 |
| House 5 | −1.25 | 19.14 | −0.50 | 20.3 |
| House 6 | 0 | 18.96 | 1.5 | 24.05 |
| House 7 | −2.00 | 18.81 | 0.5 | 20.72 |
| House 8 | 0 | 17.89 | 0 | 19.22 |
| −0.28 | 19.18 | 0.49 | 21.79 | |
Data from: Environmental monitoring.
Table 4.
Operative temperature values according to ASHRAE-55 and EN-15251 regulations for each studied case.
Table 4.
Operative temperature values according to ASHRAE-55 and EN-15251 regulations for each studied case.
| Study Case | First Monitoring | Second Monitoring | ||
|---|---|---|---|---|
| ASHRAE-55 To (°C) | EN-15251 To (°C) | ASHRAE-55 To (°C) | EN-15251 To (°C) | |
| House 1 | 22.59 | 23.95 | 23.01 | 24.41 |
| House 2 | 22.19 | 23.5 | 22.58 | 23.88 |
| House 3 | 22.66 | 23.94 | 23.09 | 24.48 |
| House 4 | 22.59 | 23.95 | 22.76 | 24.1 |
| House 5 | 22.74 | 24.1 | 23.26 | 24.68 |
| House 6 | 22.58 | 23.89 | 23.2 | 24.61 |
| House 7 | 22.38 | 23.65 | 22.68 | 23.95 |
| House 8 | 22.38 | 23.65 | 22.68 | 23.95 |
| 22.51 | 23.83 | 22.91 | 24.26 | |
Data from: Environmental monitoring.
Table 5.
Measurement and interviewing results.
| Standard | House 1 | House 2 | House 3 | House 4 | House 5 | House 6 | House 7 | House 8 | |||||||||||||||||||||||||
|---|---|---|---|---|---|---|---|---|---|---|---|---|---|---|---|---|---|---|---|---|---|---|---|---|---|---|---|---|---|---|---|---|---|
| LR | MB | LR | MB | LR | MB | LR | MB | LR | MB | LR | MB | LR | MB | LR | MB | ||||||||||||||||||
| S | V | S | V | S | V | S | V | S | V | S | V | S | V | S | V | S | V | S | V | S | V | S | V | S | V | S | V | S | V | S | V | ||
| TC | NEC-11, ISO 7730, ASHRAE 55 (18–26 °C aprox.) | - | 2 | - | 2 | + | 0 | + | 3 | +/− | 3 | +/− | 2 | - | 3 | + | 0 | - | −1 | +/− | 2 | + | 3 | - | 0 | + | 1 | + | 3 | +/− | 3 | + | 3 |
| ISO 7730 (RH 30–70%) | + | + | + | + | + | + | + | + | + | + | + | + | + | + | + | + | |||||||||||||||||
| NEC-11 (RH 40–65%) | +/− | - | + | + | +/− | +/− | + | +/− | +/− | - | + | - | + | + | +/− | +/− | |||||||||||||||||
| IAQ | EN 15251 (max. 1150 ppm) | + | 1 | + | 3 | + | 3 | + | −1 | + | 3 | + | 3 | + | 3 | + | 2 | + | 2 | + | 1 | + | 0 | +/− | 3 | + | 1 | +/− | 3 | + | 3 | - | 3 |
| ASHRAE Standard 62.1, UNE 100011 (max. 1000 ppm) | + | + | + | + | + | +/− | + | + | + | + | +/− | + | + | +/− | +/− | - | |||||||||||||||||
| NEC-11 (max. 650 ppm) | + | - | + | + | + | - | + | +/− | +/− | - | + | - | +/− | - | +/− | - | |||||||||||||||||
| VC | NEC-11 (DF ≥ 3%) | + | 2 | - | 3 | + | 3 | + | −1 | + | 3 | + | 3 | + | 3 | + | 3 | + | 2 | + | 3 | + | 1 | + | 3 | + | 1 | + | 0 | + | 3 | + | 2 |
| Assessment method (DF ≥ 2%) | + | - | + | + | + | + | + | + | + | + | + | + | + | + | + | + | |||||||||||||||||
| INEN 1152 (Living room DF ≥ 0.625%/Bedroom. DF ≥ 0.313%) | + | + | + | + | + | + | + | + | + | + | + | + | + | + | + | + | |||||||||||||||||
| Assessment method (Living room 50–300 lux/Bedroom 100 lux) | + | + | + | + | + | + | + | + | + | + | + | + | + | + | + | + | |||||||||||||||||
| 5 | 8 | 6 | 1 | 9 | 8 | 9 | 5 | 3 | 6 | 4 | 6 | 3 | 6 | 9 | 8 | ||||||||||||||||||
TC: Hygrothermic comfort, IAQ: indoor air quality, VC: visual comfort; L.R.: Living room M.B.: Master bedroom; S: Assessment of regulation’s fulfillment, indicated as complete (+); complies one of the ranges or exceeds a limit (+/−), and does not comply the regulation (−). V: Assessment of comfort’s subjective perception on a seven-degree scale, from very unsatisfied (−3) to very satisfied (+3).
Table 6.
Summary of established comfort standards for urban houses in Cuenca.
| Aspect | Unit | Value |
|---|---|---|
| Comfort temperature (Tn) | °C | 20.12 |
| Comfort range 20% PPD | °C | 16.62–23.62 |
| Comfort range 10% PPD | °C | 17.62–22.62 |
| Relative humidity (RH) | % | 40–65 |
| CO2 concentration | ppm | 614.25 |
| Daylight factor—living room | % | ≥5 |
| Daylight factor—master bedroom | % | ≥4 |
| Illumination level | lux | ≥300 |
© 2018 by the authors. Licensee MDPI, Basel, Switzerland. This article is an open access article distributed under the terms and conditions of the Creative Commons Attribution (CC BY) license (http://creativecommons.org/licenses/by/4.0/).
Share and Cite
MDPI and ACS Style
Molina, F.Q.; Yaguana, D.B. Indoor Environmental Quality of Urban Residential Buildings in Cuenca—Ecuador: Comfort Standard. Buildings 2018, 8, 90. https://doi.org/10.3390/buildings8070090
AMA Style
Molina FQ, Yaguana DB. Indoor Environmental Quality of Urban Residential Buildings in Cuenca—Ecuador: Comfort Standard. Buildings. 2018; 8(7):90. https://doi.org/10.3390/buildings8070090
Chicago/Turabian StyleMolina, Felipe Quesada, and David Bustillos Yaguana. 2018. "Indoor Environmental Quality of Urban Residential Buildings in Cuenca—Ecuador: Comfort Standard" Buildings 8, no. 7: 90. https://doi.org/10.3390/buildings8070090
Note that from the first issue of 2016, this journal uses article numbers instead of page numbers. See further details here.