Using Network Analysis and BIM to Quantify the Impact of Design for Disassembly

1
BATir Building, Architecture & Town planning, Ecole polytechnique de Bruxelles, Université Libre de Bruxelles, Brussels 1050, Belgium
2
Department of Architectural Engineering, Vrije Universiteit Brussel, Brussels 1050, Belgium
*
Author to whom correspondence should be addressed.
Buildings 2018, 8(8), 113; https://doi.org/10.3390/buildings8080113
Submission received: 7 July 2018
/
Revised: 10 August 2018
/
Accepted: 15 August 2018
/
Published: 18 August 2018
(This article belongs to the Special Issue Building Sustainability Assessment)
Abstract
:Design for Disassembly (DfD) is a promising design strategy to improve resource efficiency in buildings. To facilitate its application in design and construction practice, specific assessment tools are currently being developed. By reviewing the literature on DfD, including criteria and assessment methods, and with an explorative research approach on simple examples, we have developed a new method called Disassembly Network Analysis (DNA) to quantify the impact of DfD and link it to specific design improvements. The impact of DfD is measured in material flows generated during the disassembly of a building element. The DNA method uses network analysis and Building Information Modeling to deliver information about flows of recovered and lost materials and disassembly time. This paper presents the DNA method and two illustrative examples. Although DNA is still at a preliminary stage of development, it already shows the potential to compare assemblies and supports better-informed decisions during the design process by detecting potential points of improvements regarding waste generation and time needed to disassemble an element.
1. Introduction
Few buildings at present are designed for future adaptation and reuse of their elements, although adaptable buildings are easier to maintain, transform, and upgrade [1]. Buildings and building elements are often demolished before the end of their technical lifespan because socio-economic trends and technical evolutions require unforeseen adaptations [2]. Consequently, excessive construction and demolition waste is generated, accounting for a third of all the waste generated in the European Union [3]. The financial and socio-cultural value contained in those materials is lost as along with energy involved in extracting and processing those materials into building elements (i.e., their embodied energy).
In response to this, a promising design strategy to facilitate adaptation and reuse is Design for Disassembly [2,4]. Design for Disassembly (DfD) first appeared as a product design based on Design for Assembly, a strategy to improve assembly sequences for mechanical and electronic products [4]. Applied to the construction and refurbishment of buildings, DfD can facilitate repair, adaptation, and reuse of building and building elements [1,5]. Building elements can therefore have their service lifespan extended closer to their technical lifespan. With DfD, elements are also easier to separate and recycle. DfD can contribute to a more efficient use of materials and energy and make buildings more resilient to future requirements. Previous research has shown that DfD has the potential to reduce the life cycle cost [1,2,6] of buildings and contribute to environmental savings [1,2,4,7]. However, life cycle costing (LCC) and life cycle analysis (LCA) of buildings often ignore the interdependency between elements [6]. Hence, the impact of choosing DfD instead of a conventional inadaptable solution is difficult to estimate. A new method is therefore needed to estimate the impact of the interdependency between building elements on building material flows and disassembly time and link this information to concrete design improvements.
By reviewing the literature on Design for Disassembly, including criteria and assessment methods, and with an explorative research approach on simple examples, we have developed a method called Disassembly Network Analysis (DNA). The DNA method analyzes the interdependency between elements and defines which elements are recovered and lost during the partial disassembly of a building and how long the disassembly takes. It uses Building Information Modeling (BIM) and network analysis (NA). BIM and its linked database of geometric and nongeometric data attached to building elements aim to facilitate quantitative assessments of design options, with automated inventories of resource flows and waste [8,9,10,11]. In NA, networks are used to study patterns of connection in a wide range of physical and social phenomena [12], in particular to optimize disassembly sequences of manufactured products [6,13,14,15]. Its application to buildings has only recently been explored by Durmisevic, Denis, and Sanchez and Haas [2,16,17].
The DNA method provides a generic backbone for analyses related to building material flows or assembly processes. In this paper, we illustrate the application potential of the DNA method using mass of recovered and lost elements and disassembly time. Using this method, other data, such as the resell value, residual lifespan, and toxicity, can be attached to building elements for additional environmental and economic analyses.
2. Elaboration of the Method
There are two important steps in the elaboration of the DNA method: first, the definition of the method’s aim and scope and second, the setting of guiding rules based on element of persuasive design.
2.1. Aim and Scope
Several methods have already been developed to quantify the effects of Design for Disassembly on buildings (Table 1), with some based on methods developed for manufactured products such as electronics. Most of them give an aggregated score. Moreover, some use qualitative criteria and their result may depend on the assessors. However, the sequence disassembly planning for buildings (SDPB) method published in 2018 by Sanchez and Haas was based on geometric and physical parameters only and estimated the impacts of a disassembly in time and global warming potential [16]. This SDPB method has several limitations, including the fact that the possibility for future reuse is not considered and its output cannot be directly linked with design improvements.
Knowing the need for a Design for Disassembly assessment method (Section 1) and the abovementioned methods, we have refined the aim and scope of the method. Our method uses network analysis and BIM to identify possible disassembly paths to access, disconnect, and transport an element. For each path, the impact of the disassembly is quantified according to three indicators: (1) recovered elements, (2) lost elements, and (3) disassembly time. The first two indicators—recovered and lost elements—are measured in mass according to one of the aims of Design for Disassembly—improving the material efficiency of assemblies [5,20,21,22]. They can be linked to environmental effects and financial cost. The last indicator—disassembly time—contributes to a better evaluation of the labor cost, which sometimes overpasses material cost. In addition to disassembly time, other parameters influencing the total cost, such as the need for specific machinery or the required number of workers, could be taken into account. Contrary to the SDPB method, the developed DNA method considers both disassembly and destruction. For example, a reversible connection can be carefully unfastened or broken apart. Additionally, the three indicators of the disassembly are associated with unfastened connections. Hence, it is possible to sort the connections according to the impacts they generate and set priorities to optimize the design according to material flows and process duration. In this paper, we illustrate the applicability of the DNA method using the abovementioned indicators. Additional indicators could also be obtained from the information linked to building elements. For instance, residual lifespan could be calculated to show the difference between the elements’ technical and service lifespan (i.e., the amount of years the elements could have withstood and the time they have been used). A low residual lifespan can indicate an inefficient use of materials.
The developed method has the potential for wide use. For instance, it can be used at different building scales, provided the objects and links are sufficiently characterized. For instance, at the building scale, the method can quantify the impact of recovering a window frame out of a building; at the element scale, it can quantify the impact of recovering a glass panel out of a window frame. Moreover, it provides three different ways of using the method output: (1) evaluation, (2) comparison, and (3) optimization.
In the first case, the user evaluates a single design option and estimates the needed time and flows of resources for the recovery of a building element. Here, only the maximum reversibility potential of the connections is considered, meaning that if a connection is reversible, it will be unfastened and not broken apart. To link the indicators with design aspects, the method shows the flows and disassembly time generated per connection. It provides users with information about the impact of specific design decisions and allows them to improve the design according to defined objectives.
In the second case, the user compares different design options or disassembly processes. For instance, the method calculates the disassembly time considering all connections are broken apart (i.e., demolition) instead of being carefully unfastened (i.e., disassembly).
In the third case, the method suggests design improvements based on an optimization point between several indicators, such as the shorter disassembly time for a minimum amount of waste generated. Similarly, it identifies a design parameter to adapt in order to improve an indicator significantly.
These three levels of information can be obtained with manual calculation or can be automated in a software tool using BIM data. This software tool will then give the user insightful information with limited increase in the workload.
2.2. Guiding Rules
To develop the method and ensure its usability, we set three guiding rules considering elements of persuasive design. According to the Fogg behavior model (FBM), user behavior can be affected by three factors: ability, motivation, and trigger [23,24,25].
The ability of the user is the user’s capacity to change behavior. It increases when a tool eases the process or guides users towards a more effective one. Ability is also improved if barriers, such as cost or technical complexity, are removed. The motivation is the reason users provide extra work or energy for behavior change. The three main motivators are pleasure (immediate results), hope (anticipation of a “good” outcome), and social acceptance. Finally, the trigger is a sudden, perfectly timed, and effective event that triggers the behavior change. For example, a heart attack may trigger you to take care of your health and lose weight or an antivirus software may trigger you to update your system with a message stating your computer is threatened.
To ensure that the targeted behavior lasts, a threshold level of motivation and ability must be reached prior to the sudden trigger. We have considered that the users of the method are already motivated and willing to change their behavior but are lacking necessary tools (low ability). Therefore, the DNA method and the future DNA tool focus mainly on the users’ ability to design buildings considering DfD. The three guiding rules are:
- The amount of parameters added by the users should remain limited. Therefore, the combination with BIM is considered as a key opportunity in the integration, development and dissemination of the method, as it maximizes the amount of information collected while minimizing the amount of extra information to add manually. This rule facilitates the use of the method and refers to ability.
- A user adding more information should be rewarded. The values taken by default consider the worst-case scenario (i.e., the scenario inducing the higher amount of waste). For instance, a model without information on connections and dependencies considers by default that all connections are irreversible and all elements interdependent, resulting in a high quantity of lost elements. If the user adds more information, the results can only improve. Henceforth, the method can assess preliminary and detailed designs, allowing users to test a design along its development. This second rule refers to trigger and motivation.
- Finally, the DNA method should not rely on a particular BIM software but rather on the general principles of a BIM platform, such as data structure, object oriented-approach and classification of elements. This third rules makes the DNA method independent from proprietary software or quickly evolving tools and increases the ability of the user.
These three rules, together with the three different ways of using the method output (Section 2.1), have guided all key decisions regarding the structure of our method. These rules ensure that the final method is in line with the aim and scope defined in Section 2.1.
3. Disassembly Quantification Method
This section presents the general principles of the DNA method: firstly, the parameters used and secondly, their interactions in the information flowchart. According to the third rule (Section 2), the implementation of the method into a BIM tool is a distinct development stage, which can induce some software-specific adaptations, for instance, in the way information is accessed or how elements are defined.
3.1. Parameters
Based on the literature and experimentation with fictive case studies, we have selected parameters influencing the potential recovery of a building element. The parameters concern the elements (i.e., the nodes of the network), the physical link between elements through a connection or a contact (i.e., the edges of the network), or the composition of the elements (i.e., the structure of the network). The value of some parameters depends on a list of verifiers (Table 2).
The parameters concerning the elements are as follows:
- Accessibility: An element is accessible if a worker can reach the element and all its connections. To recover the elements and unfasten the connections, it is necessary to access them physically.
- Transportability: The mass and volume of the element are limited to a maximal value allowing transportability. Possible verifiers are that the element’s weight and element’s dimensions are lower than a certain limit (see Equations (1) and (2)). This limit may vary depending on norms and regulations (maximum weight allowed per worker) or tools and machinery used.Weightelement < Weightlimit(x,y,z)element < (lmax,Lmax,Hmax)
- Resistance factor: A number between 0 and 1 representing the resistance to wear and tear of an element. In further development, other resistance types can be considered. This factor defines the rupture point when two elements linked with an irreversible connection must be separated.
- Weight: This represents the mass of the element.
The parameters in the connections are as follows:
- Reversibility of connection: This considers if the connection can be unfastened without damaging the elements constituting of the assembly.
- Time to disassemble: This is the time needed to unfasten a reversible connection. It considers the ease of disassembly. Together with additional information, such as the working force need or the type of tools, it will allow the time and price of disassembly to be determined.
- Time to break apart: This is the time needed to break apart a connection, which can be reversible or irreversible.
Additionally, the following parameter depends on the network structure:
- Sequential dependence: This parameter considers that buildings elements have various functions. Some of them, such as the structure, are necessary for the building stability, while others are secondary. These relations and interdependencies between elements influence the disassembly sequence. The disassembly sequence is sometimes not the opposite of the assembly sequence. For instance, during construction, the roof could be “assembled” after the windows but does not have to be disassembled before the windows.
This list is not considered exhaustive and illustrates how to transpose a criterion into a list of verifiers.
3.2. Flowchart
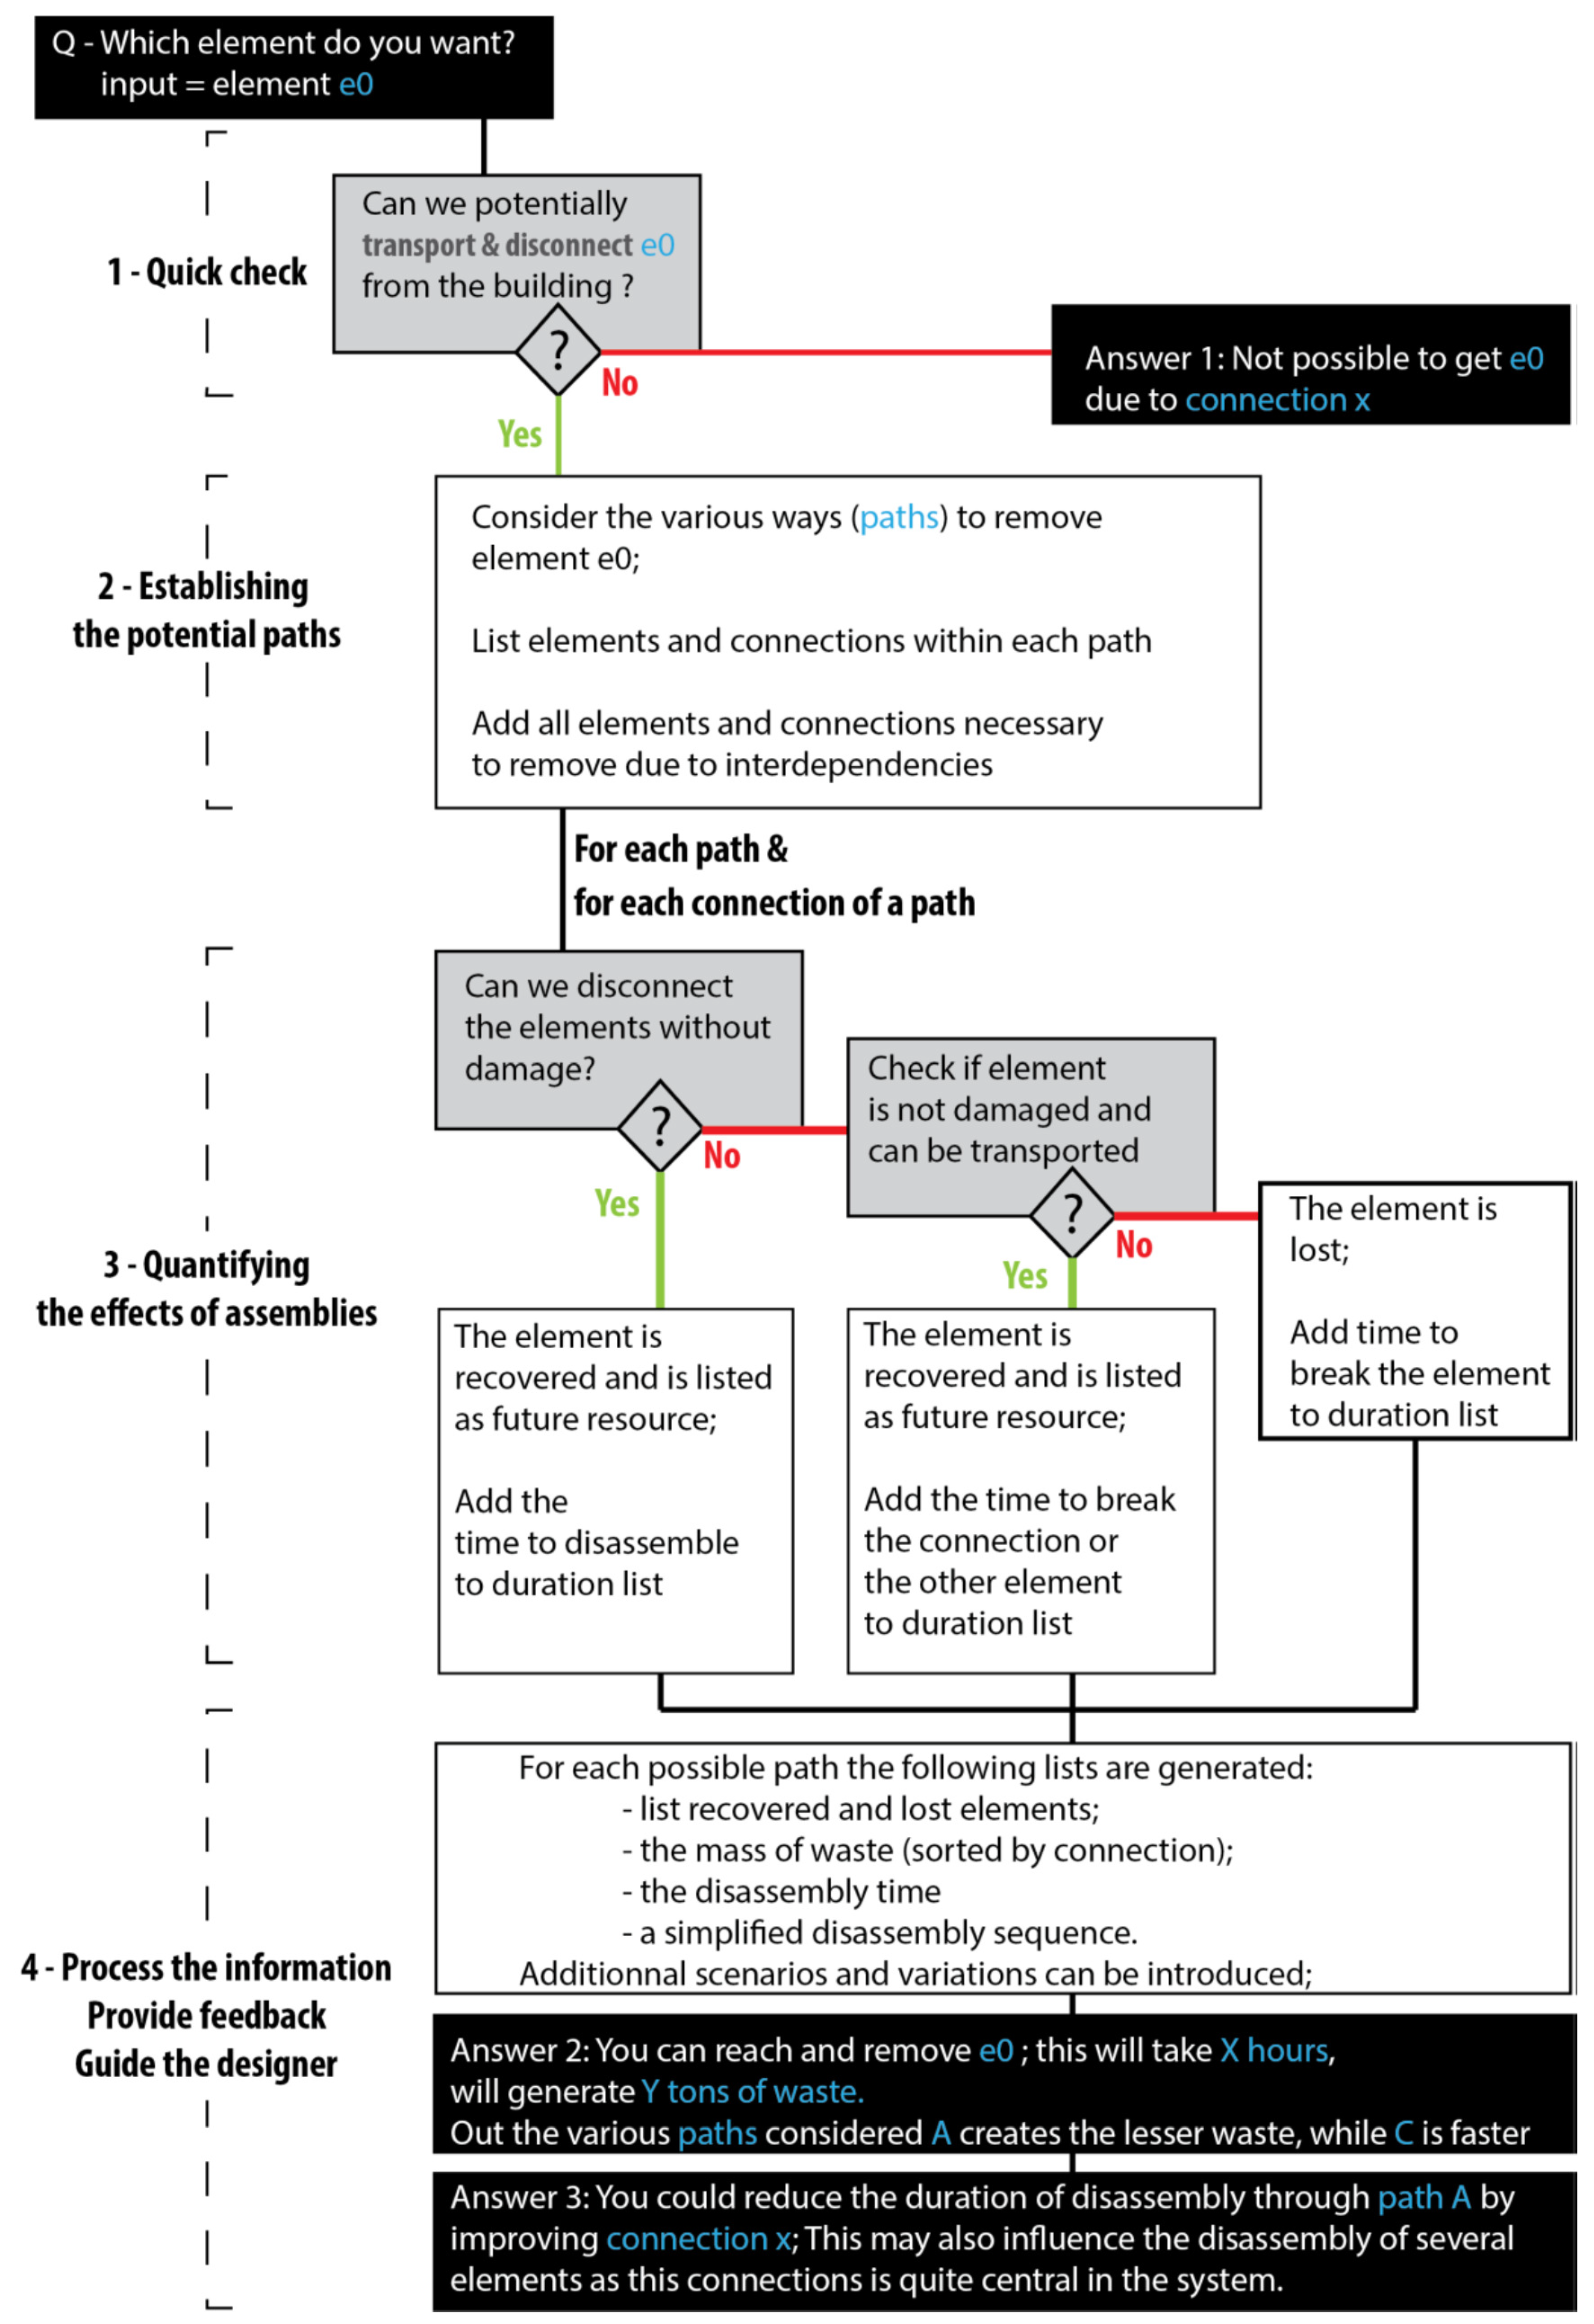
The DNA method starts with the following question: How do you disassemble and recover an element e0 (target element)? The method is divided into four parts that answer different questions (Figure 1). The first part—quick check—defines whether trying to recover e0 makes sense. The question to answer is whether e0 can be transported (considering the element’s weight and dimensions) and disconnected from the structure (considering the reversibility of connection between e0 and surrounding elements and resistance factor). In particular, if this connection is irreversible, a mix of qualitative and quantitative analyses must define which element is lost.
The second part—establishment of potential paths—lists all the possible ways to access and recover e0 (i.e., potential disassembly sequences). To do so, the building is loaded as a network of elements (nodes) linked by connections (edges). Through a geometric checking of the model, it determines the elements directly accessible from outside or inside. Then, it lists potential paths starting from the target element towards accessible elements. Additionally, extra elements and connections preventing the removal due to functional interdependencies are also added to the list. The current version of the DNA method considers two types of interdependencies: structural stability (nonstructural elements always depend on structural ones) and accessibility (a blocking element must be removed prior to the removal of blocked element). The first type can be partially automated through BIM by considering family types and host/hosted relationships. The second type can be automated using the BIM geometric data; the element is accessible if the geometry of the element touches the tridimensional room boundaries or the outside, considering room boundaries are updated every time an element is virtually disassembled. At the end of this second part, the method creates a list of connections ordered according to the disassembly sequence. Importantly, there is one list per possible path. Therefore, several lists are stored and will serve to measure and quantify the amount of waste generated by each connection.
The third part—quantifying the effect of connections—checks for each connection of the list the reversibility of connections (considering the direction of the assembly), the resistance factor of elements (to determine the potentially lost elements), and transportability. If the element is (1) transportable and reversibly connected, or (2) nonreversibly connected, resistant, and transportable, it will be added to the list of elements that can be recovered. Otherwise, it will be added to the list of lost elements. Depending on the use of the method, the time of disassembly or demolition is considered.
Finally, the fourth part—information process and feedback—outputs for each path (1) the list of recovered elements and the connections to unfasten, (2) the mass of waste generated, (3) the time to get the element, and (4) the disassembly sequence. By combining this information with the values of every potential path, the user can compare and optimize design options to obtain satisfying indicators (material flows and time) for the shortest path. Additionally, the method can identify a parameter to alter in priority to significantly improve an indicator.
4. Illustrative Examples
To illustrate the developed method, two examples show the application of the DNA method on fictive building assemblies. First, a simple linear assembly shows the working principle of the method. Then, a more complex assembly illustrates the effect of considering interdependencies between elements. In each example, the method has been applied without the use of an external software, showing the method does not rely on BIM.
4.1. Façade Wall
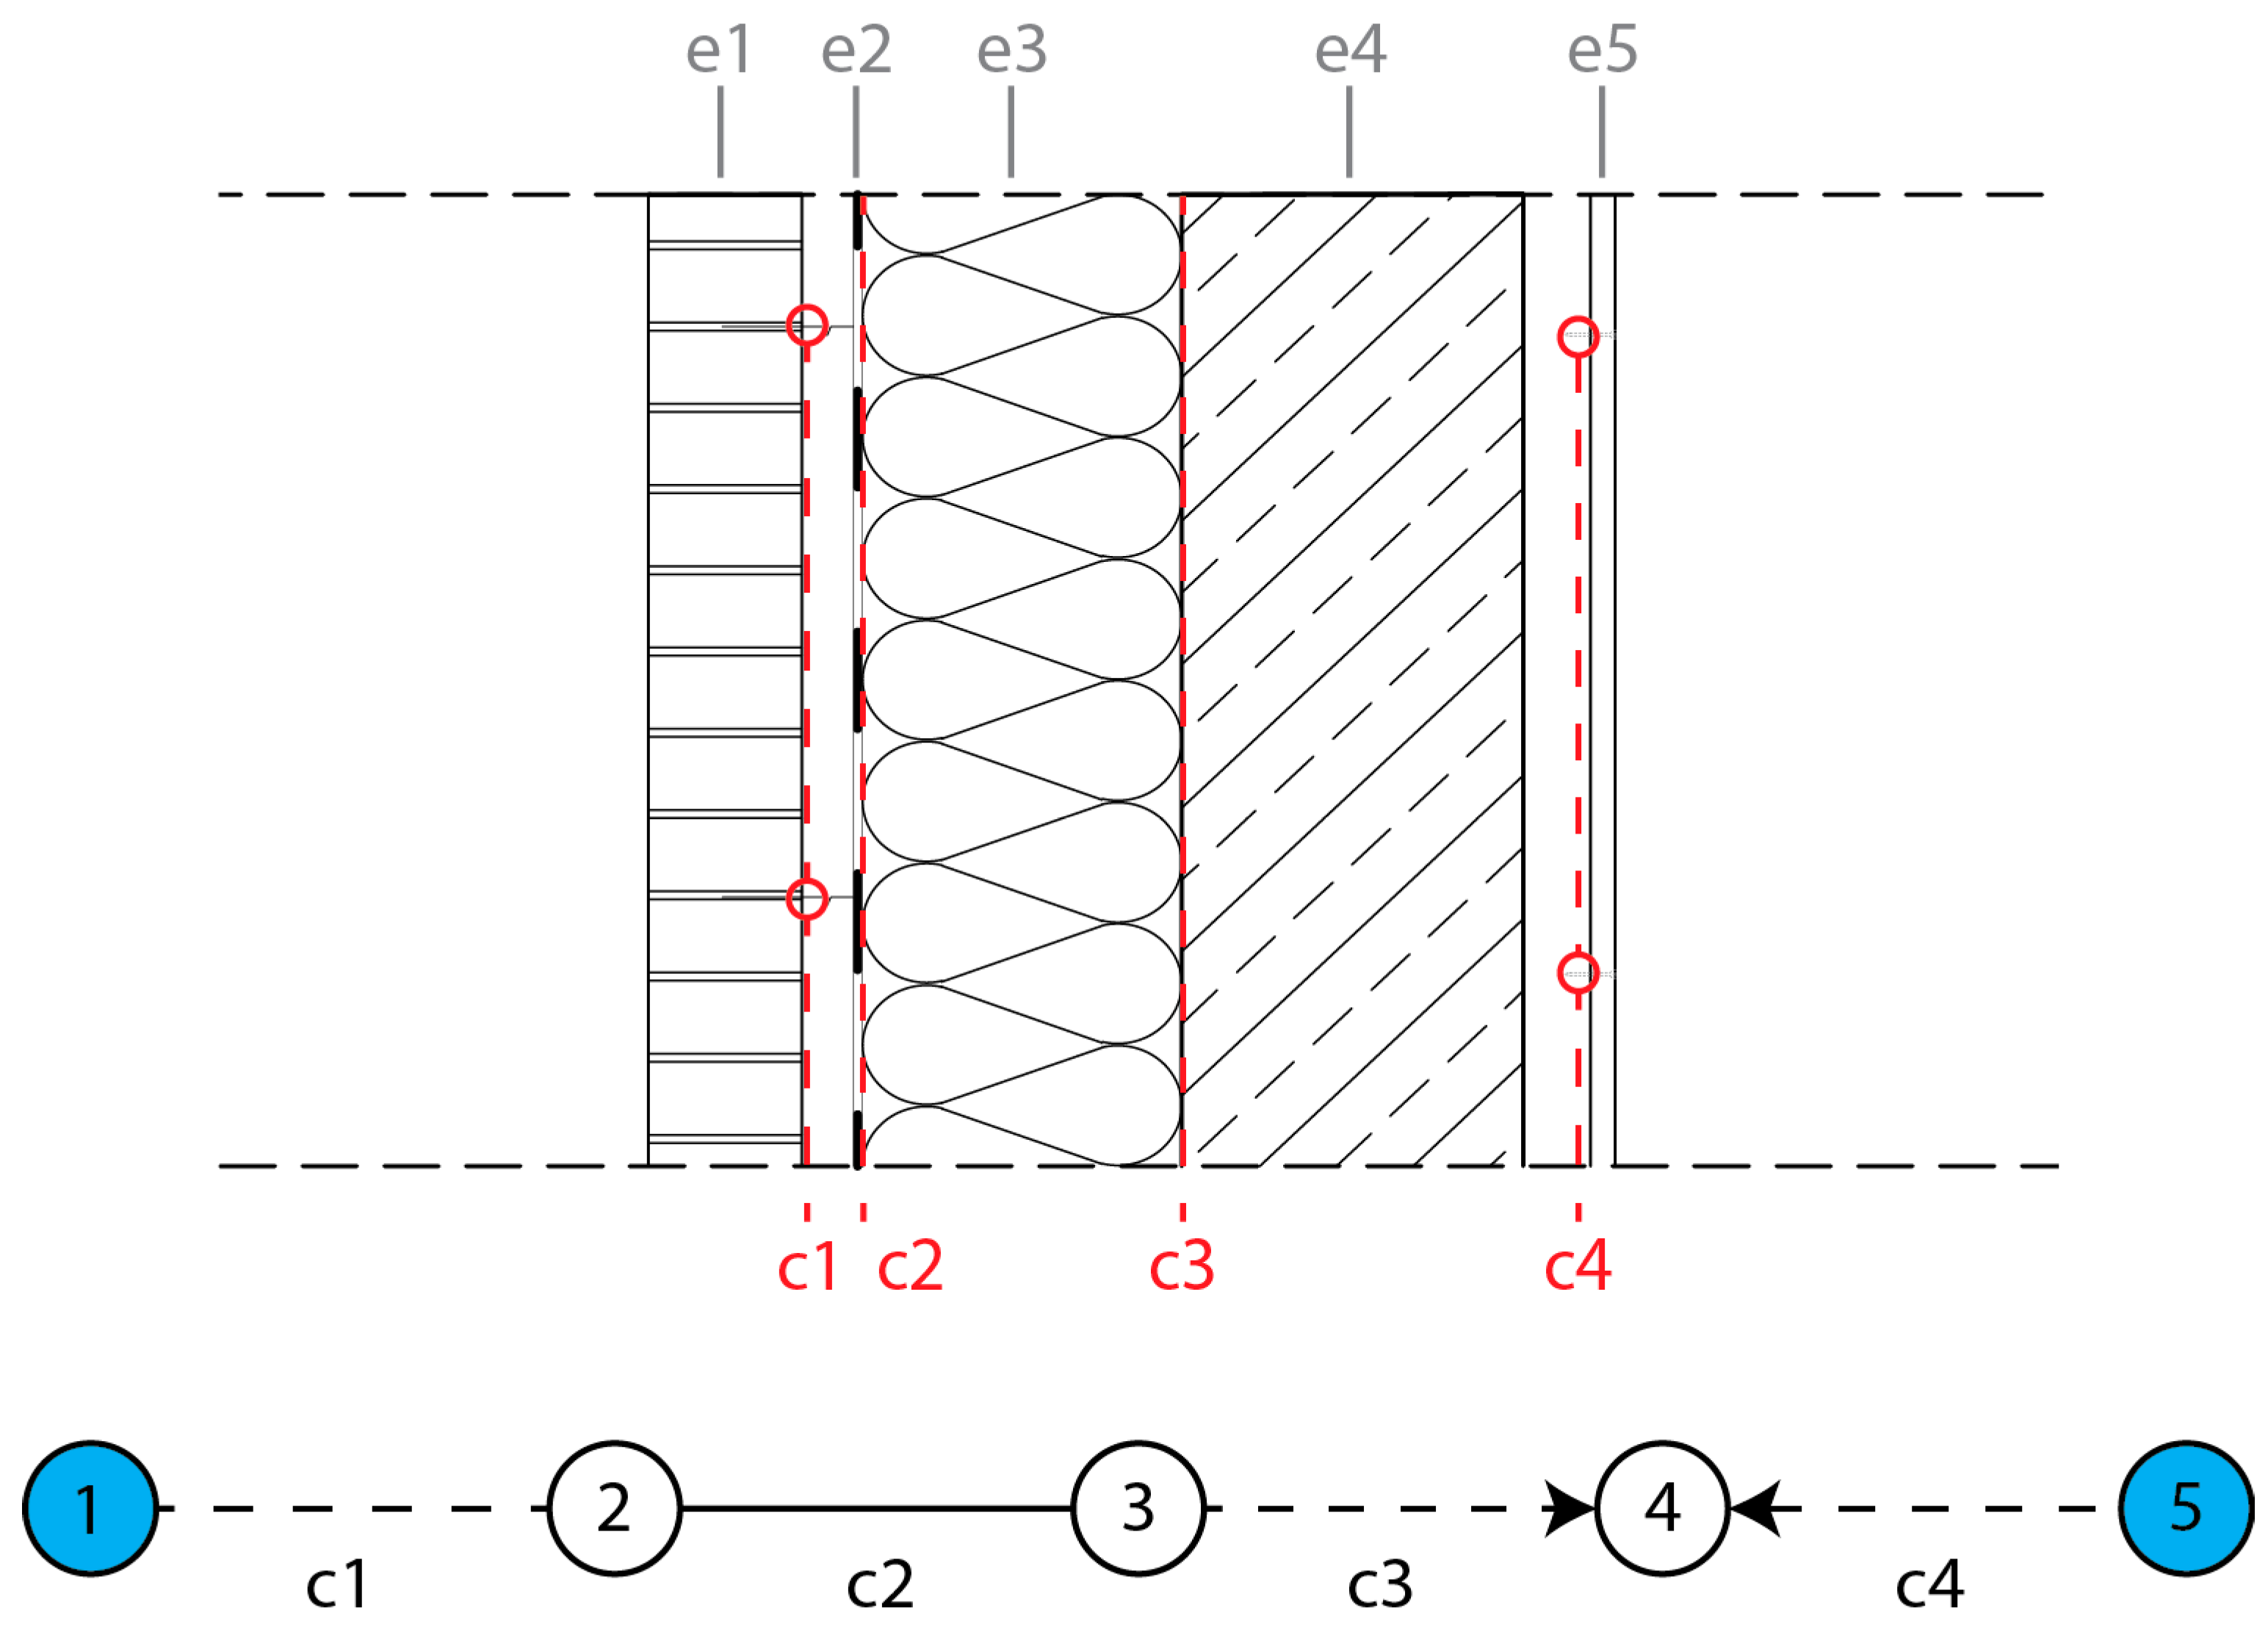
The first example considers a one-squared-meter functional unit of theoretical façade wall. Its five different elements constitute a linear network (Figure 2).
On this network, the arrows indicate the direction of the connection. A full line indicates an irreversible connection, a dashed line indicates a reversible connection. The elements in blue circles are directly accessible. Fictive values for the elements and connections are indicated in Table 3 and Table 4, respectively.
If the element to recover is the insulation layer (e3), the quick preliminary check gives the following results:
- Is e3 transportable? Yes.
- Can each connection with e3 be disconnected? c2 (between e2 and e3) is not reversible. Therefore, the elements’ resistance factors should be compared. Because e3 has a higher resistance factor than e2, e3 will be preserved.
Therefore, the quick check concludes that e3 is potentially recoverable, and the assessment can be continued. The basic requirements are also met for the exterior cladding and interior finishing (e1 and e5). Two elements do not fulfill the quick check requirements: the masonry wall (e4) because it is not transportable and the membrane (e2) because it would break when the connection is c2. Therefore, the method will give the following indications for e2 and e4: “Element e4 cannot be recovered because you cannot transport it due to its heavy weight” and “Element e2 cannot be recovered because it will be lost while trying to unfasten connection c2” (Table 5).
To recover element 3, we can establish the two potential paths:
- In path P1: elements e1, e2, e3 and connections c1, c2
- In path P2: elements e5, e4, e3 and connections c4, c3
In this example, an additional element must be removed, or connection must be unfastened due to interdependencies in each path: c3 and c2. The final paths are:
- In path P1: elements e1, e2, e3 and connections c1, c2, c3
- In path P2: elements e5, e4, e3 and connections c4, c3, c2
In path P1, c1 connects reversibly elements e1 and e2 and is accessible (according to its direction). Therefore, e1 can be added to the “recovered elements” list, and the time to disconnect c1 (Td1) is added to the total duration.
Then, c2 connecting elements e2 and e3 is accessible but not reversible, meaning we should compare the resistance of both elements. In this case, e2 is less resistant than e3, so e2 is added to the “lost elements” list, and the time to break c2 apart (Tb2) is added to the total duration. Finally, c3 connects reversibly elements e3 and e4 and is accessible, so Td3 is added to the total duration. Therefore, we consider that all connections around e3 have been unfastened and e3 can be recovered. The final lists created are the following:
- Lost elements: e2 (due to the removal of c2)
- Recovered elements: e1 (due to the removal of c1) + e3 (due to the removal of c3)
- Total duration: Td1 + Tb2 + Td3 = 60 + 220 + 60 = 440 [s]
- Total waste: 2 kg.
Path P2 induces the loss of element e3 (target element) and is therefore not valid. In this case, Answer 2 (Figure 1) is “Through path P1, you can reach and recover e3; this will take 440 s and will generate 2 kg of waste. The only possible path to recover element e3 is path P1”. As Answer 3, possible insights are “You can reduce the duration of disassembly through path P1 by 50% by improving connection c2; this connection also generates 2 kg of waste (100% of total waste)” or “Path P2 can be considered as an alternative if connection c3 is reversible in both directions. In that case, considering an alternative that will allow e4 to be recovered will avoid 150 kg of waste”.
The DNA method provides the user with insight regarding the actual impact of the current assembly and potential alternatives with their impact (i.e., “altering this connection will reduce waste by 50%”). It also explains the reasons why a disassembly sequence is not possible and allows the user to adapt the design accordingly. This first example can be considered as one multilayered building element made up of five subelements. Henceforth, the complexity and the range of solutions are purposely low. The next example illustrates a more complex, still fictive, building assembly.
4.2. Structural Frame with Techniques and Finishes
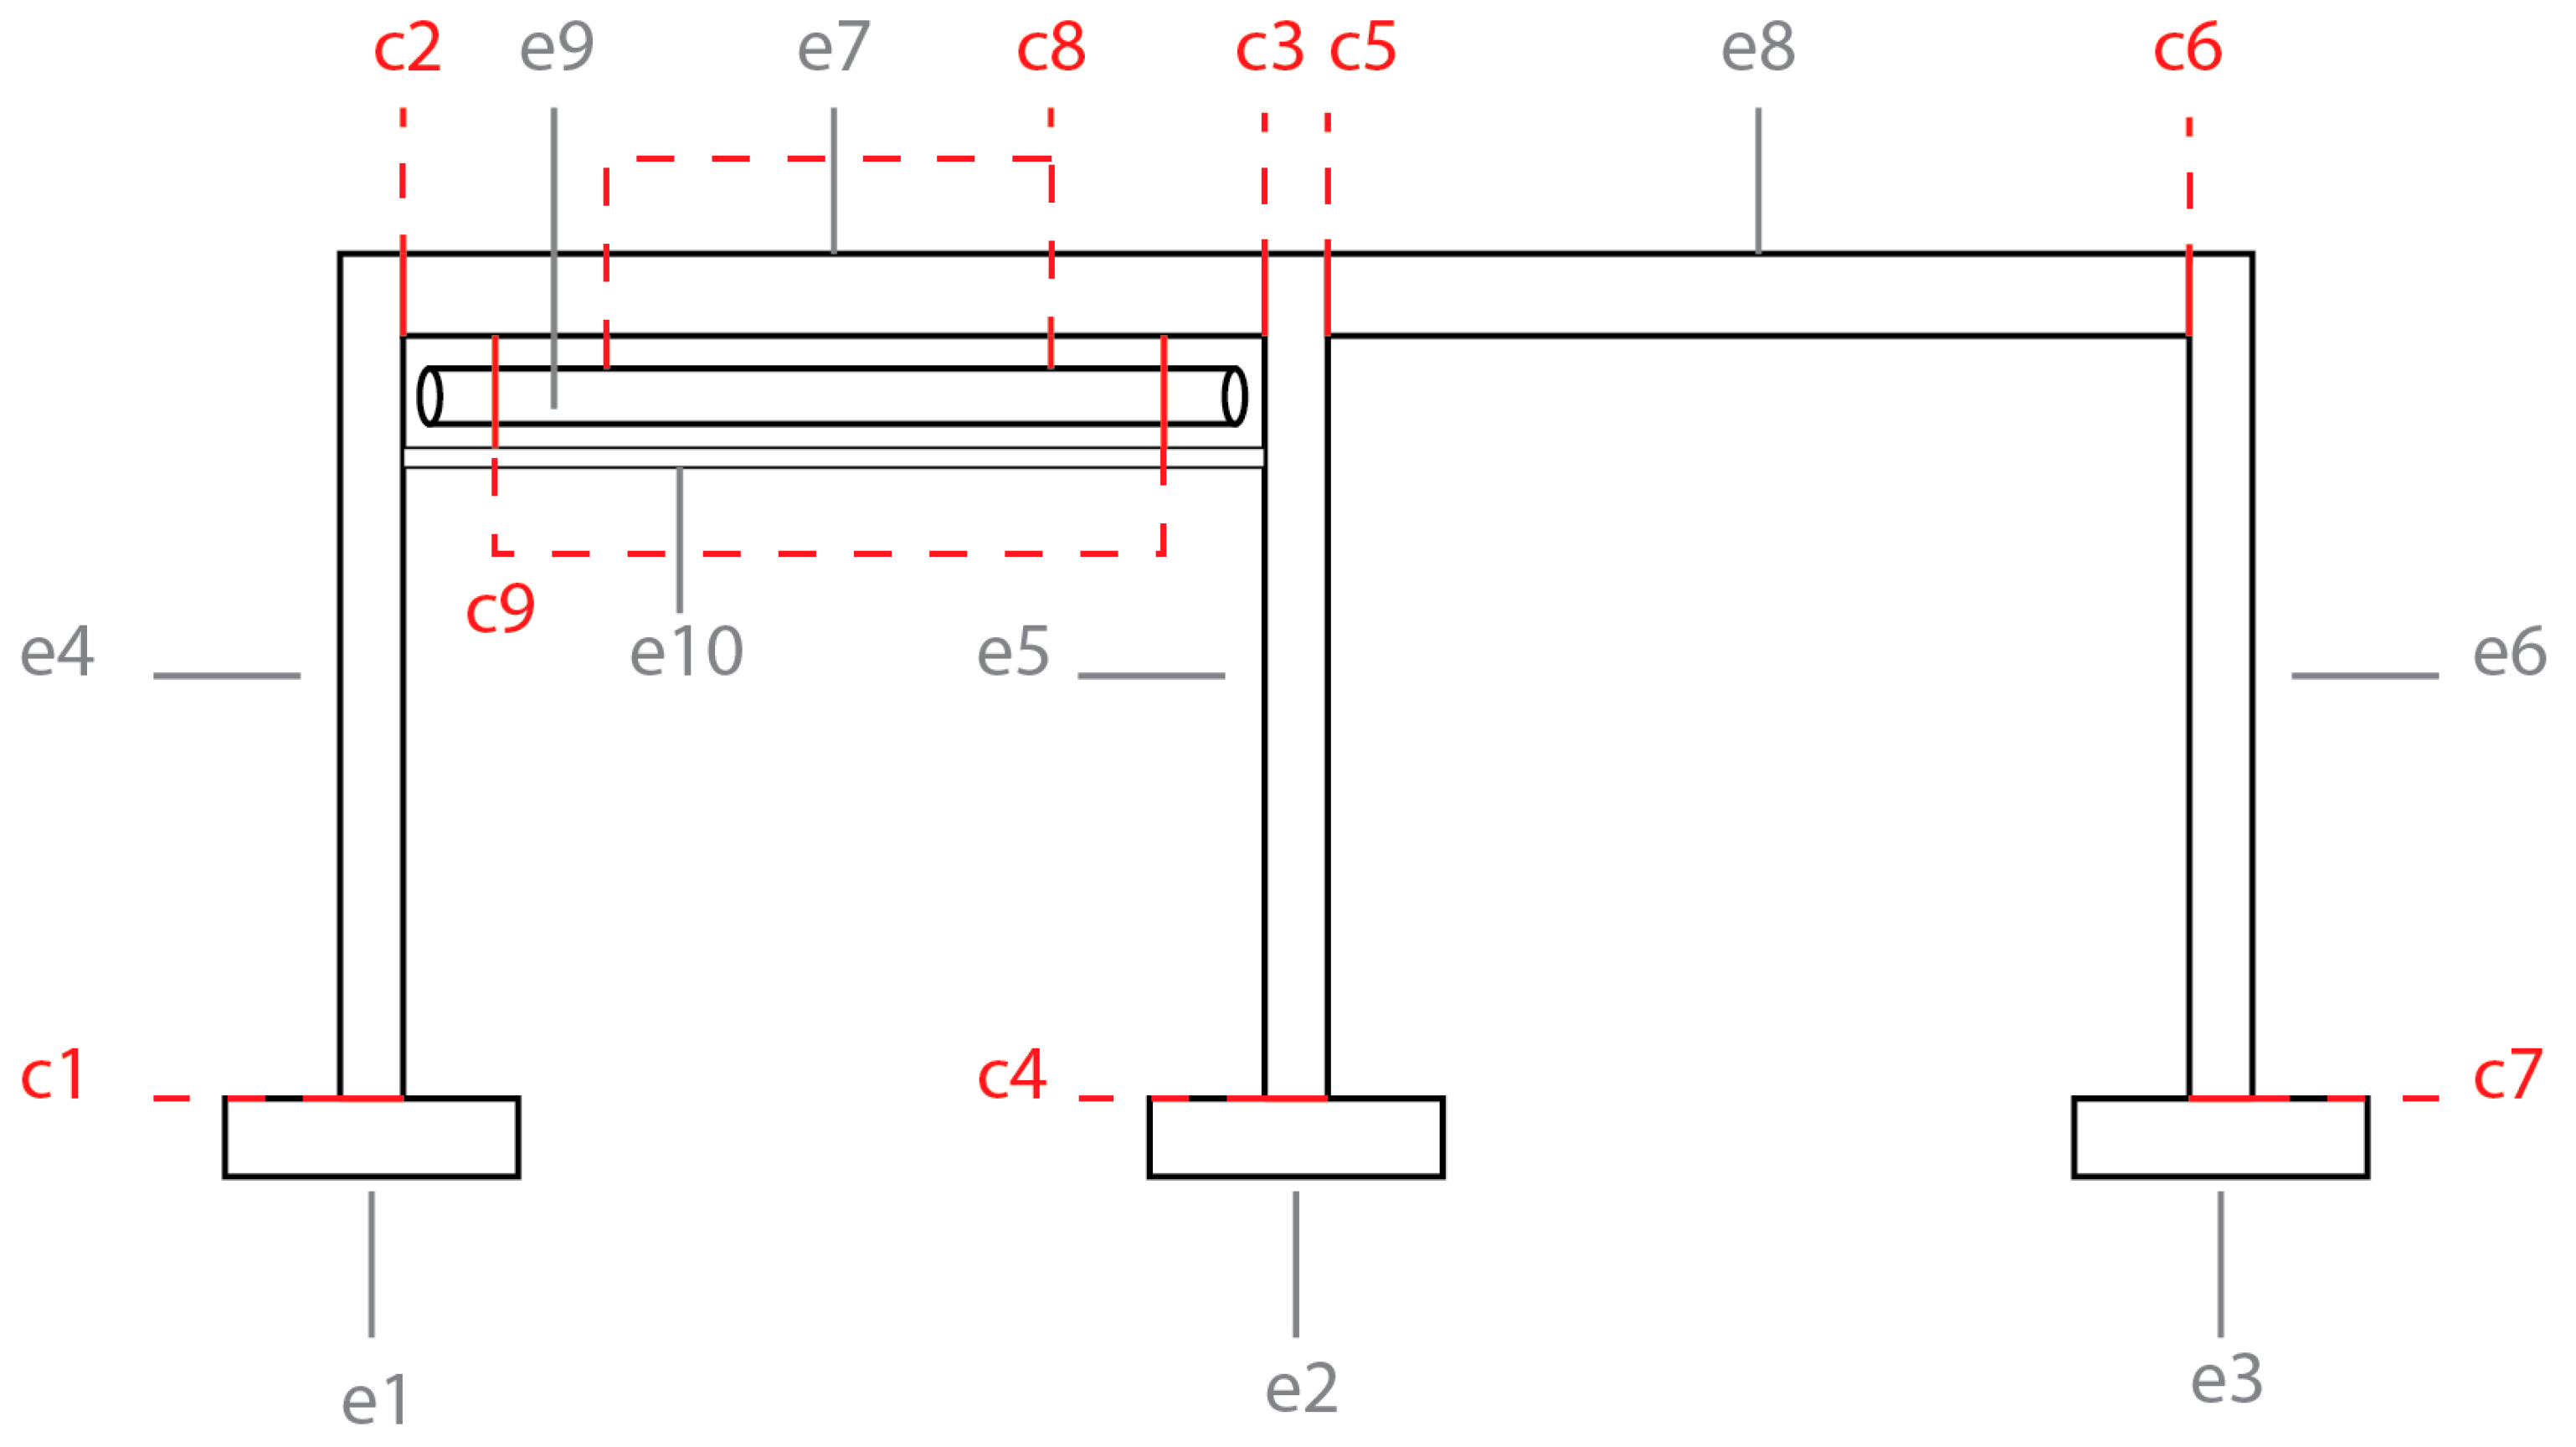
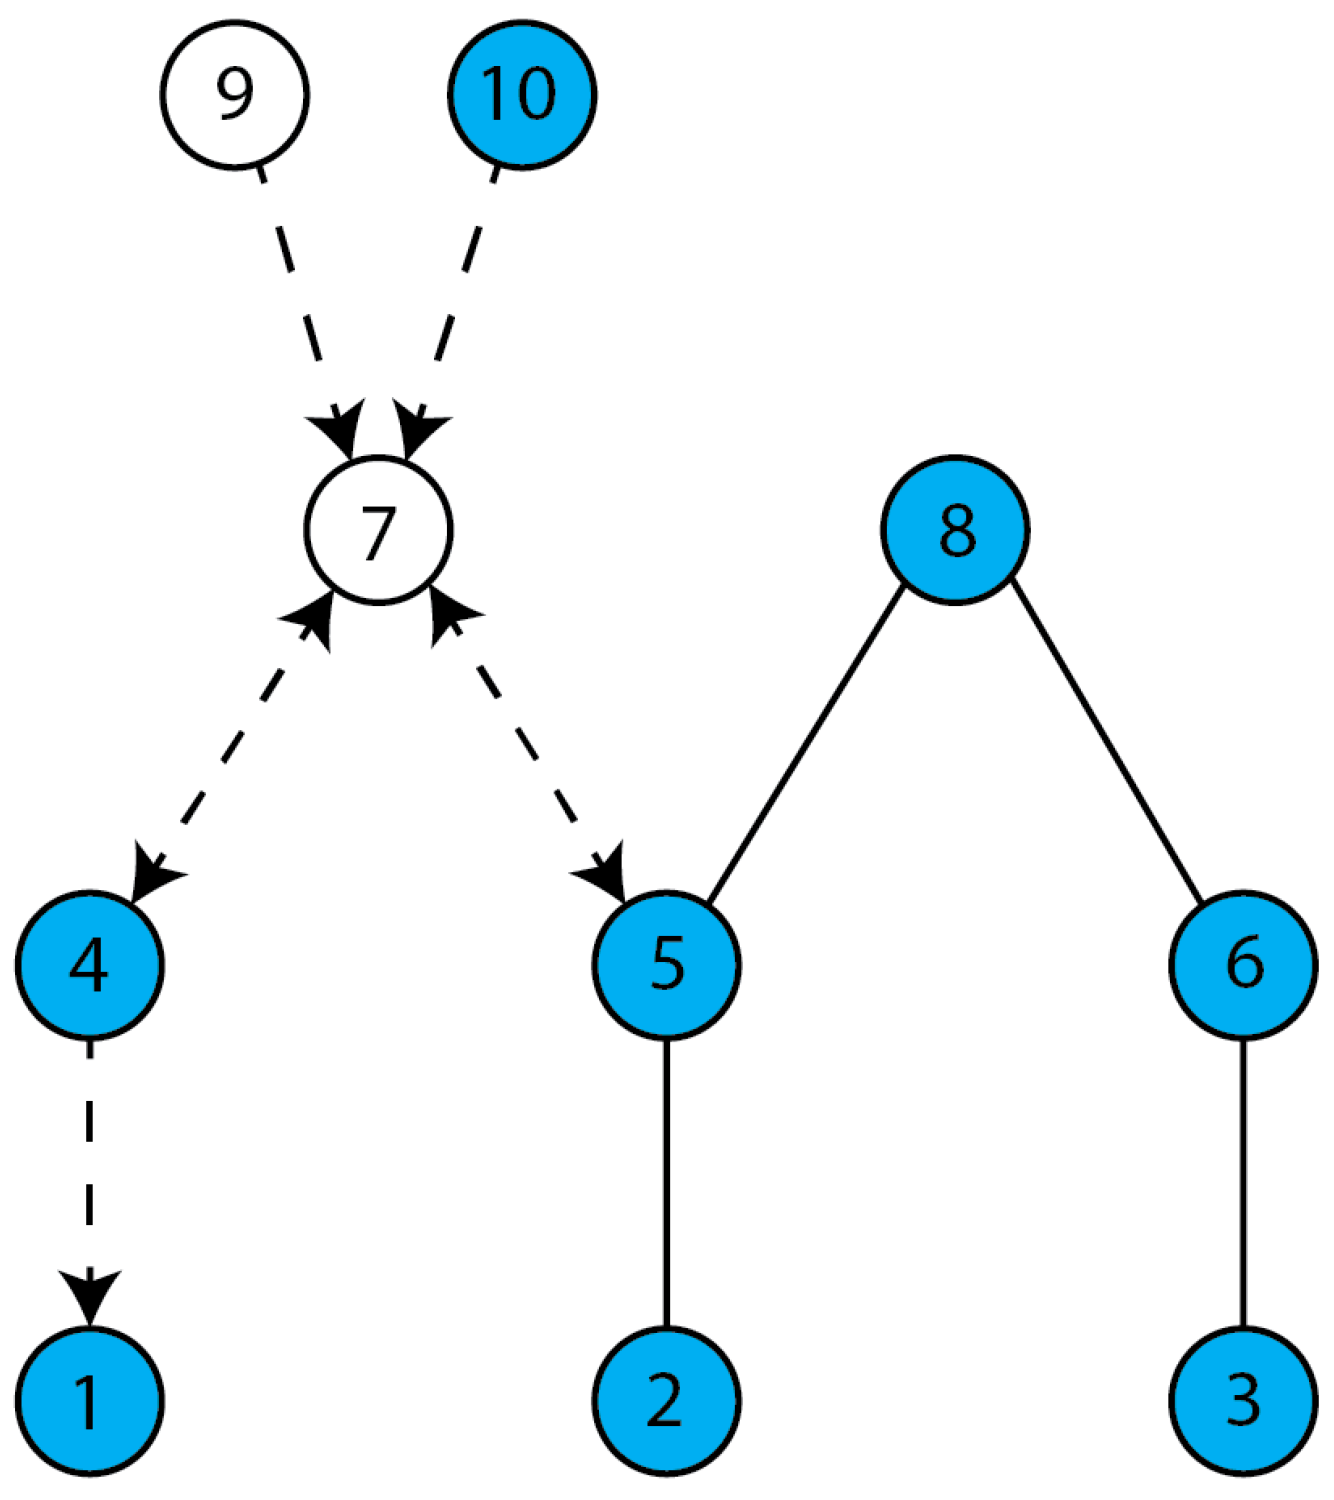
While the first example illustrates a simple linear assembly, the second case study considers a two-dimensional building frame previously analyzed by Sanchez and Haas [16] (Figure 3). Four increasingly complex analyses illustrate the potential and the limitations of the current method. All cases are based on the same structure and network (Figure 3 and Figure 4); only some metadata or additional information vary.
4.2.1. Initial Situation
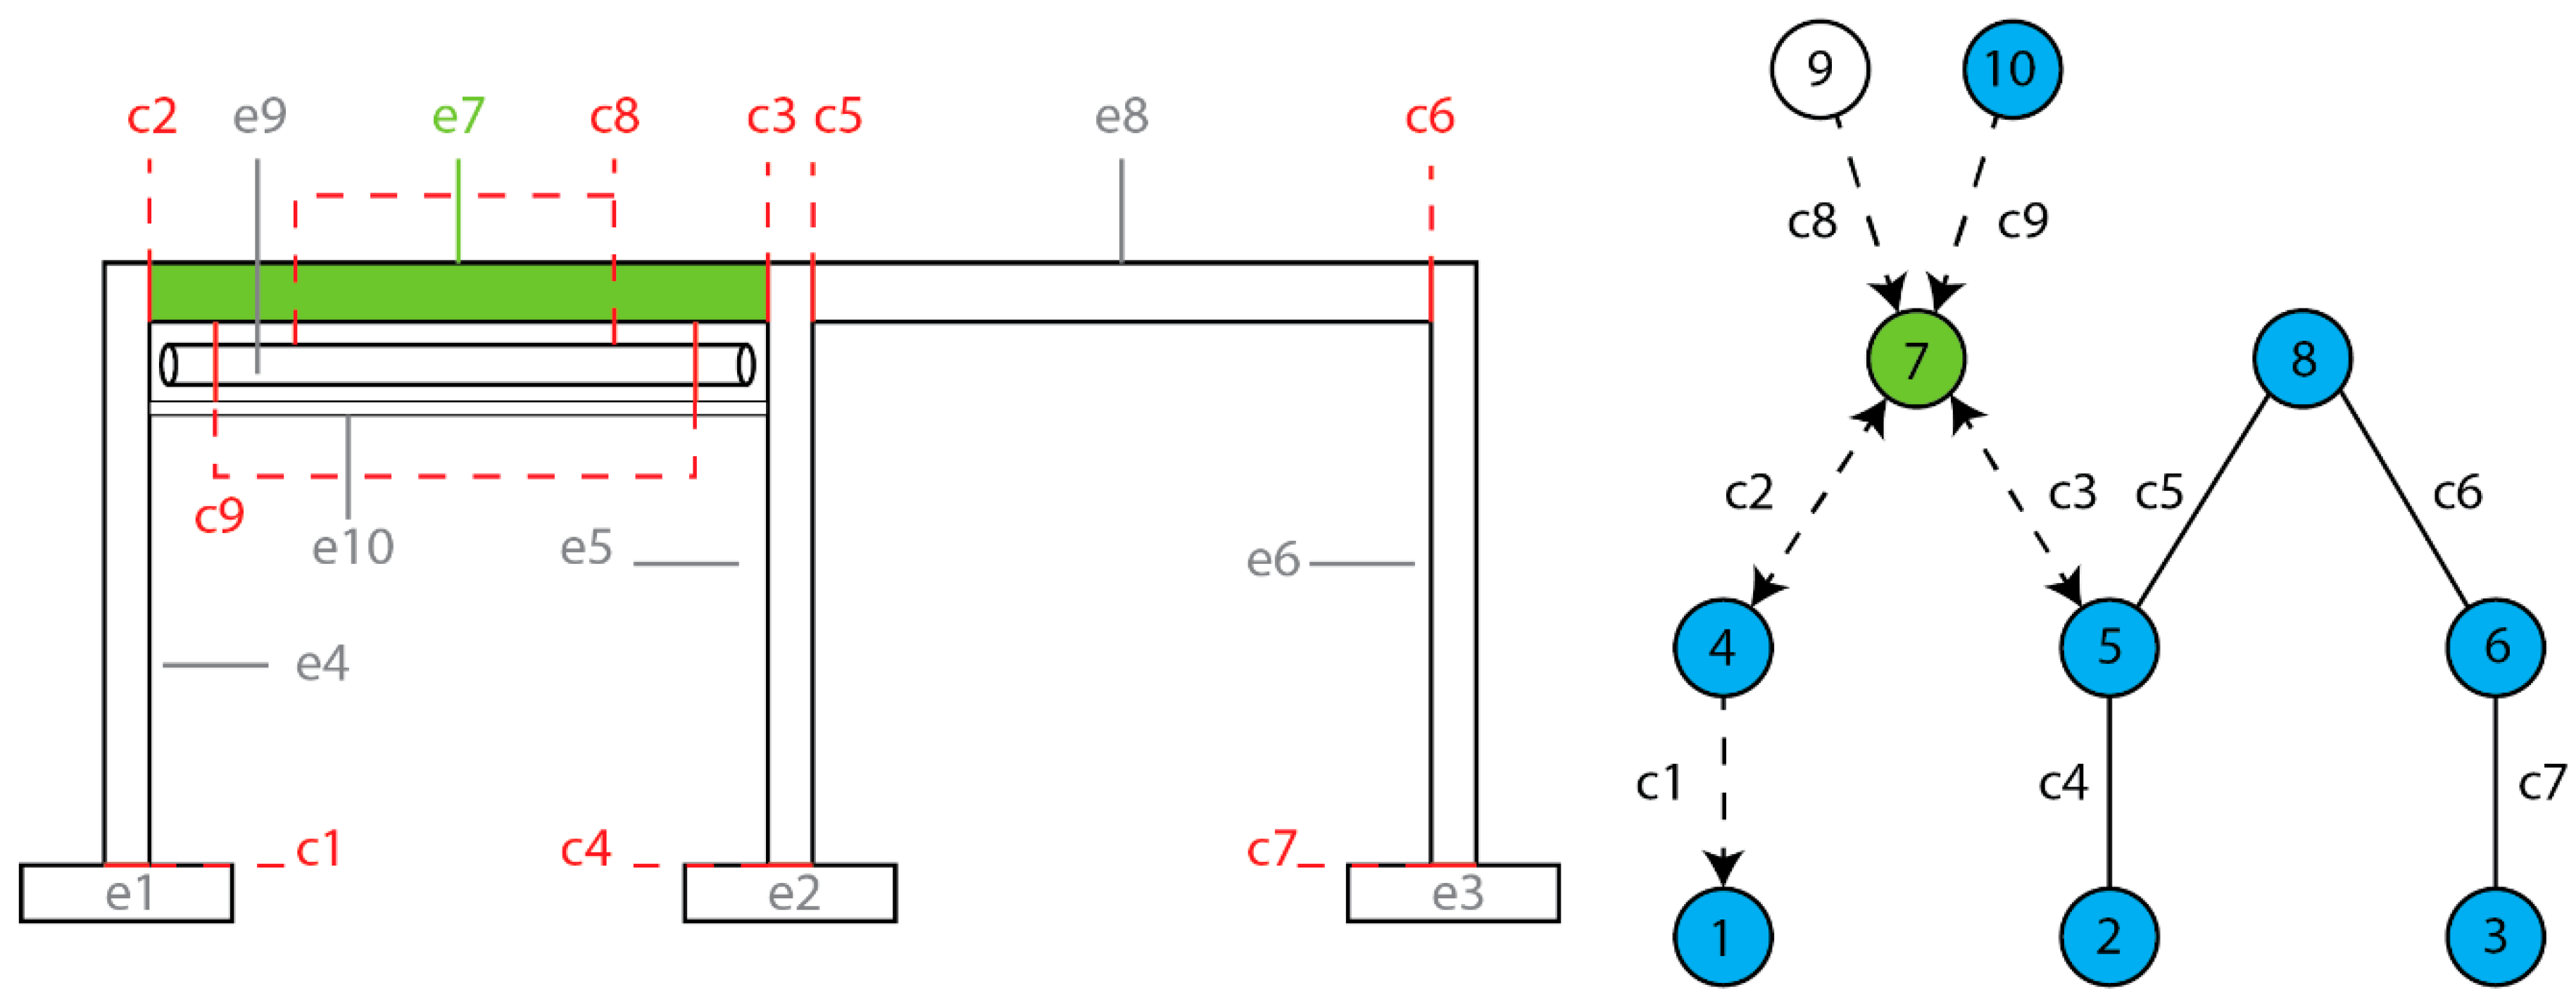
The first variation considers that no information is given regarding the interdependencies between elements. Therefore, the DNA method, in accordance with the guiding rules, considers the worst case, i.e., all elements depend on the structural elements (elements e9 and e10) (Figure 5).
If the element to recover is the left beam (e7), a quick preliminary check gives the following results:
- Is e7 transportable? Yes.
- Can each connection with e7 be disconnected? Yes.
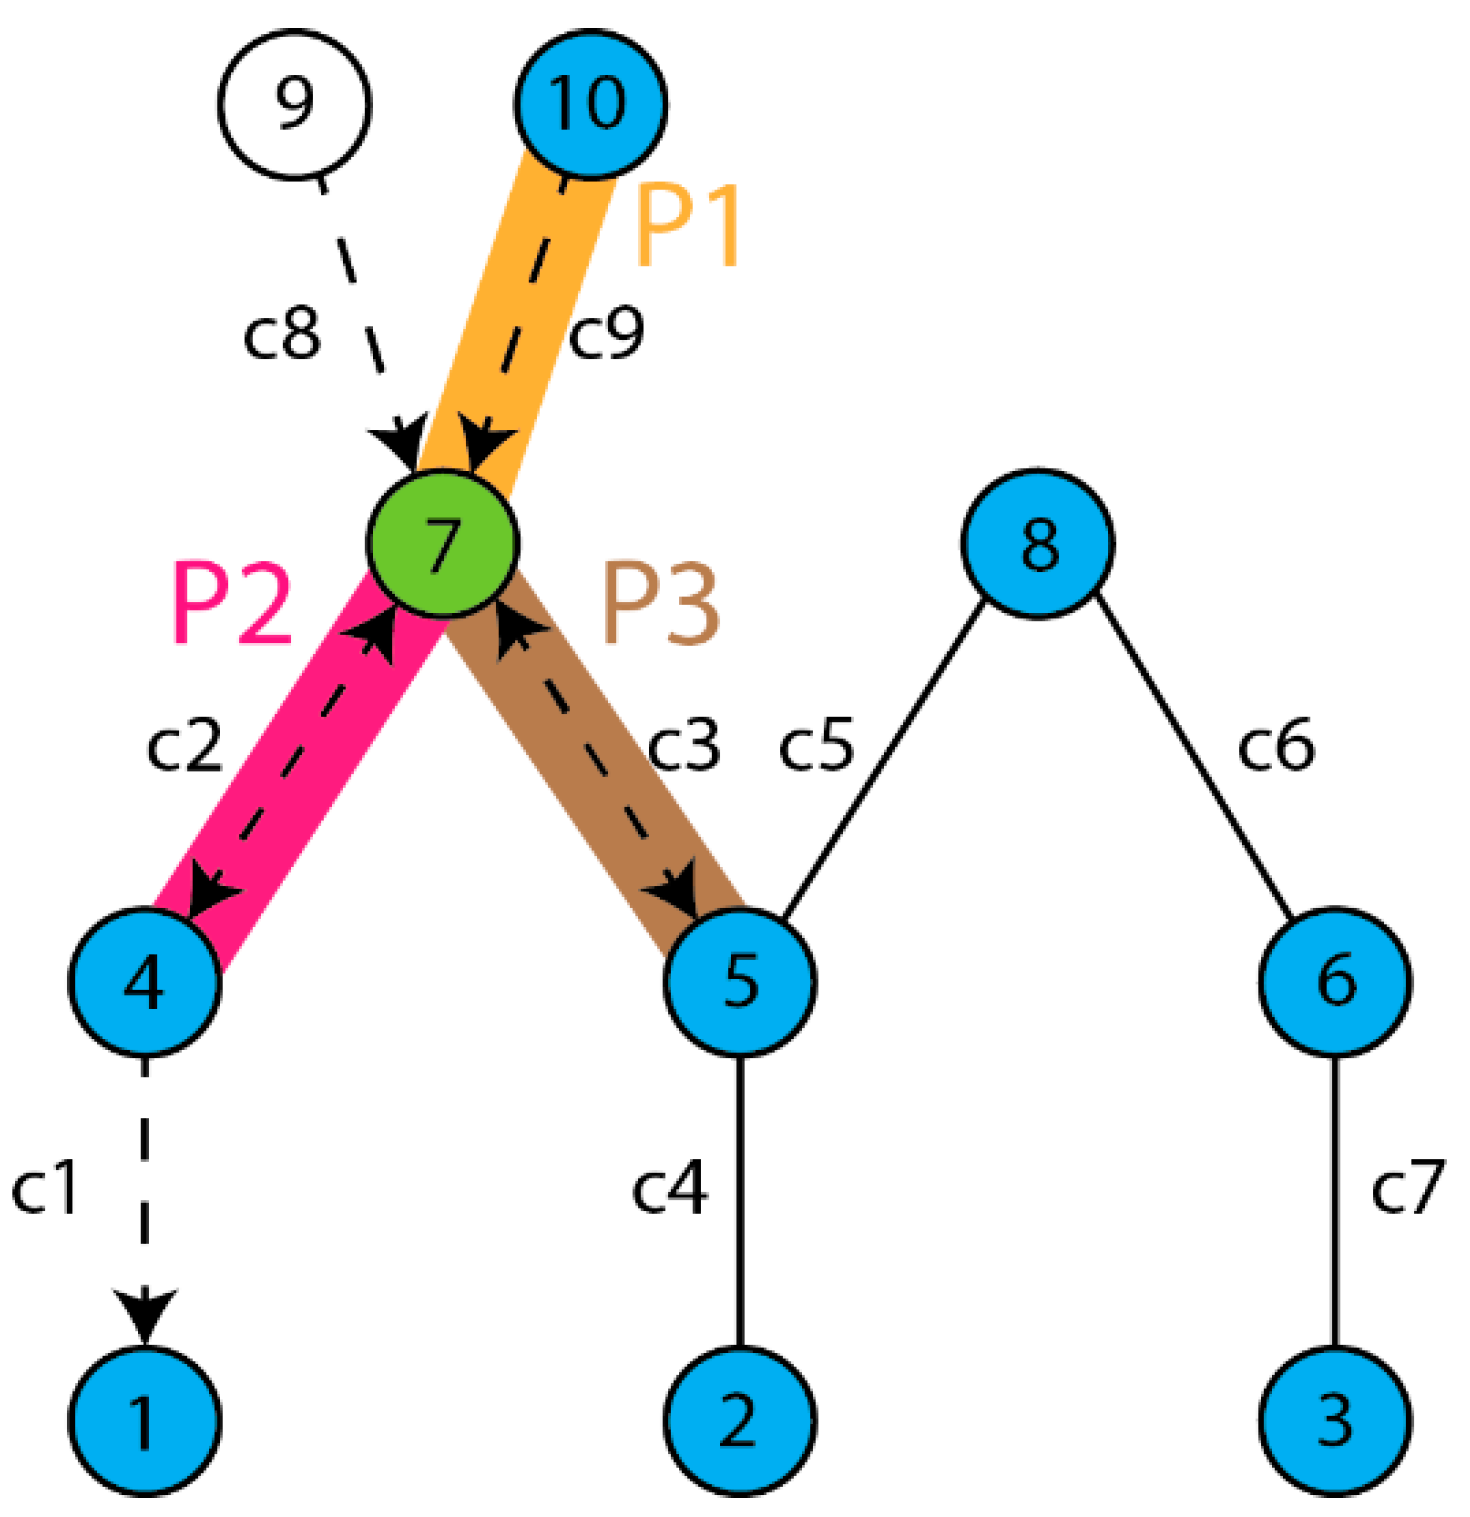
Therefore, the preliminary check concludes that e7 is potentially recoverable, and the assessment can continue. The next step establishes the potential paths. Because many elements are accessible, numerous paths can be defined (Figure 6), such as:
- Path P1: elements e7, e10 and connection c9
- Path P2: elements e7, e4 and connection c2
- Path P3: elements e7, e5 and connection c3
Other paths contain one of the three previous paths and are longer.
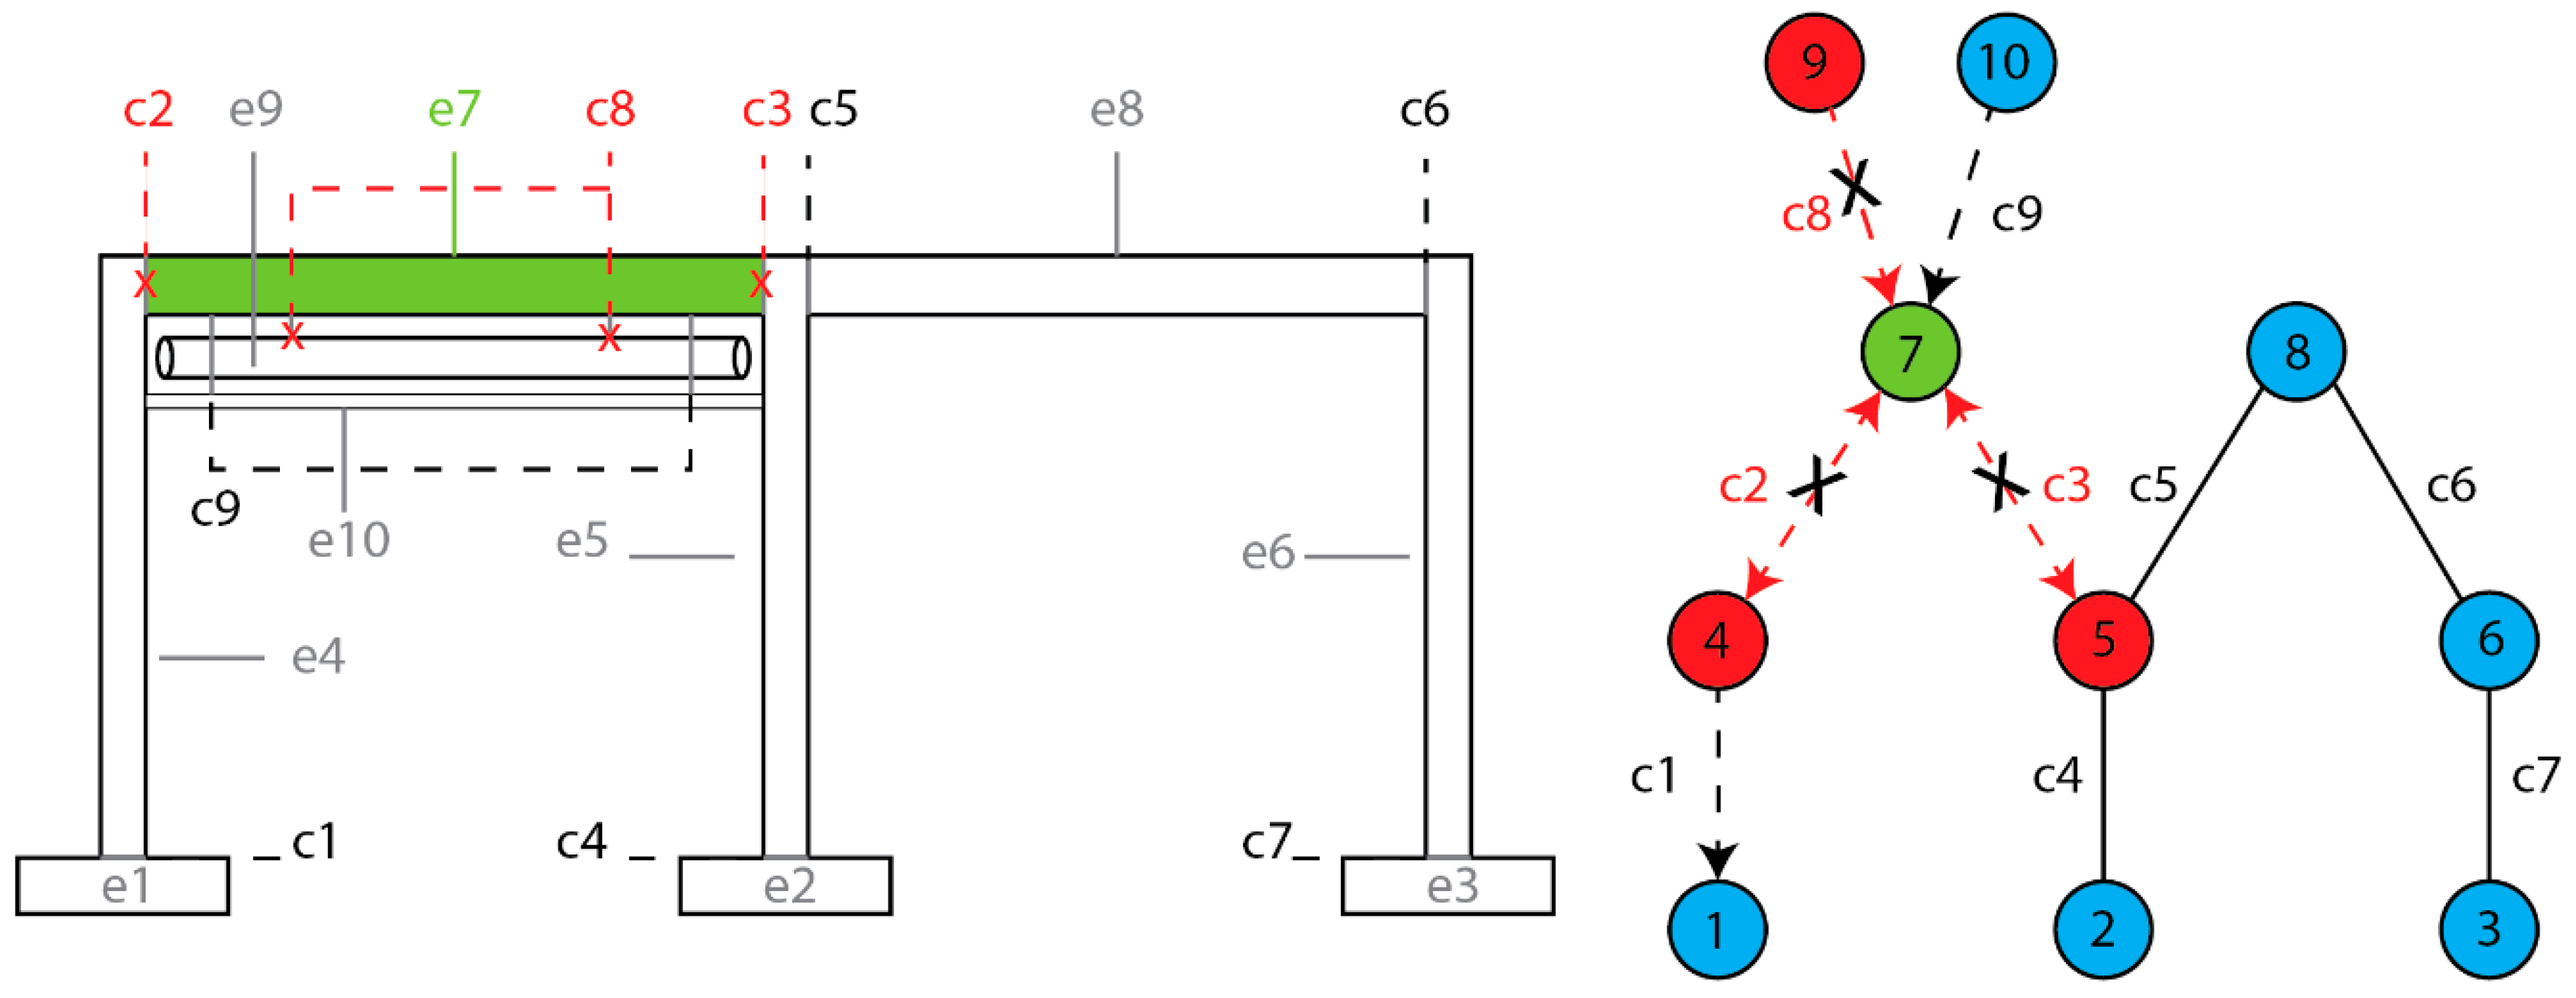
In path P1, several elements must be removed or connection must be unfastened due to interdependencies (Figure 7):
- elements e9, e4, and e5 (i.e., they are considered as dependent on e7)
- connections c8, c2, c3
However, because these elements are also hosting others, the list of elements and connections grows until all elements and connections are considered:
- elements e10, e4, e1, e4, e2, e5, e3, e6 e8, e9, e7
- connections c9, c1, c2, c7, c4, c6, c5, c3, c8
Any other path will be equivalent to path P1 because of the lack of information concerning the interdependencies between different elements. Here, all connections are considered crucial to the building stability and therefore everything must be dismantled. Consequently, these paths are ignored. This case clearly highlights the need for dependencies as the attempt to disassembly one element of the system induces the removal of every element and connection. Due to limited information, the insight provided is limited to recovered and lost materials and total disassembly time. The answer provided by the tool would only be as follows: “The removal of element e7 (and thus, the removal of everything), generates that amount of waste (total waste to disassemble the whole building) in this amount of time (total disassembly time). Connection c4 induces the loss of element e5 and replacing it by a reversible connection would therefore avoid the loss of e5 and We5.”. No information is provided regarding the disassembly sequence or the impact of removing or repairing one particular object on the whole structure. Additionally, comparison of scenarios and design options are limited to the reduced number of parameters that could be studied. Some lessons learned for the DNA method are as follows:
- The final disassembly sequence is not realistic compared to the nature of the elements (beams and columns). In this case, the DNA method always considers that the disassembled objects are supporting the others. In that case, the support (column) is considered as something that needs to be removed prior to the beam (hosted element); this does not come directly from the method but from missing information and data.
- In future development, more nuance can be applied to the default value by considering additional metadata stored within BIM objects, such as the type of object (e.g., beam and column) and their location (e.g., level and host).
- The distinction between sequential and parallel disassembly is not made and results in longer disassembly time. Indeed, the method calculates the number of working hours needed without considering if workers can work in parallel. Hence, future alternatives to distinguish sequential and parallel disassembly can be considered, although this has not been identified as a necessary feature.
- Interdependencies are needed for more detailed investigations and results.
4.2.2. Path Determination on a Simplified Case Considering Dependencies
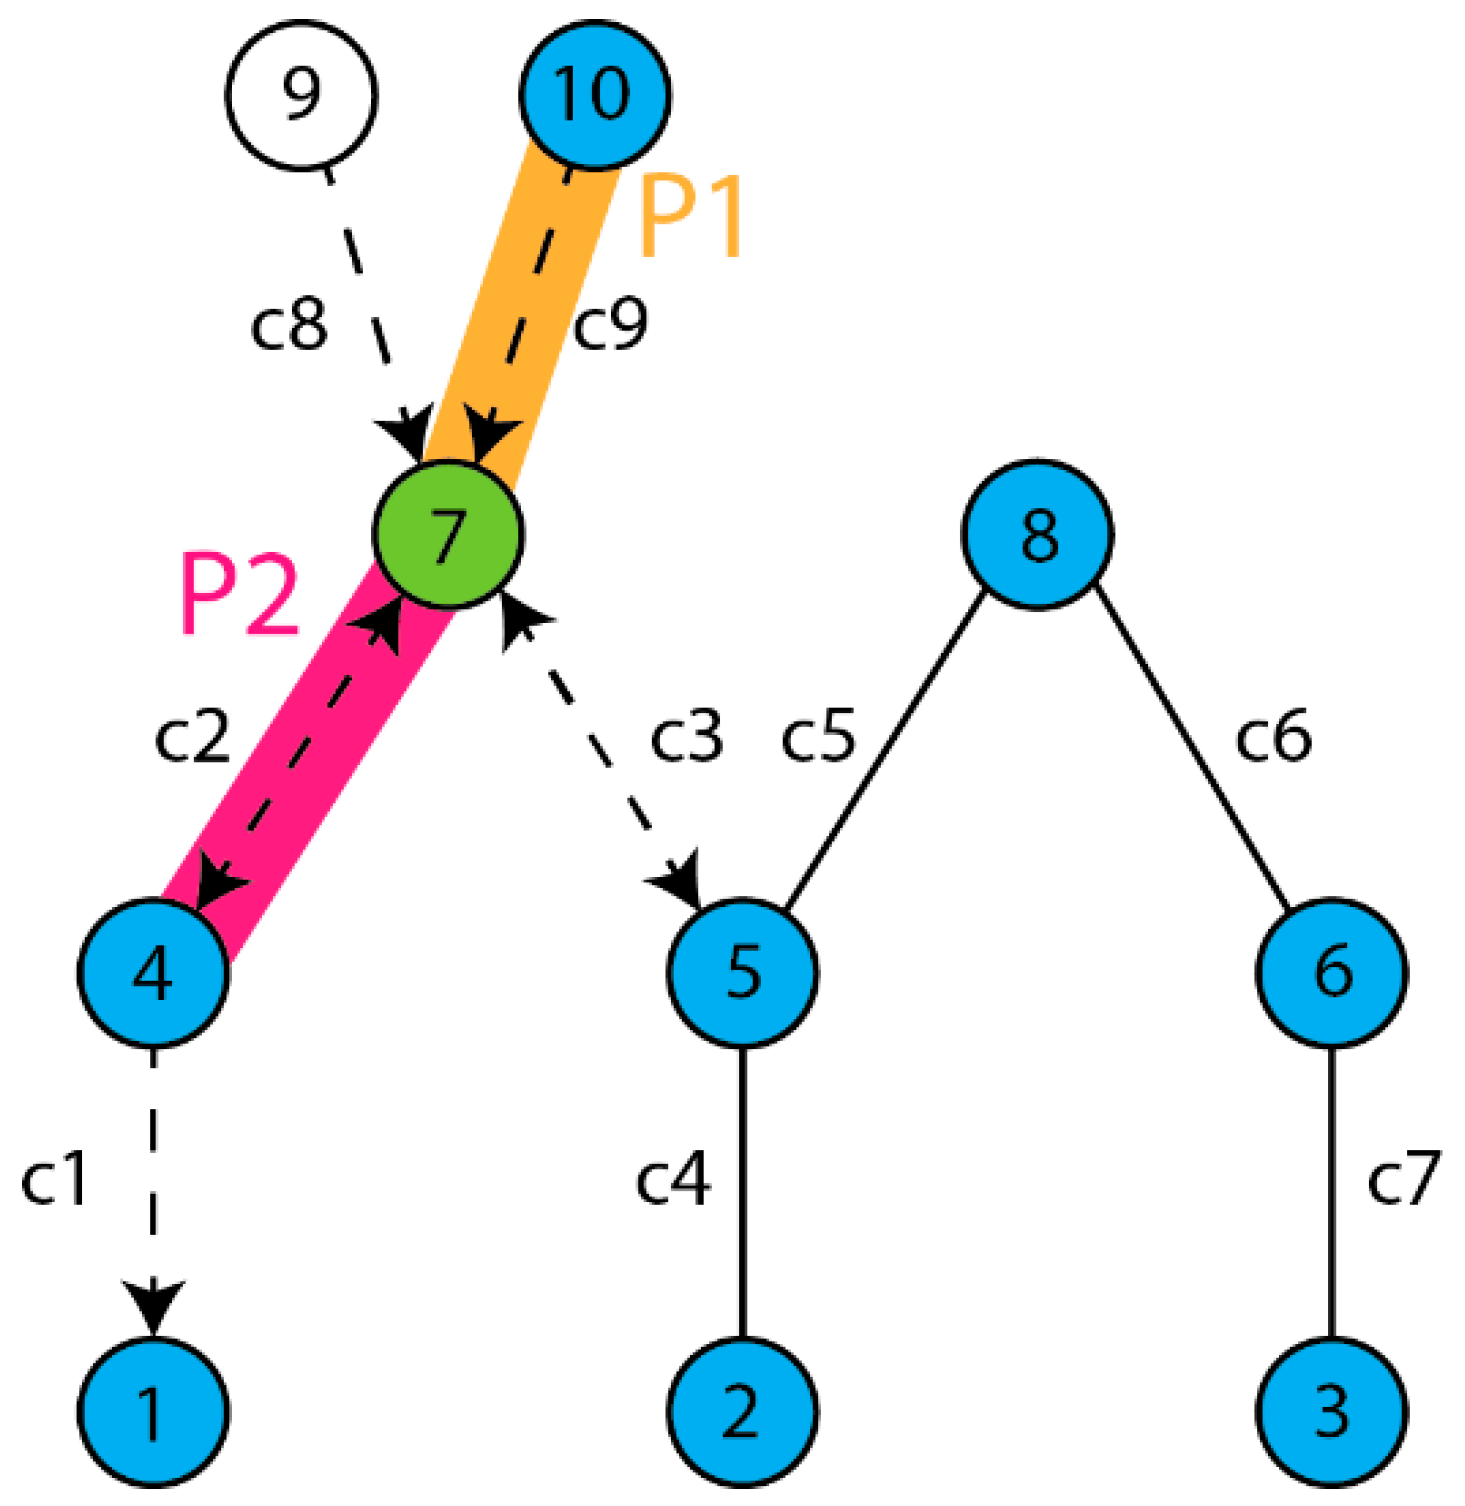
The second variation considers that nonstructural elements depend on structural ones. If two structural elements are connected, the designer must define if they are interdependent. In this case, the beam e7 depends on columns e4 and e5. However, columns e4 or e5 do not depend on e7. Ducts e9 and ceiling e10 depend on e7. Considering the same problem as in the first variation, only two potential sequences to recover e7 are considered (Figure 8):
- In path P1: elements e7, e10 and connection c9
- In path P2: elements e7, e4 and connection c2
Considering the interdependencies, the final list of elements and connections for each path are:
- In path P1: elements e10, e9, e7 and connections c9, c8, c3, c2 (Figure 9)
- In path P2: elements e4, e10, e9, e7 and connections c9, c8, c3, c2, c1
As a first remark, if ducts e10 was inaccessible, the disassembly of e7 would be impossible because e9 and e10 should be removed prior to recovering e7. This would mean that the path considered is not viable, and the method will delete this path from the potential ones.
The user knows the potential ways to recover e7 in addition to a simplified disassembly sequence that could be used to phase the disassembly. If continued, the analysis would allow the time and amount of recovered and lost materials per assembly to be quantified. Below are some lessons learned for the DNA method:
- Following the second guiding rule, this case considers the (structural) interdependence between elements, which therefore reduces the amounts of elements to be removed (compared to case 1). By adding extra information, the user is rewarded with a reduction of the disassembly time and waste generated.
- Two different paths show different results, which illustrates that the method can consider and distinguish various paths. This also represents a huge opportunity because, while a manual method might be more efficient and effective for a reduced number of paths, the added value of the DNA tool will be in the evaluation of several paths and disassembly sequences as a whole.
- No distinction is made between e9 and e10 although, in reality, e10 must be removed prior to e9. This shows the necessity to add a factor considering the “dependence regarding the accessibility of the element”. Indeed, connection c8 and element e9 are only accessible after the removal of e10. This can be made by adding accessibility interdependencies (similar way to structural dependency) as inputs, either as a parameter in the model, a cell in a calculation sheet, or through a dependency graph.
4.2.3. Propagation of Dependencies on a Path
In this case, the recovery of another element (e1) will be considered. The only additional dependence that must be defined is that the column e4 is supported by the foundation e1. Following the same process and because e1 is supporting e4, “removing e1” will first need to remove e4, which needs to remove e7, which in turn depends on the removal of e9, e10, and connection c3. This results on the disassembly of the left frame while the right frame is still stable (Figure 10).
The method allows designers to know that the only possible way to get element e1 is to completely dismantle the left frame (Figure 3).
The lessons learned for the DNA method are as follows:
- The propagation of dependencies seems robust and allows several cases to be distinguished quite easily.
- This case shows once again that the more information provided, the better are the results. This complies with the second guiding rule.
- Without any dependence, the answer will become “remove c1”, which is not realistic.
4.2.4. Complete Application of the Method on the Frame Structure
Supposing the aim is to get element e2, which is transportable, we first need to check if it is possible to extract e2 before checking how we can access it. The connection c4 is not reversible; thus, the method must establish if e2 could be damaged by the removal of this connection. To do so, the resistance (theoretical value, which depends on several factors that should be further investigated) between the element e2, the connection, and the other element it is connected to are compared. In this case R2, Rc4, and R5 are compared with the resistance of the elements and the resistance of the in-between connection. Supposing the resistance of e2 (R2) is higher than at least one of the others, e2 can be removed without damage.
Element e2 is considered directly accessible (blue in the network), which suggests that it will be easy to get it. If this path exists, it will always be prioritized because it only considers the removal of connections without having to remove extra elements. Therefore, all other paths will at least include this subpart. Potential paths are as follows:
- In path P1: elements e2 and connections: nothing yet
- In path P2: elements e2, e5 and connections: c4
However, due to the structural interdependencies elements, e10, e9, e7, e8, and e5 must be removed prior to e2. And thus, the disassembly sequence (by connection) is c9, c8, c2, c3, c5, c6, c4 (Figure 11).
As connections c9, c8, c3, c2 are reversible (and in the right direction), elements e10, e9, ande7 are added to the recovered elements list. The time considered to remove these connections is the disassembly time (Td), which is 60 min, 30 min, 45 min, and 45 min for c9, c8, c3, and c2, respectively.
On the contrary, all the other connections are not reversible, which means that waste will be created. However, to know which elements are going to be demolished, we need to compare their resistance.
Considering that Re2 > Re5 = Re6 > Re8 and that the connection itself will never break(if the connection breaks then no waste is generated except the connection itself), it induces that the removal of c5 will break e8, which will be included in the list of lost elements with a destruction time Tb = 10 min. Then, the removal of c6 is the same. The connection c4 is then removed, which generates the loss of e5 (in 5 min).
In the end, the lost elements are e5 and e8, and the total weight of waste is the sum of each element’s weight. The total disassembly time is the sum of the disassembly times (Td) except for c4, c5, and c6, where the destruction time (Tb) has been considered.
For path P1: Total disassembly time = 60 + 30 + 45 + 45 + 10 + 10 + 5 = 205 minutes.
Total amount of waste = We5 + We8.
Additionally, the method informs the user that the loss of e5 is only due to connection c4. Therefore, if c4 is replaced by a reversible connection, the total amount of waste will be reduced by We5. However, this does not apply for element e8 as it is broken due to connections c5 and c6.
As an alternative result, connection c9 takes 60 min (Td) to be unfastened because the ceiling is attached in several places to the beam, but it takes only 10 min to break (Tb). Therefore, if time is a predominant factor, the method might suggest the following: “In path P1, if you remove c9 by breaking e10, the disassembly duration will be 50 min shorter (25%) but you will generate 25 kg of extra waste (We10)”.
Some lessons learned for the DNA method:
- The removal of connections c5 and c6 both generate the loss of element e8. Element e8 is listed twice in the lost elements list to differentiate this case with a case where only one connection is leading to the loss of e8. However, when calculating the amount of waste generated by one element, the weight will be counted only once. The time of each disconnection is considered as we do not know whether the two connections will fail together or not (to be on the safe side).
- While checking connection c4, it is important to note that although the target element is the weakest, it may still be possible to get a part of it. In the method, the elements are considered “recovered”’, only if the conditions for disassembly are met. Therefore, we have decided to overestimate waste and underestimate elements that could be recovered (to be on the safe side).
5. Discussion
Finally, we discuss here three aspects: (1) the elaborated method in comparison to the original objectives, (2) the use of networks analysis (NA) and (3) the use of Building Information Modeling in the DNA method. The discussion of each aspect is structured following a SWOT (Strengths, Weaknesses, Opportunities, Threats) analysis. It focuses on the present stage of development of the DNA method, and future development tracks are also presented.
5.1. Development of the Disassembly Quantification Method
Although the DNA method is in a preliminary stage of development, its strengths can already be discussed (Table 6). First, the method quantifies the recovered and lost elements during a partial (or complete) disassembly. Because it measures material flows and disassembly time, the information provided by the DNA method can serve to refine material inventories for environmental and financial analyses. Flows of recovered and lost materials indicate the resource consumption and waste generated during the partial disassembly of the building. The DNA method can highlight inefficiencies in the design and calculate the total reliance on material input at building level. For example, if the target element to disassemble needs to be frequently replaced, there should be a path to access this element while limiting the loss of other elements. Material consumption and waste generation can then be associated with environmental effects and financial costs. Disassembly time enters in the calculation of labor costs. Moreover, the DNA method provides a generic backbone for different assessment types because additional parameters characterizing construction elements could be used as value metrics for social and cultural aspects without having to change the method drastically.
Second, the DNA method is simple and transparent; the basic principles and rules behind the method are clearly identifiable by the user. With the flowchart (Section 3.2) and the guiding rules (Section 2.2), the core principles behind the method are accessible.
Third, with the different ways of using the output (evaluation, comparison, and optimization), the DNA method adapts to the different levels of information and stands on the safe side in case of missing or uncertain information (Section 2.2). By default, elements are considered as lost, and more reliable information on the implementation of Design for Disassembly criteria allows elements (and thus materials) to be counted as recovered. Hence, the method can be used in early design too, and users are encouraged to provide more reliable data to improve the impact indicators.
Furthermore, the DNA method uses BIM data and graph theory mathematics as a backbone for the assessment but is not reliant on the use of a specific software. This ensures the future development, improvement, and dissemination of the method.
In short, the DNA method is a transparent, strictly quantitative assessment that uses partially available information to evaluate a design according to different sustainability aspects but remains independent from the use of a specific software. In further development, this method will be implemented in a software tool to test it more quickly on different configurations and increase its robustness. A software tool can make the method accessible for the design and construction practice. Part of the method could rely on existing algorithms, for instance, shortest path algorithms.
Nevertheless, the usability of the DNA method is mainly threatened by the amount of data to manually enter (in addition of the actual work of a designer) to use it properly. Simplifications and automation could facilitate and speed up the process, but they could also decrease the liability of the output. Therefore, a compromise between these two positions must be determined to ensure a maximization of outcomes and insight with a minimization of additional work.
5.2. Integration of Network Analysis
The DNA method shows that we can use network analysis to analyze the interconnectedness of buildings and elements and obtain information only accessible through NA. The whole potential of NA has not been explored yet. We could increase the added value of NA by exploiting its robust mathematical background, for instance, the calculation of NA metrics such as centrality and cluster coefficients.
Nevertheless, modeling a building using networks inevitably leads to an abstraction or simplification of the real building, as in any model. This induces a loss of information and threatens the reliability of the result. For instance, on a graph of connections—contrary to a graph of dependence—connections are not nodes but links between two nodes. On this type of graph, the dependence between elements is more difficult to detect. Additionally, the added value of networks may decrease if the method fails in balancing the usability of the output with the complexity of the assessment.
5.3. Integration of Building Information Modeling (BIM)
Using Building Information Modeling data in the future tool, we will try to automate the data collection and assessment step and gain more insight with a lower amount of the workload. This tool could make the assessment accessible to nonexperts.
On the other hand, the assessment can only use information stored in the model. This means that the modeling method and software limitations can lead to imprecision and prevent the complete implementation of the DNA method into a practical tool. A key challenge lies in the connections between elements, which are rarely geometrically modeled in BIM.
6. Conclusions
This paper presents the preliminary elaboration of a method to quantify the impact of Design for Disassembly, a strategy to promote an efficient use of materials in buildings and reduce construction and demolition waste. This method, called Disassembly Network Analysis, evaluates the interdependency between building elements. It estimates the time needed to disassemble a building element and the resulting material flows, expressed in mass of recovered or lost elements. Because it measures material flows and disassembly time, the information provided by the DNA method can serve to refine material inventories for environmental and financial analyses, such as material flow analysis (MFA), life cycle assessment (LCA), and life cycle costing (LCC). DNA provides information about the resource consumed and waste generated during the disassembly of building elements, which can then be associated with environmental effects and financial costs. The two illustrative examples show how network analysis and Building Information Modeling contribute to delivering information about flows of recovered and lost materials and disassembly time.
Contrary to the reviewed methods (Section 2), the disassembly quantification method directly links the impacts (on material flows and disassembly time) to design decisions. When further developed, the method will be used to evaluate, compare, and especially optimize design options, suggesting possible design improvements to the user. For example, it will highlight inefficiencies in the design or find optimization points between disassembly times and avoid waste.
In this method, we illustrate the need to have a set of “quantified” verifiers for each DfD criterion to avoid the method having to depend on the assessor. In this paper, we suggest potential verifiers and show where verifiers must be added or nuanced. Nevertheless, it is likely impossible to fully objectivize all DfD criteria. This should not be an issue if the assessment remains transparent and communicates openly on the considered parameters.
In further research, we will implement the DNA method in a software tool using Building Information Modeling data. This tool would then give the user insightful information with a lower amount of workload by simply linking pieces of information. Finally, to avoid exceptions or combinations that have not been considered, we will test the tool on varying case studies and therefore increase its robustness. Hopefully, such tool might raise awareness among design stakeholders concerning the potential environmental and economic savings due to Design for Disassembly and the key design parameters influencing them.
Author Contributions
François Denis and Camille Vandervaeren were involved in the following tasks: Conceptualization, Methodology, Validation, Writing—Original Draft Preparation, Visualization, Writing—Review and Editing. Niels De Temmerman was involved in Writing—Review, Editing, Supervision and Funding Acquisition.
Funding
This research was funded by Fonds Wetenschappelijk Onderzoek (FWO); François Denis, IWT grant number 141332; Camille Vandervaeren, FWO-SB grant number 1S67717N.
Acknowledgments
As the method builds on former knowledge acquired through years of research and expertise from various researchers, the authors wish to thank all the members of the TRANSFORM research team—part of the architectural engineering department of the Vrije Universiteit Brussel—for the support, knowledge generation, valuable discussions, and feedback, which allowed the development of this method.
Conflicts of Interest
The authors declare no conflict of interest.
References
- Paduart, A. Re-Design for Change: A 4 Dimensional Renovation Approach towards a Dynamic and Sustainable Building Stock. Ph.D. Thesis, Vrije Universiteit Brussel, Brussels, Belgium, 2012. [Google Scholar]
- Durmisevic, E. Transformable Building Structures. Design for Disassembly as a Way to Introduce Sustainable Engineering to Building Design & Construction. Ph.D. Thesis, Technische Universiteit Delft, Delft, The Netherlands, 2006. [Google Scholar]
- Eurostat Database. Eurostat. Available online: http://ec.europa.eu/eurostat/data/database?node_code=env_wasgen (accessed on 6 August 2018).
- Thormark, C. Recycling Potential and Design for Disassembly in Buildings. Ph.D. Thesis, Lund University, Lund, Sweden, 2001. [Google Scholar]
- Guy, B.; Ciarimboli, N. DfD—Design for Disassembly in the Built Environment: A Guide to Closed-Loop Design and Building; University Park: State College, PA, USA, 2005. [Google Scholar]
- Galle, W.; De Temmerman, N.; Allacker, K.; De Meyer, R. Geometric service life modelling and discounting, a practical method for parametrised life cycle assessment. Int. J. Life Cycle Assess. 2017, 22, 1191–1209. [Google Scholar] [CrossRef]
- Vandenbroucke, M. Design, Dimensioning and Evaluation of Demountable Building Elements. Ph.D. Thesis, Vrije Universiteit Brussel, Brussels, Belgium, 2016. [Google Scholar]
- Akinade, O.O.; Oyedele, L.O.; Bilal, M.; Ajayi, S.O.; Owolabi, H.A.; Alaka, H.A.; Bello, S.A. Waste minimisation through deconstruction: A BIM based Deconstructability Assessment Score (BIM-DAS). Resour. Conserv. Recycl. 2015, 105, 167–176. [Google Scholar] [CrossRef]
- Garber, R. BIM Design: Realising the Creative Potential of Building Information Modelling; Wiley: Chichester, UK, 2014; ISBN 978-1-118-71980-0. [Google Scholar]
- Lévy, F. BIM in Small-Scale Sustainable Design, 1st ed.; Wiley: Hoboken, NJ, USA, 2011; ISBN 978-0-470-59089-8. [Google Scholar]
- Ghyoot, M.; Devlieger, L.; Billet, L.; Warnier, A. Déconstruction et Réemploi: Comment Faire Circuler les Éléments de Construction; PPUR: Lausanne, Switzerland, 2018. [Google Scholar]
- Hansen, D.; Shneiderman, B.; Smith, M.A. Analyzing Social Media Networks with NodeXL: Insights from a Connected World; Morgan Kaufmann: Burlington, MA, USA, 2010; ISBN 978-0-12-382230-7. [Google Scholar]
- Smith, S.; Chen, W.-H. Multiple-Target Selective Disassembly Sequence Planning with Disassembly Sequence Structure Graphs. In Proceedings of the ASME 2012 International Design Engineering Technical Conferences and Computers and Information in Engineering Conference, Chicago, IL, USA, 12–15 August 2012; p. 1305. [Google Scholar]
- Teunter, R.H. Determining optimal disassembly and recovery strategies. Omega 2006, 34, 533–537. [Google Scholar] [CrossRef] [Green Version]
- Ghandi, S.; Masehian, E. Review and taxonomies of assembly and disassembly path planning problems and approaches. Comput.-Aided Des. 2015, 67–68, 58–86. [Google Scholar] [CrossRef]
- Sanchez, B.; Haas, C. A novel selective disassembly sequence planning method for adaptive reuse of buildings. J. Clean. Prod. 2018, 183, 998–1010. [Google Scholar] [CrossRef]
- Denis, F. The potential of graph theories to assess buildings’ disassembly and components’ reuse: How building information modelling (BIM) and social network analysis (SNA) metrics might help Design for Disassembly (DfD)? In Proceedings of the HISER International Conference 2017: Advances in Recycling and Management of Construction and Demolition Waste, Delft, The Netherlands, 21–23 June 2017; pp. 123–128. [Google Scholar]
- Langston, C.; Wong, F.K.W.; Hui, E.C.M.; Shen, L.-Y. Strategic assessment of building adaptive reuse opportunities in Hong Kong. Build. Environ. 2008, 43, 1709–1718. [Google Scholar] [CrossRef]
- Conejos, S.; Langston, C.; Smith, J. AdaptSTAR model: A climate-friendly strategy to promote built environment sustainability. Habitat Int. 2013, 37, 95–103. [Google Scholar] [CrossRef] [Green Version]
- Van Nunen, H. Assessment of the Sustainability of Flexible Building: The Improved Factor Method: Service Life Prediction of Buildings in The Netherlands Applied to Life Cycle Assessment. Ph.D. Thesis, Technische Universiteit Eindhoven, Eindhoven, The Netherlands, 2010. [Google Scholar]
- Gosling, J.; Sassi, P.; Naim, M.; Lark, R. Adaptable buildings: A systems approach. Sustain. Cities Soc. 2013, 7, 44–51. [Google Scholar] [CrossRef]
- Bogue, R. Design for disassembly: A critical twenty-first century discipline. Assem. Autom. 2007, 27, 285–289. [Google Scholar] [CrossRef]
- Fogg, B. A behavior model for persuasive design. In Proceedings of the 4th International Conference on Persuasive Technology, Claremont, CA, USA, 26–29 April 2009. [Google Scholar]
- Yocco, V.S. Design for the Mind: Seven Psychological Principles of Persuasive Design; Manning: Shelter Island, NY, USA, 2016; ISBN 978-1-61729-295-8. [Google Scholar]
- Fogg, B.J.; Cuellar, G.; Danielson, D. Motivating, influencing, and persuading users: An introduction to captology. In Human Computer Interaction Fundamentals; CRC Press: Boca Raton, FL, USA, 2009; pp. 109–122. [Google Scholar]
Figure 1.
Flowchart of the DNA method. The method is subdivided into four parts: quick check, sequence determination, quantification and processing information, and feedback. This allows each part to be developed and improved independently and ensures future improvements in the method.
Figure 1.
Flowchart of the DNA method. The method is subdivided into four parts: quick check, sequence determination, quantification and processing information, and feedback. This allows each part to be developed and improved independently and ensures future improvements in the method.

Figure 2.
Vertical section and network visualization of the façade wall. The direction of a connection is indicated by an arrow and its potential to be unfastened by a dashed line.
Figure 2.
Vertical section and network visualization of the façade wall. The direction of a connection is indicated by an arrow and its potential to be unfastened by a dashed line.

Figure 3.
Each element, e#, is attached to another one through a connection, c#. It should be noted that a set of connectors is considered as one connection. Adapted from Sanchez and Haas [16].
Figure 3.
Each element, e#, is attached to another one through a connection, c#. It should be noted that a set of connectors is considered as one connection. Adapted from Sanchez and Haas [16].

Figure 4.
Disassembly network of the frame presented in Figure 3. Building elements are presented as nodes and connections as edges. This graph eases the visual distinction between reversible (left side) and irreversible (right side) connections.
Figure 4.
Disassembly network of the frame presented in Figure 3. Building elements are presented as nodes and connections as edges. This graph eases the visual distinction between reversible (left side) and irreversible (right side) connections.

Figure 5.
Visualization and disassembly network of the first case focusing on the extraction of the beam e7 from the structure. By convention, the element in green is always the element that is considered to be recovered and elements in blue are directly accessible.
Figure 5.
Visualization and disassembly network of the first case focusing on the extraction of the beam e7 from the structure. By convention, the element in green is always the element that is considered to be recovered and elements in blue are directly accessible.

Figure 6.
Three possible paths—P1, P2, and P3—to get to element 7. All other paths will be longer than those three. These paths represent the first step of the process and each path will be investigated further in order to define whether additional elements or connections must be tackled due to interdependencies.

Figure 7.
Disconnection of elements connected to target element e7. In the first path (P1), the first necessary step needed to be able to take out the beam e7 is to unfasten all the connections between e7 and other elements. Additionally, because of the missing information regarding interdependencies, the method considers that all the other elements in red in the network (e4, e5, and e9) also depend on e7 and must therefore be removed as well.

Figure 8.
The two potential paths considered in this example are not the only one. They were selected to highlight the importance of the determination of interdependencies.
Figure 8.
The two potential paths considered in this example are not the only one. They were selected to highlight the importance of the determination of interdependencies.

Figure 9.
The extraction of element e7 considering the path P1 initiates the removal of connections c9, c8, c2, and c3 and the removal of elements e9 (ducts) and e10 (ceiling). For path P2, the only difference lies in the extra removal of element e4 (column) and the disconnection of c1.
Figure 9.
The extraction of element e7 considering the path P1 initiates the removal of connections c9, c8, c2, and c3 and the removal of elements e9 (ducts) and e10 (ceiling). For path P2, the only difference lies in the extra removal of element e4 (column) and the disconnection of c1.

Figure 10.
The disassembly sequence (represented by the succession of illustrations above) to get element e1 (the foundation of the column) does not only rely on the removal of the column e4 but also on all the others elements depending on this column.
Figure 10.
The disassembly sequence (represented by the succession of illustrations above) to get element e1 (the foundation of the column) does not only rely on the removal of the column e4 but also on all the others elements depending on this column.

Figure 11.
The disassembly sequence, the filtering of element (into lost or recovered elements), and the calculation of the total disassembly time are calculated sequentially after having determined the elements and connections that need to be removed to get the element (shortest path) and to be able to remove it (interdependencies).


Table 1.
Review of five building assessment methods for Design for Disassembly: Durmisevic’s Knowledge Model, Building Information Modeling-based Deconstructability Assessment Score (BIM-DAS), adaptive reuse potential (ARP), AdaptSTAR, and Sanchez and Haas’ sequence disassembly planning for buildings (SDPB) method.
| Name | Reference Publication | Tools and Methods Used | Output Data |
|---|---|---|---|
| Durmisevic’s Knowledge Model | [2] | Fuzzy logic, disassembly sequences. | Aggregated score (disassembly and interchangeability) |
| BIM-DAS | [8] | Unweighted checklist of design strategies for deconstruction and reuse using BIM data. | Aggregated score (disassembly and reuse) |
| ARP | [18] | Multicriteria sustainability analysis tool (SINDEX). | Useful life (in years) |
| AdaptSTAR | [19] | Weighted checklist of design strategies towards adaptable buildings. | Aggregated score (various design aspects) |
| Sanchez and Haas’ SDPB method | [16] | Disassembly sequence structure graph (DSSG), automated graph plot, BIM data. | Indication of the optimized disassembly sequence path based on disassembly costs and time. |
Table 2.
Parameters involved in the Disassembly Network Analysis (DNA) method. The criteria influencing the potential recovery of a building were considered and translated into verifiers, which could be extracted from a BIM model automatically or provided with a manual input.
Table 2.
Parameters involved in the Disassembly Network Analysis (DNA) method. The criteria influencing the potential recovery of a building were considered and translated into verifiers, which could be extracted from a BIM model automatically or provided with a manual input.
| Criteria | Verifiers | Data Availability in BIM |
|---|---|---|
| Accessibility | The element is free to move in the disassembly direction. | Depending on the Level of Detail. |
| Transportability | Maximum weight, maximum dimensions. | Yes, if weight max is specified by the user. |
| Resistance factor [0,1] | User input or link to external database. | |
| Weight (kg) | Yes. | |
| Reversibility of connection | The two connected elements are separable without damage. | User input or link to external database. |
| Disassemble time and Demolition time | Based on empirical measurements with a weighting factor. | User input or link to external database. |
| Sequential dependence | Which other objects needs to be disassembled prior to the disassembly of object i | User input or partially automatic detection in BIM between family types (e.g., beam, column). |
Table 3.
Values for the elements in the (fictive) façade wall example. These values were arbitrary chosen to illustrate the principle behind the DNA method.
Table 3.
Values for the elements in the (fictive) façade wall example. These values were arbitrary chosen to illustrate the principle behind the DNA method.
| Elements | e1 | e2 | e3 | e4 | e5 |
|---|---|---|---|---|---|
| Element type | Exterior cladding | Membrane | Insulation | Masonry wall | Interior finishing |
| Transportable | Yes | Yes | Yes | No | Yes |
| Resistance | 0.7 | 0.2 | 0.4 | 1 | 0.7 |
| Weight (kg) | 10 | 2 | 5 | 150 | 5 |
Table 4.
Values for the connections between elements in the (fictive) façade wall example. These values were arbitrary chosen to illustrate the principle behind the DNA method.
Table 4.
Values for the connections between elements in the (fictive) façade wall example. These values were arbitrary chosen to illustrate the principle behind the DNA method.
| Connections | c1 | c2 | c3 | c4 |
|---|---|---|---|---|
| Reversible | Yes | No | Yes | Yes |
| Time to disconnect (s) | 60 | / | 60 | 180 |
| Time to break apart (s) | 5 | 220 | 5 | 15 |
Table 5.
Process and results of the first assessment step (quick check). All elements fulfill the requirements except the membrane (e2) and the masonry wall (e4).
Table 5.
Process and results of the first assessment step (quick check). All elements fulfill the requirements except the membrane (e2) and the masonry wall (e4).
| Elements to Recover | e1 | e2 | e3 | e4 | e5 |
|---|---|---|---|---|---|
| 1. Is element transportable? | Yes | Yes | Yes | No, quick check failed. | Yes |
| 2. Are all its connections reversible? | Yes, quick check succeeded. | No, check resistances. | No, check resistances. | / | Yes, quick check succeeded. |
| 3. Is element the most resistant? | / | No, quick check failed. | Yes, quick check succeeded. | / | / |
| Conclusion | Continue the assessment | Cannot be recovered | Continue the assessment | Cannot be recovered | Continue the assessment |
Table 6.
SWOT (Strengths, Weaknesses, Opportunities, Threats) analysis of the DNA method in the current stage of development. Seeing the strengths and opportunities, the DNA method will be further developed in a software tool.
Table 6.
SWOT (Strengths, Weaknesses, Opportunities, Threats) analysis of the DNA method in the current stage of development. Seeing the strengths and opportunities, the DNA method will be further developed in a software tool.
| Strengths | Weaknesses | Opportunities | Treats |
|---|---|---|---|
| Quantitative assessment | “Elements” not yet completely defined | Basis for a software tool | Can become too complicated |
| Linked to design aspects | Missing verifiers | Several methods’ “subparts” already exist as algorithms | Can be too simplistic |
| Transparent method | / | / | / |
| Using available BIM data | / | / | / |
© 2018 by the authors. Licensee MDPI, Basel, Switzerland. This article is an open access article distributed under the terms and conditions of the Creative Commons Attribution (CC BY) license (http://creativecommons.org/licenses/by/4.0/).
Share and Cite
MDPI and ACS Style
Denis, F.; Vandervaeren, C.; De Temmerman, N. Using Network Analysis and BIM to Quantify the Impact of Design for Disassembly. Buildings 2018, 8, 113. https://doi.org/10.3390/buildings8080113
AMA Style
Denis F, Vandervaeren C, De Temmerman N. Using Network Analysis and BIM to Quantify the Impact of Design for Disassembly. Buildings. 2018; 8(8):113. https://doi.org/10.3390/buildings8080113
Chicago/Turabian StyleDenis, François, Camille Vandervaeren, and Niels De Temmerman. 2018. "Using Network Analysis and BIM to Quantify the Impact of Design for Disassembly" Buildings 8, no. 8: 113. https://doi.org/10.3390/buildings8080113
Note that from the first issue of 2016, this journal uses article numbers instead of page numbers. See further details here.