The Impact of Outdoor Views on Students’ Seat Preference in Learning Environments


1
School of Engineering and Built Environment, Griffith University, Gold Coast, QLD 4215, Australia
2
Department of Architecture, Kish International Campus, University of Tehran, Tehran 1417466191, Iran
*
Author to whom correspondence should be addressed.
Buildings 2018, 8(8), 96; https://doi.org/10.3390/buildings8080096
Submission received: 10 June 2018
/
Revised: 4 July 2018
/
Accepted: 24 July 2018
/
Published: 28 July 2018
(This article belongs to the Special Issue Human Factors in Green Building)
Abstract
:A Good learning environment should support students’ choices and attract them to stay. Focusing on outdoor views, this research explores two questions: How important outdoor views are in seat selection in learning environments? How do the view elements influence students’ seating behaviors in learning environments? A seat preference survey and view elements and occupancy rate measurements were conducted in a university library building in Gold Coast, Australia. This study not only echoes the previous research indicating that territory and privacy are important factors for choosing seats in a learning environment; more importantly, this study contributes to the literature with evidence that outdoor views might be an important factor for seat preference. Specifically, sky views and shading views were found positively related to occupancy rate. Based on this point, open views with appropriate shading were found as an optimal outdoor view composition. The singularity of greenery views would less likely be attractive to building occupants.
1. Introduction
The design of a learning environment has a significant impact on students’ attitudes, behaviors and achievements [1,2]. A successful learning environment should attract and encourage students to stay. Therefore, seat preference is one of the important performance criteria for research that seeks to understand suitably designed learning environments. There are many design factors influencing seat preference. Haghighi and Jusan [3] surveyed 370 public high school students in Iran using a questionnaire comprised five-point Likert-type scales evaluating classroom architectural items and students’ achievement motivation. The study categorized three types of physical settings in learning environments that might affect students’ seat selections and related behaviors: fixed settings (such as windows, walls, doors, and generally the outline of elements that shape the learning space), semi-fixed settings (such as radiators, bookshelves, and bulletin boards) and flexible settings (such as chairs and desks that can be moved). Yildirim Cagatay and Ayalp [4] assessed the effects of three different colors (cream, blue and pink) on the interior walls using a semantic differential scale composed of 11 bipolar adjectives for students in a High School in Turkey. The results highlighted the importance of wall color on the perception of classrooms and found that the use of different colors in interior spaces of a classroom had a statistically significant effect on the perceptual performance of the male students. Other studies [5,6,7,8] investigated diverse environmental aspects, such as daylighting, sunlight, room acoustics, temperature, which would affect students’ perception and preference. Among all potential environmental factors, territoriality is addressed as the most important factor explaining seat preferences in different types of learning environments [9]. In environmental psychology, territoriality refers to how people use space to communicate occupancy of areas or possessions [10]. In practice, learning space arrangements with well-defined areas can have a positive influence on students’ social interaction as well as on task behaviors [9,11].
Although previous studies successfully identified a series of environmental design factors influencing seat selection and related behaviors, outdoor views are largely missing in those studies [8,12]. Many green building standards reward building design that provides occupants with a connection between indoors and outdoors through the introduction of views into the regularly occupied areas of the building. For example, LEED (Leadership in Energy and Environmental Design) allocates up to four points to Quality Views [13]. There are many benefits for doing so, such as reinforcing human circadian rhythms and enhancing psychological wellbeing [14,15,16]. There is a long research track record showing the benefit of outdoor views [17,18,19]. Among all, views containing natural elements such as trees and sky are highlighted in psychological studies as preferred views [20,21]. Although outdoor views have many benefits to building users, there are few studies correlating views with seat preference or duration of stay.
In sum, the study of stay and seat preference of learning environments is mainly focused on interior elements such as territory, colors and the like, while outdoor elements that would influence occupants’ preferences, such as views, are largely missing. The research of linking views to seat preference or duration of stay is of great importance for designing learning environments. In learning environments such as a library, students have the choice to select their own seats. A good learning environment is supposed to support their choices and to attract their stays. The research aims to explore two important research questions missing in the literature:
How important outdoor views are in seat selection in learning environments?
How do the view elements influence students’ seating behaviors in learning environments?
2. Methodology
2.1. The Surveyed Building
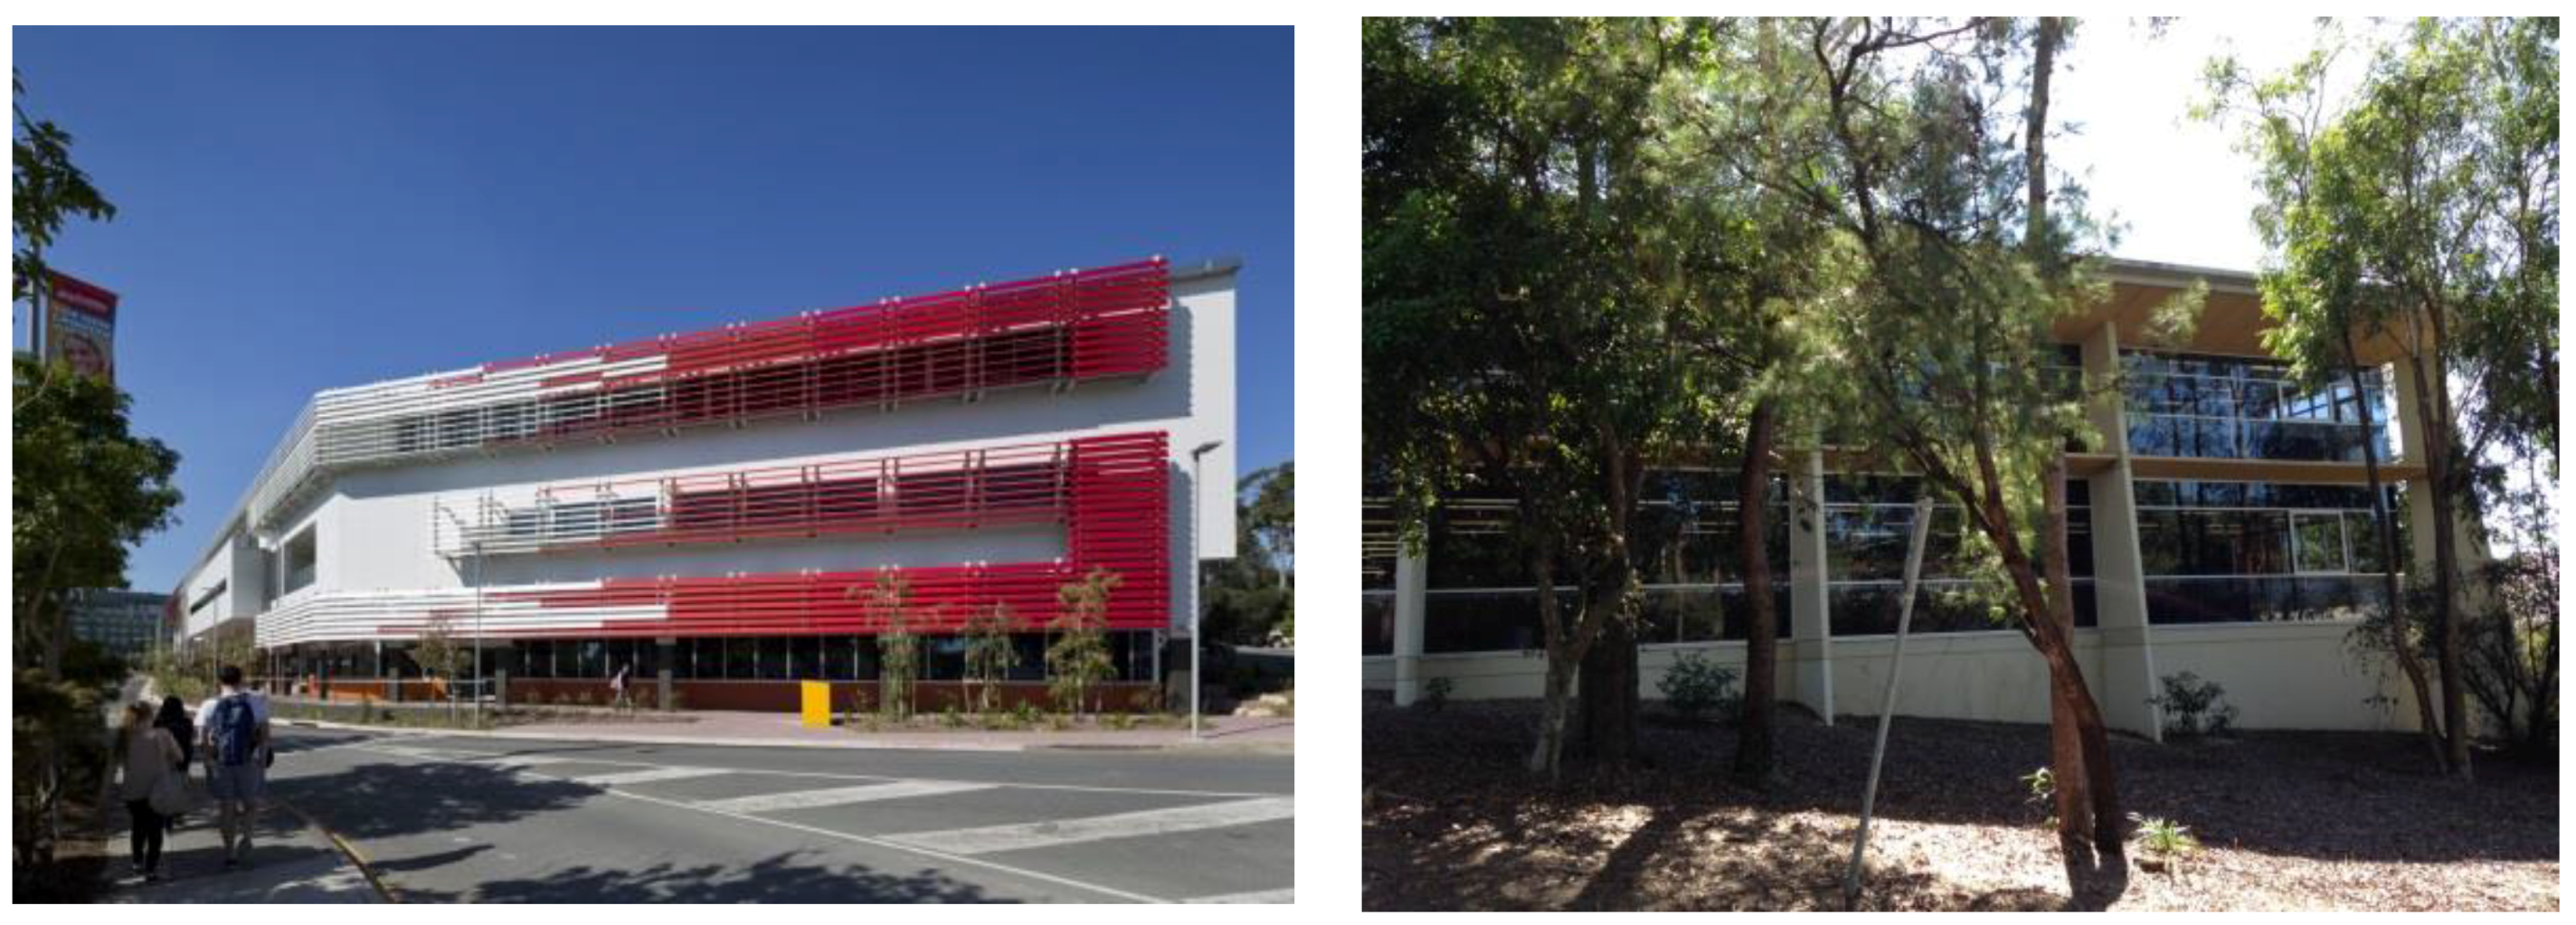
To explore the research questions, a library building was selected for the study. The building is Griffith University Gold Coast Library (Figure 1), located at a coastal city in South East Queensland on the east coast of Australia (coordinates: 27.962522 S and 153.379988 E). Gold Coast experiences a humid subtropical climate with warm winters (June–August) and hot, humid summers (December to February). The library building under study is a redevelopment of an old library building with an extension to accommodate the growing book collections and to provide more learning spaces. The project completed in 2012. Most workstations in this library are located next to windows, directly facing the outside to maximize accessibility to views. The middle space is dedicated to bookshelves. This layout design considers the fact that library users or students preferred seats near windows or daylit areas [22]. This library building and its view-oriented layout provide a unique opportunity for investigating the relationship between views, daylight peformance, and occupants behaviours. In total, 88 workstations at level 3 were selected for this study (Figure 2). They all are located in the periphery of the library space, facing the outside.
A lighting measurement was conducted to measure the illuminance at the selected workstations using Minolta T-10 (range: 0.01 to 299,99lx; accuracy ±1 digit). The measurement was conducted on two days in the summer of Southern Hemisphere: 1 December 2015 (Sunny Day) and 2 December 2015 (Cloudy Day) as well as two days in the winter of Southern Hemisphere: 6 July (Sunny Day) and 11 July 2016 (Cloudy Day). Figure 3 combines the four days’ data and compares four orientations using box plots. The north-facing workstations had a higher average desktop illuminance. This condition is different from the northern hemisphere where south-facing space is supposed to receive the most daylight during the day. The west-facing workstations were shaded by louvers; therefore, the desktop illuminance was lower than others. The desktop illuminance in east-facing workstations fell into a larger spectrum than others, especially in the morning. The south-facing workstations tended to have more outliers on desktop illuminance. The outliers came from the workstations with large sky views. During the measurement, no direct sunlight incidence was observed in these workstations; therefore, no extremely high desktop illuminance was found for this library.
2.2. Seat Preference Survey
In response to the first question, a questionnaire survey was conducted to discover the importance of the outdoor view in choosing seats in learning environments. The questionnaire survey was conducted during April–May 2016. The survey is to probe the subjective evaluation of reasons for being seated at some location and the importance of choosing a seat in a learning environment. The questionnaire consisted of three parts: the first part is about the participant’s background; the second part is an open question asking the reason that they chose their current seat; and the third part is a structured question ranking factors that contributed to their seat selection. The selected factors include good views, good daylighting, close to toilet/washroom, close to friends/mates, close to reference books, close to entrance/circulation, privacy, quietness, good furniture, clean and orientation. The questionnaire survey was administered to 100 students who were seated in the selected areas. Finally, 72 valid responses were collected. Thirty-nine are female students while 33 are male. Most of them (86.1%) are undergraduate students while few are postgraduate students.
2.3. Quantification of Views and Occupancy Rate
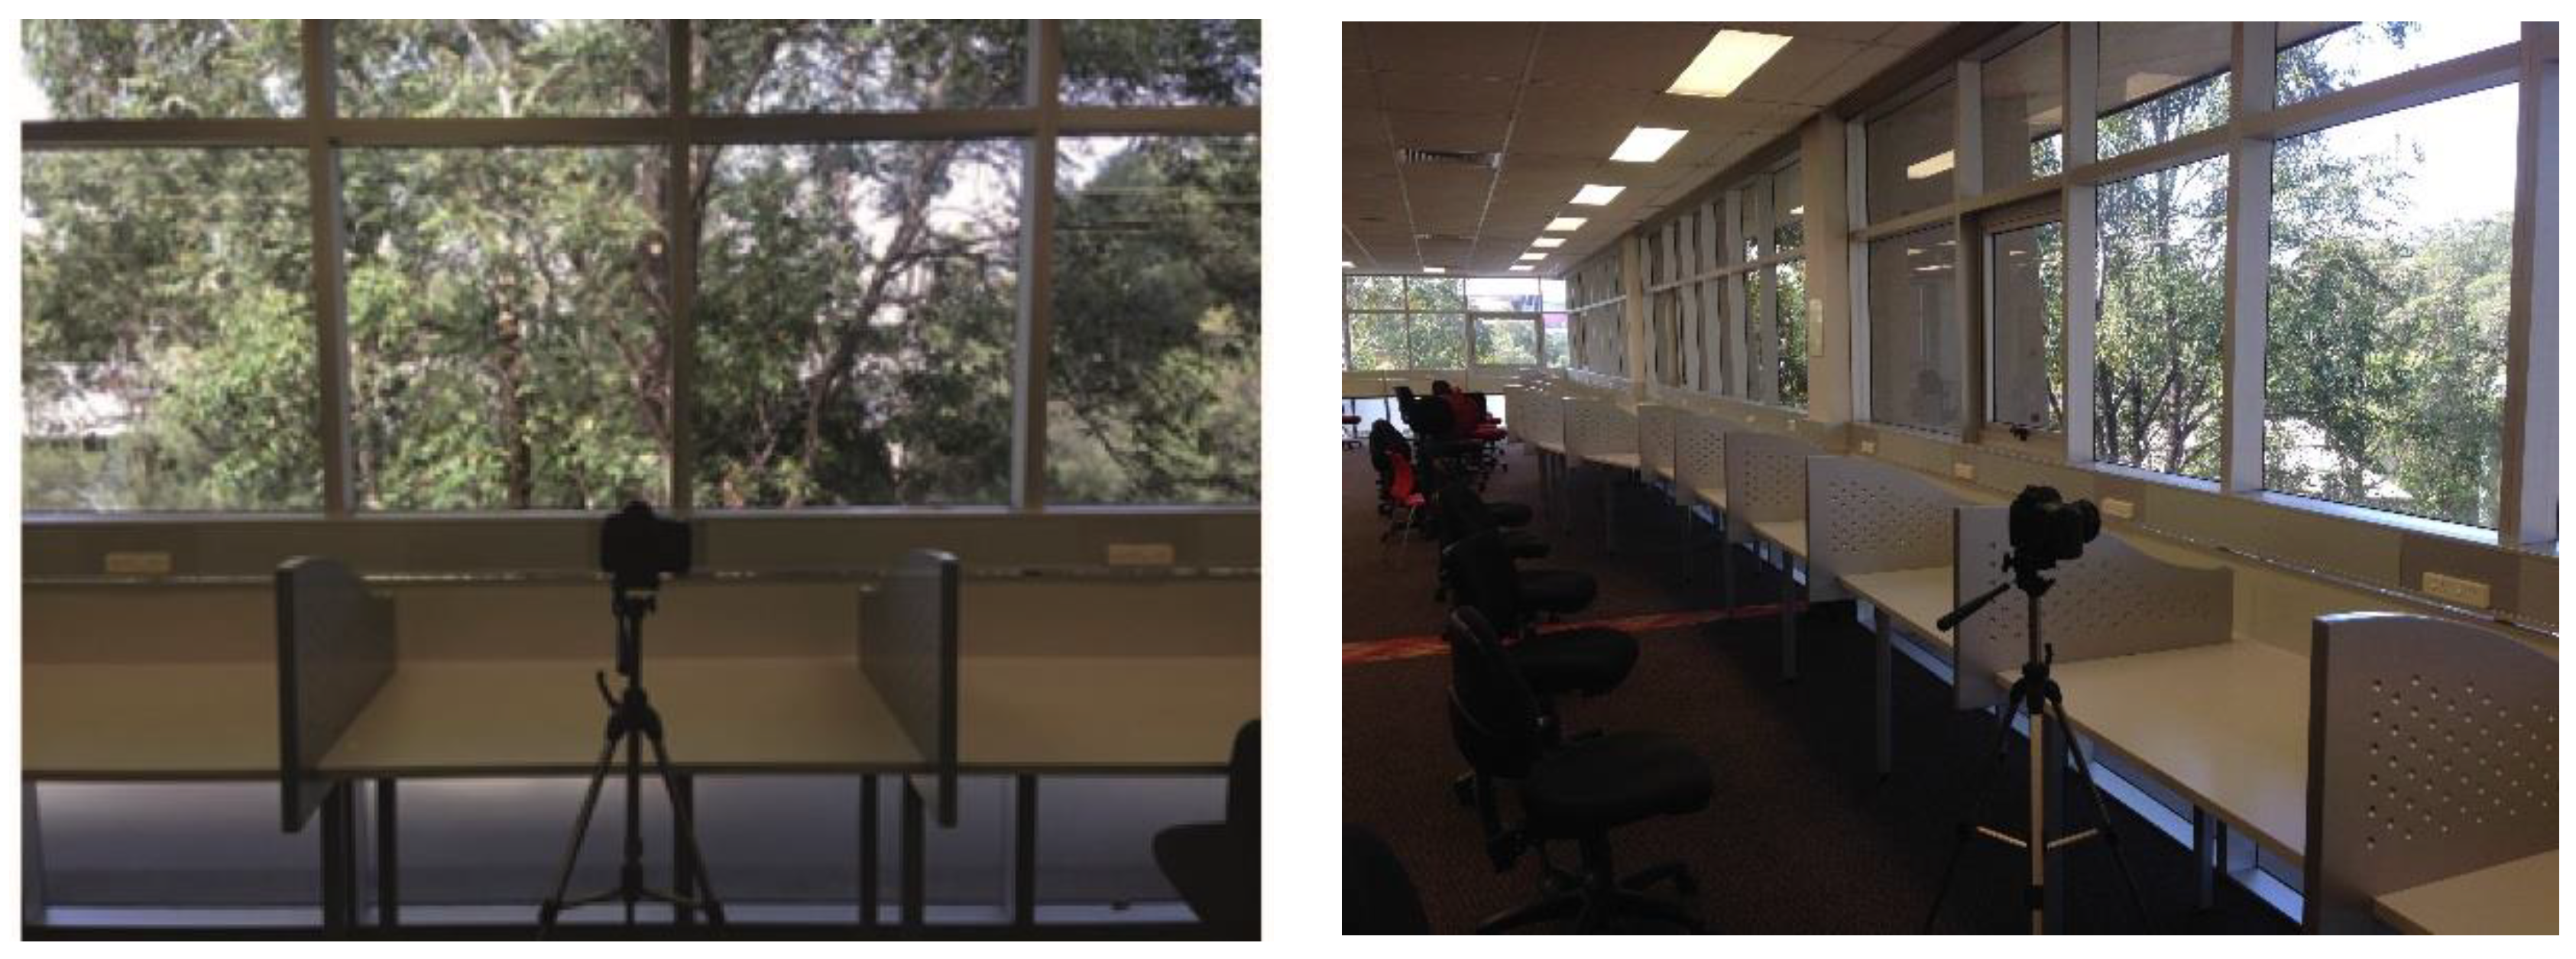
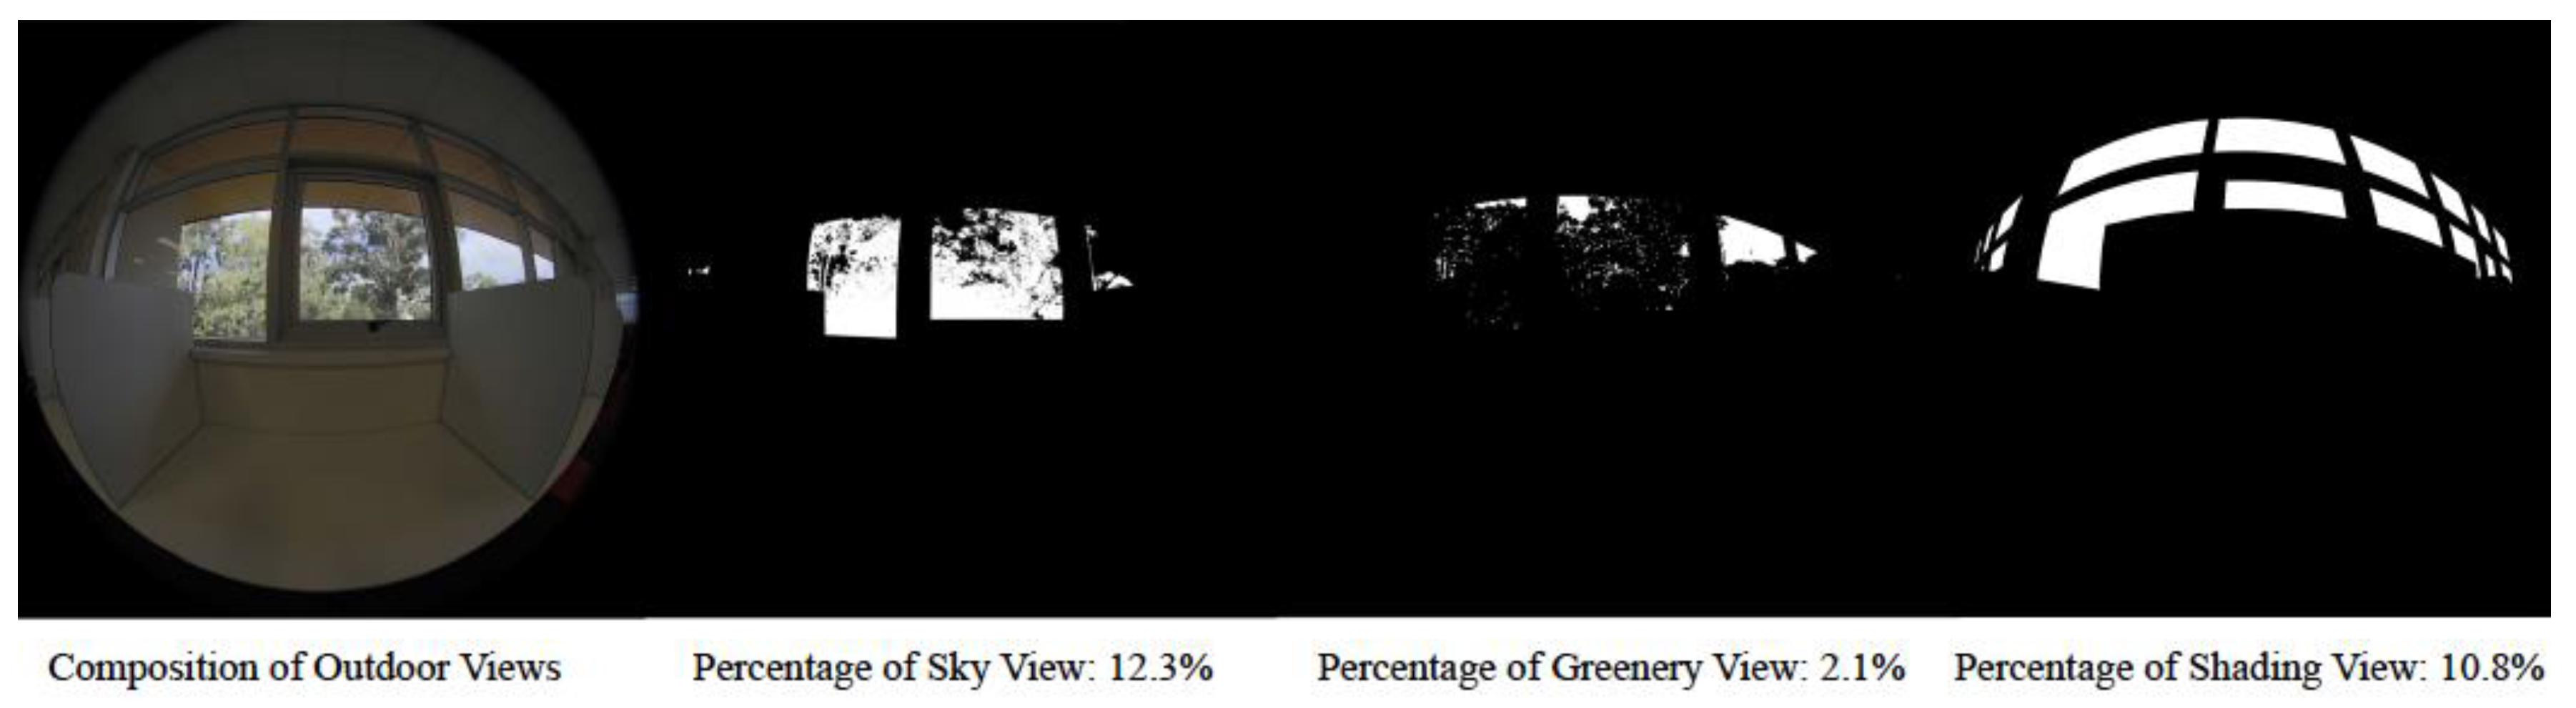
In response to the second question, measurements were conducted to quantify outdoor view elements and to collect occupancy data for the correlation analysis. A Canon EOS 5D Mark III was used to take high dynamic range images for view quantification. A tripod was used to fix the equipment and take photos at each workstation (Figure 4). These photos were taken during holidays in December 2015 to avoid interruptions from library users. The measurement of outdoor views mimicked a person seated at that workstation who was looking at windows. Based on the images taken by the fisheye lens camera, the research conducted view analysis for each workstation using the Sky View Factor Calculator developed by Lindberg and Holmer [23]. The calculator can help to quantify the portion of sky, trees, and shading in these hemispherical photographs using a Graphical User interface (GUI). To do so, the photos were processed using Photoshop to highlight the part of trees, sky, and shading, respectively (Figure 5); and then processed photos were imported to the calculator to compute the percentage using a pixel-based approach. The procedure was applied to the view analysis of each workstation. In total, 88 sets of data (percentage of sky view, percentage of greenery view, and percentage of shading view) were collected, representing the main outdoor view conditions for the 88 workstations.
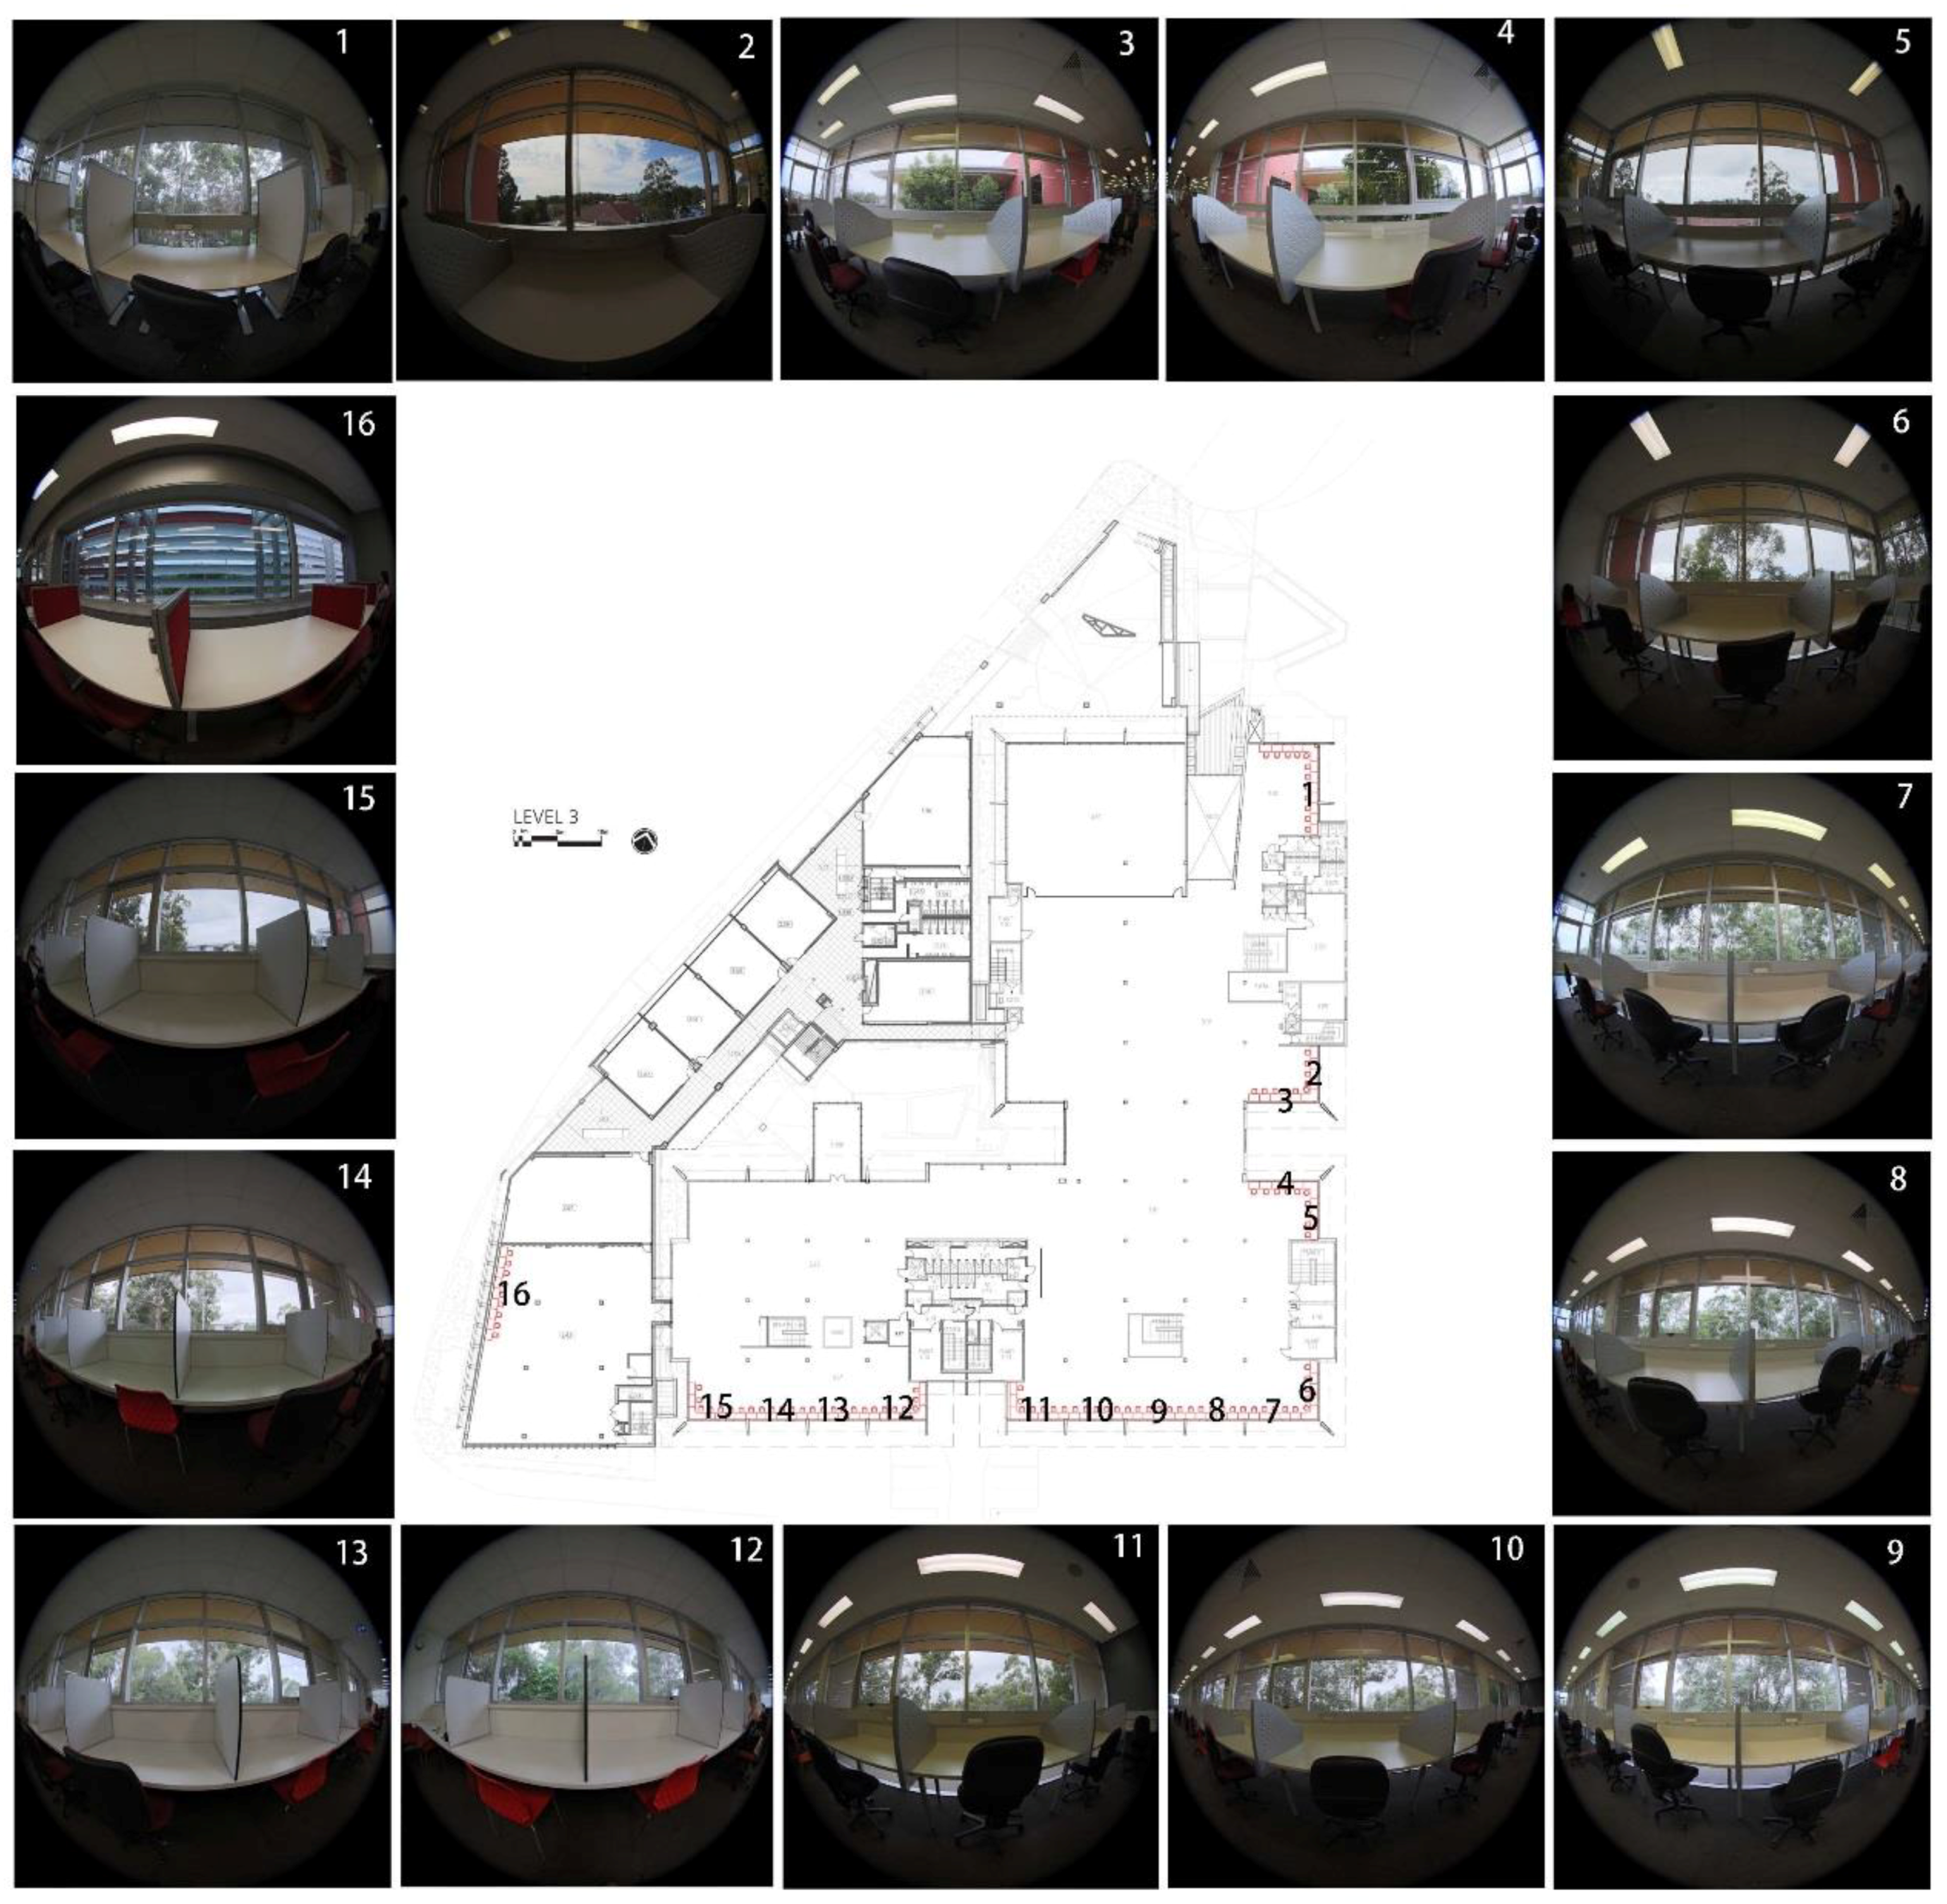
The research used 16 Arduino PIR (Passive Infrared) motion sensors to collect the occupancy data. An electronic circuit was set up to use the PIR motion sensors to collect the occupancy data. The PIR motion sensors can sense a slight motion of the human body and send a signal and trigger occupancy in the place. The data from the sensors were saved in a binary code format: ‘1’ represents detecting at least one occupant in one of the surrounding desks, and ‘0’ represents no occupant in the desks. The delay between triggers was activated at 60 s in order to acquire sufficient occupancy data especially when students stay still while studying. The circuit was placed in a black box and was installed underneath student working desks. PIR’s distance sensing range was adjusted to around 5 m to cover 5 to 6 desks. Sixteen locations, which covered all the 88 workstations, were selected to install the circuit (Figure 6).
The data were collected on two days: Monday the 4th and Tuesday the 5th of April 2016. These two days are normal weekdays in the middle semester. Although the PIR motion sensors can continuously record occupy data, the acquired data just indicated general occupancy conditions in the 16 learning spaces. It could not tell the difference of the occupancy condition for each workstation. The data for each workstation should also be recorded manually. Therefore, a research assistant helped to count heads during the first day, Monday 4th April 2016. The head counting was conducted every half hour from 8 a.m. to 8 p.m. The head counting helps to calculate how many occupants were present during daytime and verify the PIR sensors.
2.4. Analysis
The analysis of the data must follow three steps: the first step is to reduce the factors of seat selection through factor analysis, in order to identify the potential variables that could account for students’ seat selection in the library; the second step is to investigate the different types of view elements in terms of quantity; and the third step is to link the views and occupancy data acquired in the monitoring via regression analysis, in order to explore the relationships between views and occupancy.
3. Results
3.1. Factors Influencing Seat Preference
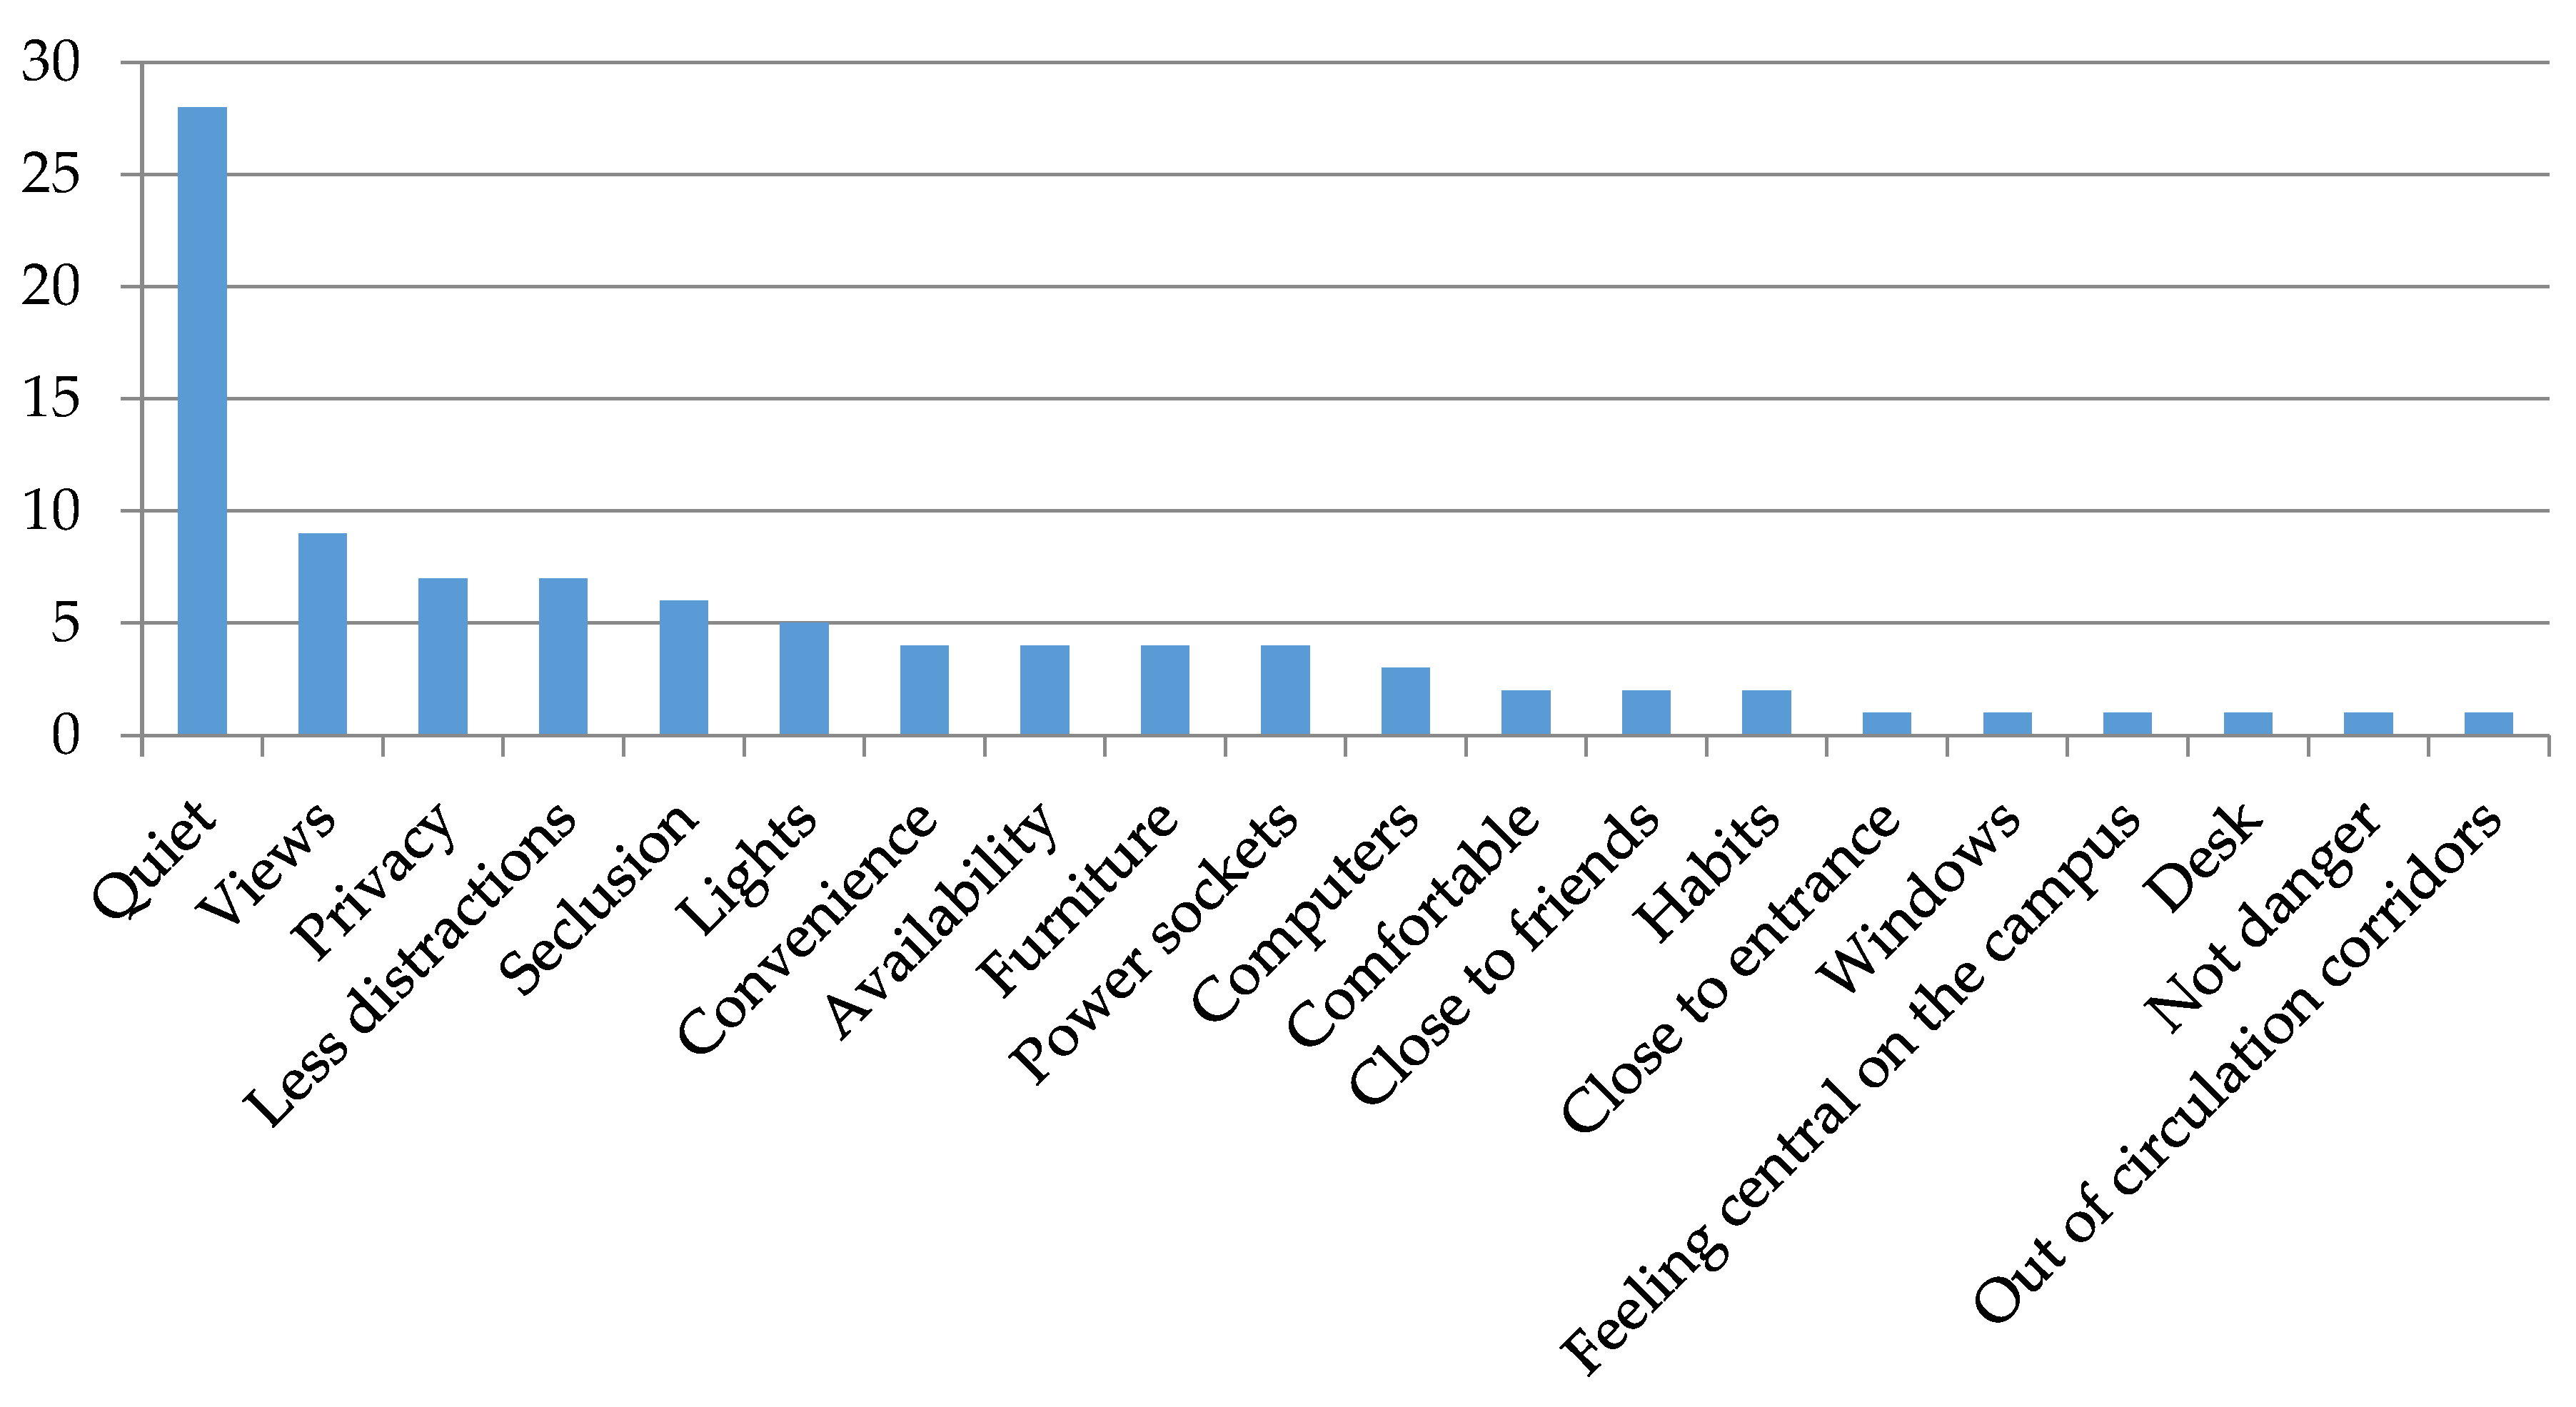
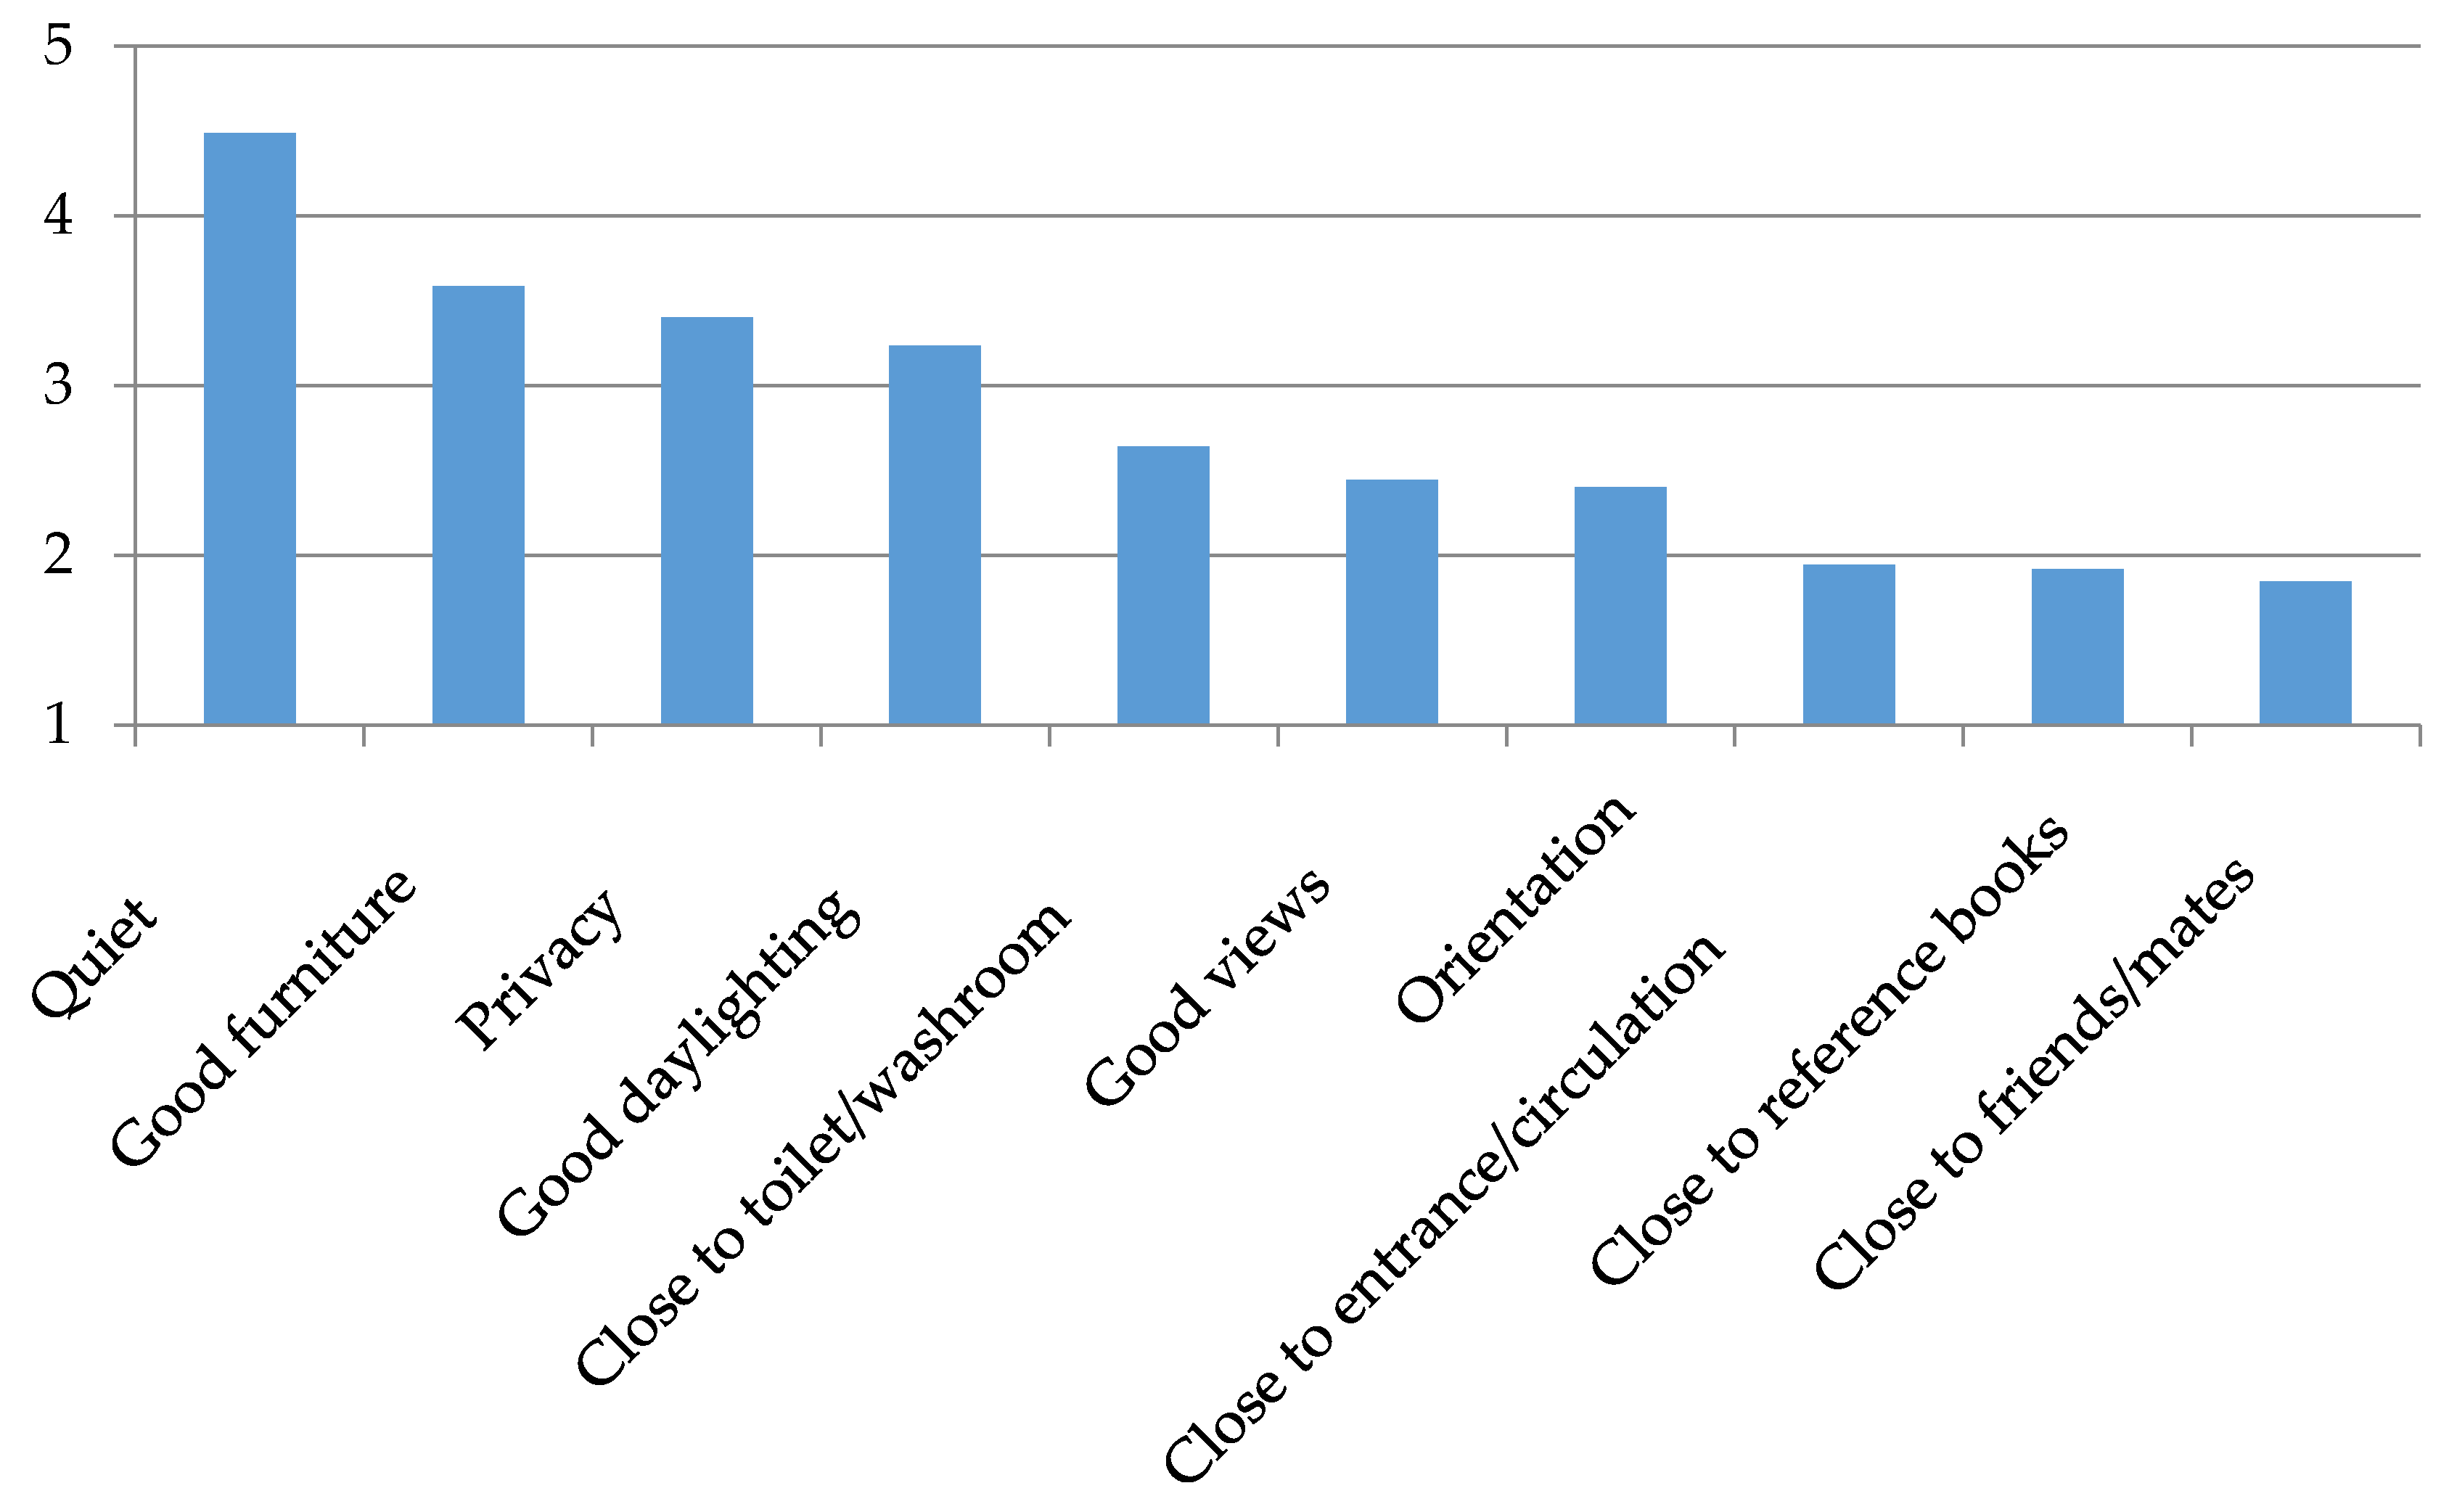
Figure 7 shows the frequency of reasons mentioned by participants for sitting at their current seats. “Quiet” is most frequently mentioned by participants. “Views” comes in second. The other frequently mentioned reasons are “privacy”, “less distraction”, and “seclusion”. The responses disclose that students prefer some quiet places for concentrating on their learning activities in the library. As assumed, outdoor views are one of the important reasons for choosing their seats. Participants were required to rate the importance of listed factors for choosing seats in the library. Figure 8 disclosed the mean score of these potential factors. As expected, “quiet” was rated as the most important factor. “Furniture” was the second important factor. Convenience, such as “close to friends”, “close to reference/books”, “close to entrance/circulation”, was least important.
Factor Analysis was conducted to reduce these factors into several main factors. The Factor Analysis is an explorative analysis, aiming to group similar variables into dimensions. This process is also called identifying latent variables. Three latent variables were extracted for this case, and the three latent variables or main factors could explain 61.2% of variability. Table 1 summarizes the three main factors. Factor 1 includes furniture, privacy, and quietness, which is the most important factor for choosing seats in library; Factor 2 covers views, daylighting and orientation, which is the second most important factor; while Factor 3 refers to being close to friends and entrance, which is the least important among the three main factors.
3.2. Views Elements and Their Relationships
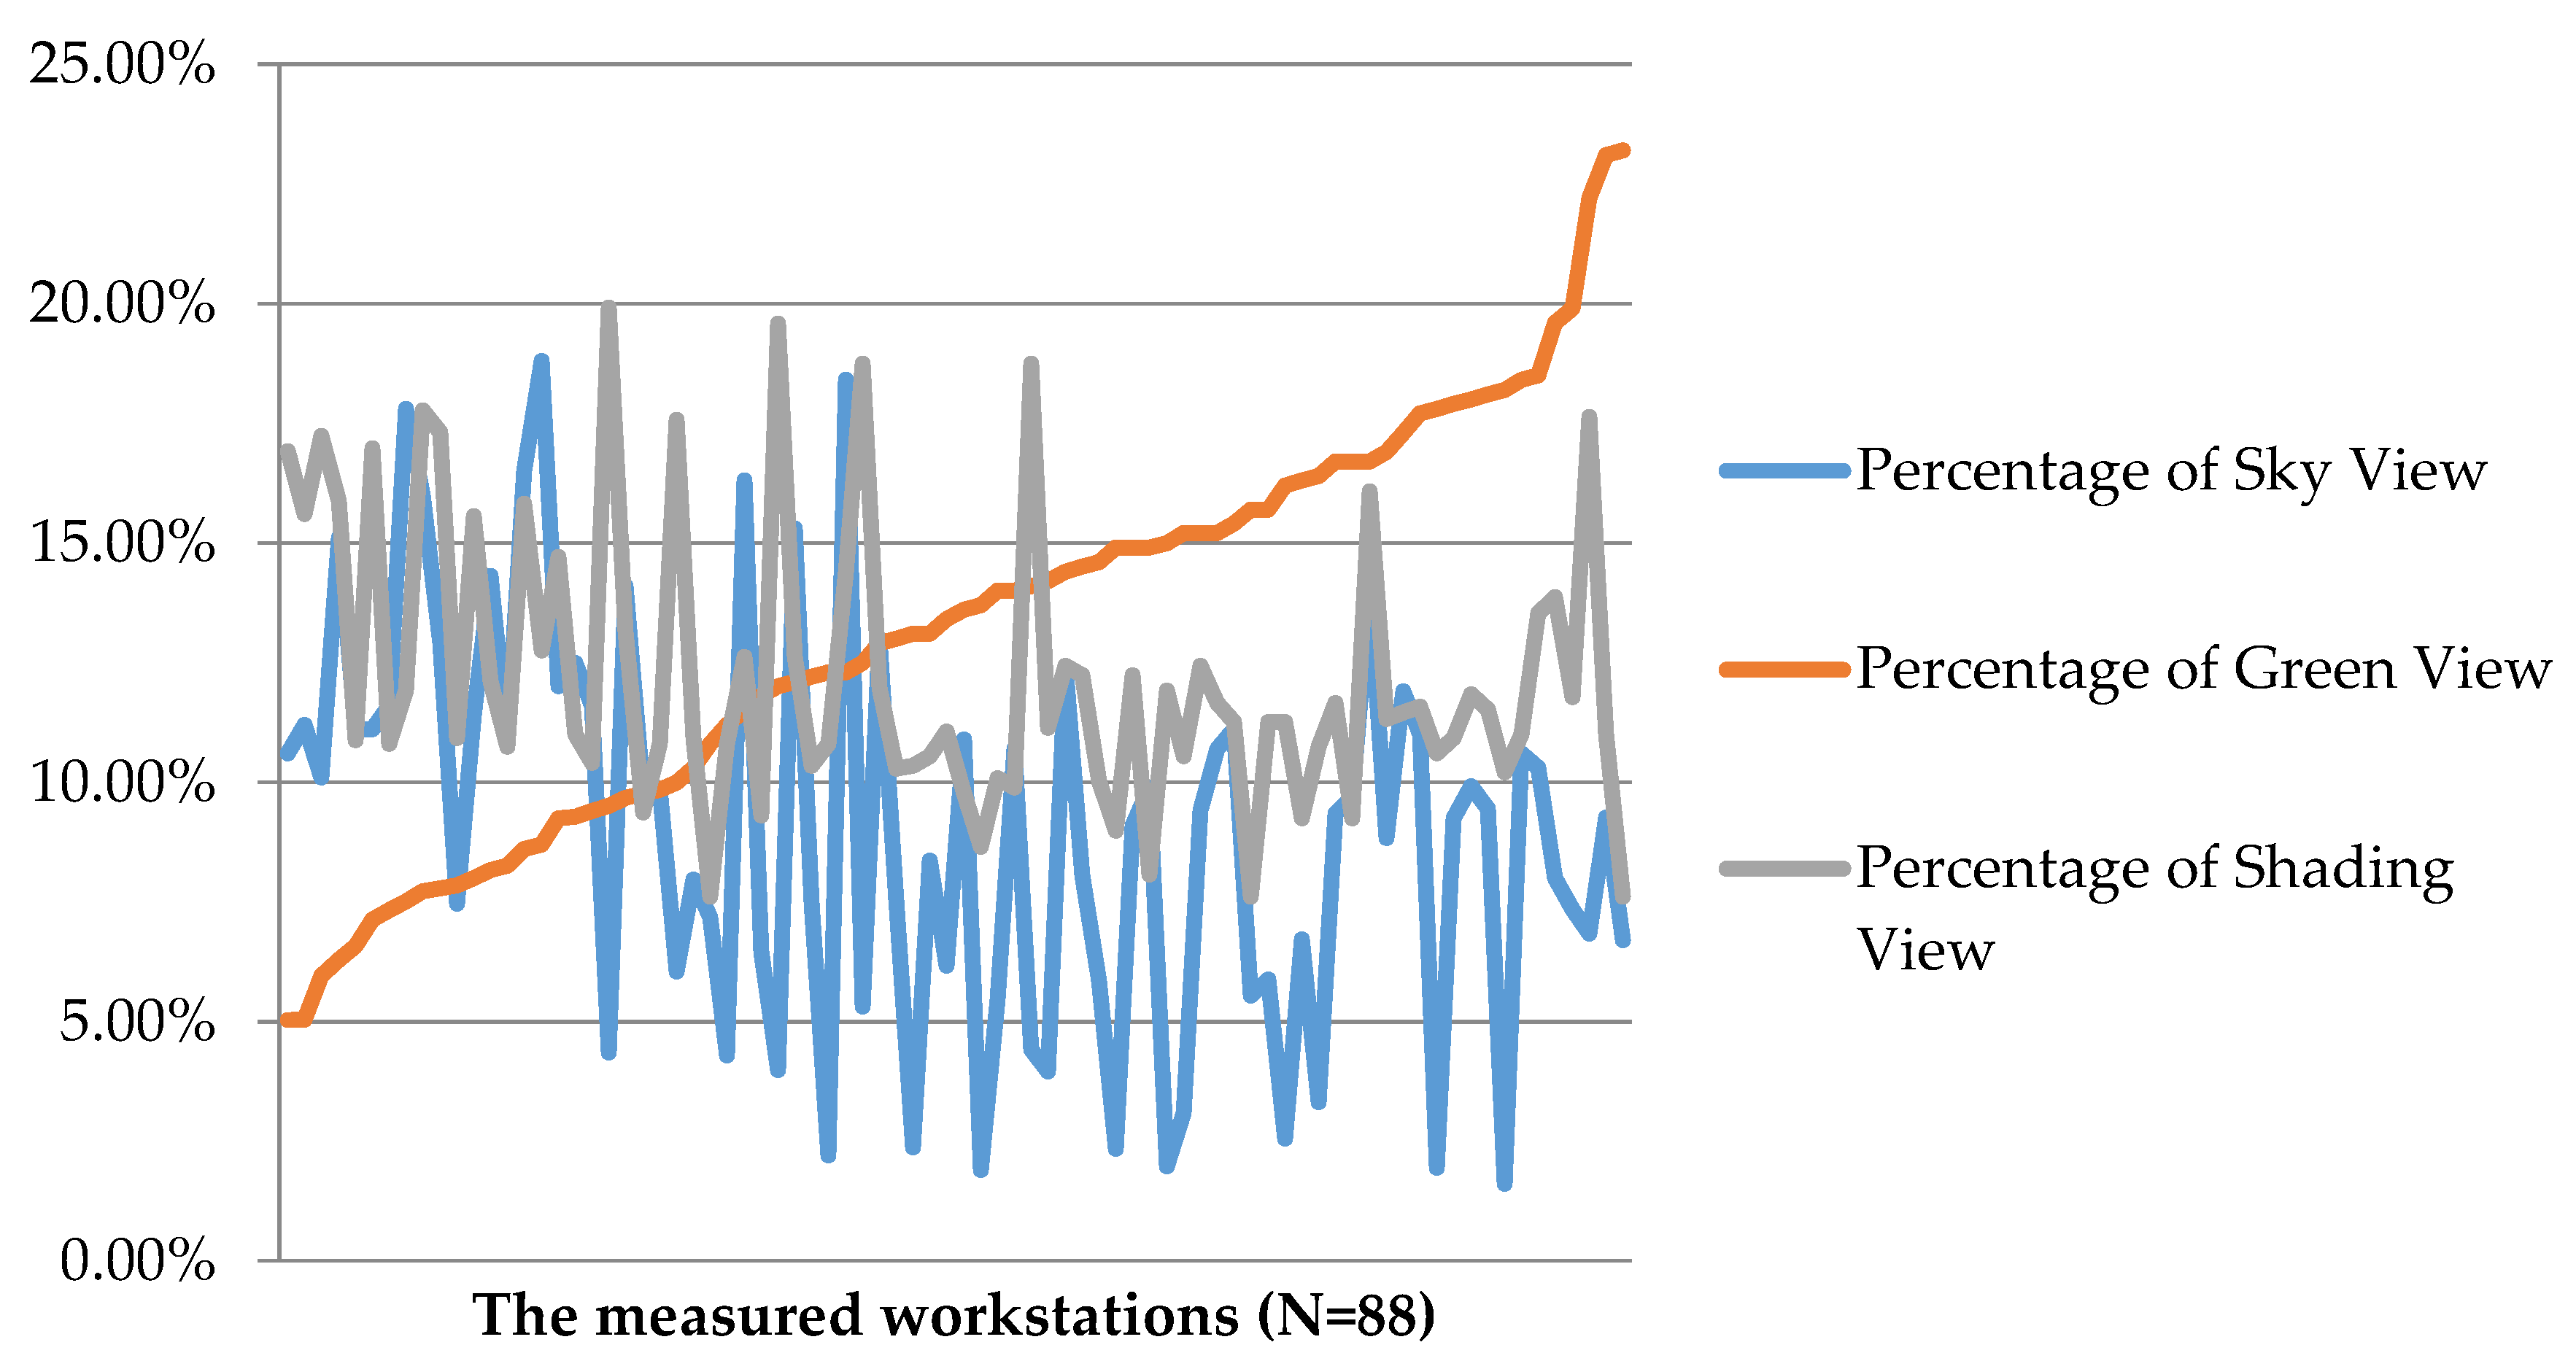
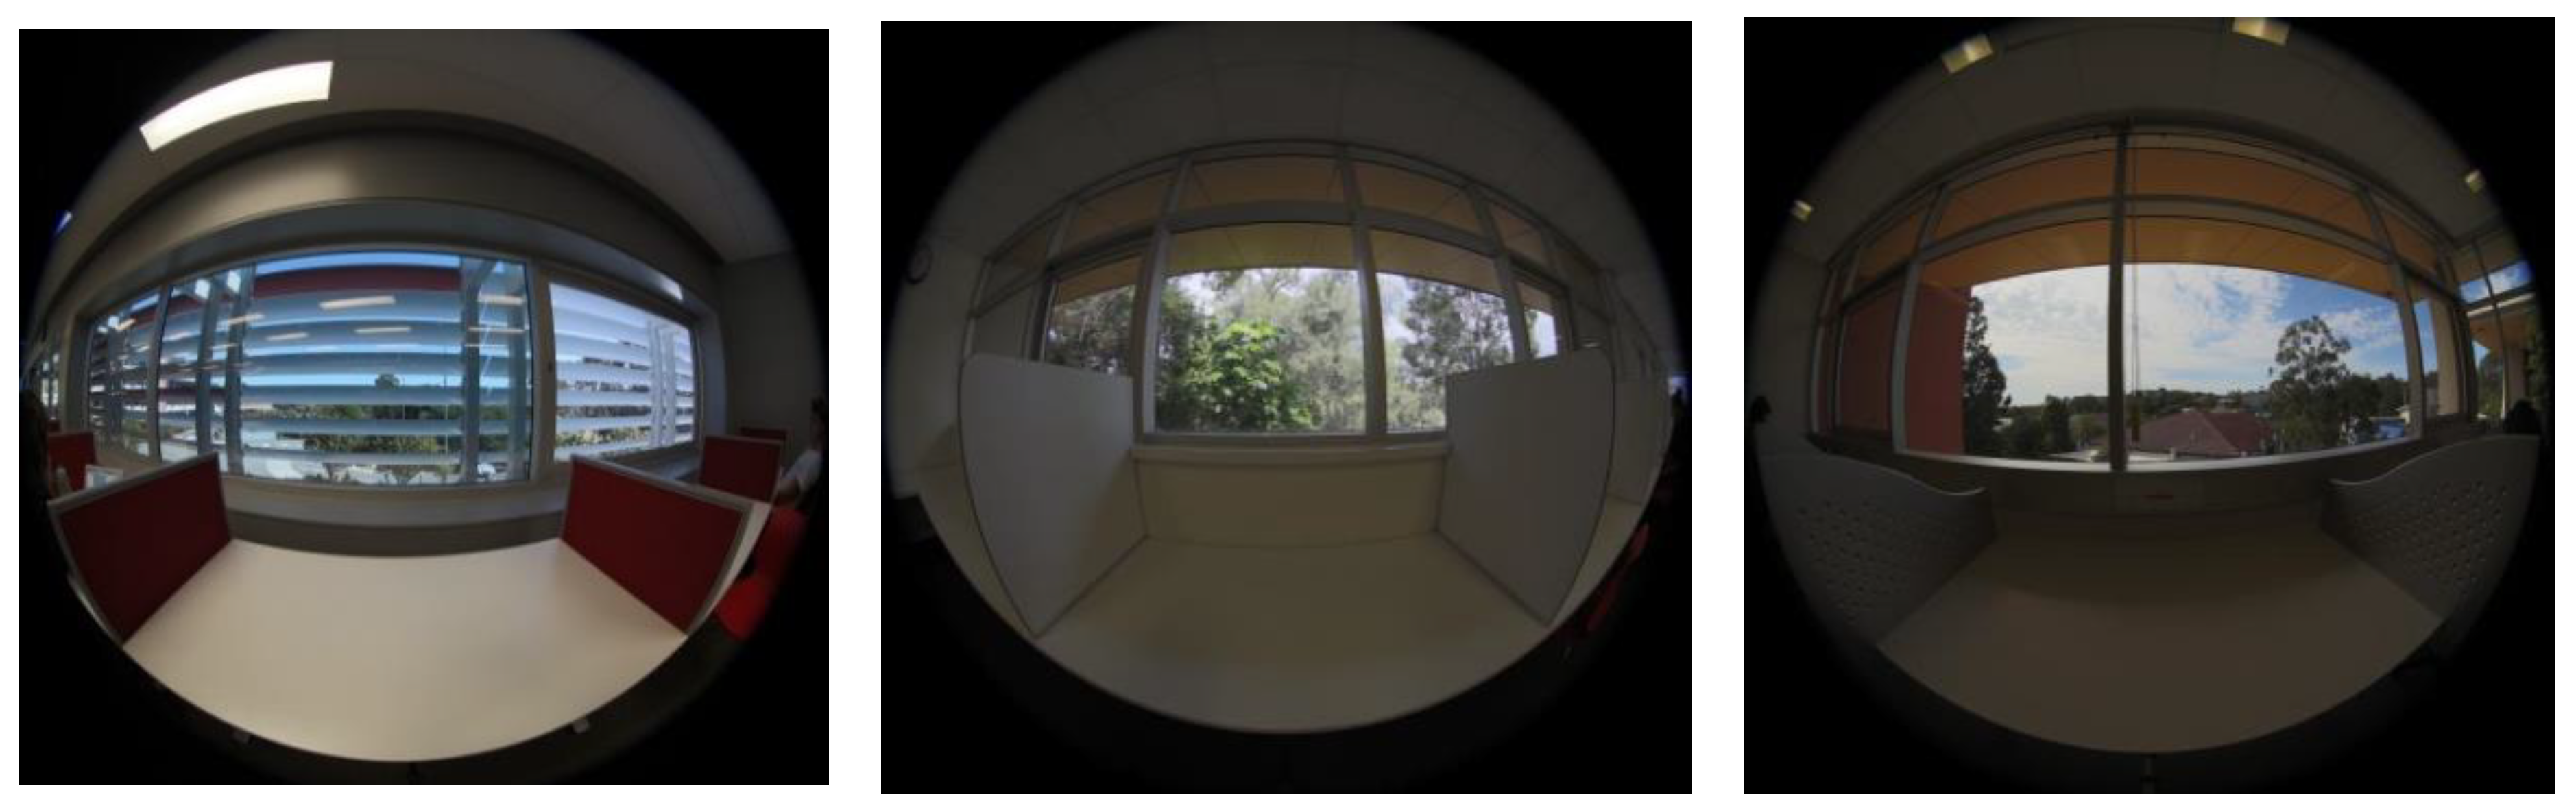
Figure 9 shows the percentage of sky, green, and shading view elements for each selected workstation. Since the library building is enclosed by continuous curtain walls, each workstation had a similar size of outdoor views (quantity of outdoor views). However, the composition of outdoor view elements (quality of outdoor views) is quite different. Averagely, these workstations had more shading views (Mean: 12.6%) and green views (12.3%) than sky views (8.4%). The stations with higher percentage sky views are those with less or without trees nearby. Another finding is that the sky and shading views both are negatively associated with the green view (Table 2), which means: the more sky or shading view, the less green view. There is no correlation between sky view and shading view. Figure 10 shows the three extreme conditions: the workstation with the most greenery view, the workstation with the most sky view, and the workstation with the most shading view. In all three conditions, nearby trees and sky are the main outdoor natural elements and they are also negatively associated with each other. The horizontal and vertical shading reduced the sky and green view availability. This is worse when the louvres are present as shading devices, which reduced the natural view size and interrupted its continuity.
3.3. Linking View Elements to Occupancy Rate
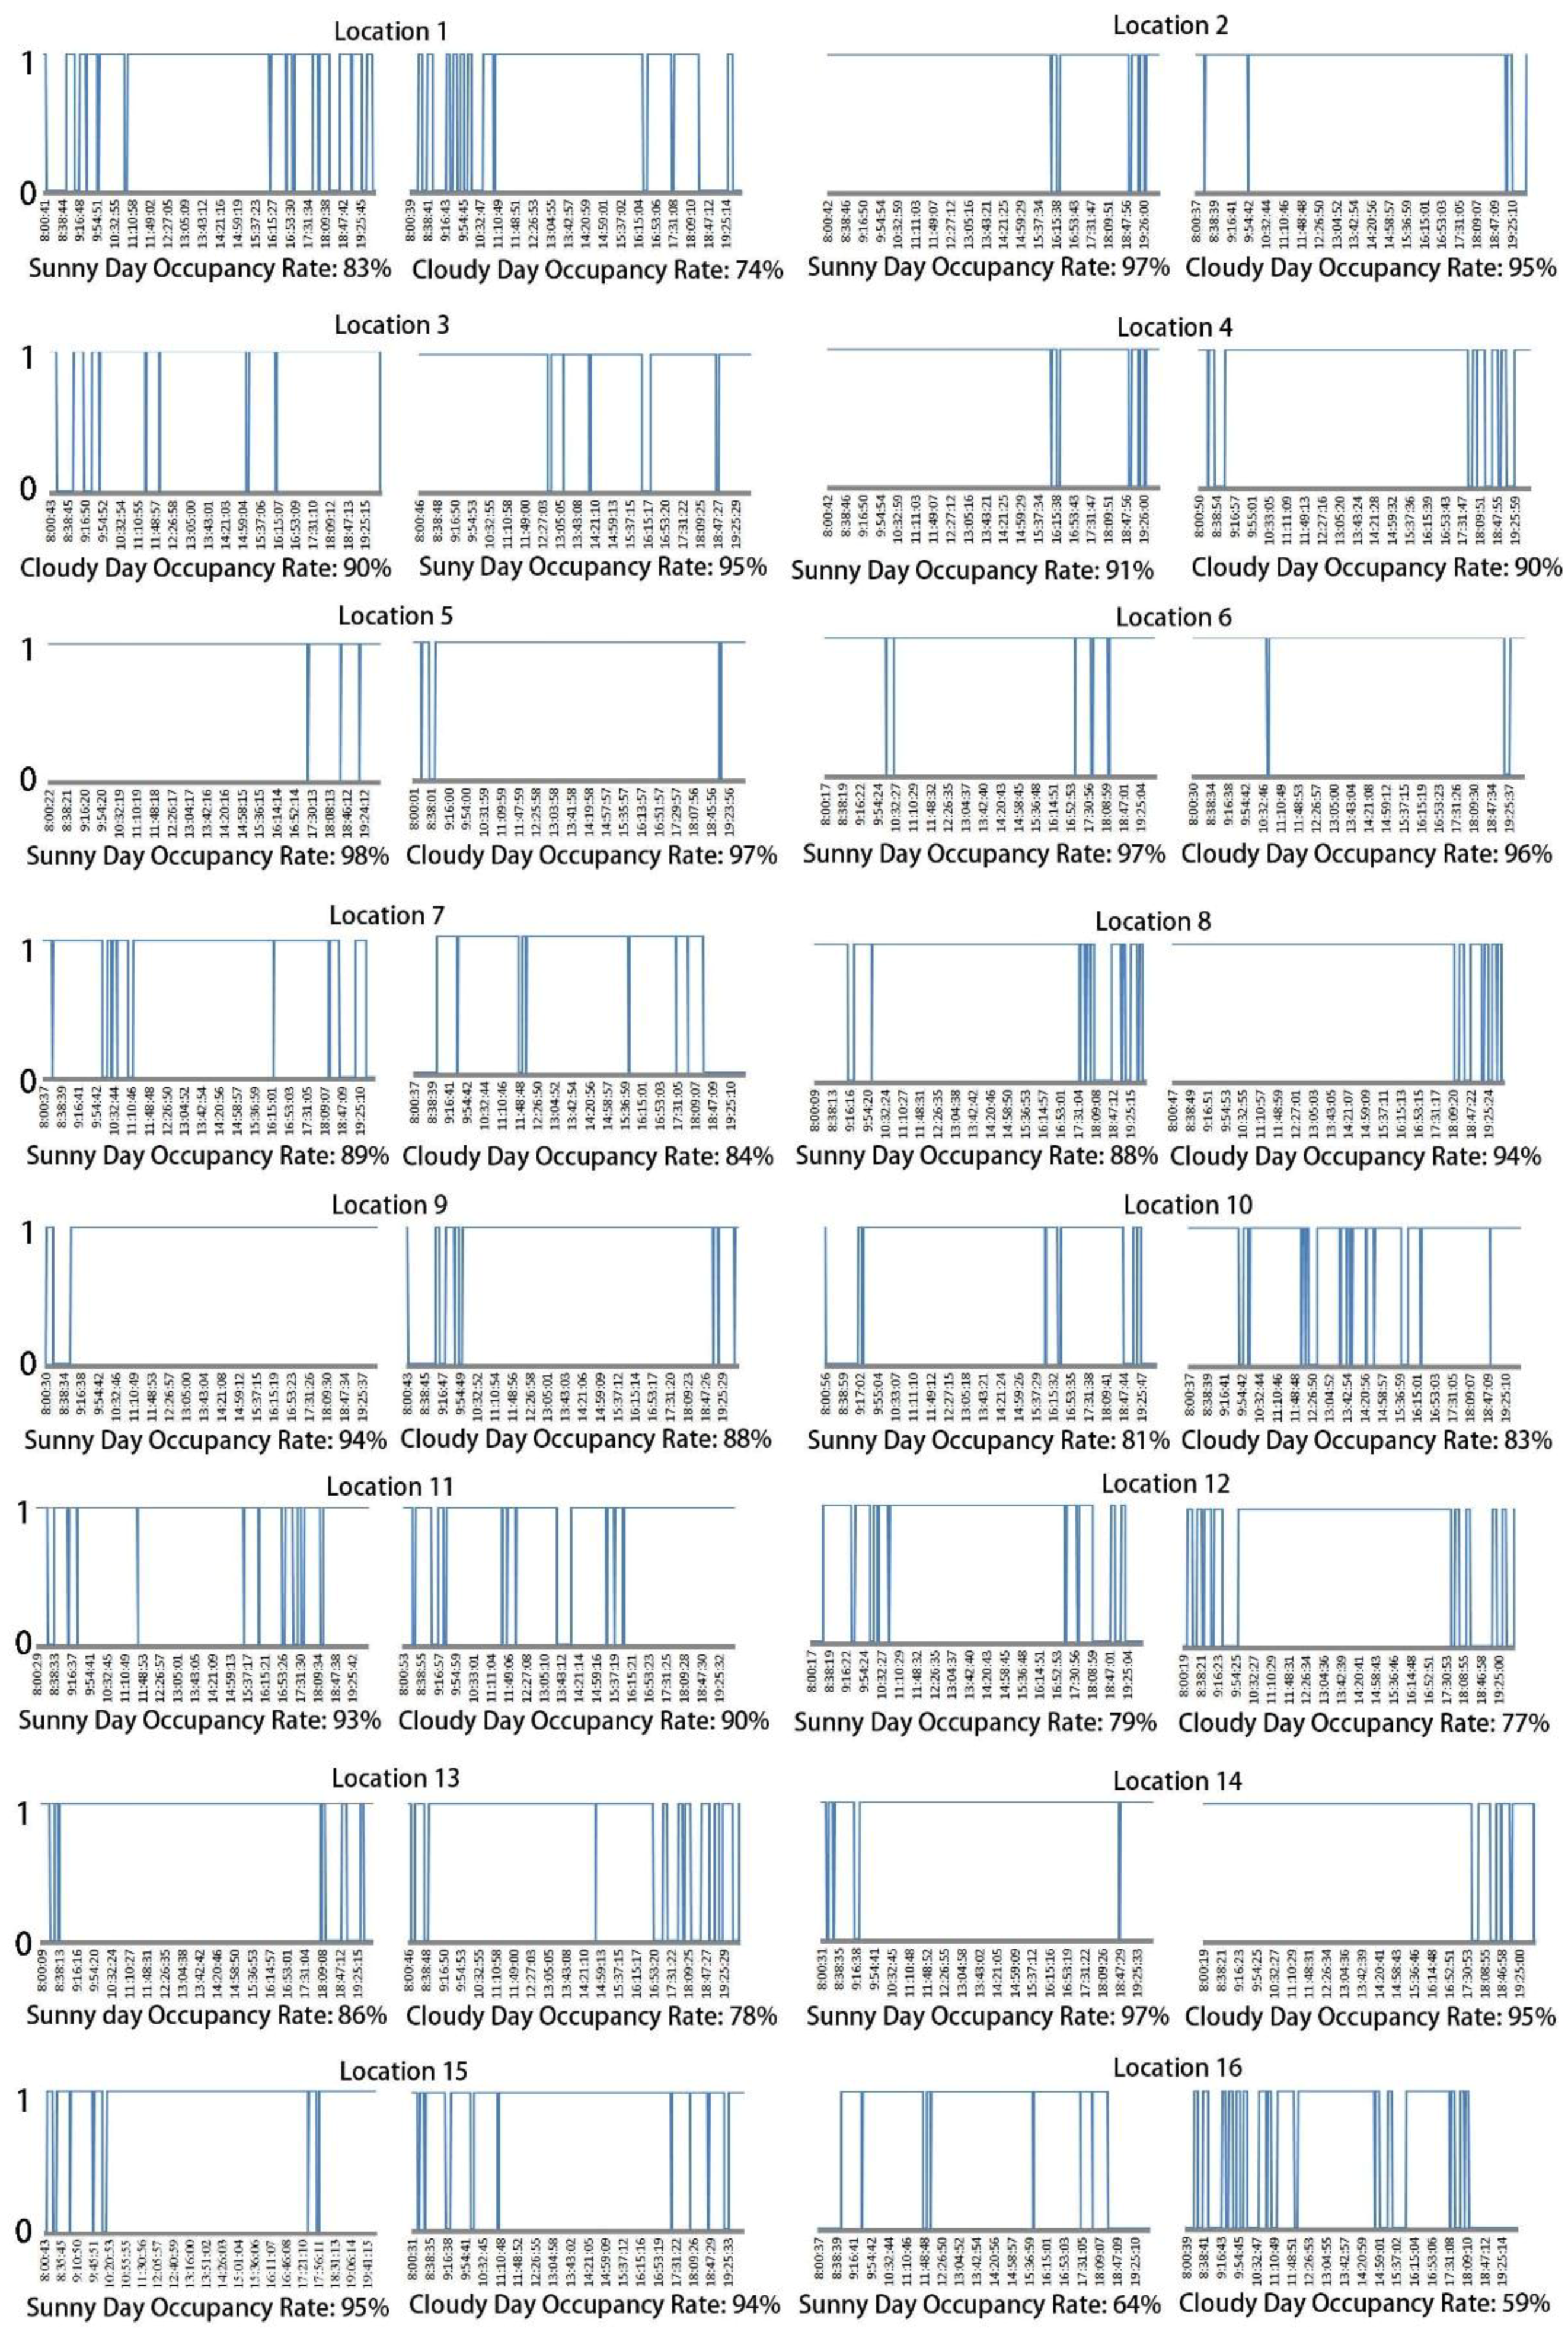
Figure 11 shows the occupancy data for the 16 selected locations representing 16 learning spaces in this library. Two-day data were analyzed. The time period was from 8 o’clock in the morning to 8 o’clock in the evening. These workstations were highly used during the first two days. There is no general pattern that the occupancy rate is greater in the sunny day than in the cloudy day (p > 0.05). However, it is found that workstations with south facing had a greater occupancy rate in the sunny day while those with east facing had a greater occupancy rate in the cloudy day. Spaces such as 2, 5, 6, 14, and 15 had higher occupancy rates than others in both two days while spaces 1 and 16 had the least rates. The difference could be initially postulated through comparing outdoor views. Workstations in space 2, 5, 6, 14, and 15 had more sky views while workstations in space 1 and 16 had the least sky views. Usually, there are a number of reasons to choose where to sit, such as noise, privacy, facilities and accessibility. Because the whole floor is a quiet zone and each workstation in this floor was equipped with similar facilities (plug and power), the influence from these factors was supposed to be minimal. The possible reason might be that compared to other locations, space 1 and 16 were to some extent isolated because students need to pass a door to enter the two spaces while other spaces are next to bookshelves.
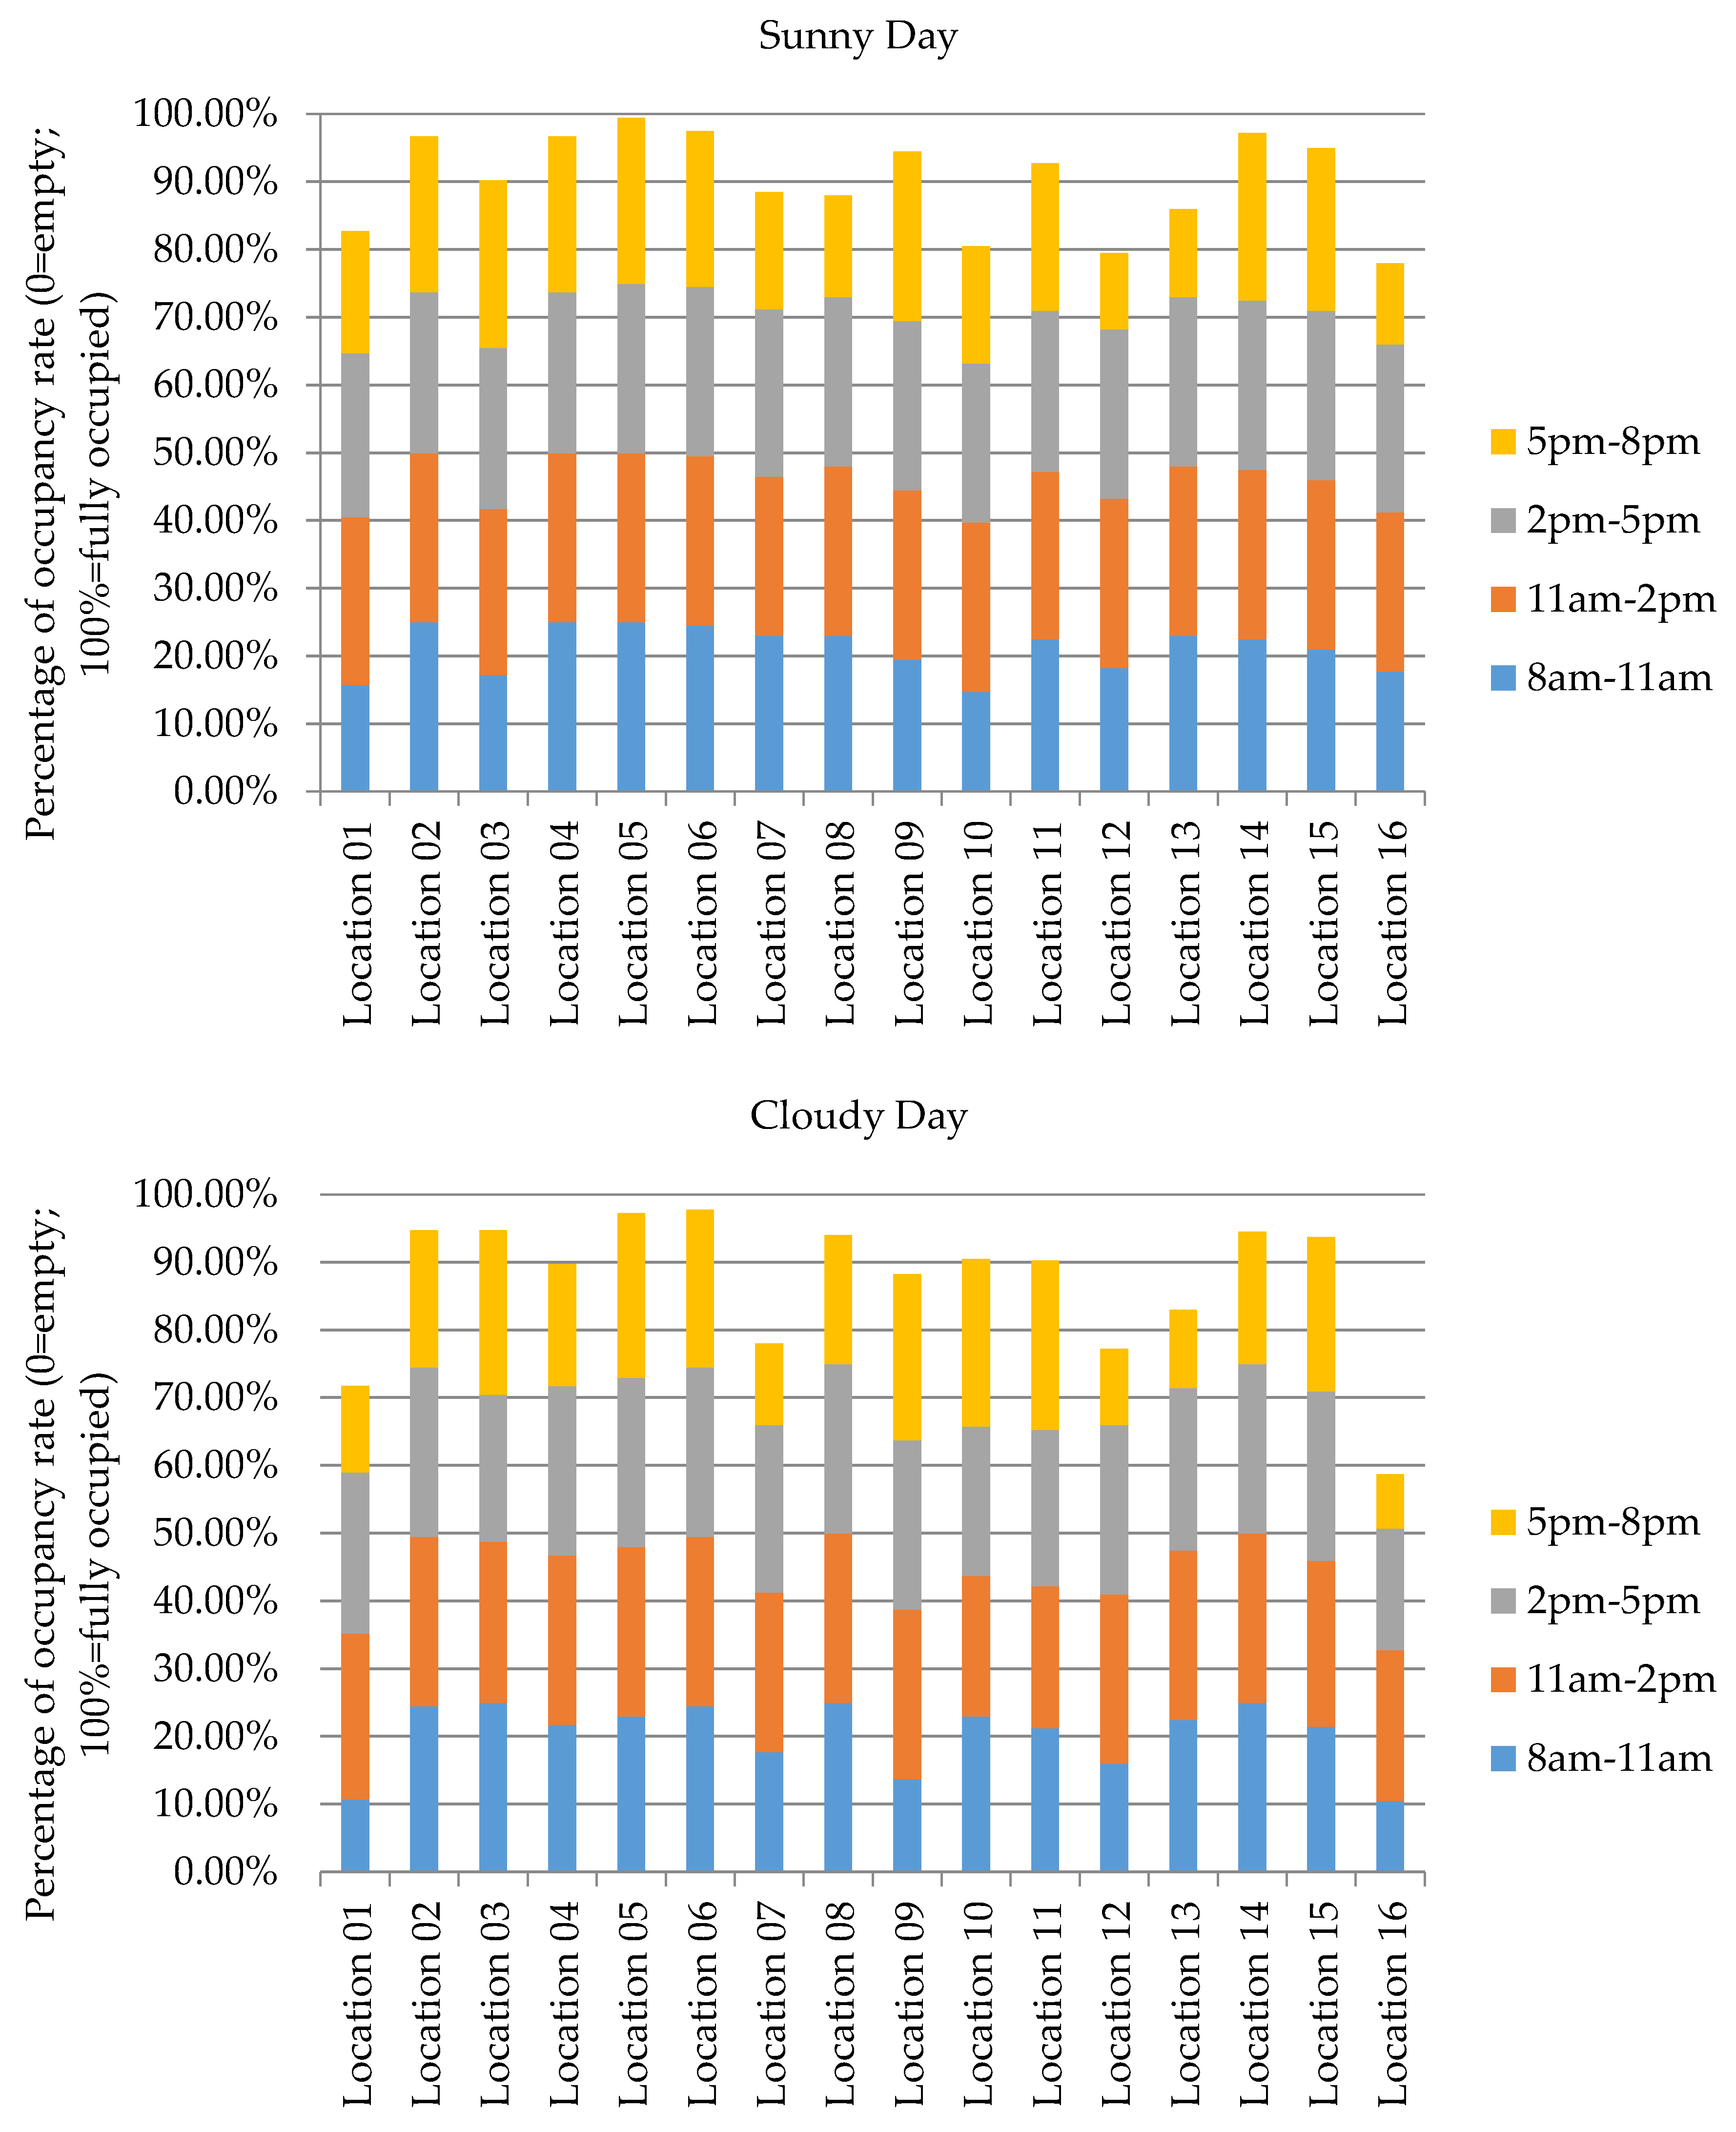
Figure 12 further breaks down the occupancy data into different time slots. Step-by-step pair tests were conducted to see whether the difference was significant. In both days, the occupancy rate in the midday (11 a.m.–2 p.m.) or afternoon (2–5 p.m.) was significantly higher than that in the morning (8–11 a.m.) or evening (5–8 p.m.) (p < 0.05). The peak time in this library was 11 a.m. to 5 p.m. The breakdown analysis also disclosed that for the least occupied learning spaces such as space 1 and 16, the peak hour occupancy rate was almost the same as the others; the difference mainly came from the non-peak hours. During morning and evening, few students choose to study there. This could exclude the assumption that the two spaces were too isolated to be accessed by students. During peak time, the two spaces were still least occupied by students.
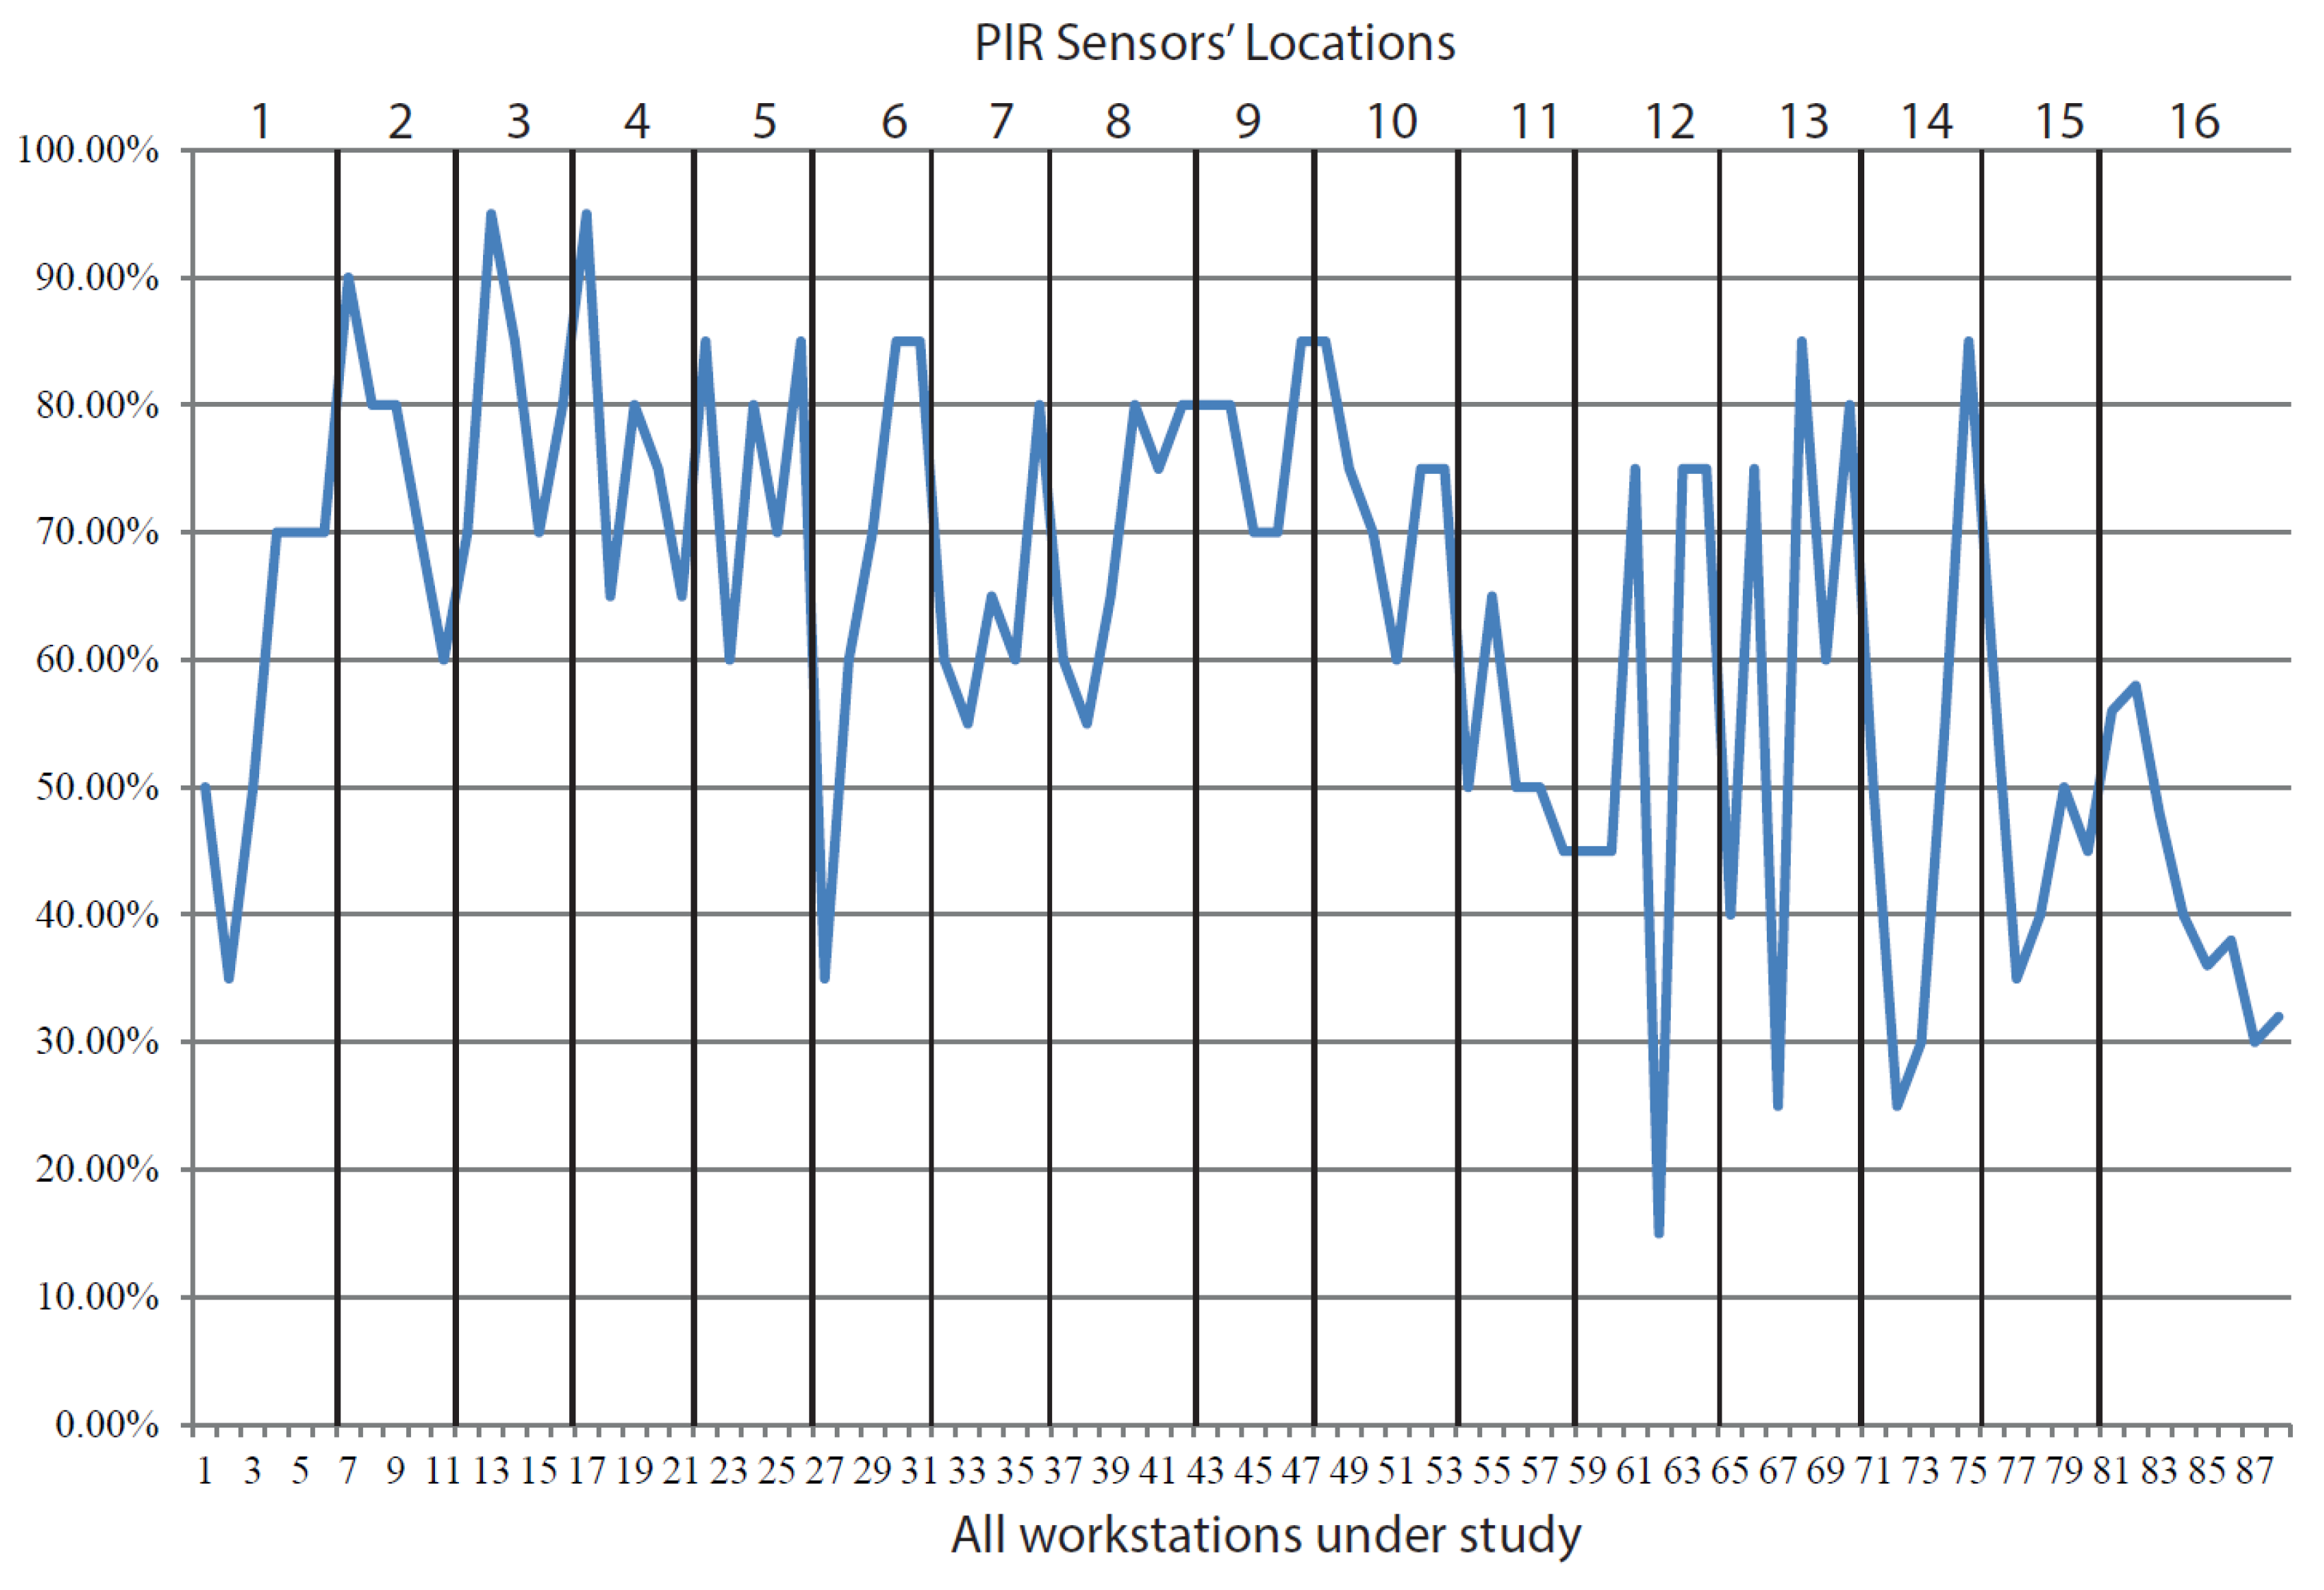
The occupancy data acquired from PIR sensors might not be accurate since each sensor would count nearby occupants. It is necessary to observe the occupancy condition to verify the data. Figure 13 shows the data acquired from one-day observation (heads counting every half hour from 8 a.m.–8 p.m). The figure also indicates the detection range of each PIR sensor in relation to each workstation. The data disclosed more details of the occupancy rate. The peak occupancy rate was similar to the data acquired by PIR sensors; on the other hand, the valley bottom value was lower than the data acquired by PIR sensors. The PIR seemed to overestimate the occupancy rate due to its detection range. However, the average value could largely match with the data acquired from the PIR sensors.
Regression analyses were conducted to explore the relationship between views and users’ stay. The dependent variables are the two types of occupancy rate data respectively acquired by PIR sensors and head counting while the independent variables include the average percentage of sky views, average percentage of green view and average percentage of shading views. Table 3 summarizes the two regression models. The two models disclose very similar relationships: sky and shading views tended to positively relate to the occupancy rate while a greenery view was likely to be negatively associated with the occupancy rate. The two regression models support each other to indicate there might be an interesting relationship between views and seat preferences. The relationship deserves further verifications and explorations. The main aim of this regression analysis is to compare the relationships between outdoor view elements (sky, greenery, and shading) and occupancy rate. Therefore, the models are not to claim the individual weighting or contribution of these elements, but to compare their correlations to the occupancy rate.
4. Discussion
High quality outdoor views are of great importance not only for improving occupants’ health and well-being, but also for attracting and retaining users, which should be addressed in designing learning environments. The seat preference survey disclosed that views are the second most frequently mentioned reason for choosing seats. The factor reduction analysis identified three latent variables accounting for choosing seats: the first is about territoriality (such as quietness, privacy, and furniture) that refers to the personal control of his or her individual space in the library; the second is about visual aspects (such as views, daylighting and orientation); and the third is about social interactions (such as friends, entrance and circulation). Territoriality, in this study, is rated as the most important factor for choosing seats, which is consistent with other research [9]. This study also found that outdoor views came to the second most important factor in students’ decision making for seat selection. The outdoor views and related daylight and orientation, are important for occupant health and wellbeing. This study points out that they are important for seat preference as well.
Furthermore, the research investigated three common outdoor view elements: sky, greenery, and shading. These three elements have different effects in a visual environment. Sky and greenery are natural elements that are supposed to have positive effects on attracting users to stay but have contradictive effects on daylight availability; shading is a man-made element that is supposed to be less attractive but necessary for preventing glare or reducing visual contrast. Occupancy rates were found positively associated with sky and shading while negatively related to greenery. This result could be tentatively interpreted that students might prefer sky views with appropriate shading rather than dense trees as outdoor views. The openness to sky can provide more layers of views, which is more interesting than singularity of densely planted trees. The quantification of view elements have not been found in previous literature. This study provided a new approach of using fisheye lens images to quantify different view elements. Three main elements were selected for the quantification. It should be noticed that other elements, such as roofs and grounds, might be a component of outdoor views, and should be included in future studies.
The occupancy rate is an important research subject in this study. Most previous research on daylighting and outdoor view preference used subjective rating, such as perception, and satisfaction as evidence [24]. This research used real occupancy data as evidence to account for users’ preference or attraction to stay. Through automatically monitoring and manually counting occupancy rates, a stable difference was found between measured locations and workstations. Workstations with the largest sky views tended to have a higher occupancy rate. The regression model confirmed the three significant factors that influenced the occupancy rate: sky views, tree views, and shading views. It is observable through the occupancy pattern that maximum sky views plus appropriate shading had positive effects on attracting a students’ stay. Some studies suggested that layers of views are also important factors contributing to the quality of outdoor views and that views with different layers were preferred over single layer views and a distant city or landscape is the most preferred layer [17]. This point can help to explain that students in this library preferred sky views due to the possibility of including more content and layers while they were less attracted to greenery views because of the singularity.
5. Conclusions
There are many personal and built environment factors influencing users’ stay or seat preference in learning environments. This study not only echoes the previous research indicating that territory and privacy are important factors for choosing seats in a learning environment; but also, this study contributes to the literature with evidence that outdoor views might be another important factor for seat preference. Using a library building as a case study, the research investigated three important outdoor view components: sky, greenery, and shading, which may influence daylighting performance and quality views. In this library building, nearby trees are used as an important shading strategy and outdoor view element. However, the high density of leafs and trunks would reduce sky and daylight availability; furthermore, the singularity of view layers would less likely be attractive to building occupants. Sky views and shading views were found positively related to the occupancy rate. Based on this point, open views with appropriate shading were found as an optimal outdoor view composition.
The research has important design implications to green building guidelines and practices. Many green building rating systems proposed bringing outdoor views inside for high quality indoor environments; while they did not suggest which view elements should be introduced and in which way different view elements should be composed. The research proposes that an open view with appropriate shading should be attractive to users. The singularity of a view that is less likely to be attractive to building occupants is not recommended.
The outdoor view is usually entangled with daylight; that is why many green building standards combine daylight and outdoor views as one of the important indoor environment quality design aspects. Therefore, it is recommended that future studies shall look at the interactive effects of daylight and outdoor views to enrich the existing daylighting design metrics [25,26].
Methodologically, this study provides new approaches to quantify view elements and to count the occupancy rate using motion sensors. However, the study contains several limitations. The first is that the seat selection was focused on the periphery of the library space while excluding the middle seats in the library. Although it is intentional since the periphery seats have direct outdoor views to study the effect, it is more interesting to see whether the effect applies to seats in other locations in the library. The second is about the sample size for the survey. Principally, 100 respondents are expected to conduct the factor analysis. However, only 72 students returned the completed survey results. The third is about the occupancy monitoring. Only two weekdays were monitored. Due to the limitations, the results and findings should be carefully generalized. Future studies are expected to include a larger sample size and longer days to monitor the occupancy conditions.
Author Contributions
Conceptualization, Methodology, Formal Analysis, Supervision and Draft Writing by Z.G.; Investigation, Data Curation and Writing Review by M.K. and B.M.
Funding
This research received no external funding.
Acknowledgments
The authors would like to thank the Griffith University library for the tremendous help in the data collection.
Conflicts of Interest
The authors declared no potential conflicts of interest with respect to the research, authorship, and/or publication of this article.
References
- Weinstein, C.S. The physical environment of the school: A review of the research. Rev. Educ. Res. 1979, 49, 577–610. [Google Scholar] [CrossRef]
- Bluyssen, P.M. Health, comfort and performance of children in classrooms—New directions for research. Indoor Built Environ. 2017, 26, 1040–1050. [Google Scholar] [CrossRef]
- Haghighi, M.M.; Jusan, M.B.M. The impact of classroom settings on students’ seat-selection and academic performance. Indoor Built Environ. 2013, 24, 280–288. [Google Scholar] [CrossRef]
- Yildirim, K.; Cagatay, K.; Ayalp, N. Effect of wall colour on the perception of classrooms. Indoor Built Environ. 2014, 24, 607–616. [Google Scholar] [CrossRef]
- De Giuli, V.; Zecchin, R.; Corain, L.; Salmaso, L. Measurements of indoor environmental conditions in Italian classrooms and their impact on children’s comfort. Indoor Built Environ. 2014, 24, 689–712. [Google Scholar] [CrossRef]
- Mahyuddin, N.; Awbi, H.B.; Alshitawi, M. The spatial distribution of carbon dioxide in rooms with particular application to classrooms. Indoor Built Environ. 2013, 23, 433–448. [Google Scholar] [CrossRef]
- Wang, N.; Boubekri, M. Investigation of declared seating preference and measured cognitive performance in a sunlit room. J. Environ. Psychol. 2010, 30, 226–238. [Google Scholar] [CrossRef]
- Galasiu, A.D.; Veitch, J.A. Occupant preferences and satisfaction with the luminous environment and control systems in daylit offices: A literature review. Energy Build. 2006, 38, 728–742. [Google Scholar] [CrossRef]
- Kaya, N.; Burgess, B. Territoriality: Seat preferences in different types of classroom arrangements. Environ. Behav. 2007, 39, 859–876. [Google Scholar] [CrossRef]
- Gifford, R. Environmental Psychology: Principles & Practice; Optimal Books: Colville, WA, USA, 2002. [Google Scholar]
- Pedersen, D.M. Privacy preferences and classroom seat selection. Soc. Behav. Personal. Int. J. 1994, 22, 393–398. [Google Scholar] [CrossRef]
- Ulrich, R. View through a window may influence recovery from surgery. Science 1984, 224, 420–421. [Google Scholar] [CrossRef] [PubMed] [Green Version]
- USGBC. LEED v4 for Building Design and Construction; U.S. Green Building Council: Washington, DC, USA, 2014. [Google Scholar]
- Boubekri, M. Daylighting, Architecture and Health: Building Design Strategies; Architectural Press: Oxford, UK, 2008. [Google Scholar]
- Gou, Z.; Lau, S.S.-Y.; Qian, F. Comparison of mood and task performance in naturally-lit and artificially-lit environments. Indoor Built Environ. 2015, 24, 27–36. [Google Scholar] [CrossRef]
- Andersen, M. Unweaving the human response in daylighting design. Build. Environ. 2015, 91, 101–117. [Google Scholar] [CrossRef] [Green Version]
- Hellinga, H.; Hordijk, T. The D&V analysis method: A method for the analysis of daylight access and view quality. Build. Environ. 2014, 79, 101–114. [Google Scholar]
- Edwards, L.; Torcellini, P. A Literature Review of the Effects of Natural Light on Building Occupants; National Renewable Energy Laboratory: Golden, CO, USA, 2002.
- Lau, S.S.Y.; Gou, Z.; Liu, Y. Healthy campus by open space design: Approaches and guidelines. Front. Archit. Res. 2014, 3, 452–467. [Google Scholar] [CrossRef]
- Velarde, M.D.; Fry, G.; Tveit, M. Health effects of viewing landscapes—Landscape types in environmental psychology. Urban For. Urban Green. 2007, 6, 199–212. [Google Scholar] [CrossRef]
- Xue, F.; Gou, Z.; Lau, S. Human factors in green office building design: The impact of workplace green features on health perceptions in high-rise high-density Asian cities. Sustainability 2016, 8, 1095. [Google Scholar] [CrossRef]
- Othman, A.R.; Mazli, M.A.M. Influences of Daylighting towards Readers’ Satisfaction at Raja Tun Uda Public Library, Shah Alam. Procedia Soc. Behav. Sci. 2012, 68, 244–257. [Google Scholar] [CrossRef]
- Lindberg, F.; Holmer, B. Sky View Factor Calculator: User Manual—Version 1.1; Göteborg Urban Climate Group, University of Gothenburg: Gothenburg, Sweden, 2012. [Google Scholar]
- Reinhart, C.F.; Mardaljevic, J.; Rogers, Z. Dynamic daylight performance metrics for sustainable building design. Leukos 2006, 3, 7–31. [Google Scholar]
- Nabil, A.; Mardaljevic, J. Useful daylight illuminance: A new paradigm for assessing daylight in buildings. Light. Res. Technol. 2005, 37, 41–57. [Google Scholar] [CrossRef]
- Salata, F.; Golasi, I.; di Salvatore, M.; de Lieto Vollaro, A. Energy and reliability optimization of a system that combines daylighting and artificial sources. A case study carried out in academic buildings. Appl. Energy 2016, 169, 250–266. [Google Scholar] [CrossRef]
Figure 1.
Griffith University Gold Coast Library and its shading strategies: louvers for west facing facades, horizontal and vertical projections for north, south and east facing facades, and trees around the building.
Figure 1.
Griffith University Gold Coast Library and its shading strategies: louvers for west facing facades, horizontal and vertical projections for north, south and east facing facades, and trees around the building.

Figure 2.
The floor plan of Level 3; 88 workstations which are located next to windows and face the outside are selected for this study.
Figure 2.
The floor plan of Level 3; 88 workstations which are located next to windows and face the outside are selected for this study.

Figure 3.
Desktop Illuminance for workstations with different orientations.

Figure 4.
Example of taking high-dynamic-range (HDR) photos at each workstation.

Figure 5.
Example of the view analysis using the Sky View Factor Calculator.

Figure 6.
The 16 locations where the Passive Infrared (PIR) motion sensors were installed (the pictures show the outside views at those locations).
Figure 6.
The 16 locations where the Passive Infrared (PIR) motion sensors were installed (the pictures show the outside views at those locations).

Figure 7.
Frequency of reasons being mentioned.

Figure 8.
Importance of factors for choosing seats in library.

Figure 9.
The percentage of sky, green and shading view elements for selected workstations.

Figure 10.
The workstation with most green view (left) located at 12 in Figure 5, the workstation with most sky view (middle) located at 2 in Figure 5 and the workstation with most shading view (right) located at 16 in Figure 5.

Figure 11.
Occupancy rate at each location by PIR sensors (1: occupied; 0: unoccupied).

Figure 12.
Breakdown of occupancy rates acquired by PIR sensors.

Figure 13.
Occupancy rate at each workstation by head counting.


Table 1.
Three underlying factors for choosing seats.
| Factor 1 | Factor2 | Factor3 | |
|---|---|---|---|
| Factor Loading * | Factor Loading * | Factor Loading * | |
| Furniture Privacy Quiet | 0.680 0.702 0.736 | ||
| Views Daylighting Orientation | 0.809 0.685 0.666 | ||
| Friends Entrance | 0.709 0.664 |
* Factor loading shows the relationship of each variable to the underlying factor.
Table 2.
Correlation table for the three outdoor view elements.
| Percentage of Sky View | Percentage of Green View | Percentage of Shading View | ||
|---|---|---|---|---|
| Percentage of Sky View | Pearson Correlation | 1 | −0.384 ** | 0.169 |
| Sig. (2-tailed) | 0.000 | 0.135 | ||
| N | 88 | 88 | 88 | |
| Percentage of Green View | Pearson Correlation | −0.384 ** | 1 | −0.325 ** |
| Sig. (2-tailed) | 0.000 | 0.003 | ||
| N | 88 | 88 | 88 | |
| Percentage of Shading View | Pearson Correlation | 0.169 | −0.325 ** | 1 |
| Sig. (2-tailed) | 0.135 | 0.003 | ||
| N | 88 | 88 | 88 |
** Correlation is significant at the 0.01 level (2-tailed).
Table 3.
Regression models for occupancy rates.
| Dependent Variables | Independent Variables & Coefficients | ||
|---|---|---|---|
| Sky | Greenery | Shading | |
| Occupancy rate_PIR sensors (R2 = 0.375) | 0.323 * | −0.197 * | 0.287 * |
| Occupancy rate_Head counting (R2 = 0.217) | 0.206 * | −0.116 * | 0.178 * |
* Correlation is significant at the 0.05 level (2-tailed).
© 2018 by the authors. Licensee MDPI, Basel, Switzerland. This article is an open access article distributed under the terms and conditions of the Creative Commons Attribution (CC BY) license (http://creativecommons.org/licenses/by/4.0/).
Share and Cite
MDPI and ACS Style
Gou, Z.; Khoshbakht, M.; Mahdoudi, B. The Impact of Outdoor Views on Students’ Seat Preference in Learning Environments. Buildings 2018, 8, 96. https://doi.org/10.3390/buildings8080096
AMA Style
Gou Z, Khoshbakht M, Mahdoudi B. The Impact of Outdoor Views on Students’ Seat Preference in Learning Environments. Buildings. 2018; 8(8):96. https://doi.org/10.3390/buildings8080096
Chicago/Turabian StyleGou, Zhonghua, Maryam Khoshbakht, and Behnam Mahdoudi. 2018. "The Impact of Outdoor Views on Students’ Seat Preference in Learning Environments" Buildings 8, no. 8: 96. https://doi.org/10.3390/buildings8080096
Note that from the first issue of 2016, this journal uses article numbers instead of page numbers. See further details here.