1. Introduction
Despite a long and rich history of research on occupational mobility and career choice, researchers have rarely explored intergenerational occupational inheritance at the level of specific occupations. In this paper, we add to a small and diverse literature on this topic by investigating the extent to which college freshmen plan to follow their parents into the engineering profession.
The under-representation of women in STEM (Science, Technology, Engineering and Mathematics) fields has long been the focus of considerable scholarly attention [
1,
2,
3,
4,
5] and public policy initiatives [
6,
7,
8,
9]. In particular, policy makers are concerned about a shortage of individuals trained for engineering and other STEM professions. Indeed, interest in generating a skilled labor force underlies much of the research on STEM fields [
10,
11].
The economic impact of the two and a half million engineers currently employed in the US far surpasses their numbers. Working in diverse industries, they plan roads, bridges and weapons systems for the government, design new products for consumers, monitor and improve production processes in manufacturing and energy production, and develop materials for use in construction, medicine, and many other fields [
12,
13].
Sociologists have long been interested in engineering [
14] due to its status as a profession often based in large corporations [
15] and for its role as an exemplar of the knowledge society [
16]. In more recent years, the gender and racial homogeneity of practitioners has taken center stage among sociologists interested in engineering [
17,
18]. Indeed, engineering is the largest of the STEM majors and is the career most often mentioned by male freshmen [
19]. The under-representation of women and minorities is particularly notable in the case of engineering [
20].
Examining occupational choices among parents and children will help us to understand the under-representation of women in this field. Research on the determinants of women’s entry into the field of engineering has paid relatively little attention to parent’s employment in engineering [
21]. Sikora and Pokropek (2012) represents a notable exception. If sons are more likely than daughters to follow their fathers into engineering, this differential would contribute to women’s under-representation in engineering. Similarly, if daughters are more likely to pattern themselves on their mothers, and if mothers are substantially under-represented in engineering, then this gender-specific role-modeling pattern could contribute to young women’s continuing under-representation in this important field. These are among the possibilities we investigate [
21].
In addition to contributing to our understanding of diversity in the field of engineering, this study promises to contribute to our understanding of gender patterns within families. By examining gender-specific role models, and investigating whether the salience of mothers’ careers has increased over time as women’s careers have become more established, we hope to shed light on the way gender inequality is reproduced and how these patterns may be evolving over time. The large and unique data set we tap provides unparalleled opportunity to assess change over time and to make detailed distinctions, such as differentiating between families in which both parents are employed as engineers and those in which only the mother is an engineer.
Understanding freshman plans to pursue a career in engineering should be understood as representing one point in the career-development process. Engineering, along with other STEM fields, experiences considerable attrition during the undergraduate years, and significant gender differences in persistence continue to be evident [
22,
23,
24,
25].
This line of research often focuses on the scientific “pipeline,” that is, stages in the educational career where women may “leak out” of pathways towards a career in engineering [
26,
27,
28]. For the purposes of understanding the career plans of college freshmen, engineering is a useful case in part because there is a clear link between the choice of field of study in college and the pursuit of a career. Specifically, freshmen who express an interest in pursuing a career in engineering also are likely to plan to major in engineering [
29]. In many cases, there is an additional behavioral step involved. In other words, engineering is often located in its own collegiate division or school and frequently requires a separate application process. In short, the plan to pursue a career in engineering represents more than checking off one box in a list of possible careers. We will examine the issue of the predictive validity of freshman career intentions in more detail below.
Finally, given its reliance on data spanning several decades, this study will help us understand change over time. We are particularly interested in exploring whether the salience of mothers in their children’s career choices has grown over time.
2. Scarcity of Studies of Occupational Inheritance
Researchers from several distinct disciplines have approached the question of occupational assortment using a variety of theoretical frameworks. As we will see, researchers have often focused on self-selection into occupational types or clusters rather than individual occupations. This pattern is evident in both social-psychological studies [
30,
31] as well as research on social mobility conducted by sociologists [
32].
This psychological literature, for example, emphasizes the role of personality and values in the choice of occupations as well as the persistence in these careers. Another approach to intergenerational inheritance employs occupational indices such as prestige scales or socio-economic status scores [
33]. Similarly, economic studies have generally emphasized intergenerational connections with respect to income rather than via specific occupations per se [
34,
35].
1There is a widely dispersed literature on the recruitment and retention of employees in particular occupations [
36,
37,
38]. These fields often come to be studied because of perceived shortages, high turnover, or the belief that the unique demands of a particular field require a very specific personality type. These occupation-specific studies typically do not focus on the inter-generational association. The main exceptions have been volunteers for military service [
39] and self-employment. A variety of studies have found that children whose parents were self-employed are much more likely to be self-employed themselves [
40,
41].
2The scarcity of research on intergenerational connections to particular occupations may well be due in part to the large amount of data needed to pursue this issue, since individual occupations often represent one percent or less of a sample. Fortunately, the UCLA Higher Education Research Institute (HERI) freshman surveys are large enough to allow for the analysis of small but important subgroups.
The questions investigated in this study most closely match those examined in an exemplary paper by Sikora and Pokropek (2012) [
21]. They considered the impact of parents’ careers on children’s plans to pursue STEM careers using data on fifteen-year-old students from 24 countries. The differences between our study and theirs include the following: (a) their study does not focus on engineering alone but groups this field with computer science and mathematics; (b) we are able to examine changes over time in the relationships between parents (especially mothers) and children; (c) our results pertain to college freshmen, who are several years older than the students included in Sikora and Pokropek’s study. Not only are college freshmen older and more focused on their career plans, but we are observing them at a particularly critical time in the selection of their field of study.
3. Theorizing Intergenerational Connections
It should be noted that there is a broad cultural emphasis on the importance of young adults making their own choices. In other words, parents (at least in the US) are broadly enjoined from issuing specific career directives for their children. Instead, parents’ role is often seen as “guiding, not deciding” for their children [
42].
3 Advice columnists and parenting guides urge parents to help their children pursue opportunities for self-discovery and appropriate information rather than direct them toward a goal of the parents’ choosing [
43]. In fact, as we will see, the vast majority of children pursue careers that differ from those of their parents.
There are nevertheless a number of reasons to believe that children will be disproportionately likely to follow in their parents’ footsteps. There are at least three sources of a connection between the careers of parents and their children: familiarity, values and skills. The world of work is comprised of a bewildering array of specialties, and consequently there are many fields of work which may not be familiar to the average 18-year-old. In general, children are exposed to their parents’ career choices, although they may not be acquainted with the details of the job. If occupational choices are disproportionately concentrated among familiar fields, and if children are at least acquainted with their parents’ jobs, then children will disproportionately express an interest in the same career choices as their parents. In Sorensen’s (2004) memorable formulation, exposure (to parent’s occupational experiences) leads to social closure, that is, a tendency for in-group members to have advantaged access to a social position over out-group members [
41].
Children may also absorb occupationally-related values from their parents. For example, some parents may emphasize the importance of service as a necessary component of meaningful work, while others may stress the importance of job security or pecuniary success. Many studies have documented the inter-generational congruence of connection of values, although the connections are sometimes weaker than one might expect and the pathways can be hard to pinpoint [
44,
45,
46,
47].
A final reason for expecting children to follow in their parent’s footsteps relates to the acquisition of skills. Children may absorb some of the ‘tricks of the trade’ by watching their parents work and listening to their parents’ stories. This mode of human capital acquisition has been emphasized for self-employment and family farms, where children are likely to have direct exposure and even involvement, a form of on-the-job training. Some researchers find that those who have inherited occupations from their parents earn more than those whose parents were employed in different fields ([
48]; but see Sorensen (2004) for an exception [
41]). They attribute this earnings advantage to the assimilation of occupation-specific skills during childhood and adolescence by those who follow in their parents’ footsteps.
To summarize, despite a general cultural emphasis on the importance of individual choice, we expect that children are likely to disproportionately select their parents’ current career as their own occupational goal.
4. Engineers’ Job Satisfaction
The tendency of children to follow their parents’ career choices assumes that the parents themselves have a generally positive view of their career choices. While it is difficult to summarize feelings about the engineering profession, since it represents such a large and diverse set of careers and employment settings, there are nonetheless several reasons to believe that parents convey a generally positive assessment of their careers in the field.
Professionals tend to view their careers in a favorable light, and engineers are no exception in this regard [
49]. Our analysis of job satisfaction using data from the General Social Survey (GSS) reveals that engineers are not statistically distinguishable from other professionals in their level of job satisfaction.
4When the Gallup organization asked respondents what kind of work or career they would recommend to a young man or woman, engineering ranked in the top 7 for both genders, and combining “engineering” with “technology/electronics” and “computers” would place this cluster of fields second only to medicine [
50]. One survey reports that engineers generally regard their work as “interesting and rewarding” (77%), and that 84% would recommend and engineering career to their child or to a friend’s child [
51].
An additional consideration that should be noted here is that parents of college freshmen are generally older, and job satisfaction increases with age. This is due in part to the fact that job rewards increase with age [
52]. It is also the case that parents who are engineers when their children are in college represent those who have survived or persisted in the field of engineering. Many of those who were disgruntled or unsatisfied with engineering would have left the field by this stage in their lives [
53]. Since parents of college freshmen are generally in their forties or fifties, they may well offer a more positive evaluation of the field than those who were dissatisfied and left to pursue other lines of work.
5. Fathers and Mothers, Sons and Daughters
Thus far, we have reviewed reasons for parental effects without differentiating between fathers and mothers on the sending side and sons and daughters on the receiving side. Now, we turn to the issue of gender-specific connections. The father-son relationship has been the focus of the greatest attention. In our view, this reflects the historical assumption that the status of the family depends on the father’s occupation and earnings. In other words, if the male is assumed to have the breadwinner role [
54], the connection between fathers and sons is the key association in terms of intergenerational transmission of status.
Research on intergenerational social mobility has most commonly taken father’s occupation as a measure of ‘social origins,’ whether or not daughters are included along with sons in the research [
55], despite substantial evidence that mothers also influence children’s outcomes. When mothers are added to the model, their influence has usually been conceptualized as rooted in their education rather than their occupation (see [
56] for a review, and [
57] for an exception). However, women’s employment has grown to the point that the majority of mothers work for pay, including mothers of pre-school children [
58]. The vast majority of undergraduates are able to list a career for their mothers, and only a minority list their mother’s occupation as “homemaker.”
5 In this context, it is important to develop specific hypotheses regarding the effects of both fathers and mothers on the career choices of sons and daughters.
We expect the occupation-specific father-son connection to be stronger than the father-daughter connection. Daughters who choose to follow their fathers must overcome gendered stereotypes about careers in engineering and science (see [
17,
25] cited above). In other words, we expect that it will be easier for sons to follow their fathers because there are a host of social and cultural obstacles in the way of daughters who may be inclined to do the same.
The voluminous literature on role models suggests a mother-daughter connection. Researchers have long suggested a connection between positive maternal role models and daughters’ engagement in paid employment [
59].
6 Now that mothers’ employment is common, we expect that mothers will not only represent a model of employment but of specific occupational choices as well. More recent research, in both experimental and natural settings, has provided evidence that non-familiar female role models, serve to counter gender-stereotypes [
61]. A central question, then, is whether the presence of a significant role model within the family in a gender-atypical setting effectively counters the broader cultural barriers to the daughter’s pursuit of a male-dominated field, in this case a career in engineering.
Sikora and Popropek [
21] lay out the role-modeling thesis in detail with respect to careers in sciences. They find that role models are influential in the choice of scientific careers, and parents in particular serve as powerful role model.
Marks [
62] carefully maps out several specific gender-specific role-modeling effects. Specifically, he investigates whether fathers have stronger effects on boys in terms of the influence of the fathers’ socio-economic level, occupational status and educational attainment. The mother-daughter association for these same three factors are also posited to be stronger than the gender-discordant relationships. Drawing on data covering over 170,000 15-year-old students in 32 countries, Marks finds some evidence of these gender-specific relationships on children’s student performance, but these associations are not consistently evident within countries or across countries. Marks concludes that it makes relatively little difference which parent contributes resources to the family as long as the mother works for pay. He also finds no evidence of change over time in the impact of mothers relative to fathers.
Rather than abandon the premise of gender-specific role models, this study will pursue these questions in terms of a substantively different parent-child connection. We posit that that the parent-child connection may well be stronger in terms of the child copying the parent’s specific occupational field rather than in terms of students’ overall educational performance. The general socio-economic relationships that Marks investigates are rather diffuse and children may not differentiate between their father’s and their mother’s attributes in this particular way. In other words, if children experience their family’s overall social standing as a whole, it may not always be possible to tease out separate effects of mothers and fathers, especially as parents are increasingly matched on their educational levels [
63]. In contrast, the particular occupational and career experiences of parents may well be more salient and not reducible to a general socio-economic dimension. Thus, there is reason to believe that, when it comes to career choice, sons may be more likely to copy their fathers while daughters copy their mothers.
In addition to redirecting the question to occupational specific connections, we reframe the question in terms of change over time. Mothers’ impact on the career goals of their children may be more salient today than was the case a generation or two ago, when fewer mothers worked outside the home for pay, and when commitment to a full-time career was less common than it has become.
As women spend a greater portion of their lives in the labor force, it may be that their occupational choices are becoming increasingly influential in their children’s development of career aspirations. Consequently, we expect that the salience of mothers’ careers may well have increased over time, especially in terms of their connection with the career choices of their daughters. We expect that mothers will have disproportionate effect on their daughters rather than their sons, and that the effect on both sons and daughters will have grown in recent decades.
It should also be noted that mothers who remain employed as engineers by the time that their daughters are entering college are a selected group. There is evidence of attrition from engineering at all stages, from the point of college entry and continuing throughout the career, and exit rates are higher for women than for men (see [
23,
24,
25,
53]). Consequently, the role-modelling of mothers in this case needs to be understood against this backdrop. In other words, the mothers who survived in engineering are more likely to be committed to this career, and their daughters are likely to be cognizant of this fact.
In this regard, our hypothesis is quite different than that developed by Hellerstein and Morrill [
64], who find evidence of an increasing association over time between the career choices of daughters and their fathers. They posit that this reflects a greater level of “occupational-specific” human capital investments on the part of fathers in the context of a greater likelihood that their daughters are going to spend a significant portion of their careers in the labor market. It is possible, then, that the Hellerstein-Morrill effect may off-set a potential increase in the mother-daughter connection. Of course, it is possible as well that there has been an increase in both the father-daughter and mother-daughter connections. We revisit the Hellerstein-Morrill issue with data that spans the period during which mothers’ labor force attachment was increasing.
6. Parental Occupational Homogamy
One important consideration in assessing the potential impact of mothers who are engineers is the fact that a very large fraction—almost half—of students whose mothers are engineers also report that their fathers are engineers. Consequently, a simple assessment of the mother’s impact on her children will overstate her influence because in many cases this will actually represent the combined effect of fathers and mothers. Because we have such a large sample, we are able to separate engineering families into those which are father only, mother only, or both parents.
7. Research Questions
The specific goals of this study include efforts to answer a series of inter-related research questions:
Research Question 1: Is there an increased likelihood of planning a career in engineering if one or more of the respondent’s parents is an engineer?
Research Question 2: Does the association between parents’ and children’s careers vary for fathers and mothers, and sons and daughters, as well as the case in which both parents are engineers?
Research Question 3: Have these associations increased or declined over the last four decades?
Research Question 4: Are parental effects mostly mediated by particular pathways, such as values and preparation, or is most of the parent–child association a largely unexplained residual?
8. Data and Methods
Our research taps into data collected by the Cooperative Institutional Research Program (CIRP), a nationwide study of college students housed at the Higher Education Research Institute at the University of California, Los Angeles. The HERI Freshman Survey, a national longitudinal study of college students in the United States, annually obtains responses from entering college students regarding their demographic backgrounds, high school experiences, affective traits such as self-concepts and values, and goals and aspirations related to college and beyond.
Data for this study cover the period 1976 through 2011. The analysis reported here is based on a sample of nearly 1 million first-year students. This sample is stratified by institutional type, control and selectivity. Weights are applied in order to make the results representative of freshmen enrolled full time at four-year institutions in the United States [
19].
Entering freshmen are asked to indicate their intended career as well as the careers of their parents based on a list of several dozen career goals on the survey. This occupational list forms the basis for the dependent variable in this study as well as the two key independent variables. Students who designated “engineer” as their career goal were assigned a value of 1; other occupational plans were assigned a value of 0. The same procedure was applied to students’ reports of the parents’ occupations. The odds ratios for father-son, father-daughter, mother-son and mother-daughter associations are calculated. These and other analyses are reported separately by gender. The trends in these associations are also reported.
Once the associations between first-year students’ plans to enter engineering and their parent’s employment in engineering were established, we sought to identify whether these associations were mediated by identifiable measures. In other words, we examined whether the parent-child association could be explained by factors such as academic self-concept or student values, or whether the association was a direct one, net of mediating factors. We employ logistic regression analysis, given the 0/1 nature of the dependent variable. We also checked on the robustness of the model by re-estimating it with OLS (ordinary least squares) regression as recommended by Mood [
65].
The control variables employed in this study were prepared as part of a larger project on the determinants of majoring in STEM fields. The selection and grouping of other independent variables draws on Lent, Brown, and Hackett’s [
66] Model of Career Related Choice Behavior (MCRCB). Variables were divided into four groups:
- ■
Race, Ethnicity and Religion
- ■
Socio-economic Characteristics
- ■
Educational Preparation, Self-Rated Abilities and Aspirations
- ■
Personality, Interests and Goals.
- -
Race, Ethnicity and Religion: Race dummy variables (vs. White) include African-American, Asian-American, Latino/Chicano and Native American. Religion (versus Protestant) dummy variables include Catholic, Jewish, Other and None.
- -
Socio-economic Characteristics: Family Income, Mother’s and Father’s Education, Race, Ethnicity and Religion, and Financial Concern for College,
- -
Academic Preparation, Self-Rated Abilities and Aspirations: High School GPA, Self-rated Mathematics Ability, Scholar Personality (factor), Degree Aspiration, Expectation of Making at Least a B Average, Expectations of Changing Major Field, Educational Reasons for Going to College (factor).
- -
Personality, Interests and Goals: Leader Personality (factor), Scholar Personality (factor), Goal of Making a Theoretical Contribution to Science; Goal: Developing a Meaningful Philosophy of Life; Goal: Raise a Family; Social Activist Personality (factor), Artistic Personality (factor), and Status Striver Personality (factor), Educational Reasons for Going to College (factor), Extrinsic Reasons for Going to College (factor).
The principal focus is the effect of these blocks of variables on the strength of the parent–child connection. The goal of the analysis is to determine whether these groups of variables account for, or explain, the impact of parents on their child’s choice of engineering as a career goal. The construction of the factors and other specifics regarding these control variables can be found in the appendix section of this paper.
While we draw on a very large data set spanning a long period of time with an extensive set of variables, there are limitations to this study, as is inevitable in any research of this kind. The data we examine do not follow students over their undergraduate years and into their careers. Thus, while we are able to shed light on a key moment in the career development process, we are unable to address questions regarding persistence into engineering and other STEM careers. The UCLA HERI Freshman Survey data also do not include questions regarding how involved parents are in their children’s career choices, questions that are available in some other studies, e.g., [
67]. We also do not have direct measures on parents’ values. We are thus in a position of inferring value transmission from student reports rather than comparing students’ and parents’ reports.
9. Results
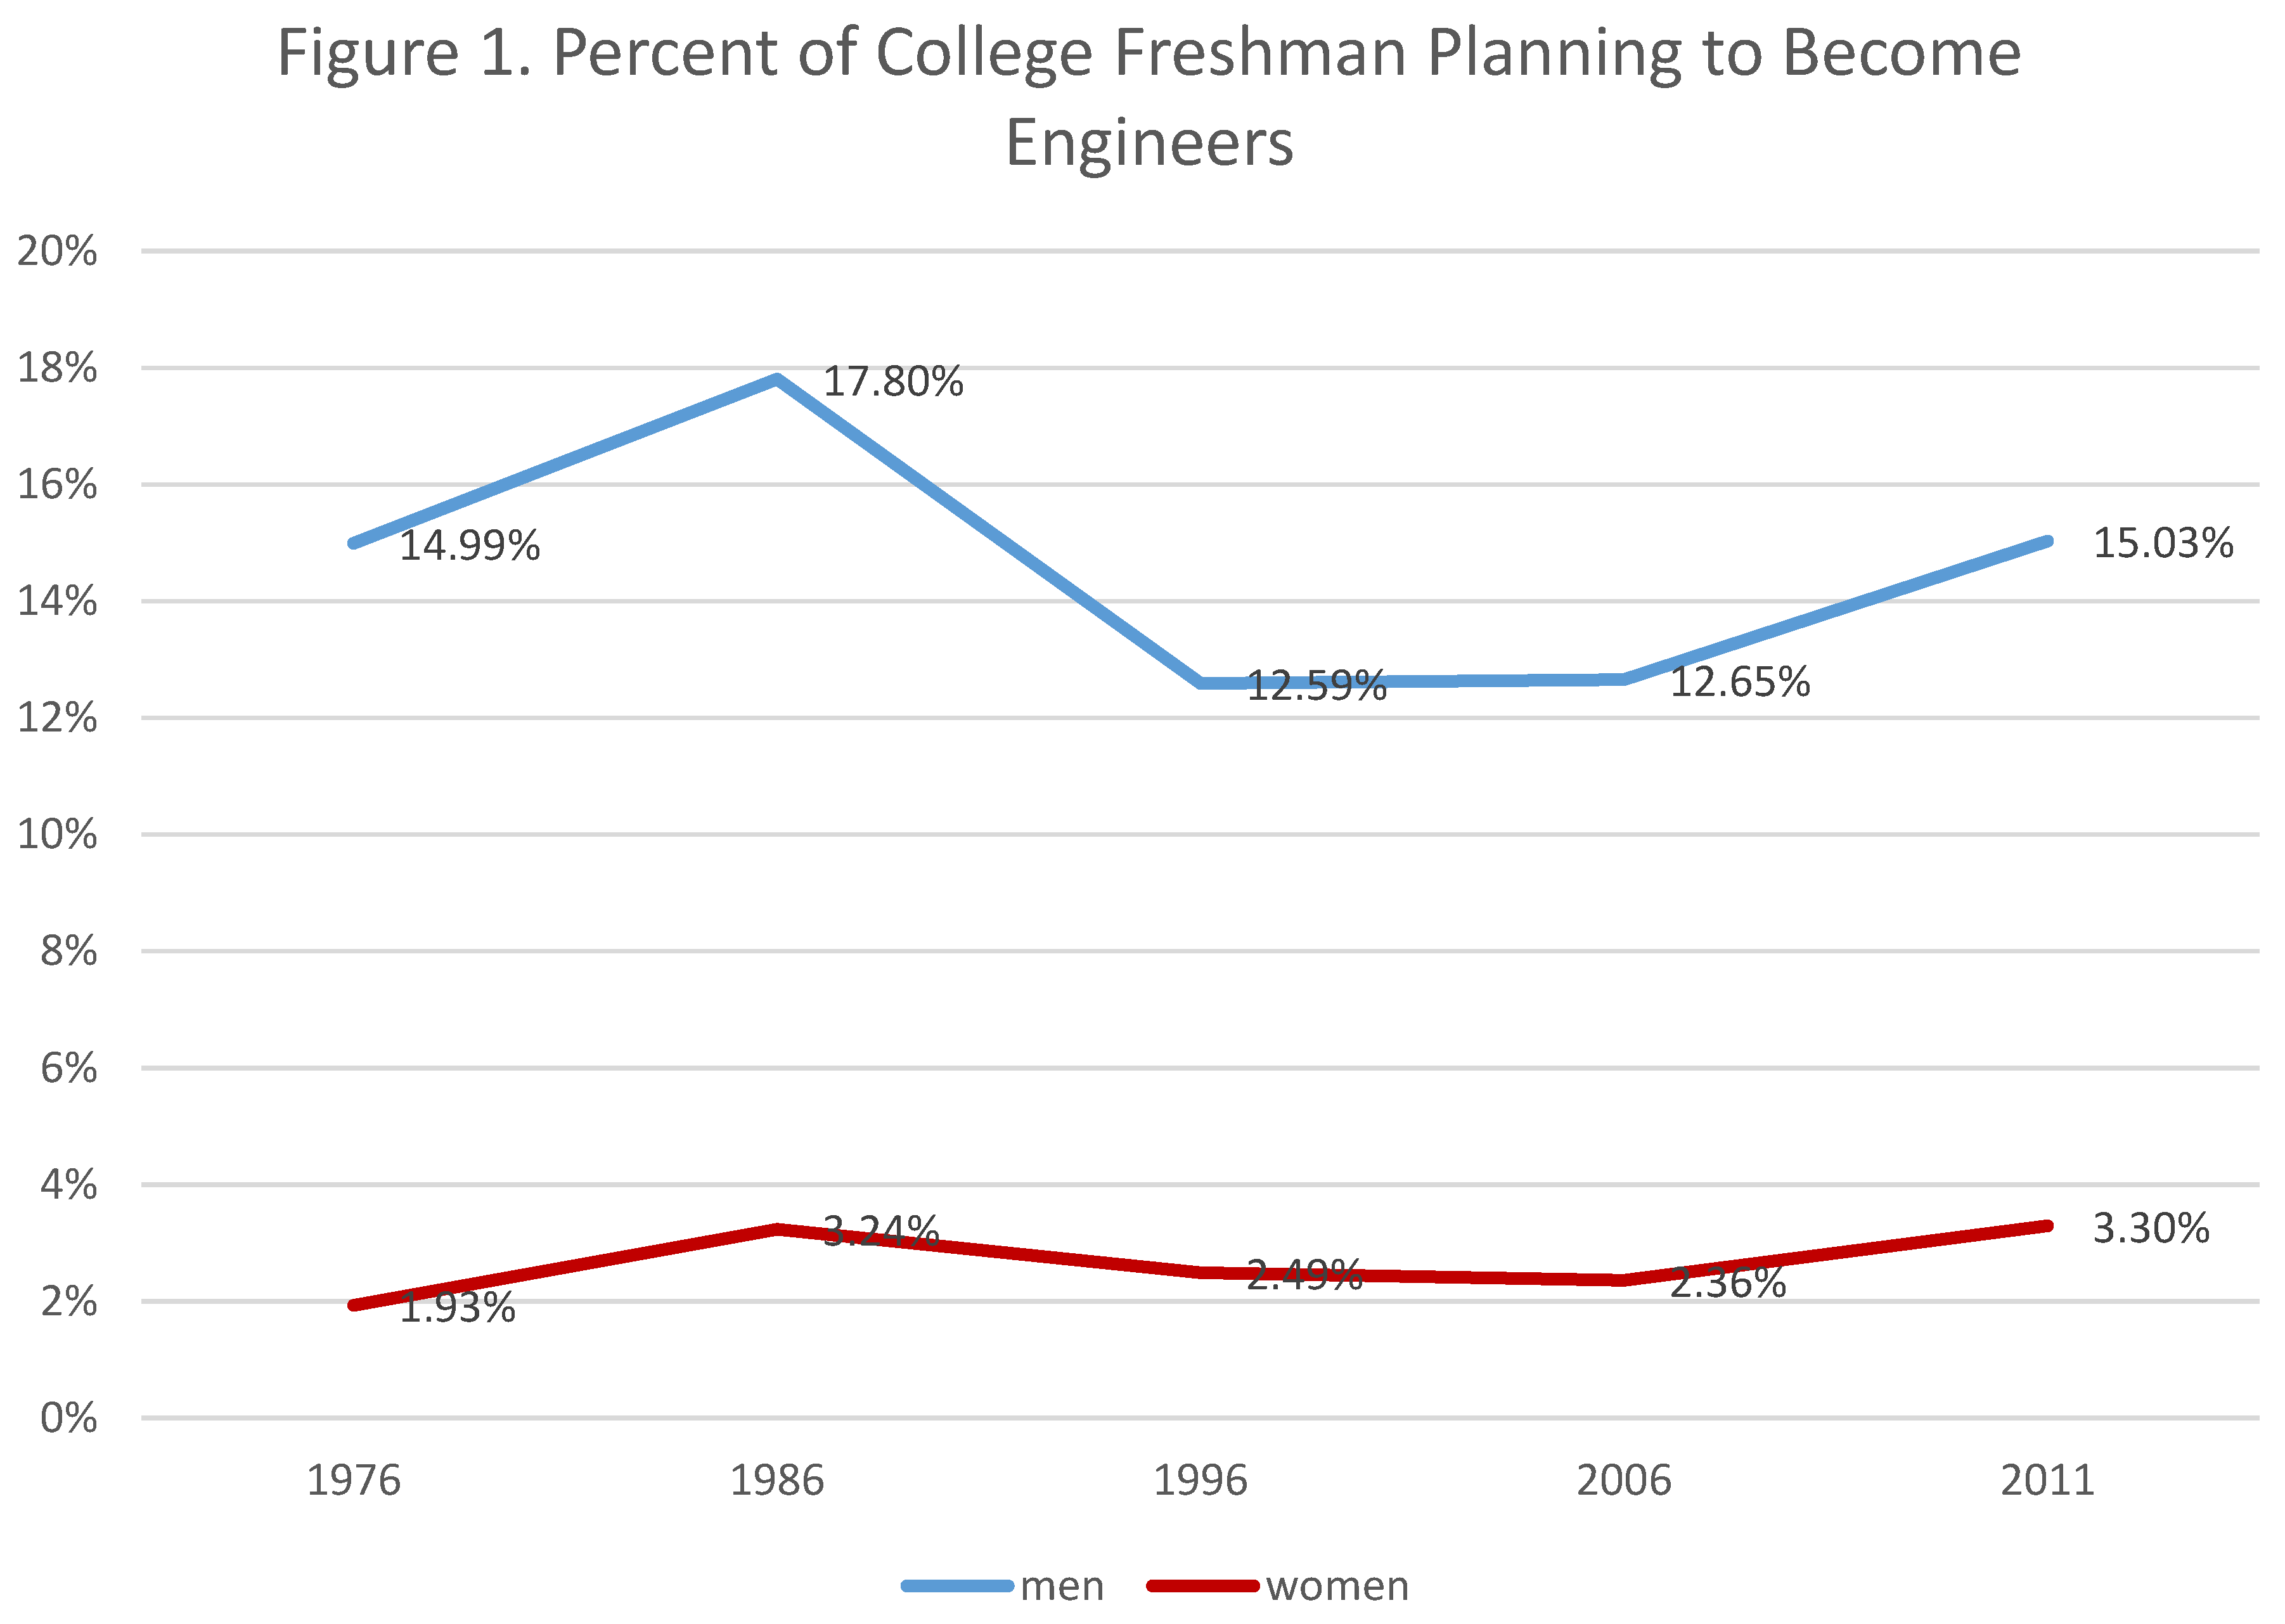
Figure 1 displays trends in the percent of freshmen indicating that they plan to major in engineering. For most of the last forty years, these figures have hovered between 12% and 18% for men and 2% and 4% for women. The fraction of women indicating an interest in engineering has increased since the 1970s, when it was 12%–13% as high as men’s;
7 it has ranged from 18% and 22% of men’s level of interest since then.
8 Are sons of engineers more likely to follow their fathers into engineering, and daughters more likely to follow their mothers? Pertinent data are presented in
Table 1. Summarizing over the entire period 1976–2011, the findings indicate that a significant minority of sons of engineers (27.4%) plan to follow their fathers into this career field, compared with 13.3% of their male classmates.
A brief discussion of probabilities, odds and odds ratios may be helpful in understanding these patterns. The probability of a young man aspiring to engineering if his father is an engineer is 27.4. The odds of his aspiring to engineering if his father is an engineer is 27.4/72.6 = 0.377 (p/1 − p). For young men whose fathers are NOT engineers, the corresponding odds are 13.3/86.7 = 0.153. The odds ratio for young men with and without engineering fathers is therefore 0.377/0.153 = 2.46, meaning that those with an engineering father are 146% more likely to aspire to an engineering career than those without an engineering father.
While daughters are much less likely to plan to become engineers than are sons, there is nonetheless an increased likelihood associated with parental employment in this field. Daughters whose fathers or mothers are engineers are more likely to enter engineering (6.3% and 11.9%, respectively), than are those whose parents are engaged in other occupations and professions (2.3%–2.6%).
For all four parent-child relationships, there is a considerable effect of parents’ careers on their children’s choices. Expressed in terms of an odds-ratio, the odds of entering engineering more than double (2.45) if the father is an engineer.
A strong father-daughter connection appears when this association is depicted in terms of an odds ratio (2.85). This does not mean that daughters of engineering fathers are more likely to become engineers than male counterparts. Rather, it indicates that the relative effect of fathers (starting at a very low baseline) is as large if not larger for daughters than for sons. The mother-daughter connection appears to be the strongest of all of the parent-child dyads (odds ratio = 5.06), but further analysis is needed to refine this conclusion. The gender-specific associations conform to our expectations in some respects but not in others. The main surprise is the disproportionately large effect of mothers on both their sons and daughters. As we will see shortly, this effect is not quite what it seems, as it is in part a “both-parents” effect.
The unstated pattern in the first panel of
Table 1 is the fact that many mothers who are engineers have spouses (or at least co-parents) who are also engineers. While of course not all parents are married or remained married by the time their children enter college, understanding the impact of parental occupational homogamy is necessary for fully addressing the issue of gender-specific role-modeling. Overall, 8.5% of all freshmen have only a father who is an engineer, 0.5% only have a mother who is an engineer and 0.24% report that both parents are engineers. There is an interesting asymmetry in mothers’ and fathers’ engineering careers. Nearly half of students who report that their mothers are engineers also report that their fathers are engineers (47.2%), while only a small fraction (2.8%) of students with engineering fathers report having a mother who is an engineer.
9 This reflects the fact that women engineers represent such a small minority in this profession. This asymmetry will reappear in interpreting other findings as well. This pattern of occupational homogamy among parents requires us to separate out parents into four categories: the (a) father is an engineer while the mother is not; (b) the mother is an engineer while the father is not; (c) both parents are engineers; and (d) neither parent is an engineer.
The effect of fathers on their sons and daughters declines slightly when the association focuses on families in which only the father is the engineer. (The odds ratio declines from 2.45 to 2.38 for sons.) This slight change is due to the fact that a small number of “both parent” engineering families are included in the results reported in Panel A of
Table 1. When this group is removed, the father-son relationship declines marginally. There is much more sizable decline in the mother-son association when dual-engineering families are removed due to the concentration of engineering mothers in this group. The mother–son odds ratio declines from 2.60 to 1.81 when the analysis focuses on mothers only.
The same pattern holds for daughters. There is still a considerable father-daughter connection in Panel D of
Table 1 (odds ratio is 2.65), but the effect of mothers on daughters is considerably attenuated (odds ratio = 3.08, compared with 5.06 when dual-engineering parents are included).
When both parents are engineers, the parental effect more than doubles for sons and nearly doubles for daughters. A large minority (38.2%) of sons plan to pursue engineering when both of the parents are engineers, while for daughters the rate is about one in six (16.5%). This rate is roughly the same as what would be obtained by adding the impact of both fathers and mothers. This finding speaks to the power of families to affect the career choices of their children.
The results presented in
Table 2 speak to trends over time in parent-child associations. Rather than portraying these connections as reflecting some enduring psycho-social dynamic within families, our analysis opens up the possibility that these relationships vary over time.
In
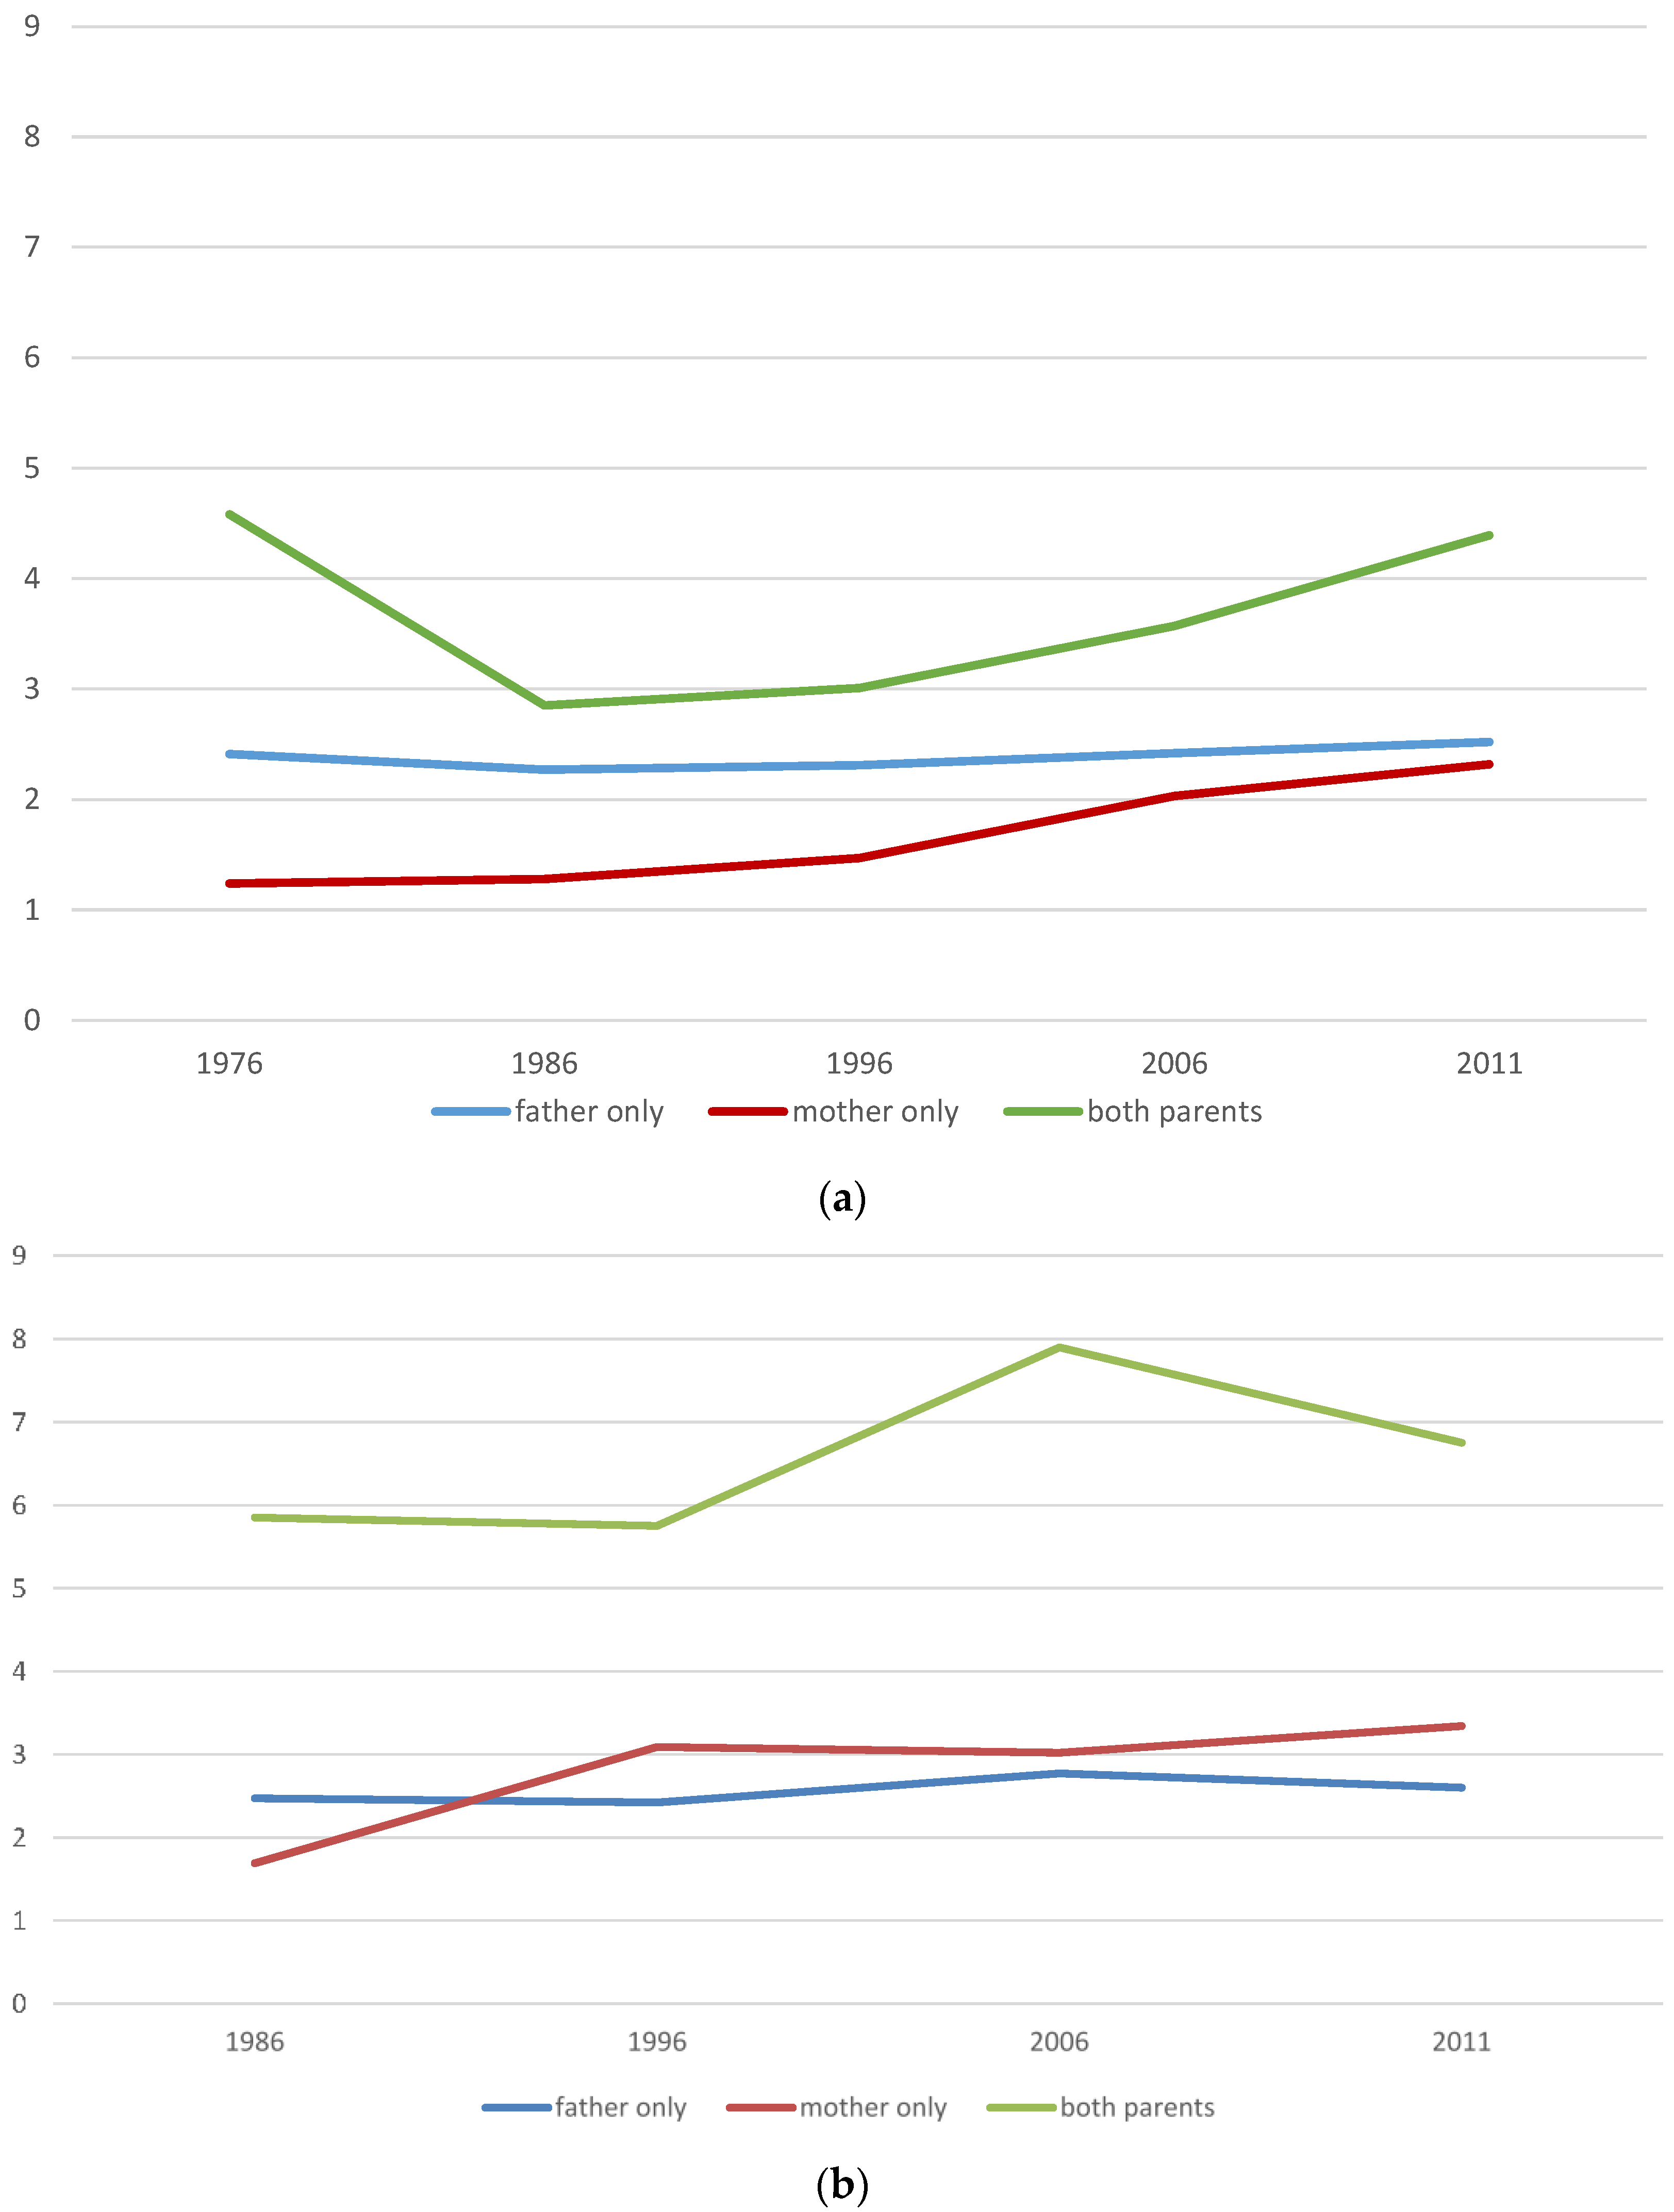
Table 2, we see a steady increase over time in the effect of mothers who are engineers on the career choices of their children. These results are presented graphically in
Figure 2a,b. Focusing on the father-only and mother-only trends, for sons, mothers’ impact is much weaker than that of fathers at the start of the study period. The gap, however, narrows considerably, and since 2006, the connection between mothers’ careers and their sons’ career choices is considerable (odds ratios in excess of 2.0 for 2006 and 2011). For daughters, however, the marked increases in mothers’ effect now reveal a stronger mother-daughter connection than is the case between fathers and daughters. The mother-daughter association jumped in the 1990s and has remained strong (odds ratios above 3.0) ever since.
10The results presented in
Table 2 underscore the importance of examining change over time. Specifically, the relative influence of parents on daughters shifts over time. Fathers had more impact than mothers on their daughter’s career choices in the 1970s and 1980s, and this pattern shifts to a gender-specific role-modeling pattern since the 1990s.
In the multivariate analyses, we estimated the effect of several sets of variables in addition to parents’ occupation on the choice of engineering. In other words, we added groups of variables in order to see how much they reduced the intergenerational associations presented in
Table 1 and
Table 2. Coefficients for parental engineering status from nested (or step-wise) regression results are presented in summary form in
Table 3 and
Table 4. The full models are presented in
Table A3 and
Table A4.
Intergenerational effects remain strongest for same-gender parents, and the overwhelming majority of the parent-child association is a direct effect, independent of the mediating variables included in our model. In other words, other indicators of social background, children’s academic preparation and values, self-efficacy, etc., are responsible for only a small portion of the parent-child association observed. This pattern is particularly clear for fathers and sons, where nearly 90% of the association remains after controls are added to the model. The pattern also holds almost as well for fathers and daughters.
The influence of mediating variables is stronger in understanding the effect of mothers: roughly one quarter of the father-daughter association is mediated by the control variables, as is nearly two-fifths of the mother-daughter association. Academic variables such as self-rated mathematics ability and personality, interest and goals play the largest role in mediating the mother-daughter association. This notable result warrants further inquiry.
The OLS analysis confirms the general story but there is less of a gendered difference in the effects of the mediating variables (See
Table 4). The portion of the intergenerational association mediated by control variables is roughly 20% for fathers and sons, 25% for mothers and sons, 15% for fathers and daughters, and 20% for mothers and daughters. In both sets of specifications, there is a large intergenerational association not accounted for by the factors controlled in this analysis. The full regression models are reported below as
Table A3 and
Table A4.
The results were estimated separately for freshman men and women. We pooled the two groups in order to test for statistical significance. Given the large sample sizes, the gender differences reported are all statistically significant, p < 0.001. Specifically, the father-son association differs from the father-daughter relationship, and the mother-son and mother-daughter effects differ as well.
10. Persistence in Engineering
A skeptic might question whether freshman intentions are a meaningful indicator of the choice of major and career. While many students who report engineering as a career goal will not end up as engineers, the freshman data are more predictive than a questioning reader might assume. Moreover, if there is one field where the link between freshman intentions and career outcomes is likely to be evident, it would be the field of engineering. Many students enter the engineering pipeline early because the extensive and demanding requirements can make switching in relatively difficult. In fact, nearly all students who report planning to become an engineer also report that engineering is their intended field of study (95% of men and 94% of women). Thus, engineering career plans have face validity in terms of their connection to the choice of major.
A variety of data sources also suggest substantial persistence; that is, students who plan to major in engineering are well represented among those who graduate with engineering degrees and begin their careers as engineers. Astin and Astin (cited as [
22] above) report that 43.9% of freshmen who intended to major in engineering in 1985 remained in the field four years later, and a total of 53.4% ended up in a STEM field. While this may seem to indicate a low rate of persistence, it should be noted that relatively few students switch into engineering. In other words, over two-thirds (68.9%) of those who were majoring in engineering in 1989 had planned to do so four years earlier. Expressed in terms of an odds ratio, students were 33 times more likely to become an engineering major if they had indicated this plan as a freshman.
A strong pattern of persistence of freshmen in engineering is also reported with more recent data by Hughes and his colleagues ([
29] above). They also found that having a parent who was an engineer increased the chances of completing this course of study. In other words, having a parent who was an engineer not only increased the chances of entering engineering, but also increased the chances of continuing in the field. Sax [
70] reports that the majority of engineering undergraduates who pursued graduate training (64.9% of women and 63.5% of men) did so in the field of engineering.
While the persistence data discussed here may seem to set a higher bound on the degree of parental impacts, there are a number of additional considerations that should be taken into account. It may be that some children of engineers who did not express an interest in the field reverted to this choice at some later point. As noted above, nearly one-third of engineering graduates switch into the field during college. If children of engineers are disproportionately represented in this group, it would increase the degree of intergenerational connection.
Another consideration has to do with near misses. It is often the case that children are affected by their parent’s occupation even when it is not a case of complete correspondence. For example, if the mother is an electrical engineer and her daughter planned to be a computer scientist, many would consider this a case of the daughter following in her mother’s footsteps, but in our analysis, this would be considered a defection [
71]; see also [
22]. If we add physical sciences and mathematics as additional educational choices and science-related careers, the extent of parental sway would be substantially higher than if the analysis is restricted to perfect matches.
11. Conclusions
This study contributes to our understanding of how the scientific and technical labor force is created. Specifically, there is a significant inter-generational association in the pursuit of careers in engineering. Both fathers and mothers significantly affect the career choices of their sons and daughters. These effects are large direct effects, that is, they are principally effects that are in addition to the effects of parents’ socio-economic status and the influence that they may have on their children’s values. In other words, the parental coefficients remain large even in full model with extensive controls.
Since young women and young men are roughly equally likely to have parents who are engineers, the gender differential in this case is not a matter of daughters’ deficit. In other words, the gaps documented here are more about differences in parental effects between young men and young women rather than differences in levels of family resources or family exposure to engineering role models.
The data point to gender-specific role model effects. Sons are more likely to follow in their father’s footsteps than in their mother’s. The gender gap in parents’ effects has narrowed as the salience of mothers on the career choices of their children has grown over time. The gender-specific role-modeling pattern for daughters is a story of change over time. In the 1970s and 1980s, daughters were more likely to follow their fathers than their mothers. However, since the 1990s, the mother-daughter connection has become stronger than the father-daughter connection. This pattern is most evident when the power of mothers is isolated by distinguishing mother-only engineering families from those in which both parents were engineers. Identifying the small numbers of families in which both parents are engineers reveals the powerful role modeling that occurs under such conditions.
Our results extend the findings of Sikora and Propokek [
21] by showing that gender-specific parental role modeling operates at the point of college entry. The findings extend Marks’s [
62] analysis by examining occupation-specific role modeling effects. In other words, while the general socio-economic standing of mothers and fathers does not consistently appear to be channeled via gender-specific role modeling, the choice of specific occupations does operate in this manner. The results presented here run somewhat counter to those of Hellerstein and Morrill [
64], in that it is the growing importance of mothers rather than fathers that stands out.
The daughters of engineers are much less likely than are sons to pursue careers in engineering. This gendered baseline is clear from the data, even though the presence of parents in the field leads daughters to pursue engineering far more than the classmates in non-engineering families. One potential source of additional women in engineering (and, by extension, other STEM fields) would be to increase their representation to the same level as their brothers and other male counterparts.
The results point to a growing effect of mothers on the career choices of their children, especially their daughters. We interpret this as pointing to a growing salience. The presence of mothers in the labor force is now more established, and mothers are working for a greater share of their children’s early years. The evidence from engineering, which remains a majority-male field, brings the influence of mothers’ careers into sharp relief.
The findings on the increasing impact of mothers on daughters is a promising development, but (a) engineering mothers remain relatively scarce, and thus the payoff of this relationship will take a long time to have a significant impact; and (b) the growing significance of mothers is relative to the low baseline of daughters’ interest in engineering. In other words, while the impact of mothers is now considerable, the level of their daughters’ interest in engineering continues to lag well behind their male counterparts.
Do the findings on the salience of parents’ careers point to any policy recommendations for non-engineering families? Compared to students whose parents are engineers, other students have less direct exposure to the profession, less familiarity with the values and lifestyle that this type of career involves, and possibly less occupation-specific knowledge. Consequently, more effort to cultivate interest in engineering in these families is likely to be required.
The notion of gender-specific role models may perhaps be extended from the realm of family members to non-family members. Projects engaged in promoting women’s representation in engineering [
72] have tried to develop social supports in just this way. In other words, if students have not had direct exposure to engineering and related STEM fields in their own family experience, educators can seek to substitute other social experiences that would provide a substitute for this type of direct familiarity and exposure. The data reported here are consistent with the thrust of this type of non-familial social supports are in order for the great majority of college students who did not happen to have parents who spent their careers in the engineering profession.


