
Gendered Perceptions of Cultural and Skill Alignment in Technology Companies

Department of Sociology, Stanford University, 450 Serra Mall, Stanford, CA 94305, USA
*
Author to whom correspondence should be addressed.
Soc. Sci. 2017, 6(2), 45; https://doi.org/10.3390/socsci6020045
Submission received: 31 August 2016
/
Revised: 11 April 2017
/
Accepted: 25 April 2017
/
Published: 3 May 2017
(This article belongs to the Special Issue Gender and STEM: Understanding Segregation in Science, Technology, Engineering and Mathematics)
Abstract
:Previous research documents how stereotypes discourage young women from choosing and attaining technology jobs. We build off this research and ask whether (and how) stereotypes continue to affect men and women once they enter the technology workforce. Using a novel survey of technical employees from seven Silicon Valley firms and new measures of what we call “cultural” and “skill” alignment, we show that men are more likely than women to believe they possess the stereotypical traits and skills of a successful tech employee. We find that cultural alignment is especially important: because women are less likely than men to believe they match the cultural image of successful tech workers, they are less likely to identify with the tech profession, less likely to report positive supervisor treatment, and more likely to consider switching career fields. This paper is the first to use unique and independent measures of cultural and skill alignment comparing employees’ perceptions of themselves to their perceptions of an ideal successful worker. By allowing cultural and skill alignment to operate separately, we are able to determine which work outcomes are most strongly related to each form of alignment. Our results imply that if we can broaden the cultural image of a successful tech worker, women may be more likely to feel like they belong in technology environments, ultimately increasing their retention in tech jobs.
1. Introduction
“When most people think of the average tech entrepreneur, the pale guy who codes while playing World of Warcraft in his gadget-filled basement pops up.”(Wei 2012)
This quote comes from a Washington Post article written by a woman venture capitalist in Silicon Valley describing the masculinized culture of technology. According to the article, women do not relate to this image of a tech worker as readily as men do, and thus women may be less likely to believe they belong in tech jobs. This weak sense of alignment could cause a variety of negative work outcomes for women.
Existing literature and policy to increase the number of women in tech jobs are primarily concerned that young women lack the skills, or at least the confidence in their skills, to enter and succeed in tech jobs. However, as we show below, these skill-based perceptions often matter less than cultural perceptions. Cultural images (like the guy in his gadget-filled basement) can make women feel like they do not match the stereotypical portrait of a successful tech worker. In this paper, we examine the way stereotypic images of tech workers influence the career progression of men and women technical workers.
According to a recent report written by the US Department of Commerce (Beede et al. 2011), women currently make up about half of the US workforce; yet, they hold only 24% of jobs in science, technology, engineering, and math (STEM) fields. The report further notes that even as women’s share of the college-educated workforce has increased over the past decade, women’s underrepresentation in STEM fields has remained relatively constant. Furthermore, while 40% of men with STEM college degrees work in STEM jobs, only 26% of women with STEM degrees do. Women also leave STEM jobs at higher rates than women leave other professional jobs, particularly early in their careers (Glass et al. 2013). These gender disparities have important implications for lifetime earnings; women in STEM jobs earn 20% more than comparable women in non-STEM jobs (Beede et al. 2011).
Gendered stereotypes about math and science can impede the entry and retention of women in STEM fields. Stereotypes are widely shared cultural beliefs about categories of people. In the case of STEM domains, stereotypes include beliefs that men have more ability than women do (Davies et al. 2002; Nosek et al. 2002; Spencer et al. 1999). As we describe below, research has established that negative stereotypes about young women’s math ability can affect their mathematical performance, self-assessments of their competence, interest, confidence, and sense of belonging in STEM activities (Steele 1997; Correll 2001; Murphy et al. 2007; Cech et al. 2011; Cheryan et al. 2009). Ultimately, stereotypes can shape the choices and aspirations of men and women considering STEM fields (Cech et al. 2011). In addition, stereotypes also cause women to be judged by a harsher standard than men and to have their achievements devalued or ignored in STEM fields (Foschi 2000; Moss-Racusin et al. 2012).
To combat the effects of stereotyping, policy makers have suggested many different interventions to enhance the pipeline of women entering STEM fields: reshaping high school and college programs, enhancing mentorship of young women, fostering interest at a young age, increasing visibility of female role models, and actively recruiting women (Hill et al. 2010; Huhman 2012; Margolis and Fisher 2002). These interventions aim to increase girls’ entrance and participation in math and science. However, few policies actively engage women once they have entered STEM careers (The NSF ADVANCE program is a notable exception; see www.nsf.gov/advance).
Underlying current pipeline policies is the assumption that if we can help young women in their more formative years continue on the path toward careers in STEM fields, the negative effects of stereotypes will disappear or be less relevant once these women enter the workforce. On the one hand, this assumption makes sense and is largely consistent with current understandings of why stereotypes have the effects that they do. Empirical studies have supported theoretical predictions that stereotypes impact judgments most heavily when there is some uncertainty about how to assess ability (Correll 2004; Reskin and McBrier 2000; Uhlmann and Cohen 2005). If women persist long enough in STEM careers, they may garner considerable evidence of their skill and ability; this successful history may reduce uncertainty about whether they possess the skill necessary to achieve continued success in a STEM field. It seems logical to predict, then, that with this reduced uncertainty, negative stereotypes may cease to influence their self-assessments and choices over time.
On the other hand, perhaps stereotypes continue to influence people’s decisions and perceptions once they are in the workplace. In any workplace, new tasks and roles emerge all the time, and employees must continuously adapt to new situations. These changing elements can create uncertainty, and negative stereotypes may resurface, reigniting women’s doubts about their ability and sense of belonging. This would lead to the alternative prediction that the same stereotypes that decrease middle school, high school, or undergraduate women’s interest in STEM fields may continue to affect women once they are on the job.
Using a unique dataset of men and women technical employees in Silicon Valley firms, we ask whether stereotypes continue to affect the judgments, decisions, and perceived treatment of women and men once they have made it through the educational pipeline and are working in a STEM job. To our knowledge, this is the only survey of its kind conducted with actual tech workers. While previous literature has documented the attrition of women out of science and engineering, and scholars are quite concerned about the dearth of women in these fields, this is one of the first papers to examine the effect of stereotypes on women who are working in tech jobs. Furthermore, while some emerging qualitative research examines women in Silicon Valley tech firms (e.g., Alfrey and Twine 2016), this is the first survey analysis of both men and women currently working in such firms. In particular, we examine whether women are less likely than their male counterparts to perceive that they align with stereotypes about successful tech workers.
We create novel measures that we call “cultural alignment” and “skill alignment.”1 We define cultural alignment as the extent to which a tech employee believes she or he matches the attributes of a stereotypical successful tech worker. Widely shared images of successful tech workers—such as the coding-obsessed geek—can create a sense of belonging in those who believe they match the image, and a sense of alienation in those who do not. We define skill alignment as the extent to which a tech employee believes he or she possesses the skills of a typical successful tech worker. Tech companies expect their employees to demonstrate a range of quantitative and analytical skills, and employees may or may not believe they match the desired skill profile. In addition, we explore how these feelings of alignment (or lack of alignment) are related to career outcomes. If women are less likely than men to believe they match the cultural image or skill profile of a successful tech employee, how does this belief influence their intentions to stay in technology and their perceptions of how they are treated by their supervisors? How do perceptions of alignment, fueled by stereotypes, influence work outcomes for men and women who are already in tech careers?
This paper offers a number of important theoretical contributions. First, this paper clarifies the distinction between cultural and skill-based forms of alignment with the prevailing standard in one’s work context. While other authors have explored similar dimensions (e.g., Cech et al. 2011), this is the first paper to operationalize the distinction between culture and skill by comparing individuals’ beliefs about themselves to their beliefs about successful workers in their field. By allowing these dimensions to operate separately and exploring the variance each explains in important gendered outcomes, we offer novel insight into the mechanisms that perpetuate gender inequality even once women have entered STEM fields. The masculine culture of technology has been cited as a key deterrent for women, but it is currently difficult to disentangle the effects of skill-based alignment from the culture of these settings. Second, this paper offers insight into the kinds of outcomes related to cultural and skill alignment. While skill alignment may be more important for certain outcomes, cultural alignment may be more significant for others. For example, is cultural alignment more strongly associated with women’s identification with the tech field and their companies, as compared to skill alignment? What about supervisor treatment? It is possible women perceive a lack of sufficient skill, thereby identifying less with their professions and anticipating worse treatment by their supervisors, but it is also possible that cultural alignment is more strongly associated with these outcomes. We currently lack research adjudicating between these competing arguments. This distinction has important practical implications since it can help guide policy interventions toward the right problems, thereby increasing the number of women in tech fields.
Before turning to the data that allow us to answer these questions, we first briefly review what is known about how stereotypes contribute to men and women’s uneven movement into STEM fields.
2. How Stereotypes Affect Perceptions in Tech Fields
Decades worth of research by sociologists and psychologists show that widely held beliefs about groups of people, as encoded in stereotypes, function as cognitive shortcuts in decision-making (Correll et al. 2017; Podolny 2005; Tiedens and Linton 2001; Weary et al. 2001). That is, under conditions of uncertainty about how to make judgments, stereotypes influence evaluations of self and other. Below, we review how gender stereotypes affect self-perceptions of skill, self-perceptions of fit or belonging, and perceptions of treatment by others, and we draw out the implications of this research for understanding the way stereotypes might impact women who are in technical jobs.
2.1. Self-Perceptions of Skill
Stereotypes can powerfully affect how women see themselves progressing in math-intensive subjects and technical careers. Particularly among people who highly identify with a domain (for example, high-achieving women in tech fields), stereotype threat can significantly undermine performance (Beilock and Carr 2005; Steele 1997; Shih et al. 1999). Low performance can subsequently reduce identification with the relevant domain (Steele 1997).
In addition to impairing performance, stereotypes can influence self-assessments of ability and aspirations for future opportunities. In the case of mathematics, even when male and female high school students receive equal objective scores on tests of mathematical ability, young men tend to rate themselves higher in mathematical ability than young women do (Correll 2001). Similarly, Cech and colleagues found that male college students rate their engineering ability higher than women do, even though men and women have similar college grade-point averages and SAT scores (Cech et al. 2011). These higher ratings by men do not occur in domains that are not stereotyped as masculine (Correll 2001; Correll 2004). As Correll (2004) demonstrates, when negative stereotypes are salient, women judge their own performance by a harsher standard than men do, requiring more evidence of their skill before believing they have sufficient ability to succeed in a male-typed field (see also Cheryan et al. 2011). Furthermore, these self-assessments can shape future career aspirations and decisions (Correll 2001; Correll 2004). In this way, the gender gap in mathematical self-assessments contributes to the underrepresentation of women in STEM college majors.
If we apply this literature to the case of women who are already in technical jobs, we might expect that they, like younger women, would continue to judge their own performance by a harsher standard and, if so, they would be less likely to see themselves as possessing the skills of a typical successful tech worker. In other words, their skill alignment would be lower than that of their male counterparts. Since gender self-assessments have been shown to affect career decisions (Correll 2001; Correll 2004), we predict that lower skill alignment will be negatively associated with important career outcomes. However, the alternative prediction is that since women technical workers have already earned technical degrees and entered technical jobs, they have garnered considerable evidence of their technical skills, thereby reducing their uncertainty about their own abilities. If so, we might expect that the gender gap in skill alignment would be small or even non-existent.
2.2. Self-Perceptions of Belonging
In addition to affecting performance and self-assessments of ability, stereotypes can also decrease women’s interest in pursuing STEM majors and careers by making women feel like they do not fit or belong in these fields. In an experiment by Davies and colleagues, viewing gender-stereotypic television commercials led women to avoid math questions in favor of verbal questions and indicate less interest in quantitative educational and vocational domains (Davies et al. 2002). Similarly, Murphy and colleagues conducted an experiment where undergraduates who were “highly math-identified” and who were majoring in a STEM field watched a video promoting an upcoming conference (Murphy et al. 2007). Women who watched a video with an unbalanced ratio of men to women displayed more signs of anxiety and fear of negative treatment, and reported less desire to participate in the conference, compared with women who watched a gender-balanced video. Whether the video was balanced or unbalanced had almost no effect on men. Importantly, this study demonstrates how features of a setting can make masculine stereotypes salient, thereby creating a threatening environment where women are less likely to feel like they belong. Subtle situational cues can trigger both objective (cognitive and physiological vigilance) and subjective (decreased sense of belonging and fit) experiences of threat. Threatening features of a setting can cause even highly confident, domain-identified women to lose interest in STEM activities and fields.
Cheryan and colleagues similarly show how physical environmental cues and interactions can influence women’s sense of belonging and subsequent interest in computer science (Cheryan et al. 2009; Cheryan et al. 2011). In one experiment, changing the objects in a computer science classroom from masculine objects (such as geeky posters) to more neutral objects (such as nature scenes) significantly raised women’s interest and sense of belonging (Cheryan et al. 2009). Stereotypical images can reinforce women’s feeling of alienation in masculine fields and decrease their interest in pursuing future opportunities.
To the extent that stereotypes make women feel like they do not fit or belong in STEM majors or careers, we would expect that women will be less likely than their male counterparts to believe they match the cultural image of a successful tech worker. Furthermore, since technical workplaces are even more heavily male-dominated than STEM college majors (Beede et al. 2011) and often embody a masculine or “frat like” culture (Wynn and Correll 2014), we predict that women will have a lower level of cultural alignment than their male counterparts, even once on the job. Given the literature reviewed above, we predict that lower cultural alignment will lead women to feel like they do not belong in tech careers, thereby increasing the odds that they will leave these careers.
2.3. Perceptions of Others’ Treatment
In addition to shaping women’s self-perceptions and choices, stereotypes also affect the way women perceive others’ judgments and behaviors. Women in STEM fields are often judged by a harsher standard than men by gatekeepers such as employers and teachers (Foschi 1996; Foschi 2000; Heilman 2001; Moss-Racusin et al. 2012). Heilman (2001) argues that stereotypical gendered expectations negate the recognition of women’s accomplishments, either through the devaluing of their work or through attributing responsibility for their success to something other than their skill and ability. For example, a recent study found that science faculty rated a student applicant for a science lab manager position more highly when the application had a man’s name than when the very same application had a woman’s name (Moss-Racusin et al. 2012). Faculty considered the man more hirable and competent, and they offered him a higher starting salary and more career mentoring, than the identical woman applicant. Research on the effects of stereotypes in other male-typed domains finds similar effects to those found in the STEM fields (Steinpreis et al. 1999).
As these studies show, in domains that are either numerically or culturally associated with men, gatekeepers judge women’s performance by a harsher standard. Therefore, we predict that, in addition to judging their own performances by a harsher standard, women tech workers will expect to face harsher judgments from their employers than men do. Perceptions of harsh treatment can have a profound effect on women’s careers. Previous research has demonstrated that perceptions of career opportunity and discrimination affect self-esteem and confidence, health and wellbeing, job performance, job commitment, and aspirations for future career prospects (Ensher et al. 2001; Kaiser et al. 2004; Kanter 1977; Markham et al. 1985). When people feel they are being treated poorly or that they do not belong in a particular setting, they may disengage, becoming less involved in and committed to their work (Ensher et al. 2001; Gutek and Tsui 1996; Hausmann et al. 2009; Stainback and Irvin 2012). Ultimately, these choices and aspirations can affect employee performance and organizational rewards. If women are more likely than men to expect discrimination in technical careers, these expectations can cause unequal career setbacks and stymied advancement (compounding the effects of the discrimination itself).
2.4. The Current Research
While existing research demonstrates how stereotypes affect women’s persistence in STEM fields at early life stages (e.g., high school and college), we continue to lack evidence about whether stereotypes continue to affect women once in a technical job. With what we believe is the only existing survey data from actual tech workers, we build on prior work by broadening our understanding of whether and how gender stereotypes matter in an important but understudied stage in the career life course of technical workers. We further explore how stereotypes about the culture of technology and the skills of technologists operate differently, and we analyze their independent effects on important gendered outcomes. We now turn to describing our data and our models for assessing the relationships between alignment and work outcomes for men and women in technical careers.
3. Data
Our data come from a dataset of men and women technical employees called “Climbing the Technical Ladder.” In 2007, the Anita Borg Institute for Women and Technology and the Clayman Institute for Gender Research at Stanford University conducted a survey of technical men and women in the Silicon Valley (Simard et al. 2007). The San Francisco Bay Area’s “Silicon Valley” is a region characterized by a high concentration of high-technology companies, providing a unique window into the technology world. Silicon Valley firms pride themselves on being meritocratic; organizational hierarchies are flat, and innovative start-up mentalities pervade. However, gender researchers suggest that widely shared gender beliefs are often carried into these new spaces (Ridgeway 2011), and technology companies often have a masculine or “fraternity-like” culture (Alfrey and Twine 2016; Wynn and Correll 2014). Using a sample of technical employees from seven Silicon Valley firms, we examine whether women perceive themselves as less aligned with the image of success than men; if so, we explore how this gender gap relates to employees’ career decisions and opportunities.
Much in the same way that Cech and colleagues studied the experiences of men and women STEM students in four US universities to delve deep into a heretofore unstudied process (Cech et al. 2011), we draw on data from seven tech companies to examine cultural and skill alignment. This research setting is rare and particularly useful for empirically analyzing the impact of stereotypes on women currently working in STEM careers. The seven tech companies in our dataset include organizations within the broad computer and information technology industry as well as companies that employ top technical talent.2 The primary industry segments represented are hardware and software. Surveyed employees comprised the core Silicon Valley technical workforce at each participating company. Thus, our sample contains data from employees actively working in technical jobs. The survey included questions about demographics, attitudes towards and perceptions of technical work, retention and advancement, and family. The survey was administered online to all employees in each company’s core Silicon Valley technical workforce over a seven-month period in 2007–2008. The survey was administered to 12,805 employees across the seven participating companies. In total, 1795 employees completed the survey; thus, the overall response rate is 14%. Because the response rate is low, we should interpret the results with caution.3 While a higher response rate is always desirable, having a sample of actual tech workers is unusual. With these data, we can provide novel insight into processes that affect women and men’s experiences in tech fields.
The sample is similar to the broader Silicon Valley population in race and ethnicity, median income, and percent foreign-born (as well as country of origin). Women comprise 34.2% of the sample and 24% of the Silicon Valley engineering and computer population; thus, there is a slight overrepresentation of women.4 The analyses presented below were conducted on cases for which there are no missing values on any variables included in the models (88% of the sample).5 The final sample includes 1582 respondents: 1048 men and 534 women.
4. Analytical Plan and Measures
We first assess the cultural and skill-based stereotypes tech workers hold about successful technical work. We then assess the extent to which male and female tech workers align with these stereotypes and, if so, whether these differences in alignment contribute to gender gaps in work outcomes. After establishing the distinction between cultural alignment and skill alignment, we ask whether cultural or skill alignment has a larger impact.
4.1. Dependent Variables
Men and women’s perceptions of how well they conform to cultural and skill expectations at work are related to a number of work outcomes. We include dependent variables capturing a range of work factors, described below, to determine the nature of resulting gender inequality. Answer choices on all dependent variable survey questions range from 1 (not at all descriptive/strongly disagree/definitely not) to 5 (extremely descriptive/strongly agree/definitely will).6
4.1.1. Identity Measures
The extent to which individuals identify with a field can influence their career-relevant judgments and decisions, thereby affecting what is commonly called the “pipeline” of women in STEM careers (Meyersson Milgrom and Petersen 2006). Our survey questions ask participants to rate the extent to which they personally identify with the tech profession and identify with their companies.
4.1.2. Supervisor Treatment Measures
Perceptions of the judgments and behaviors of gatekeepers such as teachers, supervisors, and employers can also affect men and women’s career progress. Barriers or “glass ceilings” often prevent one group from achieving the same level of success as another group (Hymowitz and Schellhardt 1986). Our survey questions ask respondents about their supervisor’s treatment: does their supervisor value their opinions, and does their supervisor assign them high-visibility projects? Being assigned to high visibility projects is crucial for promotion in tech companies (Correll and Mackenzie 2016; Silva et al. 2012).
It is important to note that our supervisor treatment variables represent respondents’ perceptions about their supervisors’ treatment. Though our data cannot reveal whether supervisors actually treat respondents as they reported, perceptions of supervisor treatment can have a profound effect on life outcomes, as described above. Therefore, if cultural or skill alignment contributes to the gender gap in perceptions of supervisor treatment, this finding would have important implications for workplace gender inequality more broadly.
4.1.3. Turnover Intention Measure
To measure turnover intentions, the survey asks participants the extent to which they plan to switch career fields in the next 12 months.
4.2. Independent Variables
Tech employees in the sample were first asked to identify the attributes of people who succeed in technology. These questions allow us to assess what stereotypes they hold about successful tech workers. Later in the survey, respondents were asked to identify the attributes that describe themselves. To the extent that their stereotypes of successful tech work overlap with their descriptions of themselves, we define the employees as perceiving that they “align” with the prevailing stereotype of success.
4.2.1. Stereotypes about Successful Tech Work
Respondents were given a set of attributes (listed below) and asked, “In your opinion, to what extent are the following attributes TRUE of people who succeed in technology?” (Answer choices are on a 5-point scale ranging from “not at all true” to “extremely true”). Guided by a principle-component factor analysis, we determined that participants’ beliefs about successful tech workers coalesced around two types of traits: cultural and skill-based. These categories emerged inductively from the data; in other words, the cultural traits and skills loaded onto separate factors during our analysis.7 Thus, we created two variables: a scale of cultural traits of successful tech workers and a scale of the skill set of successful tech workers.
The cultural traits scale is the average response from questions about the extent to which each of the following traits described the successful tech worker: obsessive, assertive, cool, geeky, young, and long working hours (α = 0.66).8 Together, these traits constitute the stereotypical image of the “geeky coder,” a young man who stays up all night obsessively coding. We ran models with several different specifications of the scale (e.g., we dropped one of the items from the scale such as “long hours”). The claims we make below are robust across models. Results are available upon request.
Because this coder image often pairs with concrete human capital skills, we created a separate skill set scale for the skills believed to be associated with successful tech work. After all, the stereotypical geeky coder is also a talented and proficient worker. The skill set scale is the average response from questions about the extent to which each of the following traits described the successful tech worker: analytical, questioning, and highly mathematical (α = 0.60). These skills are often considered essential for success in the tech world. The Pearson’s bivariate correlation between the cultural and skill scales describing successful tech workers is 0.243. Additional correlations between scale items are available in the Appendix.
4.2.2. Self-Perception Scales
After rating successful tech workers on the attributes above, respondents were then given the same list of attributes and asked how much the attributes described themselves. We created a cultural traits self-rating scale (α = 0.56) by averaging how participants rated themselves on the items loading on the cultural factor and a skill set self-rating scale (α = 0.61) by averaging how participants rated themselves on the items loading on the skill set factor.9 The Pearson’s bivariate correlation between the scales describing self is 0.344.
4.2.3. Cultural and Skill Alignment Measures
The variables above measure how individuals rate themselves and how they rate successful tech workers. To measure the extent to which individuals believe they match the cultural image or skill expectation of successful tech workers, however, we need to compare each individual’s self-rating to how the same individual rates successful tech workers. If their image of self is similar to their image of a successful tech worker, we describe them as believing they “align.” If women are less likely than men to believe they match the cultural image and skill expectations of successful tech workers, they may experience negative work outcomes. Below, we describe more fully how we created our alignment variables.
First, we created dummy variables that measure whether self-ratings of cultural traits and skill sets match the cultural and skill dimensions of successful tech workers. If the respondent sees himself or herself as equal to or greater than their own rating of the average successful tech worker, the cultural alignment dummy variable is coded as 1. This indicates that respondents see themselves in line with the cultural and personality traits of successful tech workers. If the respondent sees himself or herself as lower on the culture scale than their own rating of a successful tech worker, then the dummy variable equals 0, indicating a lack of alignment.
Similar to the cultural alignment dummy variable, the skill alignment dummy variable codes those who see themselves having equal or greater skills than the average tech worker as 1, and those who see themselves as less skilled as 0. Thus, these two dummy variables indicate whether respondents perceive themselves as successful on both cultural and skill dimensions. Importantly, these items do not ask individuals to directly compare themselves to a successful tech worker, but rather to assess the attributes of a successful tech worker and then, later in the survey, to assess themselves using the same list of attributes. In this way, our measures of alignment differ from related measures of “fit” or “professional role confidence” used by other researchers (Cech et al. 2011; Rivera 2012).
While these dummy variables provide useful information about cultural and skill alignment, we are also interested in the magnitude of any discrepancy between self-ratings and images of the successful tech worker. If women see themselves as less successful than men, does the extent of this difference matter?
Therefore, we created a second alignment variable that is the absolute value of the difference between a respondent’s self-rating and his/her own rating of successful tech workers. The cultural alignment absolute value variable indicates how wide the gap is between self and successful tech worker on the cultural alignment scales, and the skill alignment absolute value variable indicates the gap on the skill-based scales.
For example, if an individual rates herself as a 2 on the cultural scale and 3 on the skill scale, and she rates a successful tech worker as a 5 on both the cultural and skill scales, she would be coded as a 0 on both the cultural and skill dummy variables because her self-rating is lower than her impression of a successful tech worker. Her value on the absolute value variables would be 3 for culture and 2 for skill, indicating that she considers herself further from the successful tech worker on the cultural dimension compared to the skill dimension.
To simultaneously consider both the direction and the magnitude of any gap, we will add an interaction between the absolute value and dummy variables to our regression models below. This analytical procedure, which we call a “direction-magnitude interaction model,” is rather untraditional, but as we describe below, it allows us to analyze both direction and magnitude of alignment independently.10
4.2.4. Gender and Race Measures
We also include variables tracking respondents’ gender (Female and Male) and race (White, Asian, and Other). Gender is represented with a dummy variable where female is coded 1 and male 0. For Race, we introduce a dummy variable for Asian and Other, with White serving as the reference category. Unfortunately, we only have sufficient sample size to divide our sample into three racial categories. Consistent with the larger tech industry, our sample comprises mainly White (55%) and Asian (38%) respondents. Respondents were able to choose more than one racial category; thus, when coding the race variables, we included only respondents who exclusively chose “White/Caucasian” in the “White” category. We included in the “Asian” category anyone who chose “South Asian (Indian subcontinent/South Asian American),” “Southeast Asian/Southeast Asian American,” “East Asian/East Asian American,” or “Other Asian/Asian American.” Our “Other Race” category includes anyone who chose “African American/Black,” “American Indian/Alaska Native,” “Native Hawaiian,” “Mexican American/Chicano,” “Central/South American,” or “Other Latino/Puerto Rican.”
4.2.5. Employee Level
Finally, we include controls for employees’ level in the company. Levels were categorized according to the career ladders or structures at each respondent’s company (see Simard et al. 2007 for more information). Employees were categorized into three levels: low (entry), mid, and high. Mid-level is used as the reference category. Technology, similar to other professional fields, is characterized by vertical segregation, with women being more underrepresented in higher-level positions (Charles and Grusky 2004). Consistent with this trend, women in our sample are more heavily concentrated in the lower-level positions, while men are more concentrated in higher-level positions. Due to the sample size and the somewhat limited number of demographic variables, we are not able to add additional controls to the models.
5. Results
5.1. Summary Statistics
Before turning to regression models, we first explore the bivariate relationships between gender and our dependent and independent variables (see Table 1). Examining our dependent variables, we find that men are significantly more likely than women to identify with the tech profession and marginally more likely to identify with their companies. Men are also significantly more likely to believe their supervisors value their opinions and assign them high-visibility projects. Men are significantly less likely than women to plan to switch career fields in the next twelve months. There are significantly more White men than women in the sample and significantly more Asian women than men. As is common in technology firms in the Silicon Valley, women are more heavily represented among the lower levels compared to the higher levels (Simard et al. 2007).
5.2. What Are the Stereotypes About Successful Tech Work?
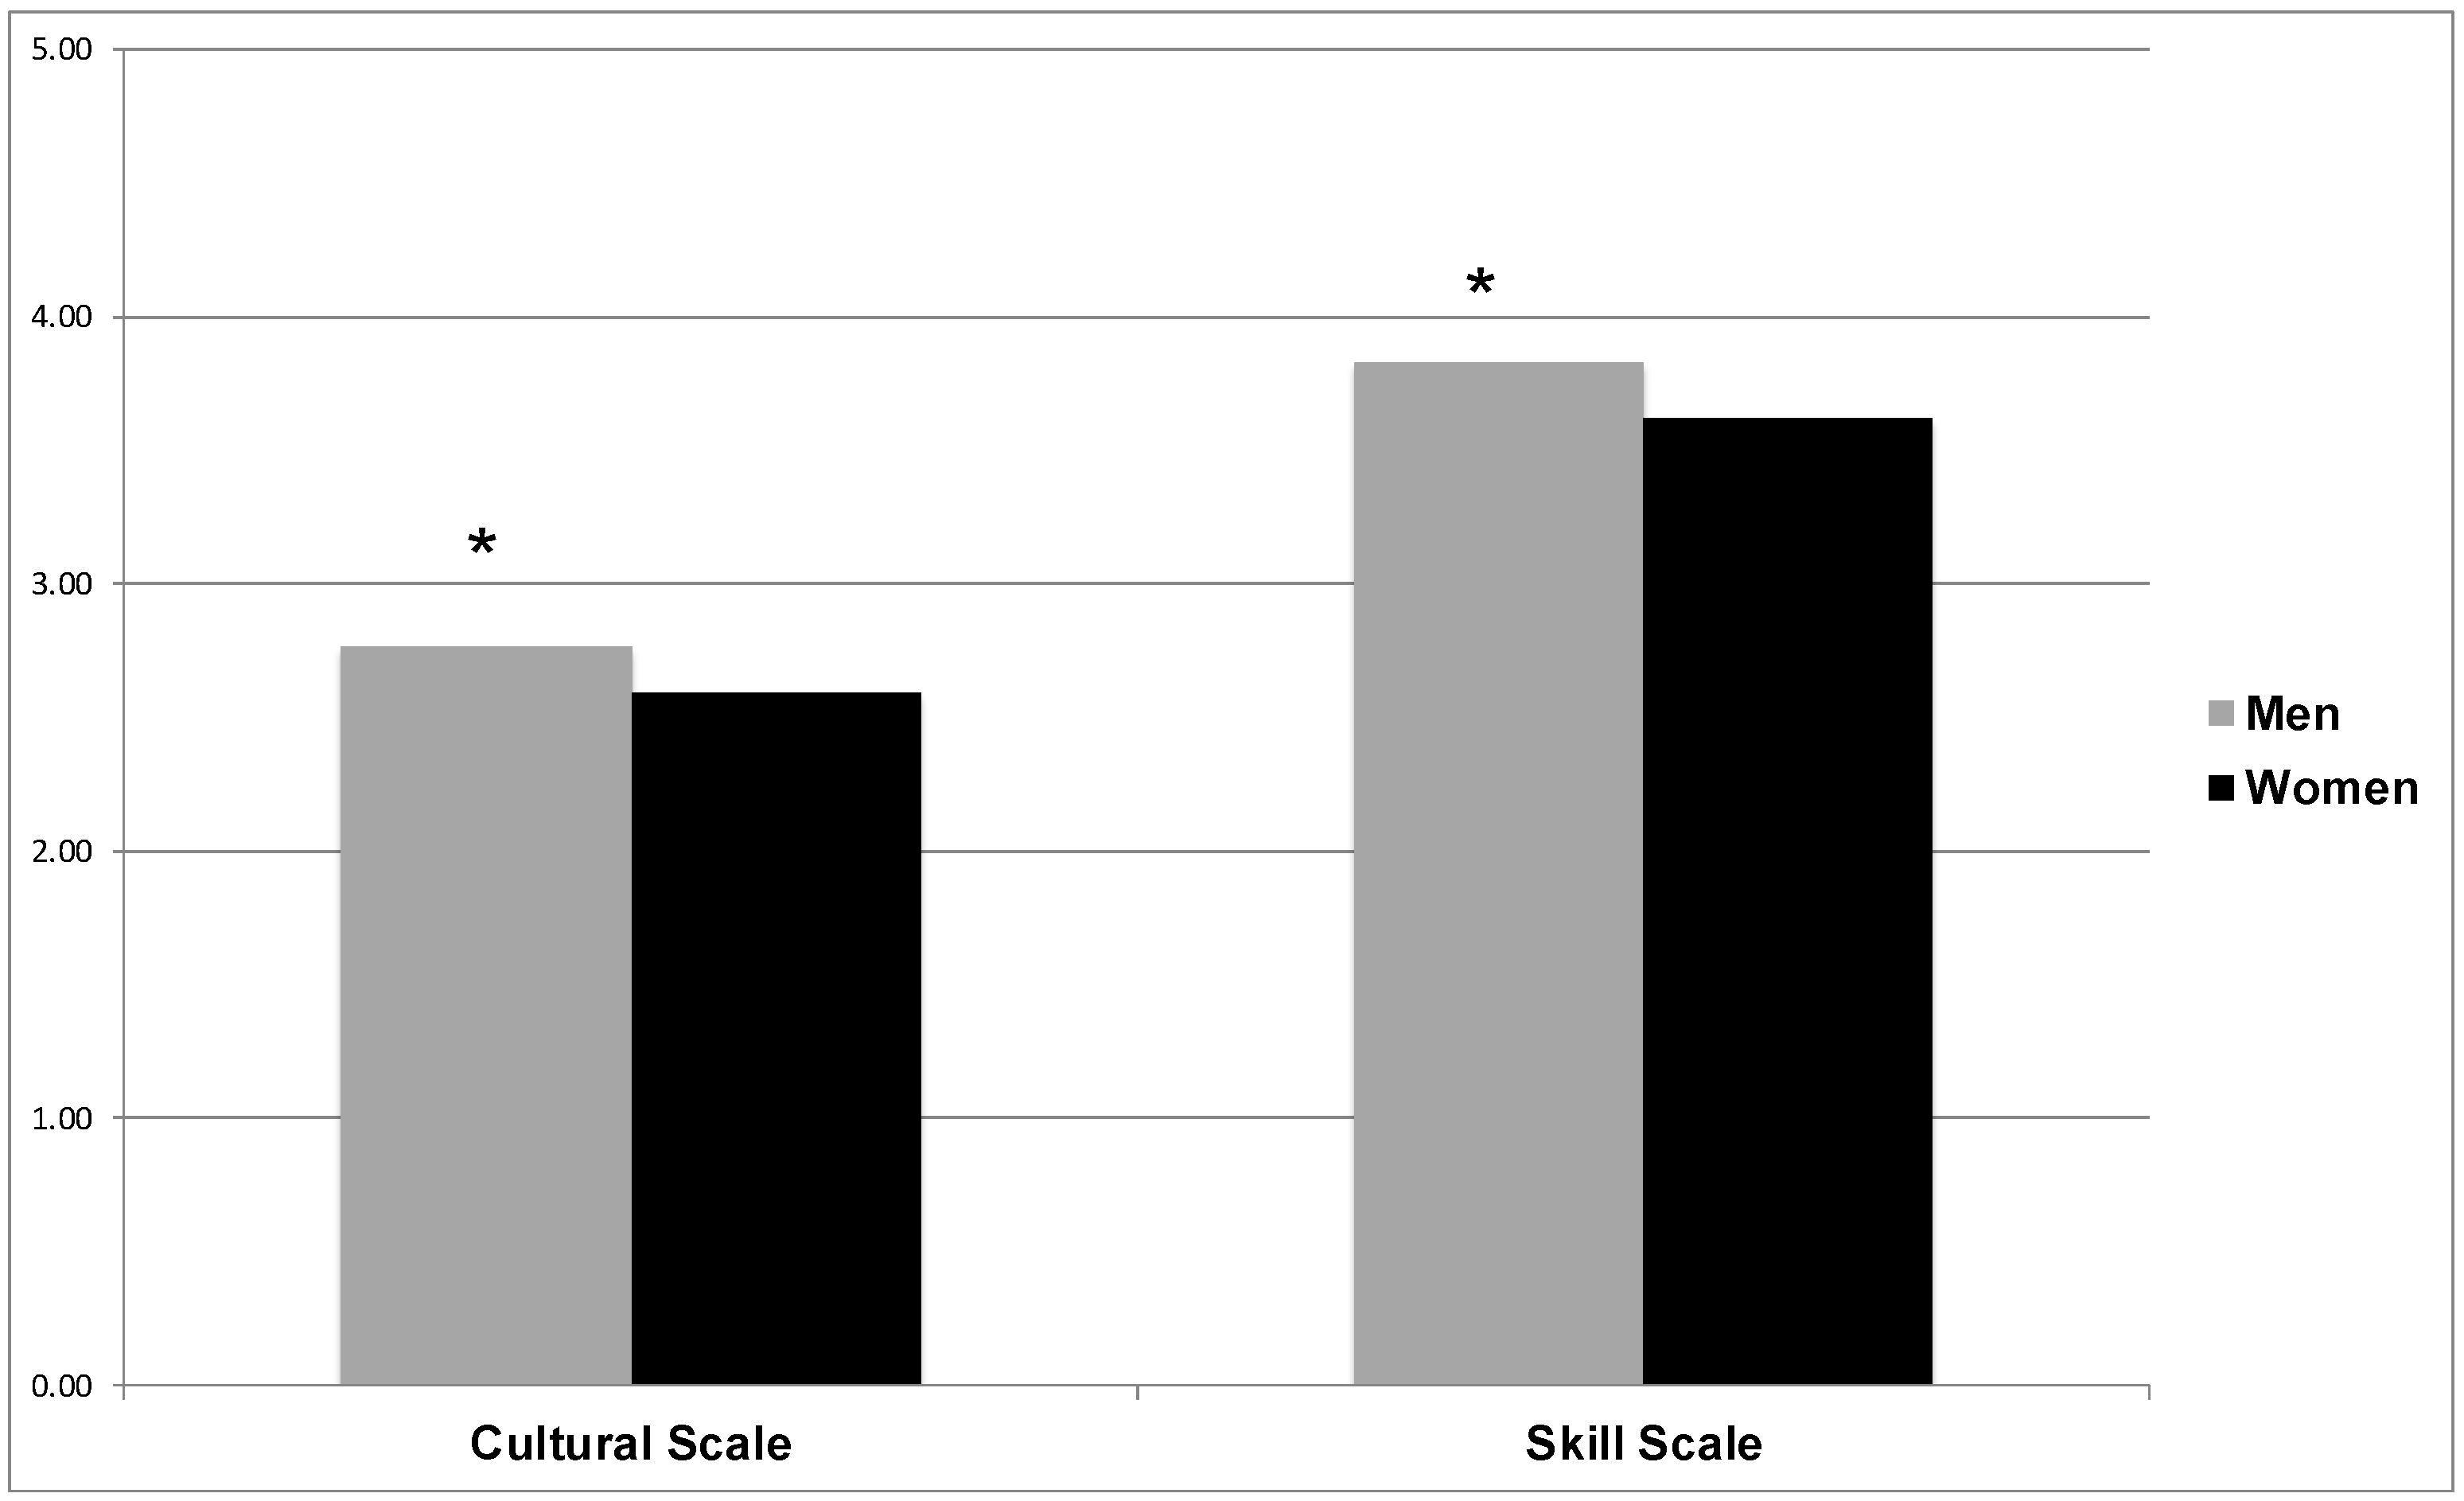
Figure 1 displays how men and women rated successful tech workers on the cultural and skill set dimension. These ratings reflect the stereotypes individuals hold about successful tech work. As can be seen, men and women hold relatively similar stereotypes, although women hold a more stereotypical view of successful tech workers on the cultural dimension, viewing successful tech workers as more geeky, obsessive, etc. The average for men’s ratings of successful tech workers is 2.76 (α = 0.66), and women’s ratings average 2.90 (α = 0.67) (p < 0.001). There is no significant gender difference in how men and women rate successful tech workers on the skill dimension, seeing successful tech workers as equally analytical, questioning, and highly mathematical. On the skill dimension, the average of men’s ratings of successful tech workers is 3.72 (α = 0.61), and women’s ratings average 3.77 (α = 0.60), an insignificant difference.
5.3. How Do Individuals Rate Themselves?
Figure 2 displays how men and women rate themselves on the cultural and skill dimensions. As can be seen, women rate themselves significantly lower on both dimensions than men do (p < 0.001). The average value on the cultural scale is 2.76 (α = 0.53) for men’s self-ratings and 2.59 (α = 0.60) for women’s self-ratings. Thus, men believe they are more obsessive, geeky, etc. than women do. The average skill scale value is 3.83 (α = 0.59) for men’s self-ratings and 3.62 (α = 0.64) for women’s self-ratings. Therefore, women tech workers are significantly less likely than men tech workers to think they have analytical quantitative skills, echoing earlier findings from high school and college settings.11
In sum, these measures reveal that men and women hold similar beliefs about the skills required to be a successful tech worker, but women are less likely to believe they themselves exhibit these traits. On the cultural dimension, women are significantly more likely than men to believe that successful tech workers embody obsessive, geeky traits, and they are also significantly less likely than men to believe these traits describe themselves.
5.4. Are Women Less Likely to Align with the Stereotypes of Successful Tech Work?
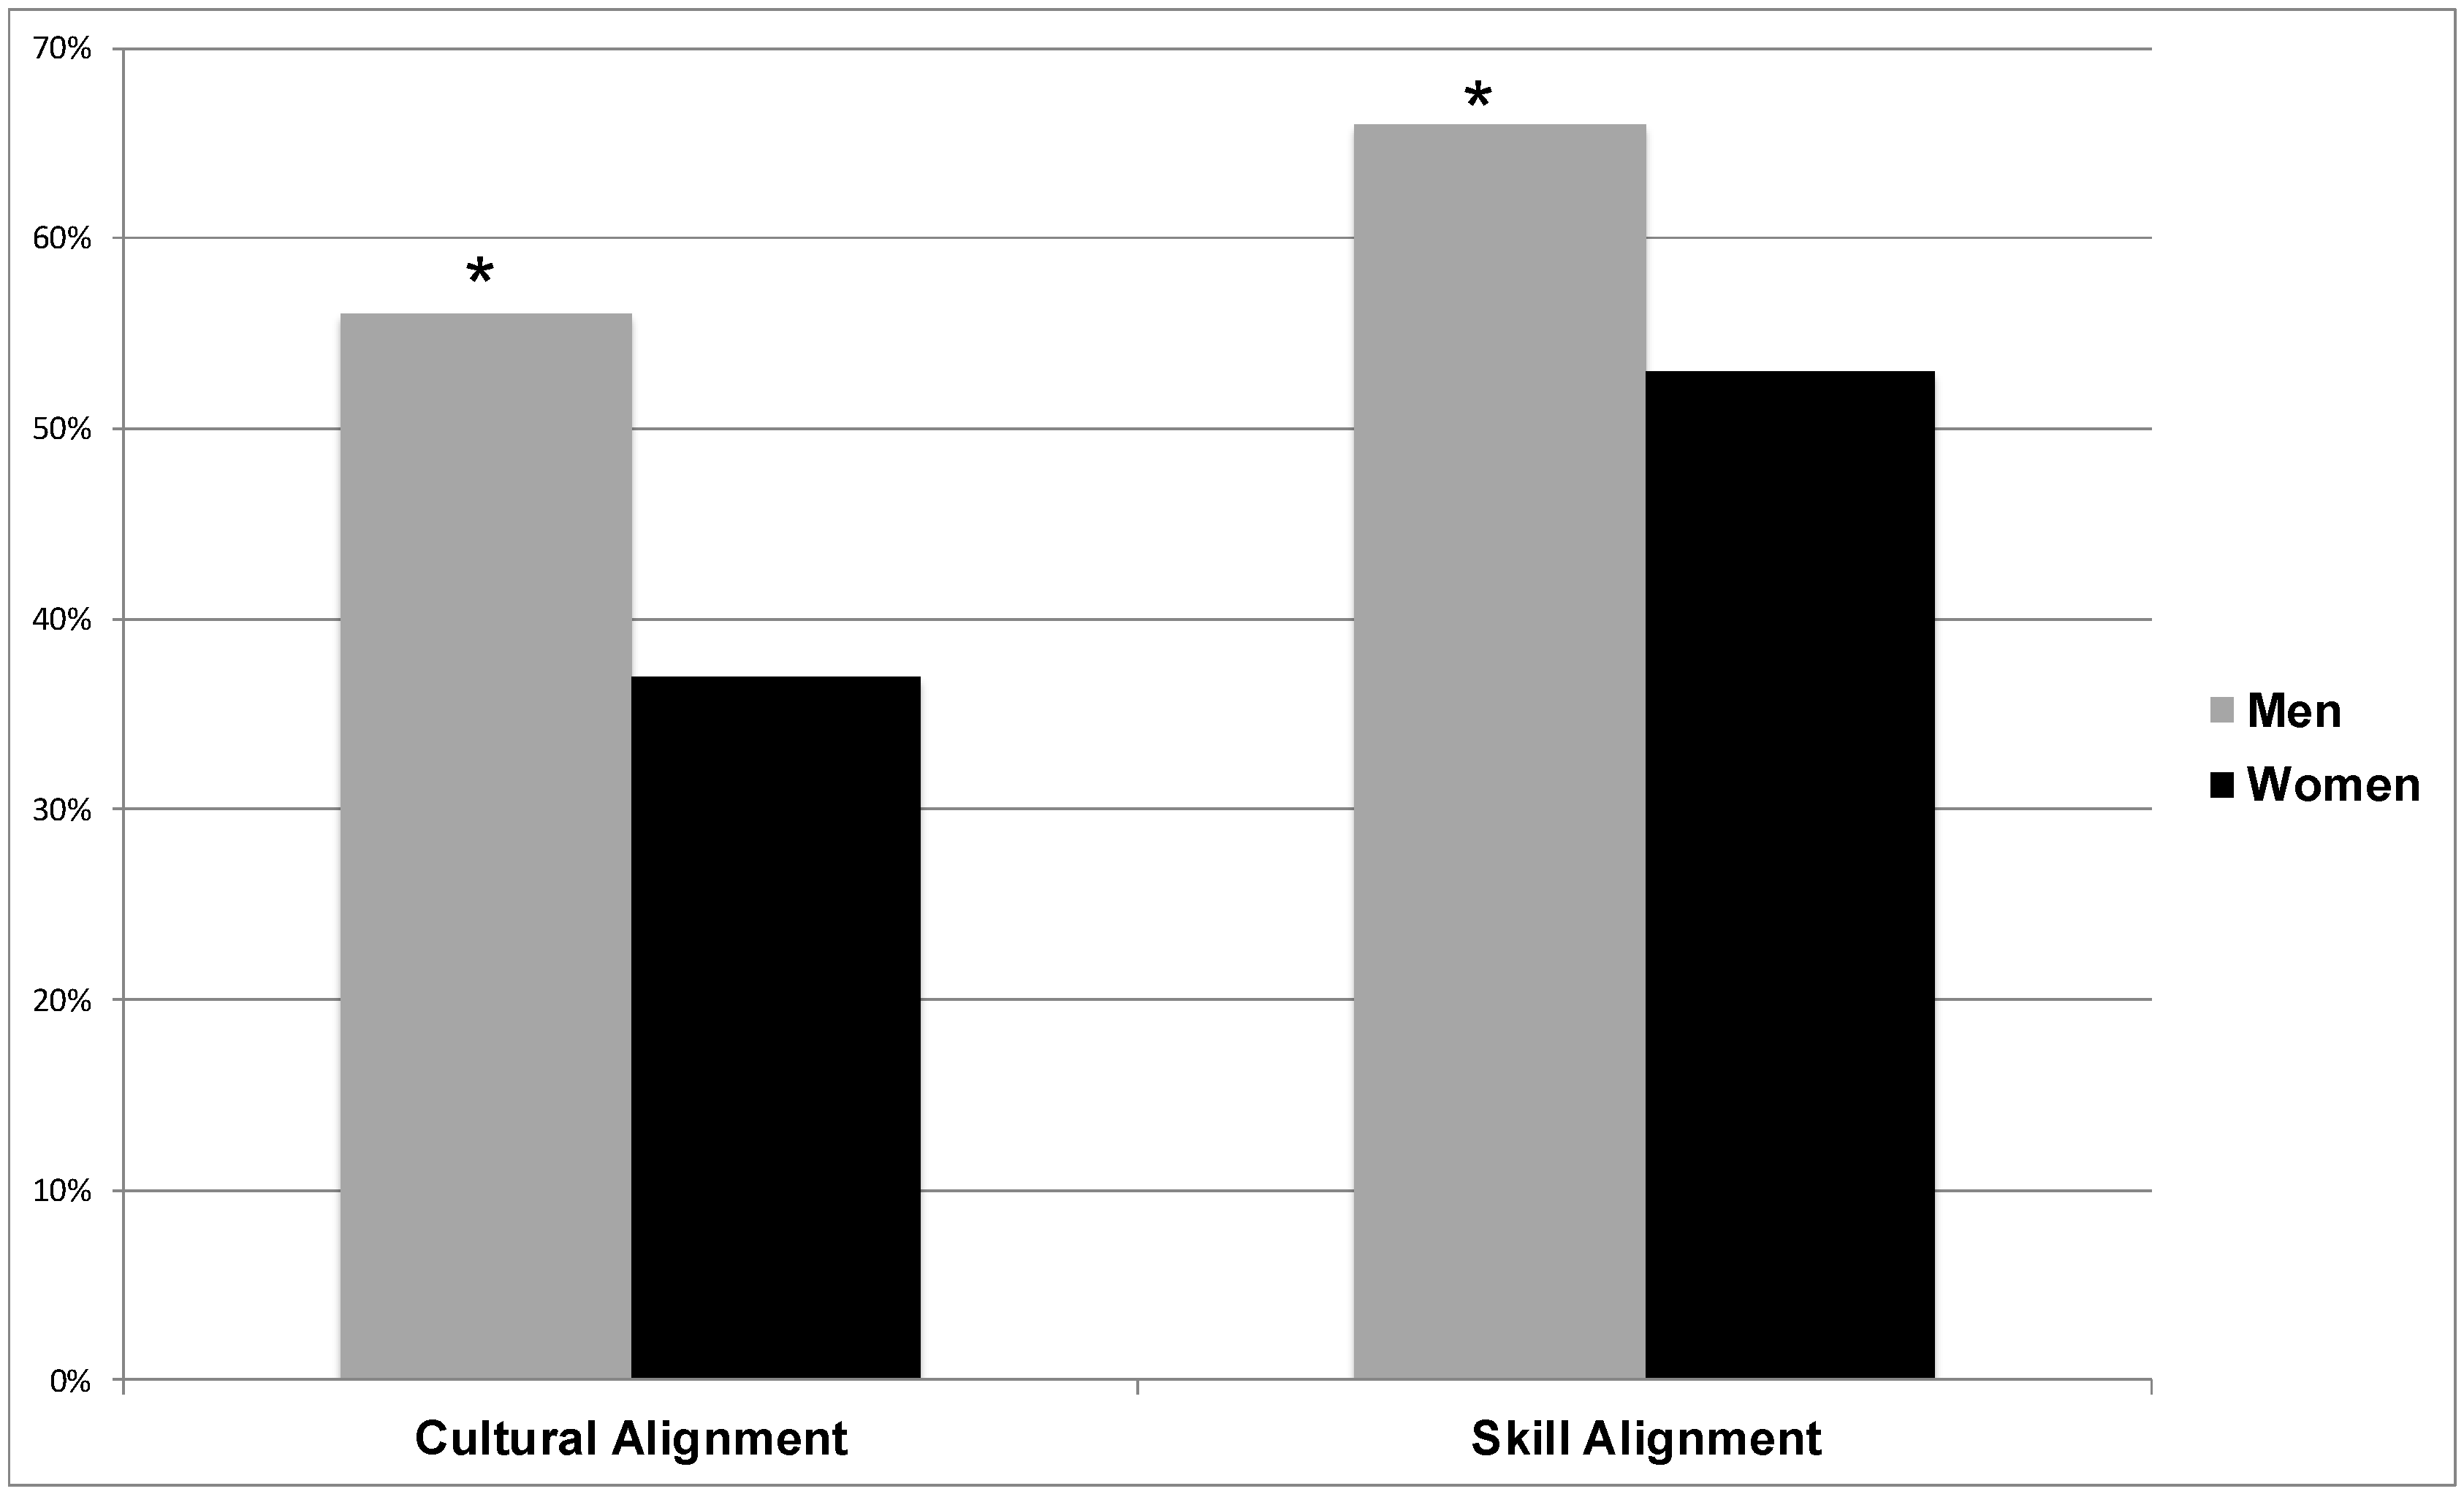
We now evaluate the extent to which individuals believe they match the cultural image or skill expectation of successful tech workers. Figure 3 plots the percentage of women and men whose image of themselves aligns with their image of successful tech workers. The bar graphs show percentages for the dummy cultural and skill alignment variables. Here we find significant gender differences for both the skill and cultural alignment variables. Only 37% of women demonstrate cultural alignment, rating themselves as greater than or equal to their image of a successful tech worker. In contrast, 56% of men demonstrate positive cultural alignment (p < 0.001). Fifty-three percent of women indicate skill alignment, whereas 66% of men have skill alignment (p < 0.001). Thus, men are more likely than women to consider themselves similar to successful tech workers in terms of having the cultural traits and skills successful workers posses. A wide chasm exists between men and women’s perceptions; men think they have what it takes to be successful, whereas women perceive a gap between themselves and the ideal tech worker, and the gap is especially pronounced on the cultural dimension.
To examine simultaneously the direction and the magnitude of any cultural and skill difference, we plot the magnitude of the gaps, broken down by whether or not individuals see themselves as similar to their image of a successful tech worker on the cultural and skill dimensions.
Specifically, in Figure 4, we graphed the cultural alignment for four different groups: (1) men who do not think they match the cultural image of a successful tech worker; (2) women who do not think they match the cultural image of a successful tech worker; (3) men who do think they align culturally; and (4) women who do think they align culturally. We also graphed the skill alignment for men and women who do and do not believe they possess the same skills as successful tech workers. The bar graph shows the extent to which respondents think they are different from successful tech workers; this difference can be in a positive direction (respondents think they are better than the average successful tech worker) or a negative direction (respondents think they are worse than the average successful tech worker).
When we compare men and women who do not perceive themselves as successful on the cultural alignment dimension (bars on the far left of Figure 4), we find that women’s absolute value is significantly larger than men’s (p < 0.001). This means that, among men and women who feel like they do not align, women perceive a large difference between themselves and successful tech workers, whereas this difference is significantly smaller for men. Women more strongly believe they lack the cultural traits valued in their environment.
In contrast, when we compare men and women who do consider themselves culturally similar to the successful tech worker (the second set of bars on Figure 4), we find that the gap between self-ratings and ratings of successful tech workers is significantly larger for men (p < 0.05). Men are more likely to believe they greatly exceed the cultural standard for success, whereas women in this category only see themselves as equivalent or slightly better than their image of the successful tech worker.
Similarly, when the skill alignment dummy variable equals 0, indicating a perceived lack of skill (third set of bars on Figure 4), women’s absolute value is significantly larger than men’s (p < 0.001). This means that, compared to men who believe they lack skill, women perceive that their lack of skill is much greater, relative to the successful tech worker. However, among people who consider themselves successful on the skill dimension, there is no significant gender difference in absolute value (p > 0.10) (right-most bars in Figure 4).
Across our two measures of alignment, among those who do not believe they align with the prevailing standard of success, women see themselves as far more deficient than men do when comparing themselves to successful tech workers. However, among those who do believe they align, men are more likely than women to see themselves as exceeding the cultural image, but they are no more likely than women to believe they have more skill.12
We now turn to regression models that allow us to assess whether these gender differences in alignment are associated with workplace outcomes.
5.5. Analytical Strategy
In the following sections, we estimate a series of ordinary least squares regression models to analyze the effect of cultural and skill alignment on work-related outcomes. We cluster the standard errors by company to account for non-independence. Since these dependent variables are discrete and ordered, we also conducted ordered logistic regressions. Because the results are extremely similar to the OLS models, we present the ordinary least squares estimates here for ease of interpretation. Results from the ordered logistic regressions are available upon request.
We first model the main effects of gender, race, and employee level. Then, we add dummy variables for cultural and skill alignment, which tell us whether alignment is associated with these work outcomes. In the final models, we add absolute value and interaction variables to examine whether the magnitude of alignment also matters, or whether the direction of alignment alone is most strongly associated. If the dummy variables are strongest, that means the direction of alignment matters most; if the interactions are significant, that means the magnitude matters as well. Thus, we present two specifications of alignment: one that is direction-only, and the other that includes direction and magnitude.
5.6. Is Alignment Associated with Workplace Outcomes?
We first present a series of models that assess the relationships between alignment (cultural and skill) and our identity measures (identification with the tech profession and identification with the respondent’s company). We then turn to models assessing whether alignment is significantly associated with perceptions of supervisor treatment (supervisor values respondent’s opinion and supervisor assigns high visibility projects). We then model whether cultural and skill alignment are significantly related to plans to switch career fields. Finally, we assess whether the results presented vary by employee career stage.
Identity models. Model 1 of Table 2 shows the raw gender, race, and employee level effects for identification with the company where the employee works. The non-significant female dummy variable coefficient indicates that there is no significant gender gap in identification with company. There is also no significant effect for company level. However, Asians and “other race” are significantly more likely than Whites to identify with their companies. The Asian result is consistent with literature on Asian culture, particularly regarding STEM fields (Jiménez and Horowitz 2013). In Model 2, we add the cultural and skill alignment dummy variables. Both cultural and skill alignment are significantly associated with identification with one’s company, and perhaps unexpectedly, skill alignment is negatively associated with company identification. Those who feel they have the skills to succeed are less likely to identify with their companies, while those who feel they align culturally are more likely to identify.
To assess both the direction and magnitude of alignment on identification, we add the absolute value variables and the interaction terms in Model 3. The cultural alignment interaction is marginally significant and positive, indicating that for those who consider themselves successful on the cultural alignment dimension, the more they exceed the successful tech worker standard, the more they identify with their company.13 The absolute value variable indicates the effect for those who do not feel they align culturally, and the cultural alignment dummy variable indicates the effect of alignment when the absolute value equals zero, or the respondent’s self-rating equals their rating of successful tech workers. The skill alignment interaction is significant and negative, indicating that for those who consider themselves successful, the more successful they consider themselves relative to other tech workers, the less likely they are to identify with their company.14 Perhaps people who believe they are overqualified relative to their stereotypes of a successful tech worker seek sources of identification outside the company. Given the higher rate of attrition out of technology from women compared to men (Beede et al. 2011), this is an encouraging finding. Increasing women’s cultural alignment with the tech field would presumably increase women’s engagement with their companies.
Models 4–6 in Table 2 demonstrate the effects of cultural and skill alignment on identification with the tech profession. As the negative female dummy variable coefficient indicates in Model 4, women are significantly less likely than men to identify with the tech profession. Similar to Models 1–3, Asians and “other race” are significantly more likely than Whites to identify. Perhaps unsurprisingly, low-level employees are significantly less likely than mid-level employees to identify with the tech field, while high-level employees do not differ from mid-level employees.
In Model 5, we add the cultural and skill alignment dummy variables. Both skill and cultural alignment are significant and positive, indicating that higher alignment is associated with higher identification with the tech profession. The gender variable also decreases in magnitude with the addition of these two variables, indicating that some of the gender gap in identification is related to the alignment variables, but the gender gap remains significant.
Next, we test whether the magnitude of perceived alignment is related to tech identification. We add the absolute value variables and interactions in Model 6. None of the coefficients for these variables are significant, leading us to conclude that Model 5 is the preferred model for identification with tech. For this dependent variable, the direction of alignment (i.e., alignment vs. no alignment) matters more than the magnitude or extent of alignment. The coefficient for the female dummy variable decreases by 21% from Model 4 to Model 5, indicating that about a fifth of the gender gap is associated with cultural and skill alignment.
It is possible the magnitude has more of an effect in local environments (e.g., company culture and experiences on teams), while the direction has more of an effect on identification with the broader technical culture (e.g., the technology field). To feel identified with the tech field, it may be sufficient for tech employees to merely perceive that their personalities and skills align with expectations, and the magnitude of alignment may matter less than the simple existence of alignment. In contrast, to feel comfortable in local environments (e.g., companies and teams) and to believe that one has what it takes to be successful, the amount of alignment may matter more. That is, individuals may need a more precise estimate of alignment when making sense of self in a specific setting that contains concrete others with whom to compare oneself.15
We also added three-way interactions between gender, alignment dummies, and absolute value to assess whether alignment has a stronger or weaker effect on the dependent variables (models not shown). These interactions are not significant. Therefore, men and women place similar value on perceptions of alignment. Lack of cultural and skill alignment do not have a stronger effect for women than for men. Instead, women simply report less cultural and skill alignment than men, thereby lowering their identification with the tech profession.
Supervisor treatment models. We now present models assessing the effect of our alignment variables on perceptions of supervisor treatment. As we detail below, cultural alignment has an even stronger relationship to these dependent variables: women are less likely than men to report that their supervisor values their opinions or assigns them high visibility projects, and controlling for cultural alignment completely eliminates these gender gaps. In contrast, skill alignment has almost no impact on these gender gaps (and if anything, it has the opposite effect of what we might expect).
Model 1 of Table 3 shows that women are less likely than men to report that their supervisors value their opinions. Asians are significantly less likely than Whites to report that their supervisors value their opinions. Employee level is not significant. In Model 2, we add the alignment dummy variables and find that the cultural alignment coefficient is significant and positive, while the skill alignment coefficient is insignificant. Further, the female coefficient decreases in magnitude and drops to marginal significance with the addition of the alignment dummies, indicating that much the gender difference in perceptions of supervisor treatment is related to cultural alignment; because women are less likely to believe they align with the cultural profile of a successful tech worker, they are less likely to believe their supervisors value their opinions.
When we add the absolute value and interaction variables in Model 3, we see that the cultural alignment variables have a strong effect on supervisor treatment. The interaction term is significant and positive, which indicates that for those who consider themselves successful on the cultural dimension, as the gap between themselves and successful tech workers widens, they are more likely to report that their supervisor values their opinion. The absolute value variable is significant and negative; for those who are unsuccessful on the cultural dimension, as the gap between themselves and successful tech workers widens, they are less likely to report that their supervisor values their opinion.
In contrast, skill alignment has the opposite effect. The significant negative skill alignment interaction coefficient indicates that, for those who perceive they have skill alignment, as the absolute value of the difference between self-ratings and ratings of successful tech workers increases, employees are less likely to believe their supervisor values their opinions. Those who report they are much stronger in mathematical and analytical skills than their stereotypes of a successful tech worker may be overly confident and difficult to work with. Whatever the reason, lack of skill alignment does not seem to explain why women are less likely than men to feel valued by their supervisors. Instead, lack of cultural alignment is more strongly related to this pattern. The coefficient for the female dummy variable decreases by 29% from Model 1 to Model 3, indicating that much of the gender gap is related to perceptions of alignment. Furthermore, we see that the magnitude of alignment matters in addition to the direction of alignment.
We see similar results for models measuring whether respondents report that their supervisors assign them high visibility projects (Models 4–6, Table 3). The negative coefficient for the female dummy variable in Model 4 shows that women are less likely than men to agree with this statement, and Models 5 and 6 demonstrate that controlling for cultural alignment completely eliminates this gender gap. The coefficient for the female dummy variable decreases by 43% from Model 4 to Model 6 and becomes non-significant. For employees who do not align culturally, as the gap between self-ratings and ratings of successful tech workers increases, they are much less likely to report that their supervisor assigns high visibility projects. For those who do align culturally, as the gap between self and successful tech worker ratings increases, they are much more likely to report their supervisor assigns high visibility projects.
Skill alignment shows the same curious pattern as before, where those who perceive they are more skilled than a successful tech worker believe they are less likely to receive high visibility projects from their supervisors. Therefore, perceptions of deviations from the stereotypical image of a successful tech worker, rather than perceived deficiencies in skill, are more strongly associated with gender differences in perceptions of supervisor treatment.16 Furthermore, other research finds women do receive fewer highly visible, “high-potential” projects relative to men (Silva et al. 2012), suggesting that women’s perceptions of supervisor project assignments in the current study may well reflect an accurate representation of their opportunities (rather than being a misguided perception).
Finally, in models not shown, we find that three-way interactions among gender, the cultural alignment dummy, and the cultural alignment absolute value are not significant for the supervisor treatment variables. That is, men and women react similarly to low cultural alignment. Women report less cultural alignment than men, and this is significantly associated with the fact that they are more likely to report negative supervisor treatment.
However, the interaction between gender, the skill alignment dummy, and the skill alignment absolute value variable is negative and significant analyzing whether the respondent feels their supervisor values their opinion (p < 0.05, model not shown). In other words, the negative effect of skill alignment on perception of supervisor treatment is not as strong for women relative to men. While for men, higher perceived skill (relative to a successful tech worker) is associated with worse perceived supervisor treatment, this effect is weaker for women.
Turnover intention models. Our final set of models examines the effect of cultural and skill alignment on plans to switch career fields.
In Model 1 of Table 4, there are no significant gender, race, or employee level effects. Recall that the dependent variable asks respondents whether they intend to switch career fields in the next 12 months. Since most people do not plan to leave their career field in the near future, the variation in this variable is reduced, making a lack of a main effect for gender, race, and employee level not overly surprising. In Model 2, neither of the alignment variables is significant. However, in Model 3, where the specification of alignment includes both magnitude and direction, we see that cultural alignment has a significant effect on plans to switch career fields. For those who are aligned on the cultural dimension, as the gap between self and successful tech worker ratings increases, they are significantly less likely to consider switching career fields in the next 12 months. The reverse is true for those who lack cultural alignment. Therefore, cultural alignment is significantly associated with plans to switch career fields in the near-term future.17 Skill alignment, by contrast, has virtually no effect. In addition, the magnitude of alignment matters for plans to switch career fields. Given our earlier finding that magnitude appears to matter more in local environments (e.g., companies and teams) compared to broader environments (e.g., industry), perhaps people make decisions about leaving a field based on their experiences in their local environment. Whatever the reason, the extent of alignment has a significant impact on turnover intentions.
These findings have important implications for gender diversity in the tech industry. While most policy efforts to date have involved efforts to enhance women’s confidence in their technical skills, our results suggest that efforts focusing on the cultural dimension will likely be more successful. We find that only 37% of women who are in tech jobs have cultural alignment, compared to 56% of men (see Figure 3). However, Model 3 above suggests that if women’s cultural alignment were equal to men’s, women would be even more likely than men to plan to stay in tech careers. Since women enter tech at substantially lower rates than men, retaining women at a higher rate than men could offset some of the gender gap in these fields.
5.7. Does Career Stage Matter?
In the models presented above, we control for tech workers’ level in their company. We now ask whether the relationships we have found differ for low, middle, and high-level employees. As we have discussed, stereotypes may have less of an effect on individuals the further they progress in their career. That is, as an individual gains more career experience, she gains more evidence of her skills, which could lessen the effects of stereotypes on career outcomes. In addition, by spending more time in the tech industry, women may develop more realistic, and less stereotypical, images of successful tech workers. By analyzing separate models for employees at different levels, we gain some, albeit limited, insight into this question.
In results not shown, we find that, at higher position levels, there are fewer gender differences in work outcomes. There are no significant differences between high-level women and high-level men in identification with the tech field or in their reports of positive supervisor treatment. However, even among high-level employees, gender gaps in alignment persist. High-level women score significantly lower on cultural alignment compared to high-level men (p < 0.01). What differs is that cultural and skill alignment gaps simply are not as strongly associated with work outcomes for high-level women compared to low-level women. Perhaps high-level women have received enough evidence of their ability to draw confidence from other sources. It is also possible that differences between high- and low-level women could reflect differential attrition; women with lower levels of alignment, identification, and/or perceived supervisor treatment may leave the company before reaching the highest levels.
These results are consistent with the idea that as women progress in their careers, the effects of stereotypes become less pronounced. Such differences in gender gaps by level could potentially derive from two mechanisms: either high-level women have higher self-assessments than low-level women on cultural and skill traits, thereby narrowing the gap between their self-assessments and their stereotypes of successful tech workers, or they have less stereotypical assessments of successful tech workers than lower-level women. Either mechanism would lead to higher alignment.
To gain empirical leverage on this question, we analyzed the self and successful tech worker scales separately. On the cultural traits scale, we find no significant difference in how high-level and low-level women rate themselves. (The same is true for high- vs. low-level men.) However, low-level women rate the average successful tech worker significantly higher on the cultural traits scale compared to mid- and high-level women (p < 0.01). In other words, low-level women have an inflated view of how geeky, assertive, etc. successful tech workers are compared to high-level women. (There is no significant difference by level among men.) On the skill scale, high-level women rate themselves significantly higher than low-level women (p < 0.05), and the same is true for men (p < 0.01). Low-level women rate the average successful tech worker marginally higher on the skill scale than mid- and high-level women (p < 0.10). (In contrast, there is no difference for men.)
Thus, on the cultural dimension, high-level women do not have a fundamentally different self-image than low-level women; rather, their image of a successful tech worker becomes less stereotypical at higher levels. On the skill dimension, women gain more evidence of their ability (just as men do), while also updating their conception of the average successful tech worker’s skills. As women reach higher levels in the tech industry, they revise their image of tech work in more realistic ways; tech workers, after all, are not really spending the bulk of their time playing World of Warcraft in their parents’ basement.
6. Summary and Conclusions
In this paper, we introduce the concepts of cultural and skill alignment and ask whether men and women in technical jobs differ in the extent to which they perceive that they have the traits and skills they associate with a successful technical worker. We further examine whether cultural and skill alignment are related to work outcomes such as identifying with the tech field, plans to switch fields, or perceptions of supervisor treatment. While past research has examined how stereotypes shape the movement of young adults into STEM fields, ours is the first study to examine cultural and skill alignment among a sample of men and women in technical jobs.
We find that, while women and men largely agree on the stereotypes about successful tech workers, women hold slightly more stereotypical images of tech workers on the cultural dimension. Furthermore, women are less likely to view themselves as having the cultural traits and skills they associate with successful tech workers. Women are less likely than men to believe they match the stereotypical image of successful tech workers, and this is significantly related to reporting worse work outcomes. Across our dependent variables, we find that cultural alignment is generally more powerful than skill alignment, and cultural alignment explains some of the variance by gender on the identification with the tech profession and supervisor treatment variables. For the supervisor treatment variables in particular, controlling for cultural alignment fully eliminates the gap between men and women. The skill alignment variables either have little effect on the gender gap, or in some cases, skill alignment has the opposite effect of what we might expect. Given the current policy emphasis on improving women’s technical skills and confidence, it is surprising that perceptions of skill alignment are less predictive overall in our models than are perceptions of alignment with the cultural image of a successful tech worker.
These findings have important theoretical implications. This is the first paper to clarify the distinction between cultural and skill based forms of alignment and demonstrate their independent effects. We show a connection between women’s lack of alignment with the masculinized culture of technology and important work outcomes, such as women’s identification with technology and perceptions of supervisor treatment. We further show that these cultural images are often more strongly associated with intentions to leave tech than are skill-based assessments. While cultural alignment is associated with perceived supervisor treatment and plans to switch career fields, skill-based alignment is significantly associated with women’s identification with the tech field, leading women to be less likely than men to identify with the field. By analyzing the separate operation of cultural and skill alignment, this paper offers unique insight into the mechanisms that impact gendered outcomes in the technology field.
Furthermore, we find that the simple existence or non-existence of alignment seems to matter more in broader contexts, such as deciding whether or not one belongs in an entire field; in contrast, the extent or magnitude of alignment matters in more localized contexts, such as a company or team. By using direction-magnitude interaction models that examine both the direction and the magnitude of alignment, we are able to tease apart the independent effects of different alignment specifications.
The main practical implication of this study is that if we want to increase the representation of women in STEM fields, we need to attend to cultural alignment in STEM workplaces. Current policies focus primarily on generating young women’s interest and skills, thereby slotting women into STEM majors in college, and eventually into STEM careers. Such policies neglect the fact that stereotypes continue to hinder women as they progress in their careers. As long as cultural stereotypes continue to make women feel like they do not fit in, women will be less likely to identify with their professions. Indeed, in their analysis of college students majoring in a STEM field, Cech and colleagues show that students who had less confidence that they fit in a STEM major were less likely to say they intended to enter a STEM career after graduation compared with students who perceived a better fit (Cech et al. 2011). Similarly, the study by Murphy and colleagues demonstrates how male-dominated cultural environments can make female students less likely to feel like they belong, causing even women highly identified with STEM fields to lose interest in pursuing STEM careers (Murphy et al. 2007). Our study shows that even those women who do enter a STEM career may be less likely to stay in these fields if they perceive that they lack the cultural traits associated with technical work (e.g., geeky, assertive, and obsessive).
In addition, policies that aim to increase women’s human capital by improving their training, restructuring school programs, and targeting women’s quantitative and analytical skills, while important, cannot solve the problem by themselves. Even when we compare men and women who have equal perceptions of skill alignment, a cultural divide between the stereotypical view of women and the stereotypical view of successful tech workers disadvantages women, especially at the early stages of their career. Widespread assumptions about who succeeds in tech companies—the masculine-typed geeky coder—continue to proliferate. Our findings suggest that, unless we reshape the cultural images surrounding technology and technical work, women will continue to leave tech jobs in higher numbers than men.
Logically, women’s cultural alignment could be increased either by broadening the cultural image of successful tech work, by stressing its collaborative and socially important nature, for example (Cech 2015; Diekman et al. 2010; Diekman et al. 2016), or by urging women to see themselves in ways that align with existing narrow images of tech as geeky, obsessive, etc. Since these images are currently strongly associated with masculinity, the latter approach seems less promising. Policies that broaden the image of a successful tech worker might help increase the retention of women in tech fields. Carnegie Mellon University provides an encouraging example of such change: in 1995, only 7 of 95 students entering the undergraduate program in computer science were women. In 2000, that number had increased to 54 out of 130, or 42% (Margolis and Fisher 2002). The researchers found that the stereotype of computer science majors as geeks “myopically obsessed with computing” discouraged women. Carnegie Mellon broadened the picture of a successful computer science student by encouraging faculty and students to discuss multiple valid ways to be a computer scientist and emphasizing computing’s real-world value and connections to other disciplines. Importantly, they did not urge women to change their self-conceptions to fit into the current narrow image of computer science. By changing the cultural image of the computer science major (along with several other changes), Carnegie Mellon succeeded in increasing the representation of women. Tech companies can emulate this example and increase the retention of women by altering the cultural images surrounding tech work.
In a controlled experiment, Cheryan and colleagues found that by simply changing the objects in a computer science classroom from those associated with geeky masculinity (e.g., Star Trek posters) to more gender-neutral objects, college women’s interest in computer science increased (Cheryan et al. 2009). However, some technology companies do just the opposite, displaying exactly the kinds of images that Cheryan and colleagues found dampen women’s interests (Wynn and Correll 2014). Such stereotype-saturated environments can also influence the treatment of women, such as career mentorship opportunities and salary (Moss-Racusin et al. 2012). While it is hard to change widely shared cultural stereotypes, it is possible for local organizations, such as universities and individual workplaces, to change the images that are present in their environments. Doing so might be especially useful for retaining women in the early stages of their careers.
The dataset for this study comes from seven tech companies in the Silicon Valley. While this area is an important site for technical work, it is not clear if the results would be the same in other regions or even in other companies in the Silicon Valley. Because of our theoretical interests in examining how stereotypes affect men and women tech workers, we sought a sample that would allow us to examine these processes in a heretofore unexamined population. With these unique data of actual tech workers at cutting-edge companies, we believe we gain novel insights into the stereotypes such workers have about successful technical work and how these stereotypes affect men and women tech workers once on the job. Given the increasing importance of technical work for today’s economy and the continued dearth of women in these fields, understanding how stereotypes affect the identification and intentions of women and men who are in these fields is of crucial importance.
Furthermore, the findings may apply to other historically male-dominated industries—such as finance, academia, and law enforcement—that continue to narrowly associate success with stereotypically masculine traits (Blair-Loy and Cech 2016). By altering cues in the local environment and changing the prevailing image of a successful worker in these fields, organizations in such industries can potentially increase women’s alignment and ultimate retention. Our findings imply that by making the image of success broader and more inclusive, organizations can do more than put women into high-status jobs—they can retain women and enable them to advance.
Acknowledgments
We would like to thank David Grusky, Cristobal Young, Kate Weisshaar, and the members of the social psychology workshop and the Michelle R. Clayman Institute for Gender Research at Stanford University for their helpful comments and suggestions. In addition, we are grateful for the suggestions of the anonymous reviewers and the editors, Maria Charles and Sarah Thébaud. This material is based upon work supported by the National Science Foundation Graduate Research Fellowship. Any opinions, findings, and conclusions or recommendations expressed in this material are those of the authors and do not necessarily reflect the views of the National Science Foundation.
Conflicts of Interest
The authors declare no conflict of interest.
Appendix A

Table A1.
Rotated Factor Loadings from Principal-Component Factor Analysis on Traits Describing Successful Tech Workers (Simard et al. 2007).
Table A1.
Rotated Factor Loadings from Principal-Component Factor Analysis on Traits Describing Successful Tech Workers (Simard et al. 2007).
| Variables | Factor 1: Intensive Work Commitment | Factor 2: Geeky Personality | Factor 3: Quantitative Skill |
|---|---|---|---|
| Young | 0.526 | 0.451 | −0.129 |
| Masculine | 0.573 | 0.384 | −0.131 |
| Long Working Hours | 0.744 | 0.111 | 0.101 |
| Cool | −0.005 | 0.687 | −0.114 |
| Geeky | 0.202 | 0.727 | 0.170 |
| Highly Mathematical | 0.259 | 0.207 | 0.608 |
| Obsessive | 0.621 | 0.159 | 0.212 |
| Assertive | 0.644 | −0.156 | 0.051 |
| Analytical | 0.029 | 0.006 | 0.805 |
| Questioning | −0.004 | −0.034 | 0.682 |
Table A2.
Pearson’s Zero-Order Correlation Coefficients from Bivariate Pairs of Cultural Scale Traits Describing Successful Tech Workers (Simard et al. 2007).
Table A2.
Pearson’s Zero-Order Correlation Coefficients from Bivariate Pairs of Cultural Scale Traits Describing Successful Tech Workers (Simard et al. 2007).
| Variables | Young | Long Hours | Obsessive | Assertive | Cool | Geeky |
|---|---|---|---|---|---|---|
| Young | 1.000 | |||||
| Long Hours | 0.356 | 1.000 | ||||
| Obsessive | 0.255 | 0.352 | 1.000 | |||
| Assertive | 0.167 | 0.282 | 0.333 | 1.000 | ||
| Cool | 0.244 | 0.036 | 0.128 | 0.150 | 1.000 | |
| Geeky | 0.266 | 0.249 | 0.320 | 0.117 | 0.407 | 1.000 |
Table A3.
Pearson’s Zero-Order Correlation Coefficients from Bivariate Pairs of Cultural Scale Traits Describing Self (Simard et al. 2007).
Table A3.
Pearson’s Zero-Order Correlation Coefficients from Bivariate Pairs of Cultural Scale Traits Describing Self (Simard et al. 2007).
| Variables | Young | Long Hours | Obsessive | Assertive | Cool | Geeky |
|---|---|---|---|---|---|---|
| Young | 1.000 | |||||
| Long Hours | 0.074 | 1.000 | ||||
| Obsessive | 0.060 | 0.225 | 1.000 | |||
| Assertive | 0.044 | 0.172 | 0.325 | 1.000 | ||
| Cool | 0.351 | 0.095 | 0.123 | 0.220 | 1.000 | |
| Geeky | 0.169 | 0.148 | 0.278 | 0.118 | 0.237 | 1.000 |
Table A4.
Pearson’s Zero-Order Correlation Coefficients from Bivariate Pairs of Skill Scale Traits Describing Successful Tech Workers (Simard et al. 2007).
Table A4.
Pearson’s Zero-Order Correlation Coefficients from Bivariate Pairs of Skill Scale Traits Describing Successful Tech Workers (Simard et al. 2007).
| Variables | Highly Mathematical | Analytical | Questioning |
|---|---|---|---|
| Highly Mathematical | 1.000 | ||
| Analytical | 0.348 | 1.000 | |
| Questioning | 0.207 | 0.507 | 1.000 |
Table A5.
Pearson’s Zero-Order Correlation Coefficients from Bivariate Pairs of Skill Scale Traits Describing Self (Simard et al. 2007).
Table A5.
Pearson’s Zero-Order Correlation Coefficients from Bivariate Pairs of Skill Scale Traits Describing Self (Simard et al. 2007).
| Variables | Highly Mathematical | Analytical | Questioning |
|---|---|---|---|
| Highly Mathematical | 1.000 | ||
| Analytical | 0.472 | 1.000 | |
| Questioning | 0.179 | 0.436 | 1.000 |
Table A6.
Percent of Men and Women who have Cultural and Skill Alignment by Company.
| Company | Variables | Men | Women |
|---|---|---|---|
| Company 1 | Cultural Alignment | 51% | 37% ** |
| Skill Alignment | 55% | 50% | |
| N | 127 | 296 | |
| Company 2 | Cultural Alignment | 58% | 36% * |
| Skill Alignment | 63% | 54% | |
| N | 112 | 28 | |
| Company 3 | Cultural Alignment | 53% | 42% |
| Skill Alignment | 71% | 32% ** | |
| N | 34 | 19 | |
| Company 4 | Cultural Alignment | 62% | 50% |
| Skill Alignment | 63% | 59% | |
| N | 144 | 46 | |
| Company 5 | Cultural Alignment | 57% | 57% |
| Skill Alignment | 61% | 43% | |
| N | 44 | 14 | |
| Company 6 | Cultural Alignment | 58% | 34% *** |
| Skill Alignment | 71% | 68% | |
| N | 320 | 68 | |
| Company 7 | Cultural Alignment | 55% | 30% *** |
| Skill Alignment | 67% | 57% | |
| N | 267 | 63 |
N = 1582. Note: (standard deviation). + P < 0.10, * P < 0.05, ** P< 0.01, *** P < 0.001. Bivariate t-tests (Simard et al. 2007).
References
- Alfrey, Lauren, and France Winddance Twine. 2016. Gender-Fluid Geek Girls: Negotiating Inequality Regimes in the Tech Industry. Gender & Society 31: 28–50. [Google Scholar]
- Beede, David, Tiffany Julian, David Langdon, George McKittrick, Beethika Khan, and Mark Doms. 2011. Women in STEM: A Gender Gap to Innovation; U.S. Department of Commerce, Economics and Statistics Administration Report. Washington: U.S. Department of Commerce, Economics and Statistics Administration.
- Beilock, Sian L., and Thomas H. Carr. 2005. When High-Powered People Fail: Working Memory and ‘Choking Under Pressure’ in Math. Psychological Science 16: 101–5. [Google Scholar] [CrossRef] [PubMed]
- Blair-Loy, Mary, and Erin A. Cech. Misconceiving Merit: Consequences of the Work Devotion Schema in Academic Science and Engineering. Paper presented at the American Sociological Association Annual Meeting, Seattle, WA, USA, 20–23 August 2016. [Google Scholar]
- Cech, Erin. 2015. Engineers and Engineeresses? Self-conceptions and the Development of Gendered Professional Identities. Sociological Perspectives 58: 56–77. [Google Scholar] [CrossRef]
- Cech, Erin, Brian Rubineau, Susan Silbey, and Caroll Seron. 2011. Professional Role Confidence and Gendered Persistence in Engineering. American Sociological Review 76: 641–66. [Google Scholar] [CrossRef]
- Chang, Linchiat, and Jon A. Krosnick. 2009. National Surveys Via RDD Telephone Interviewing Versus the Internet: Comparing Sample Representativeness and Response Quality. Public Opinion Quarterly 73: 641–78. [Google Scholar] [CrossRef]
- Charles, Maria, and David B. Grusky. 2004. Occupational Ghettos: The Worldwide Segregation of Women and Men. Stanford: Stanford University Press. [Google Scholar]
- Cheryan, Sapna, Victoria C. Plaut, Paul G. Davies, and Claude M. Steele. 2009. Ambient Belonging: How Stereotypical Cues Impact Gender Participation in Computer Science. Journal of Personality and Social Psychology 97: 1045–60. [Google Scholar] [CrossRef] [PubMed]
- Cheryan, Sapna, John Oliver Siy, Marissa Vichayapai, Benjamin J. Drury, and Saenam Kim. 2011. Do Female and Male Role Models Who Embody STEM Stereotypes Hinder Women’s Anticipated Success in STEM? Social Psychological and Personality Science 2: 656–64. [Google Scholar] [CrossRef]
- Correll, Shelley J. 2001. Gender and the Career Choice Process: The Role of Biased Self-Assessments. American Journal of Sociology 106: 1691–730. [Google Scholar] [CrossRef]
- Correll, Shelley J. 2004. Constraints into Preferences: Gender, Status, and Emerging Career Aspirations. American Sociological Review 69: 93–113. [Google Scholar] [CrossRef]
- Correll, Shelley J., Cecilia L. Ridgeway, Ezra W. Zuckerman, Sharon Jank, Sara Jordan-Bloch, and Sandra Nakagawa. 2017. It’s the Conventional Thought that Counts: How Third-order Inference Produces Status Advantage. American Sociological Review. [Google Scholar] [CrossRef]
- Correll, Shelley J., and Lori Nishiura Mackenzie. 2016. The Visibility Gap. Harvard Business Review. September 13. Available online: https://hbr.org/2016/09/to-succeed-in-tech-women-need-more-visibility (accessed on 19 December 2016).
- Curtin, Richard, Stanley Presser, and Eleanor Singer. 2000. The Effects of Response Rate Changes on the Index of Consumer Sentiment. Public Opinion Quarterly 64: 413–28. [Google Scholar] [CrossRef] [PubMed]
- Davies, Paul G., Steven J. Spencer, Diane M. Quinn, and Rebecca Gerhardstein. 2002. Consuming Images: How Television Commercials that Elicit Stereotype Threat Can Restrain Women Academically and Professionally. Personality and Social Psychology Bulletin 28: 1615–28. [Google Scholar] [CrossRef]
- Diekman, Amanda B., Mia Steinberg, Elizabeth R. Brown, Aimee L. Belanger, and Emily K. Clark. 2016. A Goal Congruity Model of Role Entry, Engagement, and Exit: Understanding Communal Goal Processes in STEM Gender Gaps. Personality and Social Psychology Review. [Google Scholar] [CrossRef] [PubMed]
- Diekman, Amanda B., Elizabeth R. Brown, Amanda M. Johnston, and Emily K. Clark. 2010. Seeking Congruity Between Goals and Roles: A New Look at Why Women Opt Out of Science, Technology, Engineering, and Mathematics Careers. Psychological Science 21: 1051–57. [Google Scholar] [CrossRef] [PubMed]
- Ensher, Ellen A., Elisa J. Grant-Vallone, and Stewart I. Donaldson. 2001. Effects of Perceived Discrimination on Job Satisfaction, Organizational Commitment, Organizational Citizenship Behavior, and Grievances. Human Resource Development Quarterly 12: 53–72. [Google Scholar] [CrossRef]
- Foschi, Martha. 1996. Double Standards in the Evaluation of Men and Women. Social Psychology Quarterly 59: 237–54. [Google Scholar] [CrossRef]
- Foschi, Martha. 2000. Double Standards for Competence: Theory and Research. Annual Review of Sociology 26: 21–42. [Google Scholar] [CrossRef]
- Glass, Jennifer L., Sharon Sassler, Yael Levitte, and Katherine M. Michelmore. 2013. What’s So Special about STEM? A Comparison of Women’s Retention in STEM and Professional Occupations. Social Forces 92: 723–56. [Google Scholar] [CrossRef] [PubMed]
- Gutek, Barbara A., Aaron Groff Cohen, and Anne Tsui. 1996. Reactions to Perceived Sex Discrimination. Human Relations 49: 791–813. [Google Scholar] [CrossRef]
- Hausmann, Leslie R. M., Feifei Ye, Janet Ward Schofield, and Rochelle L. Woods. 2009. Sense of Belonging and Persistence in White and African American First-Year Students. Research in Higher Education 50: 649–69. [Google Scholar] [CrossRef]
- Heilman, Madeline E. 2001. Description and Prescription: How Gender Stereotypes Prevent Women’s Ascent up the Organizational Ladder. Journal of Social Issues 57: 657–74. [Google Scholar] [CrossRef]
- Hill, Catherine, Christianne Corbett, and Andresse St. Rose. 2010. Why So Few? Women in Science, Technology, Engineering, and Mathematics. American Association of University Women Report. Washington: American Association of University Women. [Google Scholar]
- Holbrook, Allyson L., Melanie C. Green, and Jon A. Krosnick. 2003. Telephone Versus Face-to-Face Interviewing of National Probability Samples with Long Questionnaires: Comparisons of Respondent Satisficing and Social Desirability Response Bias. Public Opinion Quarterly 67: 79–125. [Google Scholar] [CrossRef]
- Huhman, Heather R. 2012. STEM Fields and the Gender Gap: Where are the Women? Forbes. June 20. Available online: http://www.forbes.com/sites/work-in-progress/2012/06/20/stem-fields-and-the-gender-gap-where-are-the-women/ (accessed on 27 December 2012).
- Hymowitz, Carol, and Timothy Schellhardt. 1986. The Glass Ceiling: Why Women Can’t Seem to Break the Invisible Barrier that Blocks Them from the Top Jobs. The Wall Street Journal. [Google Scholar]
- Jiménez, Tomás R., and Adam L. Horowitz. 2013. When White is Just Alright: How Immigrants Redefine Achievement and Reconfigure the Ethnoracial Hierarchy. American Sociological Review 78: 849–71. [Google Scholar] [CrossRef]
- Kaiser, Cheryl R., Brenda Major, and Shannon K. McCoy. 2004. Expectations about the Future and the Emotional Consequences of Perceiving Prejudice. Personality and Social Psychology Bulletin 30: 173–84. [Google Scholar] [CrossRef] [PubMed]
- Kanter, Rosabeth Moss. 1977. Men and Women of the Corporation. New York: Basic Books. [Google Scholar]
- Keeter, Scott, Carolyn Miller, Andrew Kohut, Robert M. Groves, and Stanley Presser. 2000. Consequences of Reducing Nonresponse in a National Telephone Survey. Public Opinion Quarterly 64: 125–48. [Google Scholar] [CrossRef] [PubMed]
- Margolis, Jane, and Allan Fisher. 2002. Unlocking the Clubhouse: Women in Computing. Cambridge: Massachusetts Institute of Technology. [Google Scholar]
- Markham, William T., Scott J. South, Charles M. Bonjean, and Judy Corder. 1985. Gender and Opportunity in the Federal Bureaucracy. American Journal of Sociology 91: 129–50. [Google Scholar] [CrossRef]
- Martell, Richard F., David M. Lane, and Cynthia Emrich. 1996. Male-Female Differences: A Computer Simulation. American Psychologist 51: 157–58. [Google Scholar] [CrossRef]
- Meyersson Milgrom, Eva M., and Trond Petersen. 2006. The Glass Ceiling in the United States and Sweden: Lessons from the Family-Friendly Corner of the World, 1970 to 1990. In The Declining Significance of Gender. Edited by Francine D. Blau, Mary C. Brinton and David B. Grusky. New York: Russell Sage Foundation. [Google Scholar]
- Moss-Racusin, Corinne A., John F. Dovidio, Victoria L. Brescoll, Mark J. Graham, and Jo Handelsman. 2012. Science Faculty’s Subtle Gender Biases Favor Male Students. Proceedings of the National Academy of Sciences of the United States of America 109: 16474–79. [Google Scholar] [CrossRef] [PubMed]
- Murphy, Mary C., Claude M. Steele, and James J. Gross. 2007. Signaling Threat: How Situational Cues Affect Women in Math, Science, and Engineering Settings. Psychological Science 18: 879–85. [Google Scholar] [CrossRef] [PubMed]
- Nosek, Brian A., Mahzarin R. Banaji, and Anthony G. Greenwald. 2002. Math = Male, Me = Female, Therefore Math ≠ Me. Journal of Personality and Social Psychology 83: 44–59. [Google Scholar] [CrossRef] [PubMed]
- Podolny, Joel M. 2005. Status Signals. Princeton: Princeton University Press. [Google Scholar]
- Reskin, Barbara F., and Debra Branch McBrier. 2000. Why Not Ascription? Organizations’ Employment of Male and Female Managers. American Sociological Review 65: 210–33. [Google Scholar] [CrossRef]
- Ridgeway, Cecilia L. 2011. Framed by Gender: How Gender Inequality Persists in the Modern World. New York: Oxford University Press. [Google Scholar]
- Rivera, Lauren A. 2012. Hiring as Cultural Matching: The Case of Elite Professional Service Firms. American Sociological Review 77: 999–1022. [Google Scholar] [CrossRef]
- Shih, Margaret, Todd L. Pittinsky, and Nalini Ambady. 1999. Stereotype Susceptibility: Identity Salience and Shifts in Quantitative Performance. Psychological Science 10: 80–83. [Google Scholar] [CrossRef]
- Silva, Christine, Nancy M. Carter, and Anna Beninger. 2012. Good Intentions, Imperfect Execution? Women Get Fewer of the "Hot Jobs" Needed to Advance. Catalyst, November 21. [Google Scholar]
- Simard, Caroline, Andrea Davies Henderson, Shannon K. Gilmartin, Londa Schiebinger, and Telle Whitney. 2007. Climbing the Technical Ladder: Obstacles and Solutions for Mid-Level Women in Technology. Available online: http://gender.stanford.edu/sites/default/files/Climbing_the_Technical_Ladder.pdf (accessed on 2 May 2017).
- Spencer, Steven J., Claude M. Steele, and Diane M. Quinn. 1999. Stereotype Threat and Women’s Math Performance. Journal of Experimental Social Psychology 35: 4–28. [Google Scholar] [CrossRef]
- Stainback, Kevin, and Matthew Irvin. 2012. Workplace Racial Composition, Perceived Discrimination, and Organizational Attachment. Social Science Research 41: 657–70. [Google Scholar] [CrossRef] [PubMed]
- Steele, Claude M. 1997. A Threat in the Air: How Stereotypes Shape Intellectual Identity and Performance. American Psychologist 52: 613–29. [Google Scholar] [CrossRef] [PubMed]
- Steinpreis, Rhea E., Katie A. Anders, and Dawn Ritzke. 1999. The Impact of Gender on the Review of the Curricula Vitae of Job Applicants and Tenure Candidates: A National Empirical Study. Sex Roles 41: 509–28. [Google Scholar] [CrossRef]
- Tiedens, Laura Z., and Susan Linton. 2001. Judgment under emotional uncertainty: The effects of specific emotions on information processing. Journal of Personality and Social Psychology 81: 973–88. [Google Scholar] [CrossRef] [PubMed]
- Uhlmann, Eric Luis, and Geoffrey L. Cohen. 2005. Constructed Criteria: Redefining Merit to Justify Discrimination. Psychological Science 16: 474–80. [Google Scholar] [PubMed]
- Wei, Jenn. 2012. Why Women VCs Shouldn’t Care about the Silicon Valley Stereotype. Washington Post. August 27 Retrieved. Available online: http://www.washingtonpost.com/national/on-innovations/why-women-vcs-shouldnt-care-about-the-silicon-valley-stereotype/2012/08/27/7d9fba02-f084-11e1-b74c-84ed55e0300b_story.html (accessed on 6 December 2012).
- Weary, Gifford, Jill A. Jacobson, John A. Edwards, and Stephanie J. Tobin. 2001. Chronic and temporarily activated causal uncertainty beliefs and stereotype usage. Journal of Personality and Social Psychology 81: 206–19. [Google Scholar] [CrossRef] [PubMed]
- Winship, Christopher, and Larry Radbill. 1994. Sampling Weights and Regression Analysis. Sociological Methods and Research 23: 230–57. [Google Scholar] [CrossRef]
- Wynn, Alison T., and Shelley J. Correll. Puncturing the Pipeline: Do Technology Companies Alienate Women in Recruiting Sessions? Paper presented at American Sociological Association Annual Meeting, San Francisco, CA, USA, 16–19 August 2014. [Google Scholar]
| 1 | Our measures complement, but are distinct from, measures used by others, such as Cech and coworkers’ measure of “professional role confidence” (Cech et al. 2011) and Rivera’s measure of “fit” (Rivera 2012). |
| 2 | Research directors at the Anita Borg and Clayman Institutes recruited seven companies to participate in the study. Their recruitment strategy was designed to capture organizational variation within the broad computer and information technology industry and to focus on companies that were known to employ top technical talent. We are unable to name the companies due to promised confidentiality. At the time the survey was completed, software and hardware industry segments were the largest employers in the high-technology sector in Silicon Valley, and these industry segments constitute the company sample. Surveys were administered to employees who comprised the core Silicon Valley technical workforce at each participating company; companies defined their “core technical workforce in the Silicon Valley region” for the researchers. The vast majority of survey respondents identified their field of expertise as software development/engineering and hardware engineering. For more information about the survey methodology, see (Simard et al. 2007). |
| 3 | Some recent research indicates that low response rates are not necessarily associated with significant declines in sample representativeness (Chang and Krosnick 2009; Curtin et al. 2000; Keeter et al. 2000). For example, Chang and Krosnick (2009) found that a sample with a 25% response rate was just as representative as a 43% response rate sample. In addition, response rates have generally declined over time, and the response rates obtained today are considerably lower than those obtainable in 1980, holding budget constant over time (Chang and Krosnick 2009; Holbrook et al. 2003). |
| 4 | Because women are underrepresented in the larger tech industry, an overrepresentation in the sample facilitates analysis by gender. While some might claim sample overrepresentation requires weights, others have argued that sampling weights are not necessary in multivariate analysis if the weight is not a function of the dependent variable, and that weighting in multivariate analysis, at least with the OLS estimator, actually produces inefficient estimates (Winship and Radbill 1994). Thus, we did not include sampling weights in our analysis. |
| 5 | We also ran our analyses with multiple imputation using a multivariate normal model (models available upon request). The patterns of results remain the same. Though some findings change slightly in magnitude and/or in level of significance, our overall arguments remain unchanged. Since very few data are missing, deleting the missing cases does not change our results substantially. |
| 6 | For the “plan to switch career fields” variable described below, there is a “don’t know” answer choice, which we coded as missing. |
| 7 | We used principal-component factor analysis with varimax orthogonal rotations to derive the cultural and skill dimensions. The cultural dimension is a combination of two factors: intensive work commitment and geeky personality. We combined these factors due to their theoretical relevance to cultural perceptions of tech workers. The skill dimension is comprised of one factor. More information is available in the Appendix A. |
| 8 | The scale is constructed by dividing the sum of the question responses by the total number of questions answered. Thus, a value is created for every observation for which there is a response to at least one item (i.e., at least one variable in the scale is not missing). The summative score is divided by the number of items over which the sum is calculated. The scale value thus represents an average. |
| 9 | Because self-ratings are more complicated and nuanced than ratings of successful tech workers, they do not align as neatly with particular “types.” Thus, we prioritized obtaining a good scale (i.e., higher Cronbach’s alpha values) for the ratings of successful tech workers rather than self-ratings. Factor loadings and bivariate Pearson’s correlations of the scale items are available in the Appendix. Breakdowns by gender are available upon request. |
| 10 | We also ran models using the raw difference between individuals’ self-ratings and their ratings of successful tech workers as the dependent variable. The overall patterns are consistent with our direction-magnitude interaction models, but our models provide more specific information. We also ran models using a spline variable. Our direction-magnitude interaction models show how the difference between self-ratings and ratings of successful tech workers affects our outcome variables as the difference gets more negative for the no-alignment group and more positive for the alignment group; spline models show the effect as the difference gets more positive for both groups. Even so, the results of the spline models are largely similar to our models, with the same overall patterns. Models are available upon request. |
| 11 | Some might wonder if men rate themselves higher on all domains than women. It is worth noting in this regard that the gap between men and women’s self-ratings is considerably larger on the cultural domain than on the skill domain. Further, Correll (2001) shows that while men make higher assessments of their mathematical ability, women actually assess their verbal ability higher. This suggests that self-ratings are affected by the gender typing of the domain being considered. |
| 12 | We also examine effects by company (see Appendix A, Table A6). As the descriptive patterns do not vary substantially across organizations, and since the number of cases for some companies is small, we pool our data across company in the regression models and cluster standard errors by company. |
| 13 | Technically, the effect for those who believe they align equals the interaction coefficient combined with the absolute value coefficient. |
| 14 | While the R2 is low, our main goal is not to explain all variance in our dependent variables. Instead, we are interested in mechanisms that contribute to the gender gap. As research on the effects of stereotypes shows, even small effects can have large impacts as they cumulate over careers (Martell et al. 1996). |
| 15 | It is also possible that the direction-magnitude interaction models (with a dummy variable, absolute value and their interaction) split up the variance in alignment variables so much that it becomes hard to detect independent effects of each component of alignment. |
| 16 | In studies like this, concerns about endogeneity must also be considered. One alternative explanation for our results could be that women perceive a lack of alignment because their supervisors treat them poorly. (In other words, the direction of causality may be reversed.) However, this seems unlikely due to the construction of our alignment variables. Survey respondents were asked to rate the average successful tech worker on a number of attributes, then they rated themselves on those same attributes. Therefore, since we did not directly ask respondents to report perceptions of alignment, but rather constructed the alignment variable from their trait assessments, it seems unlikely that the causal direction could be reversed in this way. While endogeneity can never be ruled out by cross-sectional data, this particular analysis is less susceptible to such concerns due to the way the variables were constructed. |
| 17 | Furthermore, in analyses not shown, we added the identification and perception of supervisor treatment variables as independent variables to the model predicting plans to switch career fields and found that identification with the tech profession, perception that supervisor values opinion, and perception that supervisor assigns high visibility projects all significantly predict plans to switch career fields (p < 0.05). Therefore, by impacting these variables, alignment also indirectly impacts plans to switch career fields in the next 12 months. |
Figure 1.
Stereotypes Tech Workers Hold about Successful Tech Work (Simard et al. 2007). N = 1582.
Figure 1.
Stereotypes Tech Workers Hold about Successful Tech Work (Simard et al. 2007). N = 1582.
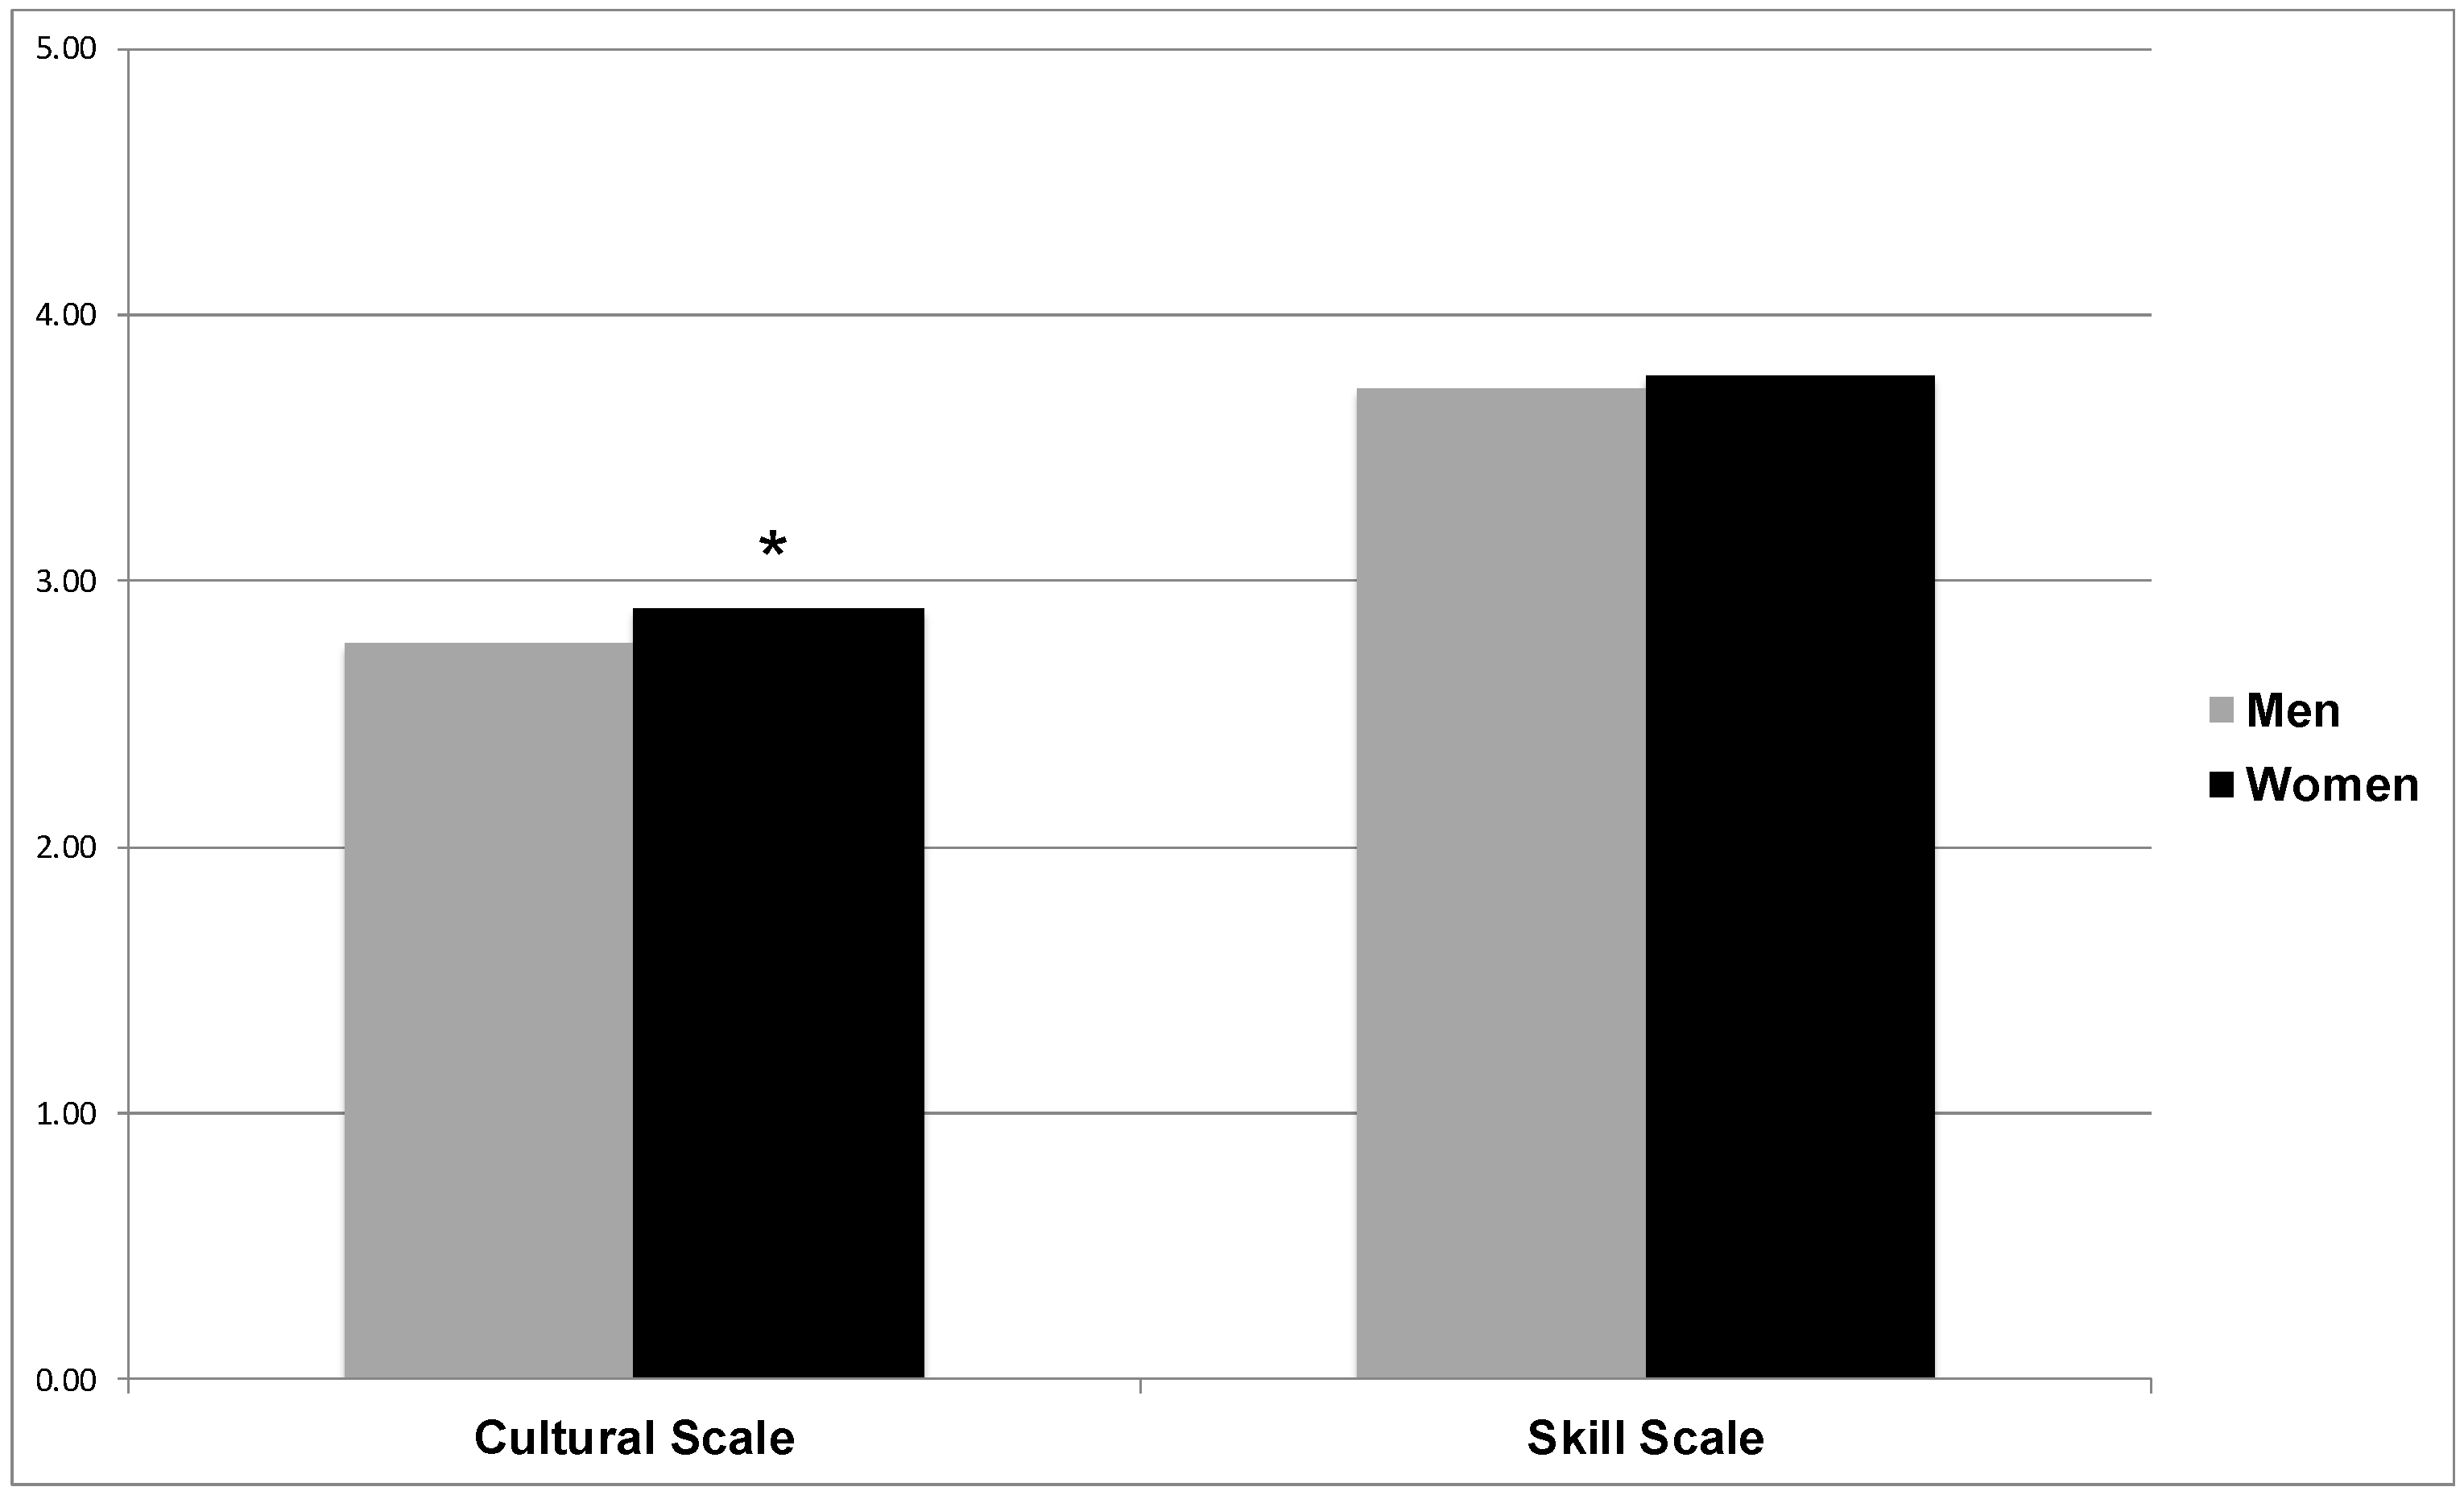
Figure 2.
How Tech Workers Rate Themselves on Cultural and Skill Dimensions. N = 1582 (Simard et al. 2007).
Figure 2.
How Tech Workers Rate Themselves on Cultural and Skill Dimensions. N = 1582 (Simard et al. 2007).

Figure 3.
Percent of Women and Men with Cultural and Skill Alignment (Simard et al. 2007). N = 1582. Note: Alignment is defined as a zero or positive gap between self-ratings and ratings of successful tech workers, and non-alignment is defined as a negative gap.
Figure 3.
Percent of Women and Men with Cultural and Skill Alignment (Simard et al. 2007). N = 1582. Note: Alignment is defined as a zero or positive gap between self-ratings and ratings of successful tech workers, and non-alignment is defined as a negative gap.

Figure 4.
Gap between Self-Ratings and Ratings of Successful Tech Workers by Direction and Gender (Simard et al. 2007). N = 1582. Note: Alignment is defined as a zero or positive gap between self-ratings and ratings of successful tech workers, and non-alignment is defined as a negative gap. The y-axis displays the average successful tech worker rating subtracted from the average self-rating for each group.
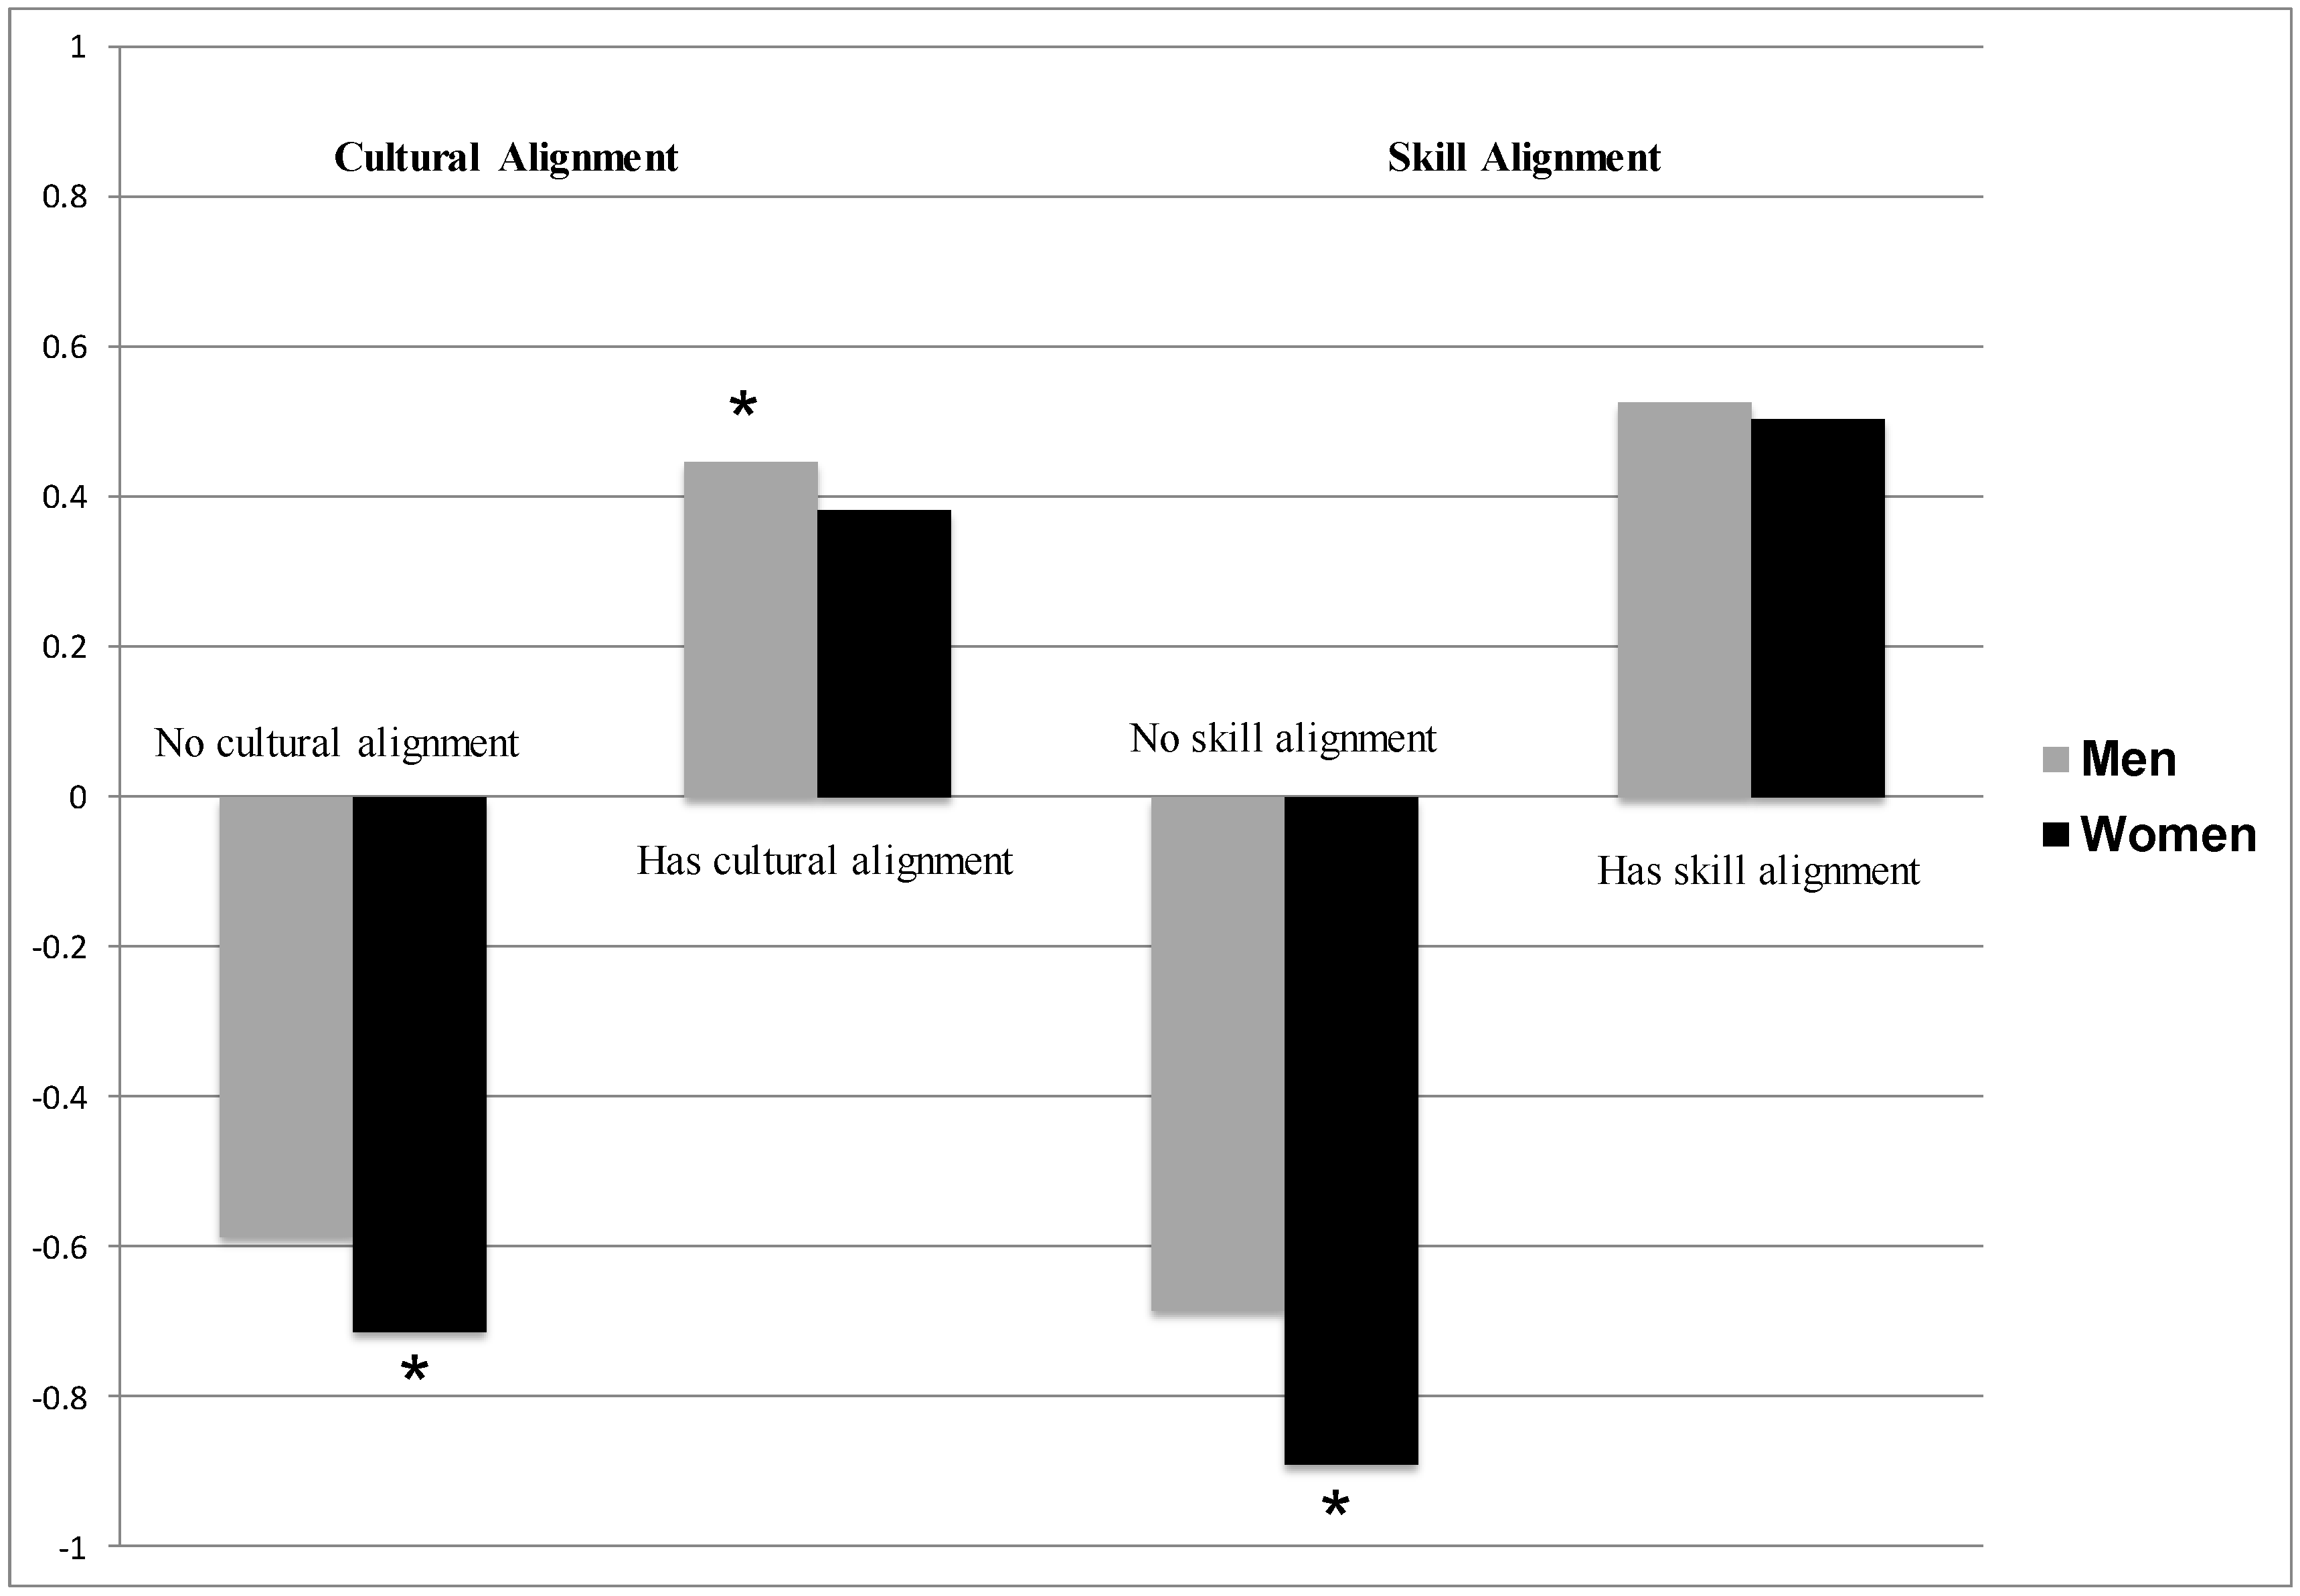
Table 1.
Means and Standard Deviations of Variables used in the Analyses of the Relationship between Alignment and Workplace Outcomes.
Table 1.
Means and Standard Deviations of Variables used in the Analyses of the Relationship between Alignment and Workplace Outcomes.
| Variables | Men | Women |
|---|---|---|
| Dependent Variables | ||
| Identify with tech profession a | 3.83 (0.95) | 3.58 *** (1.00) |
| Identify with company a | 3.40 (1.06) | 3.31 + (1.10) |
| Supervisor values opinions a | 3.91 (0.96) | 3.74 ** (0.97) |
| Supervisor assigns high visibility projects a | 3.64 (1.02) | 3.53 * (1.05) |
| Plan to switch career fields b | 1.89 (0.97) | 2.03 ** (1.01) |
| Independent Variables | ||
| Cultural Alignment (=1) | 0.57 | 0.38 *** |
| Cultural Alignment Absolute Value | 0.51 (0.40) | 0.59 *** (0.48) |
| Skill Alignment (=1) | 0.66 | 0.53 *** |
| Skill Alignment Absolute Value | 0.58 (0.54) | 0.69 *** (0.59) |
| Race | ||
| White | 0.59 (0.49) | 0.48 *** (0.50) |
| Asian | 0.36 (0.48) | 0.44 *** (0.50) |
| Other Race | 0.06 (0.23) | 0.08 (0.27) |
| Level | ||
| Low (Entry) Level | 0.20 (0.40) | 0.33 *** (0.47) |
| Mid-Level | 0.55 (0.50) | 0.57 (0.50) |
| High-Level | 0.25 (0.43) | 0.10 *** (0.30) |
| N | 1048 | 534 |
Notes: (standard deviation). + p < 0.10, * p < 0.05, ** p < 0.01, *** p < 0.001. Bivariate t-tests (Simard et al. 2007). N = 1582. a Answer choices vary from 1 (not at all descriptive/strongly disagree) to 5 (extremely descriptive/strongly agree). b Answer choices vary from 1 (definitely not) to 5 (definitely will). “Don’t know” is coded as missing.
Table 2.
Ordinary Least Squares Regression Estimates for the Effects of Cultural and Skill Alignment on Identity Outcomes for Silicon Valley Tech Workers.
Table 2.
Ordinary Least Squares Regression Estimates for the Effects of Cultural and Skill Alignment on Identity Outcomes for Silicon Valley Tech Workers.
| ID with Company | ID with Tech Profession | |||||
|---|---|---|---|---|---|---|
| Variables | Model 1 | Model 2 | Model 3 | Model 4 | Model 5 | Model 6 |
| Female (=1) | −0.143 (0.079) | −0.121 (0.078) | −0.118 (0.078) | −0.248 ** (0.051) | −0.196 ** (0.051) | −0.187 ** (0.047) |
| Asian | 0.394 *** (0.047) | 0.390 *** (0.046) | 0.382 *** (0.046) | 0.332 ** (0.073) | 0.337 ** (0.069) | 0.335 ** (0.069) |
| Other Race | 0.223 * (0.088) | 0.205 + (0.087) | 0.197 + (0.086) | 0.309 *** (0.027) | 0.294 *** (.042) | 0.292 *** (0.040) |
| Low-Level | 0.168 (0.113) | 0.158 (0.111) | 0.163 (0.116) | −0.168 ** (0.032) | −0.163 ** (0.038) | −0.159 ** (0.040) |
| High-Level | 0.090 (0.089) | 0.094 (0.092) | 0.091 (0.091) | 0.111 (0.115) | 0.090 (0.111) | 0.090 (0.111) |
| Cultural Alignment (=1 when self-rating equals or exceeds successful tech rating) | 0.134 *** (0.019) | −0.016 (0.064) | 0.163 * (0.057) | 0.061 (0.067) | ||
| Negative Cultural Self-Assessment, Magnitude (Absolute Value) | −0.216 (0.137) | −0.100 (0.111) | ||||
| Positive Cultural Self-Assessment, Magnitude (Interaction Term) | 0.239 + (0.103) | 0.189 (0.125) | ||||
| Skill Alignment (=1 when self-rating equals or exceeds successful tech rating) | −0.053 * (0.019) | 0.098 (0.070) | 0.194 *** (0.026) | 0.175 (0.112) | ||
| Negative Skill Self-Assessment, Magnitude (Absolute Value) | 0.083 (0.063) | −0.019 (0.103) | ||||
| Positive Skill Self-Assessment, Magnitude (Interaction Term) | −0.274 * (0.083) | 0.009 (0.129) | ||||
| Constant | 3.192 | 3.155 | 3.240 | 3.705 | 3.489 | 3.570 |
| R2 | 0.04 | 0.04 | 0.05 | 0.05 | 0.07 | 0.07 |
N = 1582. Note: All models cluster standard errors by company. (robust standard error). + p < 0.10, * p < 0.05, ** p < 0.01, *** p < 0.001 (Simard et al. 2007).
Table 3.
OLS Regression Estimates for the Effects of Cultural and Skill Alignment on Perceived Supervisor Treatment of Silicon Valley Tech Workers.
Table 3.
OLS Regression Estimates for the Effects of Cultural and Skill Alignment on Perceived Supervisor Treatment of Silicon Valley Tech Workers.
| Supervisor Values Opinion | Assigns High Visibility Projects | |||||
|---|---|---|---|---|---|---|
| Variables | Model 1 | Model 2 | Model 3 | Model 4 | Model 5 | Model 6 |
| Female (=1) | −0.133 * (0.052) | −0.108 + (0.050) | −0.095 (0.049) | −0.081 * (0.031) | −0.053 (0.040) | −0.046 (0.038) |
| Asian | −0.203 + (0.096) | −0.206 + (0.090) | −0.216 + (0.092) | −0.180 * (0.070) | −0.185 * (0.060) | −0.199 * (0.063) |
| Other Race | −0.077 (0.104) | −0.097 (0.104) | −0.108 (0.108) | −0.197 (0.153) | −0.222 (0.143) | −0.236 (0.146) |
| Low-Level | 0.003 (0.068) | −0.008 (0.066) | −0.002 (0.065) | 0.068 (0.042) | 0.053 (0.042) | 0.057 (0.049) |
| High-Level | 0.097 (0.071) | 0.102 (0.068) | 0.100 (0.071) | 0.115 (0.089) | 0.123 (0.091) | 0.120 (0.093) |
| Cultural Alignment (=1 when self-rating equals or exceeds successful tech rating) | 0.158 * (0.043) | −0.121 + (0.056) | 0.189 * (0.075) | −0.104 (0.095) | ||
| Negative Cultural Self-Assessment, Magnitude (Absolute Value) | −0.305 ** (0.051) | −0.346 * (0.096) | ||||
| Positive Cultural Self-Assessment, Magnitude (Interaction Term) | 0.501 ** (0.090) | 0.510 * (0.215) | ||||
| Skill Alignment (=1 when self-rating equals or exceeds successful tech rating) | −0.057 (0.048) | 0.101 (0.058) | −0.093 (0.076) | 0.175 * (0.069) | ||
| Negative Skill Self-Assessment, Magnitude (Absolute Value) | 0.087 + (0.043) | 0.158 * (0.051) | ||||
| Positive Skill Self-Assessment, Magnitude (Interaction Term) | −0.313 *** (0.043) | −0.492 ** (0.093) | ||||
| Constant | 3.957 | 3.910 | 4.053 | 3.672 | 3.630 | 3.751 |
| R2 | 0.02 | 0.03 | 0.05 | 0.01 | 0.02 | 0.06 |
N = 1582. Note: All models cluster standard errors by company. (robust standard error). + p < 0.10, * p < 0.05, ** p < 0.01, *** p < 0.001 (Simard et al. 2007).
Table 4.
OLS Regression Estimates for the Effects of Cultural and Skill Alignment on Silicon Valley Tech Workers’ Plans to Switch Career Fields.
Table 4.
OLS Regression Estimates for the Effects of Cultural and Skill Alignment on Silicon Valley Tech Workers’ Plans to Switch Career Fields.
| Variables | Model 1 | Model 2 | Model 3 |
|---|---|---|---|
| Female (=1) | 0.108 (0.077) | 0.115 (0.070) | 0.109 (0.071) |
| Asian | 0.102 (0.063) | 0.102 (0.061) | 0.107 (0.064) |
| Other Race | 0.096 (0.148) | 0.092 (0.162) | 0.101 (0.159) |
| Low-Level | 0.008 (0.066) | 0.007 (0.073) | 0.006 (0.073) |
| High-Level | −0.126 (0.067) | −0.128 (0.067) | −0.126 (0.068) |
| Cultural Alignment (=1 when self-rating equals or exceeds successful tech rating) | 0.033 (0.085) | 0.195* (0.079) | |
| Negative Cultural Self-Assessment, Magnitude (Absolute Value) | 0.205 *** (0.034) | ||
| Positive Cultural Self-Assessment, Magnitude (Interaction Term) | −0.287* (0.103) | ||
| Skill Alignment (=1 when self-rating equals or exceeds successful tech rating) | 0.010 (0.057) | −0.091 (0.123) | |
| Negative Skill Self-Assessment, Magnitude (Absolute Value) | −0.086 (0.082) | ||
| Positive Skill Self-Assessment, Magnitude (Interaction Term) | 0.183 (0.127) | ||
| Constant | 1.878 | 1.854 | 1.781 |
| R2 | 0.01 | 0.01 | 0.02 |
N = 1582. Notes: All models cluster standard errors by company. (robust standard error). + p < 0.10, * p < 0.05, ** p < 0.01, *** p < 0.001 (Simard et al. 2007).
© 2017 by the authors. Licensee MDPI, Basel, Switzerland. This article is an open access article distributed under the terms and conditions of the Creative Commons Attribution (CC BY) license (http://creativecommons.org/licenses/by/4.0/).
Share and Cite
MDPI and ACS Style
Wynn, A.T.; Correll, S.J. Gendered Perceptions of Cultural and Skill Alignment in Technology Companies. Soc. Sci. 2017, 6, 45. https://doi.org/10.3390/socsci6020045
AMA Style
Wynn AT, Correll SJ. Gendered Perceptions of Cultural and Skill Alignment in Technology Companies. Social Sciences. 2017; 6(2):45. https://doi.org/10.3390/socsci6020045
Chicago/Turabian StyleWynn, Alison T., and Shelley J. Correll. 2017. "Gendered Perceptions of Cultural and Skill Alignment in Technology Companies" Social Sciences 6, no. 2: 45. https://doi.org/10.3390/socsci6020045
Note that from the first issue of 2016, this journal uses article numbers instead of page numbers. See further details here.