Assessing Trust and Effectiveness in Virtual Teams: Latent Growth Curve and Latent Change Score Models

1
Department of Psychology, University of South Florida; Tampa, FL 33620, USA
2
State Farm Mutual Automobile Insurance Company, Atlanta, GA 30346, USA
3
Air Force Research Laboratory, Airman Systems Directorate; Dayton, OH 45433, USA
*
Author to whom correspondence should be addressed.
Soc. Sci. 2017, 6(3), 87; https://doi.org/10.3390/socsci6030087
Submission received: 5 June 2017
/
Revised: 22 July 2017
/
Accepted: 28 July 2017
/
Published: 2 August 2017
Abstract
:Trust plays a central role in the effectiveness of work groups and teams. This is the case for both face-to-face and virtual teams. Yet little is known about the development of trust in virtual teams. We examined cognitive and affective trust and their relationship to team effectiveness as reflected through satisfaction with one’s team and task performance. Latent growth curve analysis reveals both trust types start at a significant level with individual differences in that initial level. Cognitive trust follows a linear growth pattern while affective trust is overall non-linear, but becomes linear once established. Latent change score models are utilized to examine change in trust and also its relationship with satisfaction with the team and team performance. In examining only change in trust and its relationship to satisfaction there appears to be a straightforward influence of trust on satisfaction and satisfaction on trust. However, when incorporated into a bivariate coupling latent change model the dynamics of the relationship are revealed. A similar pattern holds for trust and task performance; however, in the bivariate coupling change model a more parsimonious representation is preferred.
Keywords:
trust; teams; latent growth; latent change scores; distributed teams; cognitive; affective1. Introduction
Virtual teams have been the focus of increasing research due to their prevalence in organizations. Even though these types of teams have existed for some time, we lack a clear understanding of factors related to their effectiveness. There are many advantages to virtual teams (LeMay 2000); however, available research suggests that virtual team performance is often substandard to the performance observed in face-to-face teams (Anderson et al. 2007; Thompson and Coovert 2006). One reason for this inferiority is that those constructs necessary for effective teamwork, such as trust, cohesion, and shared understanding are under-developed in virtual teams because of the quality of technology-mediated communications. There are fewer and lower quality communication cues exchanged during technology-mediated compared to face-to-face interactions (Daft and Lengel 1986). Work in a virtual environment, however, is a reality in today’s workplace. Thus, in order for organizations to have fully functional distributed teams we must have an understanding of the nature and operation of team constructs and processes in the virtual environment.
Trust is one of the critical constructs associated with team success. Its development is particularly challenging for virtual teams because team members are often dispersed across locations and they lack informal, non-task related interactions, and it is those interactions that facilitate and lead to the development of trust (Cohen and Gibson 2003). Lack of trust in a team can be problematic since it can lead to higher costs, lower team commitment, less willingness to work with the team, misinterpretation of information, and lack of open communication—especially about problems facing the team (Wilson et al. 2006). Trust is therefore closely linked to successful team performance, making it important to understand how we can build and enhance trust between individuals in technology-mediated environments.
The goal of the present study is to examine, within virtual teams, how trust changes over time, the impact team effectiveness has on those changes, and if there is a reciprocal influence between these constructs. The majority of trust research has examined the important relationships trust has with other constructs of interest, helping us answer the question of why trust is important. With this study we look to build on that work and answer the question of how trust develops in a virtual environment, and to quantify the development of trust over time through the estimation of the latent change in trust within team members as they interact over time.
A main issue with trust research in virtual teams is that studies rarely examine trust as a dynamic construct. Trust can grow or diminish over time, and those changes impact outcomes of interest. Trust researchers generally agree that the consequences of an interaction will have an effect on subsequent trust (e.g., (Mayer et al. 1995; Jarvenpaa and Leidner 1999; McAllister 1995)), with positive/satisfactory outcomes facilitating an increase in trust, while negative/unsatisfactory outcomes hamper and even decrease levels of trust. However, this bidirectional relationship between trust and its outcomes is rarely captured. In order to understand the development of trust over time, and the impact of trust on outcomes of interest, we propose a model of trust development that takes the synergistic nature of the relationship into account. We position existing findings within Social Information Processing Theory (SIP; Walther 1992) and argue for a bi-directional relationship between trust and two constructs of interest: satisfaction with one’s team and team performance. Specifically, we examine trust development and how it changes with team performance and separately trust development and how it changes with satisfaction with the team. Understanding the dynamic process of trust development will aid in implementing processes, procedures, and tools that support the development of trust in distributed teams.
Due to the scope of the trust literature, we provide only a selective review the theoretical background of trust and its development within individuals in teams. This review is necessary to provide a context for our work.
1.1. What Is Trust?
Research describes trust as essential in relationships that require collaboration and cooperation (Rusman et al. 2010). For example, trust is central to building alliances (Smith and Barclay 1997), is key to group participation (Bandow 2001), and facilitates information sharing (Jones and George 1998). Furthermore, the presence of trust is necessary in situations involving risk. Trust is a heuristic, which allows participation in risky behaviors without a constant engagement in risk-benefit analyses pertaining to the situation (Riegelsberger et al. 2003). For trust to be a required component of an interaction, two conditions need to be met: (1) one of the participants in the interaction needs to understand that the situation involves risk; and (2) participation in the situation is incentivized (Mayer et al. 1995). Moreover, trust is positively related to satisfaction, performance, and commitment as well as negatively related to stress (Costa et al. 2001). Trust is critical to effective communication processes, with low levels of trust leading to negative consequences. An example is an increased likelihood of ambiguous information being interpreted more negatively (Salas et al. 2005).
The importance of trust is indisputable; its genesis, however, is a source of debate. A review of the interpersonal trust literature by Lewicki et al. (2006) delineates two general methods for studying trust. One is a behavioral approach, which describes trust as a rational-choice behavior often evaluated by observing cooperation behaviors; the second is a psychological perspective which examines interpersonal states, expectations, attitudes, and dispositions. Within each method, trust is a dynamic construct whereby it can increase, decrease, or remain unchanged based on the interaction and outcomes.
From the psychological perspective, there are three major conceptualizations of trust. First, trust can be a unidimensional construct whereby it ranges from extreme distrust to high trust (e.g., (McAllister 1995)). Secondly, trust is viewed as a two-dimensional construct with trust and distrust as separate dimensions, allowing for a person to range on each (thus a person can simultaneously trust and distrust a target; (e.g., (McAllister 1995)). Thirdly, trust has been conceptualized as a transformational construct that can change quantitatively and also qualitatively over time (e.g., (Lewicki and Bunker 1996; Lewicki et al. 2006)).
In the present work, we examine trust as a unidimensional psychological construct and employ the theoretical perspective advanced by McAllister (1995). We chose this conceptualization for three reasons: its intuitive theoretical development, the strong empirical evidence supporting its measurement, and the goals of our study. As defined by McAllister (1995), trust is “the extent to which a person is confident in, and willing to act on the basis of, works, actions and decisions of another” (p. 25). To capture the role of trust in an organizational setting, McAllister (1995) proposed a two-factor model of trust: cognition-based trust and affect-based trust. Cognition-based trust is derived from knowledge the trustor possessed about the entity to be trusted (trustee). Affect-based trust captures the emotional ties between the trustor and the trustee. This two-component model of trust has received strong empirical support (e.g., (Webber 2008; Wilson et al. 2006)) and has become very influential in the field of trust research. Moreover, a recent review by McEvily and Tortoriello (2011) of the measurement of trust identified that the McAllister (1995) scale is one of the most replicated trust measures, further supporting our use of this conceptualization and measurement.
1.2. The Importance of Trust in Virtual Teams
When task completion involves collaboration among individuals, trust among those individuals is essential. Thus, trust is a central construct of interest when examining the performance and effectiveness of teams, both face-to-face and virtual. In the case of virtual teams there is an additional risk imposed by the environment. Computer-mediated environments are considered to be of higher risk than face-to-face due to the limited interaction among team members and the reduced amount of information exchanged during the interaction owing to the technological medium (Riegelsberger et al. 2003).
A virtual team is one whose members are geographically or temporally dispersed. Individuals in virtual teams communicate exclusively via technology, as they are unable to engage in direct face-to-face interactions (Cohen and Gibson 2003). Most work teams fall on a continuum of virtuality (Kirkman and Mathieu 2005); individuals in these teams use technology in varying degrees in order to accomplish work tasks. On the low virtuality end of the continuum, teams are primarily face-to-face and use technology only occasionally, while on the high virtuality end teams communicate exclusively via technology and never meet face-to-face. In the work described here our focus is on high virtuality teams, where the interaction between team members is exclusively through technology. We refer to these teams as virtual teams.
Organizations have identified several positive aspects to virtual teams, including greater flexibility in scheduling and superior access to a diverse workforce (LeMay 2000). Despite these positive characteristics, there can be downsides. For example, empirical research suggests that virtual team performance can be inferior to the performance of face-to-face teams (Thompson and Coovert 2006). Additionally, virtual teams take longer to complete a task, team members experience more misunderstandings, and more time is spent clarifying ideas (Anderson et al. 2007).
The drawbacks of virtual teams have been attributed to characteristics of the environment. Participants in a computer-mediated environment often lack the time and the informal interaction needed to establish personal relationships, resulting in lower levels of trust between team members. Additionally, technology-mediated environments do not allow for the transmission of the same quantity and quality of communication cues, as do face-to-face interactions. The resulting degradation of the information communicated between team members further contributes to lower levels of understanding and trust (Daft and Lengel 1986). Empirical results support this perspective. MacDonnell et al. (2009) compared performance and cohesion in face-to-face and video conferencing teams. Their results indicated that even though there was no significant difference in performance between the two types of teams, team cohesion ratings for video conferencing teams were significantly lower than face-to-face teams. The fact that video conferencing teams performed on the same level as face-to-face teams is likely because video conferencing team members could exchange task relevant information as effectively over the video conferencing medium as could be done in the face-to-face format. The differences in cohesion perception, however, suggest that even though the interactions are similar, there are still disparities occurring in terms of team processes (MacDonnell et al. 2009). Similar differences in team process were observed by Wilson et al. (2006) for trust and cooperation. Additionally, Zornoza et al. (2009) demonstrate that trust climate in a group moderates the relationship between virtuality level and the effectiveness of the group. Finally, an additional and important finding is provided by Wilson et al. (2006) who demonstrate that even one face-to-face interaction between virtual team members can mitigate the decrement introduced by technology and elevate trust and cooperation up to levels occurring in face-to face teams.
Face-to-face and virtual teams are frequently examined as two distinct and separate entities. Rusman et al. (2010) proposed an integrated view of the trust formation process in both co-located and virtual project teams. These authors stated the development of trust in virtual teams is especially challenging because there is rarely an expectation that collaboration would continue in the future, reducing the necessity for teammates to behave in a trustworthy manner. Additionally, virtual team members often lack the information necessary to evaluate each other’s trustworthiness. For example, during a typical interaction, teammates make a trustworthiness assessment of a trustee. This includes an estimate of the trustworthiness characteristics of benevolence, competence, and integrity (Mayer et al. 1995). If information on these characteristics is not available, then participants in a face-to-face interaction would base their assessment on available non-relevant cues such as physical appearance and body language. Participants in technology-mediated interactions, however, do not have access to many types of trust cues concerning a target trustee. This makes establishing an initial level of trust especially challenging. As described by Rusman et al. (2010), once an initial assessment of trust is performed, the process of further trust development is a cyclical one. First, information is attended to. Secondly, based on that information and the context of the interaction, the trustor makes a subsequent trustworthiness assessment and acts accordingly. Thirdly, the outcome of the interaction is incorporated with the rest of the available information, a new trust assessment is made, and another action is taken based on that trust assessment thereby continuing the cycle.
With an understanding of the process whereby trust develops in the individuals in a team and how it can change over time, we now consider the relationship between trust and outcome variables important to teams. Two important team outcome variables are satisfaction with one’s team and the performance of one’s team.
1.3. Trust and Satisfaction
Based on the idea that one’s perceptions of both dispositions and observed behaviors comprise trust, Costa et al. (2001) examine the effect of trust on task performance, satisfaction, relationship commitment, and stress in face-to-face teams. Their results indicated that both trustworthiness perceptions and cooperation behaviors play a major role in an assessment of trust in a target trustee. They demonstrated trust was positively related to perceived team satisfaction and commitment, task performance, and negatively related to stress (Costa et al. 2001) and continuance commitment (Costa 2003).
This relationship between trust and satisfaction holds in a virtual environment as well. Schiller et al. (2014) examined the effect of institutional boundaries on trust in virtual teams. They examined trust as a one-component concept (e.g., (Jarvenpaa and Leidner 1999; Mayer et al. 1995)) and demonstrated that team trust is positively associated with two aspects of satisfaction—satisfaction with the team process and satisfaction with the team outcome.
Taken together these findings suggest that team satisfaction is impacted by trust regardless of the communication environment in which the team operates (face-to-face vs. virtual). It is important to consider this relationship between trust and satisfaction, since satisfaction with the interaction and its outcome could determine the trustworthiness assessment of the trustee for a subsequent interaction (Mayer et al. 1995). This calls for a longitudinal design in order to determine the initial trust to satisfaction link, followed by a quantification of the satisfaction to trust influence.
1.4. Trust and Performance
Trust in face-to-face teams has been determined to have a direct positive influence on performance, satisfaction, and organizational citizenship behaviors (Dirks and Ferrin 2001). These results have been supported at both the individual (e.g., (Costa 2003)) and team (e.g., (De Jong and Elfring 2010; Palanski et al. 2011)) levels. Moreover, prior performance has been shown to have an influence on trust (Walther 1992; McAllister 1995; Webber 2008), supporting a bi-directional relationship between trust and performance.
The relationship between trust and performance in virtual teams, however, is less definitive. Some studies have found a positive relationship between the two (e.g., (Altschuller and Benbunan-Fich 2010)), while others have found no relationship (e.g., (Aubert and Kelsey 2003)).
Altschuller and Benbunan-Fich (2010) examined the communication process variables that affect trust and performance in virtual teams. Altschuller and Benbunan-Fich speculate that interaction experiences such as self-disclosure, and interpersonal perceptions such as virtual co-presence (one’s subjective feeling that an environment is shared with virtual counterparts), will positively relate to both team trust and team performance. To explore this hypothesized relationship, they examined group-level trust in short-lived virtual teams. Their results demonstrate that trust fully mediates the relationship between virtual co-presence and team performance, supporting the notion that trust has a positive relationship with team performance in virtual environments.
Extending the Altschuller and Benbunan-Fich (2010) findings by examining real-world, long term distributed teams, Peters and Karren (2009) studied the impact of team trust on team performance in a virtual context. Their results demonstrate a strong relationship between team trust and perceived team performance, paralleling the earlier findings from co-located teams.
To further specify the mechanisms that take place for trust development and thereby enhance performance in virtual teams, Crisp and Jarvenpaa (2013) assessed two components of trust: trusting belief and normative action. Trusting belief is a cognitive element and captures the positive expectations of the team’s trustworthiness. Normative action, on the other hand, is a behavioral component and involves “setting and monitoring performance norms in virtual teams” (p. 47). They found that early trust helps the team engage in normative actions, which further help facilitate the development of trust, which in turn has a positive effect on team performance.
Summary
We see from literature reviewed in the above two sections that trust is closely related to satisfaction with one’s team and also team performance. Initial levels of trust influence satisfaction with one’s team and also influence the team’s performance. Subsequently, satisfaction and performance are likely to influence later levels of trust. Thus, it is important to examine and quantify these hypothesized reciprocal relationships as they evolve over time.
1.5. Trust Development in a Virtual Environment—A Proposed Model and Hypotheses
The model we propose builds upon findings in the existing literature about the trust-performance relationship and situates them within the framework of Social Information Processing theory (SIP; Walther 1992). According to SIP theory, once team members have worked together for a sufficient amount of time, they will start communicating non-task relevant information; this type of information is necessary for the development of affect-based trust. Indeed Wilson et al.’s (2006) work supports this postulation demonstrating that given enough time, members of virtual teams can reach the same levels of trust and cooperation as their face-to-face counterparts. We chose SIP theory to guide our research as our interest is in virtual teams with a relatively short time together. Other approaches, such as media naturalness theory (DeRosa et al. 2004) should be investigated if the virtual teams have a longer duration.
Researchers have been urged to examine team processes in a longitudinal manner, within task-episodes consisting of concrete inputs and outputs (Jarvenpaa et al. 2004; LePine et al. 2008). This type of episodic approach lends itself well to the study of how trust and team outcomes (e.g., satisfaction, performance) develop over time as a function of each other. It is possible that the relationships between trust and its outcomes vary depending on the amount of time team members have spent together. Examining the development of these two constructs by utilizing the task-episode approach will allow for the examination of such possibilities.
We propose that trust and its outcomes, specifically satisfaction with one’s team and the performance of the team, will develop in such a way that changes in one will influence the other. We anticipate that both within and between construct relationships will drive changes in trust. Intra-construct relationships are defined by the established level of trust (e.g., Trust at time 1), and how quickly trust is changing (e.g., the rapidity of trust development as specified by its slope). Inter-construct relationships during a particular task episode will be influenced by trust and in turn will influence trust (Walther 1992; McAllister 1995). Thus, trust will influence satisfaction with one’s team, which in turn will influence the subsequent level of trust. This type of model is referred to as a bivariate coupling model, where trust is coupled to satisfaction, which in turn is coupled to the subsequent level of trust. It is anticipated that for each trust type, a bivariate coupling model will fit the data better than either of two simpler models, see hypotheses 4a and 4b. One simpler model is defined by trust influencing satisfaction with no reciprocal influence of satisfaction on trust and the second simpler model has satisfaction influencing trust, with no reciprocal influence of trust on satisfaction.
It is anticipated the same type of relationships will hold between each type of trust and team performance. Specifically we anticipate that for each type of trust and performance a bivariate coupling model will better explain the relationships in the data better than either of two simpler models, see hypotheses 5a and 5b. One simpler model has trust influencing performance, but no reciprocal influence of performance on trust. The second simpler model has performance influencing trust but no reciprocal influence of trust on performance.
A specific prediction as to the direction of the above-described relationships is less clear. Social Information Processing theory stipulates that given successful performance, trust will increase (Walther 1992). If teams are generally successful in achieving their goals, this success will propagate trust development, which will influence performance and satisfaction, resulting in positive relationships. If team performance is not successful, it will have (1) a negative effect on trust (trust will decrease); or (2) no effect (trust will not change), with relationships being negative or non-significant, respectively.
In terms of trust development, it is expected the two components of trust, cognition- and affect-based, will follow different developmental trajectories. Based on prior research (McAllister 1995; Webber 2008; Kuo and Yu 2009) we anticipate that cognition-based trust will be the first to develop as team members base it on task relevant information exchanged. As team members work together and cognition-based trust continues to grow, affect-based trust will emerge based on the established cognition-based trust, and the exchange of relational information. Therefore, we expect to replicate existing findings:
Hypothesis 1.
Affect-based trust will take longer to develop than cognition-based trust.
Furthermore, it is assumed the growth trajectory of cognitive trust is linear; although this has yet to be empirically tested. Since cognitive trust develops first, followed by affective trust, this implies the latent growth of affective trust is non-linear. We will empirically test each assumption via latent growth modeling.
Building on what we know so far about the development of trust in both virtual and face-to-face teams, we propose a dynamic model of trust development. The model stipulates trust development and team outcomes are closely connected to each other and they should be studied together. This is especially true in teams such as ours where task interdependence is high (Alge et al. 2003). Methodologically, the model is a Latent Change Score (LCS) model (McArdle 2009; Ferrer and McArdle 2010; Geiser 2013) and is theoretically positioned within Social Information Processing theory (Walther 1992). Based on SIP theory, interactions between team members influence the development of trust within each individual. Thus, it is expected that if prior interactions were successful, trust would increase within each individual; if they were not, it would not change or it might even decrease.
It is important to point out that latent change score models operate by estimating the amount of the latent construct of interest (e.g., trust) within each individual. This involves estimating the factor scores of the construct for each individual at each point in time (e.g., task episode). The manner in which this is done is to constrain the measurement models factor loading and intercepts so the observed changes are a function of the change in the latent constructs, not due to changes in the measurement scales. See McArdle (2009) Ferrer and McArdle (2010) and Geiser (2013) for details.
Therefore, based on the proposed model it is expected that:
Hypothesis 2.
Affective trust: A latent change score model with strong factorial invariance will fit better than a less restrictive autoregressive model.
Hypothesis 3.
Cognitive trust: A latent change score model with strong factorial invariance will fit better than a less restrictive autoregressive model.
Hypothesis 4a.
A bivariate coupling model linking affective trust and satisfaction will explain the relationships in the data better than either of two simpler models.
Hypothesis 4b.
A bivariate coupling model linking cognitive trust and satisfaction will explain the relationships in the data better than either of two simpler models.
Hypothesis 5a.
A bivariate coupling model linking affective trust and performance will explain the relationships in the data better than either of two simpler models.
Hypothesis 5b.
A bivariate coupling model linking cognitive trust and performance will explain the relationships in the data better than either of two simpler models.
To ease discussion, we use the term team effectiveness as defined by the combination of team performance and satisfaction with one’s team. It is expected that when team effectiveness is high there will be an increase in trust from an initial point to a subsequent point in time (e.g., Time 1 to Time 2). If effectiveness levels are low, as when a team is performing poorly, there will be no change or even a decrease of trust from an initial to a subsequent point (e.g., Time 2 to Time 3).
2. Methodology
2.1. Participants
Two hundred and ninety seven (N = 297) participants took part in the study, composing a total of 99 teams. All teams consisted of three participants. The final sample was 76% female with a mean age of 21.22 years (SD = 4.21). Participants identified themselves as: Caucasian, 45%; Black, 13%; Hispanic, 19%; Other 18%; and 5% did not report their ethnicity. Participants were undergraduate students at a large southeastern research university and were incentivized to participate in the study by receiving class credit. The Institutional Review Board (IRB) approved the study and treatment of subjects. The IRB strictly adheres to the guidelines of the Declaration of Helsinki and the National Institutes of Health regarding the ethical treatment of research participants.
2.2 Materials
2.2.1. Search and Rescue Task
A search and rescue task running on the Distributed Dynamic Decision-making, DDD 4.1 simulation engine (Aptima, Inc., Woburn, MA, USA), was utilized for this study. The task required team members to work together by sharing information and resources in order to complete a search and rescue mission. Each team member possessed a limited set of resources (medical, mechanical, and navigational), with the distribution of those resources being the same across team members. Based on prior task calibration, the total available resources was sufficient to complete each mission. Team members used their resources to accomplish tasks necessary to facilitate mission completion. The tasks included: find and rescue a lost party, repair a communications antenna, and recover a lost item (e.g., a UAV). To evaluate performance, each participant received points for completing certain actions. Actions include uncovering mission critical information, fixing broken equipment to facilitate further movement, and helping other parties (team mates) along the way.
Team members communicated with one another using a built-in synchronous text-based chat tool. This allowed for the exchange of unique information, coordination of tasks, and discussions of whether to expend resources on activities. The content of those chat logs was not analyzed for this study.
Each team consisted of four individuals, with three members (action members) being responsible for accomplishing the task at hand, and a fourth member (resource member) conveyed external information and provided extra resources when requested. We attempted to staff the four roles with research participants, but in cases when only three arrived for the study, a research assistant filled the role of the resource member. The use of a research assistant for the resource team member was deemed appropriate due to the nature of the role. Team performance was determined by the actions of the three action members; the influence of the resource member on overall team performance was negligible.
Each team completed three different missions. The order of the missions was counterbalanced.
2.2.2. Team Trust
Team trust was assessed using the trust scale developed by McAllister (1995). The scale determined trust on two dimensions—affect-based trust and cognition-based trust (Cronbach’s α = 0.8–0.9 and α = 0.84–0.93, respectively). Both cognition- and affect-based trust was assessed with four items targeting trust in one’s teammates. Participants indicated their responses on a 5-point Likert scale.
2.2.3. Team Satisfaction
Team satisfaction was assessed using a team satisfaction scale adapted from Lancellotti and Boyd (2008). The scale contained three items, which assessed individual desire to be a part of the team (Cronbach’s α = 0.85–0.88). Respondents had to indicate their level of agreement on a 7-point Likert scale.
2.2.4. Performance
Each individual in the team received a score based on the number of tasks completed (e.g., read a seismic monitor, repaired a mechanical device, provided medical assistance). A team score was derived based on the sum of the three action members’ scores.
2.3. Procedure
Participants were recruited via a university online recruiting system and signed up for a session of their choice. Interaction between the participants prior to the study was minimized. Once participants arrived in the lab for the study, they completed a consent form that outlined the assessments and the task. After consent was obtained the participants completed the first trust assessment (baseline). Then, participants watched a 10-min training video covering functionality of the computer-simulation and the role of each participant. Following the training video participants completed a demographic survey and a training mission. The training mission lasted approximately 15 min and enabled training to competency on task actions. Once training was completed, the first mission commenced. The participants had 40 min to complete the mission. The majority of teams utilized all the allotted time. Upon mission completion or when time ran out, participants filled out the team satisfaction assessment. The measurement period was terminated once the participants completed the satisfaction survey. The second measurement period then commenced. Participants filled out the second trust assessment (Time 1) followed by participating in the second mission and subsequently completing the team satisfaction survey. The third measurement period was identical to the second, with trust assessment (Time 2), task performance, and satisfaction measurement. At the end of the third measurement period the participants filled out the trust assessment (Time 3) one last time, then they were debriefed and thanked for their participation. (The McAllister (1995) scales are readily available in the literature. Two items from the scale measuring satisfaction with teammates (Lancellotti and Boyd (2008) are: 1. My teammates approach the mission with professionalism and dedication. 2. I can rely on my teammates not to make my job more difficult by careless work. We are happy to provide all scales upon request.)
2.4. Analysis Strategy
Below we test a series of models with varying degrees of freedom. Because degrees of freedom are linked to power, we are conservative and our sample size results in power in excess of 0.90 for all models (MacCallum et al. 1996).
To examine the trajectory of trust development we utilize Latent Growth Curve Modeling (LGCM), since it allows for the assessment of a specific type of change over time, such as linear or quadratic. Latent Growth Curve Modeling is advantageous as it corrects for random measurement error, thereby allowing for estimation of interindividual differences in true intraindividual change in trust over time.
To examine the dynamic trust-satisfaction and trust-performance relationships we employ a Latent Change Score (LCS) modeling technique. The application of a LCS model is preferred to other modeling approaches for several reasons. First, as a structural equation model, it allows for the study of latent-variable and measurement-variable (indicator) relationships. Secondly, by using LCS modeling we can examine possible sources of changes in the constructs of interest. Thirdly, LCS models include coupling parameters that capture the time-dependent effect of one construct on the change of another, thereby allowing for the examination of dynamic processes (McArdle 2009). Latent change models take a different approach from autoregressive models in that change is measured directly through latent difference variables (McArdle and Hamagami 2004; Raykov 1993). To test the proposed models, we followed the recommendations in Geiser (2013) and McArdle (2009):
- (1)
- Examine a confirmatory factor model reflecting the measurement of the construct over occasions. Examine factor intercorrelations to assess (1) latent state (intercorrelations close to 1.0); (2) latent state trait (small to medium intercorrelations); or (3) an autoregressive model (decreasing intercorrelations over time) (Geiser 2013, p. 84).
- (2)
- Examine an autoregressive model in which the temporal sequence is preserved.
- (3)
- Examine an indicator specific latent variable model that accounts for specific (non-random) indicator variance.
- (4)
- Examine a model involving invariant factor loadings.
- (5)
- Examine a full latent change model.
3. Results
3.1. Latent Growth Curve Analysis: Test of Hypothesis 1
Based on a review of the literature, our hypothesis (H1) regarding the change in trust among individuals is that affective trust takes longer to develop, so we predict a linear growth model will not fit over all sessions, but will fit the latter segments (once cognitive trust is established). Since cognitive trust develops first it is hypothesized to follow a linear growth pattern. To test this we conducted second-order latent growth curve modeling.
3.1.1. Affective Trust
Fit of a linear growth curve model to the four time points for affective trust is quite poor; Χ2 (115) = 424.216, p < 0.001, RMSEA = 0.095, CFI = 0.907, TLI = 0.903, SRMR = 0.125. The growth process for affective trust is significantly different from zero: MINTERC = 3.085, z = 55.675, p < 0.001. There is also significant variability in the initial latent scores, VarINTERC = 0.430, z = 5.731, p < 0.001. The mean for the latent slope factor is significantly different from zero, indicating trust increases over time, MLINEAR = 0.209, z = 10.684, p < 0.001. The slope factor variance is also significant, VarLINEAR = 0.044, z = 3.23, p < 0.001, indicating significant variability in the slopes of the individual growth curves; thus over time affective trust is not increasing to the same extent in all team members.
Given that affective trust is hypothesized to emerge later than cognitive, we fit a second order linear growth model to the last three time points (removing baseline from the above analysis). Fit of the linear growth model is quite good, Χ2 (58) = 136.903, p < 0.001, RMSEA = 0.068, CFI = 0.970, TLI = 0.966, SRMR = 0.047. The growth process for trust is significantly different from zero: MINTERC = 3.203, z = 51.654, p < 0.001. There is also significant variability in the initial latent scores, VarINTERC = 0.760, z = 7.611, p < 0.001. The mean for the latent slope factor is significantly different from zero, indicating affective trust increases over time, MLINEAR = 0.257, z = 11.047, p < 0.001. The slope factor variance is not significant, VarLINEAR = 0.016, z = 390, p < ns, indicating nonsignificant variability in the slopes of the individual growth curves; thus affective trust is increasing to the same extent in all team members over time. The second-order growth factors account for considerable variance in the latent affective trust states, R2 values of 0.797, 0.849, and 0.949 for time 1, time 2, and time 3, respectively, indicating good fit of the linear growth model to the data. The remaining 20.3% (baseline) to 5.1% (time 3) of the latent state variance is due to reliable occasion-specific variability demonstrating that occasion-specific fluctuations were more important in the beginning than at the end of the study.
3.1.2. Cognitive Trust
The linear growth curve model for cognitive trust fits reasonably well, Χ2 (106) = 232.544, p < 0.001, RMSEA = 0.063, CFI = 0.963, TLI = 0.958, SRMR = 0.089. The growth process for trust is significantly different from zero: MINTERC = 3.452, z = 74.392, p < 0.001. There is also significant variability in the initial latent scores, VarINTERC = 0.359, z = 6.805, p < 0.001. The mean for the latent slope factor is significantly different from zero, indicating cognitive trust increases over time, MLINEAR = 0.185, z = 10.319, p < 0.001. The slope factor variance is also significant, VarLINEAR = 0.045, z = 4.650, p < 0.001, indicating significant variability in the slopes of the individual growth curves; thus cognitive trust is not increasing to the same extent in all team members over time. The second-order growth factors account for between 42.9% and 97.5% of the variance in the latent cognitive trust states, R2 values of 0.429, 0.740, 0.806, and 0.975 for baseline, time 1, time 2, and time 3, respectively. This indicates good fit of the linear growth model to the data. The remaining 57.1% (baseline) to 2.5% (time 3) of the latent state variance is due to reliable occasion-specific variability demonstrating that occasion-specific fluctuations were more important in the beginning than at the end of the study. See Figure 1 for the plot of the latent means over time.
3.1.3. Summary
Our analysis provides support for hypothesis one. In these virtual teams individuals start out with different levels of cognitive trust and while it grew at a significant rate and in a linear fashion, individual growth of cognitive trust occurs at different rates. Overall affective trust is non-linear due to the fact that it is dependent on the establishment of cognitive trust. Once cognitive trust is in place, affective trust develops at a significant rate, providing support for Hypothesis 1. Individuals start with different levels of affective trust and it grows at a significant pace. It is important to note that although the development of trust occurs according to theoretical prediction, causality has not been conclusively demonstrated.
We now move to examine how the different types of trust influence satisfaction with one’s team and team performance; and if, over time, there is a reciprocal relationship between trust and satisfaction or trust and performance.
3.2. Overview of Latent Change Analysis
Analyses of models concerned with change proceed in a sequential fashion, allowing for the comparison of models of interest to substantive baseline models. Following recommendations in (McArdle 2009; Ferrer and McArdle 2010; Geiser 2013), we begin with a confirmatory factor model reflecting the measurement of the construct over occasions. In our case this refers to the items from the McAllister (1995) trust scale reflecting affective (4 items) and cognitive (4 items) trust. We then examine an autoregressive model in which the temporal sequence is preserved (e.g., baseline trust followed by measurement occasions 1, 2, and 3). Next, as we are using the same scale over time, it is important to account for specific (non-random) indicator variance. As such, we add a model that includes indicator-specific latent variables (Geiser 2013, p. 88). Following next is a model involving invariant factor loadings (weak factorial invariance). We end with a full latent change model, which adds invariant intercepts (strong factorial invariance) to the weak factorial invariant model. This is our primary model of interest. It is the comparison of the full latent change model to the preceding baseline models that provides a test of Hypotheses 2 for affective trust and Hypothesis 3 for cognitive trust.
3.3. Latent State Analysis of Trust
As described by (Geiser 2013, p. 145) “Latent difference variables represent interindividual differences in true intraindividual change over time—that is, change scores corrected for random measurement error.” As such, this is a direct method for estimating change, as opposed to the indirect approach taken by autoregressive models. Since a latent difference between two variables (e.g., trust at time 1; trust at time 2) is itself a latent variable in the model, this makes it possible to directly study interindividual differences in intraindividual change.
3.3.1. Hypothesis 2: Assessment of Affective Trust via Latent Change Score Modeling
As described above, a sequence of models is examined beginning with the least restrictive (confirmatory factor analysis) and incrementally becoming more restrictive until concluding with a latent change model. The fit of the different models are summarized in Table 1.
Confirmatory Factor Model
The confirmatory factor model examines affective trust measured on four occasions with the identical indicators (same four items from McAllister’s scale) on each occasion. Fit of the model is poor, Χ2 (98) = 599.84, p < 0.001, RMSEA = 0.131, CFI = 0.850, TLI = 0.816, SRMR = 0.063. Examining the interfactor correlations of the confirmatory factor model, we see they are of modest magnitude and decline with increasing temporal distance (baseline to time 1 = 0.425, baseline to time 2 = 0.380, baseline to time 3 = 0.362) thus indicating the influence of both occasion variance (as opposed to full trait variance) and the presence of an autoregressive process.
Latent Autoregressive Model
We begin adding constraints, first by replacing the inter-factor correlations with structural parameters between the trust latent variables, linking them in sequence from measurement at: baseline to time 1, time 1 to time 2, and time 2 to time 3. This model, more restrictive than the first, fits poorly and about the same level as the intercorrelated confirmatory factor model, Χ2 (101) = 608.14, p < 0.001, RMSEA = 0.130, CFI = 0.848, TLI = 0.820, SRMR = 0.063.
Indicator Specific Latent Variable Model
A third model accounts for using the same scale on multiple measurement occasions through adding indicator specific latent variables (specific method factors). The indicator-specific latent variable approach is preferred to simply allowing the errors to correlate as it does not confound indicator specific effects with random measurement error (Geiser 2013, p. 89). Fit of this model to the data results in: Χ2 (86) = 168.16, p < 0.001, RMSEA = 0.057, CFI = 0.975, TLI = 0.966, SRMR = 0.037. The addition of indicator specific method factors is a significant improvement from the sequential model, nested model comparison Χ2 (15) = 439.98, p < 0.001.
Factorial Invariance Model
A fourth model layers further restrictions by constraining factor loading to be invariant. This weak factorial invariance (Widaman and Reise 1997; Meredith and Horn 2001) ensures the measured variables of the measurement instrument did not change their relationship to the affective trust latent variable over the course of the study. The resulting difference in variance is a function of the latent construct being influenced by contextual sources; here participation in the task. The additional parameter restrictions affect the overall fit of the model, Χ2 (97) = 228.76, p < 0.001, RMSEA = 0.068, CFI = 0.961, TLI = 0.951, SRMR = 0.087. The model with weak factorial invariance fits somewhat less well than the model with fewer restrictions although the overall fit is reasonable.
Latent Change of Affective Trust
The model of primary interest is a latent change model. Described above, the latent change representation has many advantages over autoregressive and second order autoregressive models. To test a latent change model we take the weak factorial invariance model and include the restriction that the intercepts of the observed variables are invariant over occasions, imposing strong factorial invariance (Widaman and Reise 1997; Meredith and Horn 2001) on the model. Then latent variables representing the change in the latent construct at each point in time is included. The parameterization allows for the estimation of the influence of each preceding time and the difference on subsequent time points. For example, trust at time 1 is equal to baseline trust, plus the difference between baseline (time 0) and time 1; time 2 trust is equal to time 1 trust plus the difference between time 1 and time 2; and so forth for trust at time 3. The model fit is acceptable, Χ2 (101) = 272.33, p < 0.001, RMSEA = 0.076, CFI = 0.949, TLI = 0.939, SRMR = 0.086. Given its reasonable fit, this is the preferred model moving forward as it provides the theoretical advantages described above, notably the ability to estimate error free latent means. Thus, support is found for Hypothesis 2.
3.3.2. Hypothesis 3: Assessment of Cognitive Trust via Latent Change Score Modeling
Latent Change of Cognitive Trust
Having examined a series of baseline models and concluding with the latent change model for affective trust (see Table 1), we took the same approach for assessing cognitive trust. The result across baseline models is similar, as such we report only the latent change solution here (see Table 1 for comparisons). Compared to the affective trust solution, fit of the latent change cognitive trust model is somewhat better, Χ2 (101) = 217.756, p < 0.001, RMSEA = 0.062, CFI = 0.965, TLI = 0.959, SRMR = 0.082. See again Table 1. With the fit of this model, support is found for Hypothesis 3.
3.4. Latent State Analysis of Satisfaction
We are interested in the manner in which satisfaction with one’s team changes as the team works together over time and the extent to which it may be influenced by changes in trust. Following the system described above for analyzing a sequence of models, we applied the same strategy to the analysis of the satisfaction construct. We first test the confirmatory factor model, followed by the latent autoregressive model, in the third model we add indicator specific factors to account for method variance in the indicators over time, a fourth model tests for weak factor invariance, and the fifth model is the latent change model with strong factor invariance.
All models are summarized in Table 2. A similar patter to the one for affective trust (see again Table 1) emerges. Fit is poor for the CFA and latent autoregressive models. The first significant improvement occurs with the addition of the indicator specific latent variables Χ2 (7) =109.37, p < 0.001. As with the trust construct, adding constraints in terms of invariant factor loadings decreases fit of the model. According to RMSEA, the latent change score models with strong factorial invariance fit slightly better than the autoregressive model with invariant factor loadings. Although the autoregressive model with indicator specific latent variables fit better than the latent change model, Χ2 (7) = 25.32, p < 0.01; the advantage of the latent change model is it provides unbiased estimates of the latent variable means, and this is necessary as we want to examine the influence of the change in satisfaction on trust. Satisfaction at time 1 with one’s team is M = 3.707. The latent change score between time 2 and time 1 is, diff = 0.088, which results in the latent mean for time 2 being M = 3.795. A much larger change in satisfaction occurs between time 3 and time 2, diff = 0.247, with the resulting time 3 satisfaction latent mean M = 4.042.
Summary
Like trust, satisfaction with one’s team is a state (as opposed to trait) construct and can be expected to change over time. We modeled it with the latent change modeling approach and the resulting model has reasonable properties. As we now have the latent change models developed for affective trust and satisfaction with one’s team, we now couple these models to determine the extent to which trust influences satisfaction over time and satisfaction also impacts trust.
3.5. Testing the Relationships between Trust and Satisfaction
3.5.1. Hypothesis 4a: Affective Trust and Satisfaction
Having developed two latent change score models, one for how affective trust changes over time and the second for how satisfaction with one’s team changes over time, we now link them in order to investigate the relationship between changes in trust and changes in satisfaction over time. Fit of the following models is summarized in Table 3 below.
Change in Affective Trust Influencing Satisfaction
The first model of interest examines how the latent change in affective trust at each of three time points influences satisfaction with one’s team at the same points in time, see Figure 2. The model fits reasonably well, Χ2 (269) = 666.16, p < 0.001, RMSEA = 0.070, CFI = 0.934, TLI = 0.926, SRMR = 0.178. A second model asks the question, does the change in affective trust directly influence the change in satisfaction one has with the team. This model, while not fitting quite as well as the previous one, fits at an acceptable level (RMSEA, CFI and TLI now in acceptable range; SRMR still indicating poor fit): Χ2 (271) = 719.99, p < 0.001, RMSEA = 0.075, CFI = 0.925, TLI = 0.917, SRMR = 0.216. A chi-square difference test comparing the two models is significant, Χ2 (2) = 53.83, p < 0.001; this indicates the model with the change in latent affective trust directly influencing satisfaction with one’s team (Figure 2) fits significantly better than the alternative.
Change in Satisfaction Influencing Change in Trust
In addition to examining relationships where affective trust influences satisfaction, it is also reasonable to question if change in satisfaction with one’s teammates influences affective trust. We test two models similar to the ones just described. One model has a change in satisfaction directly influencing affective trust; see Figure 3. The model fit is similar to the other models, Χ2 (268) = 694.96, p < 0.001, RMSEA = 0.073, CFI = 0.929, TLI = 0.920, SRMR = 0.215. The second model examines the influence of change in satisfaction on changes in affective trust. Fit of this model is slightly worse than the previous, Χ2 (273) = 717.20, p < 0.001, RMSEA = 0.074, CFI = 0.926, TLI = 0.919, SRMR = 0.217. A chi-square difference test reveals the model with change in satisfaction directly influencing affective trust is preferred, Χ2 (5) = 22.24, p < 0.001, see again Figure 3.
Bivariate Coupling of Latent Change
Following McArdle (2009), we refer to models where the change scores in the lower and upper panel influence variables in the opposite panel as bivariate coupling models. We now test a model that includes the change in affective trust impacting satisfaction with one’s team (Figure 2, model A in Table 3) with change in satisfaction influencing affective trust (Figure 3, model C in Table 3). Figure 4 presents the parameters and estimates. Overall this model fits better than any of the previous models, Χ2 (267) = 652.096, p < 0.001, RMSEA = 0.070, CFI = 0.936, TLI = 0.928, SRMR = 0.165 and chi-square difference tests reveal the fit is significantly better than the other preferred models, see bottom two rows of Table 3. Thus, hypothesis 4a is supported, a bivariate coupling model between affective trust and satisfaction with one’s team fits better than the simpler non-bivariate coupled models.
3.5.2. Hypothesis 4b: Cognitive Trust and Satisfaction
The second type of trust we examine is cognitive. The focus of cognitive trust is on professionalism, competence, and quality of work. As the latent growth curve analysis demonstrated, there is a different growth trajectory for cognitive compared to affective trust where cognitive trust’s overall trajectory is linear and the overall trajectory for affective is non-linear; only becoming linear after some time has passed.
We are interested in the same change models and influences as with affective trust. We begin with the test of strong factorial invariance. The fit of the model is reasonable, Χ2 (101) = 217.756, p < 0.001, RMSEA = 0.062, CFI = 0.965, TLI = 0.959, SRMR = 0.082. We move to examining a series of models testing the relationships between cognition-based trust and satisfaction with one’s team. Fit of each model is summarized in Table 4.
Change in Cognitive Trust Influencing Satisfaction
Taking what we learned from our analysis between affective trust and satisfaction, we analyzed three models depicting the relationships between cognitive trust and satisfaction with one’s team. The first model is depicted in Figure 2, where change in cognitive trust directly influences satisfaction. The model fits reasonably well, Χ2 (269) = 584.423, p < 0.001, RMSEA = 0.063, CFI = 0.947, TLI = 0.941, SRMR = 0.201. The parameter estimates for this model are provided in Figure 2, see estimates in [brackets]. The second model we examined specifies that change in satisfaction will impact cognitive trust; again see Figure 3. This model also fits reasonably well, Χ2 (268) = 599.18, p < 0.001, RMSEA = 0.065, CFI = 0.945, TLI = 0.938, SRMR = 0.214. Parameter estimates for cognitive trust are given in brackets in the figure. The final model combines the previous two, and states that change in cognitive trust impacts satisfaction with one’s team; and change in satisfaction, in turn, influences trust, see again Figure 4. Fit of this model is Χ2 (267) = 577.72, p < 0.001, RMSEA = 0.063, CFI = 0.948, TLI = 0.942, SRMR = 0.185. Parameter estimates are provided in Figure 4, see bracketed values. Nested model chi-square comparisons of this bivariate coupling model to the previous models are significant; see bottom two rows of Table 4. This means the bivariate coupling model does a better job of explaining the observed variance between cognitive trust and satisfaction than does a model with just change in cognitive trust influences satisfaction, or the model where change in satisfaction influences cognitive trust. Hypothesis 4b is supported.
Summary
It is important to understanding how trust changes over time and influences satisfaction with one’s team. Similarly, it is essential to recognize how satisfaction with one’s team changes over time and influences trust in the team. For each type of trust (affective, cognitive) and satisfaction with one’s team we examined a series of change models, beginning with correlated factor and progressing through latent change with strong factorial invariance (Meredith and Horn 2001). Strong factorial invariance imposes restrictions on the factor loadings such that they are invariant over time. Similarly, intercepts for the indicator variables are constrained to zero, and remain fixed over time. The result is the properties of the measurement instrument do not change over time and therefore do not influence the estimation of parameters associated with the latent constructs of interest (here trust and satisfaction).
Once the latent change models for each type of trust and satisfaction were established we examined a series of models looking at the influence of changes in latent trust on satisfaction, followed by models specifying changes in satisfaction impacting trust. Finally, we coupled the latent change representations and the resulting model captures how, over time in distributed groups, changes in trust influence satisfaction with the group, and how changes in satisfaction influence trust. This bivariate coupling between each type of trust and satisfaction with one’s team reveals the dynamic nature of the linkages and influence between change in trust and satisfaction as the team works together over time.
3.6. Trust and Performance
Having established the relationship between trust and satisfaction with one’s team, we want to test if the same relationship exists between trust and performance. That is, for each type of trust, do changes in trust influence performance, and do changes in performance influence trust. The model is similar to Figure 2, Figure 3 and Figure 4, except the satisfaction with teammates latent variables are replaced by performance, where performance has two indicators: individual and team score on the task.
3.6.1. Hypothesis 5a: Affective Trust and Performance
The first model we examine states that latent change in affective trust over time influences performance over time. We fit this model to the data, and the overall fit is reasonable, Χ2 (201) = 426.417, p < 0.001, RMSEA = 0.061, CFI = 0.937, TLI = 0.927, SRMR = 0.084. Examination of the parameters reveals that change in trust at times two and three influencing performance are non-significant, see Figure 5. In terms of parsimony we fixed those two parameters to zero and re-estimated the model. Overall fit changed very little, Χ2 (203) = 426.704, p < 0.001, RMSEA = 0.061, CFI = 0.937, TLI = 0.929, SRMR = 0.083. A nested model chi-square indicates the models are not significantly different from one another Χ2 (2) = 0.287, p = 0.866, so we prefer the more parsimonious structure.
To rule out the possibility that performance influences changing levels in affective trust, we tested a model reversing the direction of influence so over the three time periods, performance influences change in affective trust (in Figure 5 instead of regressing performance on change, regress change on performance). Model fit is significantly poorer, with the chi-square being over 100 points larger and the descriptive measures of fit indicating worse fit across the board.
Summary
As the overall model fit quite well and hypothesis 5a is supported, the relationship between affective trust and performance is less straightforward than the relationship found between affective trust and satisfaction with one’s teammates. Change in affective trust directly influences performance only at time one; moreover, changes in performance do not influence trust. We now move to examine the relationships between cognitive trust and performance.
3.6.2. Hypothesis 5b: Cognitive Trust and Performance
As before, we begin with a model that has parameters linking change in cognitive trust and performance. The overall model fits quite well Χ2 (204) = 393.080, p < 0.001, RMSEA = 0.056, CFI = 0.948, TLI = 0.941, SRMR = 0.087; however, the parameters linking change in trust to performance are not significant, see Figure 5.
The next model determines if change in performance influences trust. The model fit is quite acceptable, Χ2 (203) = 370.686, p < 0.001, RMSEA = 0.053, CFI = 0.954, TLI = 0.947, SRMR = 0.086. In this case, the parameter linking change in performance from time 1 to time 2 and cognitive trust is significant, whereas the following change in performance does not significantly influence trust at time three.
Hypothesis 5b is supported as the full bivariate coupling change model fit, with fit parameters: Χ2 (202) = 392.042, p < 0.001, RMSEA = 0.056, CFI = 0.948, TLI = 0.940, SRMR = 0.088. While the overall fit of the model is quite good, none of the bivariate coupling parameters are significant. We reran the model fixing all bivariate coupling parameters to zero except the one from change in performance (time 1 to time 2) and trust at time 2 as this was significant in the change in performance influencing cognitive trust model described above. The parsimonious model fits quite well, Χ2 (204) = 370.788, p < 0.001, RMSEA = 0.052, CFI = 0.954, TLI = 0.948, SRMR = 0.086.
Summary
The relationship between cognitive trust and performance is complex. Similar to affective trust, cognitive trust behaves differently. Unlike affective trust, there is no relationship between change in cognitive trust and it influencing performance at time 1. Change in performance between time 1 and time 2 directly influences cognitive trust at time 2. Change in performance between time 2 and 3 has no influence on cognitive trust at time three.
3.7. Overall Summary of Results
Using the latent growth curve modeling approach allows for the estimation of error free latent means for our model. Graphically (see again Figure 1) the two types of trust appear different in their initial level and growth. Latent growth curve modeling confirmed the difference, with cognitive trust growing from the outset in a linear fashion. Affective trust, however, is overall non-linear, but has a strong linear component once cognitive trust is established.
3.7.1. Foundational Latent Change Analyses
Our interest is in the nature of trust in distributed teams, how it changes over time as the individuals interact, and how it relates to satisfaction with one’s teammates and performance. Affective and cognitive trust are likely to behave differently, we therefore analyzed separately for each trust type. The relatively modest intercorrelations for trust factors confirmed we are dealing with state-like as opposed to trait-like constructs. For each trust type the intercorrelations decreased with increasing temporal distance, thereby confirming an autoregressive process.
Following a procedure outlined by McArdle (2009) and Geiser (2013) we examined a series of baseline models proceeding from those with fewer constraints to models with more constraints. The first is a confirmatory factor model followed by a latent autoregressive model. These fit poorly. Adding indicator specific latent variables to account for using the same scale over multiple measurement occasions increased the fit dramatically. The final models added constraints on factor loadings (weak factorial invariance) and intercepts (strong factor invariance). These models fit in an acceptable although mediocre range. The final representation added latent variables for change. Overall fit of a latent change representation for affective and cognitive trust is good; again see Table 1.
Following the same procedure we used for analyzing trust, we examined the change in satisfaction over time. As with each type of trust, the latent change model fit reasonably well.
3.7.2. Models of Theoretical and Substantive Interest
We are interested in how affective and cognitive trusts are related over time to satisfaction with one’s teammates and also performance in the team.
Satisfaction
Latent change models for both affective and cognitive trust provide a reasonable explanation of the interrelationships in the data. As seen in Figure 2 where change in trust influences satisfaction, the structural parameters are moderate to large and all are significant. Similarly in Figure 3 change in satisfaction influences trust. Again, the parameters are moderate to high, and all are significant. In the full bivariate coupling model the relationships all hold, so we see that for both affective and cognitive trust, change in trust influences satisfaction, and change in satisfaction impacts trust, providing support for Hypothesis 4a and 4b. Furthermore, all individual parameters in the models are significant.
Performance
In each case, overall fit of the bivariate change model to the data for affective and cognitive trust to performance is significant, providing support for Hypotheses 5a and 5b. Unlike satisfaction, however, the influence of trust on performance is less pronounced. This can be seen in the individual parameters of the models. For affective trust, change in trust from baseline to time one does influence performance at time one, but neither of the other two trust change scores significantly influence performance. Similarly, none of the cognitive change scores influence performance. In considering the influence of change in performance on trust, only for cognitive trust does the difference between time two and time one influence trust at time two. The time two to time three differences is not significant for either type of trust.
3.7.3. General Summary
We see that the latent change score method is a useful strategy for studying change in trust in distributed teams. The models are helpful for understanding the change in trust over time. Since the technique provides error free estimates of latent variable means, it is useful to further analyze factor scores. Here we see that the type of trust interacts with time, as there are different structures to the latent change scores. For both affective and cognitive trust, the bivariate coupling models demonstrated that over time, change in trust influences satisfaction with one’s teammates; and change in satisfaction with one’s teammates influences trust. When considering performance, however, the situation is different. For affective trust, early change in trust influences early performance; whereas for cognitive trust early change in performance influences early trust.
4. Discussion and Conclusions
Modern technologies enable seamless communications providing individuals within today’s organizations the unprecedented ability to communicate across temporal and geographical boundaries. Yet, regardless of the sophistication of the hardware and software, fundamental human characteristics, such as trust, lay at the very foundation of successful interactions. As discussed in the introduction, the state of knowledge regarding trust in virtual teams is limited. Our work is focused on building a solid foundation of knowledge regarding the development and growth of trust in virtual teams. We believe this is best accomplished, at least in part, through the use of controlled experiments and appropriate quantitative methods.
Our latent growth curve analyses demonstrate that cognitive and affective trust are both present in nontrivial levels when virtually distributed individuals are asked to work together to complete a mission. Yet for each trust type, there are considerable individual differences in the initial levels (significant differences in the intercepts). Once task work commences, cognitive trust follows a linear trend with trust increasing within individuals at different rates. On the whole, this is good news for organizations that pull together individuals for project teams and need those teams to work effectively from the start. One potential downside, however, would be a situation where one or more members might be a cybersecurity threat to the organization and the early trusting by the group enables or facilitates nefarious acts.
The increase in early cognitive trust supports the notion that it is laying the groundwork for subsequent development of affective trust. Affective trust takes additional time to develop beyond the baseline level. Once established, however, affective trust follows a linear growth trend and increases within individuals at the same rate. This is different from cognitive trust where individuals develop it at different rates throughout task completion. With affective trust associated with satisfaction, cohesion, performance and extra role behaviors such as organizational citizenship, its growth and development is important for organizations to attend to.
Our work with latent change score models strengthens and adds to the trust literature. The base latent change models, while highly constrained, fit the data quite well. All structural parameters are large and significant indicating that preceding levels of trust and change in trust are each significant predicators of subsequent trust. Estimating parameters via latent change scores allow for the clear prediction of trust levels in virtual teams at various points in the team’s evolution. Another use these parameters would be to seed parameters of computational models used to simulate artificial teammates in organizational contexts such as training.
The relationship of both cognitive and affective trust with satisfaction is more complex than earlier believed. If we look simply at the change in trust influencing satisfaction (Figure 2), as trust changes over time, change in trust has a positive influence on satisfaction with one’s team. Similarly, change in satisfaction over time continues to positively influence subsequent levels of trust. Examination of the bivariate coupling change model (Figure 4), however, reveals a diminishing influence of trust on satisfaction from the first change in trust influence on satisfaction to the second. The relationship is negative at the third change in trust episode, perhaps indicating greater demands on the satisfaction criterion space beyond that provided by trust.
The relationship of trust with performance is somewhat different. While the bivariate coupling change models fit the data significantly better than the uncoupled models, parsimony argues for a simpler representation. This is because change in affective trust influences only early task performance. Change in cognitive trust, however, does not influence either early or later task performance. Similarly, early change in performance influences cognitive trust. This complex relationship that develops over time may be providing support for the evolution of trust similar to that described by Lewicki and Bunker (1996). Our findings argue for structuring team tasks in such a fashion to allow early successful performance to build early cognitive trust among members.
4.1. Theoretical and Practical Implications
The results of this study have several important implications. First, these findings support the notion that both cognitive and affective trust is present early in the team’s lifecycle. The two types of trust have different developmental trajectories, suggesting that based on the maturity of the team, organizations may want to utilize different techniques for building trust. Additionally, there are differences in developmental trajectories across group members, suggesting that the rates at which trust changes is different across individuals. It is important to understand the factors that determine those inter-individual differences.
Secondly, the results of this study indicate the two components of trust have different relationships with outcomes of interest, in this case performance and team satisfaction. The impact of changes in affective and cognitive trust on those outcomes is different, and changes over time. This is important for interventions that organizations may consider implementing. Understanding whether an intervention is aimed at enhancing cognitive or affective trust can help researchers and practitioners target the effect it may have on the outcome of interest.
Thirdly, these findings support the view that by examining trust as cognitive and affective constructs, researchers can further understand important relationships between trust type and outcomes. The two types of trust have different developmental trajectories and unique relationships with the outcomes examined here. This more refined understanding of trust can help both researchers and practitioners gain a deeper understanding of team processes, allowing for the ability to impact those processes when needed.
Lastly, findings from this study demonstrate trust can develop among team members despite the low media richness of the communication tool utilized by team members. In this study, team members communicated via a text-based, synchronous communication chat tool. This type of communication medium is widely used in organizations for a number of reasons including its convenience and cost effectiveness. Text chat tools are inexpensive, widely available, and utilize less bandwidth compared to other tools such as video-conferencing, making them attractive as a communication tool. Even though text-based chat tools are located toward the lean end of the media richness spectrum, the results of the present study suggest they are an effective communication tool. Team members were able to complete their tasks as well as establish relationships with one another as indicated by their increasing trust scores.
4.2. Limitations and Future Directions
The sample of this study consisted of undergraduate students; as such caution should be exercised when generalizing these findings to an organizational setting. This study is a first step in uncovering these dynamic relationships between trust, team satisfaction, and performance. Thus, future studies need to extend this work to an organizational context.
Throughout the study, the researchers monitored the experimental teams’ progress to ensure all players participated in the mission, however their degree of motivation and effort could not be assessed. Based on participant reactions during the debriefing sessions, the participants generally found the task engaging and appeared to have done their best. Also our task simulated only high cycle interactions (completion of three missions within forty minutes). Replication of the study with organizational teams in a higher-stakes environment and longer durations is advisable.
In this study, we examined trust as a psychological construct that develops between people based on their experiences and interactions with one another. In virtual teams, however, two types of trust are at play—interpersonal trust and trust in the utilized technology. This study examined the former and did not address the latter. As complex technology is layered onto human interactions trust in both the human agent as well as in the technology become critical for effective system design and subsequent interactions (Lee and See 2004). Future studies should examine the effects of both trust in team members and trust in technology on team outcomes.
The focus of this study was to examine the direct relationships as it unfolds over time between trust and two effectiveness concepts, team satisfaction and performance. Prior studies have found the relationship between trust and performance could be mediated through different team processes (De Jong and Elfring 2010). Future studies should examine how trust interacts with these team processes in order to increase effectiveness. In particular, communication has been identified as being important to teamwork (Powell et al. 2004). For this study, we did not have the chat logs generated during the sessions available for analyses. With the advancement of text analytic technology, future studies should aim to utilize available communication data to examine the patterns of communication as well as information sharing behaviors.
Our work has focused on distributed teams who do not see one another. This is commonplace in the global world of work in which we live today. Much of what is known about how trust develops, however, is based upon studies conducted in face-to-face teams. In those teams trust develops through those interactions in which individuals incorporate both subtle verbal and nonverbal meaning. Future research needs to build upon our work utilizing a dimension of virtuality.
Lastly, this study examined the development of trust and effectiveness in a naturalistic setting with no trust manipulations. Team members were encouraged to work together and be cooperative. However, team dynamics change as a function of team member behaviors, and in turn influence trust and team performance. Future studies should examine how competition influences the development of the relationships between trust and effectiveness in virtual teams.
In conclusion, the world continues to become ever more connected. As organizations exploit this connectivity through the use of distributed teams it becomes increasingly important to understand the factors that influence effectiveness in these teams. We see that for two types of effectiveness, team satisfaction and task performance, trust plays a foundational role. By utilizing latent growth curve and latent change score models, our work provides practitioners and theoreticians a solid foundation upon which to continue to build.
Acknowledgments
This work was supported by a National Research Council Fellowship and an AFRL Chief Scientists Seedling Award to the first author. Support was also received from contract number PO-JN42903. An earlier version of this work was presented at the 31st Annual Meeting of the Society of Industrial and Organizational Psychology. We thank Marijana Arvan and David Coovert for their assistance with the data collection.
Author Contributions
All three authors conceived and designed the experiments; Miller and Coovert performed the experiments; Coovert and Miller analyzed the data; Coovert, Miller and Bennett contributed to the writing of the paper.
Conflicts of Interest
The authors declare no conflict of interest. The founding sponsors had no role in the design of the study; in the collection, analyses, or interpretation of data; in the writing of the manuscript, and in the decision to publish the results.
References
- Alge, Bradley J., Carolyn Wiethoff, and Howard J. Klein. 2003. When does the medium matter? Knowledge-building experiences and opportunities in decision-making teams. Organizational Behavior and Human Decision Processes 9: 26–37. [Google Scholar] [CrossRef]
- Altschuller, Shoshana, and Raquel Beneunan-Fich. 2010. Trust, performance, and the communication process in ad hoc decision-making virtual teams. Journal of Computer-Mediated Communication 16: 27–47. [Google Scholar] [CrossRef]
- Anderson, A. H., R. McEwan, J. Bal, and J. Carletta. 2007. Virtual team meetings: An analysis of communication and context. Computers in Human Behavior 23: 2558–80. [Google Scholar] [CrossRef]
- Aubert, Benoit A., and Barbara L. Kelsey. 2003. Further understanding of trust and performance in virtual teams. Small Group Research 34: 575–619. [Google Scholar] [CrossRef]
- Bandow, Diane. 2001. Time to create sound teamwork. The Journal of Quality and Participation 24: 41–47. [Google Scholar]
- Cohen, Susan, and Christina Gibson. 2003. In the beginning: Introduction and framework. In Virtual Teams that Work: Creating Conditions for Virtual Team Effectiveness. Edited by Susan Cohen and Christina Gibson. San Francisco: Jossey-Bass, pp. 1–13. [Google Scholar]
- Costa, Ana N. 2003. Work team trust and effectiveness. Personnel Review 32: 605–22. [Google Scholar] [CrossRef]
- Costa, Ana N., Robert A. Roe, and Tharsi Taillieu. 2001. Trust within teams: The relation with performance effectiveness. European Journal of Work and Organizational Psychology 10: 225–44. [Google Scholar] [CrossRef]
- Crisp, C. Brad, and Sirkka L. Jarvenpaa. 2013. Swift trust in global virtual teams: Trusting beliefs and normative actions. Journal of Personnel Psychology 12: 45–56. [Google Scholar] [CrossRef]
- Daft, Richard L., and Rovert H. Lengel. 1986. Organizational information requirements, media richness and structural design. Management Science 32: 554–71. [Google Scholar] [CrossRef]
- De Jong, Bart A., and Tom Elfring. 2010. How does trust affect the performance of ongoing teams? The mediating role of reflexivity, monitoring, and effort. Academy of Management Journal 53: 535–49. [Google Scholar] [CrossRef]
- DeRosa, Darleen M., Donald A. Hantula, Ned Kock, and John D’Arcy. 2004. Trust and leadership in virtual teamwork: A media naturalness perspective. Human Resource Management 43: 219–32. [Google Scholar] [CrossRef]
- Dirks, Kurt T., and Donald L. Ferrin. 2001. The role of trust in organizational settings. Organizational Science 12: 450–67. [Google Scholar] [CrossRef]
- Ferrer, Emilio, and John J. McArdle. 2010. Longitudinal modeling of developmental changes in psychological research. Current Directions in Psychological Science 19: 149–54. [Google Scholar] [CrossRef]
- Geiser, Christian. 2013. Data analysis with Mplus. New York: Guilford Press. [Google Scholar]
- Jarvenpaa, Sirkka L., and Dorthy E. Leidner. 1999. Communication and trust in global virtual teams. Journal of Computer Mediated Communication 3: 1–36. [Google Scholar] [CrossRef]
- Jarvenpaa, Sirkka L., Thomas R. Shaw, and D. Sandy Staples. 2004. Toward Contextualized Theories of Trust: The Role of Trust in Global Virtual Teams. Information Systems Research 15: 250–67. [Google Scholar] [CrossRef]
- Jones, Gareth R., and Jennifer M. George. 1998. The experience and evolution of trust: Implications for cooperation and teamwork. Academy of Management Review 23: 531–46. [Google Scholar]
- Kirkman, Bradley L., and John E. Mathieu. 2005. The dimensions and antecedents of team virtuality. Journal of Management 31: 700–18. [Google Scholar] [CrossRef]
- Kuo, Feng-yang, and Chai-ping Yu. 2009. An exploratory study of trust dynamics in work-oriented virtual teams. Journal of Computer-Mediated Communication 14: 823–54. [Google Scholar] [CrossRef]
- Lancellotti, Matthew P., and Thomas Boyd. 2008. The Effects of Team Personality Awareness Exercises on Team Satisfaction and Performance. Journal of Marketing Education 30: 244–54. [Google Scholar] [CrossRef]
- Lee, John D., and Katrina A. See. 2004. Trust in automation: Designing for appropriate reliance. Human Factors 46: 50–80. [Google Scholar] [CrossRef] [PubMed]
- LeMay, Elaine A. 2000. Virtual Teams: Work Processes, Communication, and Team Development. Ph.D. Dissertation, Colorado State University, Fort Collins, CO, USA. [Google Scholar]
- LePine, Jeffery A., Ronald F. Piccolo, Christine L. Jackson, John E. Mathieu, and Jessica R. Saul. 2008. A meta-analysis of teamwork process: Tests of a multidimensional model and relationships with team effectiveness criteria. Personnel Psychology 61: 273–307. [Google Scholar] [CrossRef]
- Lewicki, Roy J., and Barbara Benedict Bunker. 1996. Developing and maintaining trust in work relationships. In Trust in Organizations: Frontiers of Theory and Research. Edited by Roderick M. Kramer and Tom R. Tyler. Thousand Oaks: Sage Publications, pp. 114–39. [Google Scholar]
- Lewicki, Roy J., Edward C. Tomlinson, and Nicole Gillespie. 2006. Models of interpersonal trust development: Theoretical approaches, empirical evidence, and future directions. Journal of Management 32: 991–1024. [Google Scholar] [CrossRef]
- MacCallum, Robert C., Michael Browne, and Hazuki Sugawara. 1996. Power analysis and determination of sample size for covariance structure modeling. Psychological Methods 1: 130–49. [Google Scholar] [CrossRef]
- MacDonnell, Rhiannon, Thomas O’Neill, Theresa Kline, and Laura Hambley. 2009. Bringing group-level personality to the electronic realm: A comparison of face-to-face and virtual contexts. The Psychologist-Manager Journal 12: 1–24. [Google Scholar] [CrossRef]
- Mayer, Roger, James Davis, and F. David Schoorman. 1995. An integrative model of organizational trust. Academy of Management Review 20: 709–36. [Google Scholar]
- McAllister, Daniel J. 1995. Affect-and cognition-based trust as foundations for interpersonal cooperation in organizations. Academy of Management Journal 38: 24–59. [Google Scholar] [CrossRef]
- McArdle, John J. 2009. Latent variable modeling of differences and changes with longitudinal data. Annual Review of Psychology 60: 577–605. [Google Scholar] [CrossRef] [PubMed]
- McArdle, John J., and Fumiaki Hamagami. 2004. Methods for dynamic change hypotheses. In Recent Developments on Structural Equation Models. Edited by K. van Montfort, J. Oud and A. Satorra. Dordrecht: Kluwer Academic Publishers, pp. 295–335. [Google Scholar]
- McEvily, Bill, and Marco Tortoriello. 2011. Measuring trust in organisational research: Review and recommendations. Journal of Trust Research 1: 23–63. [Google Scholar] [CrossRef]
- Meredith, William, and John Horn. 2001. The role of factorial invariance in modeling growth and change. In New Methods for the Analysis of Change. Edited by L. M. Collins and A. G. Sayer. Washington: American Psychological Association, pp. 203–40. [Google Scholar]
- Palanski, Michael E., Surinder S. Kahai, and Francis J. Yammarino. 2011. Team virtues and performance: An examination of transparency, behavioral integrity, and trust. Journal of Behavioral Ethics 99: 201–16. [Google Scholar] [CrossRef]
- Peters, Linda, and Ronald J. Karren. 2009. An examination of the roles of trust and functional diversity on virtual team performance ratings. Group and Organization Management 34: 479–504. [Google Scholar] [CrossRef]
- Powell, Anne, Gabriele Piccoli, and Blake Ives. 2004. Virtual teams: Team control structure, work processes, and team effectiveness. Information Technology & People 17: 359–79. [Google Scholar]
- Raykov, Tenko. 1993. A structural equation model for measuring residualized change and discerning patterns of growth or decline. Applied Psychological Measurement 17: 53–71. [Google Scholar] [CrossRef]
- Riegelsberger, Jens, M. Angela Sasse, and John D. McCarthy. 2003. The researcher’s dilemma: Evaluating trust in computer-mediated communication. International Journal of Human-Computer Studies 58: 759–81. [Google Scholar] [CrossRef]
- Rusman, Ellen, Jan van Bruggen, Peter Sloep, and Rob Koper. 2010. Fostering trust in virtual project teams: Towards a design framework grounded in a TrustWorthiness ANtecedents (TWAN) schema. International Journal of Human-Computer Studies 68: 834–50. [Google Scholar] [CrossRef]
- Salas, Eduardo, Dana E. Sims, and C. Shawn Burke. 2005. Is there a "Big Five" in teamwork? Small Group Research 36: 555–99. [Google Scholar] [CrossRef]
- Schiller, Shu Z., Brian E. Mennecke, Fiona Fui-Hoon Nah, and Andy Luse. 2014. Institutional boundaries and trust of virtual teams in collaborative design: An experimental study in a virtual world environment. Computers in Human Behavior 35: 565–77. [Google Scholar] [CrossRef]
- Smith, J. Brock, and Donald W. Barclay. 1997. The effect of organizational differences and trusting on the effectiveness of selling partner relationships. Journal of Marketing 61: 3–21. [Google Scholar] [CrossRef]
- Thompson, Lori, and Michael D. Coovert. 2006. Understanding and developing virtual computer-supported cooperative work teams. In Creating High-Tech Teams: Practical Guide to Work Performance and Technology. Edited by Clint Bowers, Eduardo Salas and Florien Jentsch. Washington: APA, pp. 213–41. [Google Scholar]
- Walther, Joseph B. 1992. Interpersonal Effects in Computer-Mediated Interaction—A Relational Perspective. Communication Research 19: 52–90. [Google Scholar] [CrossRef]
- Webber, Shelia S. 2008. Development of cognitive and affective trust in teams: A longitudinal study. Small Group Research 39: 746–69. [Google Scholar] [CrossRef]
- Widaman, Keith F., and Steven P. Reise. 1997. Exploring the measurement invariance of psychological instruments: Applications in the substance use domain. In The Science of Prevention: Methodological Advances from Alcohol and Substance Abuse Research. Edited by Kendall. J. Bryant, Michael Windle and Stephen G. West. Washington: American Psychological Association, pp. 281–324. [Google Scholar]
- Wilson, Jeanne M., Susan G. Straus, and Bill McEvily. 2006. All in due time: The development of trust in computer-mediated and face-to-face teams. Organizational Behavior and Human Decision Processes 99: 16–33. [Google Scholar] [CrossRef]
- Zornoza, Ana, Virginia Orengo, and Vicente Peñarroja. 2009. Relational capital in virtual teams: The role played by trust. Social Science Information 48: 257–81. [Google Scholar] [CrossRef]
Figure 1.
Latent growth curves for cognitive and affective trust.

Figure 2.
Latent change in trust influencing satisfaction with one’s team. Standardized parameter estimates for affective trust are not bracketed, those for cognitive trust are given in brackets. All estimates are significant p < 0.01. For clarity, the measurement model and indicator specific latent variables are not presented.

Figure 3.
Latent change in satisfaction influencing trust. Standardized parameter estimates for affective trust are not bracketed; those for cognitive trust are given in brackets. All estimates are significant p < 0.01. For clarity, the measurement model and indicator specific latent variables are not presented.

Figure 4.
Bivariate coupling model. Latent change in trust influencing satisfaction and latent change in satisfaction influencing trust. Standardized parameter estimates for affective trust are not bracketed; those for cognitive trust are given in brackets. All estimates are significant p < 0.01. For clarity, the measurement model and indicator specific latent variables are not presented.
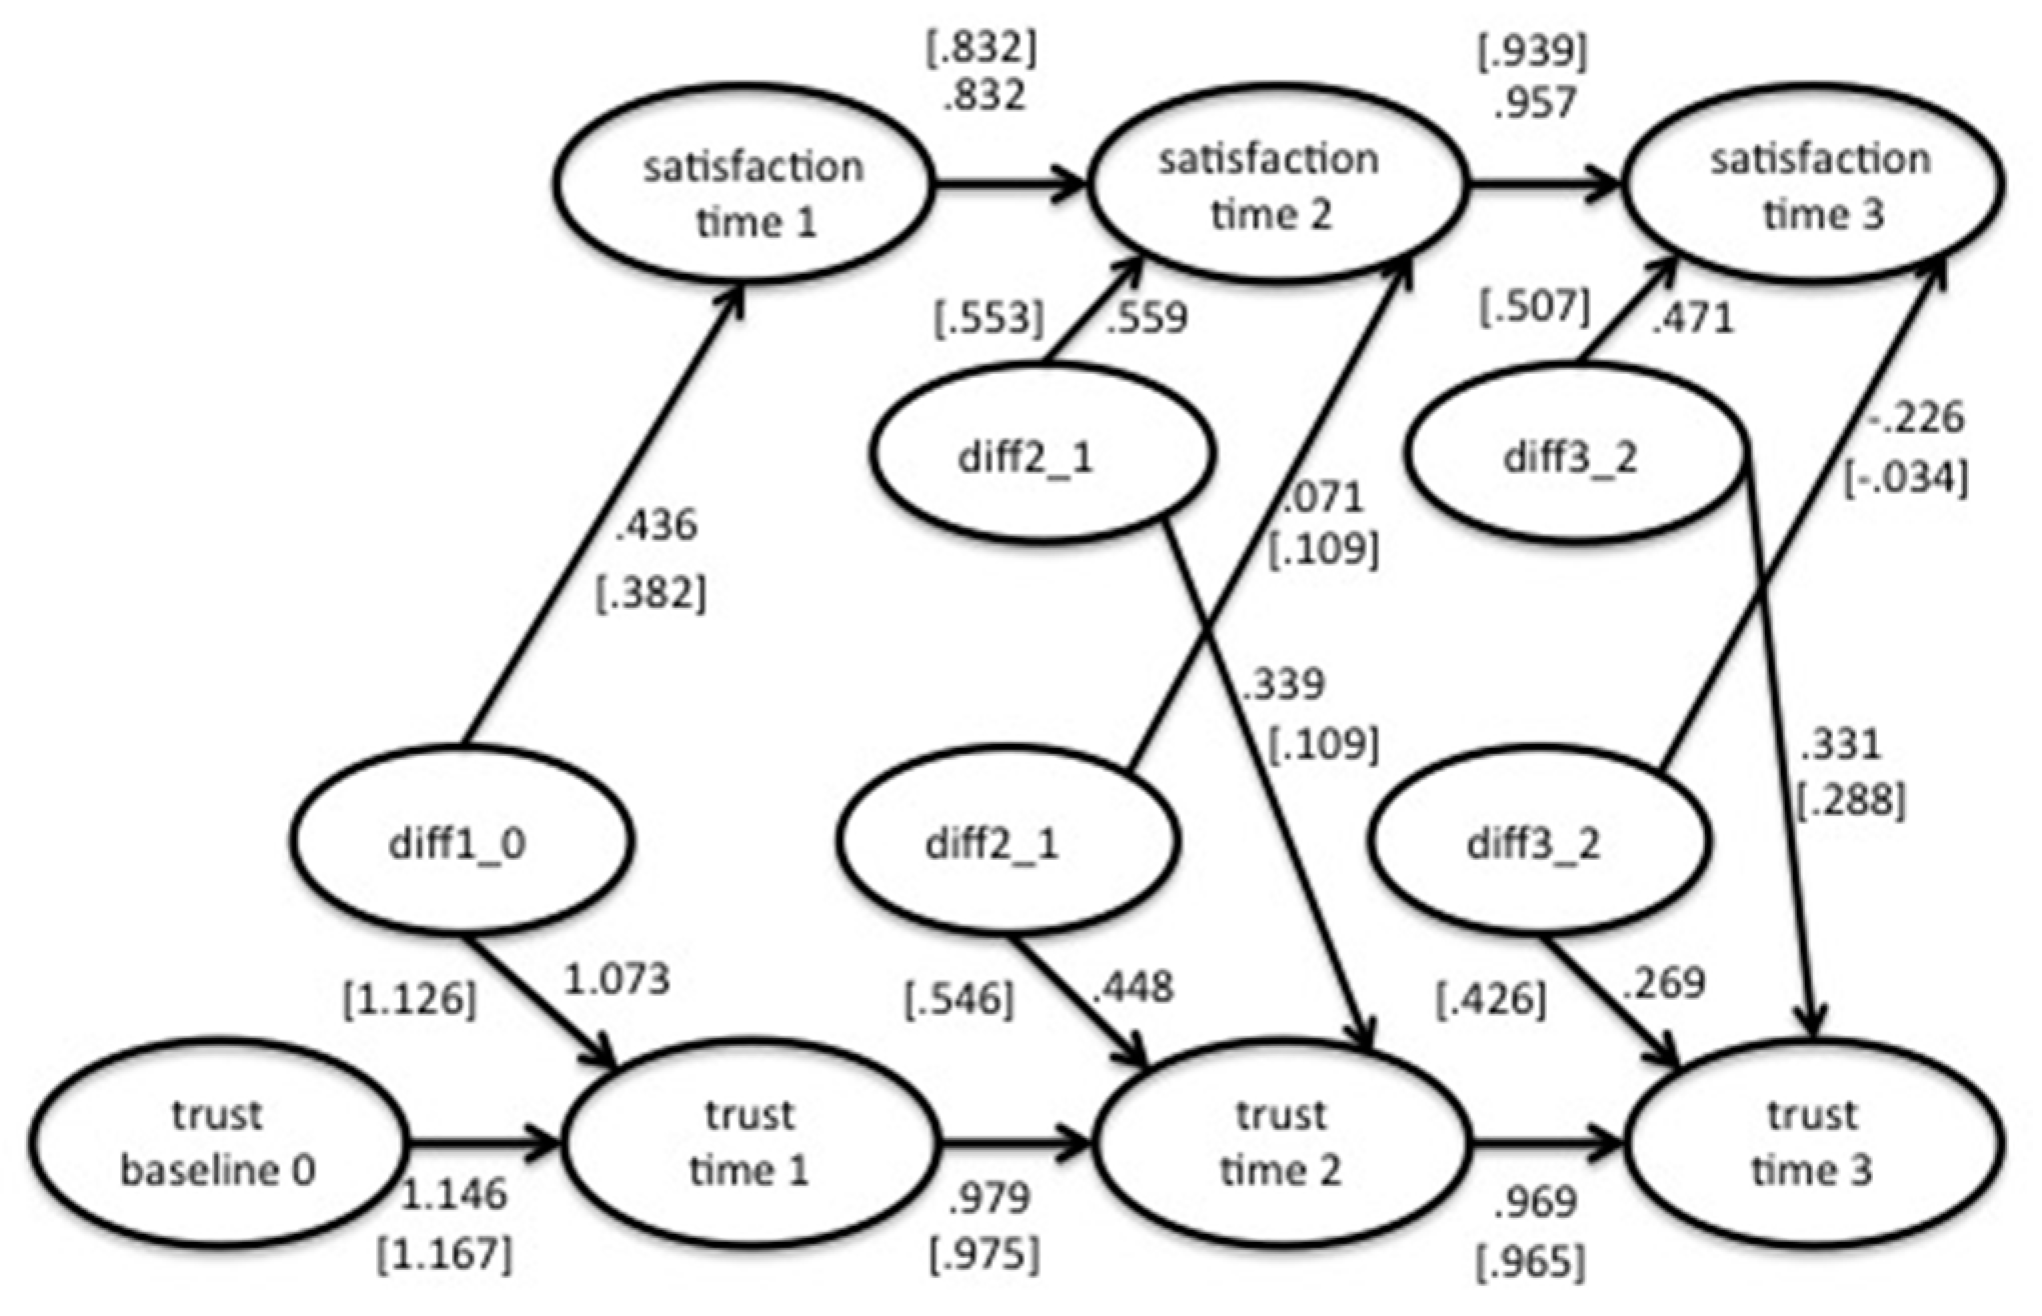
Figure 5.
Bivariate coupling model. Latent change in trust influencing performance and change in performance influencing trust. Standardized parameter estimates for affective trust are not bracketed; those for cognitive trust are given in brackets. All estimates are significant p < 0.01 unless otherwise noted. * p < 0.023, parameter estimate from parsimonious solution, model H in Table 5. For clarity, the measurement model and indicator specific latent variables are not presented.


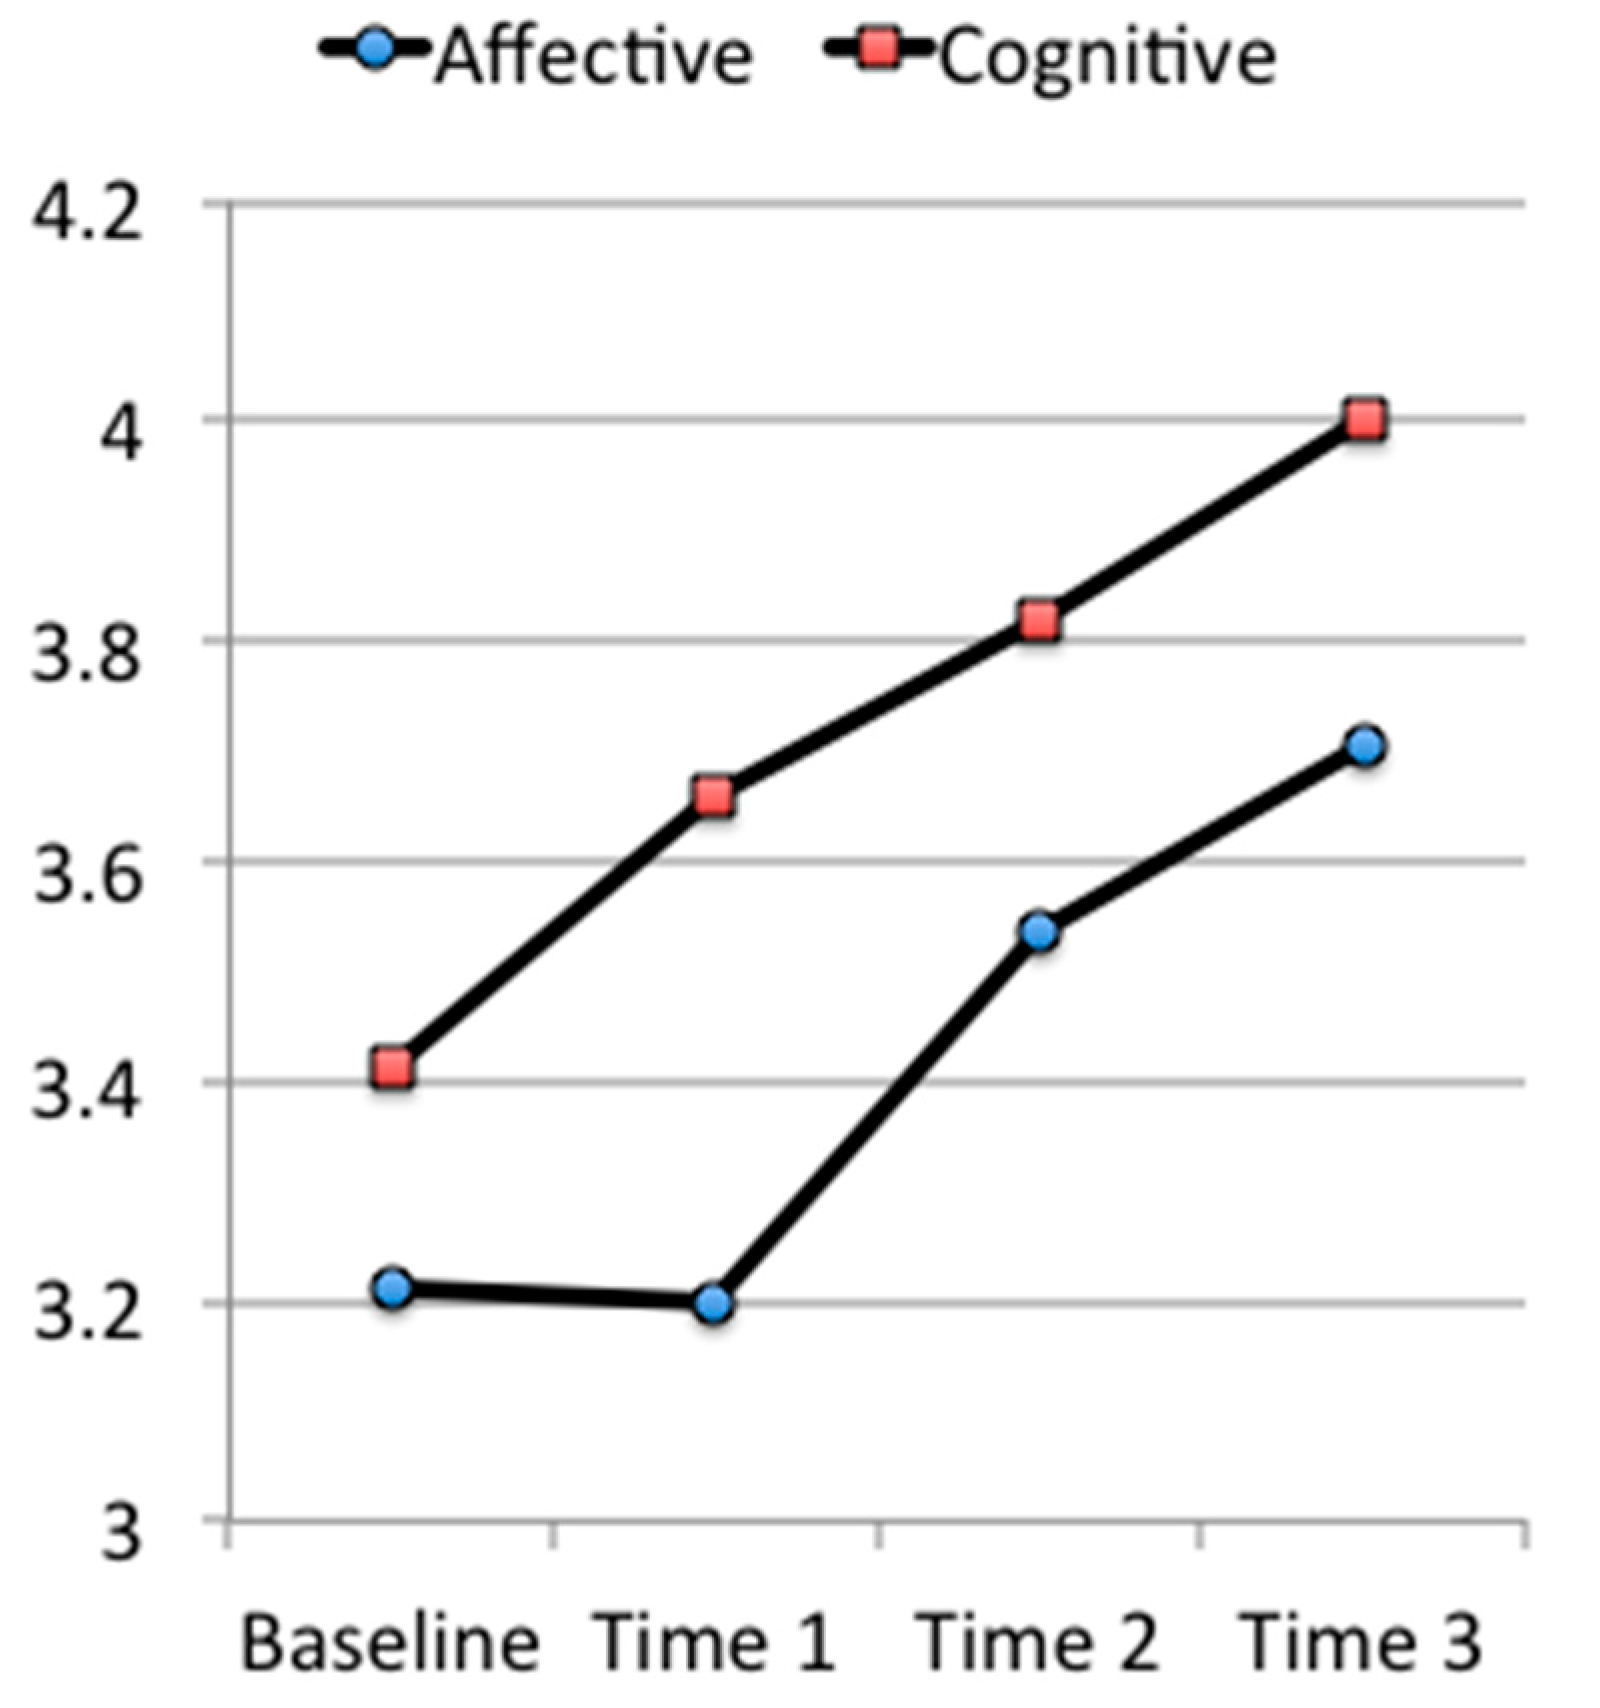
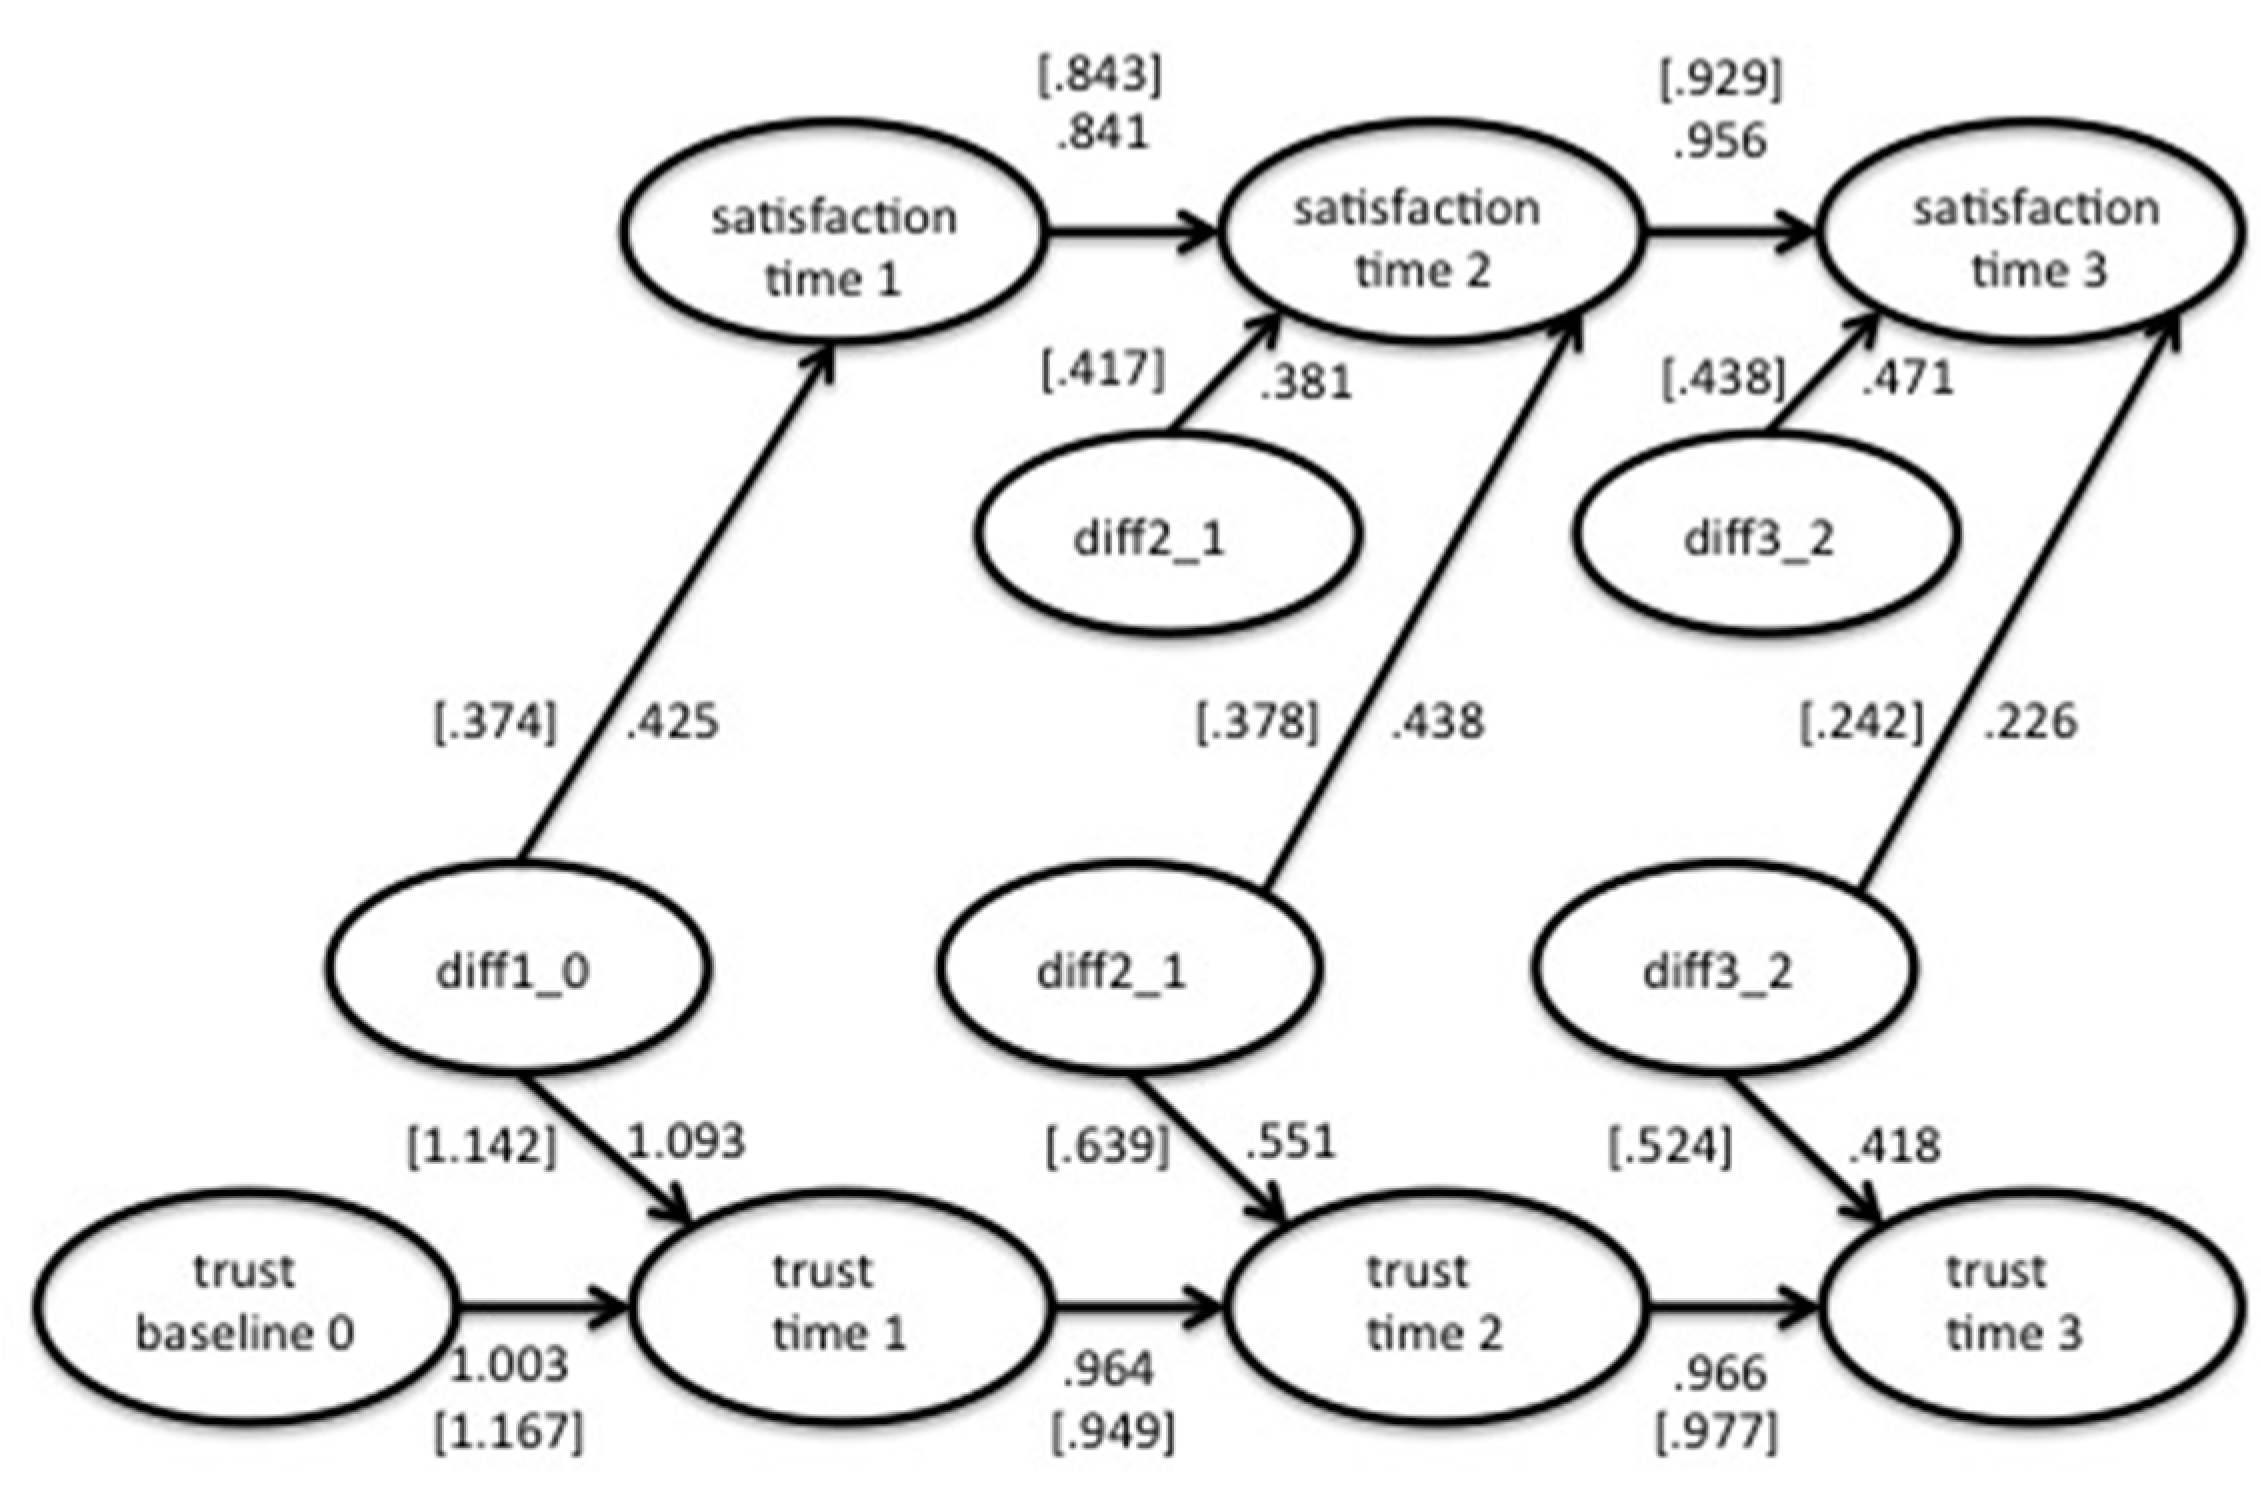
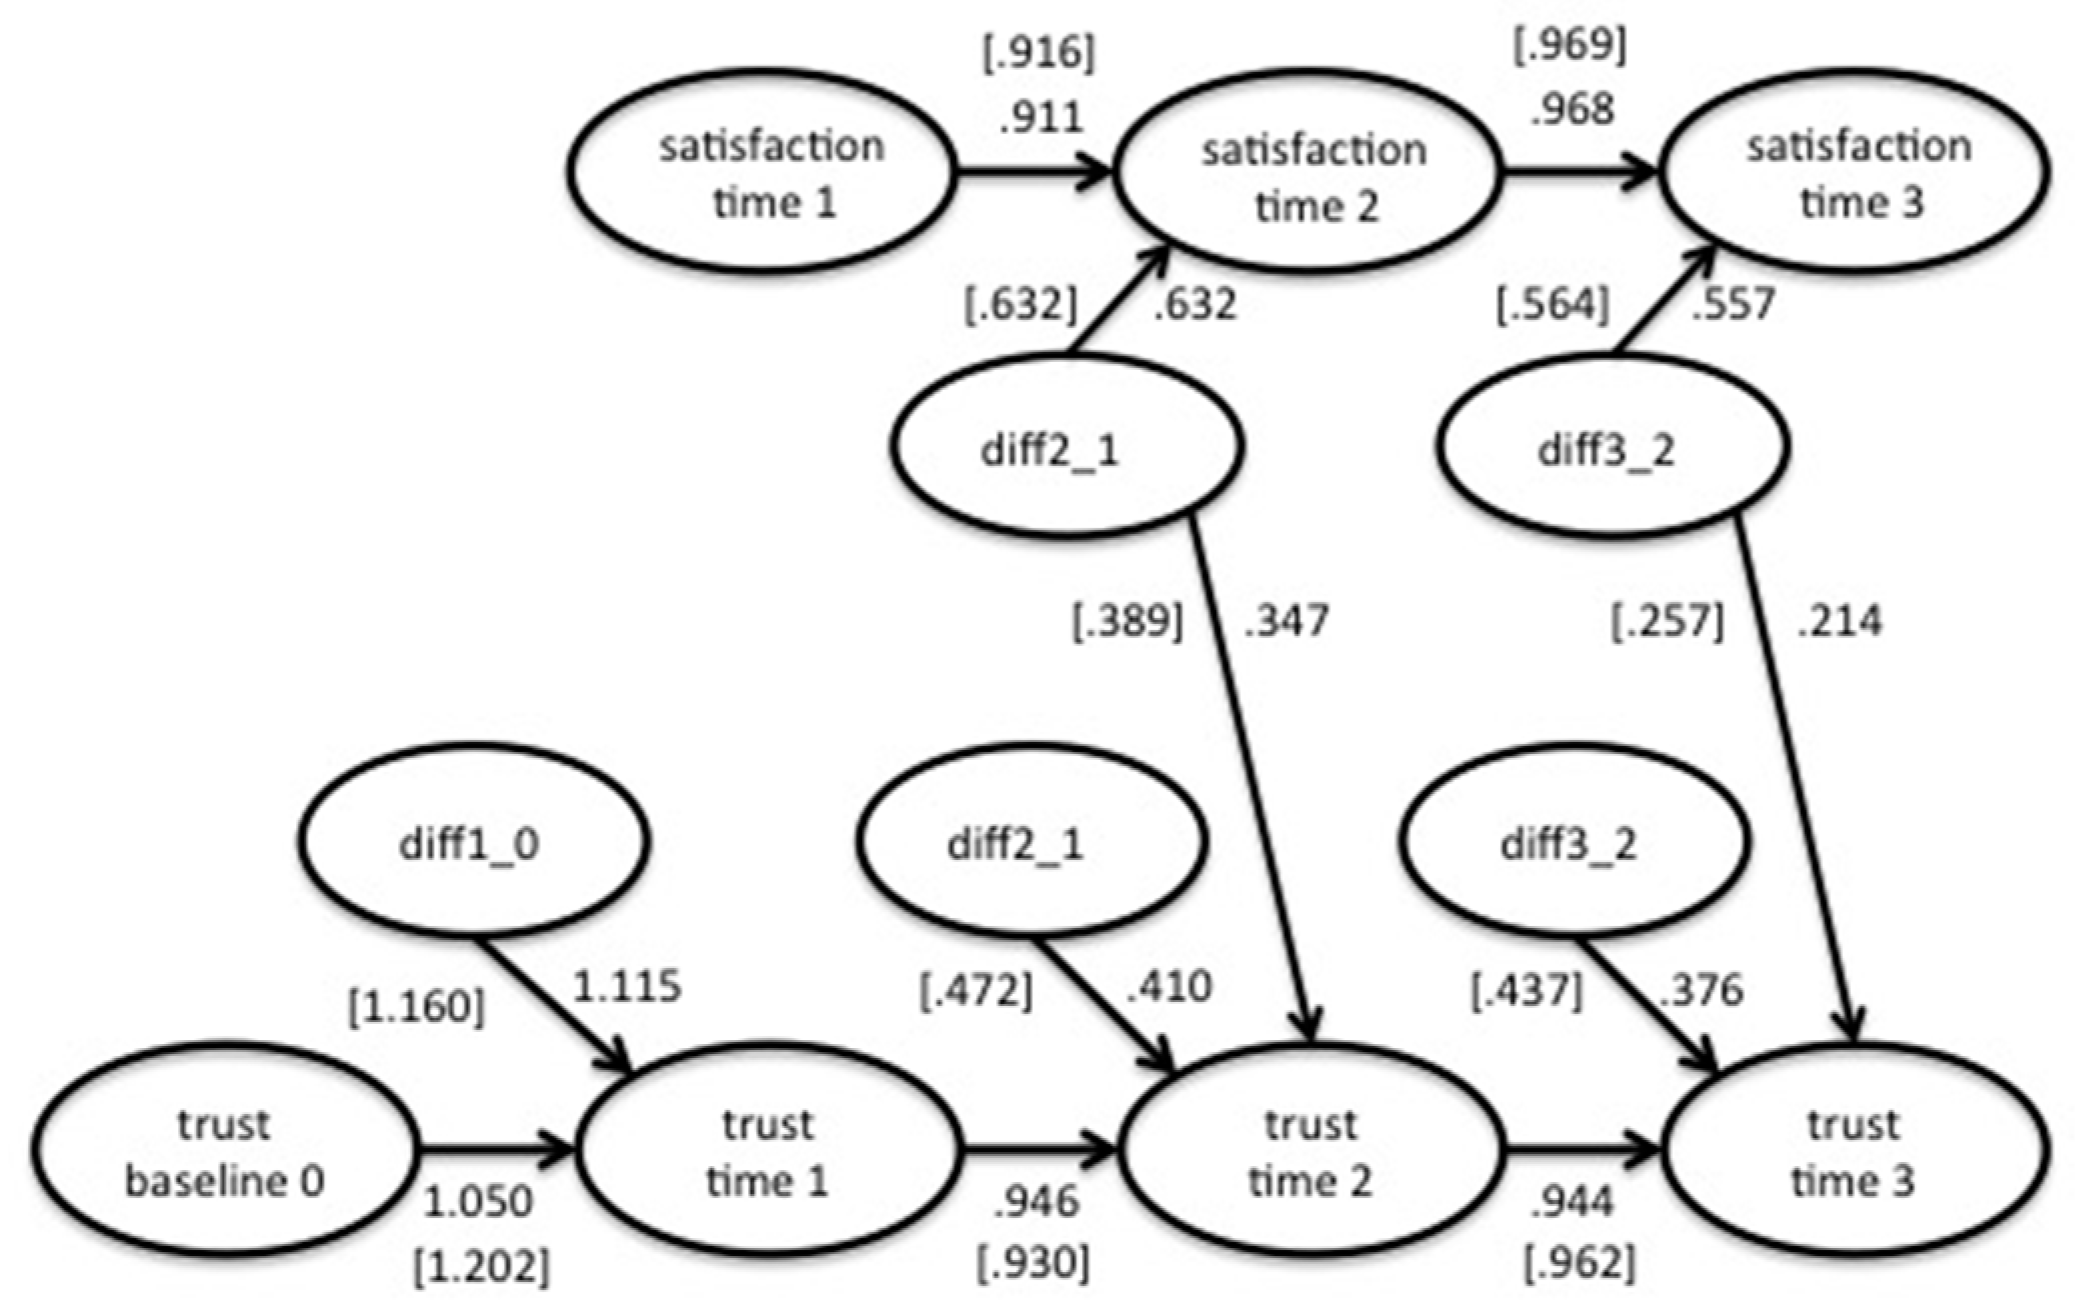
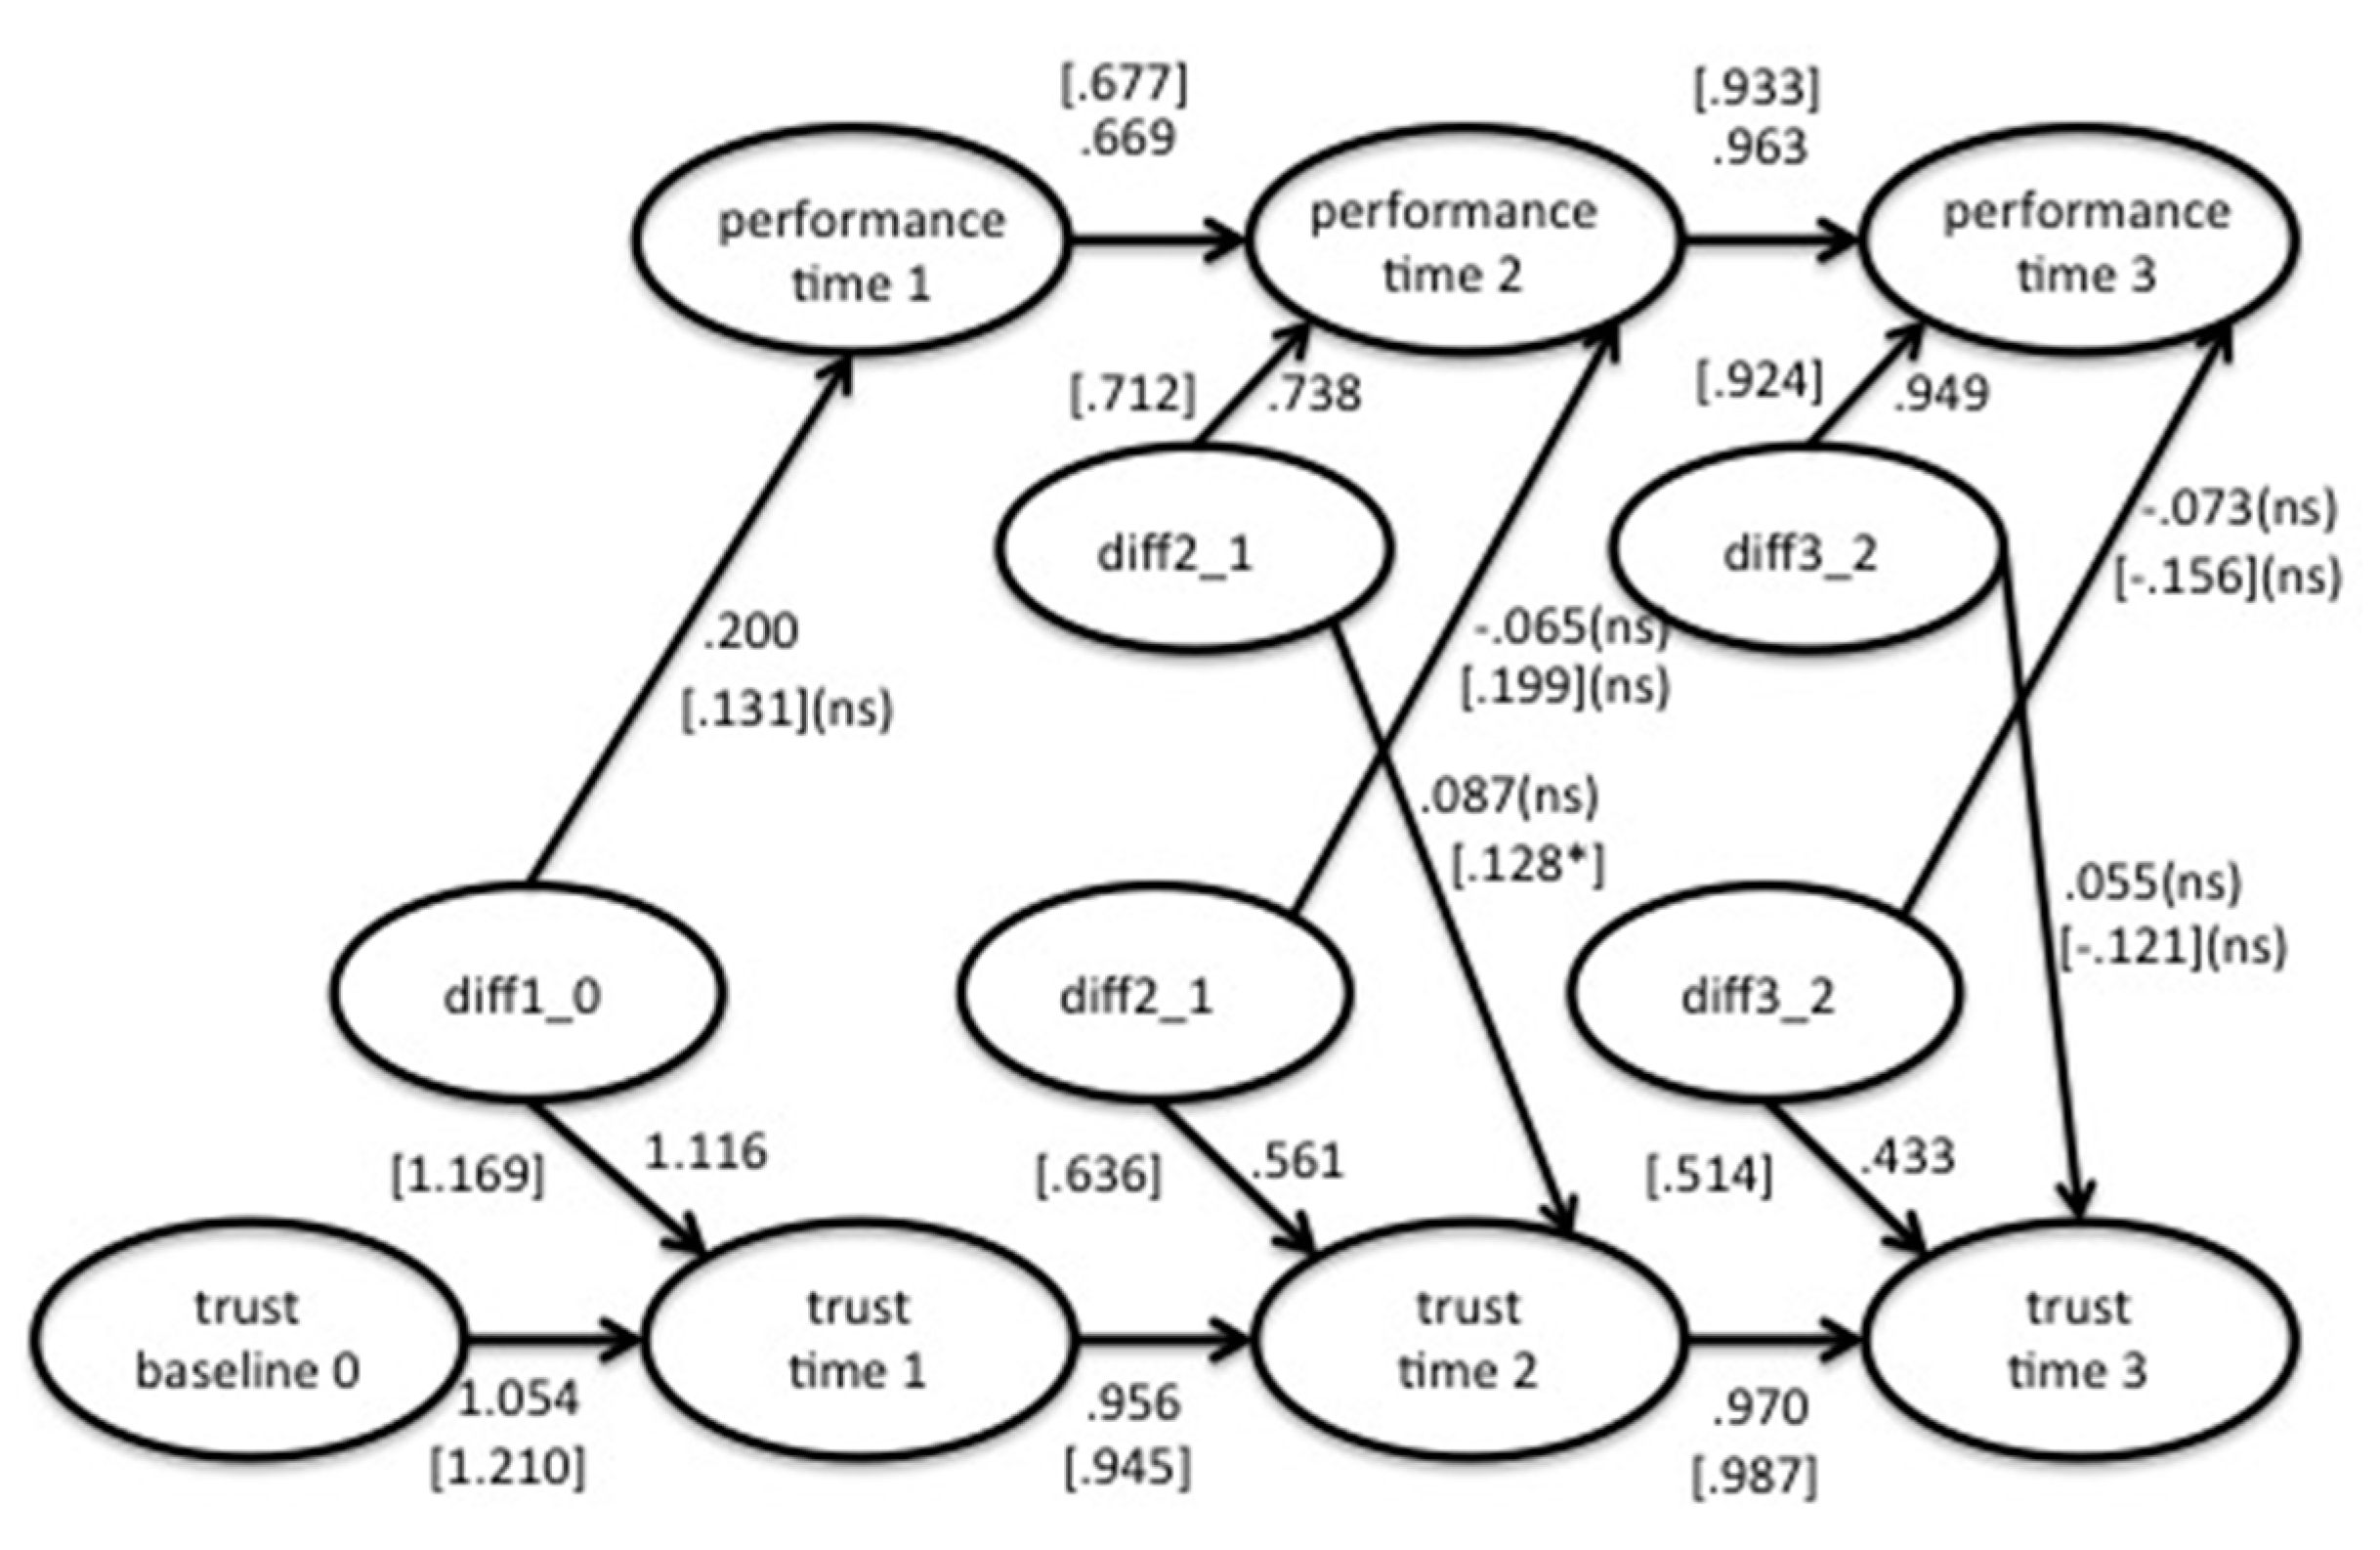
Table 1.
Latent state analysis of trust.
| Model | Χ2 | df | RMSEA | CFI | TLI | SRMR |
|---|---|---|---|---|---|---|
| Affective Trust | ||||||
| Null | 3459.85 | 120 | ||||
| Confirmatory factor model. Four intercorrelated trust factors | 599.84 | 98 | 0.131 | 0.850 | 0.816 | 0.063 |
| Latent autoregressive model | 608.14 | 101 | 0.130 | 0.848 | 0.820 | 0.063 |
| Baseline -> T1 -> T2 -> T3 | ||||||
| Autoregressive adding indicator specific latent variables | 168.16 | 86 | 0.057 | 0.975 | 0.966 | 0.037 |
| Autoregressive, indicator specific LVs, adding invariant factor loadings | 228.76 | 97 | 0.068 | 0.961 | 0.951 | 0.087 |
| Latent change model: invariant factor loadings and intercepts | 272.24 | 101 | 0.076 | 0.949 | 0.939 | 0.086 |
| Cognitive Trust | ||||||
| Null | 3498.94 | 120 | ||||
| Latent change model: invariant factor loadings and intercepts | 217.756 | 101 | 0.062 | 0.965 | 0.959 | 0.082 |
Table 2.
Latent state analysis of satisfaction.
| Model | Χ2 | df | p | RMSEA | CFI | TLI | SRMR |
|---|---|---|---|---|---|---|---|
| Null | 2378.20 | 36 | 0.000 | ||||
| Confirmatory factor model. Three intercorrelated satisfaction factors | 146.72 | 24 | 0.000 | 0.131 | 0.948 | 0.921 | 0.057 |
| Latent autoregressive model | 150.35 | 25 | 0.000 | 0.130 | 0.946 | 0.923 | 0.060 |
| S1 -> S2 -> S3 | |||||||
| Autoregressive adding indicator specific latent variables | 40.98 | 18 | 0.002 | 0.066 | 0.990 | 0.980 | 0.035 |
| Autoregressive, indicator specific LVs, adding invariant factor loadings | 60.94 | 22 | 0.000 | 0.077 | 0.983 | 0.987 | 0.064 |
| Latent change model: invariant factor loadings and intercepts | 66.30 | 25 | 0.000 | 0.075 | 0.982 | 0.975 | 0.064 |
Table 3.
Examining the relationship between changes in affective trust and changes in satisfaction with one’s team.
Table 3.
Examining the relationship between changes in affective trust and changes in satisfaction with one’s team.
| Model | Χ2 | df | p | RMSEA | CFI | TLI | SRMR |
|---|---|---|---|---|---|---|---|
| Change in affective trust influencing satisfaction | |||||||
| Null | 6300.69 | 300 | 0.000 | ||||
| A. Change in trust directly influencing satisfaction (see Figure 2) | 666.16 | 269 | 0.000 | 0.070 | 0.934 | 0.926 | 0.178 |
| B. Change in trust influencing change in satisfaction | 719.99 | 271 | 0.000 | 0.075 | 0.925 | 0.917 | 0.216 |
| Model comparison, model A vs. model B | 53.83 | 2 | 0.001 | ||||
| Change in satisfaction influencing affective trust | |||||||
| C. Change in satisfaction directly influencing trust (see Figure 3) | 694.96 | 268 | 0.000 | 0.073 | 0.929 | 0.920 | 0.215 |
| D. Change in satisfaction influencing change in trust | 717.20 | 273 | 0.000 | 0.074 | 0.926 | 0.919 | 0.217 |
| Model comparison, model C vs. model D. | 22.24 | 5 | 0.001 | ||||
| Bi-variant coupling change model | |||||||
| E. Combines parameters: Change in trust influencing satisfaction (model A) with Change in satisfaction influencing trust (model C), (see Figure 4). | 652.096 | 267 | 0.000 | 0.070 | 0.936 | 0.928 | 0.165 |
| Model E vs. Model A | 14.064 | 2 | 0.001 | ||||
| Model E vs. Model C | 42.860 | 1 | 0.001 | ||||
Table 4.
Examining the relationship between changes in cognitive trust and changes in satisfaction with one’s team.
Table 4.
Examining the relationship between changes in cognitive trust and changes in satisfaction with one’s team.
| Model | Χ2 | df | p | RMSEA | CFI | TLI | SRMR |
|---|---|---|---|---|---|---|---|
| Change in trust influencing satisfaction | |||||||
| Null | 6298.62 | 300 | |||||
| A. Change in trust directly influencing satisfaction. See Figure 2, parameter estimates in [ ]. | 584.423 | 269 | 0.000 | 0.063 | 0.947 | 0.941 | 0.201 |
| Change in satisfaction influencing trust | |||||||
| C. Change in satisfaction directly influencing trust. See Figure 4 parameter estimates in [ ]. | 599.18 | 268 | 0.000 | 0.065 | 0.945 | 0.938 | 0.214 |
| Bi-variant coupling change model | |||||||
| E. Combines parameters: Change in trust influencing satisfaction (model A) with Change in satisfaction influencing trust (model C). | 577.72 | 267 | 0.000 | 0.063 | 0.948 | 0.942 | 0.185 |
| Model A vs. Model E | 6.703 | 2 | 0.048 | ||||
| Model C vs. Model E | 22.46 | 1 | 0.001 | ||||
Table 5.
Examining the relationship between changes in affective and cognitive trust and performance.
Table 5.
Examining the relationship between changes in affective and cognitive trust and performance.
| Trust Type | Model | Χ2 | df | p | RMSEA | CFI | TLI | SRMR |
|---|---|---|---|---|---|---|---|---|
| Change in trust influencing performance | ||||||||
| Affective | Null | 3800.56 | 231 | |||||
| Cognitive | Null | 3859.65 | 231 | |||||
| Affective | A. Change in trust influencing performance. | 426.704 | 203 | 0.000 | 0.061 | 0.937 | 0.929 | 0.083 |
| Cognitive | B. Change in trust influencing performance. | 393.080 | 204 | 0.000 | 0.056 * | 0.948 | 0.941 | 0.087 |
| Change in performance influencing trust | ||||||||
| Affective | C. Change in performance influencing trust. | 408.47 | 202 | 0.000 | 0.059 | 0.942 | 0.934 | 0.082 |
| Cognitive | D. Change in performance influencing trust | 370.686 | 203 | 0.000 | 0.053 * | 0.954 | 0.947 | 0.086 |
| Bi-variant coupling change model | ||||||||
| Affective | E. Combines parameters: Change in trust influencing performance with Change in satisfaction influencing trust | 426.417 | 201 | 0.000 | 0.061 | 0.937 | 0.927 | 0.084 |
| F. Parsimonious. Same as model E, but fix non significant paths to zero. | 427.101 | 205 | 0.000 | 0.060 | 0.938 | 0.930 | 0.083 | |
| Model E vs. Model F | 0.684 | 4 | ns | |||||
| Cognitive | G. Combines parameters: Change in trust influencing performance with change in satisfaction influencing trust | 392 | 202 | 0.000 | 0.056 * | 0.948 | 0.940 | 0.088 |
| H. Parsimonious. Same as model G, but fix non significant paths in model B and D to zero. | 370.788 | 204 | 0.000 | 0.052 * | 0.954 | 0.948 | 0.086 | |
© 2017 by the authors. Licensee MDPI, Basel, Switzerland. This article is an open access article distributed under the terms and conditions of the Creative Commons Attribution (CC BY) license (http://creativecommons.org/licenses/by/4.0/).
Share and Cite
MDPI and ACS Style
Coovert, M.D.; Miller, E.E.P.; Jr., W.B. Assessing Trust and Effectiveness in Virtual Teams: Latent Growth Curve and Latent Change Score Models. Soc. Sci. 2017, 6, 87. https://doi.org/10.3390/socsci6030087
AMA Style
Coovert MD, Miller EEP, Jr. WB. Assessing Trust and Effectiveness in Virtual Teams: Latent Growth Curve and Latent Change Score Models. Social Sciences. 2017; 6(3):87. https://doi.org/10.3390/socsci6030087
Chicago/Turabian StyleCoovert, Michael D., Evgeniya E. Pavlova Miller, and Winston Bennett Jr. 2017. "Assessing Trust and Effectiveness in Virtual Teams: Latent Growth Curve and Latent Change Score Models" Social Sciences 6, no. 3: 87. https://doi.org/10.3390/socsci6030087
Note that from the first issue of 2016, this journal uses article numbers instead of page numbers. See further details here.