Entry and Degree Attainment in STEM: The Intersection of Gender and Race/Ethnicity

Department of Sociology, Syracuse University, Syracuse, NY 13244, USA
*
Author to whom correspondence should be addressed.
Soc. Sci. 2017, 6(3), 89; https://doi.org/10.3390/socsci6030089
Submission received: 26 September 2016
/
Revised: 10 July 2017
/
Accepted: 26 July 2017
/
Published: 8 August 2017
(This article belongs to the Special Issue Gender and STEM: Understanding Segregation in Science, Technology, Engineering and Mathematics)
Abstract
:This study focused on entry to and attainment of bachelor’s degrees in science, technology, engineering, and mathematics (STEM) fields, by examining gender and race/ethnicity in an intersectional manner and paying particular attention to STEM subfields. The intersectional analysis extends previous research findings that female students are more likely to persist in college once they are in a STEM field and further reveals that racial minority women share the same tendency of persistence with white women. Women and racial minorities are most under-represented in physical-STEM fields. Our analysis reveals that black men would have had the highest probability to graduate in physical-STEM fields, had they had the family socioeconomic background and academic preparations of Asian males. This highlights the critical importance of family socioeconomic background and academic preparations, which improves the odds for STEM degree attainment for all groups. Out of these groups, black students would have experienced the most drastic progress.
1. Introduction
The recent release of Science and Engineering Indicators (2016) once again highlights the under-representation of women and non-Asian racial minorities in science, technology, engineering, and mathematics (STEM) degree attainment, and in the STEM labor force (National Science Board 2016). This is a significant social issue, as STEM fields witness more job growth and promise higher earning potential than non-STEM fields. So, the under-representation of women and racial minorities in STEM could increase labor market inequality along race and gender lines. On a different level, as the demographics of the American population become more diverse, STEM workforce needs to catch up with demographic changes. Otherwise, the country runs the risk of losing its competitive advantages in the world.
The under-representation of women and racial minorities in STEM is particularly acute now, as racial minorities have made significant inroads into postsecondary institutions, and women in recent years have been obtaining bachelor’s degrees at a higher rate than men (Buchmann and DiPrete 2006). However, the increase of access to colleges and universities does not automatically bring about an increase of enrollment in STEM fields. Therefore, it is an increasingly worthy task for researchers to understand the processes leading to the under-representation of women and racial minorities in STEM fields.
Recent research has brought additional complexity to the theme of under-representation. Studies have shown that black students are as likely as their white counterparts to claim college majors in STEM fields (Hanson 2009; Ma 2009; Riegle-Crumb and King 2010). That is, initially, they are not under-represented in STEM fields; however, they are eventually under-represented in STEM degree attainment, but it is not clear why. Racial disparity in degree attainments generally exists, but we are not sure whether STEM degree attainment poses additional barriers for racial minorities. Research is needed to disentangle the process of STEM degree attainment from general degree attainment.
In addition, this study also pays particular attention to STEM subfield variations, as women and racial minorities are not uniformly under-represented across STEM subfields. Previous studies have documented strongly that women and racial minorities have made great inroads into life science and related STEM fields, but they are persistently under-represented in such fields as physics, computer science, and engineering (England and Su 2006; Frehill 1997; Ma 2009; Sassler et al. 2017). In computer science, women’s representation has surprisingly declined by 2013, as compared to the 1980s (Corbett and Hill 2015; Sassler et al. 2017). Engineering has witnessed more growth, but it still remains heavily male-dominated (Xie et al. 2015). For this reason, this study has differentiated STEM into life-STEM and physical-STEM fields, with the former including agricultural, biology, and other life science-related STEM fields, and the latter including physical science, math, computer science, and engineering.
This study focuses on both entry-level majors and bachelor’s degree attainment in STEM fields—the admission ticket to many STEM occupations (Xie and Shauman 2003). It examines patterns of representation in STEM subfields for the intersection of gender and racial/ethnic groups. It uses the National Education Longitudinal Studies (1988:2000) (NELS) from the National Center for Education Statistics. The NELS data make possible an examination of the process from college entry to degree completion, and also enable an examination of racial minorities, as the survey over-sampled Asians and Hispanics. The data also contains rich contextual information on high school academic preparations, which are important to understand STEM attainment in college.
In what follows, I will first review theoretical and empirical studies using intersectional perspectives of gender and race, and then review the relevant literature in understanding the process of STEM degree attainment. The process of STEM degree attainment can be understood from two angles. One is the trajectory that students have traveled. Do students graduate with STEM degrees by choosing their initial college majors in STEM and then persisting, or do they start with a non-STEM major and then switch later to STEM? The second angle is to understand the extent to which key background factors including family socioeconomic status and academic preparations account for group disparity in STEM attainment. The intersectional perspectives of race and gender can help elucidate new patterns and insights about the process of STEM degree attainment, in terms of both trajectories and contextual explanations for group disparity.
2. Intersectionality Studies
Critical race theorist and legal scholar Kimberlé Williams Crenshaw coined the term “intersectionality” in 1989 to address the marginalization that African American women and other women of color faced in both feminist and antiracist politics and theory. Crenshaw argued that the experience of women of color cannot be understood in terms of their gender or race. Therefore, she used the concept to denote the many ways in which race and gender interact to influence the experiences of African American women. In her book titled “Ain’t I A Woman? Black women and feminism,” scholar and social activist bell hooks examines the history of sexism and racism on black women and the civil rights movement and waves of feminist movements to the 1970s, against both forms of oppressions, which together have caused black women to suffer the most in American society (hooks 1981). While the idea of intersectionality was developed largely based on the experience of women of color, the concept has expanded to refer to the insight that social locations such as race, ethnicity, gender, class, sexuality, nationality, ability, and age do not function as stand-alone and mutually exclusive entities (Collins 2015, p. 2). In this sense, intersectionality calls attention to power relations that create social inequalities and injustices (Collins 2015, p. 5). Power shapes privileged and oppressed social categories that are interconnected, creating a “matrix of domination” (Collins 2015).
However, in understanding educational experiences in STEM fields, most studies treat gender and racial minorities in the aggregate, as if all men and women share similar experiences in STEM fields. It is also problematic to presume that gender is irrelevant when we examine racial/ethnic disparities in STEM fields (Muller et al. 2001). Recent research on subgroups clearly underscores the significance of examining gender and race/ethnicity from an intersectional perspective. Hanson (2009) found that African American girls, contrary to the expectation that they are doubly disadvantaged in STEM fields as members of two under-represented status groups, show a greater interest and a more positive attitude towards science than their white counterparts. A study by Riegle-Crumb and King (2010) questions the assumption that STEM fields are still dominated by white males, and they find that racial minorities are not under-represented as compared to whites in entering STEM fields in terms of college major choices. Unfortunately, their study has not included Asian students, a group highly visible in STEM. Also, their study examines only college major choices two years after high school. Their conclusion, consequently, cannot apply to ultimate degree attainment, in which racial minorities still fall behind.
Most recently, Ro and Loya (2015) have found out that among a sample of engineering students, black women rate their skills lower than white men and women, and also lower than black men. The authors suggest that black women may be suffering “a double effect because of their gender and race” (Ro and Loya 2015, p. 385). On the other hand, Ma (2010) has found that Asian women hold quite a positive attitude towards STEM fields, much more than their white counterparts. Lord et al. (2009) argue that many studies on engineering education literature fails to disaggregate women by race/ethnicity, therefore getting overgeneralized results that render minority women invisible. The intersectional analysis is needed to fully understand the group disparity in STEM attainment.
3. Pipeline Model or Revolving Door?
The “pipeline model” has been widely-used to understand the process of choice and attainment in STEM (Berryman 1983; Xie and Shauman 2003). As the metaphor of the pipeline indicates, the process is characterized by uni-directional rigid steps in choosing a college major and then persistence in attaining the degree. Other educational trajectories, e.g., choosing a non-STEM major initially, are viewed as “leaking from the pipeline.” The pipeline imagery is grounded in the framework of cumulative disadvantage theory (Merton 1968; DiPrete and Eirich 2006), which posits higher attrition rates among traditionally under-represented groups, such as women and racial minorities. The theory then holds that the probability of a later influx into the pipeline is small, and therefore, complete persistence should be the dominant means for any group to attain a STEM degree.
Contrary to cumulative disadvantage theory and the pipeline model, the revolving door theory—proposed by Jerry Jacobs (1989) in his seminal study of occupational sex segregation—provides a different approach that enables a more dynamic and fluid perspective. Jacobs found substantial flows of women into and out of male-dominated occupations. The “revolving door” perspective captures fluidity in aspirations and choices, allowing for delayed entry and attainment. Recent studies provide some empirical evidence for this view (Xie and Shauman 2003; Ma 2011), which indicates that most female STEM baccalaureates enter the STEM educational trajectory during college, after entertaining high school expectations of a non-STEM college major, whereas most male STEM baccalaureates anticipated majoring in a STEM field and held to this course in college. Ma (2011) further argued that the social control that prevents women from entering math and science fields during their pre-college years may ease up in college, which may help account for the influx of women into STEM later, in college. However, we are not yet certain of the more complex picture that may emerge after an examination of the intersection of gender and race/ethnic groups. Will racial minority women follow a similar trajectory of STEM degree attainment as white women, due to the more open and supportive environment in college than pre-college years? The intersectional analysis will provide empirical evidence to address this question.
4. Social Background Effects on STEM Choice and Attainment
Research has provided robust evidence for the impact of such contextual factors as family factors—particularly family SES—and high school academic preparations on STEM choice and attainment. There are substantial differences in STEM coursework and achievement between low-SES and high-SES students spanning from elementary schools to college (Miller and Kimmel 2012; NSB 2014). Various studies posit that high-SES parents can provide the necessary resources, exposure, and access to experiences that lead to later interest and participation in STEM (Archer et al. 2012; Dabney et al. 2013; Sjaastad 2012). In this aspect, racial minorities, black and Hispanic students in particular, are disadvantaged because they disproportionately derive from low-income households. Under-represented racial minorities are more likely to be in remedial courses and less likely to take advanced math and science courses than their white and Asian peers (Kelly 2009; Nord et al. 2001; NSB 2014). It is important to disentangle the effects of race from those of family SES, although they highly correlate in the U.S.
Academic preparations in pre-college math and science have been identified as the key determinants for participation in STEM fields in college (Adelman (1998, 2006); Smyth and McArdle 2004; Tai et al. 2006). However, recent research has consistently documented that aggregate gender differences in academic preparation, such as course taking and test scores, are negligibly small and can account for virtually nothing of the differences in the choice of a STEM major (Simon and Farkas 2008; Xie and Shauman 2003). Performance at the college level also influences students’ educational trajectory, leading to STEM degree attainment. Some research suggests that when women and minorities fail a course, they are more likely not to repeat the course and to switch their major (Seymour and Hewitt 1997). Course grades in the first years of college may predict program retention (May and Chubin 2003). Few studies at the national level exist concerning the intersection of gender and race/ethnic patterns. However, some studies have shown that African American females have higher levels of academic preparation than their male counterparts (Hyde and Linn 2006; Riegle-Crumb 2006), and Asian American women show a much stronger tendency than white women to major in STEM fields, though they still fall behind Asian men (Ma 2011).
5. Research Questions
This study investigates the following questions:
- ○
- What are the patterns of representation in STEM fields in college in terms of the intersection of gender and racial/ethnic groups?
- ○
- How does the group representation vary at the starting and end points of students’ college careers? Is under-representation among minorities driven mainly by their lower overall likelihood of finishing college, or does persisting in a STEM field pose additional barriers?
- ○
- How do race and gender distributions vary across STEM fields? Specifically, we distinguish life-STEM (biology and life sciences) and physical-STEM (physical science, math, computer, and engineering). How do race and gender distributions vary across STEM fields after taking into account family and academic backgrounds?
6. Data and Analytical Samples
The study uses the NELS: 88-2000 and the Postsecondary Education Transcript Study, which is the nationally representative dataset, collected by the National Center of Survey Statistics (NCES). NELS data is the most recent nationally representative longitudinal study that spans from students’ 8th grades to 8 years after high school. The 1988 eighth grade cohort was followed at two-year intervals as the students passed through high school and entered post-secondary education. Similar to previous datasets collected by NCES, NELS data contain rich information on student pre-college academic preparation, including detailed information on coursework, and its postsecondary transcript data contains detailed curriculum and postsecondary attendance and attainment information. This survey allows for study of college access, college major choice, and degree attainment. The studies also oversampled Asians and Hispanics, which makes it possible to study racial patterns as well.
Since this study examines two sequential outcomes—the initial college major choice and STEM degree attainment—there are two distinct samples. For the initial major choice, the sample consists of all the postsecondary participants, based on transcript data, who also identify as one of four racial/ethnic groups: non-Hispanic Whites, non-Hispanic Blacks, Hispanics, and Asians. This results in 9272 students—among whom, 1657 has claimed STEM fields as their initial major, 5555 has claimed non-STEM fields as their initial majors, and 2060 students were undecided. The sample for STEM degree attainment consists of all those with bachelor’s degrees, and the sample size is 4020—among whom, 1013 have attained STEM degrees. Appropriate weights variables are also employed in the analysis.
7. Variables
7.1. Dependent Variables
The dependent variables are the initial college major, and bachelor’s degree major. The NELS data have the first college major information; bachelor’s degree major information was obtained from the NELS: 88/2000 Postsecondary Transcript files. An aggregated variable with 12 categories (BAMJR) is used, and STEM fields include life science, math, physical, and computer sciences, engineering (of all sorts); the rest are non-STEM fields. STEM fields are further differentiated into life-STEM (agriculture, biology, and life-science related), and physical-STEM (computer, math, physical science, and engineering). This coding is a modified version of the coding used by the National Science Foundation, as well as by other researchers (Frehill 1997; Ma 2011).
7.2. Independent Variables
7.2.1. Academic Preparation
Academic preparation is measured using high school course taking and standardized test scores in math and science from the 12th grade and first year college GPA. These factors are domain-specific, and are considered to be important factors for the bachelor’s degree attainment in STEM fields. Course taking information was gathered from high school transcripts, and includes the highest math course taken in high school. It has nine categories: Basic/Remedial Math, General/Applied Math, Pre-Algebra, Algebra I, Geometry, Algebra II, Advanced Math (Algebra III, Finite Math, Statistics), Pre-calculus (including Trigonometry), and Calculus. The course taking and test scores have some missing, and we use group means to impute for those missing values.
7.2.2. Demographic Variables
Demographic variables include gender, race, and family socioeconomic status (SES). Race consists of four categories: non-Hispanic Whites, non-Hispanic Blacks, Hispanics, and Asian/Pacific Islanders. Family SES is a composite measure drawn from information on both parents’ education and their occupations and income.
8. Findings
8.1. Entry
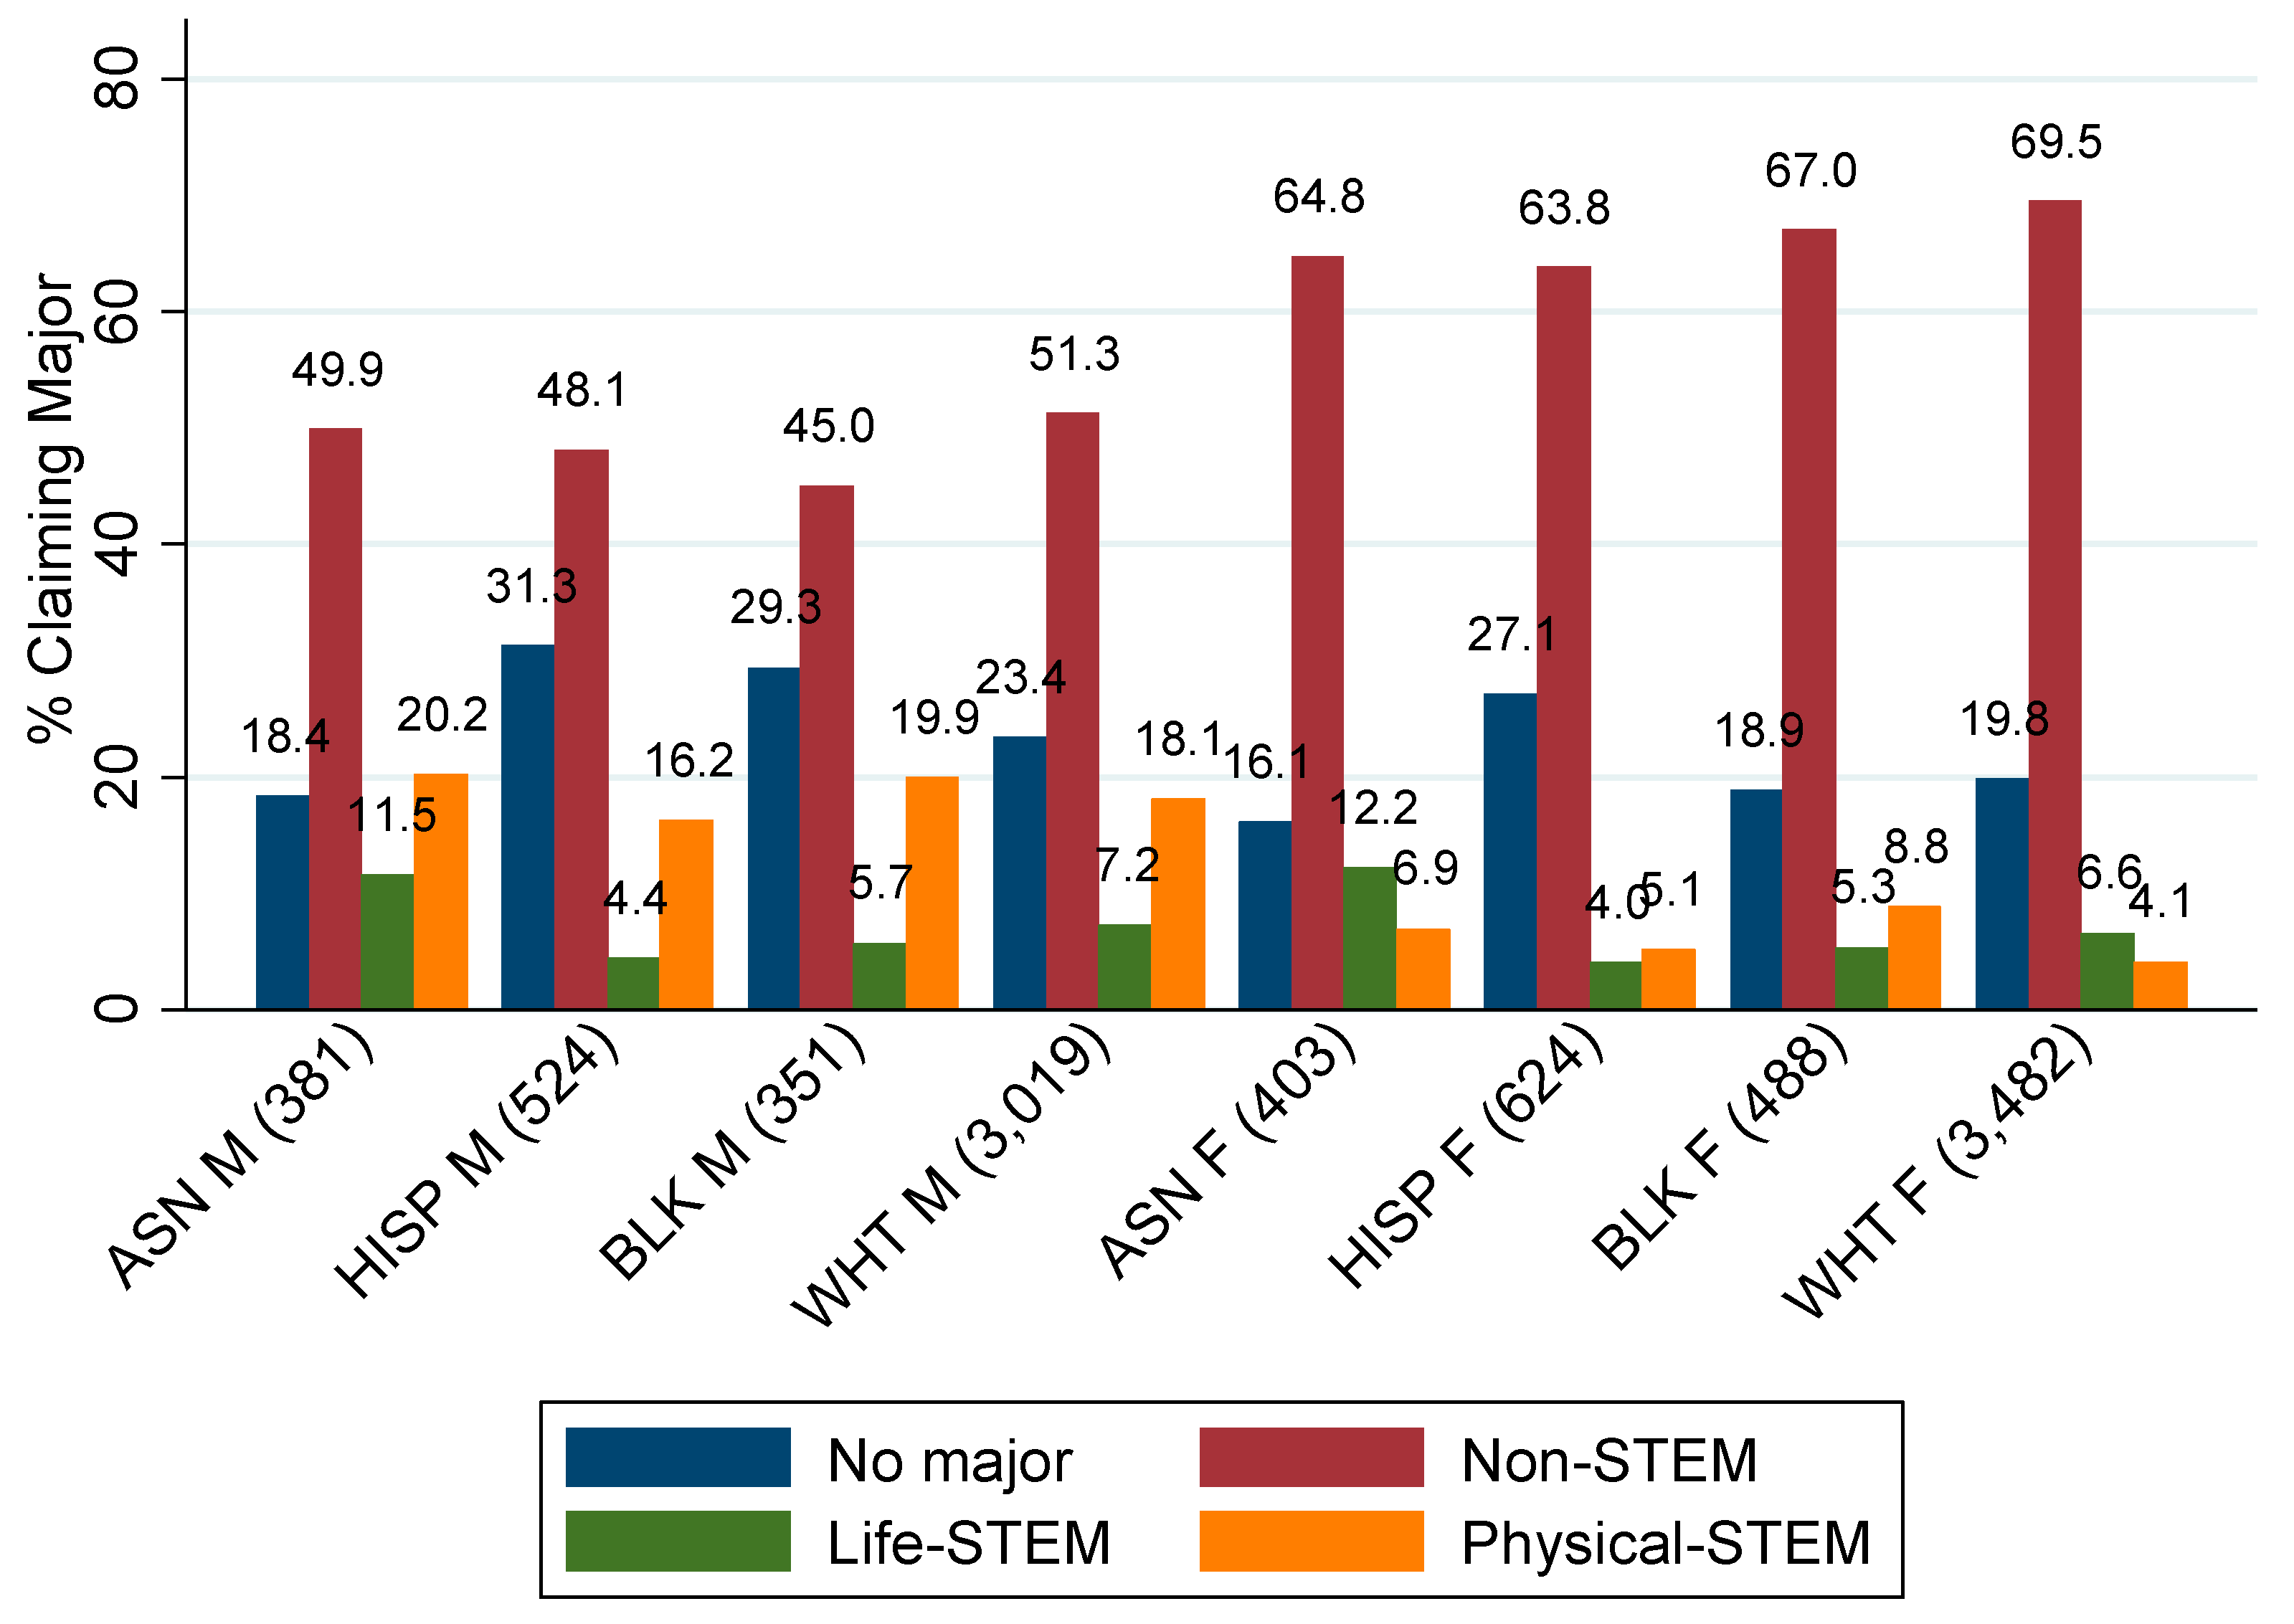
Figure 1 presents the percentage of students from eight groups who chose a STEM field as their first college major. Because most of the participants were in their second year in college, a bit more than one fifth of students had not yet declared a college major. Asian males topped the chart, with more than 30 percent in STEM. The lowest male group—Hispanics—had more than 20 percent in STEM fields, still higher than the highest female group—Asian females, at 19 percent. While males are overall more likely to enter STEM fields than females, there are significant group variations across STEM subfields. In general, life-STEM fields witnessed much more female presence, while physical-STEM fields had a quite low female presence. In particular, over 12 percent of Asian females entered life-STEM fields, surpassing all male groups. The other notable finding was that blacks were not at all under-represented. Black males were as likely as white males to claim STEM majors. Black females are more likely than white females to enter STEM fields. More than 14 percent of black females had their first college major in a STEM field, compared to less than 11 percent of white females. In particular, black females are about twice as likely as their white counterparts to enter physical-STEM fields. Black females also overtook Asian females in their entry to physical-STEM fields.
8.2. STEM Degree Attainment
Figure 2 shows the group patterns in STEM bachelor’s degree attainment. The NELS data collected entry information (initial college major choices) in 1994, and the degree attainment information in 2000, eight years after high school. Figure 2 shows that among the 9272 students who were enrolled in college in 1994, a significant number of them have no degrees six year later. Racial gaps are paramount. Over 65 percent of black males and 64 percent of Hispanic males have not obtained any degrees, compared with 33 percent of Asian females with no degrees—the lowest among all the groups. In terms of STEM degree attainment, Asian females have a higher rate of STEM degree attainment than all of the male groups, except for Asian males. Close to 20 percent of the Asian females have attained bachelor’s degrees in STEM fields, compared to less than 15 percent of white males and less than 10 percent of black and Hispanic males. Asian males still topped the chart, with 24 percent graduating in STEM. There are significant variations across STEM-subfields. In particular, Asian females have the highest representation in life-STEM fields among all race-gender groups, with over 14 percent of Asian females graduating from life-STEM fields. However, less than 6 percent of Asian females graduated from physical-STEM fields and they trailed behind every male group, except for Hispanic males. Physical-STEM fields seem to be daunting for all females, with Asian females most represented (less than 6 percent) among all females. Although black females surpassed Asian females in their tendency to choose a physical-STEM major, they were left behind when it comes to degree attainment.
Given both black males and females were initially not under-represented in STEM fields but eventually are, this suggests a severe attrition issue for black students. But the question remains: Are the seemingly high attrition rates due to their higher rate of dropping out of college, or due to their higher rate of switching out of STEM fields?
8.3. Attrition for Those with Initial Majors in STEM and Non-STEM Fields
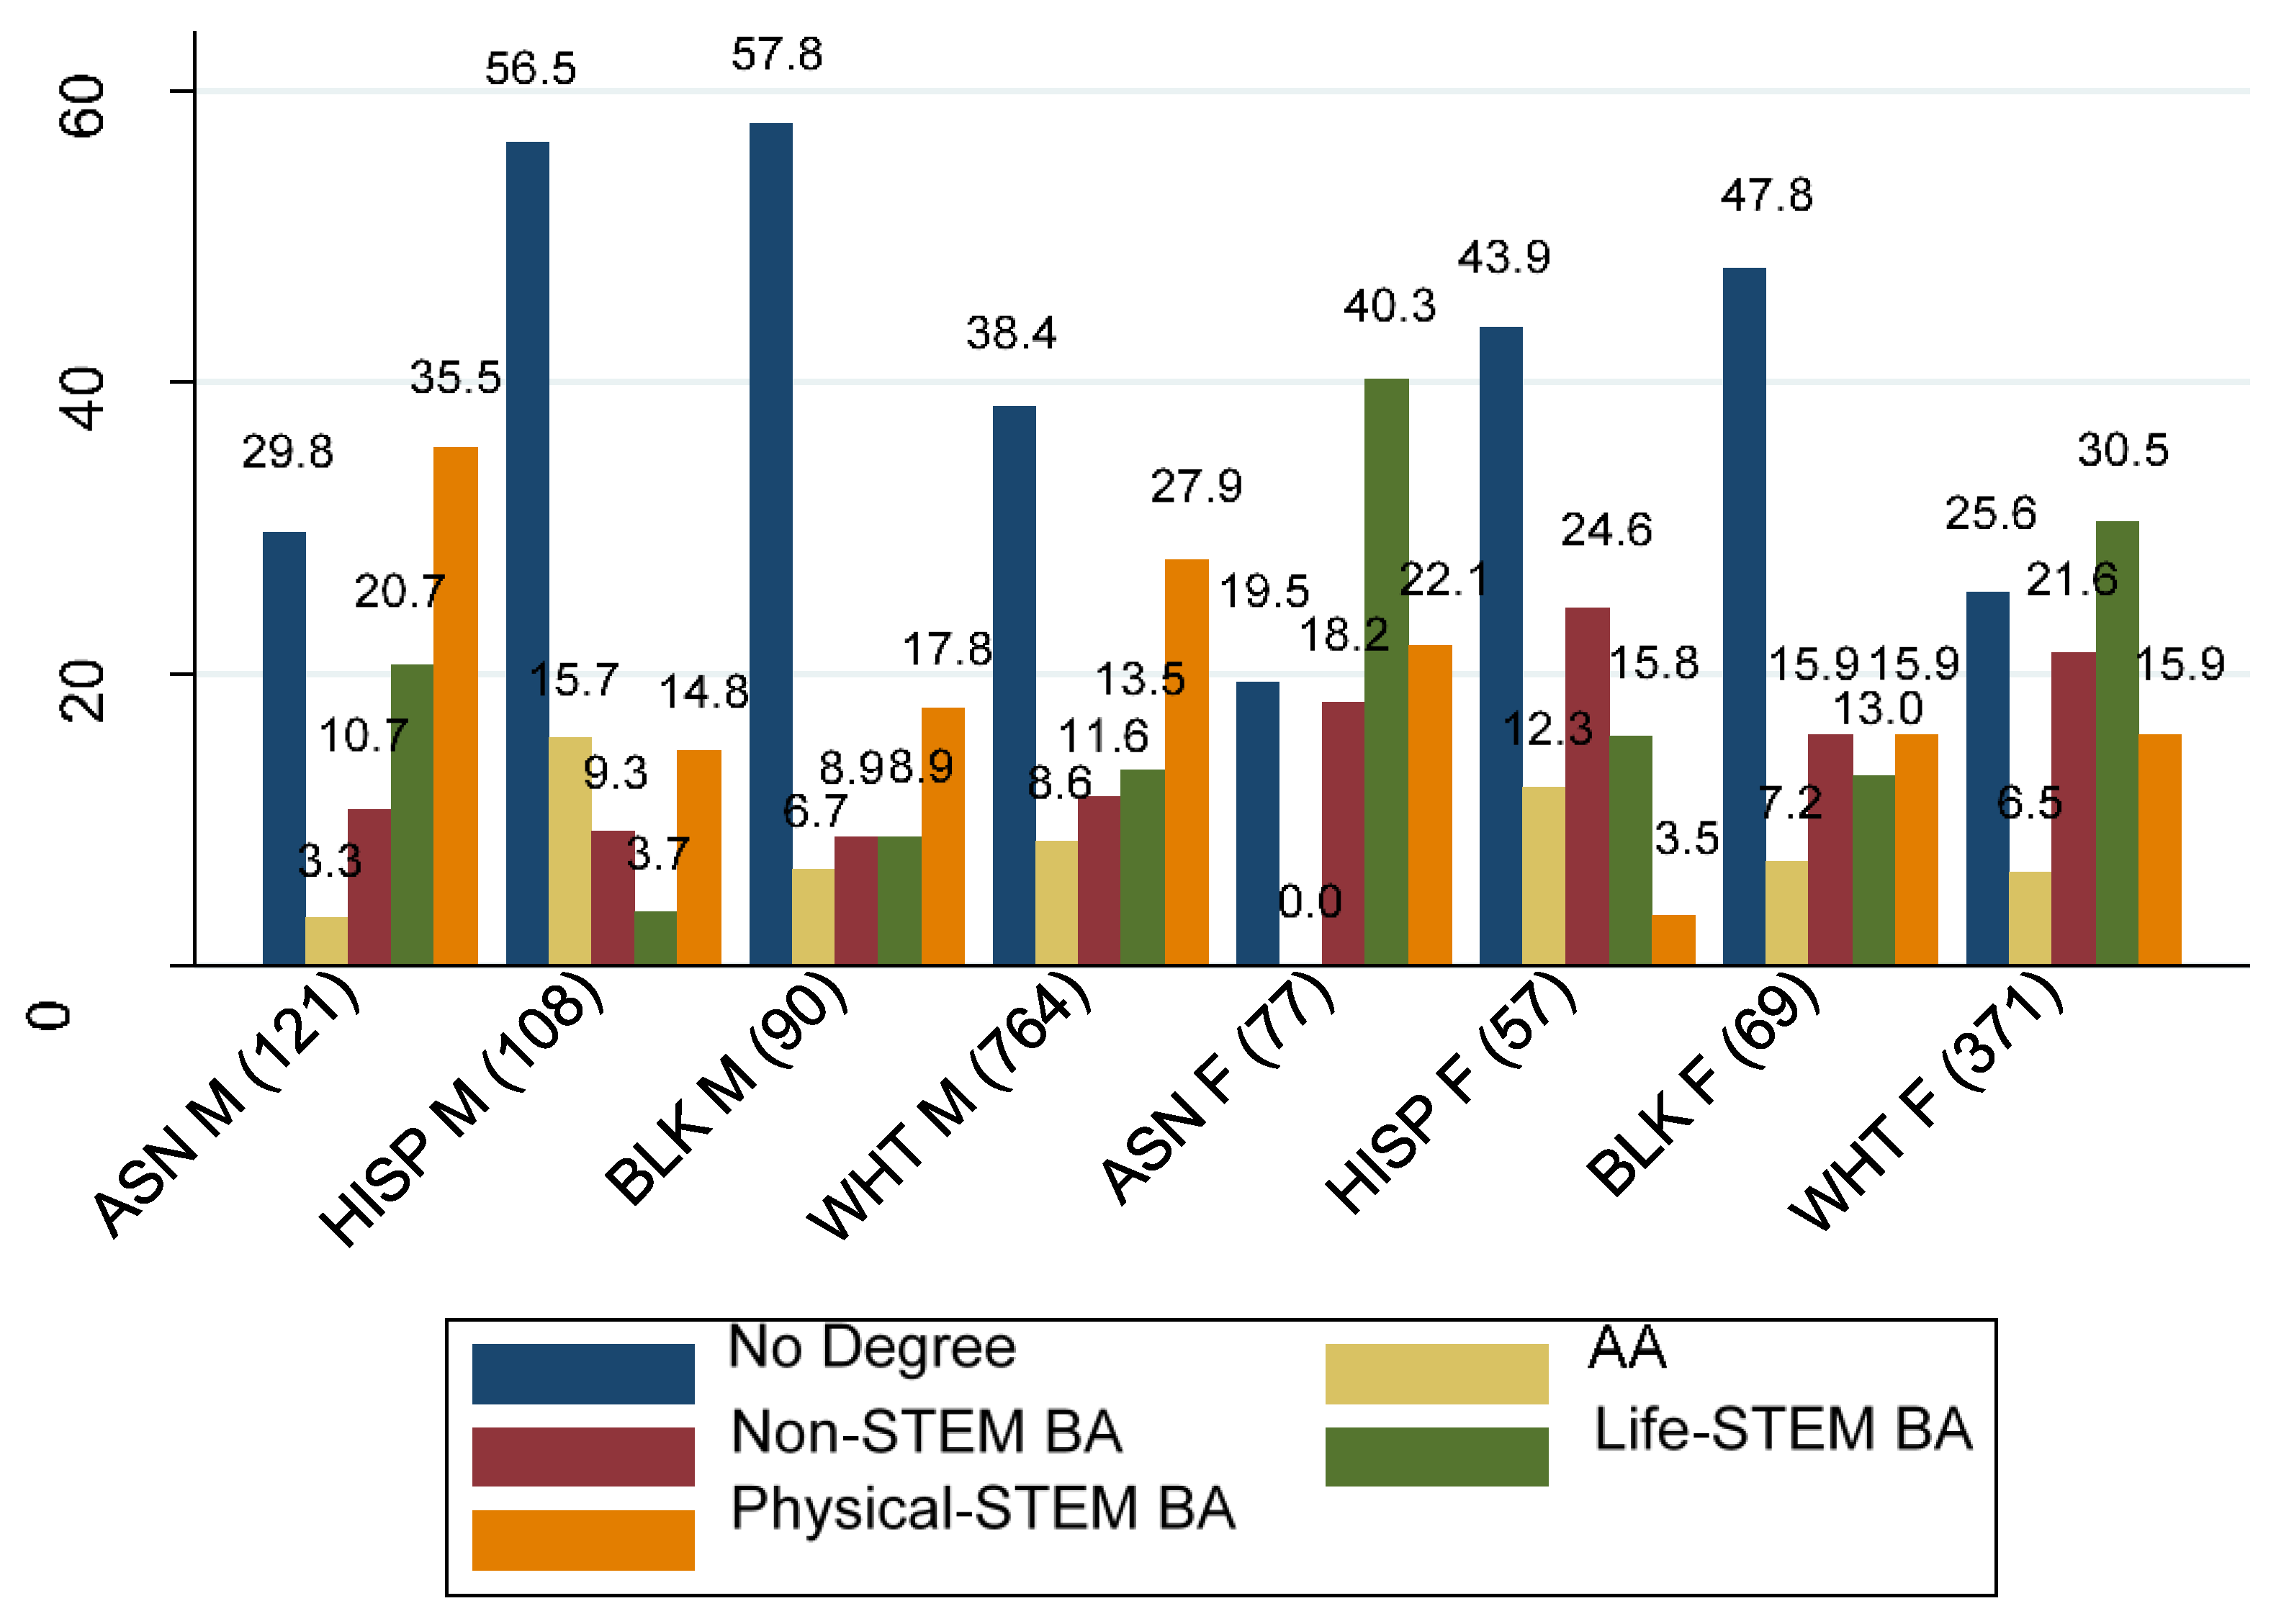
Figure 3 and Figure 4 can help address the above questions. Figure 3 examines outcomes for those who claimed a STEM field as their initial college major. There were 1657 students who had initial majors in STEM in 1994. These students could have four potential outcomes in 2000: no degree, associate degree, bachelor’s degree in STEM fields, and bachelor’s degree in non-STEM fields. A strong pattern emerges: females of all groups persisted slightly more than males, and Asian females had the highest persistence rate among all of the groups. Among those who claimed a STEM field as their initial college major, 62 percent of Asian females ultimately attained their bachelor’s degree in a STEM field, followed by 56 percent of Asian males and 46 percent of white females. Among STEM graduates, all the males have more degrees in physical-STEM than in life-STEM, and the reverse is true for females, but black females remain the exception. While black females and white females share similar percentage in physical-STEM fields (over 15 percent), there are 13 percent of black females in life-STEM fields, compared with over 30 percent of white females in life-STEM fields.
A close examination of the question of attrition shows that black males have the highest percentage of dropping out of college: over 57 percent of those who initially claimed a STEM college major left college without any degree, compared to less than 20 percent of Asian females. Hispanic males were equally likely to drop out of college. Since there were many fewer black and Hispanic students completing college, the number of those who switched out of STEM and graduated with a non-STEM degree was also less than the number of white and Asian students.
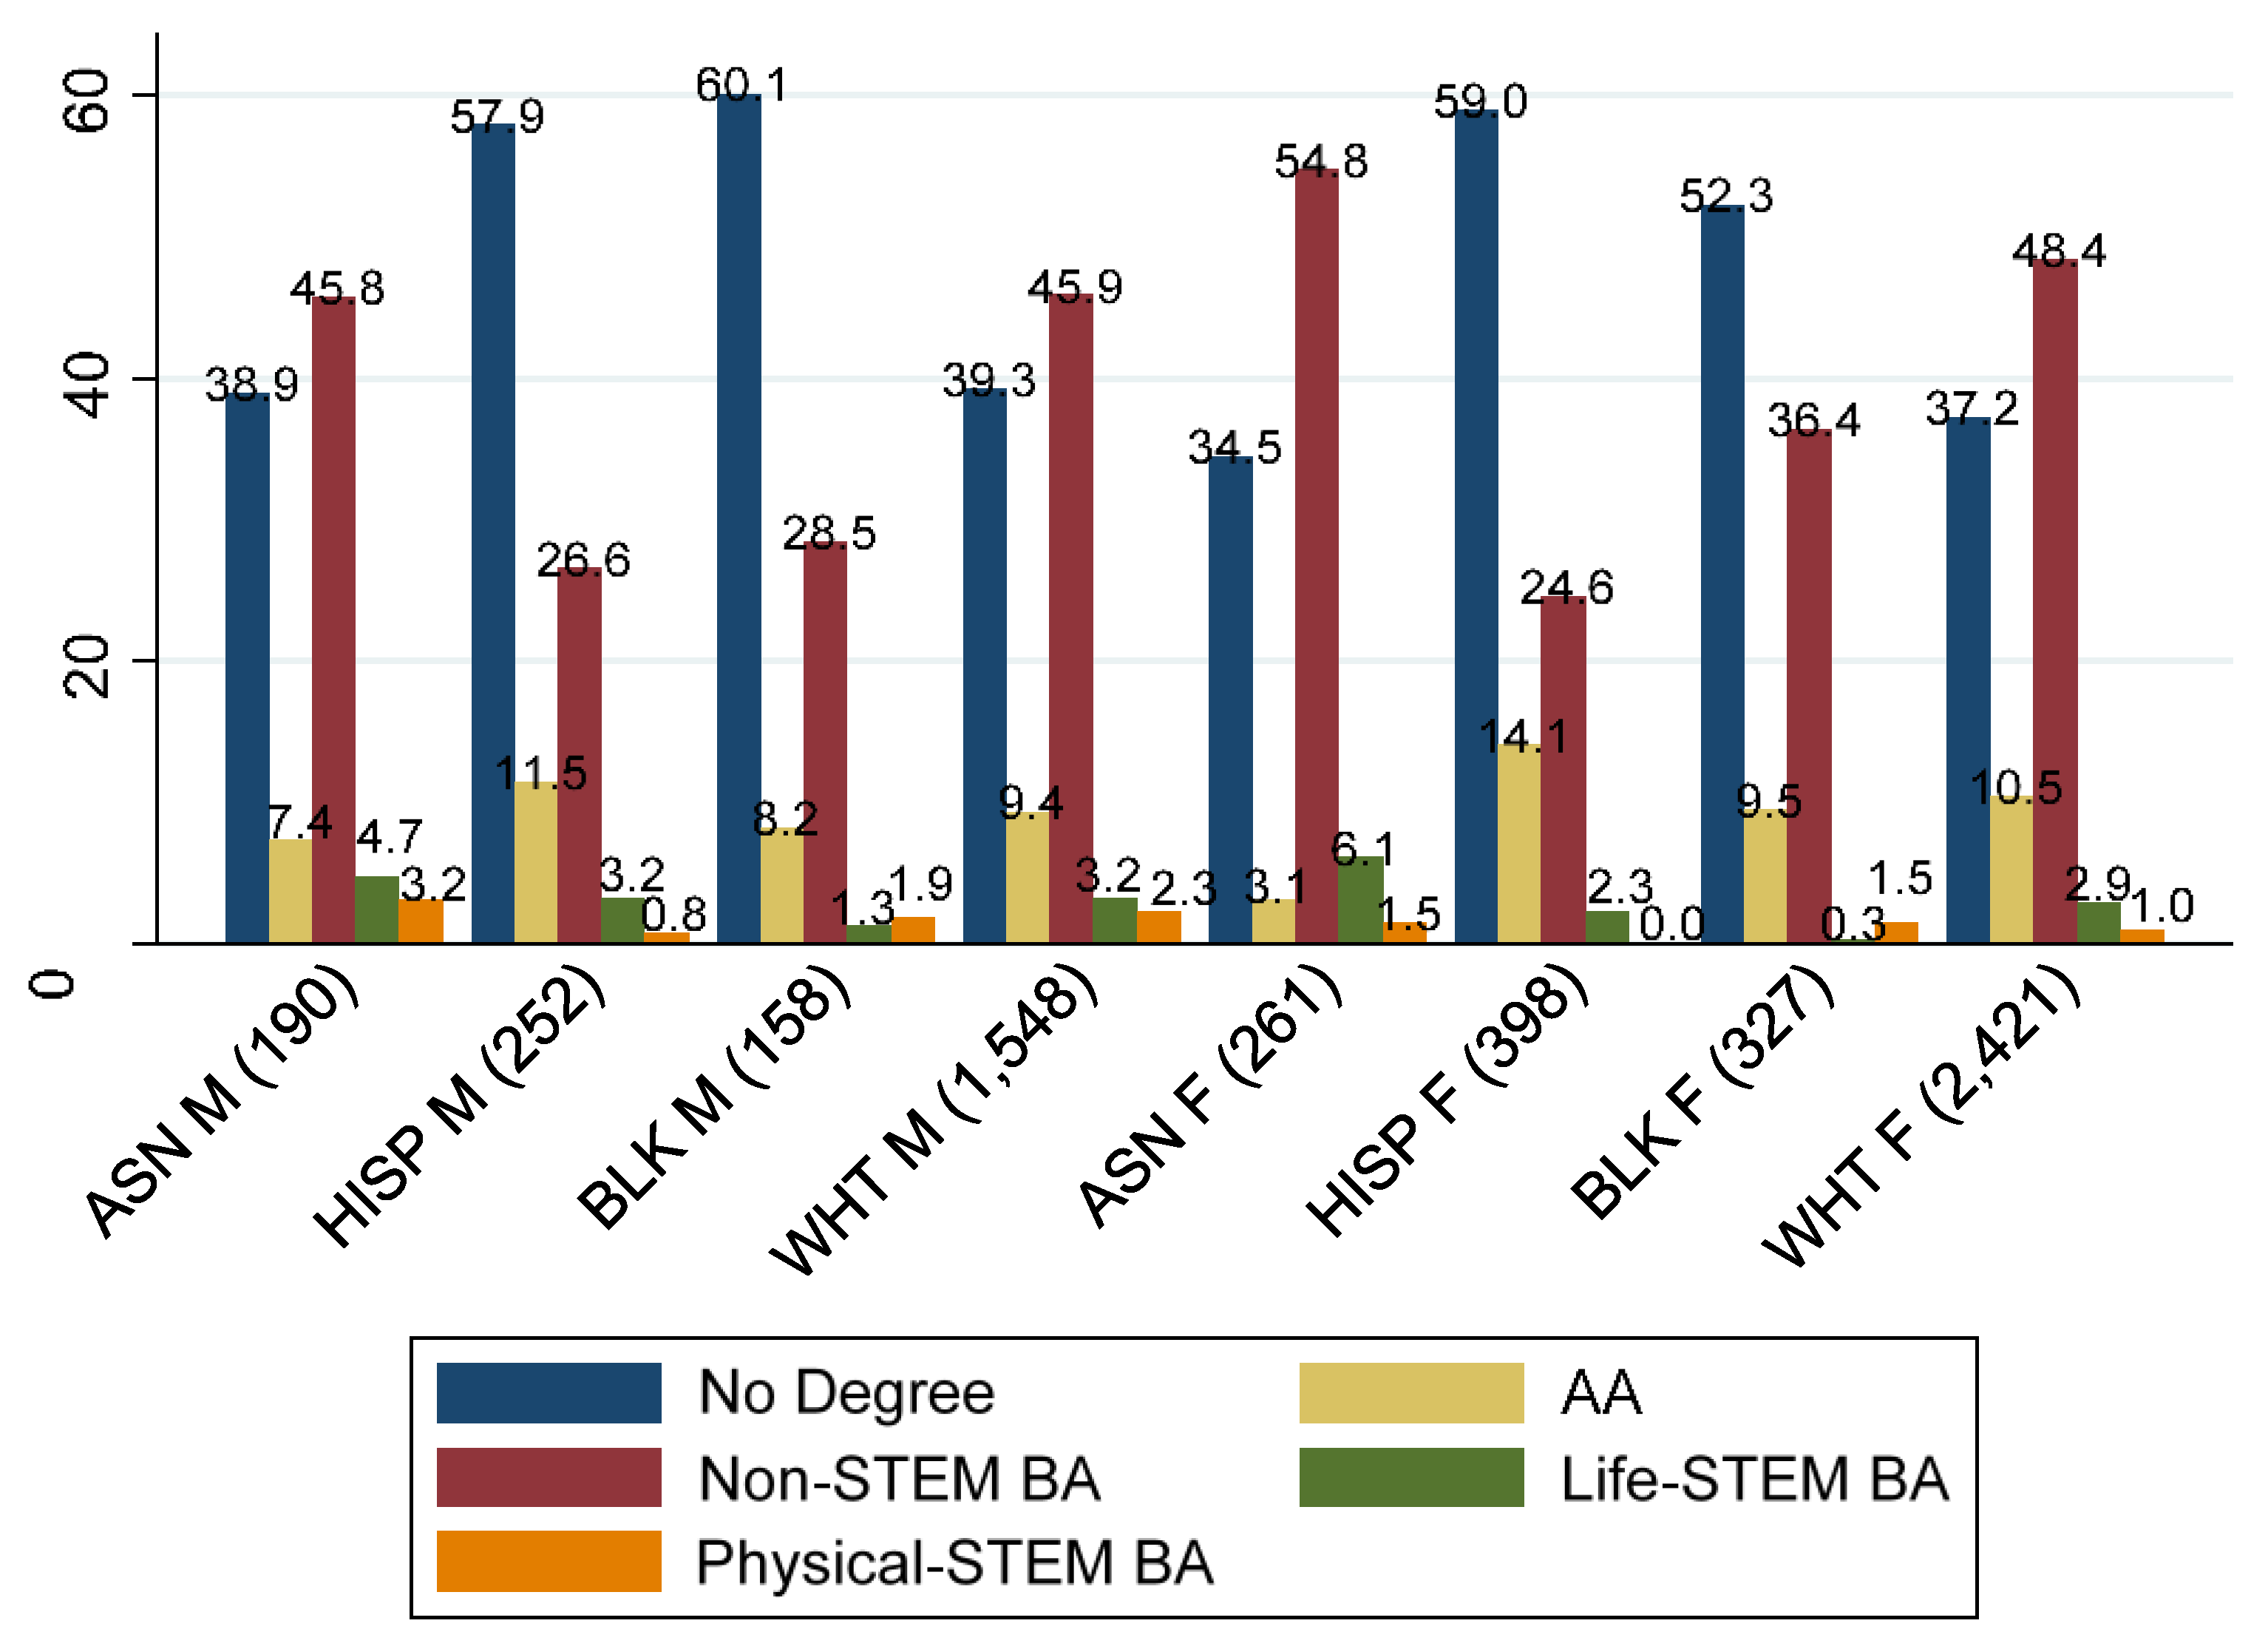
Figure 4 examines the outcomes of those with an initial major in a non-STEM field. This figure, along with Figure 3, offers a comparison of the attrition rates among those who started with STEM and non-STEM fields. The interesting pattern emerges that for females, entering a STEM field is associated with a much lower attrition rate than entering a non-STEM field; this pattern is not so strong for males. For example, more than 34 percent of Asian females in non-STEM fields dropped out of college, compared to less than 20 percent of their counterparts in STEM fields; close to 60 percent of Hispanic females in non-STEM fields left college with no degree, compared to 44 percent of their counterparts in STEM fields. The same pattern applies to white females: 37 percent in non-STEM fields did not complete college, compared to only 25 percent of their counterparts in STEM fields. Black females exhibit similar patterns, though the gap is not as salient. This seems to indicate that female students who enter STEM fields are positively selected in ways that drive them to persist in college.
For males, entry into STEM does not make as much of a difference in completing college, with the exception of Asian males. Less than 30 percent of Asian males in STEM fields drop out of college, compared to 39 percent of their counterparts in non-STEM fields. Blacks show a similar pattern, but the gap is not salient. For whites and Hispanics, the type of college major makes virtually no difference.
8.4. Trajectory of STEM Degree Attainment
Figure 5 examines the pathways of STEM degree attainment. Among 1013 students who finally attained STEM degrees in 2000, 679 students (67 percent) claimed their initial college majors in STEM, in other words, they followed the pathway of early entry and persistence; about 334 students entered STEM later in college, after initially not in STEM. Apparently, the early entry and persistence pathway is a dominant one. But the intersection of race and gender group analysis reveals the importance of non-dominant path. Figure 5 shows that Asian women, Hispanic women and white women are all more likely to travel the non-dominant pathway than their male counterparts. The only exception is black women, with a quarter of them attaining STEM degrees after initially in a non-STEM field, compared to 40 percent of Asian and white women and 47 percent of Hispanic women who did so.
Table 1 shows group disparities in key variables in family and academic backgrounds. For the highest math course taken during high school, contrary to the conventional wisdom that females trail behind males, both Asian females and black females surpassed their male counterparts. Meanwhile, whites and Hispanics maintained the traditional gender gap in favor of males. Asian females went the furthest in terms of the highest math course taken. Racial gaps are salient, in that blacks and Hispanics trail behind whites and Asians. Similar racial gaps manifest for standardized math achievement test scores. However, the female advantage in math course taking starts to trail off in standardized test scores, with both Asian and black females coming close to their male counterparts.
8.5. Predicted Probabilities of Majoring in STEM Subfields
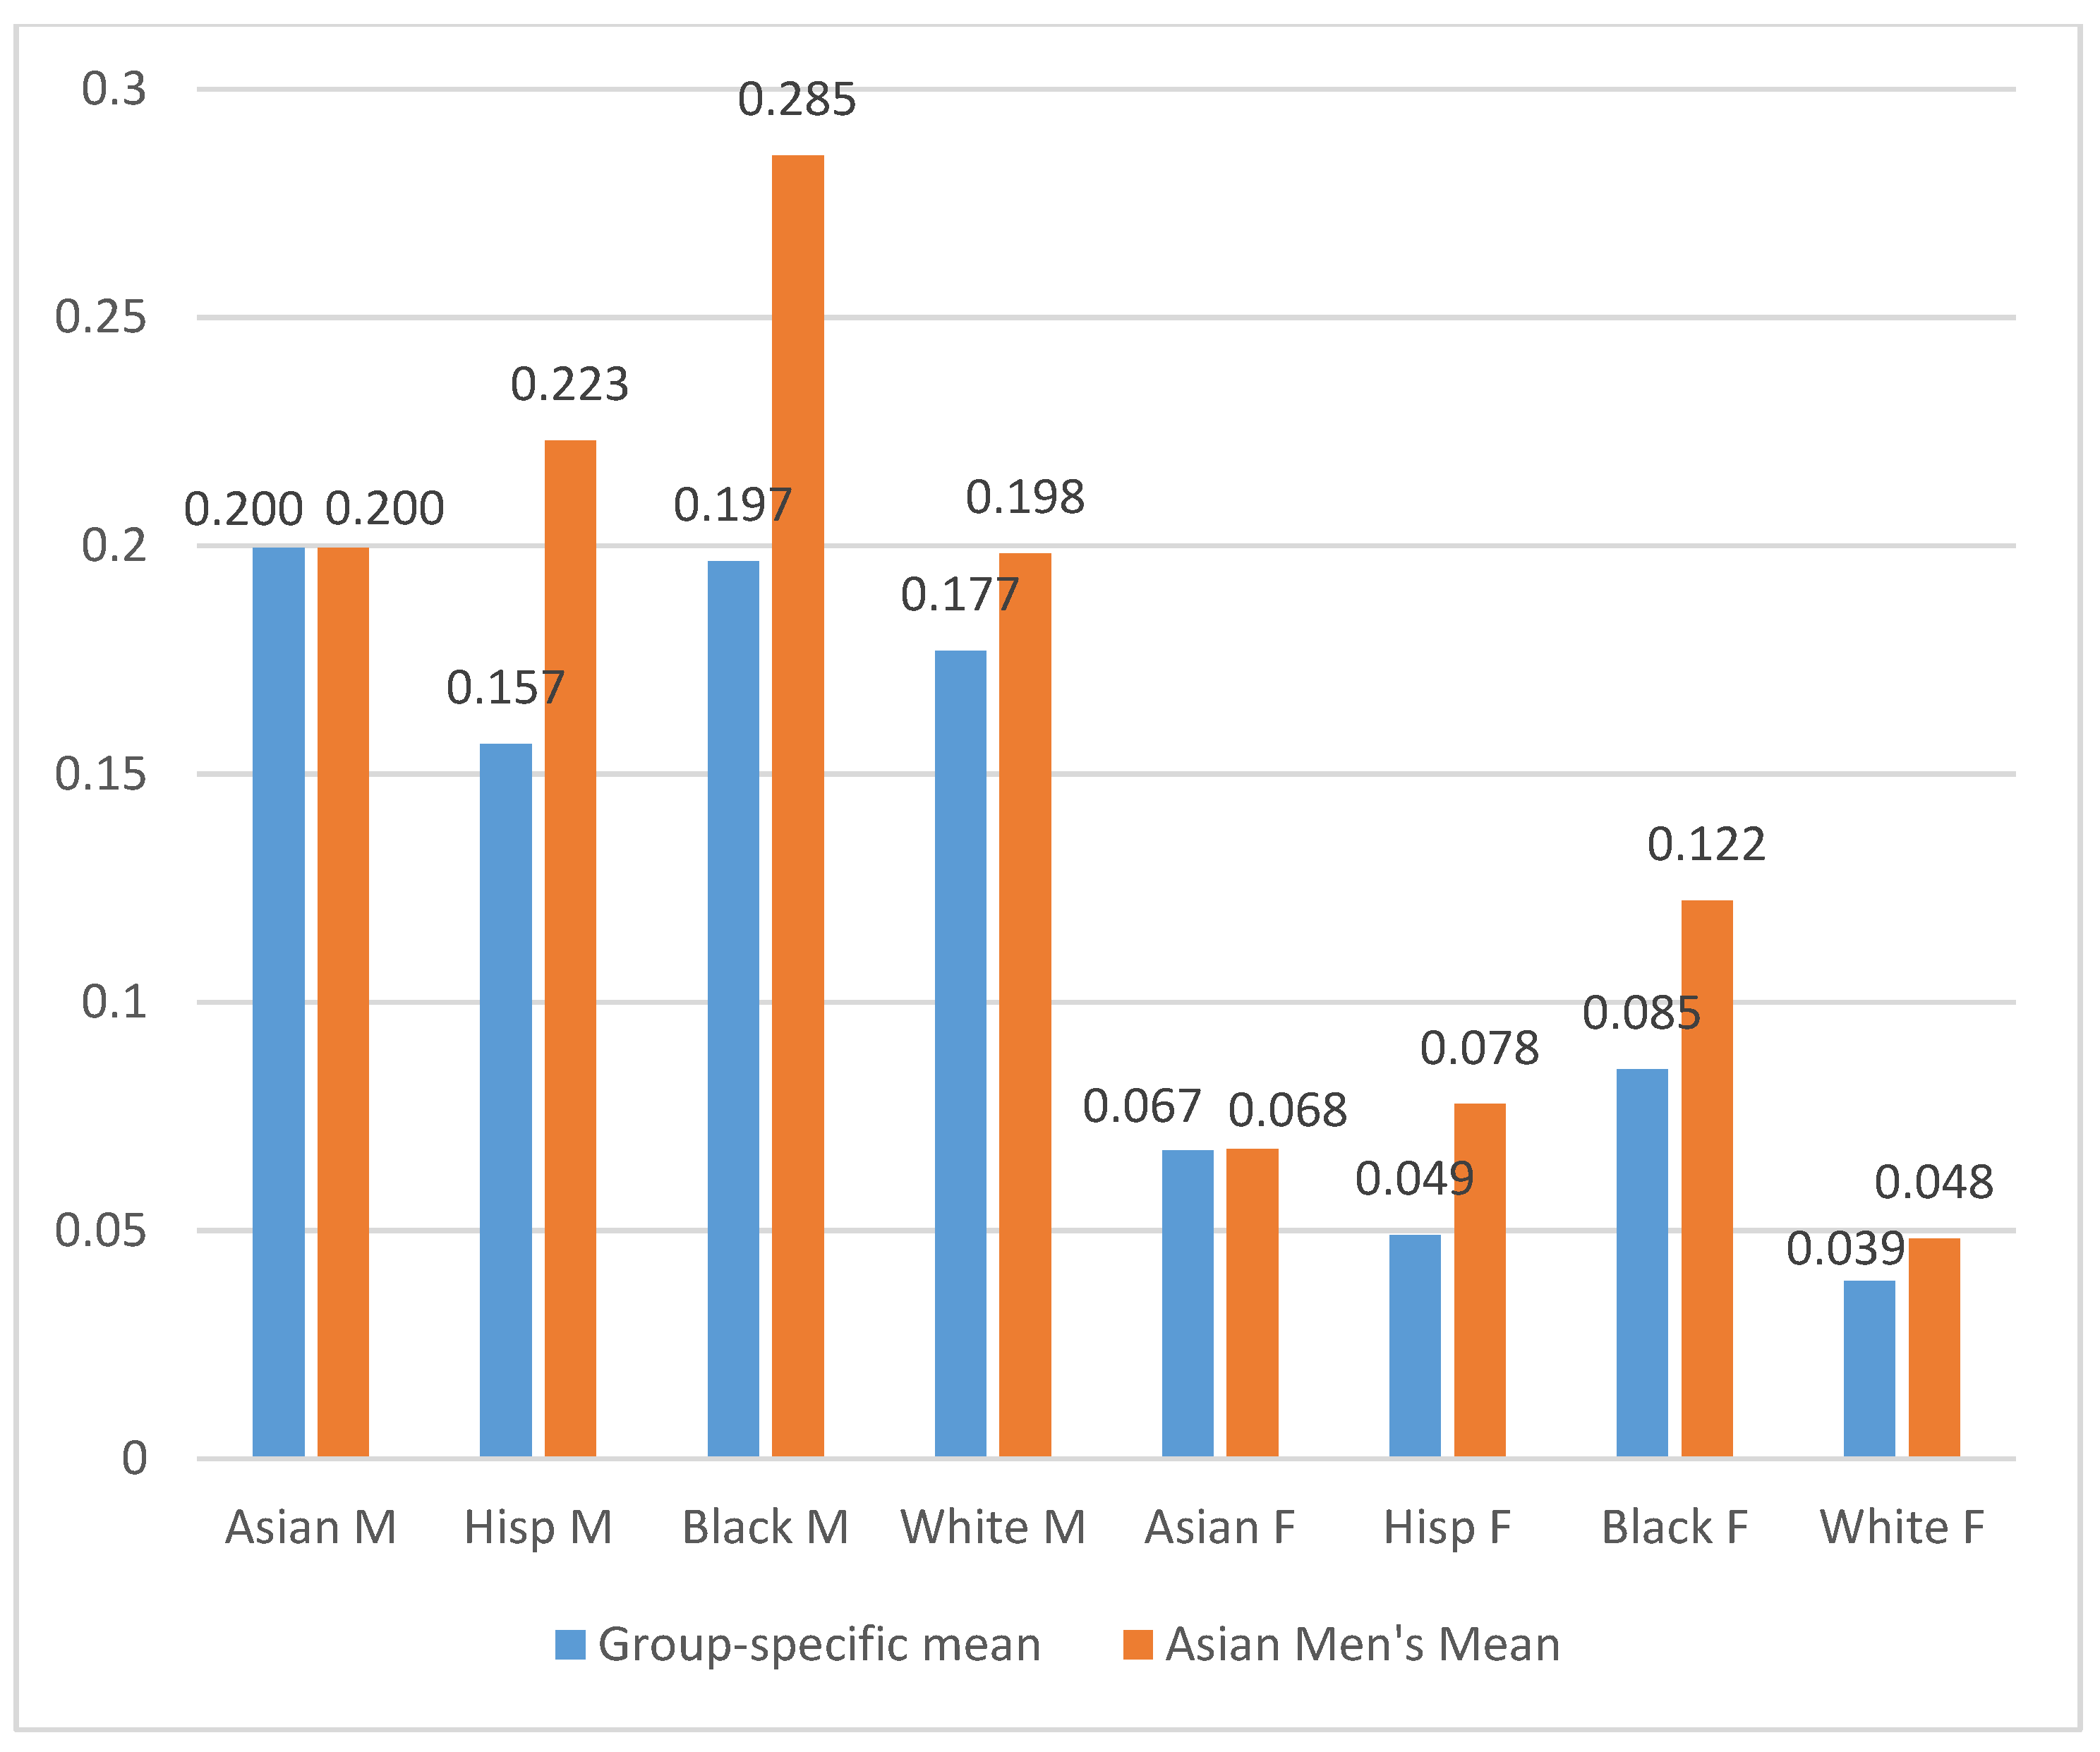
Figure 6 and Figure 7 present the predicted probability based on the logistic regression model of entry into life-STEM majors and physical-STEM majors. The model includes the key independent variables in academic preparation and family SES (their details are in Table 1). The blue bars represent predicted probabilities for each of the race and gender groups with the academic and SES variables set at the group-specific mean. Given that Asian males have the highest STEM degree attainment, the orange bars represent predicted probabilities for each of the race and gender groups, with the academic and SES variables set at the mean for Asian men. The comparison between the two sets of bars can elucidate how much of the group gaps can be closed by equalizing family background and academic preparations. Figure 6 shows that all the groups have increased their predicted probabilities in entry to life-STEM fields if they have had the same group mean in academic and family backgrounds with Asian men, except for Asian women. It is no surprise that Table 1 already shows Asian women have more academic advantages than Asian men. However, these academic advantages do not translate to much presence in physical-STEM fields. As Figure 7 shows that Asian women are much less represented in physical-STEM fields than other male groups, and also than black women. After setting group means at the level of Asian men’s, the predicted probability for black women in entering physical-STEM fields is 0.122, compared with 0.06 of Asian women. The biggest change took place for black men. The predicted probability of black men in entering physical-STEM fields jumped to 0.285, had they had the family and academic backgrounds of Asian men. Figure 7 also shows that black men thus have the highest propensity to enter physical-STEM fields, had they had the family and academic backgrounds of Asian men.
8.6. Predicted Probabilities of Degree Attainment in STEM-Subfields
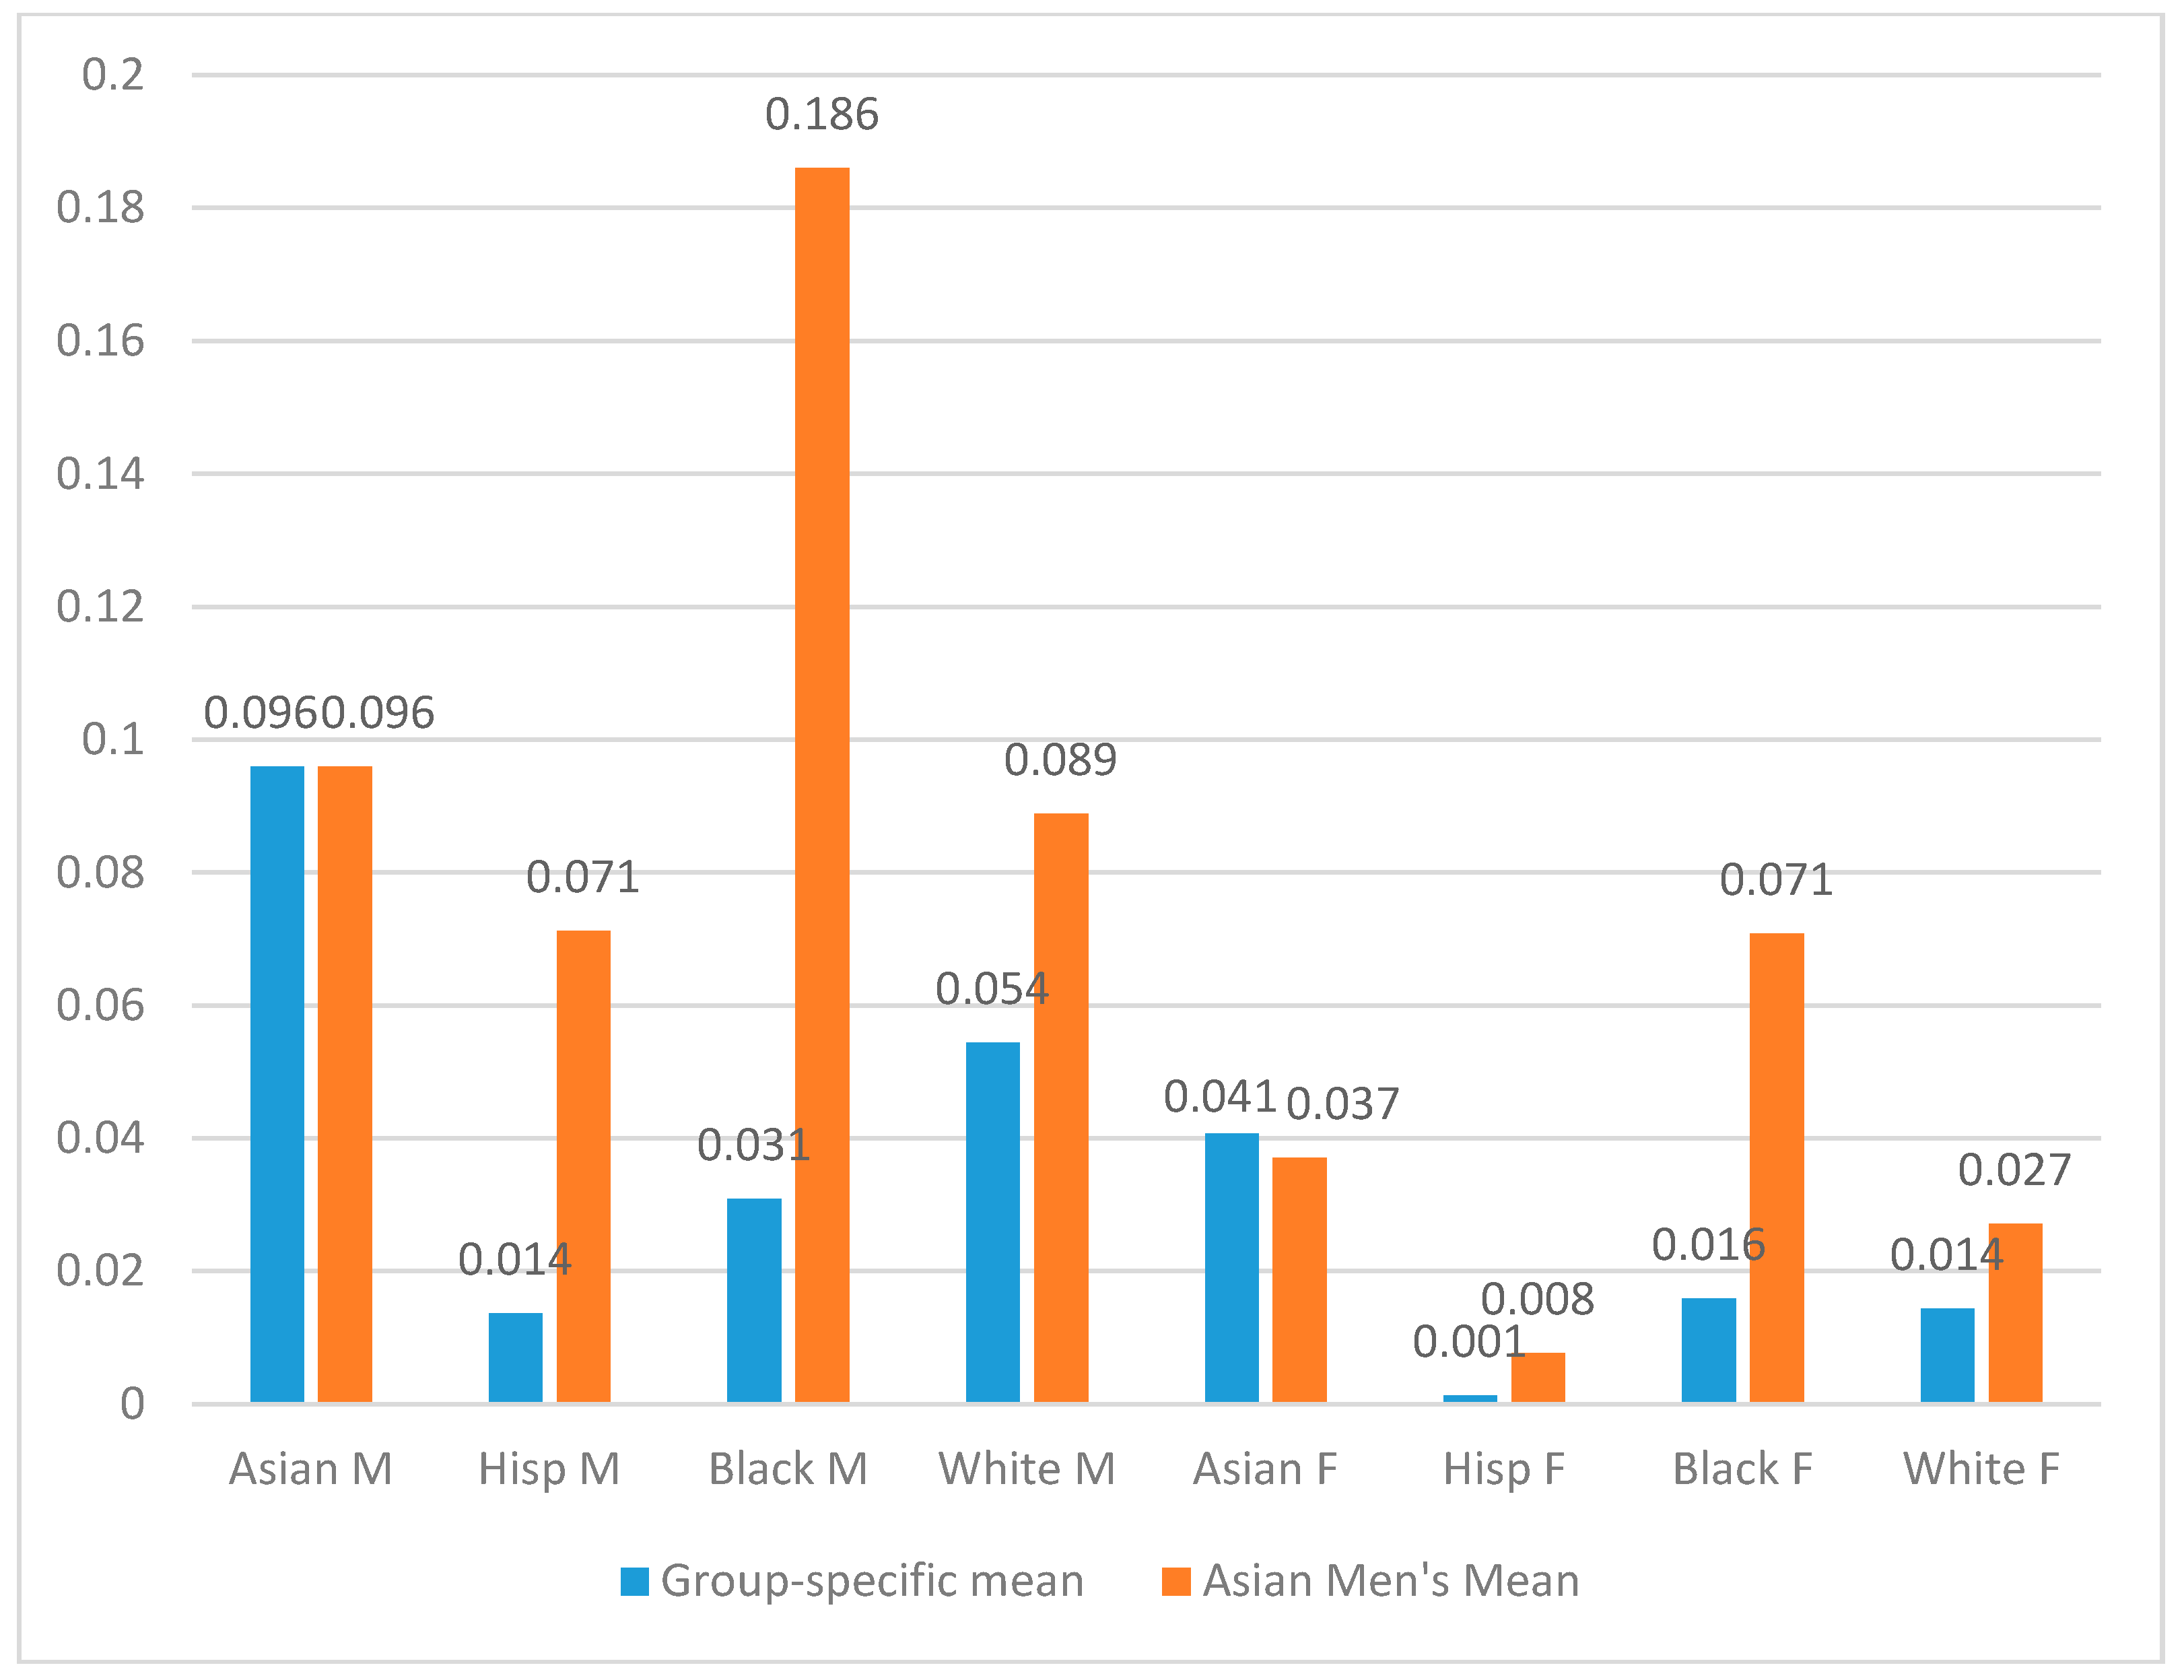
Figure 8 and Figure 9 present the predicted probabilities based on the logistical regression of STEM degree attainment for life-STEM and physical-STEM fields respectively. Similar methods were used as in Figure 6 and Figure 7 to compare the predicted probabilities before and after setting the mean at the level of Asian men, in terms of family and academic background variables. Figure 8 has shown that salient changes took place for both black males and Hispanic females. The predicted probability has jumped to 0.077 from 0.02 for black males to graduate in life-STEM fields after taking on the mean of Asian male’s academic and family background. The increase for Hispanic females from 0.018 to 0.072 is also quite remarkable. Figure 9 focuses on physical-STEM fields. It has shown the most striking changes for black males. The predicted probability for black males to graduate in physical-STEM has jumped to 0.186 from its previous 0.031, had they had the family and academic attributes of Asian males. Notably, the predicted probability of Asian males to graduate in physic-STEM fields is 0.096, only half of the level of black males with Asian characteristics.
8.7. Separate Model
Table A1 and Table A2 (in the Appendix) examine the intersectional effects by running separate models for each of the eight gender and race groups. Table A1 focuses on the outcome of entry into a STEM field. The effects of academic preparations, and in particular, the highest math courses taken during high school, are very important for most of the groups. Family SES is less important. Table A2 focuses on the outcome of attaining STEM degrees. Here, the high school academic preparation, along with first year college GPA are important for most of the groups, and their impacts on life-STEM and physical-STEM fields are similar.
9. Conclusions
This study focused on entry to and attainment of bachelor’s degrees in STEM fields, by examining gender and race/ethnicity in an intersectional manner. The intersectional analysis reveals that both race and gender matter in the STEM degree attainment. What is notable and consistent with previous research (Hanson 2009; Ma 2009; Riegle-Crumb and King 2010) is that black students were not at all under-represented at the starting point; that is, black males were as likely as white males to claim a STEM field as their initial major, and black females were more likely than white females to enter STEM. Black females in particular show their willingness, more than any other female groups, to choose physical-STEM fields as their initial college majors, in which females in general remain severely underrepresented. However, when it comes to completing a STEM bachelor’s degree, the attrition issue for black students is severe. Asians and whites were much more likely to complete their bachelor’s degree in STEM than blacks and Hispanics. Among those who had an initial major in STEM, females were slightly more likely than their male counterparts for all racial groups to complete the degree. Asian females had the highest persistence rate among all the groups, followed by Asian males.
Our findings reinforce the robust evidence provided by previous research that family and academic backgrounds are key to closing group disparities in STEM degree attainment. Our intersectional analytical approach can highlight particular race-gender groups that would benefit most from equalizing family and academic backgrounds. For example, women and racial minorities are the most under-represented in physical-STEM fields. Our analysis reveals that black men would have had the highest probability to graduate in physical-STEM fields, had they had the family and academic preparations of Asian males. Black women would have had the highest probability of graduating in physical-STEM fields among all women, had they had the family and academic preparations of Asian males. This highlights the critical importance of family resources and academic preparations, which improves the odds for STEM degree attainment for all groups. Black students would have experienced the most drastic progress.
The focus on both the starting and end points of a college career make it possible to pinpoint when and where minorities are under-represented, so that targeted efforts can be made. This study resonates with previous research showing that female students are more likely to persist in college once they are in a STEM field (Ma 2011). It also provides new evidence by looking at women in terms of race/ethnicity and finding that minority women share the same tendency of persistence with white women. This study also found that racial disparities in completing STEM degrees are much larger than at the entry point. Blacks and Hispanics, males and females included, trail behind Asians and whites in persistence. This study attempted to disentangle bachelor’s degree attainment from STEM degree attainment. We found that for males, claiming a STEM major does not make much difference in the probability of dropping out of college; for females, claiming a STEM major was associated with a lower rate of dropping out of college than claiming a non-STEM major, which again testifies to the positive selection of females’ choosing a STEM field.
Therefore, recruitment is much more important than retention for women at the undergraduate level. At the start of college, women are much less likely to choose a STEM major, and those who do are among the select few who are particularly driven and interested in STEM. Therefore, encouraging and supporting women as early as secondary school about the possibility of entering a STEM field is key for recruitment.
Our analysis extends earlier research on the trajectories of STEM degree attainment, by taking an intersectional perspective to examine race and gender. It not only corroborates with previous research that women are more likely to follow the non-dominant path, different from early entry and persistence as predicted by the pipeline model (Xie and Shauman 2003; Ma 2011), but also reveals that this non-dominant path of degree attainment applies to Asian women, Hispanic women, and white women. This provides further testimony that college may provide a more open environment that re-socializes women in a way that makes STEM fields more appealing and viable career path than pre-college does. This paper calls forth targeted efforts at pre-college stage to encourage and support women in STEM fields.
Other factors are noted as important in the literature, but we were not able to examine them given the scope of this project. In particular, the academic culture of STEM fields, especially the weed-out culture of STEM gateway courses and a lack of support overall, are integral to understanding racial disparities in persistence. The role of culture and climate in contributing to racial disparity in STEM is akin to a similar process leading to gender disparity in STEM (Catsambis 1994; Correll 2001). This indicates that efforts to improve the cultural climate in STEM fields and reduce the gender gap should be extended to address racial disparity.
Author Contributions
The lead author Yingyi Ma is in charge of research design, literature review and writing. The second author Yan Liu provides data analysis and some parts of the literature review and writing.
Conflicts of Interest
The authors declare no conflict of interest.
Appendix A

Table A1.
Multinomial Logistic Regression Models for Intersectional Effects (STEM Entry).
| Asian M | Hispanic M | Black M | White M | |||||
| Life-STEM | Physical-STEM | Life-STEM | Physical-STEM | Life-STEM | Physical-STEM | Life-STEM | Physical-STEM | |
| Family SES | 1.011 | 1.014 | 1.007 | 1.006 | 0.976 | 1.003 | 0.960 | 0.994 |
| (0.015) | (0.013) | (0.011) | (0.007) | (0.038) | (0.008) | (0.038) | (0.006) | |
| Math test score | 1.075 ** | 1.012 | 1.003 | 1.004 | 1.109 *** | 1.024 | 1.061 *** | 1.044 *** |
| (0.038) | (0.027) | (0.033) | (0.020) | (0.042) | (0.025) | (0.014) | (0.010) | |
| Highest math course | 1.869 *** | 1.656 *** | 1.610 *** | 1.395 *** | 0.908 | 1.522 *** | 1.402 *** | 1.372 *** |
| (0.363) | (0.240) | (0.297) | (0.162) | (0.231) | (0.240) | (0.097) | (0.069) | |
| Observations | 381 | 381 | 524 | 524 | 351 | 351 | 3019 | 3019 |
| Asian F | Hispanic F | Black F | White F | |||||
| Life-STEM | Physical-STEM | Life-STEM | Physical-STEM | Life-STEM | Physical-STEM | Life-STEM | Physical-STEM | |
| Family SES | 1.010 | 0.687 | 0.999 | 0.903 | 0.997 | 0.997 | 0.994 | 0.998 |
| (0.053) | (0.169) | (0.040) | (0.221) | (0.011) | (0.009) | (0.008) | (0.008) | |
| Math test score | 1.002 | 1.143 *** | 1.047 | 0.995 | 1.104 *** | 1.097 *** | 1.053 *** | 1.069 *** |
| (0.030) | (0.053) | (0.036) | (0.031) | (0.041) | (0.034) | (0.014) | (0.018) | |
| Highest math course | 1.606 *** | 1.307 | 1.644 ** | 1.438 ** | 1.667 ** | 1.450 ** | 1.727 *** | 1.628 *** |
| (0.280) | (0.290) | (0.328) | (0.266) | (0.375) | (0.270) | (0.125) | (0.141) | |
| Observations | 403 | 403 | 624 | 624 | 488 | 488 | 3482 | 3482 |
Reference group: “no major.” Coefficients on “Non-STEM major” are not reported in this table. **denotes p < 0.01, ***denotes p < 0.001.
Table A2.
Multinomial Logistic Regression Models for Intersectional Effects (STEM Degree Attainment).
Table A2.
Multinomial Logistic Regression Models for Intersectional Effects (STEM Degree Attainment).
| Asian M | Hispanic M | Black M | White M | |||||
| Life-STEM | Physical-STEM | Life-STEM | Physical-STEM | Life-STEM | Physical-STEM | Life-STEM | Physical-STEM | |
| Family SES | 1.016 | 1.019 | 0.978 | 1.016 | 0.976 | 1.023 ** | 1.003 | 0.992 |
| (0.014) | (0.012) | (0.069) | (0.012) | (0.074) | (0.010) | (0.007) | (0.010) | |
| Math test score | 1.144 *** | 1.074 ** | 1.059 | 1.062 | 1.147 *** | 1.047 | 1.080 *** | 1.107 *** |
| (0.045) | (0.035) | (0.048) | (0.040) | (0.057) | (0.040) | (0.017) | (0.016) | |
| Highest math course | 1.976 *** | 2.498 *** | 2.467 *** | 2.932 *** | 0.860 | 2.250 *** | 1.807 *** | 2.157 *** |
| (0.414) | (0.483) | (0.641) | (0.666) | (0.301) | (0.504) | (0.144) | (0.153) | |
| GPA | 2.447 *** | 2.933 *** | 2.247 * | 2.636 ** | 3.504 ** | 4.106 *** | 2.107 *** | 2.337 *** |
| (0.764) | (0.838) | (1.073) | (1.059) | (1.828) | (1.639) | (0.277) | (0.267) | |
| Observations | 381 | 381 | 524 | 524 | 351 | 351 | 3019 | 3019 |
| Asian F | Black F | White F | ||||||
| Life-STEM | Physical-STEM | Life-STEM | Physical-STEM | Life-STEM | Physical-STEM | |||
| Family SES | 0.976 | 0.616* | 1.010 | 1.006 | 0.996 | 0.972 | ||
| (0.038) | (0.166) | (0.011) | (0.012) | (0.010) | (0.056) | |||
| Math test score | 1.051 * | 1.172 *** | 1.053 | 1.057 | 1.113 *** | 1.180 *** | ||
| (0.031) | (0.060) | (0.056) | (0.048) | (0.017) | (0.029) | |||
| Highest math course | 2.221 *** | 2.350 *** | 2.388 *** | 2.743 *** | 1.976 *** | 2.169 *** | ||
| (0.395) | (0.661) | (0.754) | (0.752) | (0.150) | (0.248) | |||
| GPA | 2.256 *** | 1.293 | 2.999 ** | 2.977 ** | 2.010 *** | 2.314 *** | ||
| (0.660) | (0.482) | (1.602) | (1.374) | (0.264) | (0.472) | |||
| Observations | 403 | 403 | 488 | 488 | 3482 | 3482 | ||
Reference group: “no degree.” Coefficients on AA and non-STEM degrees are not reported in this table. Due to the small sample size of Hispanic females in STEM degree attainment (less than 10), the estimates are unreliable, thus excluded from this table. **denotes p < 0.01, ***denotes p < 0.001.
References
- Adelman, Clifford. 1998. Women and Men of the Engineering Path: A Model for Analyses of Undergraduate Careers. Washington: U.S. Department of Education. [Google Scholar]
- Adelman, Clifford. 2006. The Toolbox Revisited: Paths to Degree Completion from High School through College. Washington: U.S. Department of Education. [Google Scholar]
- Archer, Louise, Jennifer DeWitt, Jonathan Osborne, Justin Dillon, Beatrice Willis, and Billy Wong. 2012. Science aspirations, capital, and family habitus: how families shape children’s engagement and identification with science. American Educational Research Journal 49: 881–908. [Google Scholar] [CrossRef]
- Berryman, Sue E. 1983. Who Will Do Science?: Minority and Female Attainment of Science and Mathematics Degrees: Trends and Causes. New York: Rockefeller Foundation. [Google Scholar]
- Buchmann, Claudia, and Thomas A. DiPrete. 2006. The Growing Female Advantage in College Completion: The Role of Parental Resources and Academic Achievement. American Sociological Review 71: 515–41. [Google Scholar] [CrossRef]
- Catsambis, Sophia. 1994. The path to math: Gender and racial-ethnic differences in mathematics participation from middle school to high school. Sociology of Education 67: 199–215. [Google Scholar] [CrossRef]
- Collins, Patricia H. 2015. Intersectionality’s Definitional Dilemmas. Annual Review of Sociology 41: 1–20. [Google Scholar] [CrossRef]
- Correll, Shelley J. 2001. Gender and the Career Choice Process: The Role of Biased Self-Assessments. American Journal of Sociology 106: 1691–730. [Google Scholar] [CrossRef]
- Corbett, Christianne, and Catherine Hill. 2015. Solving the Equation: The Variables for Women’s Success in Engineering and Computing. Washington: The American Association of University Women. [Google Scholar]
- Dabney, Katherine P., Devasmita Chakraverty, and Robert H. Tai. 2013. The association of family influence and initial interest in science. Science Education 97: 395–409. [Google Scholar] [CrossRef]
- DiPrete, Thomas A., and Gregory M. Eirich. 2006. Cumulative advantage as a mechanism for inequality: A review of theoretical and empirical developments. Annual Review of Sociology 32: 271–97. [Google Scholar] [CrossRef]
- England, Paula, and Su Li. 2006. Desegregation Stalled: The Changing Sex Composition of College Majors, 1971–2002. Gender and Society 20: 657–77. [Google Scholar] [CrossRef]
- Frehill, Lisa M. 1997. Education and Occupational Sex Segregation: The Decision to Major in Engineering. Sociological Quarterly 38: 225–49. [Google Scholar] [CrossRef]
- Hanson, Sandra L. 2009. Swimming against the Tide: African American Girls and Science Education. Philadelphia: Temple University Press. [Google Scholar]
- hooks, bell. 1981. Ain’t I a Woman Black Women and Feminism. Brooklyn: South End Press. [Google Scholar]
- Hyde, Janet Shibley, and Marcia C. Linn. 2006. Gender similarities in mathematics and science. Science 314: 599–600. [Google Scholar] [CrossRef] [PubMed]
- Jacobs, Jerry A. 1989. Revolving Doors: Sex Segregation and Women’s Careers. Stanford: Stanford University Press. [Google Scholar]
- Kelly, Sean. 2009. The black-white gap in mathematics course taking. Sociology of Education 82: 47–69. [Google Scholar] [CrossRef]
- Lord, Susan M., Michelle Madsen Camacho, Richard A. Layton, Russell A. Long, Matthew W. Ohland, and Mara H. Wasburn. 2009. Who’s persisting in engineering? A comparative analysis of female and male Asian, black, Hispanic, Native American, and white students. Journal of Women and Minorities in Science and Engineering 15: 167–90. [Google Scholar] [CrossRef]
- Ma, Yingyi. 2009. Family Socioeconomic Status, Parental Involvement, and College Major Choices—Gender, Race/Ethnic, and Nativity Patterns. Sociological Perspectives 52: 210–34. [Google Scholar] [CrossRef]
- Ma, Yingyi. 2010. Model Minority, Model for Whom?—An Investigation of Asian American Students in Science/Engineering. AAPI Nexus Asian Americans and Pacific Islanders Policy, Practice & Community 8: 43–73. [Google Scholar]
- Ma, Yingyi. 2011. Gender Differences in the Paths Leading to a STEM Baccalaureate. Social Science Quarterly 92: 1169–90. [Google Scholar] [CrossRef]
- May, Gary S., and Daryl E. Chubin. 2003. A Retrospective on Undergraduate Engineering Success for Underrepresented Minority Students. Journal of Engineering Education 92: 27–39. [Google Scholar] [CrossRef]
- Merton, Robert K. 1968. The Matthew effect in science. Science 159: 56–63. [Google Scholar] [CrossRef] [PubMed]
- Miller, Jon D., and Linda G. Kimmel. 2012. Pathways to a STEMM profession. Peabody Journal of Education 87: 26–45. [Google Scholar] [CrossRef]
- Muller, Patricia A., Frances K. Stage, and Jillian Kinzie. 2001. Science achievement growth trajectories: Understanding factors related to gender and racial–ethnic differences in precollege science achievement. American Educational Research Journal 38: 981–1012. [Google Scholar] [CrossRef]
- Nord, Christine, Shep Roey, Robert Perkins, Marsha Lyons, Nita Lemanski, Janis Brown, and Jason Schuknecht. 2011. The Nation’s Report Card: America’s High School Graduates (NCES 2011-462). Washington: National Center for Education Statistics (NCES), Available online: http://nces.ed.gov/nationsreportcard/pdf/studies/2011462.pdf (accessed on 1 July 2017).
- NSB. 2014. Science and Engineering Indicators 2014; Arlington: National Center for Science and Engineering Statistics. Available online: http://www.nsf.gov/statistics/seind14/ (accessed on 1 July 2017).
- National Science Board. 2016. Science and Engineering Indicators 2016. Arlington: National Science Board. [Google Scholar]
- Riegle-Crumb, Catherine. 2006. The path through math: Course taking trajectories and student performance at the intersection of gender and race/ethnicity. American Journal of Education 113: 101–22. [Google Scholar] [CrossRef] [PubMed]
- Riegle-Crumb, Catherine, and Barbara King. 2010. Questioning a White Male Advantage in STEM: Examining Disparities in College Major by Gender and Race/Ethnicity. Educational Researcher 39: 656–65. [Google Scholar] [CrossRef]
- Ro, Hyun K., and Karla I. Loya. 2015. The Effect of Gender and Race Intersectionality on Student Learning Outcomes in Engineering. The Review of Higher Education 38: 359–96. [Google Scholar] [CrossRef]
- Sassler, Sharon, Katherine Michelmore, and Kristin Smith. 2017. A Tale of Two Majors: Explaining the Gender Gap in STEM Employment among Computer Science and Engineering Degree Holders. Social Science 6: 69. [Google Scholar] [CrossRef]
- Seymour, Elaine, and Nancy M. Hewitt. 1997. Talking about Leaving. Boulder: Westview Press. [Google Scholar]
- Simon, Richard M., and George Farkas. 2008. Sex, class, and physical science educational attainment: Portions due to achievement versus recruitment. Journal of Women and Minorities in Science and Engineering 14: 30–46. [Google Scholar] [CrossRef]
- Sjaastad, Jørgen. 2012. Sources of inspiration: The role of significant persons in young people’s choice of science in higher education. International Journal of Science Education 34: 1615–36. [Google Scholar] [CrossRef]
- Smyth, Frederick L., and John J. McArdle. 2004. Ethnic and gender differences in science graduation at selective colleges with implications for admission policy and college choice. Research in Higher Education 45: 353–81. [Google Scholar] [CrossRef]
- Tai, Robert H., Christine Qi Liu, Adam V. Maltese, and Xitao Fan. 2006. Planning early for careers in science. Science 312: 1143–44. [Google Scholar] [CrossRef] [PubMed]
- Xie, Yu, and Kimberlee A. Shauman. 2003. Women in Science: Career Processes and Outcomes. Cambridge: Harvard University Press. [Google Scholar]
- Xie, Yu, Michael Fang, and Kimberlee Shauman. 2015 STEM Education. Annual Review of Sociology 41: 1–27. [CrossRef] [PubMed]
Figure 1.
Gender and Race Disparity in Entry into science, technology, engineering, and mathematics (STEM) fields (N = 9272). Note: Data is from National Education Longitudinal Studies (NELS:88-00) postsecondary transcript data. The sample consists of all the postsecondary participants, based on transcript data, who also identify as one of the four racial/ethnic groups: non-Hispanic Whites, non-Hispanic Blacks, Hispanics, and Asians. The parenthesis includes the sample size for each group.

Figure 2.
Gender and Race Disparity in Completing a STEM bachelor’s Degree (N = 9272). Note: Data is from NELS: 88-00 postsecondary transcript data. The sample consists of all the postsecondary participants, based on transcript data, who also identify as one of the four racial/ethnic groups: non-Hispanic Whites, non-Hispanic Blacks, Hispanics, and Asians. The parenthesis includes the sample size for each group.
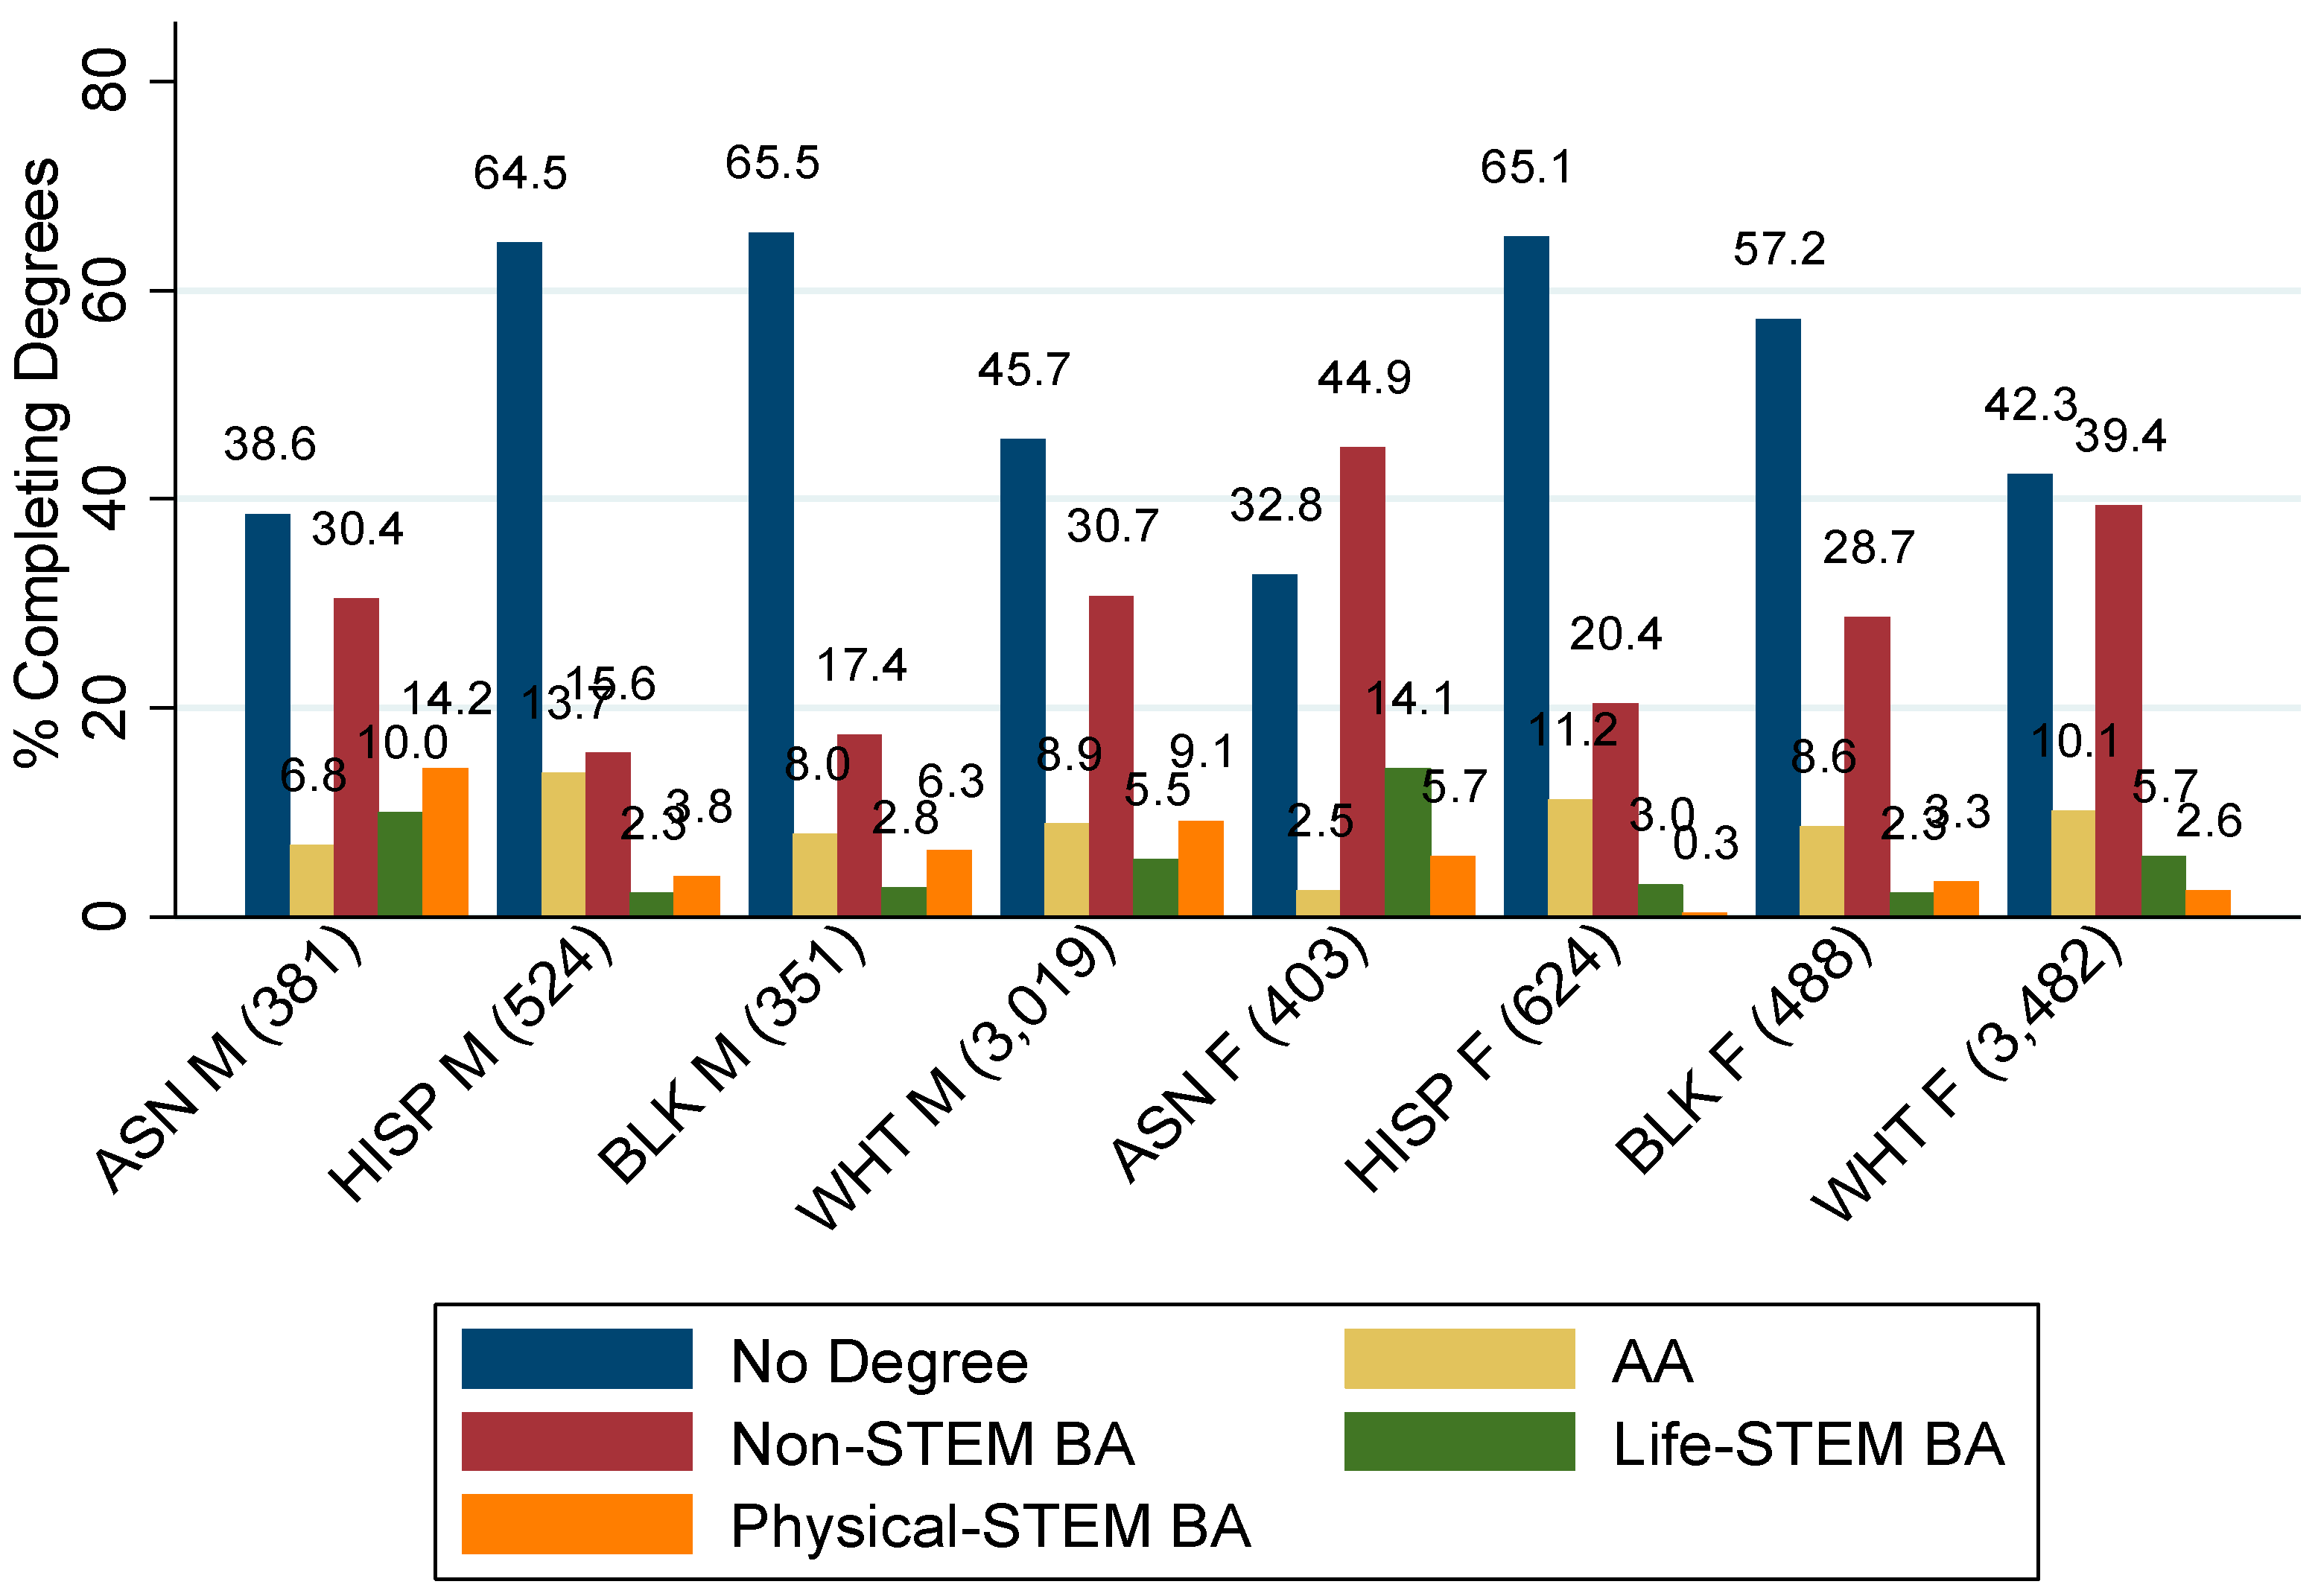
Figure 3.
Gender and Race Disparities in the Outcomes among those with an initial STEM major. (N = 1657). Note: Data is from NELS:88-00 postsecondary transcript data. The sample size includes all with the initial college major in STEM fields. The parenthesis includes the sample size for each group.
Figure 3.
Gender and Race Disparities in the Outcomes among those with an initial STEM major. (N = 1657). Note: Data is from NELS:88-00 postsecondary transcript data. The sample size includes all with the initial college major in STEM fields. The parenthesis includes the sample size for each group.

Figure 4.
Gender and Race Disparities in the Outcomes among those with an initial non-STEM major. (N = 5555). Note: Data is from NELS:88-00 postsecondary transcript data. The sample size includes all with an initial major in non-STEM fields. The parenthesis includes the sample size for each group.
Figure 4.
Gender and Race Disparities in the Outcomes among those with an initial non-STEM major. (N = 5555). Note: Data is from NELS:88-00 postsecondary transcript data. The sample size includes all with an initial major in non-STEM fields. The parenthesis includes the sample size for each group.

Figure 5.
Gender and Race Disparities in Traveling the Non-Dominant Path of STEM Degree Attainment (N = 1,013). Note: Data is from NELS:88-00 postsecondary transcript data. The sample size includes all with the STEM bachelor’s degrees by 2000. The parenthesis includes the sample size for each group.
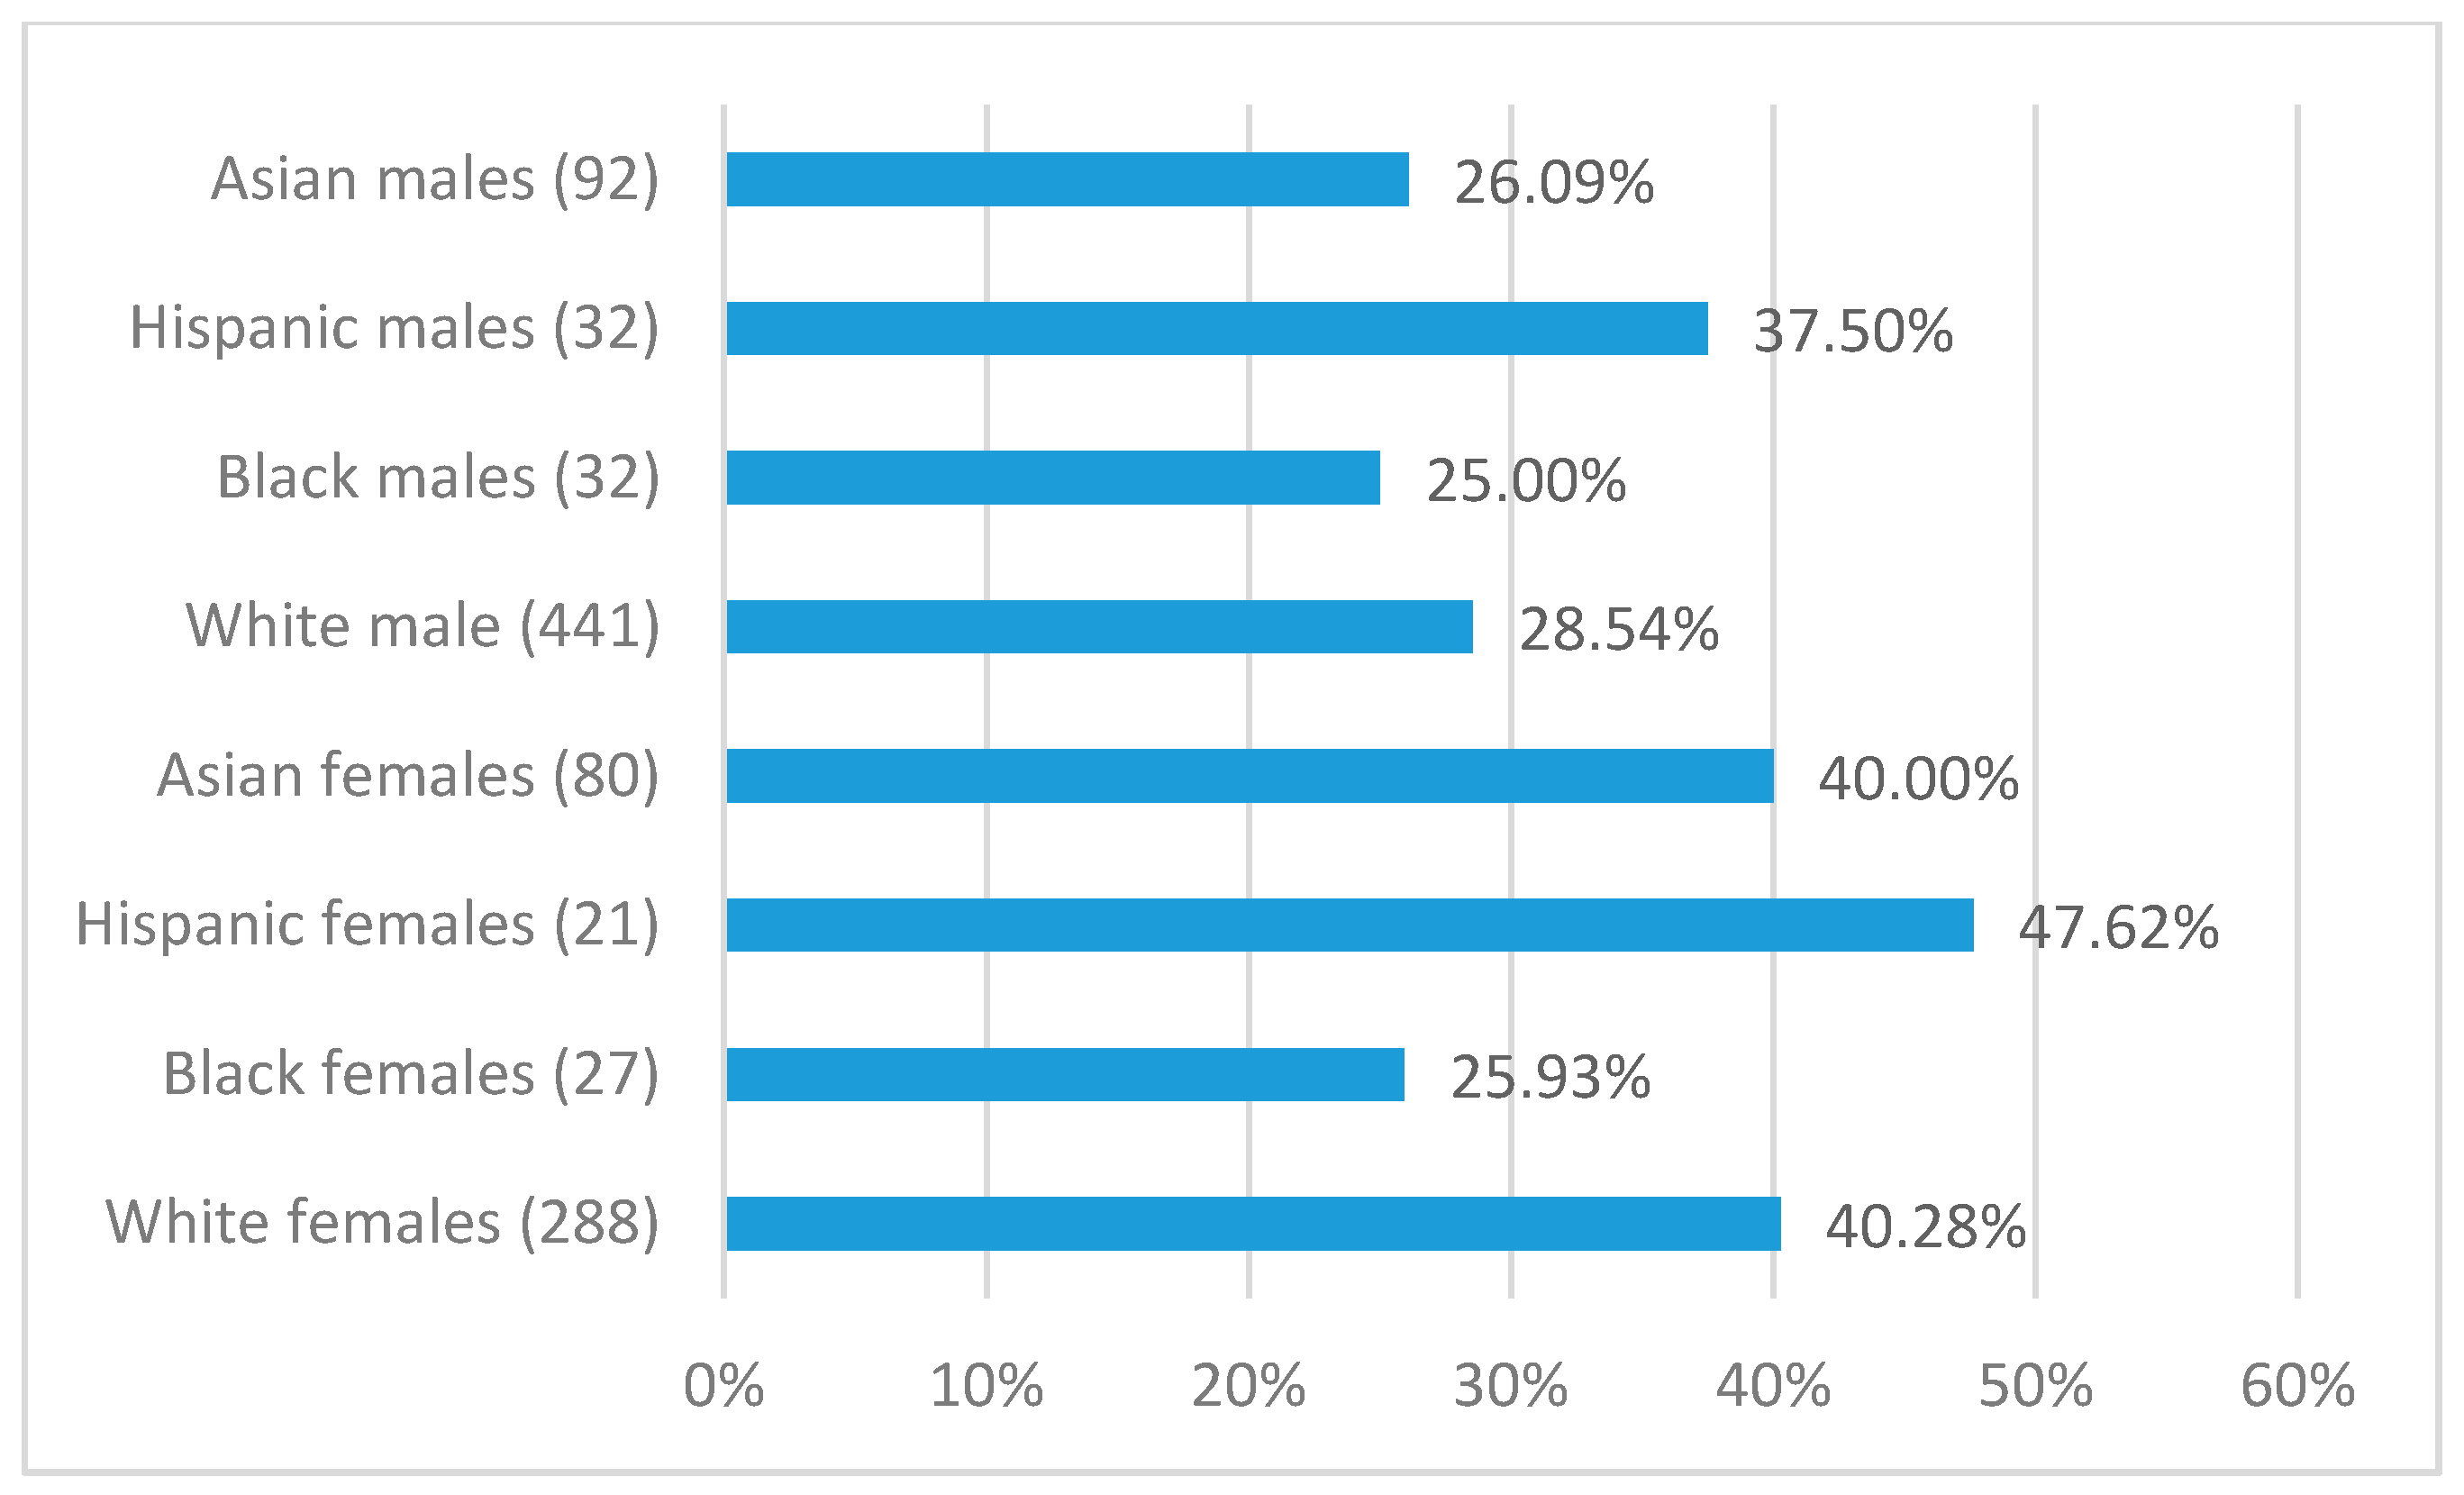
Figure 6.
Predicted Probability of Choosing a Life-STEM Major for Race and Gender Groups. Note: Data is from NELS:88-00 postsecondary transcript data. Blue bars represent the predicted probability when independent variables (i.e., family SES and academic preparations) are set at the group-specific mean; Orange bars represent the predicted probability when independent variables are set at the mean of Asian men).
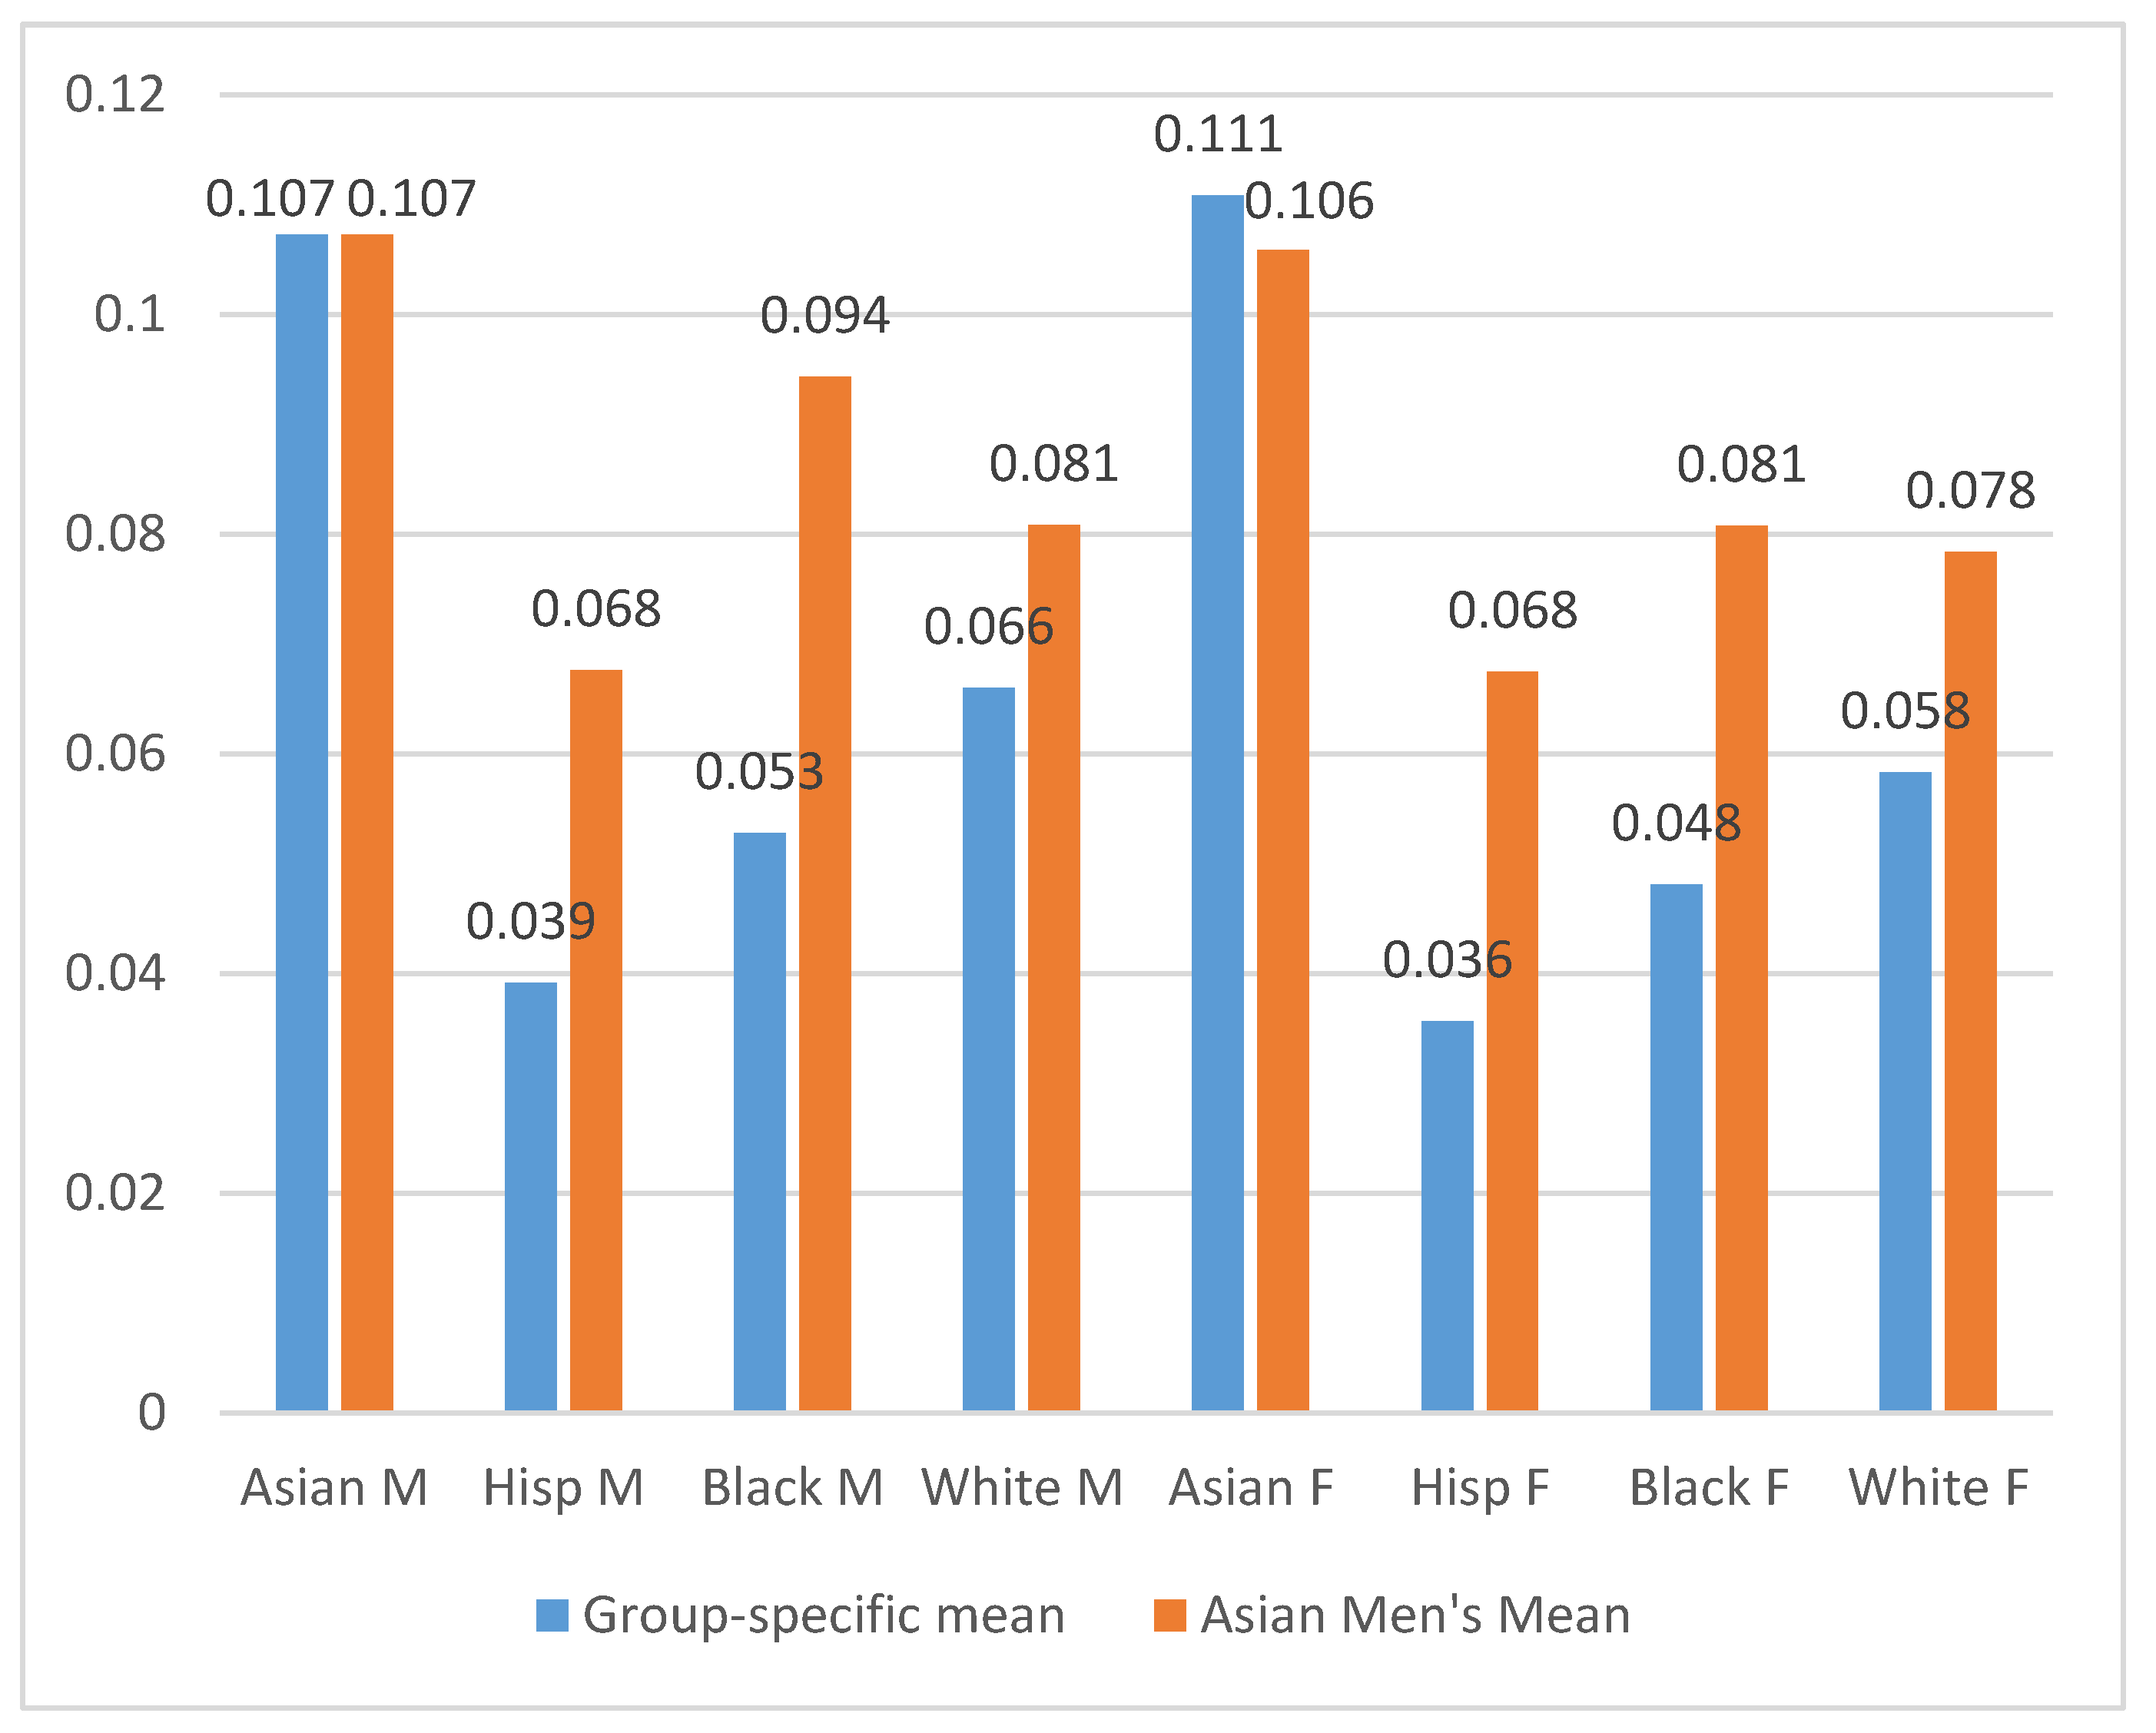
Figure 7.
Predicted Probability of Choosing a Physical-STEM Major for Race and Gender Groups. Note: Data is from NELS:88-00 postsecondary transcript data. Blue bars represent the predicted probability when independent variables (i.e. family SES and academic preparations) are set at the group-specific mean; Orange bars represent the predicted probability when independent variables are set at the mean of Asian men).

Figure 8.
Predicted Probability of Attaining a Life-STEM Bachelor’s Degree for Race and Gender Groups. Note: Data is from NELS:88-00 postsecondary transcript data. Blue bars represent the predicted probability when independent variables (i.e. family SES and academic preparations) are set at the group-specific mean; Orange bars represent the predicted probability when independent variables are set at the mean of Asian men).
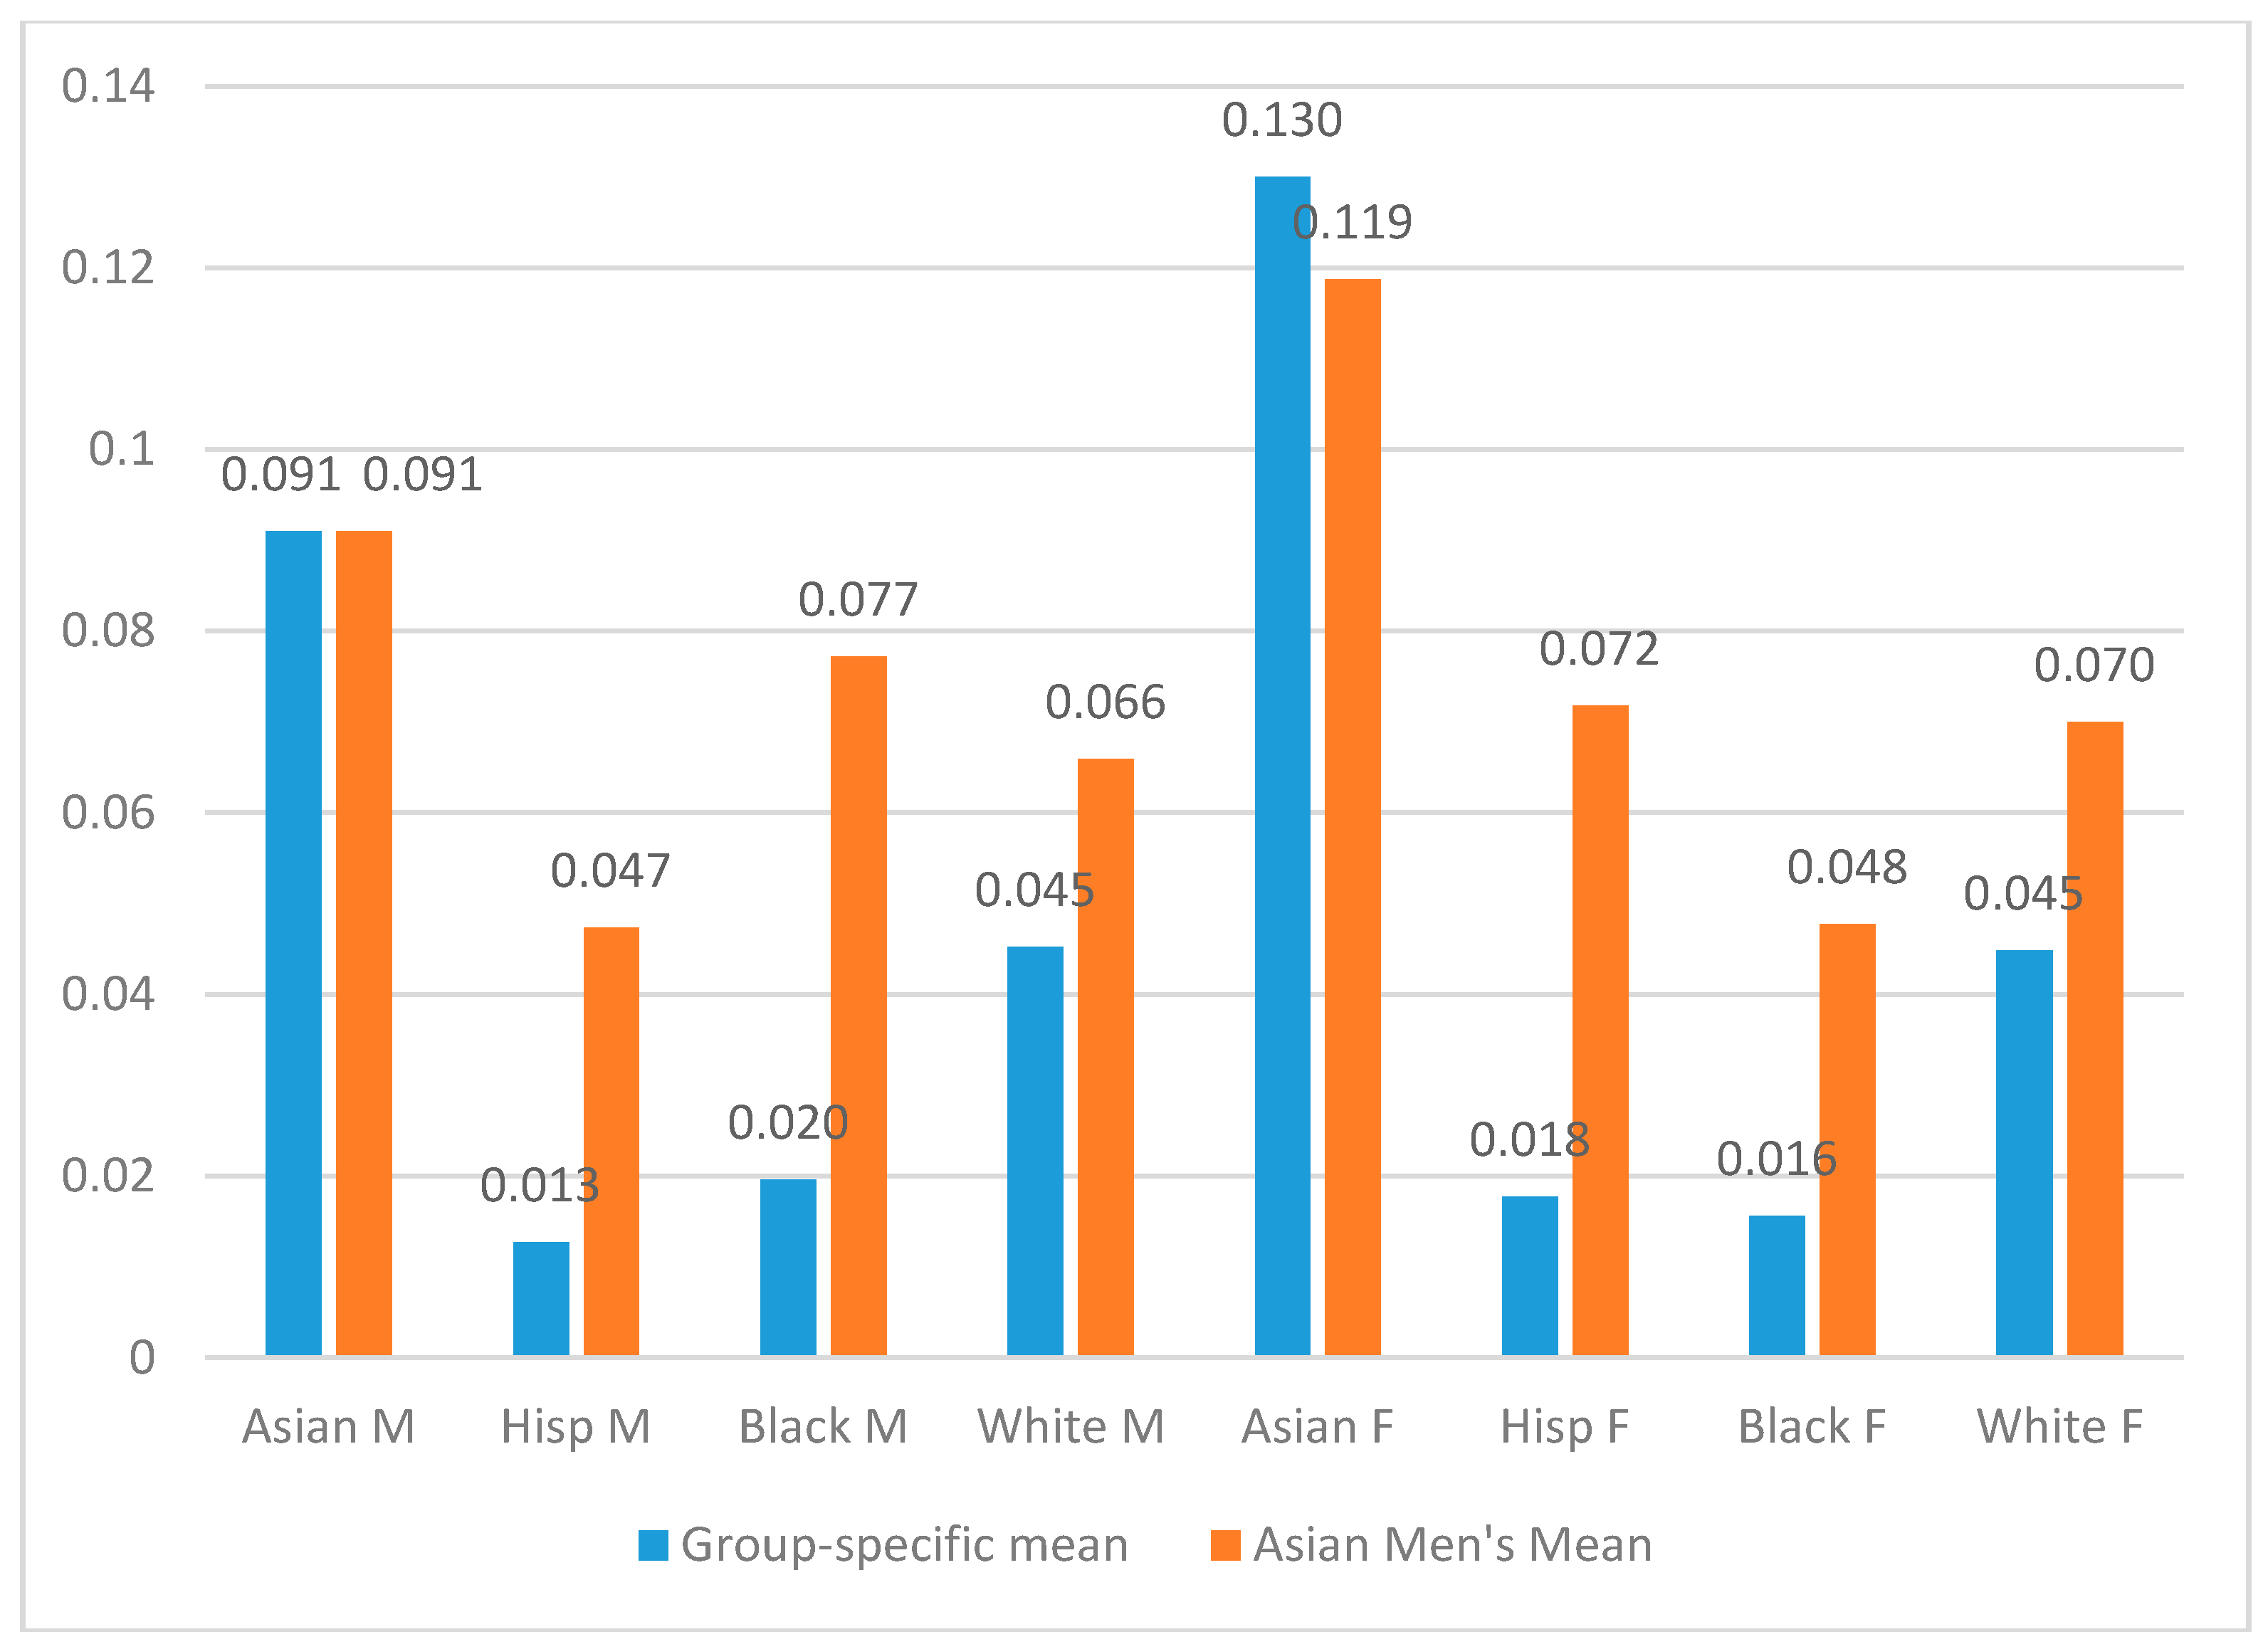
Figure 9.
Predicted Probability of Attaining a Physical-STEM Bachelor’s Degree for Race and Gender Groups. Note: Data is from NELS:88-00 postsecondary transcript data. Blue bars represent the predicted probability set at group-specific mean; Orange bars represent the predicted probability set at the mean of Asian men, the group with the highest rate of STEM degree attainment).

Table 1.
Gender and Race Disparities in Key Independent Variables.
| SES (from −2.43–2.54) | Highest Math (from 1–6) | Math Score (from 30.27–71.37) | College GPA (from 0–4) | |||||
|---|---|---|---|---|---|---|---|---|
| Mean | S.D. | Mean | S.D. | Mean | S.D. | Mean | S.D. | |
| Asian Male | 0.27 | 0.88 | 4.18 | 1.57 | 57.24 | 8.41 | 2.68 | 0.77 |
| Hispanic Male | –0.35 | 0.78 | 2.91 | 1.40 | 49.79 | 8.13 | 2.43 | 0.70 |
| Black Male | –0.15 | 0.80 | 2.91 | 1.19 | 46.66 | 7.66 | 2.24 | 0.71 |
| White Male | 0.30 | 0.70 | 3.58 | 1.45 | 55.59 | 8.02 | 2.59 | 0.74 |
| Asian Female | 0.30 | 0.90 | 4.33 | 1.48 | 56.92 | 8.17 | 2.82 | 0.72 |
| Hispanic Female | –0.46 | 0.76 | 2.82 | 1.22 | 47.85 | 7.45 | 2.48 | 0.75 |
| Black Female | –0.26 | 0.77 | 3.14 | 1.26 | 47.14 | 7.87 | 2.41 | 0.72 |
| White Female | 0.20 | 0.71 | 3.41 | 1.40 | 53.76 | 7.75 | 2.76 | 0.72 |
| Full sample | 0.13 | 0.79 | 3.44 | 1.44 | 53.40 | 8.46 | 2.63 | 0.74 |
Note: Data is from NELS:88-00 postsecondary transcript data.
© 2017 by the authors. Licensee MDPI, Basel, Switzerland. This article is an open access article distributed under the terms and conditions of the Creative Commons Attribution (CC BY) license (http://creativecommons.org/licenses/by/4.0/).
Share and Cite
MDPI and ACS Style
Ma, Y.; Liu, Y. Entry and Degree Attainment in STEM: The Intersection of Gender and Race/Ethnicity. Soc. Sci. 2017, 6, 89. https://doi.org/10.3390/socsci6030089
AMA Style
Ma Y, Liu Y. Entry and Degree Attainment in STEM: The Intersection of Gender and Race/Ethnicity. Social Sciences. 2017; 6(3):89. https://doi.org/10.3390/socsci6030089
Chicago/Turabian StyleMa, Yingyi, and Yan Liu. 2017. "Entry and Degree Attainment in STEM: The Intersection of Gender and Race/Ethnicity" Social Sciences 6, no. 3: 89. https://doi.org/10.3390/socsci6030089
Note that from the first issue of 2016, this journal uses article numbers instead of page numbers. See further details here.