Diffusion of Electricity Consumption Practices in Mexico


1
School of Political and Social Sciences, National Autonomous University of Mexico, Circuito Mario de La Cueva s/n, Ciudad Universitaria, Coyoacán, Mexico City 04510, Mexico
2
Center for Demographic, Urban and Environmental Studies, El Colegio de Mexico, Entronque Picacho-Ajusco 20, Fuentes del Pedregal, Tlalpan, Mexico City 010740, Mexico
*
Author to whom correspondence should be addressed.
Soc. Sci. 2017, 6(4), 144; https://doi.org/10.3390/socsci6040144
Submission received: 1 October 2017
/
Revised: 13 November 2017
/
Accepted: 21 November 2017
/
Published: 24 November 2017
(This article belongs to the Special Issue Understanding Population, Development, and Environment Linkages in the Context of Global Climate Change)
Abstract
:In recent decades, residential energy consumption has grown in Mexico despite high poverty levels. While inequalities in energy have been documented, less attention has been paid to practices of consumption. Particularly, we sustain that it is necessary to account for changes in associated behaviors, which shape energy use, such as the acquisition of electrical appliances. This paper analyzes if there is evidence of diffusion of energy practices from higher to lower-income households. We hypothesize that more intensive energy practices expand across groups beyond their demographic and socioeconomic characteristics. Employing a harmonized dataset of thirteen Income and Expenditure Household Surveys, we assess changes in electrical appliances and electricity consumption. Using latent class analysis, we construct energy profiles that identify underlying consumption behaviors from sociodemographic and residential characteristics. We find support for the argument that intensive energy practices expanded from high to lower socioeconomic groups. While this trend reflects improvements in living conditions in Mexico, it also highlights the environmental challenges that increasing consumption poses for sustainable development goals.
1. Introduction
Energy consumption is key to achieving sustainability. Energy has broad and recognizable environmental implications, particularly in its impact on greenhouse gas emissions. Achieving energy efficiency goals requires not only the diminishing the role of fossil fuels on the production side, but it also necessitates changing the ways energy is consumed. Electricity consumption is central for such a goal, as its use has nearly doubled globally in the last three decades. Moreover, the largest expansion of the electricity demand has taken place in middle- and low-income countries, as residential and commercial building demand has increased with income and urbanization growth (Energy Information Administration, (EIA 2017)). In Mexico, power demand has also expanded consistently and grown during the same period, being the most rapid expanding sector of electricity consumers (Energy Information System, Secretariat of Energy (SENER 2016)).1
Multiple studies address electricity consumption determinants. At the national level, urbanization, income, weather conditions, and energy commodity prices are associated with electricity demand. A few studies considered the stock of electrical appliances, since data is difficult to obtain and is sometimes unreliable due to the limited information available on the kind and efficiency of goods (Fisher and Keysen 1962; Dergiades and Tsoulfidis 2011). However, understanding the implications of appliances is key to evaluating potential savings in electricity based on the efficiency of appliances (Dergiades and Tsoulfidis 2011).
On the household level, studies found that family size, structure, and composition, as well as dwelling characteristics and weather exposure, impact electricity use. Across the board, research demonstrated a strong positive association between income and electricity consumption. However, there is still limited research on energy practices and profiles. Two important shortcomings are of note. First, most studies fail to fully consider prior practices shaping electricity consumption, particularly the acquisition of electrical appliances. Second, studies have overlooked disparities and convergences in electricity use over time.
In this paper, we propose to construct electricity-consumption profiles based on electrical appliance ownership at the household level, examining whether there is evidence of the diffusion of electricity practices from higher to lower socioeconomic groups in Mexico. We present an appliance indicator based on the number, type, and potential electricity demand of goods. By doing so, we attempt to address Fisher and Keysen’s (1962) concerns about difficulties in having information on the stock of appliances and their uses. Using thirteen editions of Income and Expenditure Household Survey (ENIGH) (1992–2014), we show a strong association between the proposed indicator and electricity consumption across different income groups. Next, we employ a latent class analysis, to identify the electricity profile of households over time and examine how far we appreciate a diffusion of more intensive consumption of household equipment.
We find evidence of such expansion, which took place in a context where per capita income improved but where strong inequalities persisted. In addition to reflecting improving economic condition, this pattern could entail changes in lifestyles, values, and perceptions linking energy consumption to social status, as households could have acquired more equipment following patterns of consumption associated with higher socioeconomic status. This paper seeks to contribute to a better understanding of how consumption patterns are formed, which is a necessary step to achieving sustainable energy use practices. Mexico offers a particularly well-suited context to explore these issues, given its increasing electricity use and deep social stratification.
2. Inequality and Energy Sustainability
Although global energy demand has slowed down, per capita estimates for household consumption in many countries have increased, especially in emerging economies (International Energy Agency [IEA] 2015). This residential behavior might explain why the growing global demand for electricity has doubled in four decades, from 9.2% in 1973 to 18% in 2013 (IEA 2015). Mexico is no exception to this trend. Electricity has strengthened its share of total energy consumption in the country. According to SENER (2016), in 1992 this sector accounted for 16% of energy from all sources, while in 2012 it represented nearly 30%. Additionally, residential electricity consumption is the most important and dynamic fragment in recent decades. It grew at an average annual rate of 4.37%, exceeding the growth of commercial and public sectors. This increase was even higher in the 1990s when the average annual growth exceeded five percentage points (authors’ calculations, SENER 2016). This trend is particularly worrisome, because the Mexican energy mix is dominated by oil and gas; in fact, nearly 80% of electricity is produced based on oil, gas, or coal (IEA 2016).
The expansion of electricity consumption occurred in an economic context of unstable and poor macroeconomic performance, but where living standards and consumption improved. Despite ups and downs in macroeconomic conditions, average per capita grew 27% between 1992 and 2016 (CEPAL 2016), reflecting changes in the purchasing power of households. Income gains also took place at the bottom of the distribution thanks to social transfers and remittances (Campos-Vázquez et al. 2014). Moreover, housing and consumer credit expanded, helping broader segments of the population than in the past (López-Calva and Lustig 2011). The share of credit for consumption rose, specifically towards durable goods. Consumption credit represented nearly 17% of all credit between 1995 and 2012. Credit for consumption of durable goods expanded, especially in the 2002–2006 period, when it ascended to nearly 27% of consumption credit (authors’ calculations using Banxico 2016).
Inequality levels remained high, with small fluctuations (see Figure 1). Between 1998–2004, the Mexican Gini coefficient declined, but this indicator is still one of the highest in the world (Esquivel 2011). Similarly, official statistics show a reduction in poverty, although in 2012, 43% of the households were still below poverty line; a high proportion for a country with the level of development of Mexico (National Council for the Evaluation of Social Development Policy[CONEVAL] Coneval 2014). Improvements in income distribution and reductions in poverty may have affected household demand, especially of durable goods such as cars and appliances (Wolfram et al. 2012). Parametria (2006) estimated that households used credit mostly to purchase appliances (37% of respondents) and clothing (15%). Better social conditions and monetary policy could have created an increase in durable goods’ acquisition, which in turn could have involved greater energy consumption.
Less explored in contemporary literature are the environmental implications of income distribution changes on the possession of energy goods, and to what extent they became an indicator of social standing as social position gets tied to consumption practices (Røpke 2006). Discussing the association between income distribution and energy practices is particularly relevant for economies in transition, in which per capita income has increased markedly in recent decades, and in which the share of consumption of middle and lower income groups is expanding. Given the size of their population and economies, and given expected changes in their sociodemographic profiles, the performance of these countries is critically important to achieving global energy sustainability. Moreover, multiple studies show the stickiness of energy practices once they are adopted; therefore, it is necessary to explore how households incorporate energy uses and to what extent this varies across socioeconomic groups as countries increase their economic development. A larger question posed by this study is to what extent it is possible to achieve equity and energy sustainability.
The present paper adds to the microsociological approaches that conceptualize sustainable consumption behavior, lifestyles, and daily routines related to the role of citizen–consumers in sustainable development (Spaargaren 2003). There is an agreement that unsustainable patterns of consumption and production are the primary cause of environmental deterioration, especially after the Johannesburg Plan of Implementation at the World Summit on Sustainable Development in 2002 (Akenji and Bengtsson 2014; Barber 2003; UNEP 2010). The new development goals imply a shift to improve systems of provision, reduce environmental impacts due to more efficient resource consumption and reduced waste, and enable countries to achieve their goals in poverty eradication (Bizikova et al. 2015, p. 9).
In fact, Sustainable Development Goal (SDG) No. 12 seeks to “ensure sustainable consumption and production patterns”, although it does not address household practices explicitly. While this paper does not attempt to propose new SDGs indicators, it seeks to move forward the discussion of energy sustainability by considering changes in electricity use over time. We analyze appliances ownership as a way to understand electricity consumption. We construct profiles on the levels of consumption and its association with demographic and socioeconomic characteristics. Then, we examine whether higher consumption profiles become more common across middle- and lower-income households. By examining the diffusion of practices, we seek to assess whether a more intensive use of energy is being constructed across income groups and over time.
3. Electrical Appliances Ownership
Sustainable electricity consumption relates to “choosing electricity from renewable or other less environmentally detrimental sources” and choosing “appliances and of their duration and modes of use with the ultimate goal of curbing overall consumption” (Fischer 2008, pp. 79–80). Therefore, appliance purchases are the first step for energy conservation (Fischer 2008, pp. 79–80) through decisions about their numbers and characteristics, from the TV set to electric heater. Understanding ownership of appliances over time and across groups becomes a mandatory task for constructing baselines to assess energy sustainability.
Households are a unit of production and consumption that use energy, directly and indirectly. Direct energy consumption relates to final energy used, from different energy sources, which reaches households after transformation from its primary sources. Indirect energy consumption (grey energy) occurs when households have employed various goods and services that, in their processing, use different energy intensities. In this document, we focus on final electricity consumption of Mexican households.
Of particular interest is the relationship between income and consumption and electric appliances. Previous studies have shown that income has a critical effect on energy consumption, as there is a positive association between them (Lenzen et al. 2006). Additionally, some studies suggest that income plays an essential role not only in consumption habits, but also in fuel types and type of technology deployed in their consumption (Cayla et al. 2011; Sovacool 2011; Stephenson et al. 2010). However, the energy demand of households is associated with other factors also, such as family structures, living arrangements, household size, education, daily life organization, or, generally, lifestyles. (Greening and Jeng 1994; Jensen 2008; Lenzen et al. 2006; Pachauri 2004; Prskawetz et al. 2004; Pucher et al. 1998; Van den Bergh 2008). These sociodemographic features affect energy profiles and some studies identify subpopulations according to their mode of consumption and behavior (Belaïd 2016; Lévy and Belaïd 2017).
Another set of studies points to the need to consider effects such as demonstration purposes, imitation, and dissemination of consumer practices in more explicit ways. On one hand, a wide range of works have been concerned with explaining the persistence of energy-intensive practices while facing deterrent policies, particularly rising prices or special taxes (Greening et al. 2000), frequently resorting to explanations linked to values and household expectations. On the other hand, another group of works has sought to explain consumption practices more in terms of the relevance of these as indicators of belonging and social status, even in the case of consumption linked to routinary and basic, but not lavish, needs (Warde 2015). Studies on the subject are more common in developed countries, particularly in Europe and the US and, more recently, in China (Jones et al. 2015). Latin America has a long way to go in this direction, especially Mexico. For the Mexican case, Sánchez Peña (2012) found that factors associated with total energy consumption strongly associate with household demographics, with emphasis on the household’s life cycle (measured by the head’s age) and the family arrangement of residence and household size. This author also showed that energy inequality was closely associated with income inequality, but energy inequity grew even in times of improving social conditions (Sánchez Peña 2016).
In general terms, studies find the same determinants for electricity consumption regarding the sociodemographic profile of the households. Research supports income as an important predictor of electricity consumption; multiple studies also find a positive association of household and dwelling size, as well the household head’s age and weather variations with electricity use (Zhou and Teng 2013; Alberini et al. 2011; Blázquez et al. 2013).
Multiple studies usually control for appliance ownership, but few explicitly seek to address its implications for electricity consumption: among the latter studies, we found research seeking to understand the implications of appliances on electricity demand at the national level (Dergiades and Tsoulfidis 2008), as well as studies looking at the household level. Yust et al. (2002) suggest that this relationship should be understood in the context of a human ecosystem model, by considering four components: (i) the natural environment, and physical and biological factors; (ii) the human organism, individuals, families, or household features; (iii) the social environment, and the psychological and social behaviors of the occupants; and (iv) the built environment. However, for Yust et al. (2002), environmental variables explained largely electricity consumption while appliances play a significant but smaller role. Similarly, Jones et al. (2015) suggest that electricity consumption is linked to socioeconomic factors, housing characteristics, and appliances. Tiwari (2000) does explicitly estimate electricity demand using the average power requirement of individual appliances in Mumbai (1987–1988). He founds a close relationship between holding of appliances and electricity demand. Boogen et al. (2014) consider energy services and appliances in their analysis of electricity consumption using household survey data from Switzerland (2005 and 2011). They found a positive association between the appliance index and power demand, net of other demographic and economic characteristics.
Previous studies suggest that electricity consumption responds to elements of the natural and built habitat, practices associated with everyday demands, and household activities, as well as motivations and expectations of consumers. In these studies, the number, type, and efficiency of appliances impact electricity use in the household, beyond household characteristics. Still, they do not seek to examine the underlying differences in electricity use that holding those appliances may entail. We suggest that considering the buddle of electrical goods owned by household and how it changes over time could inform us regarding the adoption of energy practices.
4. Research Methodology
There are two approaches for studying domestic energy consumption: top-down and bottom-up. Kavgic et al. (2010) explain that top-down models are relatively easy to estimate with the information provided by macroeconomic indicators, such as price and earnings, technology and pace of development, and climate. These models are mainly based on historical information regarding past consumption. On the other hand, Swan and Ugursal (2009) indicate that the bottom-up approach identifies the contribution of each end-use to the dwelling’s total energy consumption. This type of approach provides a greater understanding of different items associated with power consumption. Bottom-up engineering models seek to evaluate actual energy use, accounting for use time, as well as appliances’ characteristics. However, data for these studies is demanding and rare. Another approach is to establish a statistical association between consumption and households or dwellings. These studies tend to employ survey data, which is more readily available, although it faces reliability concerns regarding adequate registry of energy consumption and equipment (Fisher and Keysen 1962; Dergiades and Tsoulfidis 2008).
We present a bottom-up study, based on consumption behavior of households registered in a nationally representative survey, ENIGH, from 1992 to 2014. ENIGH includes information on sociodemographic characteristics of the household, income level, housing attributes and goods, and expenditures by energy source. Specifically, the survey collects information on the kind and number of appliances they have. However, categories of appliances changed over time. Electricity consumption was estimated by dividing the expenditure by the average electricity price.
We analyze ownership profiles and if there has been a change in the consumption of electronic appliances over time to consider whether there has been an expansion of practices from the highest to the lowest socioeconomic strata. The overall analytical strategy is to first examine household appliances ownership over time. Second, it is to build consumer profiles from a latent class analysis that allow us to associate sociodemographic characteristics of households to an appliances index. Finally, we examine to what extent these consumption profiles are modified over time to approximate the idea of dissemination of consumer practices.
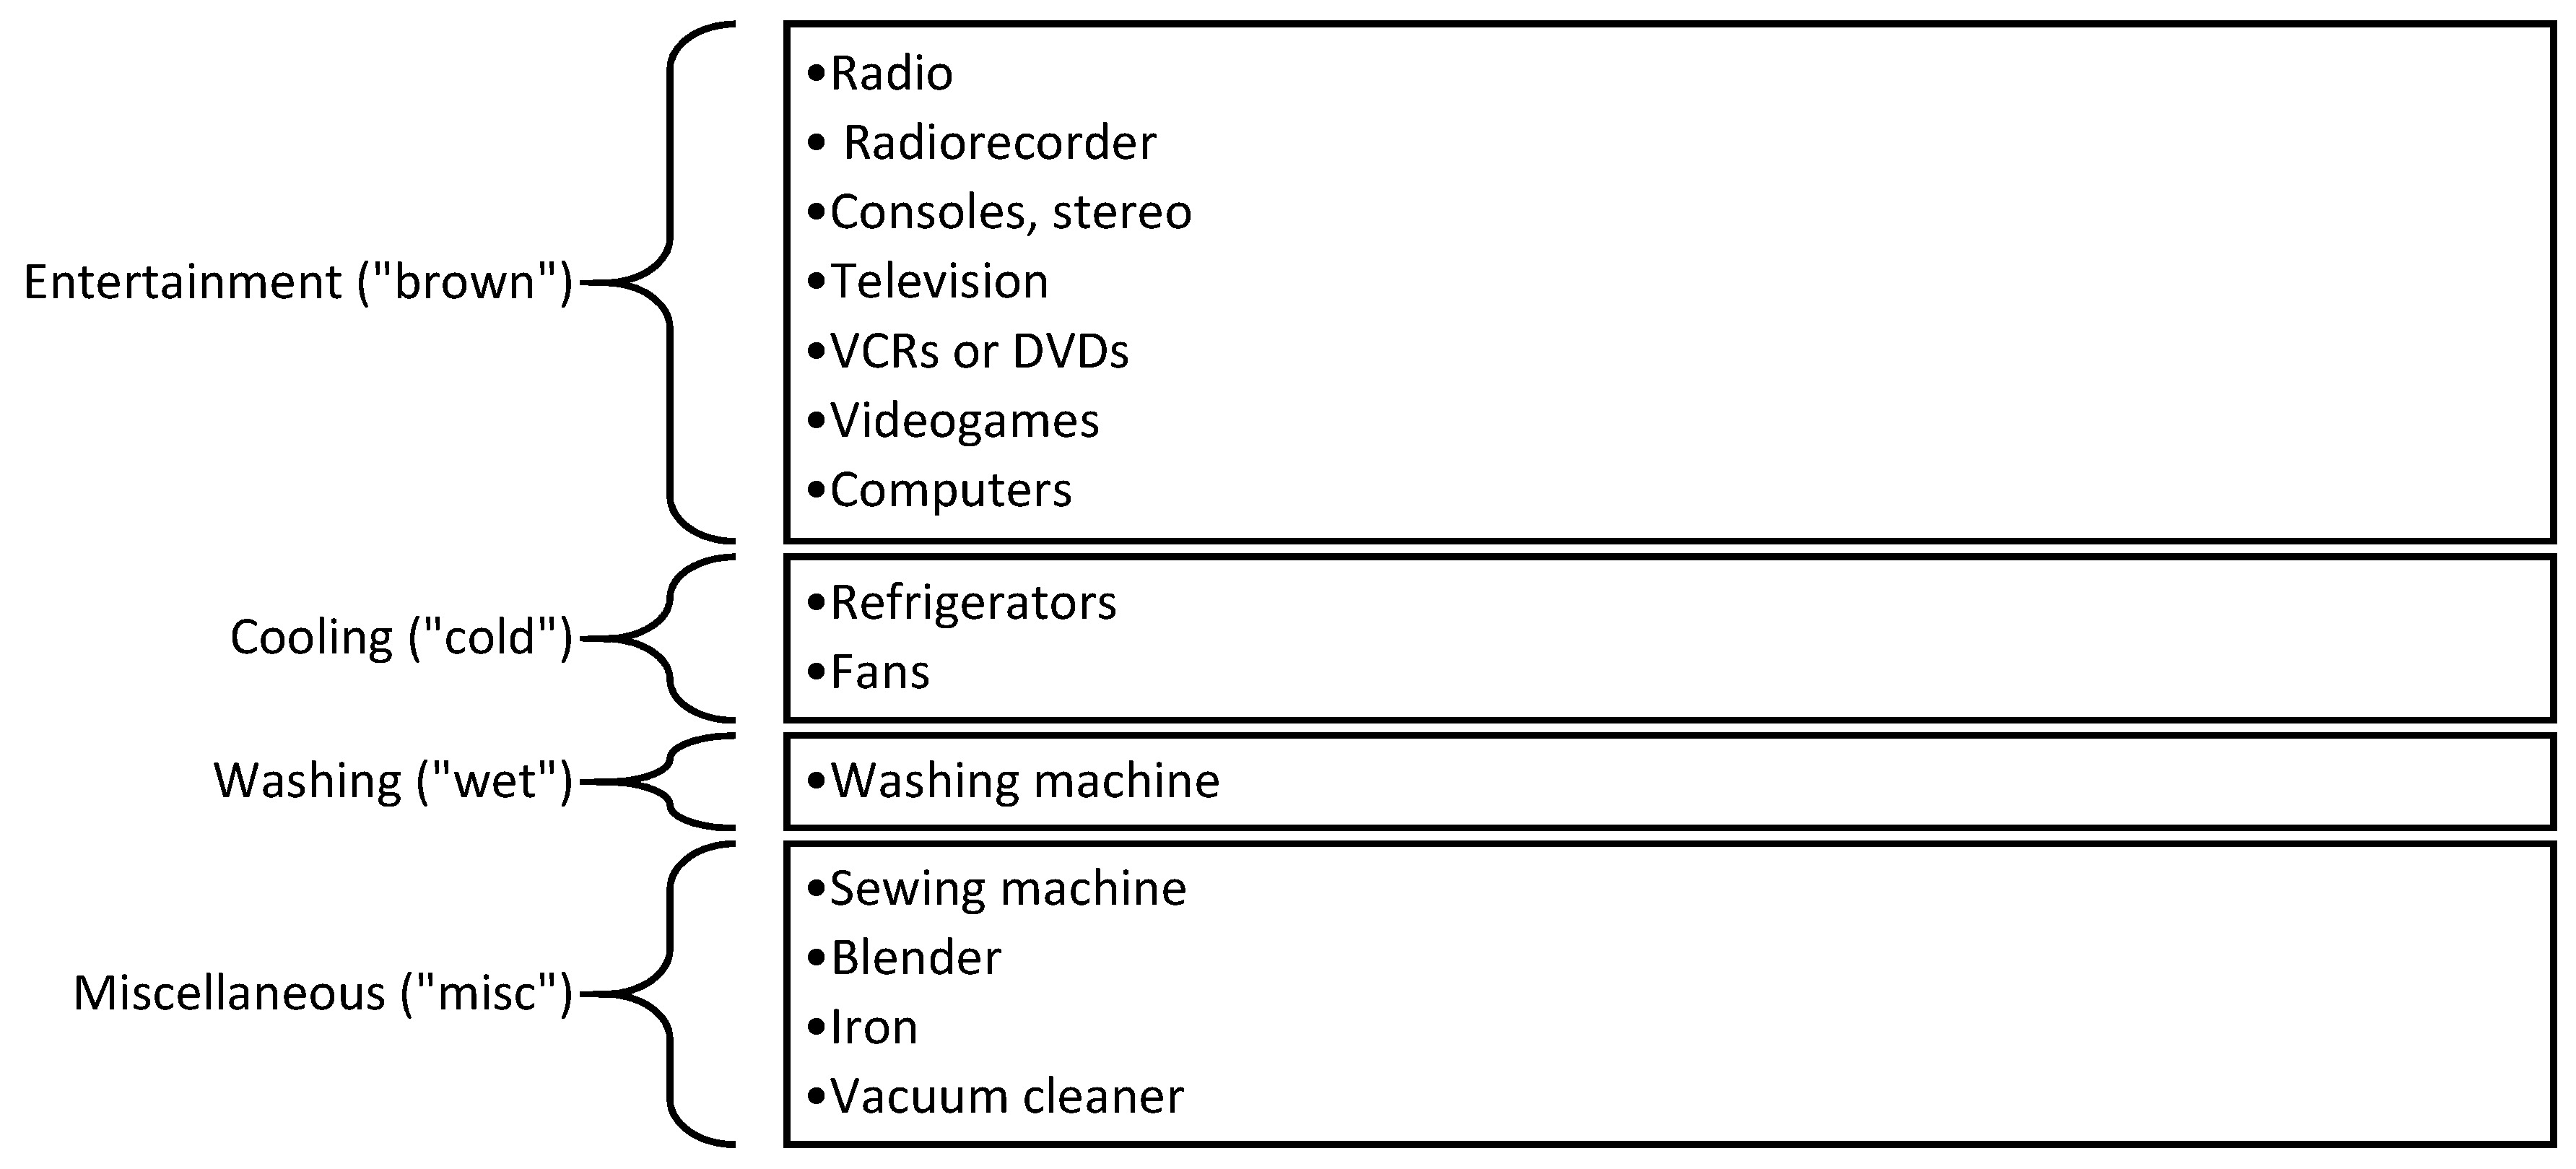
We began by constructing an appliance-ownership index. The first step was standardizing the appliances in the ENIGH data for the period 1992–2014. Only goods with full-coverage data for the analyzed period were included. In some cases, this meant consolidating categories or transforming ones to take into account the evolution of technology (e.g., VHS became DVD player). Thus, we tracked 14 appliances over time. Following Yao and Steemers (2005), we classified the 14 items into four categories (brown, cold, wet, and miscellaneous) according to their uses (Figure 2).2 Each category implies different frequencies and intensities of use, as well as electricity demand.
ENIGH does not provide historical information on the appliance model or year of acquisition, so it is not possible to accurately estimate the energy demand for electrical appliances. It is possible that appliances become more efficient over time and, therefore, reduce their energy consumption. However, our data suggest that electricity consumption increased and is closely associated with appliance ownership, as shown below. That could also be associated with the stratification of appliance efficiency, that is, more recent and efficient models are acquired for higher-socioeconomic status households. With our data, we cannot account for such efficiency gains, but we attempt to understand consumer practices by recognizing differences between items regarding energy efficiency. Yao and Steemers (2005) point out that the most intensive end uses in electricity consumption refer to appliances for cooling (“cold”) and washing (“wet”), while miscellaneous appliances consume relatively little electricity but have become pervasive. We take advantage of the classification and constructed by proxy from a pondered average of the number of appliances, weighing the two categories with higher consumption—“cold” and “wet”—more than the rest.3 This provides a better way of approaching the environmental implications than a simple index with a summative number of appliances per household.
This weighted appliance index, however, still cannot get all the behavior features related to appliance use, and ENIGH does not provide information about it, nor does any other national survey in Mexico. So, we make profiles estimating a latent model, assuming it is possible to identify underlying behavioral patterns from explanatory variables, such as sociodemographic characteristics, and regional and period conditions.
We apply a latent class analysis, where our indicator variable is the appliance index and the resulting latent variable is a categorical variable that classifies households according to their consumption profile.
As the index is a continuous variable, the standard model is a finite Gaussian mixed type, which determines subpopulations within a continuous data distribution (Oberski 2016). In these models, parameters are estimated by the method of maximum likelihood (ML), i.e., the solution consists of parameter values that maximize the likelihood function and natural logarithm using the expectation–maximization (EM) algorithm or the Newton–Raphson algorithm. Both algorithms start with arbitrary initial values of parameters and continue the estimation and re-estimation of parameters until they converge to a maximum of a likelihood function (Reyna and Brussino 2011).
We introduce as covariates household features (household size, education, age, and sex of head of the family) and dwelling characteristics (place of residence, number of rooms, and flooring construction materials). Thus, the model estimates latent class membership probability by taking into account indicator variables (appliance index) and covariates. Besides household and dwelling characteristics, we included two other groups of control variables: geographical region and the year of the survey. These control variables cluster the observations, but they do not generate a parameter in the model (inactive variables). The inclusion of both inactive and active covariates allows us to estimate the latent variable, as accounting for an underlying mechanism of the consumer practices.4
To get the number of classes or latent profiles, we use the parsimonious Bayesian information criterion (BIC). Our estimations result in models with a decreasing BIC along the number classes (see Table A1), so we weigh into our solution the measures of internal consistency as the classification error minimization and the interpretation of the estimated classes. Thus, we elected the model of five classes, which ensures less than 20% of class error, and it is the model where the BIC begins to decrease more slowly.
5. Results
5.1. Trends in Appliances Ownership
Between 1992 and 2014, access to electricity in Mexico became almost universal. At the beginning of the 1990s, only over 6% of households declared having no access to electricity in their homes, while this percentage has dropped to less than 1% of families since 2005 (Figure 3). On the other hand, energy consumption augmented; notably, power consumption moved from representing half of the total of energy consumption to nearly three-quarters (Figure 4). In other words, it became the primary energy source for households.
The calculated appliance index is a reliable indicator of electricity consumption, and the average correlation of the index and electricity consumption is 0.41 for the period 1992–2014. In our analysis, the acquisition of goods is an indicator of consumption practices—which we cannot obtain by looking at an aggregated variable such as electricity consumption. So, by analyzing the index and appliance ownership over time, we can assess how consumption practices have evolved in Mexico.
Appliance ownership has changed over time, and so have income levels. Figure 5 shows the equipment according to the classification given in Figure 2 and by income deciles. We observed an increase between 1992 and 2002 in all deciles. Moreover, between 2002 and 2014, only the lowest deciles grew (deciles 1 to 4). Deciles 5 and above show stagnation in the number of home appliances; even the richer households reduced their number of appliances, particularly brown items. However, the gap between the lowest and highest income groups remained.
This graph also allows us to examine what sorts of apparatuses lead the expansion: electronic devices designed for home entertainment. The technological evolution might have resulted in end-uses consolidation (in particular between DVD players and TV streaming); that could explain their stagnation or even decline in the middle deciles and the top decile over the last decade. Figure 5 may also be pointing towards diffusion between income deciles over the years if we consider the number and type of appliances owned by families at the lower end.
In Figure 6, we constructed the deciles by electrical consumption per capita. Results show a similar pattern to Figure 5: there is a relationship between the number of electric appliances and the level of household electricity consumption. To estimate the latter, we divided the expense over the yearly residential electricity tariff and we obtain the consumed electricity expressed in kilowatt hours. Since 2010, the survey collection of electricity expenditure changed from self-declaration to bill consultation. This modification explains the reduction of power consumption for all groups since that year. It also affects comparability over time of the consumption levels, but not necessarily in the distribution across households and, therefore, not on the construction of energy deciles.
Figure 6 shows two important points. First, it demonstrates a relationship between the number of electric appliances and household energy consumption. Second, it points to an evident stratification of energy consumption associated with home equipment that has persisted over time. We also note that the lowest energy deciles have more appliances increasingly over time, but the middle and top deciles do not. Between 1992 and 2002, the upper deciles show a rising trend, but later they present stagnation and even a reduction between 2002 and 2014. We notice that cooling items have greater presence in high consumption deciles, while miscellaneous items show similar behavior throughout all energy deciles and time, except in the lowest levels. Similarly, there are few changes in the ownership of the washer machine (wet). In contrast, the number of entertainment devices that households own vary noticeably over time and increase with regard to energy consumption levels.
5.2. Latent Profiles: Identifying Differences in Appliance Use
Table 1 shows the results of the latent profiles’ model, which identifies five profiles for the period 1992–2014. Those profiles account for distinct appliance ownership and sociodemographic patterns. Each accounts for different levels of energy use, as measured by appliance index; therefore, we decided to identify them based on the level of consumption, going from the minimum consumption group to the high one (Table 1). The table shows each group proportion for households and the average of the index for each class. Results suggest that only 8% of the households belong to the high consumption group and only 7% to the minimum one. The largest category is medium consumption, which includes 37% of households. Classes are clearly distinct in their appliances index; the high consumption group has a mean of 3.7, which is 20 times larger than the average rate obtained by the minimum category, and twice that achieved by the middle consumption group.
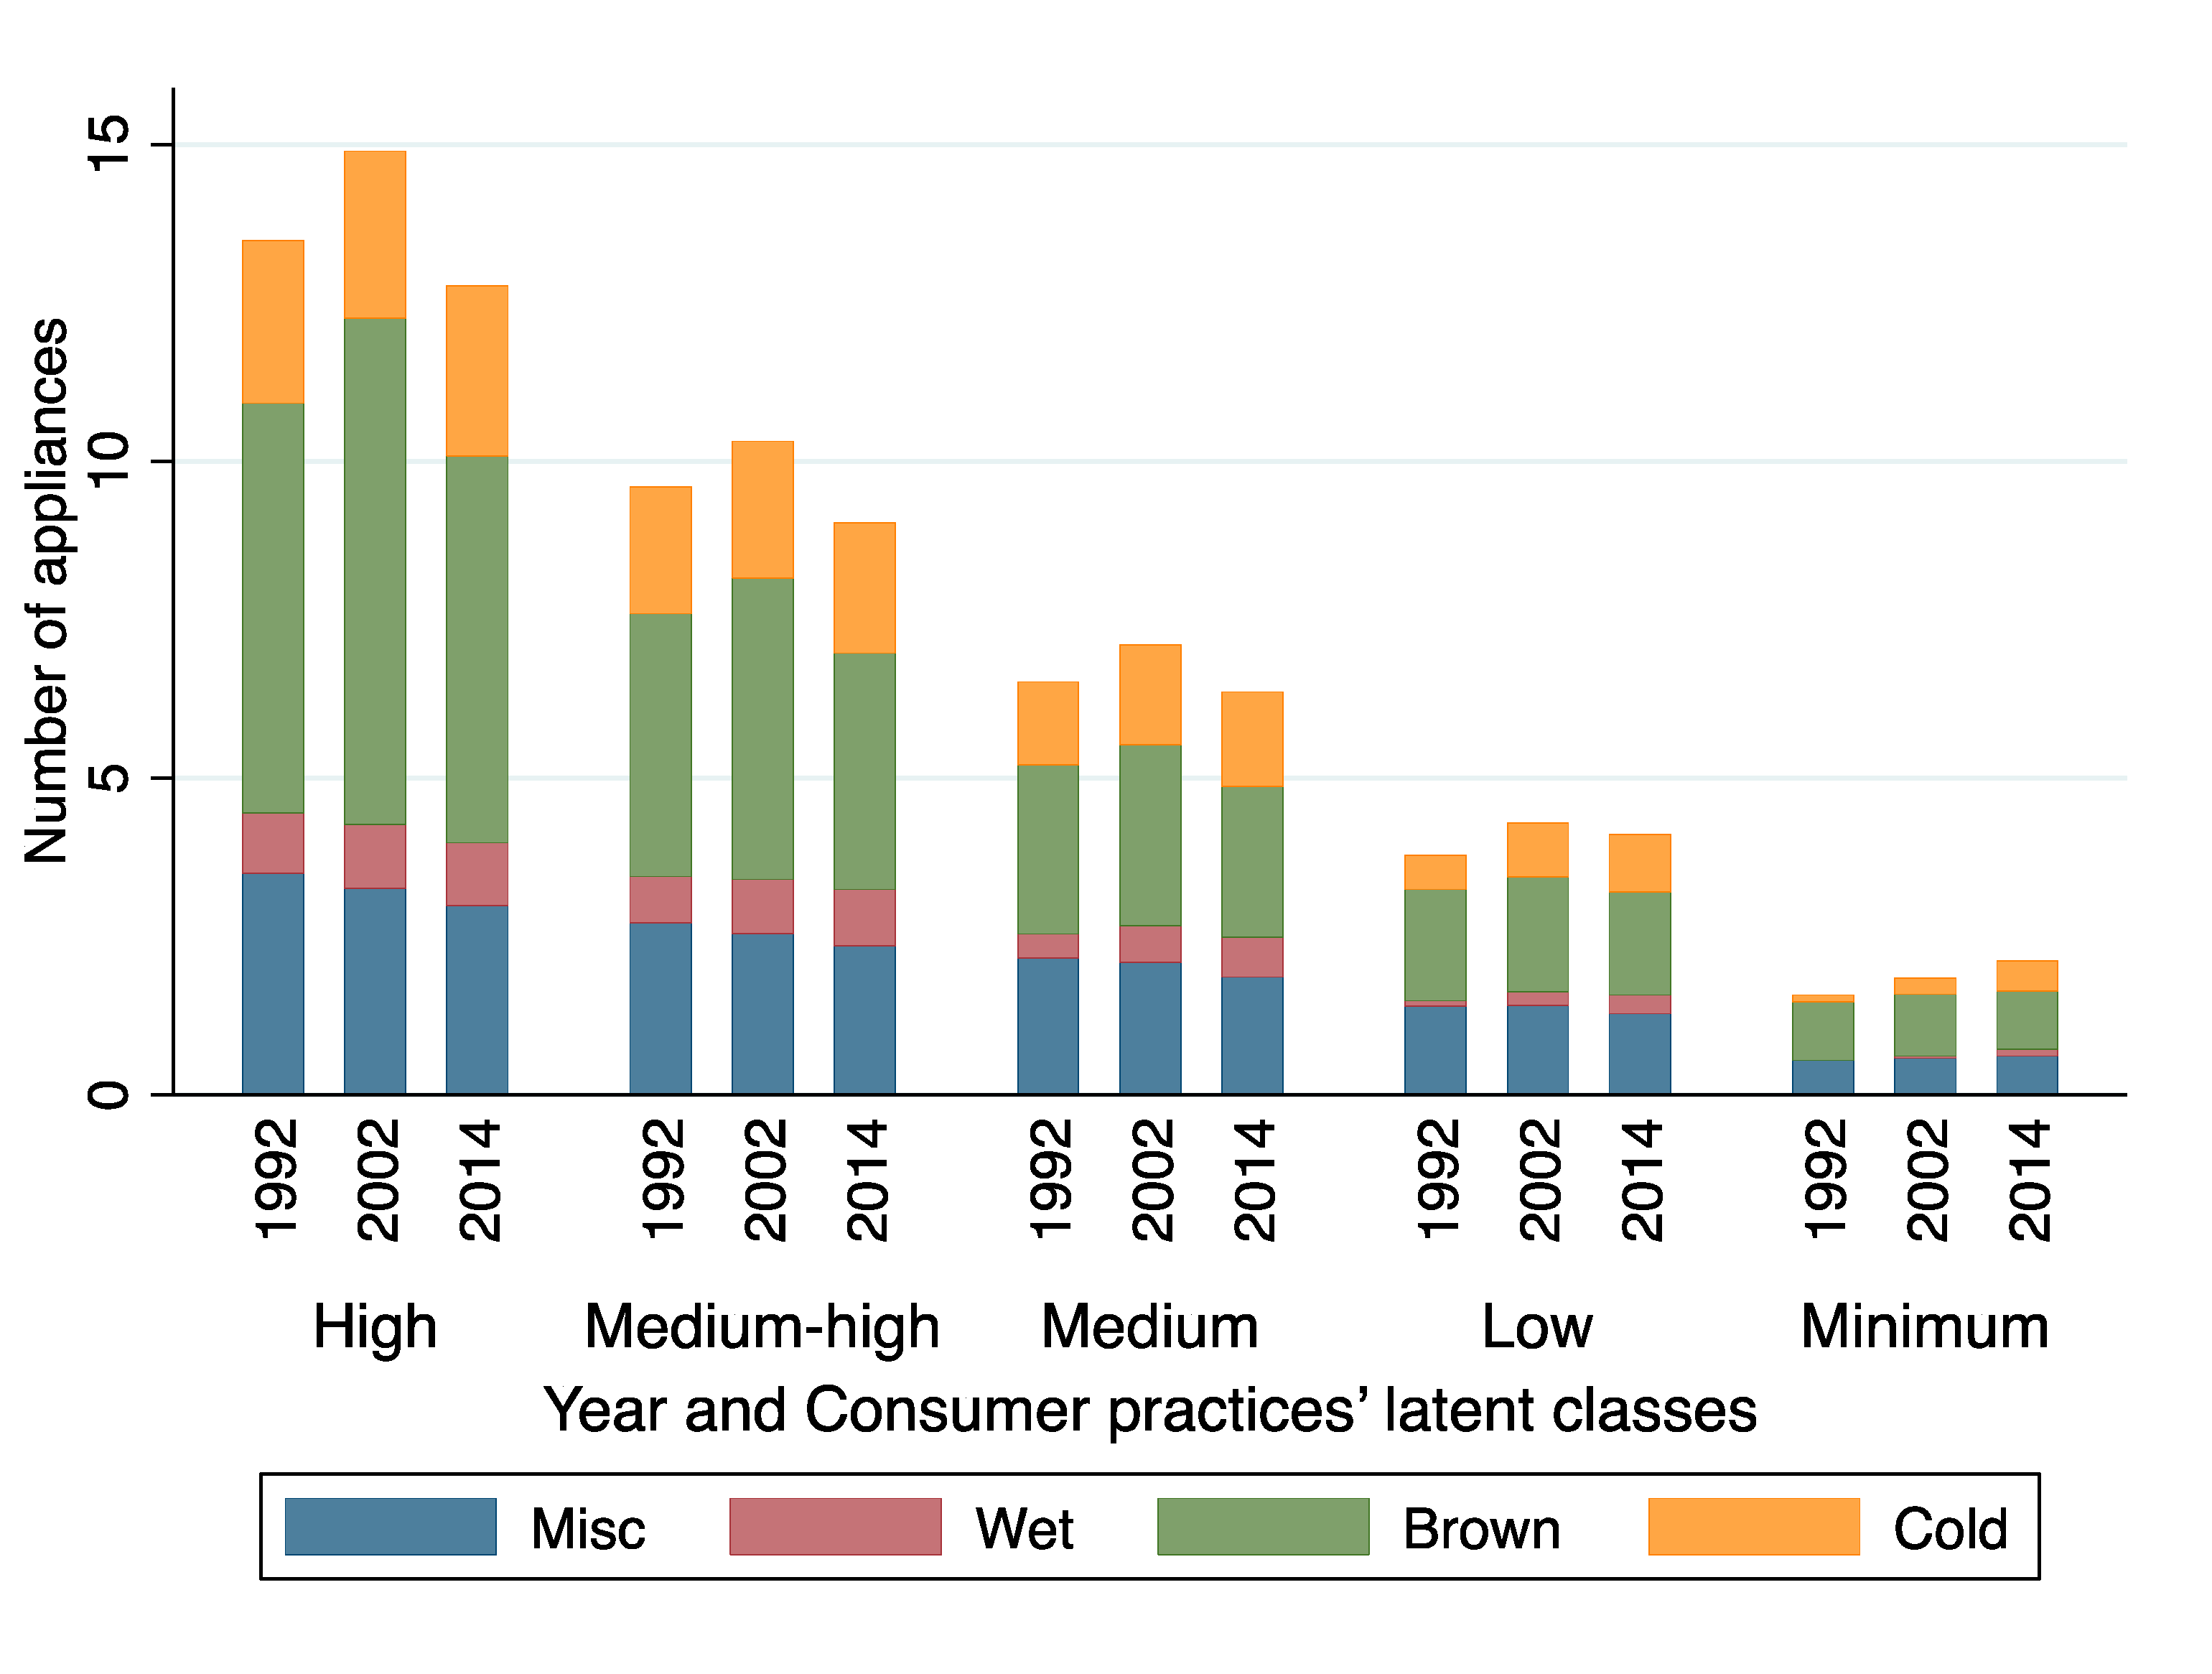
Figure 7 shows the distribution of appliances by end use type for five identified profiles at three points in time. The high-consumption class holds a greater proportion of appliances dedicated to entertainment. In 2014, this profile had over 13 appliances on average, somewhat below a maximum level reached in 2002. In the case of “medium-high” profile, there is some stagnation in the number of appliances over the years, averaging around 10. Again, we see an increase in brown appliances over the years. Households classified as “middle” consumption level have more than five appliances and that number keeps stable over time. It is remarkable that this class has a smaller presence of appliances used for washing, “wet”, and cooling, “cold”. Low energy consumption profile households have almost no presence of washing machines; this profile has fewer than five appliances per household. Finally, in the class of minimum level of consumption, there is no presence of washing and cooling machines, which are the most energy intensive. The consumption differences between classes are statistically significant, according to the estimations of the Kruskal–Wallis equal-populations test for each of the years of study (see Table A2, in the Appendix A).
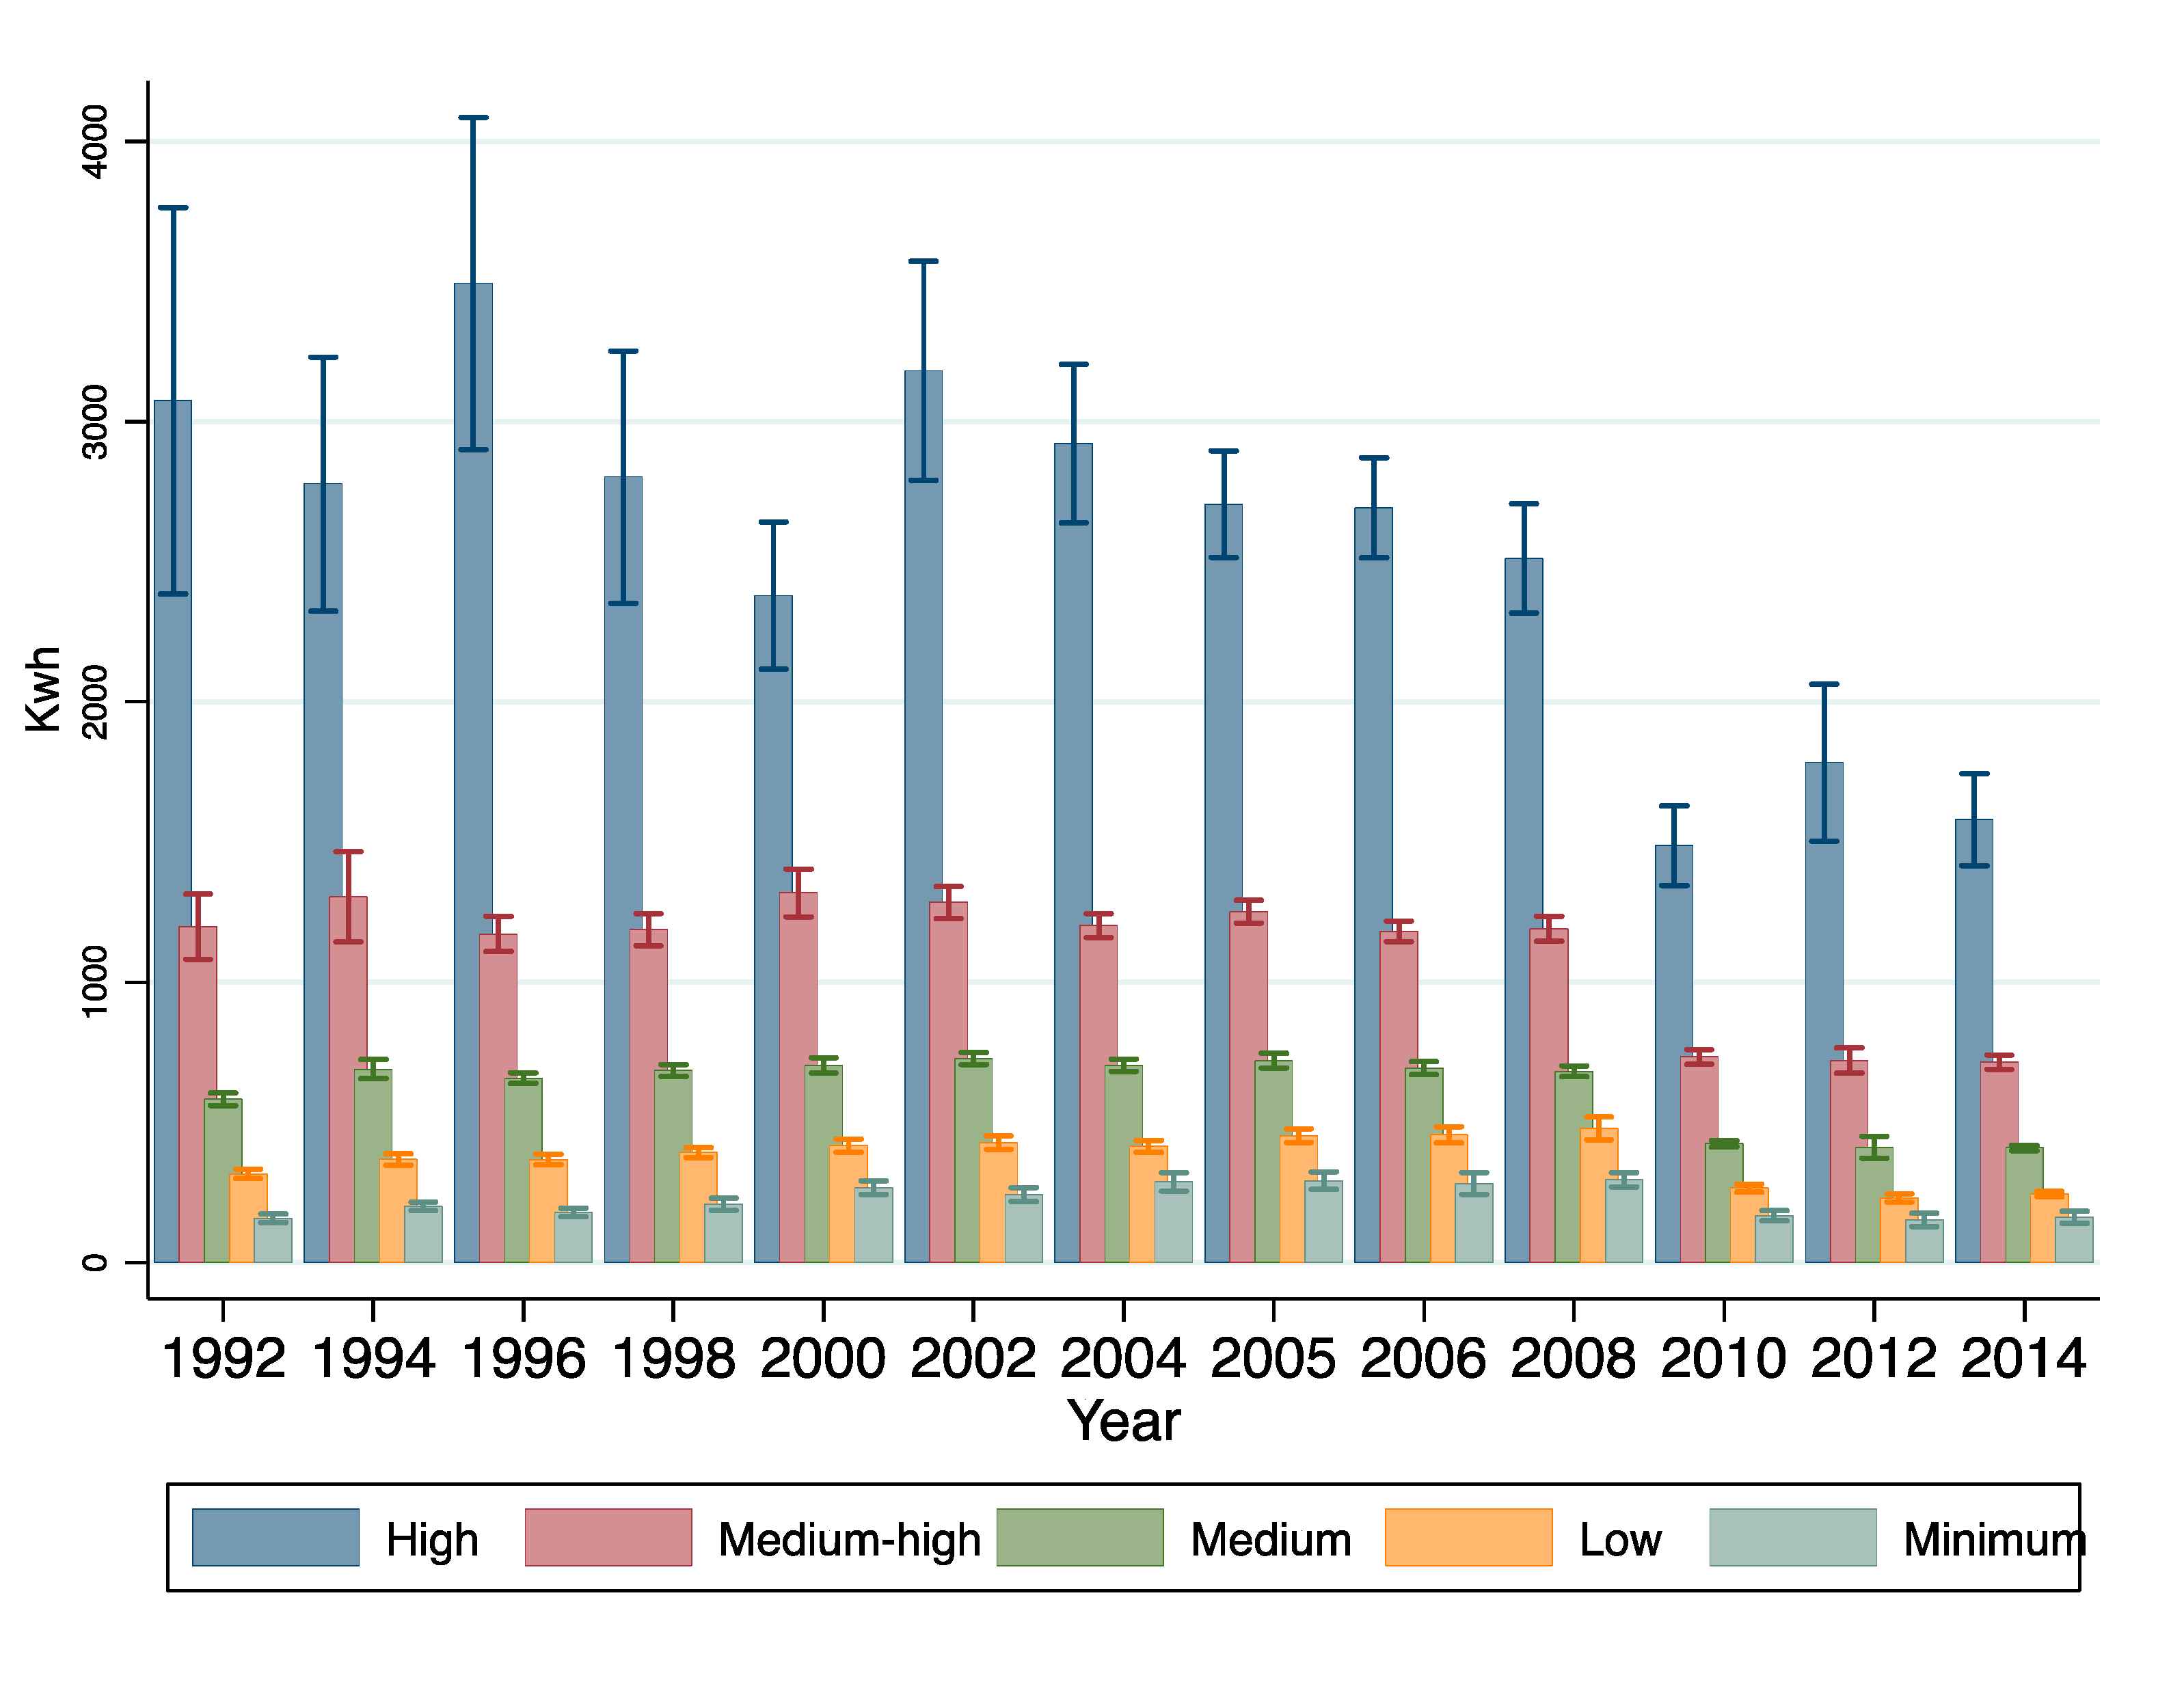
Such results suggest our model works for predicting appliance ownership. To establish its predictive capacity for energy consumption, we calculate the average kilowatt hours per capita consumed by each latent class, as Figure 8 shows. The estimated classes have different levels of consumption, and those differences are statistically significant for all years (see Table A3 in Appendix A). Also, our resulting latent profiles match the expected consumption patterns. Over the years, consumption remains relatively constant within classes, except for the high-consumption profile, which shows more variability because of the size of the group, as interval confidences show.5
Regarding its sociodemographic profile (Table A6 and Table A7), it is evident that the wealthier condition accounts for the higher consumption; the wealthier condition is largely concentrated in high-income households, with better housing conditions, larger dwellings, and highly educated occupants, with household heads mostly in their prime productive ages and largely urban. In contrast, minimum consumption is characterized by low income, bad housing conditions, and low education, and is largely rural and with older household heads.
More subtle differences appear between categories in the middle. The medium-high-consumption class has a better profile than the other two groups, but it is less wealthy than the high-consumption one despite their similar demographic profiles. The medium consumption class has lower levels of income than medium-high consumption. It is also less urban and with poorer housing conditions. The head of the households tends to have an elementary education, while households are of smaller size and receive remittances in greater numbers. This class was the largest during the analyzed period.
The low-consumption class is split between rural and urban residency. At the same time, the distribution of educational levels is even more skewed downward, with over 20% of the heads with no education. We also observe a presence of more dwellings with bare floors and slightly larger household size and homes compared to the medium consumption profile.
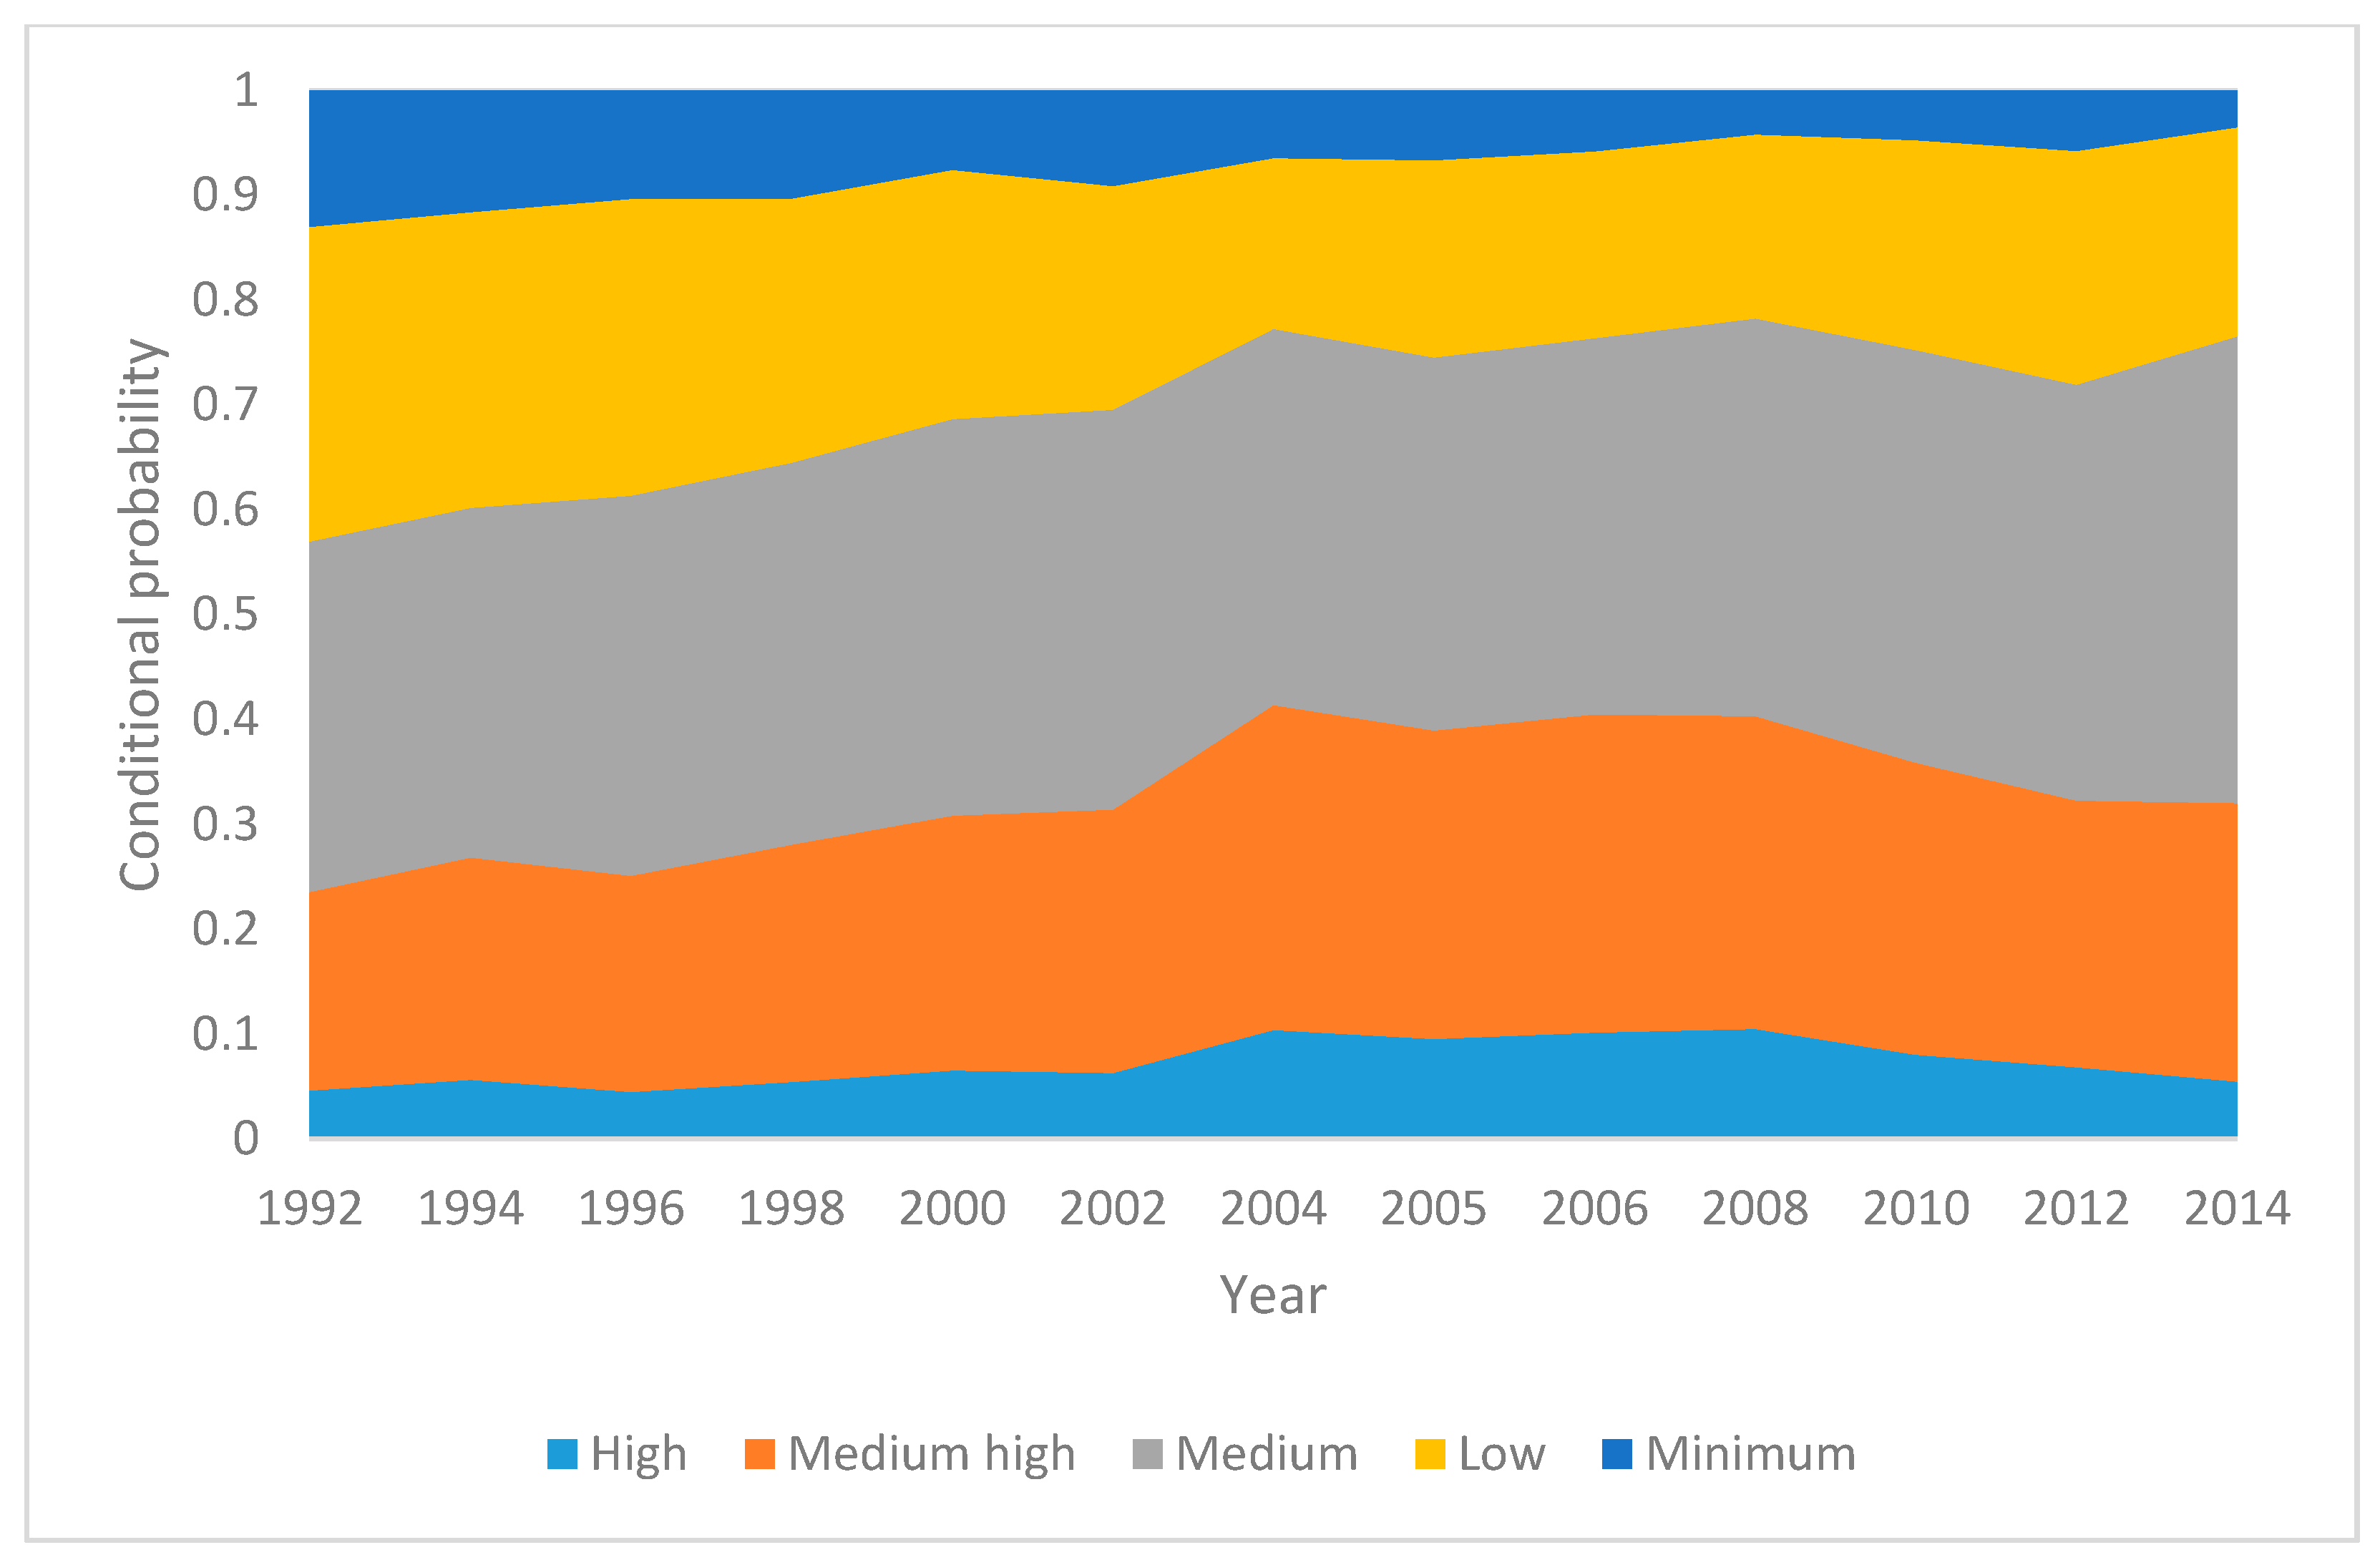
So far, we show that latent classes relate to distinct levels of energy consumption and distinct sociodemographic characteristics. To explore whether there has been an expansion of energy practices, we consider employing conditional probabilities. Figure 9 shows the membership probability of being in each class by year. Medium consumption increased its share among Mexican households over time as it did the medium-high class. On the other hand, less intensive energy classes (low and minimum) have reduced their presence throughout the two decades, while the high-energy class had slightly higher probabilities during the beginning of the 2000s, but since 2008 it has diminished, and its 2014 levels are similar to those in 1992.
While Figure 9 gives us a preliminary idea of the dissemination of consumer practices; this process can be better appreciated by examining how much membership probabilities have changed over time by income levels. Figure 10 graphs that relationship at the beginning and end of our observations. It clearly shows that the medium consumption class greatly expanded its presence among low- and middle-income households. The medium-high energy class also expanded its presence in the bottom part of the distribution, but less strongly. In contrast, the low consumption energy class diminished noticeably—and even more noticeable was the presence of the minimum class, which was limited to the poorest households in 2014.
Meanwhile, the highest consumption class seems to maintain its chances at higher income deciles, with negligible increments in the intermediate levels. This high-consumption class inelasticity suggests that the high-consumption cluster is firmly anchored to wealthier households and it is markedly different from other households. However, an increment of appliances and, consequently, electricity use is distinctly perceived in the middle and lower strata.
6. Conclusions
Over the last two decades, Mexican households have experienced important sociodemographic transformations: more educated, smaller, older, more urban, and with a greater proportion of female headship. These trends were present across all income strata, but differences remained strong between groups (see Table A7). These demographic changes, along with economic gains, contribute to explaining the expansion of more intensive energy profiles, but, by themselves, cannot fully account for it. In fact, the model results show distinct social configurations for each class but with changes in their distribution across income deciles.
Practices are difficult to capture, but we can approximate them by looking at the underlying traits in the link between sociodemographic characteristics and energy uses. Moreover, we could improve the understanding of energy practices by constructing an appliance index that seeks to capture not only the number of appliances but also the intensity of energy demand by considering their uses.
Our study shows a growth in the consumption of appliances and electricity over time and across different income levels. It also identifies latent profiles of energy consumption, which show a clear association with electricity consumption. Thus, it suggests that holding of appliances could help us identify energy profiles and, consequently, it could also orient public policies regarding energy efficiency norms and promotion of responsible behavior. Also, further analysis should address the incentives to consume more efficient appliances such as labeling appliances, dissemination activities, and product replacement schemes. For this, it is necessary to research both consumption practices and consumer intentions.
The latent model analysis points out that the presence of a high-consumption class remained over time. Even if its size is small, its level of consumption is notoriously larger than the other classes, and it contributes sustainable consumption inequalities over two decades. It seems clear that energy-intensive practices have a strong relationship with higher levels of income. Still, results also suggest that medium and medium-high practices expanded their presence across income levels, while low-intensive patterns reduced their participation. This could point to a process of dissemination of practices across households.
This pattern poses challenges for energy sustainability, because appliance use, and therefore, electricity, could increase. Current trends point to not only the expansion of large appliance ownership (refrigerator, washing machine) but also of entertainment devices, which are expected to keep expanding in the coming years. This trend points to the need to improve efficiency norms in small but pervasive items.
The challenge, however, is equity. In a country with strong inequality and high levels of poverty, material gains could be seen as a sign of improving living standards and decreasing domestic work. However, to achieve sustainable consumption goals, we need to address the expansion of consumption practices across household groups and to find an equilibrium between material welfare and environmental goals. Expanding electricity consumption of a large number of households could have an important impact on environmental indicators, but the concentration of power consumption in a small group of households could be more relevant. Addressing this inequality could offer a way to both diminish environmental impacts and transform our understanding of “desirable” practices.
Acknowledgments
This work was supported by the USAID grant 2000004882. “Poverty and climate change in Mexico: the implications of mitigation policy, climate impacts, and development pathways for household welfare”. We are grateful to the three anonymous reviewers for their useful comments and suggestions.
Author Contributions
The authors contributed equally to the analysis and writing of this paper.
Conflicts of Interest
The authors declare no conflict of interest.
Appendix A

Table A1.
Goodness of fit for profile latent models. From 1 to 8 classes or clusters models.
| Model | LL | BIC | AIC | Npar | Class.Err. |
|---|---|---|---|---|---|
| 1-Class | −318,123 | 636,270 | 636,250 | 2 | 0.00% |
| 2-Classes | −260,394 | 521,071 | 520,833 | 23 | 7.40% |
| 3-Classes | −228,956 | 458,455 | 458,001 | 44 | 11.68% |
| 4-Classes | −217,093 | 434,986 | 434,315 | 65 | 15.97% |
| 5-Classes | −211,992 | 425,044 | 424,157 | 86 | 19.61% |
| 6-Classes | −211,211 | 423,739 | 422,635 | 107 | 20.42% |
| 7-Classes | −208,994 | 419,564 | 418,244 | 128 | 23.86% |
| 8-Classes | −208,724 | 419,283 | 417,746 | 149 | 25.93% |
Source: Authors’ calculations with ENIGH (1992–2014), LL = Log likelihood, Npar = number of parameters; Class.Err. = Class Error, BIC = Bayesian Information Criterion, AIC = Akaike Information Criterion.
Table A2.
Results of Kruskal-Wallis equality-of-populations rank test for the number of appliances and consumer’ practices latent classes.
Table A2.
Results of Kruskal-Wallis equality-of-populations rank test for the number of appliances and consumer’ practices latent classes.
| Year | Chi2 Estimation | Degrees of Freedom | p-Value |
|---|---|---|---|
| 1992 | 5636.9 | 4 | 0.000 |
| 1994 | 6930.8 | 4 | 0.000 |
| 1996 | 7201 | 4 | 0.000 |
| 1998 | 5643.5 | 4 | 0.000 |
| 2000 | 5096.1 | 4 | 0.000 |
| 2002 | 8762.1 | 4 | 0.000 |
| 2004 | 11,632.8 | 4 | 0.000 |
| 2005 | 11,904.1 | 4 | 0.000 |
| 2006 | 10,473.1 | 4 | 0.000 |
| 2008 | 13,641.6 | 4 | 0.000 |
| 2010 | 12,685 | 4 | 0.000 |
| 2012 | 4077.5 | 4 | 0.000 |
| 2014 | 7301.8 | 4 | 0.000 |
Source: Authors’ calculations, ENIGH (1992–2014).
Table A3.
Results of Kruskal-Wallis equality-of-populations rank test for electricity consumption and consumer practices latent classes.
Table A3.
Results of Kruskal-Wallis equality-of-populations rank test for electricity consumption and consumer practices latent classes.
| Year | Chi2 Estimation | Degrees of Freedom | p-Value |
|---|---|---|---|
| 1992 | 2836.1 | 4 | 0.000 |
| 1994 | 3416.4 | 4 | 0.000 |
| 1996 | 3995.3 | 4 | 0.000 |
| 1998 | 2514.1 | 4 | 0.000 |
| 2000 | 2023.5 | 4 | 0.000 |
| 2002 | 3863.9 | 4 | 0.000 |
| 2004 | 4514.9 | 4 | 0.000 |
| 2005 | 4967.3 | 4 | 0.000 |
| 2006 | 3623.4 | 4 | 0.000 |
| 2008 | 3818.9 | 4 | 0.000 |
| 2010 | 3617.9 | 4 | 0.000 |
| 2012 | 1170 | 4 | 0.000 |
| 2014 | 2057.8 | 4 | 0.000 |
Source: Authors’ calculations, ENIGH (1992–2014).
Table A4.
Conditional probabilities for consumer practices latent class membership. Mexico, 1992–2014.
Table A4.
Conditional probabilities for consumer practices latent class membership. Mexico, 1992–2014.
| High | Medium High | Medium | Low | Minimum | Total | |
|---|---|---|---|---|---|---|
| Total probabilities | 0.08 | 0.27 | 0.37 | 0.21 | 0.07 | 1.00 |
| Indicator | - | |||||
| Appliance index | - | |||||
| 0–0.900 | 0.00 | 0.00 | 0.09 | 0.59 | 0.32 | 1.00 |
| 1–1.400 | 0.00 | 0.05 | 0.57 | 0.38 | - | 1.00 |
| 1.500–1.800 | 0.01 | 0.18 | 0.75 | 0.06 | - | 1.00 |
| 1.900–2.400 | 0.03 | 0.47 | 0.49 | 0.00 | - | 1.00 |
| 2.500–22.70 | 0.34 | 0.61 | 0.05 | - | - | 1.00 |
| Covariates | - | |||||
| Logarithm of current income | - | |||||
| Quintile 1 | 0.00 | 0.03 | 0.28 | 0.45 | 0.24 | 1.00 |
| Quintile 2 | 0.01 | 0.14 | 0.51 | 0.29 | 0.06 | 1.00 |
| Quintile 3 | 0.03 | 0.28 | 0.50 | 0.16 | 0.03 | 1.00 |
| Quintile 4 | 0.08 | 0.43 | 0.38 | 0.10 | 0.02 | 1.00 |
| Quintile 5 | 0.28 | 0.46 | 0.20 | 0.05 | 0.01 | 1.00 |
| Flooring construction materials | - | |||||
| Bare earth | 0.00 | 0.01 | 0.13 | 0.43 | 0.43 | 1.00 |
| Cement or firm | 0.02 | 0.17 | 0.48 | 0.29 | 0.05 | 1.00 |
| Wood, tile or other coverings | 0.19 | 0.48 | 0.29 | 0.04 | 0.01 | 1.00 |
| Rooms | - | |||||
| 1 | 0.00 | 0.03 | 0.31 | 0.44 | 0.22 | 1.00 |
| 2 | 0.01 | 0.15 | 0.46 | 0.30 | 0.08 | 1.00 |
| 3 | 0.04 | 0.34 | 0.46 | 0.14 | 0.02 | 1.00 |
| 4 | 0.12 | 0.47 | 0.34 | 0.06 | 0.01 | 1.00 |
| 5+ | 0.35 | 0.45 | 0.17 | 0.02 | 0.00 | 1.00 |
| Type of household | - | |||||
| Single household unit | 0.02 | 0.13 | 0.35 | 0.34 | 0.16 | 1.00 |
| Households without a family core | 0.21 | 0.00 | 0.67 | - | 0.12 | 1.00 |
| Couples without kids | 0.05 | 0.24 | 0.41 | 0.22 | 0.09 | 1.00 |
| Couples with kids | 0.09 | 0.28 | 0.37 | 0.20 | 0.06 | 1.00 |
| Single parent households with kids | 0.07 | 0.26 | 0.40 | 0.21 | 0.05 | 1.00 |
| Extended households | 0.09 | 0.30 | 0.38 | 0.18 | 0.05 | 1.00 |
| Composed households | 0.09 | 0.59 | - | 0.32 | - | 1.00 |
| Age | - | |||||
| 12–22 | 0.03 | 0.20 | 0.41 | 0.28 | 0.08 | 1.00 |
| 23–30 | 0.07 | 0.29 | 0.38 | 0.20 | 0.06 | 1.00 |
| 31–38 | 0.11 | 0.31 | 0.36 | 0.17 | 0.05 | 1.00 |
| 39–50 | 0.11 | 0.30 | 0.35 | 0.18 | 0.06 | 1.00 |
| 51–86 | 0.07 | 0.24 | 0.37 | 0.22 | 0.10 | 1.00 |
| Education of the HH head | - | |||||
| No education | 0.01 | 0.07 | 0.28 | 0.39 | 0.25 | 1.00 |
| Primary education | 0.03 | 0.19 | 0.42 | 0.28 | 0.08 | 1.00 |
| Some secondary education | 0.05 | 0.30 | 0.47 | 0.16 | 0.02 | 1.00 |
| Higher education | 0.22 | 0.46 | 0.27 | 0.04 | 0.00 | 1.00 |
| Sex of the HH head | - | |||||
| Male | 0.08 | 0.27 | 0.36 | 0.21 | 0.07 | 1.00 |
| Female | 0.07 | 0.26 | 0.41 | 0.21 | 0.05 | 1.00 |
| Location | - | |||||
| Urban | 0.1045 | 0.3365 | 0.395 | 0.1466 | 0.0174 | 1.00 |
| Rural | 0.0127 | 0.0934 | 0.3238 | 0.3712 | 0.1988 | 1.00 |
| HH size | - | |||||
| 1–2 | 0.05 | 0.21 | 0.39 | 0.25 | 0.11 | 1.00 |
| 3 | 0.08 | 0.30 | 0.39 | 0.18 | 0.05 | 1.00 |
| 4 | 0.10 | 0.32 | 0.38 | 0.17 | 0.04 | 1.00 |
| 5 | 0.10 | 0.29 | 0.38 | 0.18 | 0.05 | 1.00 |
| 6+ | 0.07 | 0.23 | 0.34 | 0.26 | 0.10 | 1.00 |
| Having remittances | - | |||||
| No | 0.08 | 0.27 | 0.37 | 0.21 | 0.07 | 1.00 |
| Yes | 0.04 | 0.24 | 0.47 | 0.21 | 0.03 | 1.00 |
| Region | - | |||||
| Northwest | 0.11 | 0.34 | 0.38 | 0.14 | 0.03 | 1.00 |
| Central | 0.07 | 0.26 | 0.39 | 0.23 | 0.05 | 1.00 |
| Northeast | 0.10 | 0.32 | 0.39 | 0.15 | 0.05 | 1.00 |
| Central-west | 0.08 | 0.28 | 0.39 | 0.20 | 0.05 | 1.00 |
| South-Southeast | 0.06 | 0.21 | 0.33 | 0.26 | 0.13 | 1.00 |
| Year | ||||||
| 1992 | 0.0462 | 0.1895 | 0.3342 | 0.2999 | 0.1301 | 1.00 |
| 1994 | 0.0565 | 0.2121 | 0.3334 | 0.282 | 0.116 | 1.00 |
| 1996 | 0.045 | 0.2061 | 0.3624 | 0.2831 | 0.1033 | 1.00 |
| 1998 | 0.0547 | 0.2261 | 0.3642 | 0.2521 | 0.1029 | 1.00 |
| 2000 | 0.0655 | 0.2431 | 0.3779 | 0.2378 | 0.0756 | 1.00 |
| 2002 | 0.0632 | 0.2509 | 0.3813 | 0.2134 | 0.0911 | 1.00 |
| 2004 | 0.1042 | 0.3098 | 0.3588 | 0.1628 | 0.0644 | 1.00 |
| 2005 | 0.0957 | 0.294 | 0.3559 | 0.188 | 0.0664 | 1.00 |
| 2006 | 0.1016 | 0.3036 | 0.3588 | 0.1781 | 0.0579 | 1.00 |
| 2008 | 0.105 | 0.2985 | 0.3793 | 0.1754 | 0.0418 | 1.00 |
| 2010 | 0.0804 | 0.2787 | 0.3933 | 0.2002 | 0.0474 | 1.00 |
| 2012 | 0.0686 | 0.2542 | 0.3966 | 0.2228 | 0.0578 | 1.00 |
| 2014 | 0.0548 | 0.2656 | 0.445 | 0.1996 | 0.035 | 1.00 |
Source: authors’ calculations, ENIGH (1992–2014).
Table A5.
Profiles of consumer practices latent classes. Mexico 1992–2014.
| High | Medium High | Medium | Low | Minimum | |
|---|---|---|---|---|---|
| Cluster Size | 0.08 | 0.27 | 0.37 | 0.21 | 0.07 |
| Indicator | |||||
| Appliance index | |||||
| Mean | 3.64 | 2.42 | 1.64 | 0.87 | 0.18 |
| Covariates | |||||
| Logarithm of current income | |||||
| Quintile 1 | 0.00 | 0.03 | 0.15 | 0.43 | 0.68 |
| Quintile 2 | 0.02 | 0.10 | 0.27 | 0.27 | 0.16 |
| Quintile 3 | 0.06 | 0.21 | 0.27 | 0.15 | 0.08 |
| Quintile 4 | 0.20 | 0.32 | 0.20 | 0.09 | 0.05 |
| Quintile 5 | 0.71 | 0.34 | 0.11 | 0.05 | 0.02 |
| Total | 1.00 | 1.00 | 1.00 | 1.00 | 1.00 |
| Mean | 9.97 | 9.29 | 8.69 | 8.17 | 7.69 |
| Flooring construction materials | |||||
| Bare earth | 0.00 | 0.00 | 0.03 | 0.19 | 0.59 |
| Cement or firm | 0.12 | 0.34 | 0.68 | 0.73 | 0.38 |
| Wood, tile or other coverings | 0.88 | 0.66 | 0.29 | 0.08 | 0.03 |
| Total | 1.00 | 1.00 | 1.00 | 1.00 | 1.00 |
| Rooms | |||||
| 1 | 0.00 | 0.03 | 0.16 | 0.40 | 0.62 |
| 2 | 0.03 | 0.14 | 0.31 | 0.36 | 0.28 |
| 3 | 0.14 | 0.33 | 0.32 | 0.17 | 0.07 |
| 4 | 0.25 | 0.29 | 0.15 | 0.05 | 0.02 |
| 5+ | 0.57 | 0.22 | 0.06 | 0.01 | 0.00 |
| Total | 1.00 | 1.00 | 1.00 | 1.00 | 1.00 |
| Mean | 5.07 | 3.67 | 2.67 | 1.92 | 1.50 |
| Type of household | |||||
| Single household unit | 0.02 | 0.04 | 0.08 | 0.13 | 0.19 |
| Households without a family core | 0.01 | - | 0.01 | - | 0.01 |
| Couples without kids | 0.06 | 0.08 | 0.09 | 0.09 | 0.11 |
| Couples + kids | 0.55 | 0.51 | 0.48 | 0.46 | 0.43 |
| Single parent households + kids | 0.08 | 0.10 | 0.11 | 0.10 | 0.07 |
| Extended households | 0.27 | 0.26 | 0.24 | 0.21 | 0.19 |
| Composed households | 0.01 | 0.01 | - | 0.01 | - |
| Total | 1.00 | 1.00 | 1.00 | 1.00 | 1.00 |
| Age of the HH head | |||||
| 12–22 | 0.08 | 0.16 | 0.23 | 0.27 | 0.23 |
| 23–30 | 0.19 | 0.21 | 0.20 | 0.19 | 0.16 |
| 31–38 | 0.26 | 0.22 | 0.18 | 0.15 | 0.13 |
| 39–50 | 0.29 | 0.23 | 0.20 | 0.18 | 0.19 |
| 51–86 | 0.18 | 0.18 | 0.19 | 0.21 | 0.29 |
| Total | 1.00 | 1.00 | 1.00 | 1.00 | 1.00 |
| Mean | 50.07 | 47.78 | 46.59 | 46.18 | 49.87 |
| Education of the HH head | |||||
| No education | 0.01 | 0.03 | 0.10 | 0.24 | 0.45 |
| Elmentary education | 0.13 | 0.30 | 0.47 | 0.56 | 0.48 |
| Some secondary education | 0.12 | 0.22 | 0.25 | 0.15 | 0.05 |
| Tertiary | 0.73 | 0.45 | 0.19 | 0.05 | 0.02 |
| Total | 1.00 | 1.00 | 1.00 | 1.00 | 1.00 |
| Sex of the HH head | |||||
| Male | 0.82 | 0.78 | 0.76 | 0.79 | 0.83 |
| Female | 0.18 | 0.22 | 0.24 | 0.21 | 0.17 |
| Total | 1.00 | 1.00 | 1.00 | 1.00 | 1.00 |
| Location | |||||
| Urban | 0.95 | 0.90 | 0.76 | 0.50 | 0.18 |
| Rural | 0.05 | 0.10 | 0.25 | 0.50 | 0.82 |
| Total | 1.00 | 1.00 | 1.00 | 1.00 | 1.00 |
| HH size | |||||
| 1–2 | 0.14 | 0.18 | 0.23 | 0.27 | 0.35 |
| 3 | 0.18 | 0.20 | 0.18 | 0.15 | 0.11 |
| 4 | 0.28 | 0.26 | 0.22 | 0.17 | 0.12 |
| 5 | 0.22 | 0.19 | 0.17 | 0.15 | 0.12 |
| 6+ | 0.19 | 0.18 | 0.19 | 0.26 | 0.29 |
| Total | 1.00 | 1.00 | 1.00 | 1.00 | 1.00 |
| Mean | 4.34 | 4.16 | 4.03 | 4.20 | 4.15 |
| Having remittances | |||||
| No | 0.97 | 0.95 | 0.93 | 0.95 | 0.97 |
| Yes | 0.03 | 0.05 | 0.07 | 0.05 | 0.03 |
| Total | 1.00 | 1.00 | 1.00 | 1.00 | 1.00 |
| Region | |||||
| Northwest | 0.14 | 0.13 | 0.10 | 0.07 | 0.04 |
| Central | 0.23 | 0.24 | 0.26 | 0.26 | 0.19 |
| Northeast | 0.18 | 0.17 | 0.15 | 0.10 | 0.10 |
| Central-west | 0.24 | 0.25 | 0.25 | 0.23 | 0.18 |
| South-Southeast | 0.21 | 0.21 | 0.24 | 0.34 | 0.49 |
| Total | 1.00 | 1.00 | 1.00 | 1.00 | 1.00 |
| Year | |||||
| 1992 | 0.03 | 0.03 | 0.04 | 0.07 | 0.09 |
| 1994 | 0.04 | 0.04 | 0.05 | 0.08 | 0.10 |
| 1996 | 0.04 | 0.05 | 0.06 | 0.08 | 0.09 |
| 1998 | 0.03 | 0.04 | 0.05 | 0.06 | 0.07 |
| 2000 | 0.04 | 0.04 | 0.04 | 0.05 | 0.05 |
| 2002 | 0.06 | 0.07 | 0.08 | 0.08 | 0.10 |
| 2004 | 0.13 | 0.11 | 0.10 | 0.08 | 0.09 |
| 2005 | 0.12 | 0.11 | 0.10 | 0.09 | 0.10 |
| 2006 | 0.12 | 0.10 | 0.09 | 0.08 | 0.08 |
| 2008 | 0.17 | 0.14 | 0.13 | 0.11 | 0.08 |
| 2010 | 0.12 | 0.13 | 0.13 | 0.12 | 0.08 |
| 2012 | 0.04 | 0.04 | 0.04 | 0.04 | 0.03 |
| 2014 | 0.06 | 0.09 | 0.10 | 0.08 | 0.04 |
| Total | 1.00 | 1.00 | 1.00 | 1.00 | 1.00 |
Source: Authors’ calculations, ENIGH (1992–2014).
Table A6.
Sociodemographic characteristics for consumer practices latent classes. México 1992 and 2014.
Table A6.
Sociodemographic characteristics for consumer practices latent classes. México 1992 and 2014.
| High | Medium-High | Medium | Low | Minimum | Total | |
|---|---|---|---|---|---|---|
| Education level | ||||||
| 1992 | ||||||
| No education | 1.38 | 5.00 | 12.78 | 33.30 | 58.15 | 17.90 |
| Elementary | 12.54 | 35.78 | 56.82 | 59.44 | 39.95 | 48.36 |
| Secondary | 10.39 | 19.88 | 21.19 | 6.09 | 1.82 | 15.60 |
| Tertiary | 75.69 | 39.34 | 9.21 | 1.16 | 0.09 | 18.14 |
| Total | 100.00 | 100.00 | 100.00 | 100.00 | 100.00 | 100.00 |
| 2014 | ||||||
| No education | 0.56 | 1.46 | 6.10 | 23.71 | 57.64 | 7.96 |
| Elementary | 4.06 | 18.24 | 40.35 | 54.24 | 37.68 | 33.76 |
| Secondary | 6.19 | 21.48 | 31.31 | 16.85 | 3.13 | 24.30 |
| Tertiary | 89.19 | 58.82 | 22.23 | 5.19 | 1.55 | 33.98 |
| Total | 100.00 | 100.00 | 100.00 | 100.00 | 100.00 | 100.00 |
| Sex of the head | ||||||
| 1992 | ||||||
| Male | 89.21 | 85.14 | 84.57 | 86.77 | 88.56 | 85.75 |
| Female | 10.79 | 14.86 | 15.43 | 13.23 | 11.44 | 14.25 |
| Total | 100.00 | 100.00 | 100.00 | 100.00 | 100.00 | 100.00 |
| 2014 | ||||||
| Male | 80.42 | 75.77 | 72.98 | 72.78 | 80.17 | 74.31 |
| Female | 19.58 | 24.23 | 27.02 | 27.22 | 19.83 | 25.69 |
| Total | 100.00 | 100.00 | 100.00 | 100.00 | 100.00 | 100.00 |
| Location of the residence | ||||||
| 1992 | ||||||
| Urban | 99.34 | 96.67 | 86.47 | 53.33 | 2.62 | 76.51 |
| Rural | 0.66 | 3.33 | 13.53 | 46.67 | 97.38 | 23.49 |
| Total | 100.00 | 100.00 | 100.00 | 100.00 | 100.00 | 100.00 |
| 2014 | ||||||
| Urban | 97.91 | 94.81 | 79.18 | 41.80 | 6.93 | 78.00 |
| Rural | 2.09 | 5.19 | 20.82 | 58.20 | 93.07 | 22.00 |
| Total | 100.00 | 100.00 | 100.00 | 100.00 | 100.00 | 100.00 |
| Age | ||||||
| 1992 | 47.51 | 45.39 | 43.20 | 42.73 | 46.85 | 44.16 |
| 2014 | 53.26 | 49.42 | 47.93 | 48.06 | 57.04 | 48.83 |
| Household size | ||||||
| 1992 | 5.01 | 4.69 | 4.50 | 4.96 | 4.87 | 4.70 |
| 2014 | 4.02 | 3.97 | 3.75 | 3.50 | 3.20 | 3.79 |
Source: Authors’s calculations, ENIGH (1992–2014). Weighted data.
Table A7.
Sociodemographic characteristics by income quintiles. México 1992 and 2014.
| Quintile 1 | Quintile 2 | Quintile 3 | Quintile 4 | Quintile 5 | Total | |
|---|---|---|---|---|---|---|
| Education level | ||||||
| 1992 | ||||||
| No education | 35.50 | 22.39 | 18.22 | 14.11 | 6.65 | 17.91 |
| Elementary | 58.80 | 60.28 | 53.98 | 48.87 | 27.43 | 48.22 |
| Secondary | 5.00 | 12.94 | 19.11 | 19.43 | 18.74 | 15.78 |
| Tertiary | 0.70 | 4.39 | 8.69 | 17.59 | 47.18 | 18.09 |
| Total | 100.00 | 100.00 | 100.00 | 100.00 | 100.00 | 100.00 |
| 2014 | ||||||
| No education | 14.70 | 9.78 | 7.77 | 5.89 | 2.08 | 7.96 |
| Elementary | 49.12 | 41.55 | 36.38 | 29.26 | 13.90 | 33.76 |
| Secondary | 26.38 | 29.30 | 28.62 | 24.09 | 13.83 | 24.30 |
| Tertiary | 9.81 | 19.37 | 27.24 | 40.75 | 70.20 | 33.98 |
| Total | 100.00 | 100.00 | 100.00 | 100.00 | 100.00 | 100.00 |
| Sex of the head | ||||||
| 1992 | ||||||
| Male | 92.51 | 89.61 | 86.30 | 83.49 | 80.33 | 85.78 |
| Female | 7.49 | 10.39 | 13.70 | 16.51 | 19.67 | 14.22 |
| Total | 100.00 | 100.00 | 100.00 | 100.00 | 100.00 | 100.00 |
| 2014 | ||||||
| Male | 77.64 | 76.90 | 74.91 | 71.74 | 70.62 | 74.31 |
| Female | 22.36 | 23.10 | 25.09 | 28.26 | 29.38 | 25.69 |
| Total | 100.00 | 100.00 | 100.00 | 100.00 | 100.00 | 100.00 |
| Location of the residence | ||||||
| 1992 | ||||||
| Urban | 37.71 | 68.94 | 81.10 | 86.35 | 94.25 | 76.55 |
| Rural | 62.29 | 31.06 | 18.90 | 13.65 | 5.75 | 23.45 |
| Total | 100.00 | 100.00 | 100.00 | 100.00 | 100.00 | 100.00 |
| 2014 | ||||||
| Urban | 53.73 | 73.78 | 80.71 | 87.63 | 93.12 | 78.01 |
| Rural | 46.27 | 26.22 | 19.29 | 12.37 | 6.88 | 21.99 |
| Total | 100.00 | 100.00 | 100.00 | 100.00 | 100.00 | 100.00 |
| Age | ||||||
| 1992 | 42.81 | 43.16 | 43.95 | 44.63 | 44.73 | 43.97 |
| 2014 | 45.88 | 47.91 | 49.05 | 50.50 | 50.69 | 48.83 |
| Household size | ||||||
| 1992 | 6.39 | 5.47 | 4.84 | 4.11 | 3.43 | 4.70 |
| 2014 | 4.99 | 4.28 | 3.85 | 3.28 | 2.61 | 3.79 |
Source: own calculations, ENIGH (1992–2014). Weighted data.
References
- Akenji, Lewis, and Magnus Bengtsson. 2014. Making Sustainable Consumption and Production the Core of Sustainable Development Goals. Sustainability 6: 513–29. [Google Scholar] [CrossRef]
- Alberini, Anna, Will Gans, and Daniel Velez-Lopez. 2011. Residential consumption of gas and electricity in the U.S.: The role of prices and income. Energy Economics 33: 870–81. [Google Scholar] [CrossRef]
- Banxico. 2016. Estadísticas [WWW Document]. Available online: http://www.banxico.org.mx/estadisticas/index.html (accessed on 5 March 2016).
- Barber, Jeffrey. 2003. Production, Consumption and the World Summit on Sustainable Development. Environment, Development and Sustainability 5: 63–93. [Google Scholar] [CrossRef]
- Belaïd, Fateh. 2016. Understanding the spectrum of domestic energy consumption: Empirical evidence from France. Energy Policy 92: 220–33. [Google Scholar] [CrossRef]
- Bizikova, Livia, László Pintér, Gabriel A. Huppé, Heinz Schandl, Charles Arden-Clarke, Sandra Averous, Alice Mansion, and Clementine O’Connor. 2015. Sustainable Consumption and Production Indicators for the Future SDGs. UNEP Discussion Paper. Paris: United Nations Environment Programme. [Google Scholar]
- Blázquez, Leticia, Nina Boogen, and Massimo Filippini. 2013. Residential electricity demand in Spain: New empirical evidence using aggregate data. Energy Economics 36: 648–57. [Google Scholar] [CrossRef]
- Boogen, Nina, Souvik Datta, and Massimo Filippini. 2014. Going beyond Tradition: Estimating Residential Electricity Demand Using an Appliance Index and Energy Services. SSRN Scholarly Paper No. ID 2466015. Rochester: Social Science Research Network. [Google Scholar]
- Campos-Vázquez, Raymundo, Gerardo Esquivel, and Nora Lustig. 2014. The Rise and Fall of Income Inequality in Mexico, 1989–2010. In Falling Inequality in Latin America: Policy Changes and Lessons. Edited by Giovanni Andrea Cornia. Oxford: Oxford University Press, pp. 140–63. [Google Scholar]
- Cayla, Jean-Michel, Nadia Maizi, and Christophe Marchand. 2011. The role of income in energy consumption behaviour: Evidence from French households data. Energy Policy 39: 7874–83. [Google Scholar] [CrossRef]
- CEPAL. 2016. CEPALSTAT: Estadísticas e Indicadores Demográficos y Sociales. América Latina [WWW Document]. Available online: http://websie.eclac.cl/infest/ajax/cepalstat.asp?carpeta=estadisticas (accessed on 4 April 2016).
- Coneval. 2014. Evolución de la Población en Pobreza en Materia de Ingresos, 1992–2014 [WWW Document]. Available online: http://www.coneval.org.mx/Medicion/EDP/PublishingImages/Evolucion_ingresos/EVOL_POBREZA_INGRESOS_92-14_gr.jpg (accessed on 9 June 2016).
- Dergiades, Theologos, and Lefteris Tsoulfidis. 2008. Estimating residential demand for electricity in the United States, 1965–2006. Energy Economics 30: 2722–30. [Google Scholar] [CrossRef]
- Dergiades, Theologos, and Lefteris Tsoulfidis. 2011. Revisiting residential demand for electricity in Greece: New evidence from the ARDL approach to cointegration analysis. Empirical Economics 41: 511–31. [Google Scholar] [CrossRef]
- EIA. 2017. International Energy Outlook 2017; Washington: International U.S. Energy Information Administration, September 14. Available online: https://www.eia.gov/outlooks/ieo/ (accessed on 23 November 2017).
- Esquivel, Gerardo. 2011. The dynamics of income inequality in Mexico since NAFTA. Economia 12: 155–79. [Google Scholar] [CrossRef]
- Fischer, Corinna. 2008. Feedback on household electricity consumption: A tool for saving energy? Energy Efficiency 1: 79–104. [Google Scholar] [CrossRef]
- Fisher, Franklin M., and Carl Keysen. 1962. A Study in Econometrics: The Demand for Electricity in the United States. Amsterdam: North-Holland Pub. Co. [Google Scholar]
- Greening, Lorna A., and Hann Tarn Jeng. 1994. Lifecycle analysis of gasoline expenditure patterns. Energy Economics 16: 217–28. [Google Scholar] [CrossRef]
- Greening, Lorna A., David L. Greene, and Carmen Difiglio. 2000. Energy efficiency and consumption—The rebound effect—A survey. Energy Policy 28: 389–401. [Google Scholar] [CrossRef]
- IEA. 2015. World Energy Outlook 2015. Paris: OECD. [Google Scholar]
- IEA. 2016. Mexico Energy Outlook. Paris: OECD. [Google Scholar]
- Jensen, Jesper Ole. 2008. Measuring consumption in households: Interpretations and strategies. Ecological Economics 68: 353–61. [Google Scholar] [CrossRef]
- Jones, Rory V., Alba Fuertes, and Kevin J. Lomas. 2015. The socio-economic, dwelling and appliance related factors affecting electricity consumption in domestic buildings. Renewable and Sustainable Energy Reviews 43: 901–17. [Google Scholar] [CrossRef] [Green Version]
- Kavgic, Miroslava, Anna Mavrogianni, Dejan Mumovic, Alex Summerfield, Zarko Stevanovic, and Maja Djurovic-Petrovic. 2010. A review of bottom-up building stock models for energy consumption in the residential sector. Building and Environment 45: 1683–97. [Google Scholar] [CrossRef]
- Lenzen, Manfred, Mette Wier, Claude Cohen, Hitoshi Hayami, Shonali Pachauri, and Roberto Schaeffer. 2006. A comparative multivariate analysis of household energy requirements in Australia, Brazil, Denmark, India and Japan. Energy 31: 181–207. [Google Scholar] [CrossRef]
- Lévy, Jean-Pierre, and Fateh Belaïd. 2017. The determinants of domestic energy consumption in France: Energy modes, habitat, households and life cycles. Renewable and Sustainable Energy Reviews. [Google Scholar] [CrossRef]
- López-Calva, Luis F., and Nora Lustig, eds. 2011. La Disminución de la Desigualdad en América Latina. Mexico: Fondo De Cultura Economica. [Google Scholar]
- Oberski, Daniel. 2016. Mixture models: Latent profile and latent class analysis. In Modern Statistical Methods for HCI. Edited by Judy Robertson and Maurits Kaptein. Berlin: Springer. [Google Scholar]
- Pachauri, Shonali. 2004. An analysis of cross-sectional variations in total household energy requirements in India using micro survey data. Energy Policy 32: 1723–35. [Google Scholar] [CrossRef]
- Parametria. 2006. Las Fronteras del Consumo a Crédito entre los Mexicanos. Mexico City: El Excélsior. [Google Scholar]
- Prskawetz, Alexia, Jiang Leiwen, and Brain C. O’Neill. 2004. Demographic composition and projections of car use in Austria. Vienna Yearbook of Population Research 2: 175–201. [Google Scholar] [CrossRef]
- Pucher, John, Tim Evans, and Jeff Wenger. 1998. Socioeconomics of urban travel: Evidence from the 1995 NPTS. Transportation Quarterly 52: 15–33. [Google Scholar]
- Reyna, Cecilia, and Silvina Brussino. 2011. Revisión de los fundamentos del análisis de clases latentes y ejemplo de aplicación en el área de las adicciones. Trastornos Adictivos 13: 11–19. [Google Scholar] [CrossRef]
- Røpke, Inge. 2006. Consumption and Environment—Ecological Economic Perspectives. Lyngby: University of Roskilde, Department of Manufacturing Engineering and Management, Technical University of Denmark. [Google Scholar]
- Sánchez Peña, Landy. 2012. Hogares y Consumo Energético en México. Mexico City: Revista Digital Universitaria, vol. 13, pp. 1–8. [Google Scholar]
- Sánchez Peña, Landy. 2016. Ingresos y consumo energético de los hogares en el Distrito Federal. In La Ciudad de México En El Siglo XXI. Edited by M. Adrián Guillermo Aguilar. Mexico City: SECITI—Miguel Ángel de Porrúa. [Google Scholar]
- Secretariat of Energy (SENER). 2016. Energy Information System [WWW Document]. Available online: http://sie.energia.gob.mx/ (accessed on 4 April 2016).
- Sovacool, Benjamin K. 2011. Conceptualizing urban household energy use: Climbing the “Energy Services Ladder”. Energy Policy 39: 1659–68. [Google Scholar] [CrossRef]
- Spaargaren, Gert. 2003. Sustainable Consumption: A Theoretical and Environmental Policy Perspective. Society & Natural Resources 16: 687–701. [Google Scholar]
- Stephenson, Janet, Barry Barton, Gerry Carrington, Daniel Gnoth, Rob Lawson, and Paul Thorsnes. 2010. Energy cultures: A framework for understanding energy behaviours. Energy Policy 38: 6120–29. [Google Scholar] [CrossRef] [Green Version]
- Swan, Lukas G., and V. Ismet Ugursal. 2009. Modeling of end-use energy consumption in the residential sector: A review of modeling techniques. Renewable and Sustainable Energy Reviews 13: 1819–35. [Google Scholar] [CrossRef]
- Tiwari, Piyush. 2000. Architectural, Demographic, and Economic Causes of Electricity Consumption in Bombay. Journal of Policy Modeling 22: 81–98. [Google Scholar] [CrossRef]
- UNEP. 2010. ABC of SCP: Clarifying Concepts on Sustainable Consumption and Production. Saint-Martin-Bellevue: United Nations Environment Programme. [Google Scholar]
- Van den Bergh, Jeroen C. J. M. 2008. Environmental regulation of households: An empirical review of economic and psychological factors. Ecological Economics 66: 559–74. [Google Scholar] [CrossRef]
- Warde, Alan. 2015. The Sociology of Consumption: Its Recent Development. Annual Review of Sociology 41: 117–34. [Google Scholar] [CrossRef]
- Wolfram, Catherine, Orie Shelef, and Paul J. Gertler. 2012. How Will Energy Demand Develop in the Developing World? The Journal of Economic Perspectives 26: 119–38. [Google Scholar] [CrossRef]
- Yao, Runming, and Koen Steemers. 2005. A method of formulating energy load profile for domestic buildings in the UK. Energy and Buildings 37: 663–71. [Google Scholar] [CrossRef]
- Yust, Becky L., Denise A. Guerin, and Julie G. Coopet. 2002. Residential Energy Consumption: 1987 to 1997. Family and Consumer Sciences Research Journal 30: 323–49. [Google Scholar] [CrossRef]
- Zhou, Shaojie, and Fei Teng. 2013. Estimation of urban residential electricity demand in China using household survey data. Energy Policy 61: 394–402. [Google Scholar] [CrossRef]
| 1 | For example, in 2015, total energy consumption in México was of 5094.74 petajoules, and domestic accounted for nearly 15% of it. Electricity consumption was about 895.6 petajoules in the same year, and residential participation consumption was 22.3%. |
| 2 | The air conditioner was not included in the “cold” appliances categories because the survey collected information about it inconsistently over time. This is a shortcoming of the index given air conditioner high demand for electricity; however, only fourteen percent of Mexican households report having owned an air conditioner in 2014. |
| 3 | This index is a proxy variable that weighs the categories or classes of apparatuses that demand greater consumption by their physical qualities and end-uses. In the case of Mexico, we assumed equality between the weights of categories of high consumption, “cold” and “wet”, and we assigned same weight to “miscellaneous” and “brown”, as the following equation shows: . |
| 4 | Also, we adjusted thirteen individual models, one for each year. The results of these individual models were similar to pooled model discussed here. Both results suggest the same number of classes and have an analogous class membership probability. We used the pooled estimations to portray the changes across time in a single model. |
| 5 | As we pointed out before, there was a change in energy data collection since 2010, in which the survey has collected information from the electricity bill instead of expense declaration. The estimations of latent profiles become useful, not only for estimating consumer practices, but also for addressing these kinds of methodological changes in studying energy consumption. |
Figure 1.
Gross domestic product (GDP) per capita (2010 millions of dollars), Gini coefficient, and proportion of poor households. Mexico, 1992–2012. Source: GDP per capita (CEPAL 2016). Gini and poverty author´s calculations, with data from Income and Expenditure Household Survey (ENIGH), National Institute of Statistics and Geography (INEGI, 1992–2012). We used poverty lines defined using National Council for the Evaluation of Social Development Policy (CONEVAL) welfare baskets. We used per capita total income scaled by household members.
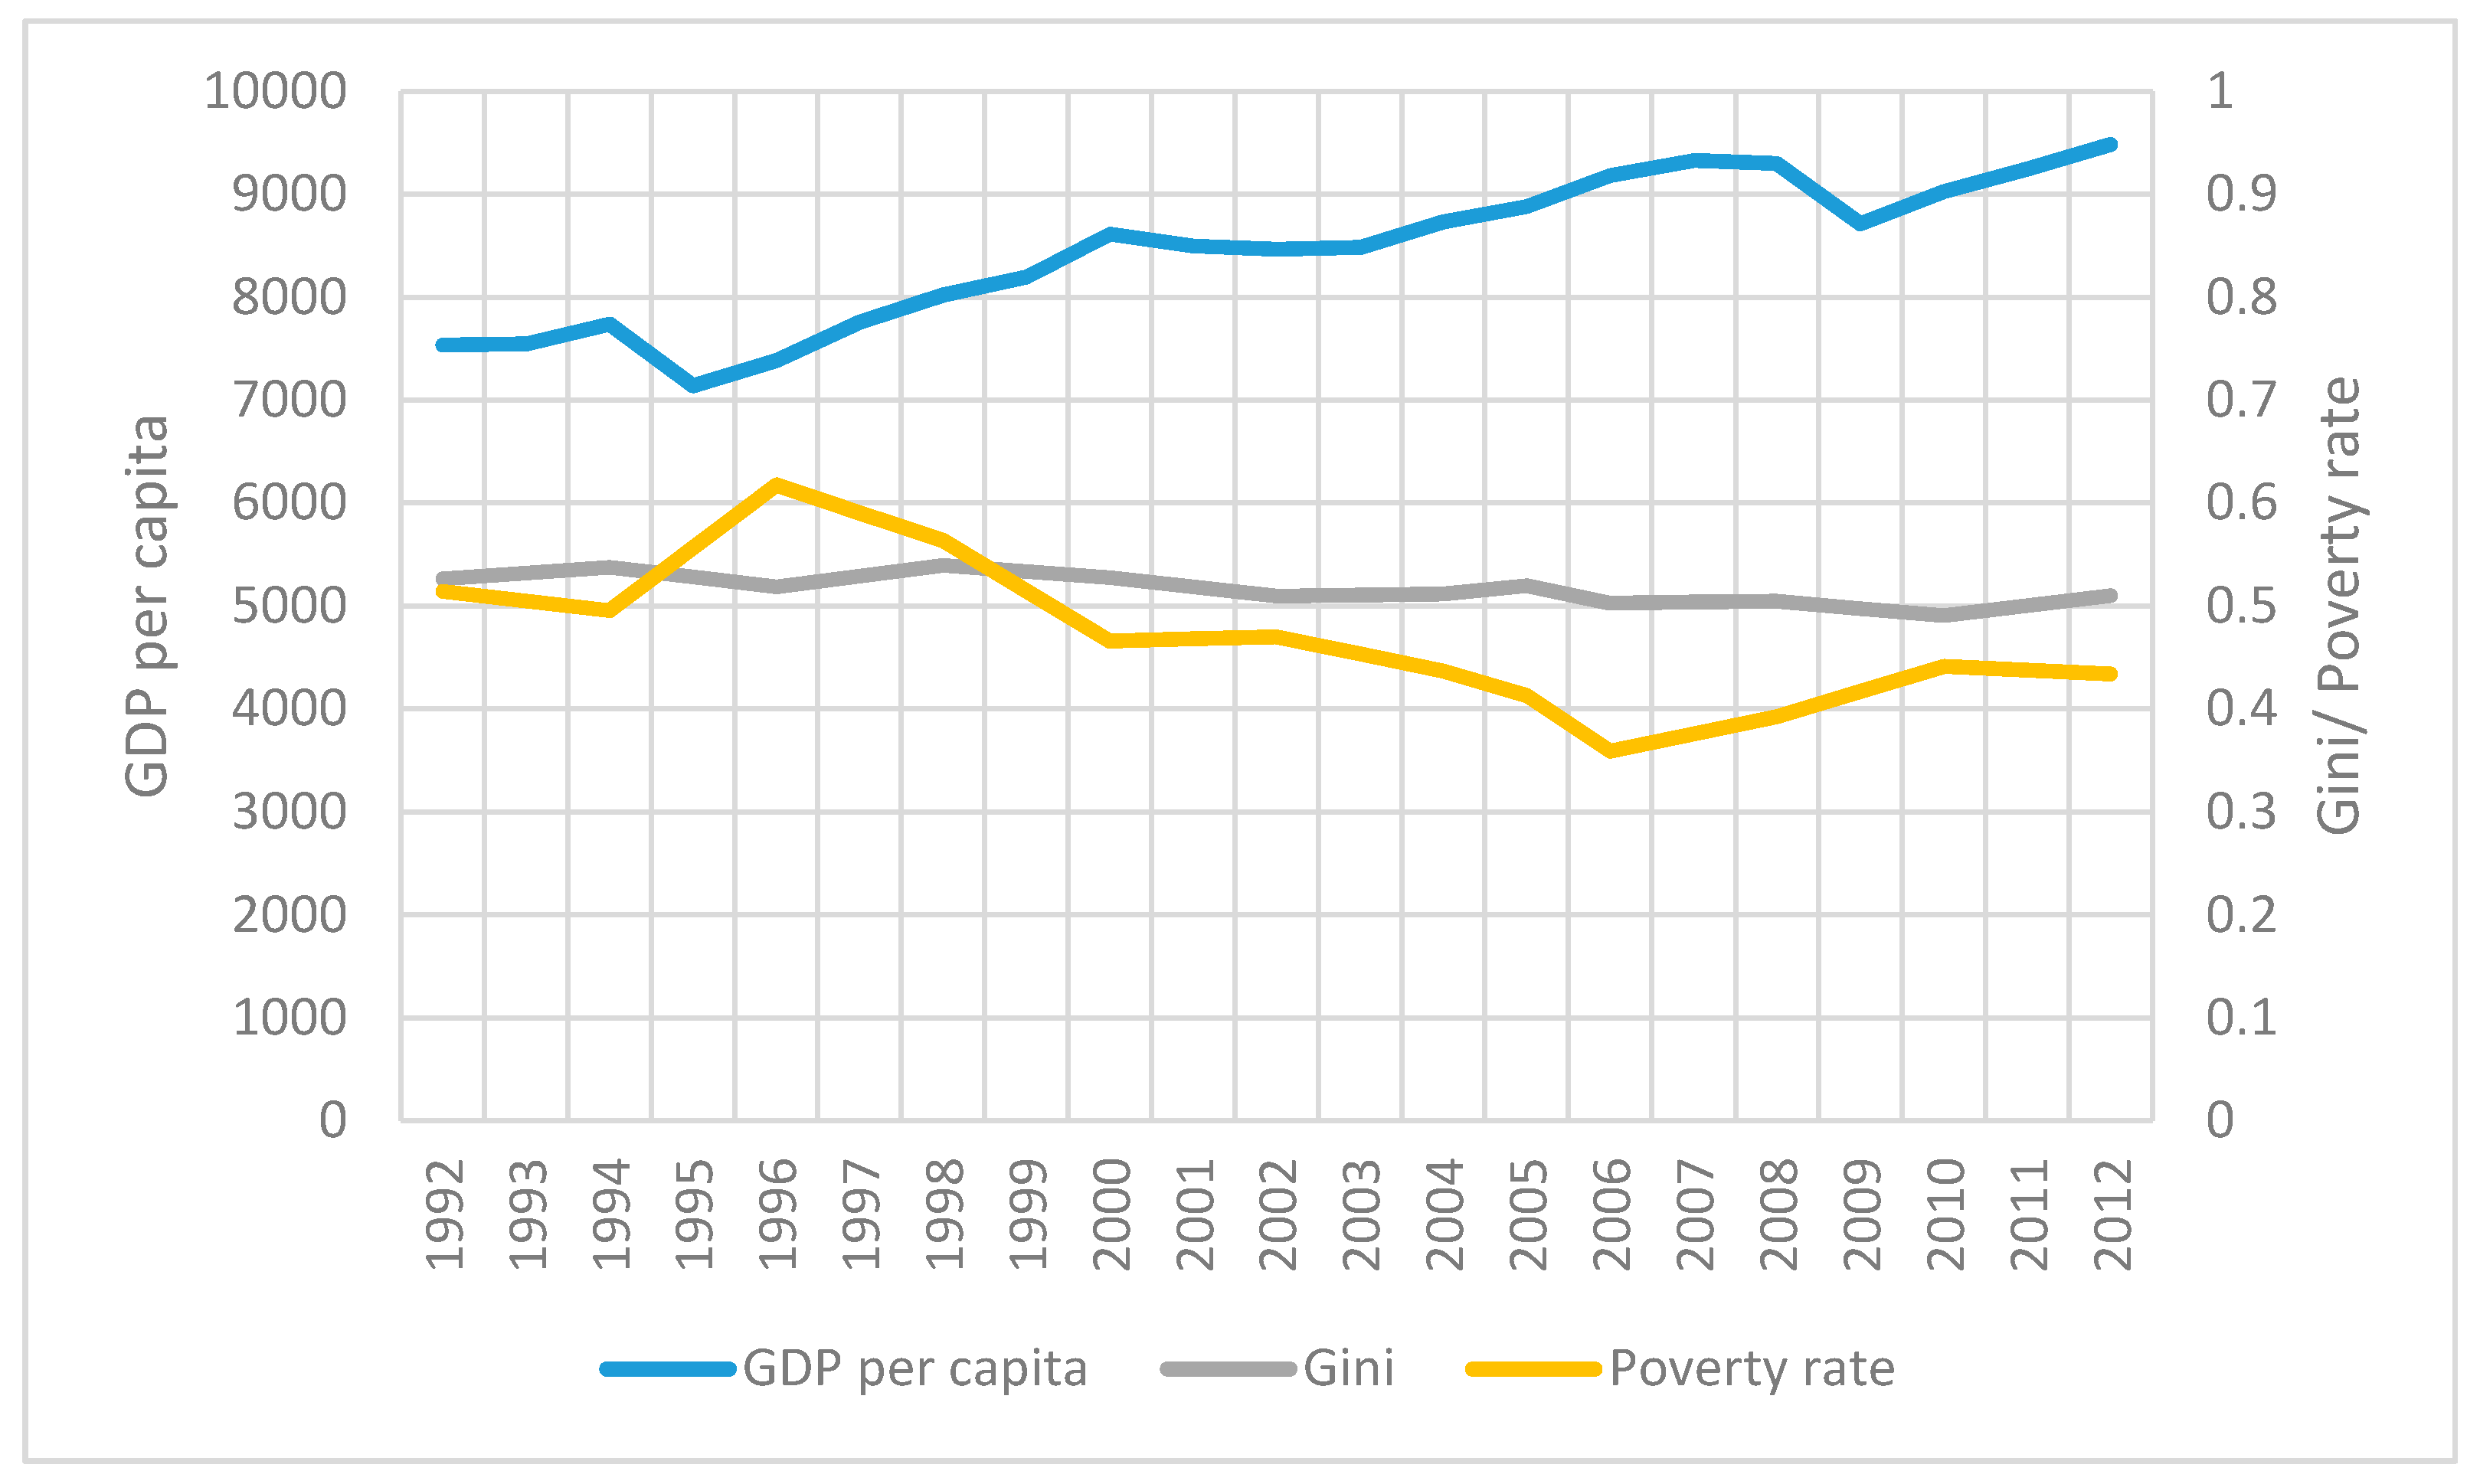
Figure 2.
Appliances classification in the Mexican survey—ENIGH. 1992–2014. Source: Authors’ classification based on Yao and Steemers (2005).
Figure 2.
Appliances classification in the Mexican survey—ENIGH. 1992–2014. Source: Authors’ classification based on Yao and Steemers (2005).

Figure 3.
Households with no access to electricity. Mexico 1992–2014. Percentage. Source: Authors’ calculations, ENIGH (1992–2014).
Figure 3.
Households with no access to electricity. Mexico 1992–2014. Percentage. Source: Authors’ calculations, ENIGH (1992–2014).
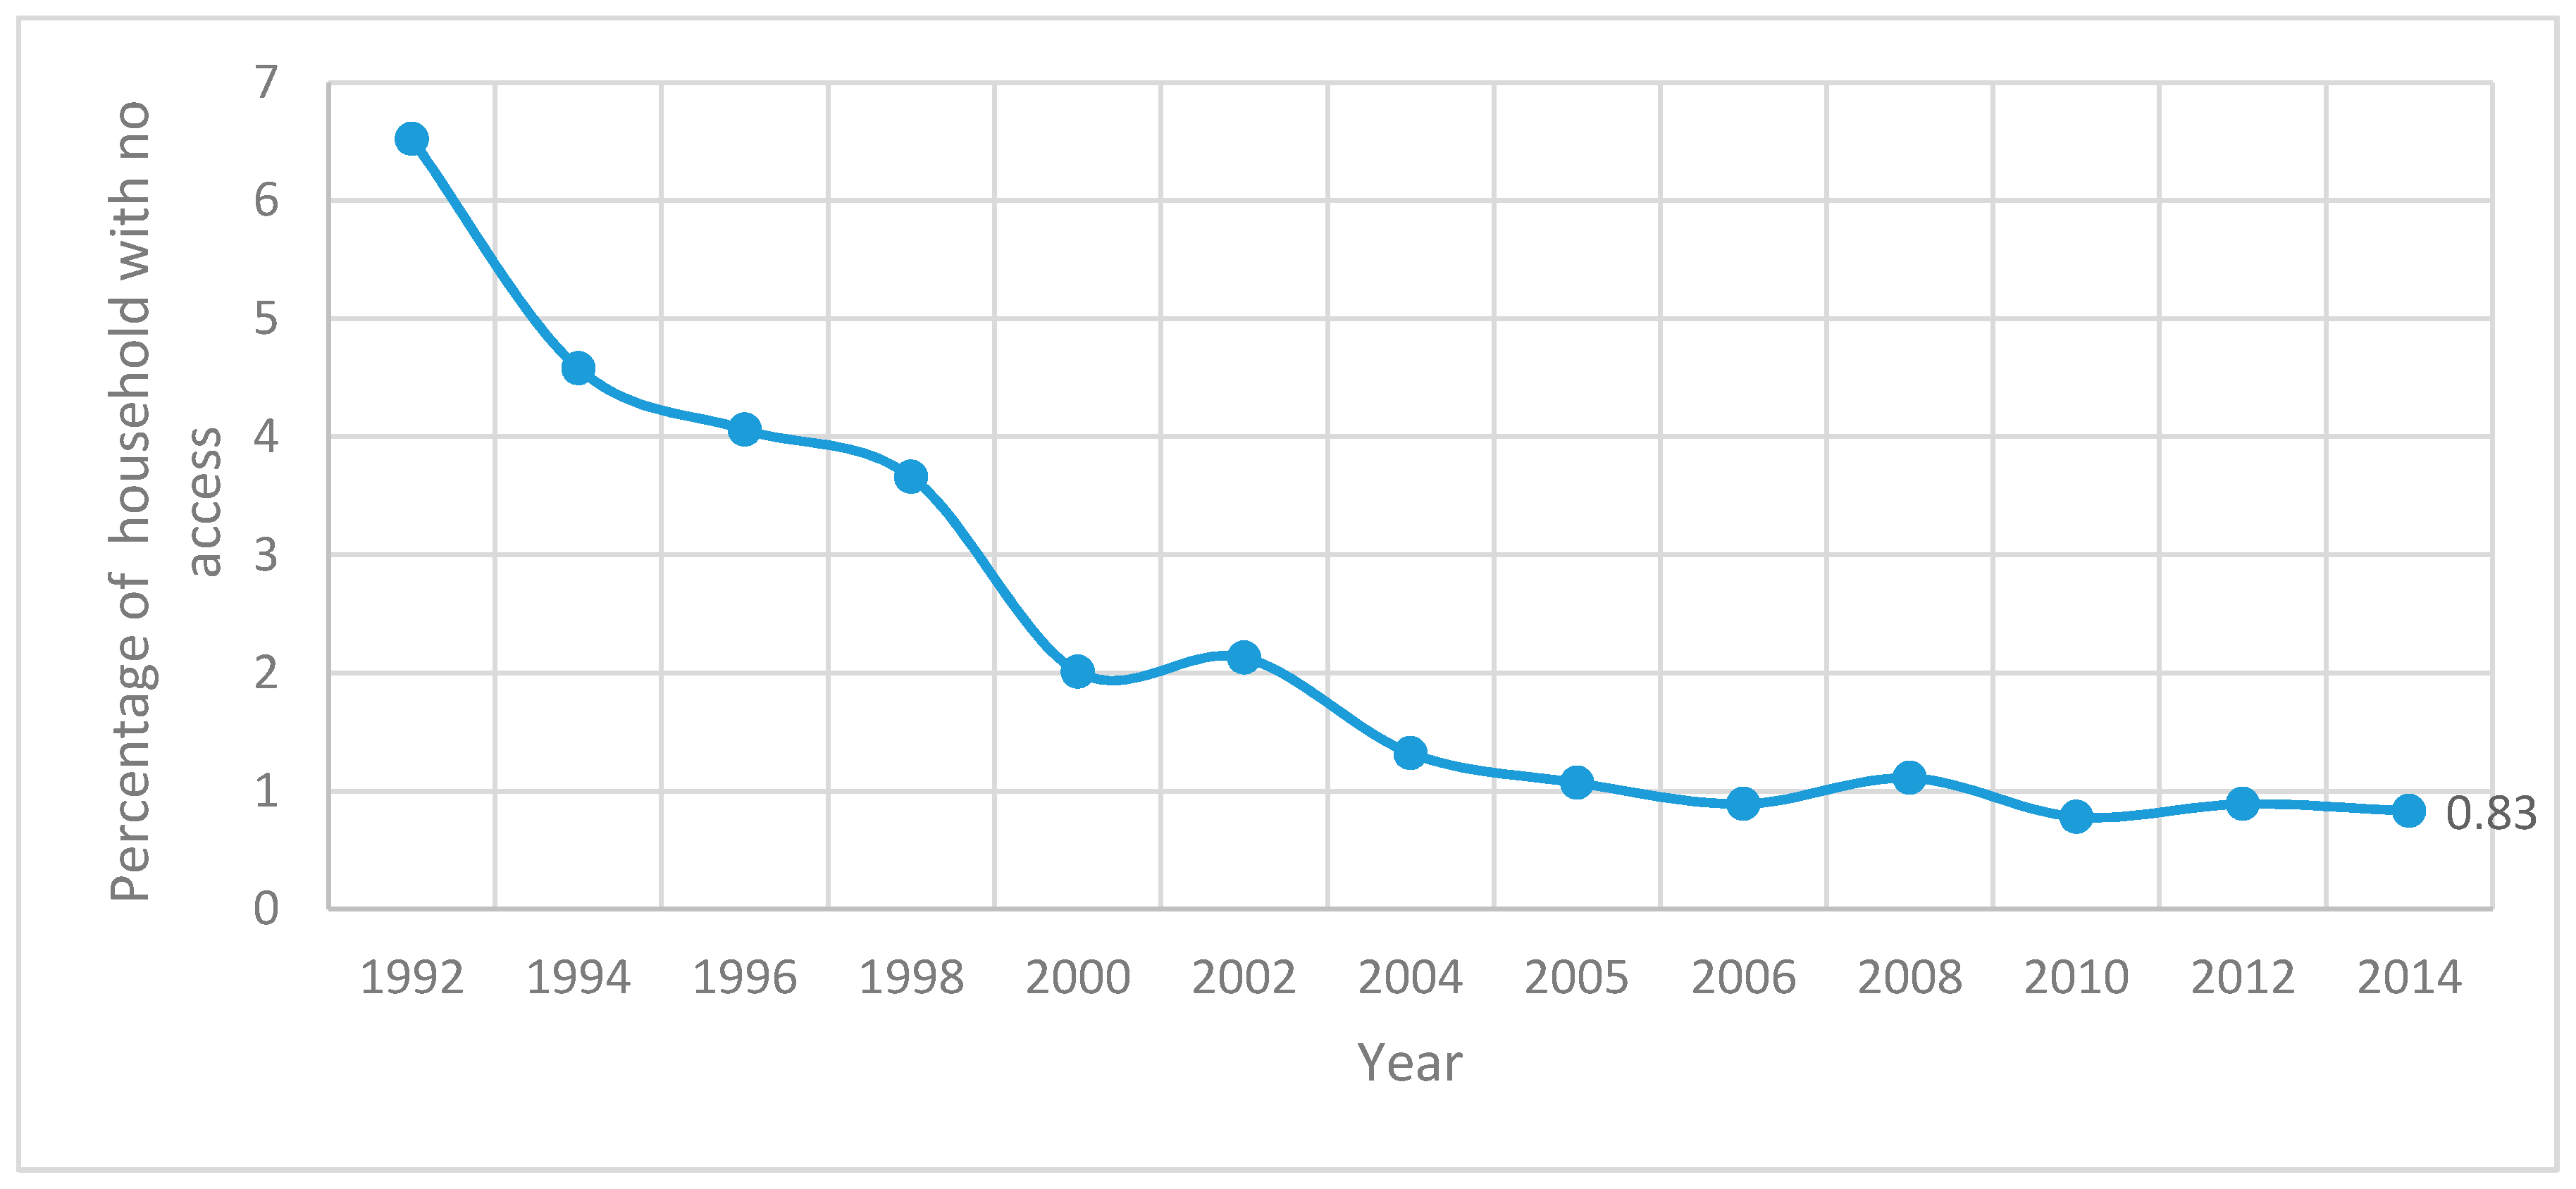
Figure 4.
Electricity/total energy consumption ratio. Mexico 1992–2014. Source: Authors’ calculations, ENIGH (1992–2014).
Figure 4.
Electricity/total energy consumption ratio. Mexico 1992–2014. Source: Authors’ calculations, ENIGH (1992–2014).
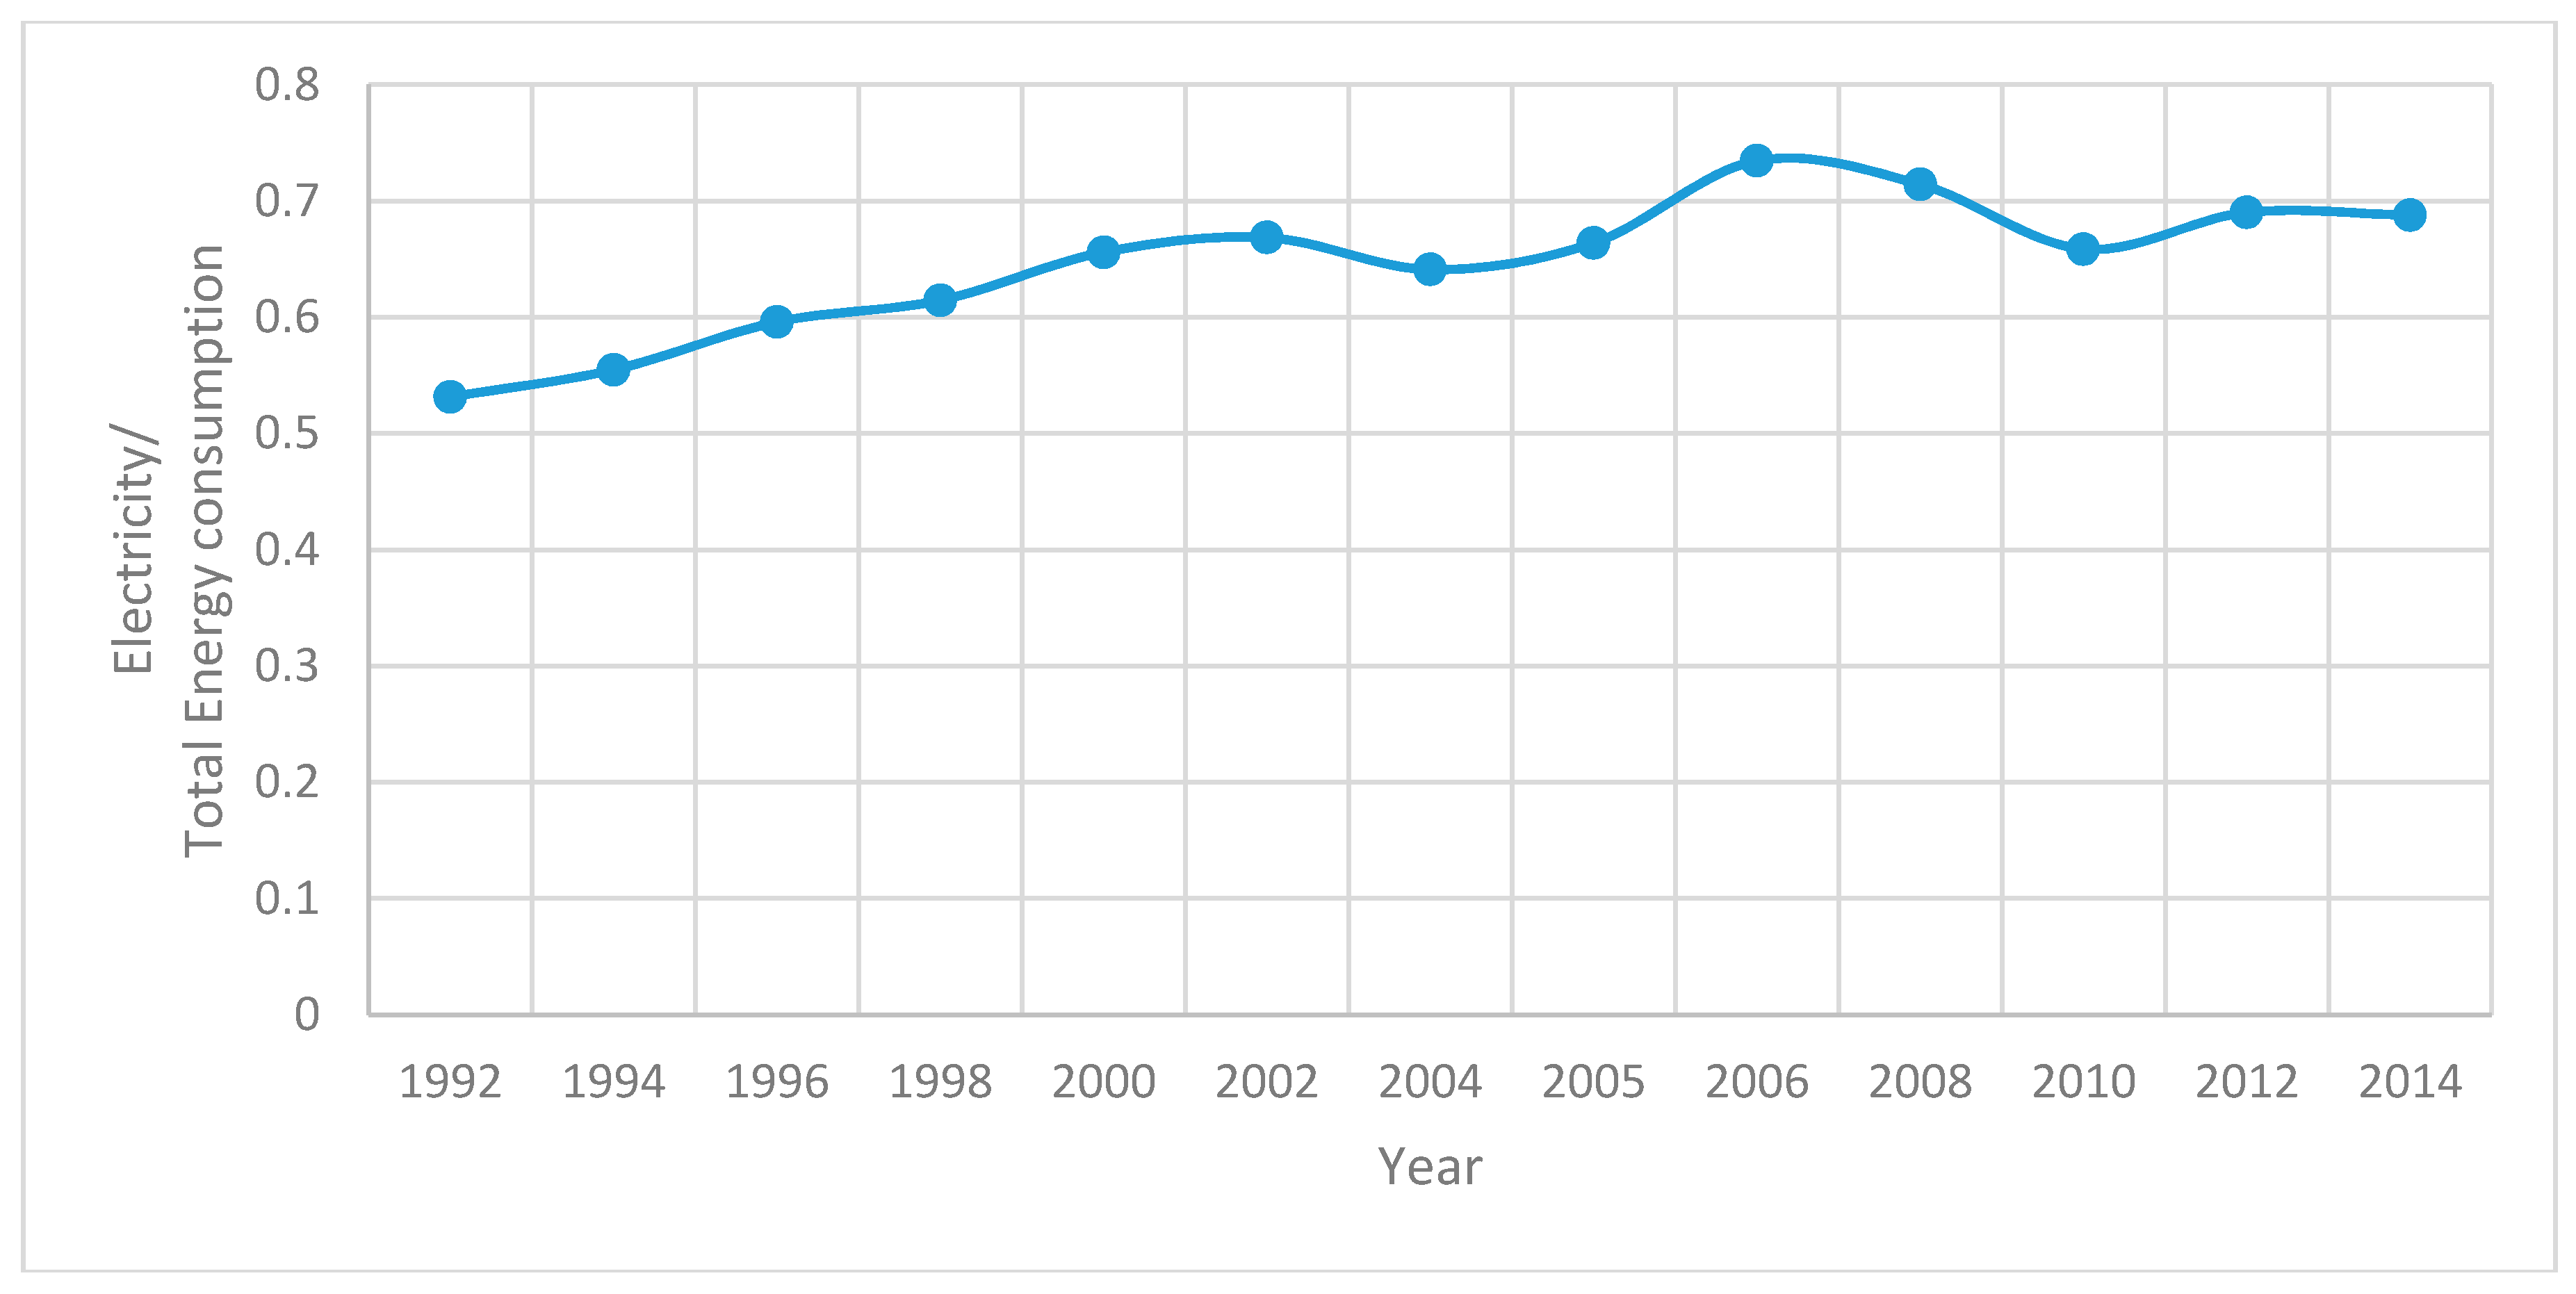
Figure 5.
Number of appliances by income decile and end-uses. Mexico, 1992, 2002, and 2014. Source: Authors’ calculations, ENIGH (1992–2014).
Figure 5.
Number of appliances by income decile and end-uses. Mexico, 1992, 2002, and 2014. Source: Authors’ calculations, ENIGH (1992–2014).
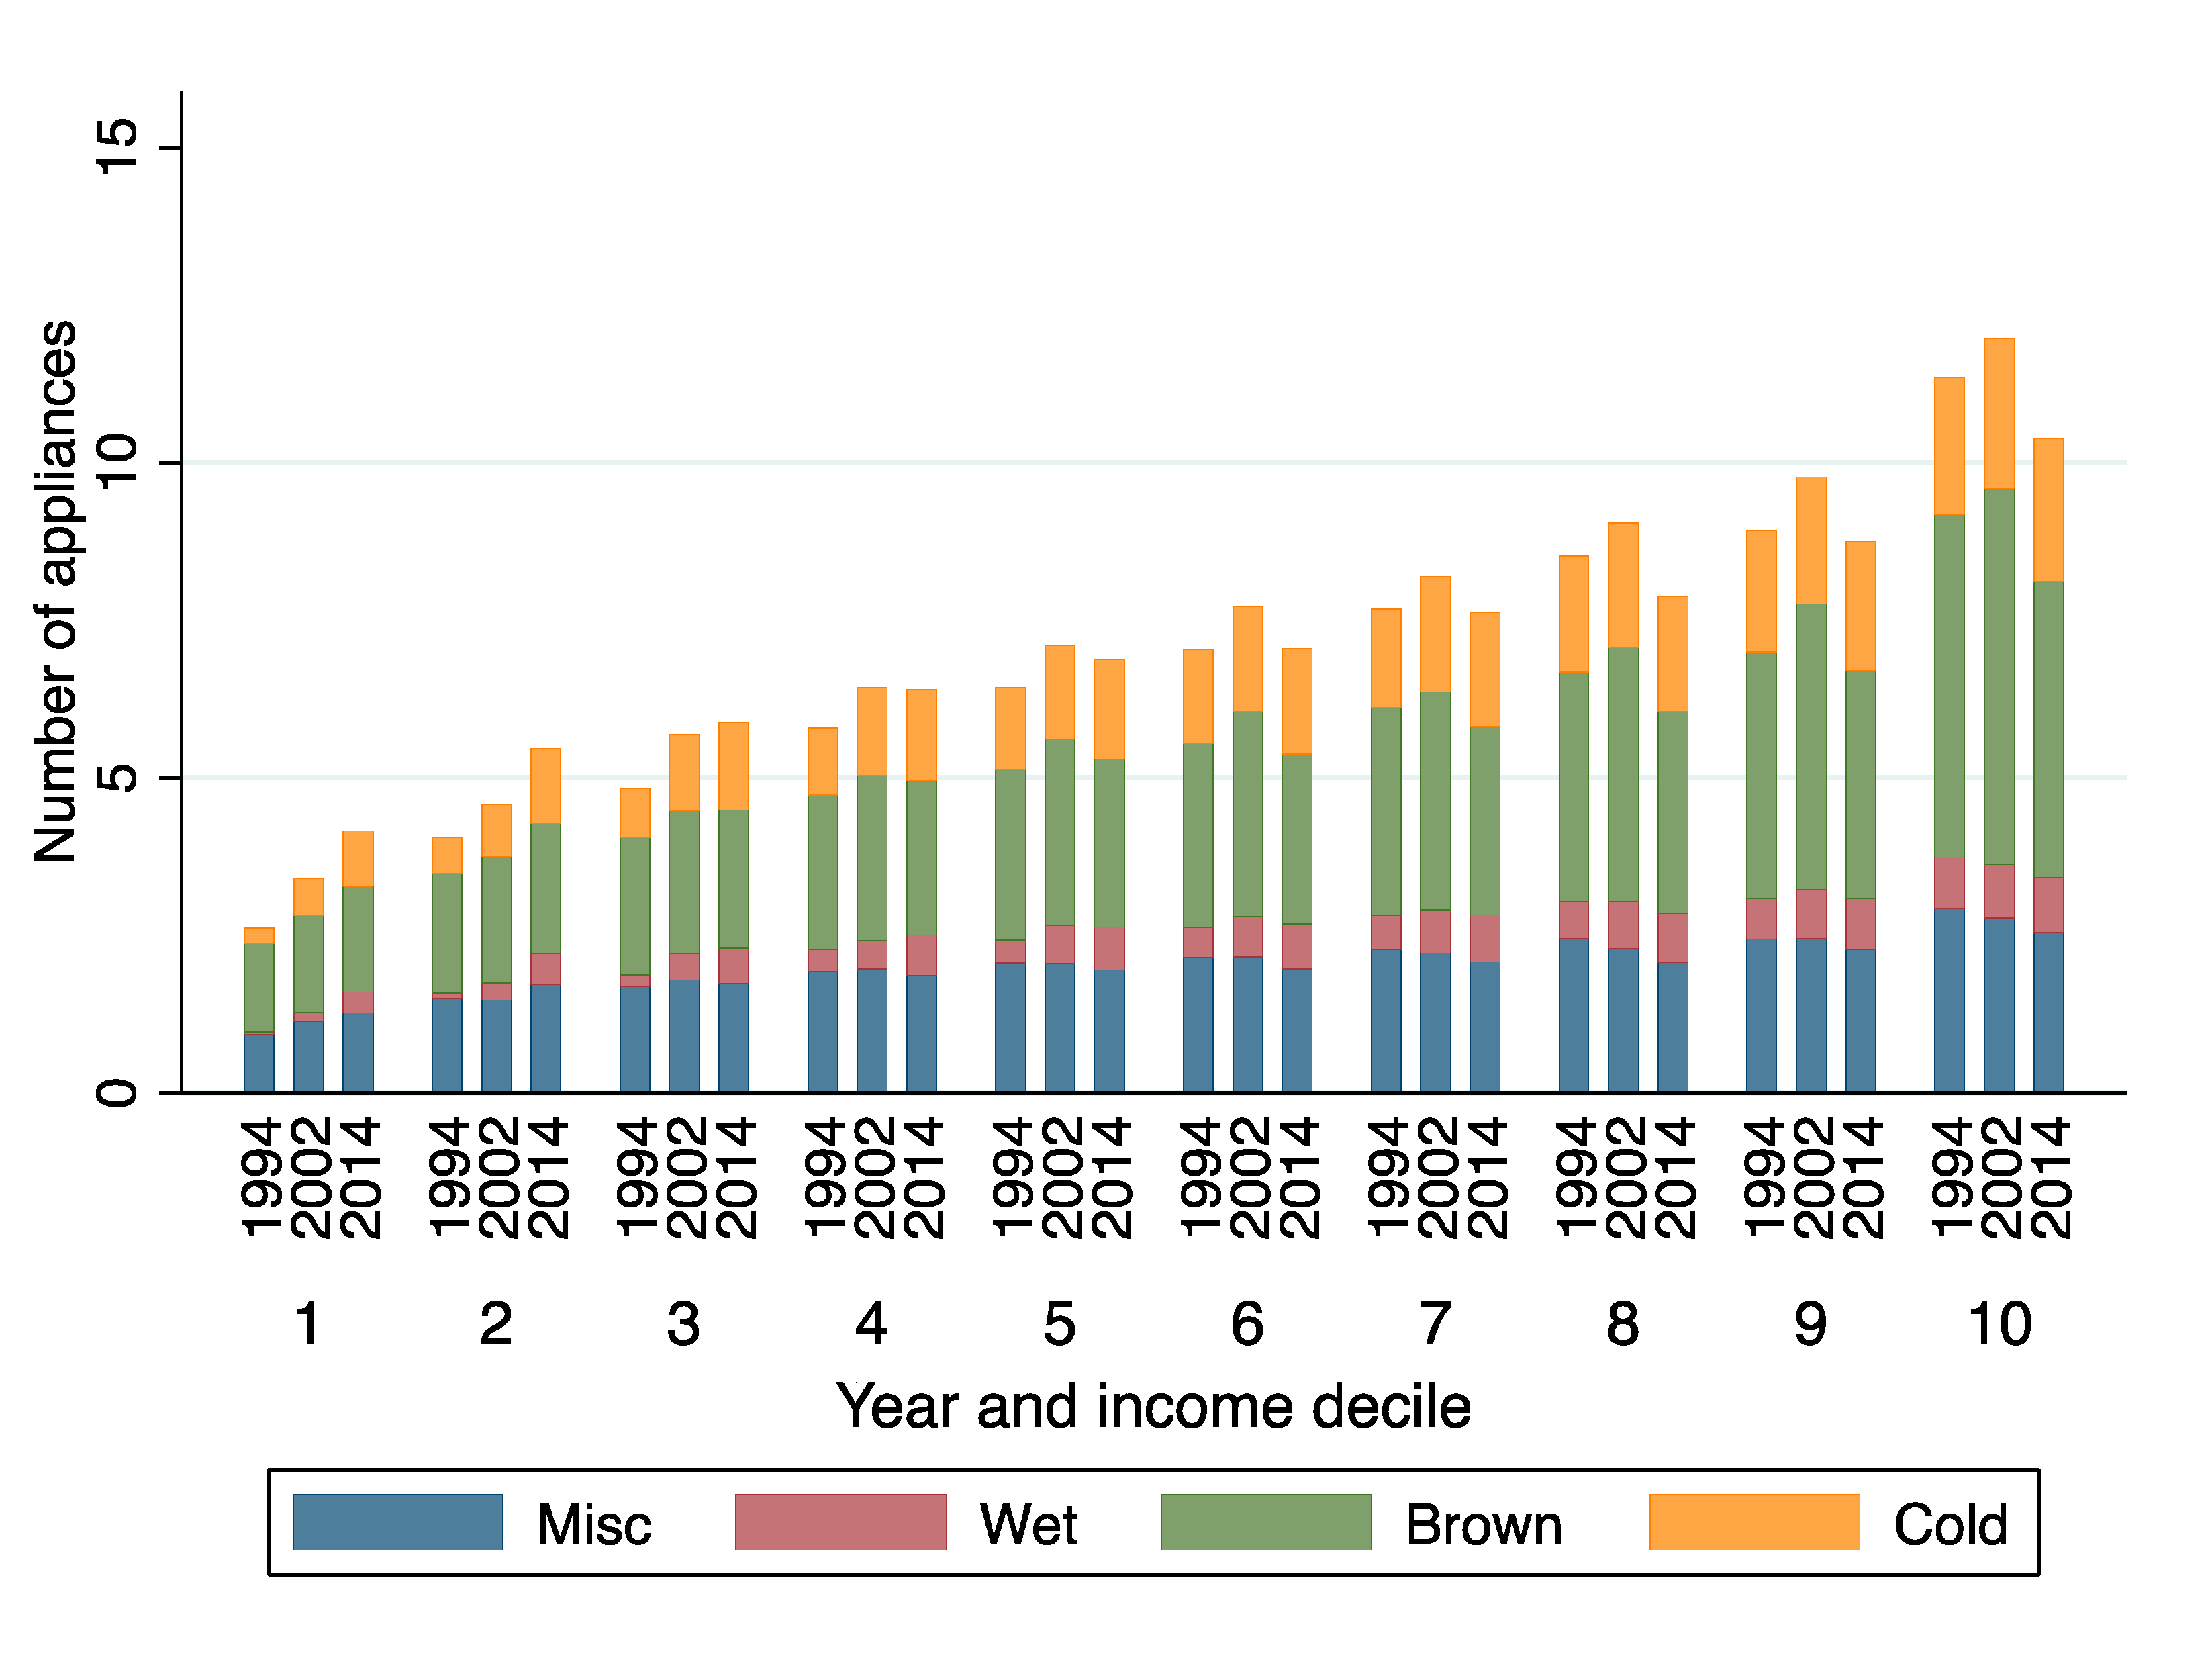
Figure 6.
Number of appliances by electrical consumption decile and end-uses. Mexico, 1992, 2002, and 2014. Source: Authors’ calculations, ENIGH (1992–2014).
Figure 6.
Number of appliances by electrical consumption decile and end-uses. Mexico, 1992, 2002, and 2014. Source: Authors’ calculations, ENIGH (1992–2014).
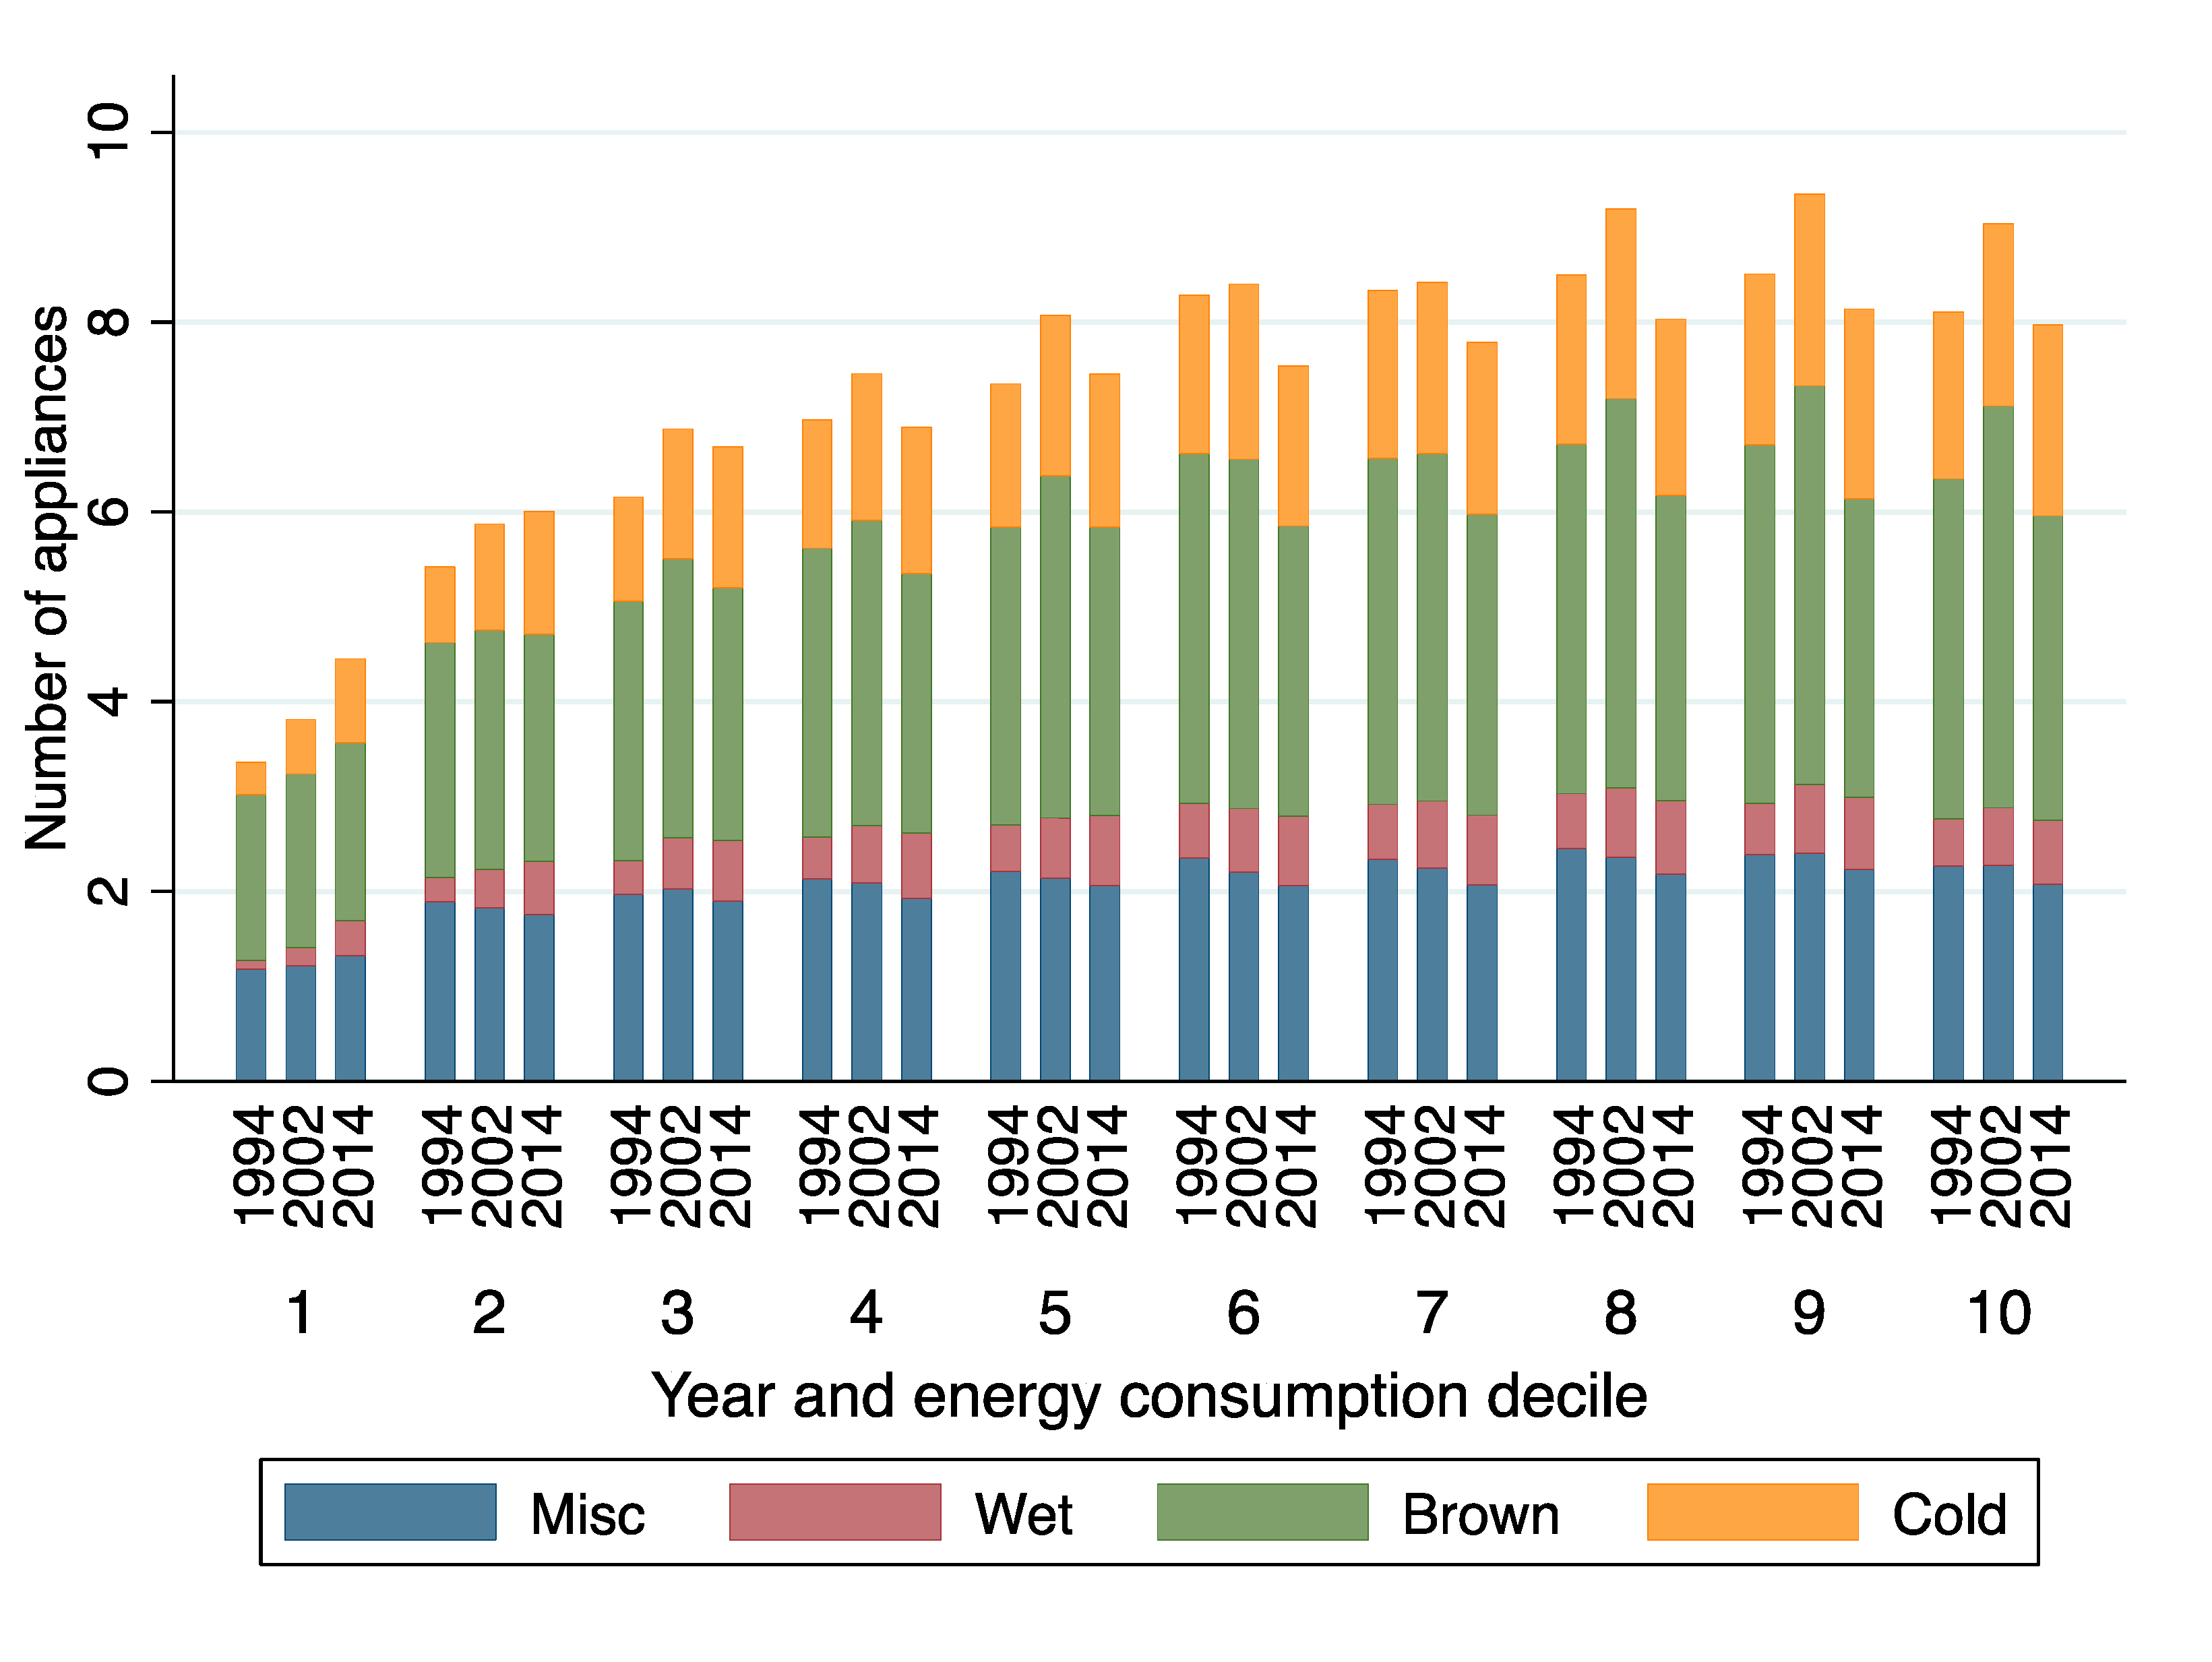
Figure 7.
Number of appliances over consumer practices’ latent classes and end uses. Mexico, 1992, 2002, and 2014. Source: Authors’ calculations, ENIGH (1992–2014).
Figure 7.
Number of appliances over consumer practices’ latent classes and end uses. Mexico, 1992, 2002, and 2014. Source: Authors’ calculations, ENIGH (1992–2014).

Figure 8.
Electricity consumption per household by consumer practices’ latent classes. Mexico 1992–2014. Kilowatt hours (Kwh) and confidence intervals (95%). Source: Authors’ calculations, ENIGH (1992–2014).
Figure 8.
Electricity consumption per household by consumer practices’ latent classes. Mexico 1992–2014. Kilowatt hours (Kwh) and confidence intervals (95%). Source: Authors’ calculations, ENIGH (1992–2014).

Figure 9.
Conditional probabilities for consumer practices latent class membership over time. Mexico 1992–2014. Source: Authors’ calculations, ENIGH (1992–2014).
Figure 9.
Conditional probabilities for consumer practices latent class membership over time. Mexico 1992–2014. Source: Authors’ calculations, ENIGH (1992–2014).

Figure 10.
Conditional probabilities for consumer practices latent class membership over income deciles. Mexico 1992 and 2014. Source: Authors’ calculations, ENIGH (1992–2014).
Figure 10.
Conditional probabilities for consumer practices latent class membership over income deciles. Mexico 1992 and 2014. Source: Authors’ calculations, ENIGH (1992–2014).
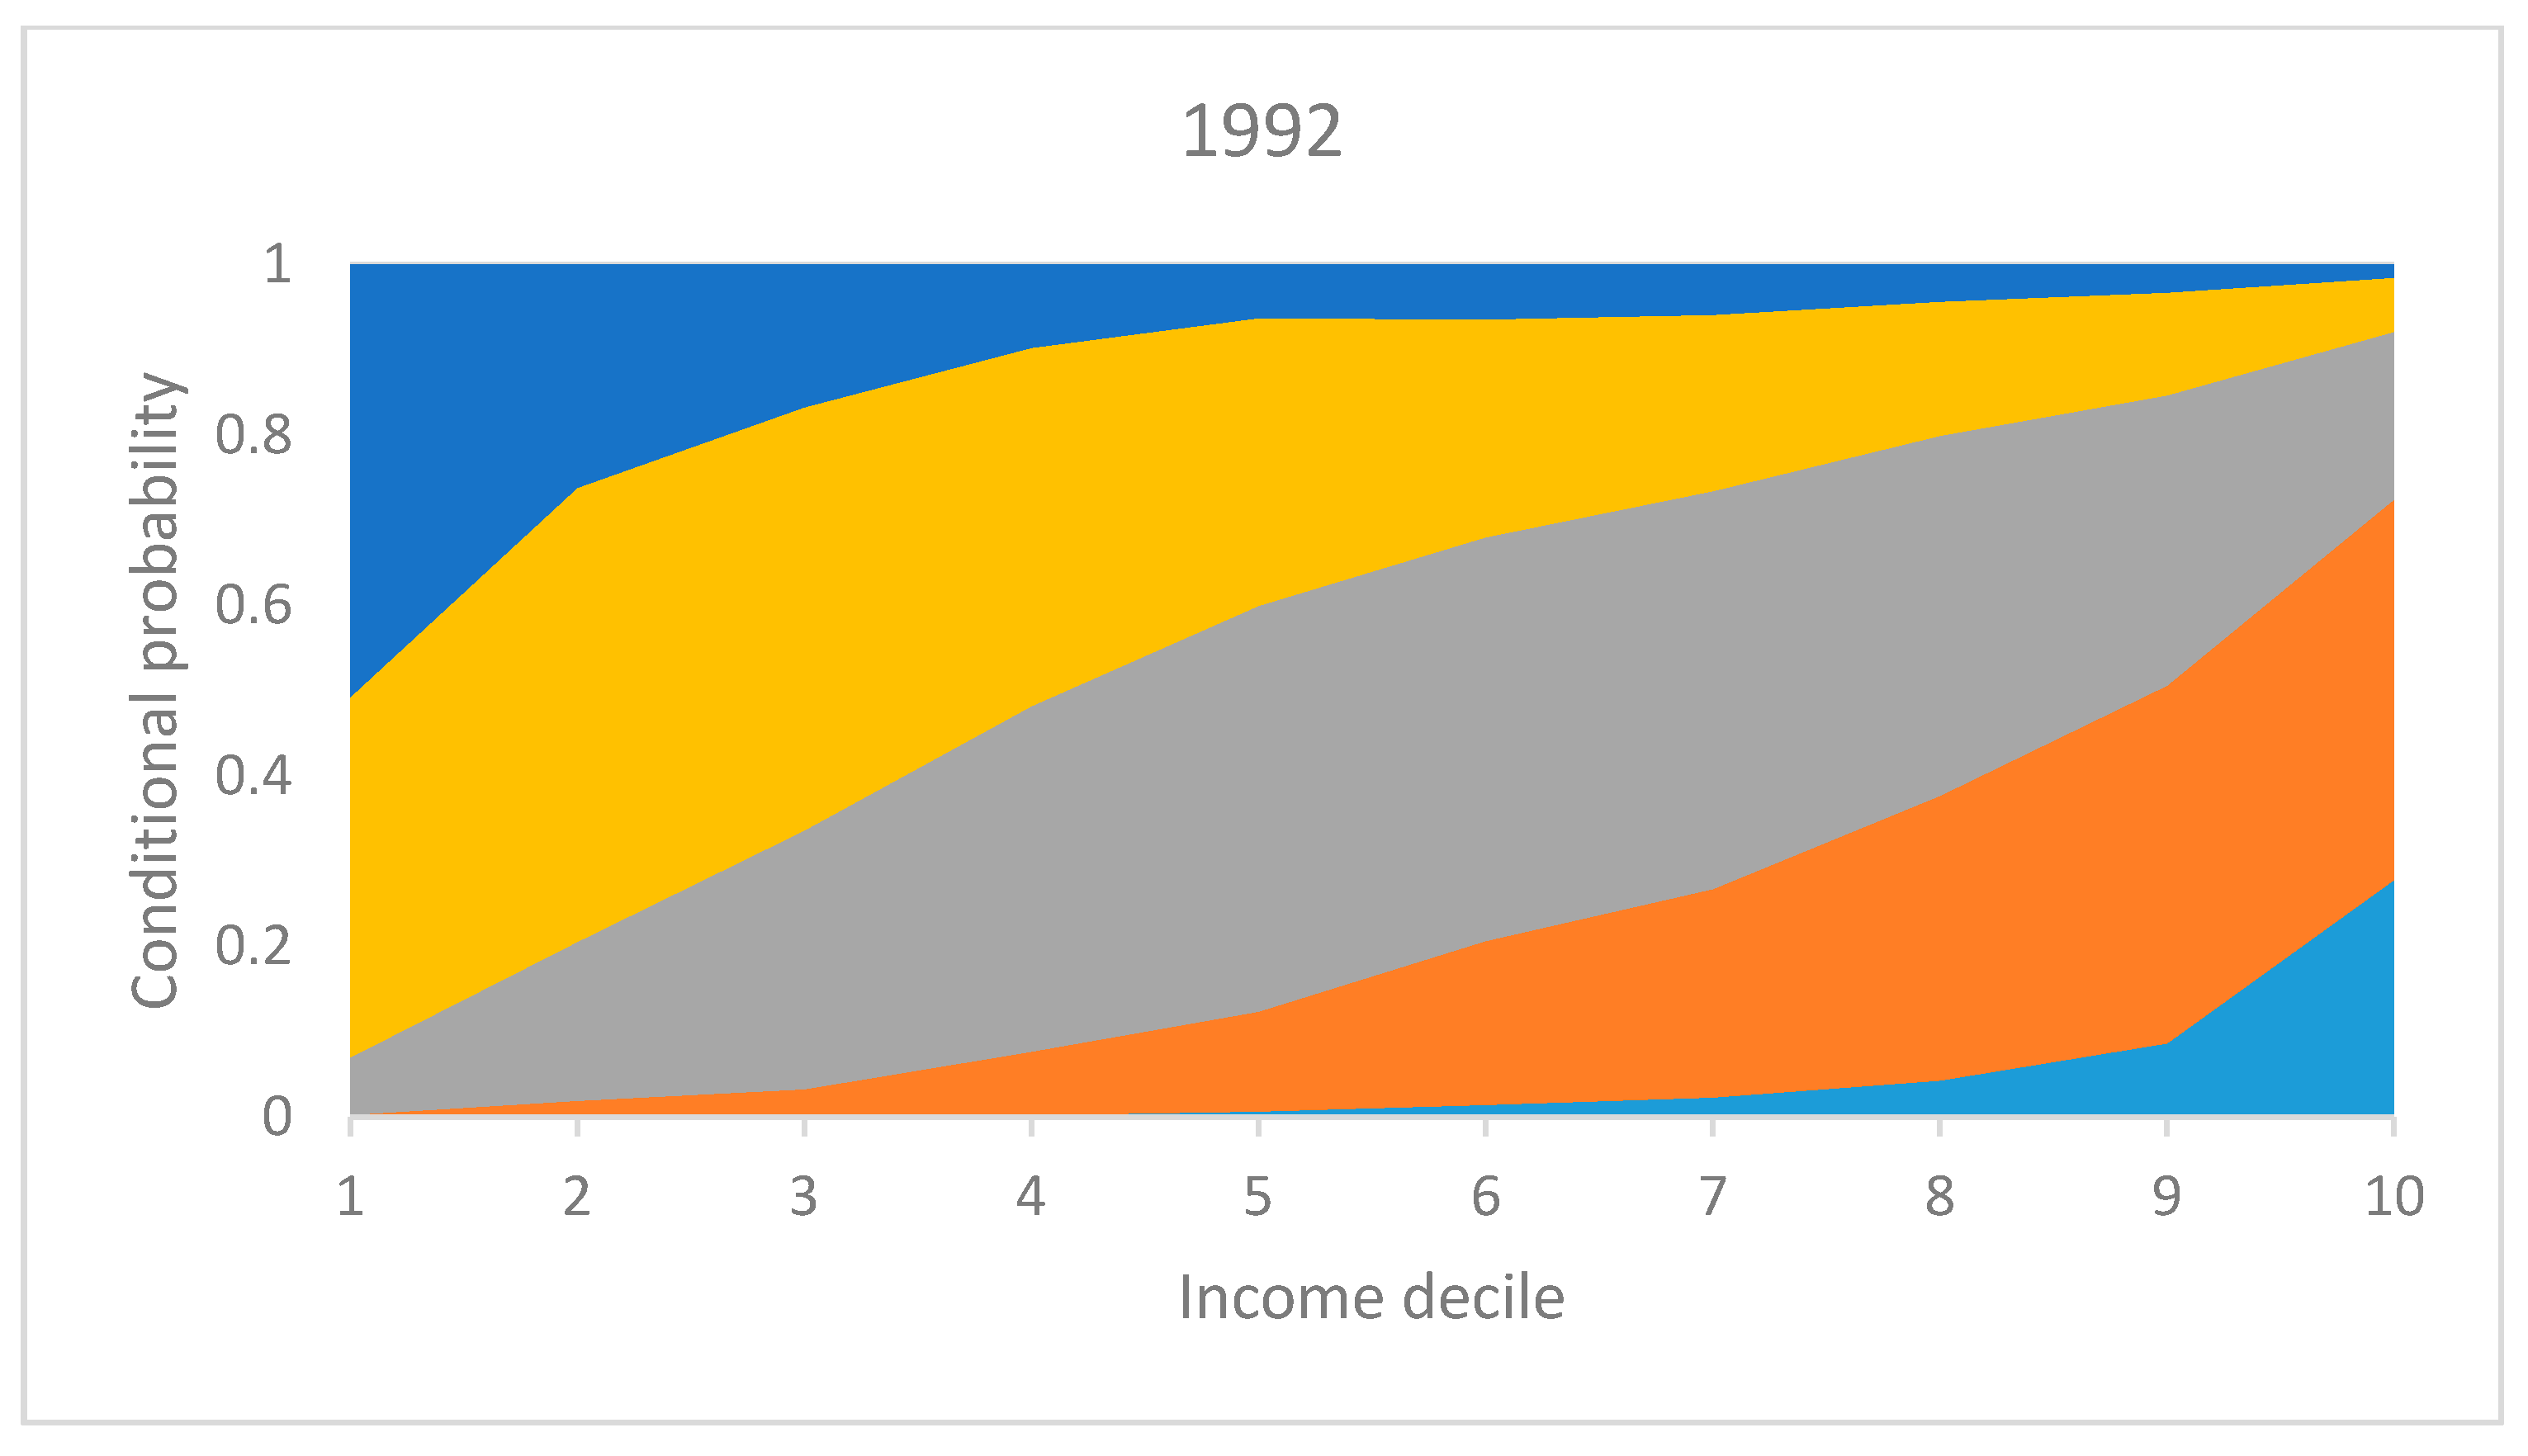
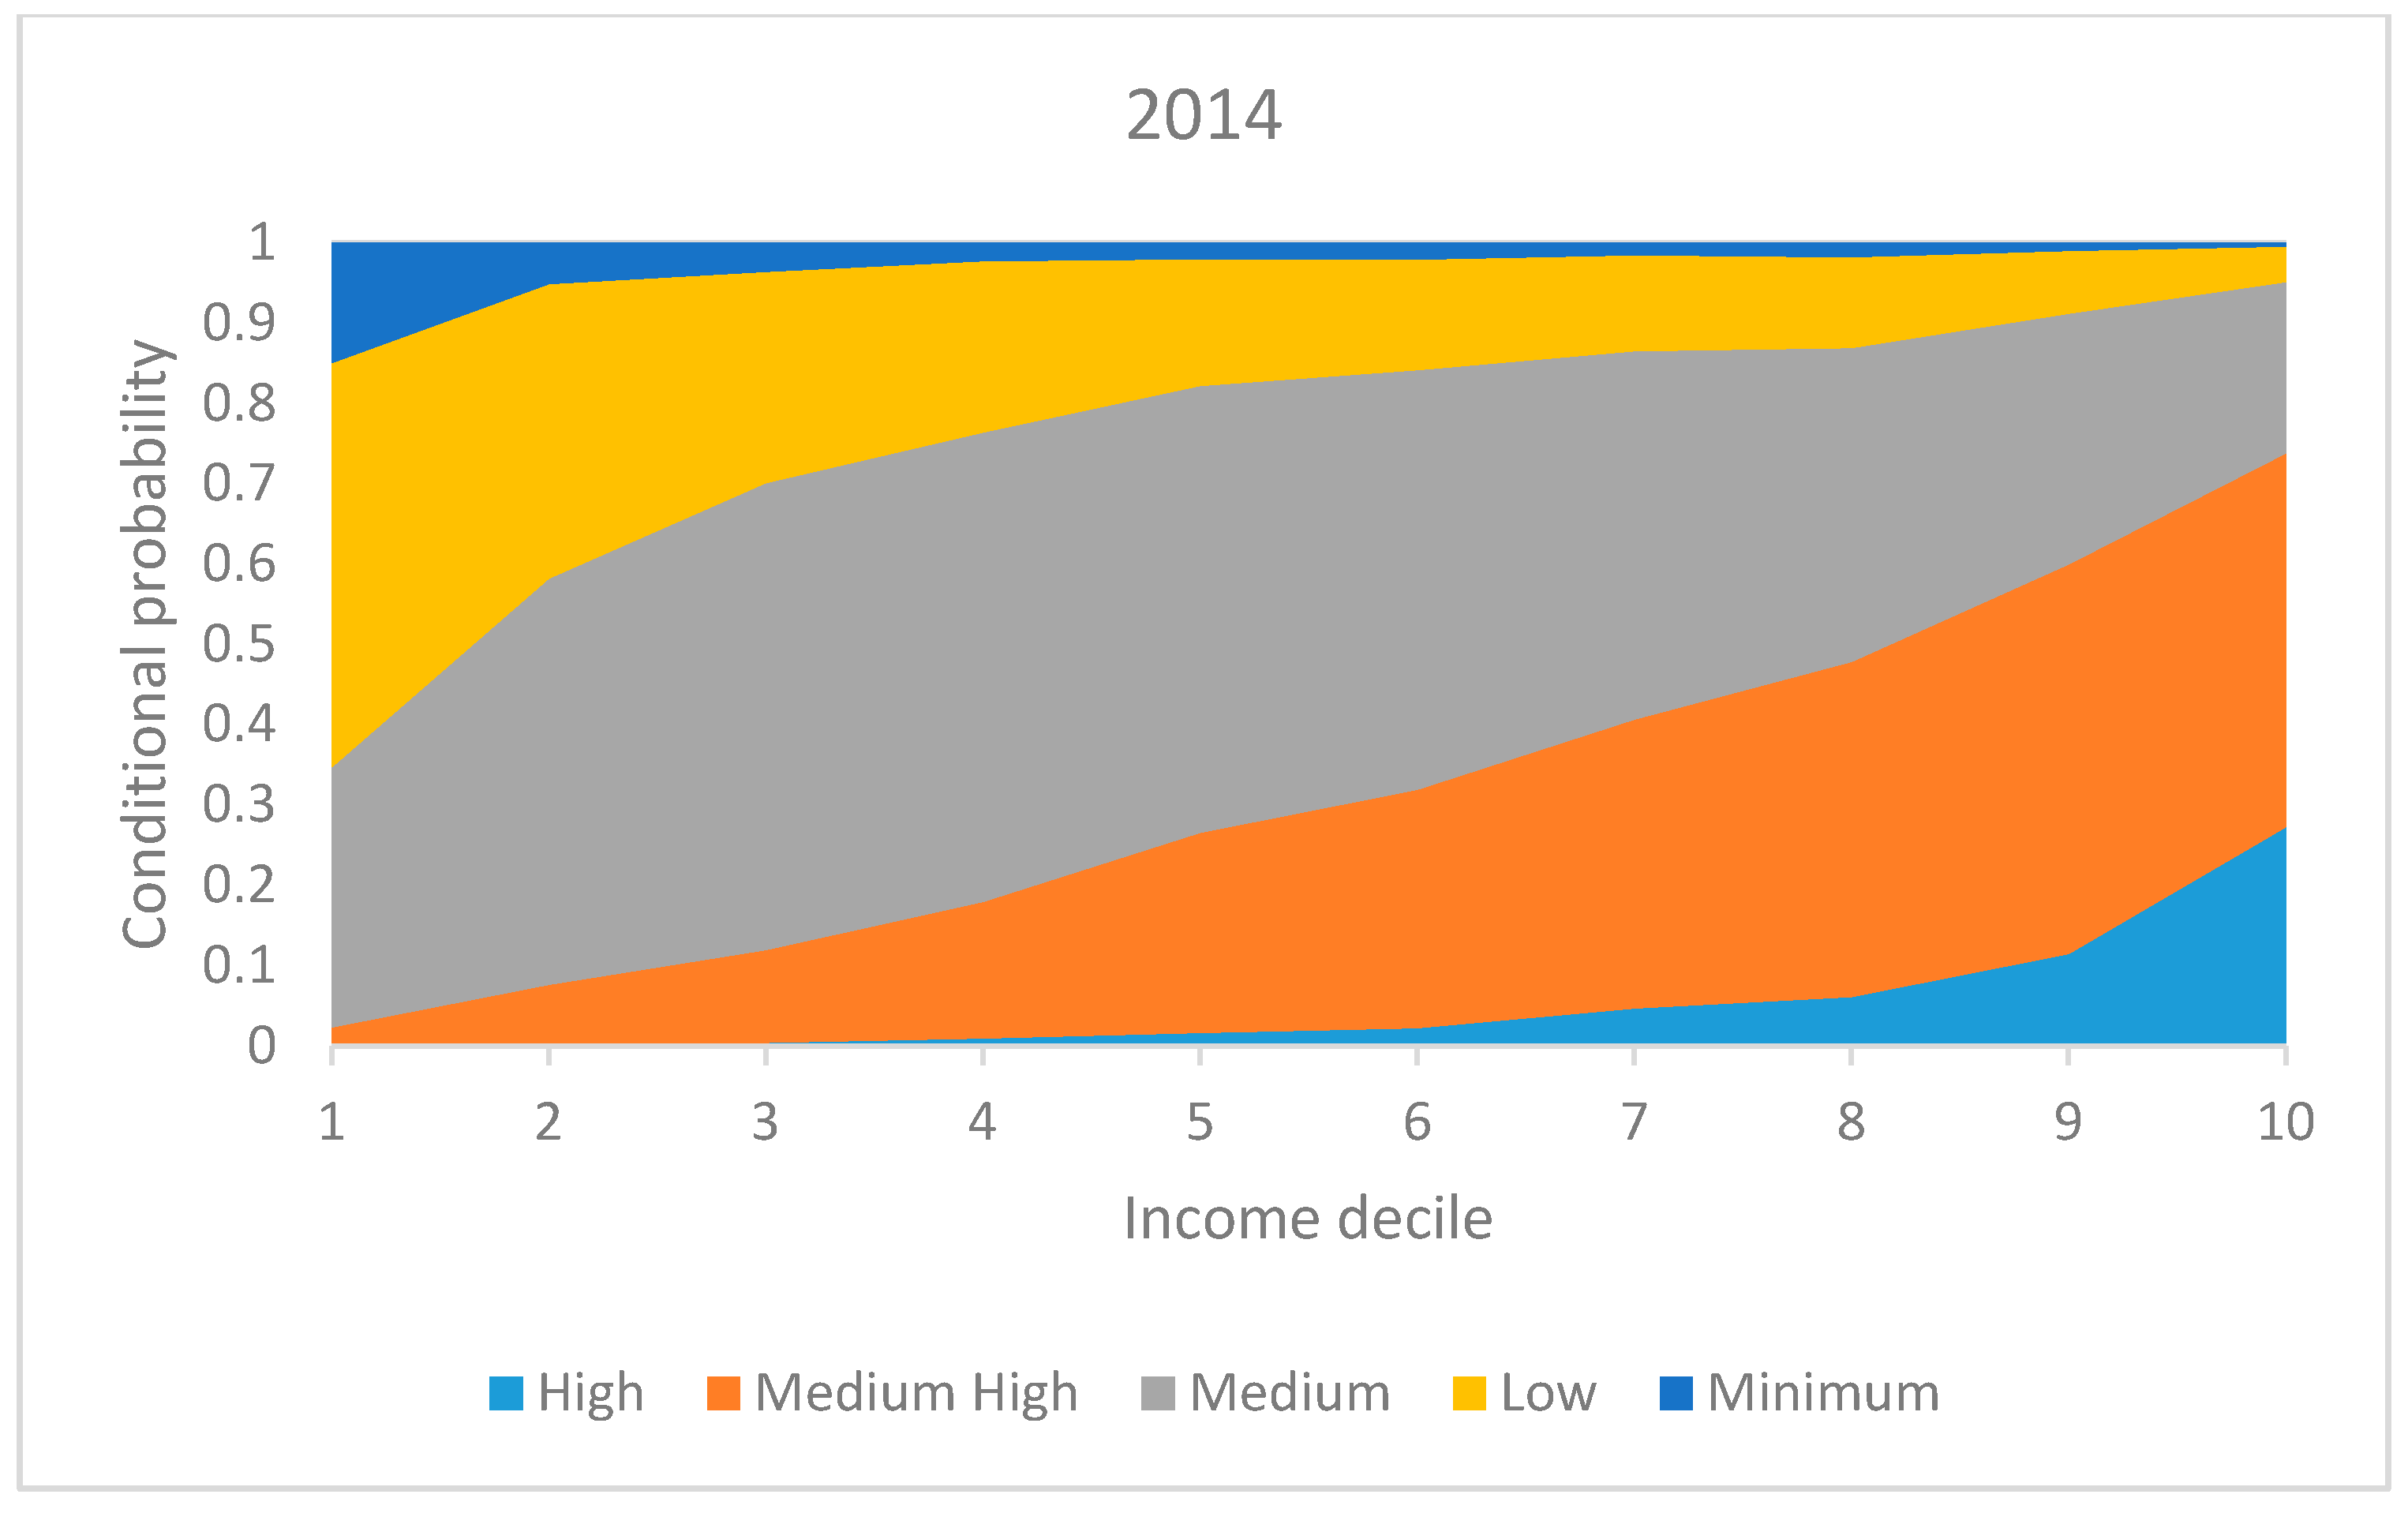
Table 1.
Size of latent classes and mean of appliances index.
| Estimation | High | Medium High | Medium | Low | Minimum |
|---|---|---|---|---|---|
| Membership probability | 0.08 | 0.27 | 0.37 | 0.21 | 0.07 |
| Mean Appliances index | 3.64 | 2.42 | 1.64 | 0.87 | 0.18 |
Source: Authors’ calculations, ENIGH (1992–2014).
© 2017 by the authors. Licensee MDPI, Basel, Switzerland. This article is an open access article distributed under the terms and conditions of the Creative Commons Attribution (CC BY) license (http://creativecommons.org/licenses/by/4.0/).
Share and Cite
MDPI and ACS Style
Escoto Castillo, A.; Sánchez Peña, L. Diffusion of Electricity Consumption Practices in Mexico. Soc. Sci. 2017, 6, 144. https://doi.org/10.3390/socsci6040144
AMA Style
Escoto Castillo A, Sánchez Peña L. Diffusion of Electricity Consumption Practices in Mexico. Social Sciences. 2017; 6(4):144. https://doi.org/10.3390/socsci6040144
Chicago/Turabian StyleEscoto Castillo, Ana, and Landy Sánchez Peña. 2017. "Diffusion of Electricity Consumption Practices in Mexico" Social Sciences 6, no. 4: 144. https://doi.org/10.3390/socsci6040144
Note that from the first issue of 2016, this journal uses article numbers instead of page numbers. See further details here.