1. Introduction and Background
As technology advances to allow for the integration of automation into daily life, consumers face the eventual reality that is driverless vehicles. However, this technology is still relatively new and rarely used in commercial settings for public consumption. Consumers do not necessarily have informed, considered opinions. Therefore, it is important to gauge consumer reactions in order to understand current perceptions and tailor the industry accordingly. As the industry shifts to allow for the integration of driverless vehicles, consumers will likely feel strongly about this new technology, whether positively or negatively. Previous research has investigated consumer perceptions of the implementation of automation in airlines (
Mehta et al. 2014;
Rice et al. 2014) as well as emergency medical service vehicles (
Winter et al. 2017). Generally, findings suggest that individuals are less willing to ride in driverless vehicles than those with human drivers, though this finding is often dependent on gender, nationality or emotional response to the situation at hand. The current research builds upon these previous studies, aiming to understand the willingness of parents to let their children ride in driverless school buses.
1.1. Bus Benefits and Safety Concerns
The current study is aimed at understanding consumer willingness to let their children ride in automated school buses. Participants from both the United States and India were sampled in order to achieve a cross-cultural analysis of consumer perceptions on driverless school buses. It is important to note some operational details of public transportation, specifically buses, in both the aforementioned countries. Though school transport is not the same as all forms of bus transport, it does share some characteristics, including the large number of users and direct relevancy to daily life. Automation in either of these contexts—city buses and school buses—would dramatically change the way public transportation exists and functions.
The 2004 Texas Transportation Institute (TTI) Annual Urban Mobility Report states that public transportation reduces traffic delays and vehicle costs (
Schrank and Lomax 2009). In 2002, regular bus and train services in congested cities saved drivers more than 1.1 billion hours of travelling; without public transportation, travelling delays would have increased both in time and in cost of time, fuel and maintenance (
American Public Transportation Association 2000). However, any congested city also seems to sometimes be overwhelmed by the use of public transportation, resulting in overcrowding and slow transport. In India especially, public transportation is often uncoordinated and inconvenient, calling for reform and expansion (
Pucher et al. 2004). On the other hand, India provides quite a bit more public transportation compared to the United States, which relies more on personal vehicles.
Recent decades have seen a push for increased bus safety in the United States. Analysis of accident data from the National Transit Database (NTD) concluded that many major transit bus collisions occur in normal conditions: during clear weather, in daylight, under normal road conditions and on straight roadways (
Yang 2007). The NTD reports more than 80% of major bus collisions occurring near stop signs and traffic lights. An analysis of bus accident severity also cites increased severity of accidents depending on driver age, driver speed, and risky and inattentive driving (
Kaplan and Prato 2012).
Some research details potential countermeasures for transit collisions, suggesting LIDAR (similar to radar) that is currently being developed for highly automated cars (
Yang 2007). Research and governmental initiatives seek to combat bus collisions, and make public transportation safer for everyone. One potential avenue of improving transportation technologies for buses relies on automation, as self-driving vehicles will eventually results in a reduction of driver errors, resulting in safer transportation. However, in order to better understand how school buses may benefit from automation, we must first investigate differences between populations and how they may be differentially affected.
1.2. School Travel in India and the US
Overall, school travel in urban areas is relatively well-studied compared to school travel in rural areas, in both the U.S. and in India. In addition, school travel in the U.S. is more widely studied than school travel in India. This is likely due to the provision of school buses in the U.S. while the Indian government does not generally provide a school busing service for its students. However, the main modes of transportation are the same for schools in the US and India, though the data is distributed very differently: travel by private car, travel by school bus, travel by public transportation, walking and cycling are among the most prevalent methods of transportation to and from school for children in the aforementioned countries.
School travel in the United States has seen a large shift over the previous decades to a much larger proportion of students travelling to school in private cars and a much smaller proportion of students walking or biking (
McDonald et al. 2011;
McDonald 2007). Since 1969, the proportion of American children taking a school bus has remained relatively constant—approximately 40% of students aged 5–14 take the school bus (
McDonald et al. 2011). In addition, more male students than female students bike and/or walk to school, which may reflect parent safety concerns (
McDonald 2012).The decrease and gender differences in those walking and cycling to school may be a result of the urban form around the school in question—urban form meaning the physical layout of the area, which may influence transportation safety (
McMillan 2007).
Research on school transportation in Hyderabad (the fifth-largest city in India) has indicated that the primary modes of transportation are walking and cycling, which they believe are highly influenced by the child’s distance traveled to and from school (
Tetali et al. 2015). Though a similar trend in walking distance is seen in U.S. students (
McDonald et al. 2011), this is a much higher percentage of walking and cycling than those schools surveyed in the U.S., and a much lower percentage (less than 5%) of schoolchildren who arrive in private cars than those in the U.S. One specific program was targeted at improving the number of female students in secondary schools by focusing on cycling to school (
Muralidharan and Prakash 2017). In addition, many Indian children use public buses as transportation to school (
Tetali et al. 2015), while this seems to be uncommon in the United States. It is also important to note that school transportation in Hyderabad seems to be influenced by the type of school traveled to and from (government, semi-private, or private) and there is little research on private school transportation in the U.S.
As school buses have different levels of current use, we believe that automated transportation maybe of some interest to the countries in question—either replacing current technologies, or introducing new safe ways of traveling, reducing the need for foot transportation. Parents may have different views on automated school buses dependent on their country’s current status quo of school transportation.
1.3. Research on Automation
Automation is regularly classified into levels, though for the purposes of this study, a fully automated vehicle is suggested. Specific levels of automobile automation generally vary from no automation (Level 0) to full automation (Level 5), with things such as autonomous brake systems or adaptive cruise control falling towards the middle of the continuum. These levels are further discussed in the next section. Automation as a general term is defined as a machine executing an action or function previously executed by a human (
Parasuraman and Riley 1997;
Wickens and Hollands 2000). Automation has influenced most industries, as operations become more complex and costly, driving the need for machines and automated processes to take over for expensive human operators. However, automation is moving yet further, into consumer products and services, such as driverless cars and automated public transportation.
As humans begin to act within the context of automation, they have two primary tasks: monitoring the automated system, and readiness to take control of the automated system—two functions which they should act upon when the system is not operating as expected (
Bainbridge 1983;
Stanton and Marsden 1996). In the context of driverless transportation, these tasks rely on the driver (or attendant) to take over control of the vehicle, should the automation fail or err. Fully automated vehicles, although in testing, are not currently on the market.
1.4. Driverless Vehicle Research
Driverless vehicles have long been in the plan for many companies, with automated features such as autopilot and adaptive cruise control becoming available in on-the-market vehicles. The Society for Automotive Engineers (SAE) is a professional organization, which develops and defines standards for automotive manufacturing. In 2016, the Department of Transportation (DoT) adopted the SAE’s six levels of automation, a classification system that defines the different possible levels of automation in vehicles (
National Highway Traffic Safety Administration, Department of Transportation 2016). This ranges from no automation present (Level 0) to full automation (Level 5), and in-between exist levels like “Driver assistance” and “Conditional Automation” which specify the level of interaction between driver and system. For the purposes of this study, we focus on what would be considered Level 5—Full Automation. Many major car manufacturers are included in the long list of companies and research facilities beginning to develop and test highly automated as well as driverless vehicles. In terms of automation predictions, Litman states that automation integration, including autonomous braking, active lane assist, and autopilot driving have the potential to become industry standards within two decades (
Litman 2014). Potentially as a result, driverless vehicles have gained a lot of research attention, as well as media attention.
Additionally, automation has the potential to improve the lives of individuals, such as those with any type of mobility issue (
Beckwith 2017). Though often touted as a safer alternative to traditionally driven vehicles, automation is not always thought of as positive. Research on public perception of self-driving cars has generally found that individuals are not totally unwilling, but are hesitant to adopt and pay for new levels of autonomy in their vehicles (
Haboucha et al. 2017;
Kyriakidis et al. 2015). Older drivers tend prefer a lower level of automation in their cars, and have different levels of willingness for certain automated features (e.g., older users are less willing to have an automated function that sometimes takes control of driving) (
Abraham et al. 2017). However, the same research does note that overall, a large portion of their sample does seem to be supportive of automated functions which aid the driver. Though individuals seem to want automated programs and technologies in their vehicles, an AAA study has also found that drivers report being “afraid” to drive in a fully autonomous, self-driving car (
Shar 2017). This fear is likely to depend on a number of factors, both individual differences and situational differences. The current research explores these variables in relation to each other, partially gauging fear by “willingness to ride” in order to capture the same sort of consumer perceptions as the aforementioned AAA survey.
Other driverless vehicles research has focused on the algorithms which driverless cars will use to make ethical decisions (e.g., if necessary, choosing between hitting a pedestrian or hitting a car) (
Fleetwood 2017;
Goodall 2016). The increasing prevalence of driverless vehicles will also likely have implications for driver workload, attention, and skill degradation (
Young and Stanton 1997). However, dependent on programming, driverless vehicles will perhaps be less likely to engage in risky driving, and will not be subject to driver inattention or lack of driver-knowledge. There are clear benefits and drawbacks to the development and eventual use of self-driving vehicles. The current trend of transportation to become more fully automated drives our current research question: How willing are consumers to let their children ride in a driverless school bus?
1.5. Perception Differences Based on Gender
Differences in gender have been shown to influence risk-taking behaviors such that females are usually less willing to take risks (
Byrnes et al. 1999). One of the objectives of the current study is to take note of gender differences in acceptance of new technologies, specifically automated school buses, which could be seen as a “risk.” In addition to Byrnes et al.’s meta-analysis (
Byrnes et al. 1999), previous research on automation in aviation has shown the decreased willingness of female participants to fly on an aircraft where the cockpit is entirely autonomous (
Mehta et al. 2014). This is in line with other aviation research findings that female participants are less willing to fly on an aircraft where cabin depressurization has the potential to be used as a hijacking mitigation technique (
Mehta et al. 2017). In a study investigating willingness to fly, participants were asked how willing they would be to let someone else fly in an autonomous aircraft, as opposed to the participant themselves. The results of this study indicated that willingness to fly changes significantly dependent on who the passenger is: the self, a child, or a colleague (
Rice et al. 2014). One prior study has investigated gender differences specifically in willingness to use a driverless vehicle, finding that of a sample of 1603 Germans, females were significantly more anxious about the use of driverless vehicles than the males (
Hohenberger et al. 2016). The decreased willingness to fly in prior research, coupled with females negative emotions about driverless cars suggest that female participants in this study may be less willing to let their children ride in an automated school bus.
1.6. Nationality and Culture
Culture often shapes perception, such that individuals from different nations will perceive similar scenarios (such as automated vehicles) differently. A focus of the current research is to investigate differences between participants willingness to ride dependent on their nationality. There are many potential reasons why these two cultures may respond differently. One potential reason lies in the community-orientation of the culture. India and the United States are collectivist and individualistic cultures respectively and thus may respond to driverless vehicles differently (
Hofstede 1980,
2001;
Markus and Kitayama 1991;
Robbins and Judge 2009). Collectivist cultures tend to focus on the needs of the group, and be very trusting of one another, while individualistic cultures are interested in individual successes, and less focused on community needs (
Bochner 1994;
Han and Shavitt 1994;
Kashima and Callan 1994). The introduction of driverless vehicles has the potential to influence individual as well as community needs, especially when considering driverless school buses. As such, it is a possibility that individualistic and collectivistic cultures may respond differently to emergent technologies, especially within the context of driving. Differences in the escort of children have already been shown between individualistic and collectivistic cultures; children in the U.S. are much more likely to be accompanied by an adult while travelling than children in Japan (
Waygood 2009). This is in line with the finding that private car usage for school transportation in U. S. schoolchildren has increased in the past decades (
McDonald et al. 2011;
McDonald 2007). Indeed, as discussed in a previous section, school travel differs greatly between the U.S. and India; this may play a significant role in willingness to use autonomous transport.
In addition, culture factors highly into trust, which is said to be an underpinning of willingness (
Hofstede 1980). Do individuals trust that an automated vehicle will carry them (or their children) safety to their destination? Previous research on the effect of nationality on willingness to ride has investigated differences between Indians and Americans in an aviation context. Winter et al. found that Indians were more willing to fly in an aircraft that was fully auto-piloted than the Americans in the same study (
Winter et al. 2015). Other research by Rice et al. found the same, and additionally that Indians were more trusting of the autonomous situation than Americans (
Rice et al. 2014). This was regardless of who was the passenger—the participant, their child or their colleague. Though these nationality differences in Willingness to Ride are not yet explicitly understood, there is a clear and replicated effect.
1.7. Willingness and the Consumer
As automation becomes increasingly relevant in today’s transportation, it is important to consider passenger perceptions of different automated scenarios as these will drive use and purchase of highly automated and driverless vehicles. Individuals will likely feel differently about riding in driverless vehicles, as opposed to today’s typical model, with a human driver. Therefore, research in consumer willingness to ride (or drive) is necessary to understand the impact of automation on potential users. The current research utilizes a willingness to ride scale previously validated by Winter, Rice, Keebler, and Mehta (
Winter et al. 2017), and originally created as willingness to fly scale (
Rice et al. 2015a). The scale has respondents answer using a five-point Likert scale ranging from strongly disagree to strongly agree, with a zero neutral option (see
Appendix A).
Prior to the adaptation of the willingness to fly scale for automobiles, studies were conducted using the willingness to fly scale, in order to gauge willingness in a number of scenarios, including automated cockpits, pilot anti-depressant use, and cabin depressurization as a hijacking mitigation technique (
Rice et al. 2014,
2015b;
Mehta et al. 2017). Recent research has also investigated willingness to ride in driverless emergency service vehicles and found not only that individuals are less willing to ride in driverless ambulances, but also that the length of the ride, as well as the gender and nationality of the participant influenced this willingness (
Winter et al. 2017). Though the same willingness to ride scale was not utilized, research by Dong, DiScenna, and Guerra found that males are more willing to ride in a driverless bus than females, and all individuals are more willing to ride in a driverless bus when there is a transit employee or attendant on board (
Dong et al. 2017). As discussed earlier, consumer perceptions on self-driving vehicles as a whole are mixed, with an undercurrent of hesitation. However, the literature on willingness to utilize self-driving public transportation vehicles is very limited, and even less is understood about the consumer in either situation. Prior studies have mostly focused on age or gender (
Haboucha et al. 2017;
Kyriakidis et al. 2015;
Abraham et al. 2017). The current study utilizes a willingness to ride scale in order to investigate the willingness of participants to let their children ride in automated school buses, and further investigate the individual differences which may influence willingness.
1.8. Affect and the Six Universal Emotions
Affect, or expression of emotion, is known to be inextricably linked to decision-making (
Schwarz 2000;
Sayegh et al. 2004). The six universal emotions, developed by Ekman and Friesen (
Ekman et al. 1971) are a common conceptualization of affect used in research, and are anger, disgust, fear, happiness, sadness and surprise. Prior research has used pictorial representations (see
Figure 1) of these emotions in order to gauge type and level of affect in participants. The aim has been to decide if any of the six universal emotions can help explain public perception (
Babin and Attaway 2000;
Baker and Cameron 1996;
Winter et al. 2014). Rice and Winter used Ekman and Friesen’s (
Ekman et al. 1971) six universal emotions in order to investigate which, if any, of the six mediated the relationship between automation in an aircraft cockpit and passenger willingness to fly; they found that several emotions did mediate between the two variables (
Rice and Winter 2015). Specifically, the researchers found effects for fear, anger and happiness, indicating that participants were less happy about the autopilot condition, more fearful, and angrier. The current research follows the same research paradigm, in attempting to use the six universal emotions in order to understand consumer willingness to fly or ride. However, in this context, the six universal emotions are used to gauge parent reactions to their children riding in driverless school buses. One prior study to our knowledge has focused on the influence of emotions on willingness to use self-driving vehicles, finding that women are influenced by more negative emotions about self-driving cars, and males are more influenced by positive emotions about self-driving vehicles (
Hohenberger et al. 2016).
2. Current Study
There has been quite a bit of research lately focusing on consumer willingness to fly (
Winter et al. 2015;
Rice and Winter 2015) and ride in various vehicles (
Winter et al. 2017). In these studies, affect is often cited as a mediator, where affect refers to the individual’s emotional response to the hypothetical situation provided. The most relevant study for our purposes was conducted by Winter et al., whereby they found that affect mediates whether people are willing to ride in ambulances (
Winter et al. 2017). There are, however, some missing gaps that need to be filled. One of them is determining how willing consumers are to have others get on board with driverless vehicles and another is how people feel about driverless school buses. The current paper attempts to fill both these gaps. Across two studies, we had participants rate their willingness to let their child ride in a driverless school bus, and we measured how gender and nationality affected that willingness. We also measured affect in order to determine which, if any, emotion mediated participants’ willingness to let their child ride in a driverless school bus. We hypothesized the following for Study 1:
Hypothesis 1 (H1). Participants will be less willing to allow their children to ride in driverless school buses compared to traditional school buses with a human driver.
3. Methods—Study 1
Study 1 was designed in order to provide an initial analysis of individual willingness to let children ride in a driverless school bus compared to willingness to let children ride in a traditional school bus with a human driver. The researchers first wanted to investigate whether or not individuals would differ in willingness between the conditions before investigating any individual differences (e.g., gender or nationality, as discussed in study two) which may influence that willingness.
3.1. Participants
Fifty (25 females) people took part in the study. The mean age was 36.22 (
SD = 11.59). All participants were recruited from the United States via a convenience sample using Amazon’s
® Mechanical Turk
® (MTurk). MTurk provides a source of participants who can complete human intelligence tasks in exchange for monetary compensation. Prior research has shown that data from MTurk is as reliable as standard laboratory data (
Buhrmester et al. 2011;
Germine et al. 2012;
Paolacci et al. 2010).
3.2. Materials and Procedure
Participants were first given an electronic consent form to sign, after which they read instructions about the study. They were then presented with one of two hypothetical scenarios in which the school bus driver was either a human or autopilot. In one condition, they were told, “Imagine a situation where your child has no other option of getting to school other than riding on the public school bus. The ride is about 30 min long and there are about 40 children on the bus along with your child. This school bus is driverless; that is, it has no human driver and is fully auto-piloted.” In another condition, the driver was a traditional licensed human driver.
After reading the scenario, participants read directions which instructed them to fill out a 7-tem Willingness to Ride Scale (see
Appendix A) that was previously validated by Winter, Rice, Keebler and Mehta (
Winter et al. 2017). All items were positively worded and participants responded to on a 5-point Likert scale from Strongly Disagree (−2) to Strongly Agree (2) with a zero neutral option. The 7 items in the Willingness to Ride Scale were randomized per participant. Upon completion, participants were debriefed, paid through MTurk, and exited the online survey.
3.3. Design
We used a within-participants design, whereby all participants received both conditions.
4. Results—Study 1
Prior to the data analysis, the Willingness to Ride scale was subjected to a Cronbach’s Alpha test in order to ensure high reliability of the data. The results of the two conditions were 0.97 and 0.98, respectively, indicating very high consistency in the data.
A repeated measures t-test was conducted to test the differences between group means. This test showed a statistically significant difference between the human driver (M = 0.68, SD = 1.06) and autopilot configurations (M = −0.51, SD = 1.32), t(49) = 6.01, p < 0.001, d = 0.86.
Discussion—Study 1
The purpose of Study 1 was to determine if consumers are more or less willing to have their child ride in a driverless school bus compared to one driven by a traditional licensed human driver. We predicted that participants would score lower on the willingness to ride scale when the bus was operated by a driverless autopilot. The data strongly supported this hypothesis, with a large effect size seen between the two conditions. One limitation of the study was that we used a within-participants design. This may have allowed participants to hypothesis-guess and change their answers accordingly. This limitation is addressed in Study 2.
5. Introduction—Study 2
In Study 1, we determined if a driverless school bus would cause parents to be less willing to allow their child on board compared to a school bus driven by a traditional licensed human driver. The results clearly showed that this was the case. The purpose of Study 2 was three-fold. First, we wanted to test whether the findings from Study 1 were reproducible, using a fully between-subjects design. Second, we wanted to see if those findings would vary based on Gender and Nationality of the participants. Third, we wanted to see which, if any, emotions mediated the relationship between the Type of Driver and willingness to ride. We hypothesized the following:
Hypothesis 1 (H1). Participants will be less willing to allow their children to ride in driverless school buses compared to traditional school buses with a human driver, replicating the results of study one.
Hypothesis 2 (H2). Willingness to ride ratings will be affected by gender.
Hypothesis 3 (H3). Willingness to ride ratings will be affected by the nationality of the participant.
Hypothesis 4 (H4). There will be interactions in the data.
Hypothesis 5 (H5). The relationship between the IVs and DV will be mediated by at least one emotion.
5.1. Methods—Study 2
Study 2 was designed to further gauge individual willingness to let children ride in a driverless school bus compared to willingness to let children ride in a traditional school bus with a human driver. The researchers wanted to investigate whether or not gender or nationality would significantly influence willingness.
5.2. Participants
Six hundred and ten (274 females) people took part in the study. The mean age was 32.49 (SD = 9.13). All participants were recruited from India and the United States via a convenience sample using Amazon’s® Mechanical Turk® (MTurk).
5.3. Materials and Procedure
Study 2 was identical to Study 1 with the following two exceptions. First, we collected data from both genders and across two nationalities (USA and India). Thus, there were three independent variables. The first variable (type of driver) was manipulated to be either a traditional licensed human driver or a driverless autopilot. The second variable was Gender, while the third variable was Nationality of the participant (USA or India).
Second, following the reading of the scenario, participants were asked to fill out a specific emotions scale which was based on images of facial expressions (see
Figure 1) of the six universal emotions described by Ekman and Friesen (
Ekman et al. 1971). Each image was presented to the participants in random order. They were asked, “Based on the scenario above, how strongly do you feel like the image shown?” Participants then manipulated a slider that had scale ends of “I do not feel this way at all” to “I extremely feel this way”. The slider scored the responses on a numerical scale from 0—10; however, participants were not aware of this. This same methodology has been successfully used multiple times in the past (
Rice and Winter 2015;
Cremer and Rice 2015;
Rice et al. 2015c).
5.4. Design
Participants were randomly assigned to one of the two manipulated conditions (Type of Driver). The variables of Gender and Nationality were also between-participants. Thus, we used a between-participants three-way factorial design, with mediation.
6. Results—Study 2
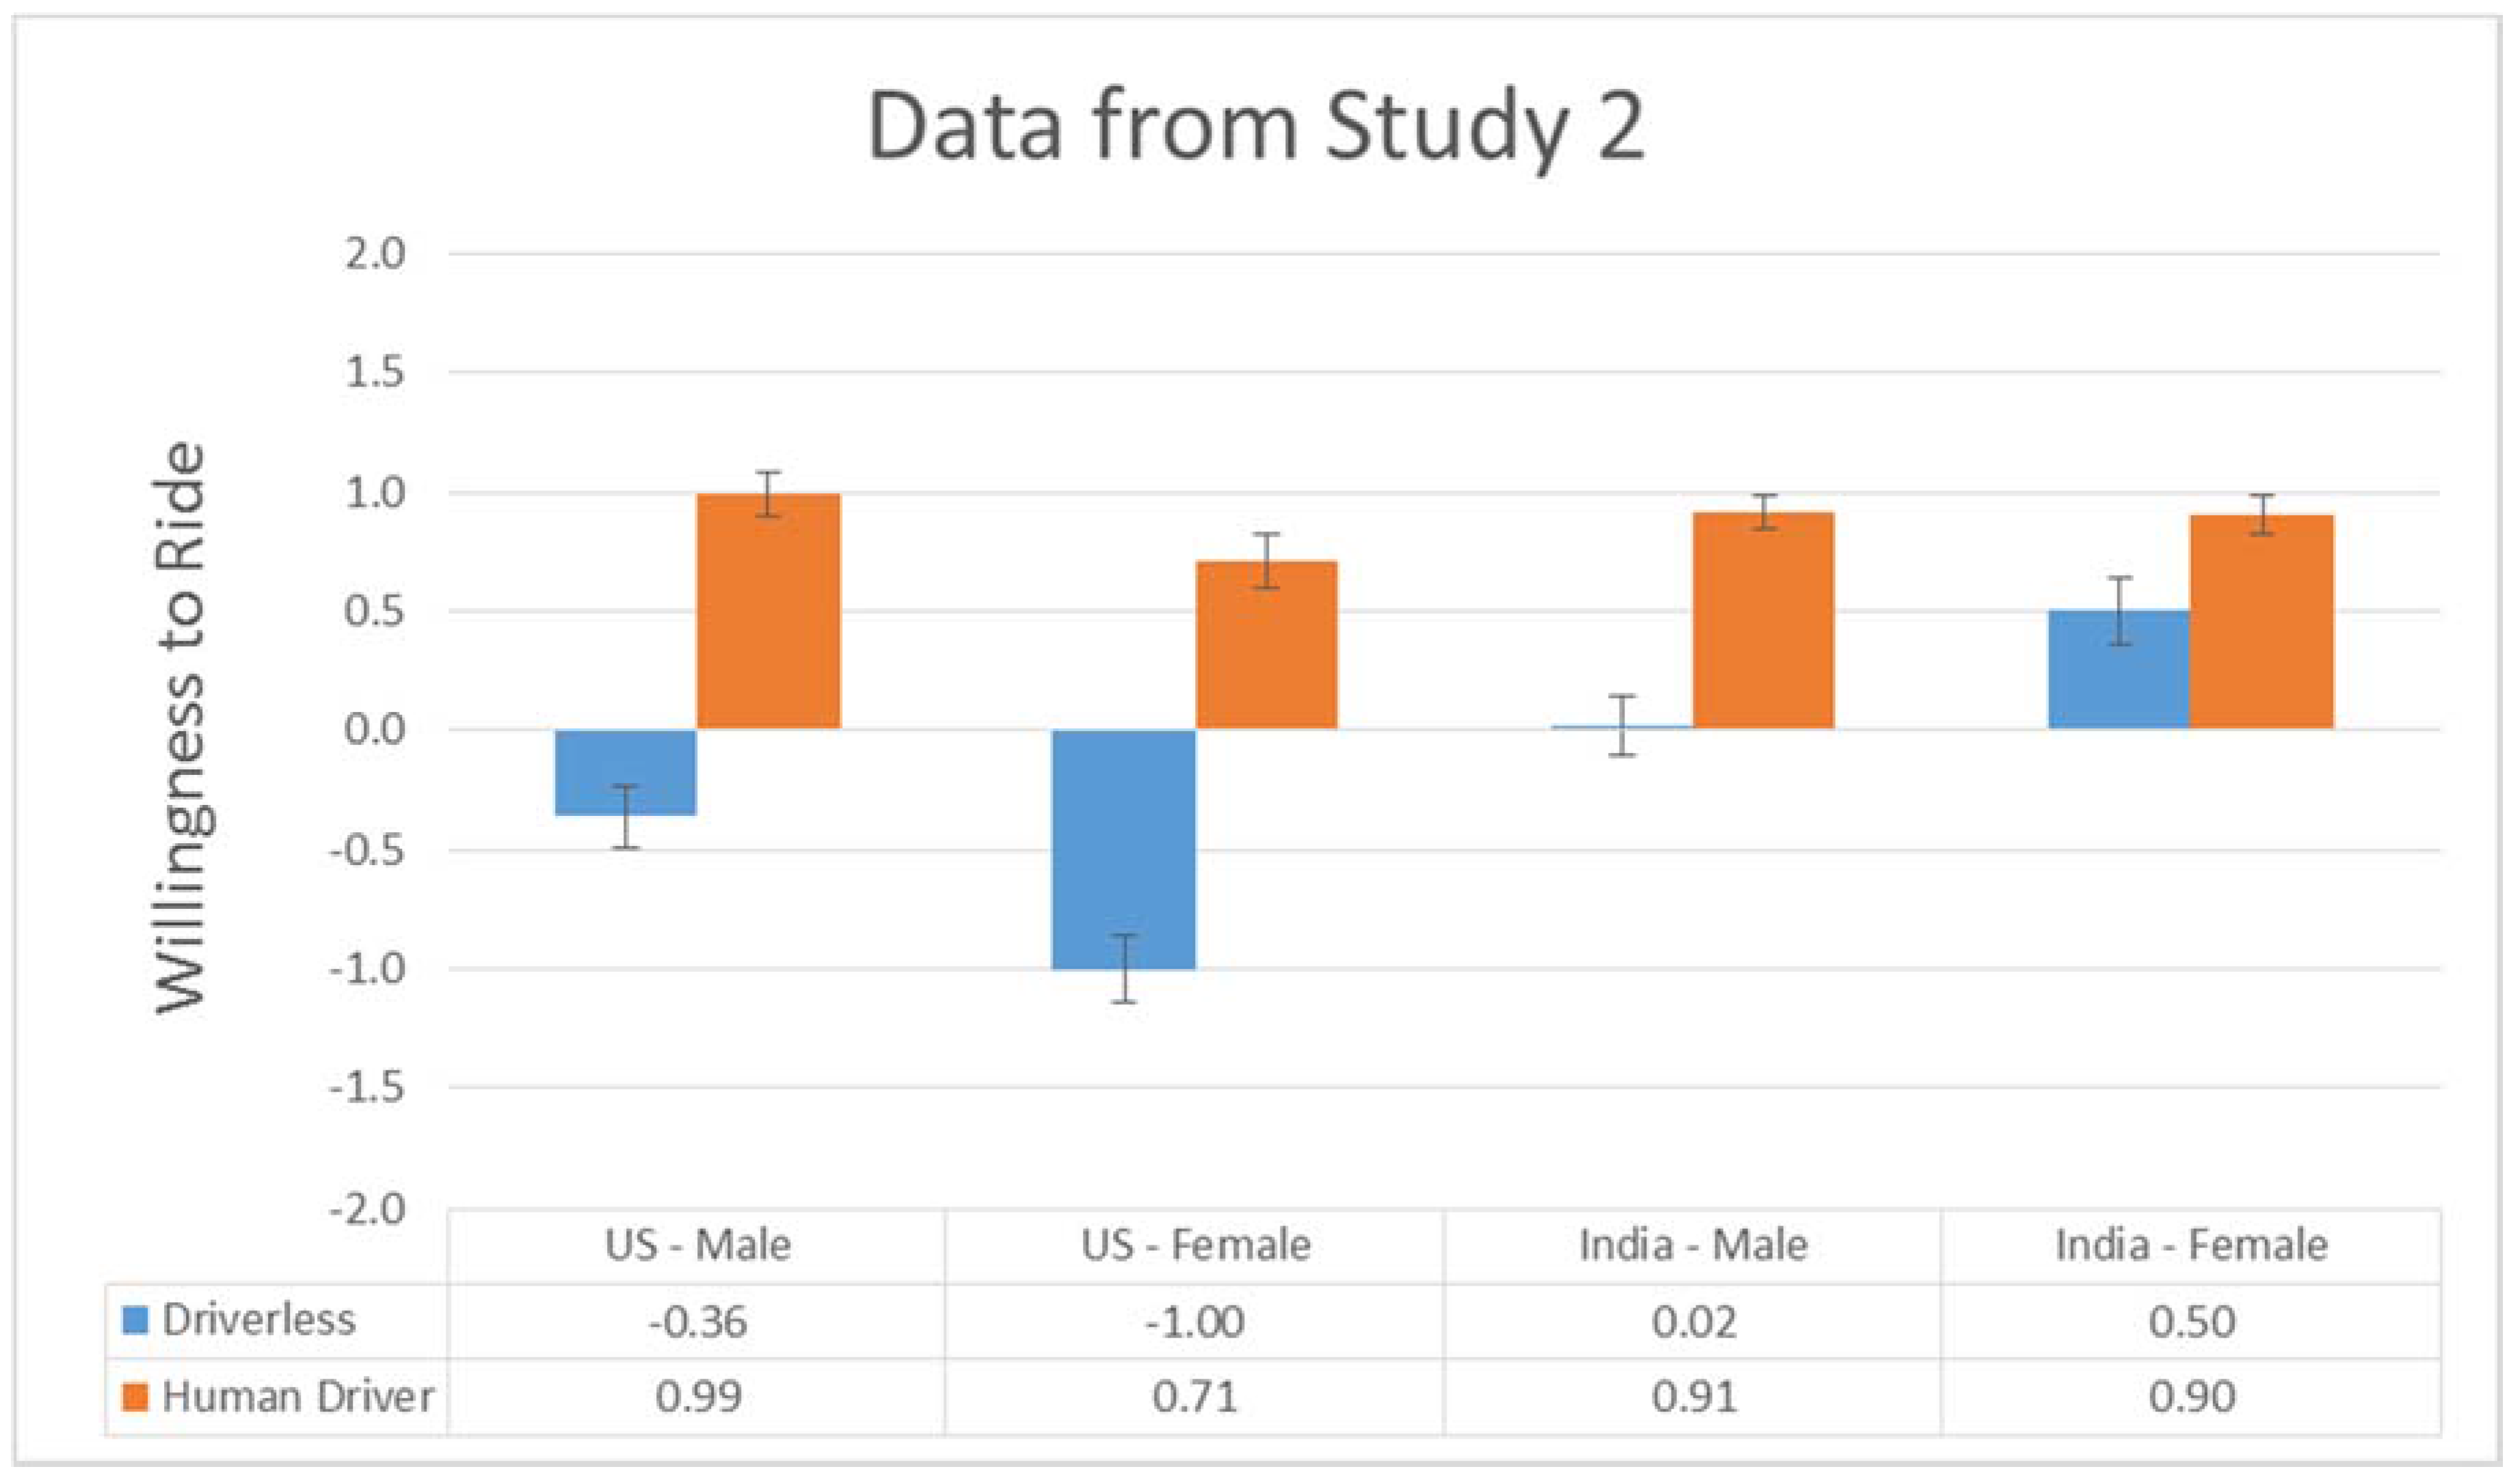
Prior to the data analysis, the Willingness to Ride (WTR) scale was subjected to a Cronbach’s Alpha test in order to ensure high reliability of the data. The results of the conditions ranged from 0.85 to 0.98, indicating very high consistency in the data. The data for WTR are presented in
Figure 2.
The WTR data was subjected to a three-way analysis of variance with Type of Driver, Gender, and Nationality as the three factors. There was a significant main effect of Type of Driver, F(1, 602) = 176.92, p < 0.001, partial-eta-squared = 0.23, and a significant main effect of Nationality, F(1, 602) = 37.41, p < 0.001, partial-eta-squared = 0.06. There was not a significant main effect of Gender, F(1, 602) = 2.02, p = 0.156, partial-eta-squared = 0.003. These main effects were qualified by a significant interaction between Type of Driver and Nationality, F(1, 602) = 29.12, p < 0.001, partial-eta-squared = 0.05, and a significant interaction between Nationality and Gender, F(1, 602) = 18.12, p < 0.001, partial-eta-squared = 0.03. Finally, there was a significant three-way interaction between Nationality, Gender, and Type of Driver, F(1, 602) = 6.78, p < 0.01, partial-eta-squared = 0.01.
The differences between the driverless and human driver conditions were tested for each of the four country and gender combinations. The means of each group can be found in
Figure 2. For US males, the difference of 1.35 was statistically significant,
t(156) = −8.266,
p < 0.001. For US females, the difference of 1.71 was statistically significant,
t(149) = −9.656,
p < 0.001. For Indian males, the difference of .89 was statistically significant,
t(176) = −6.453,
p < 0.001. For Indian females, the difference of 0.40 was statistically significant,
t(121) = −2.304,
p = 0.023.
6.1. Mediation Analyses
6.1.1. US Males
The standardized regression coefficient between type of driver and affect was statistically significant, as was the relationship between affect and willingness to ride. The significance of this indirect effect was tested using bootstrapping procedures (
Hayes 2013) with 10,000 bootstrapped samples. For Fear, the bootstrapped 95% confidence interval ranged from −0.75 to −0.18. For Happiness, the bootstrapped 95% confidence interval ranged from −0.43 to −0.11. For Sadness, the bootstrapped 95% confidence interval ranged from −0.30 to −0.02. Thus, the indirect effect was statistically significant and there was mediation for Fear, Happiness, and Sadness. Thus, when US males think about the driverless condition, they exhibit fear and sadness, but exhibit happiness when they think about the human driver condition.
6.1.2. US Females
The standardized regression coefficient between type of driver and affect was statistically significant, as was the relationship between affect and willingness to ride. The significance of this indirect effect was tested using bootstrapping procedures (
Hayes 2013) with 10,000 bootstrapped samples. For Anger, the bootstrapped 95% confidence interval ranged from −0.75 to −0.04. For Happiness, the bootstrapped 95% confidence interval ranged from −0.65 to −0.07. Thus, the indirect effect was statistically significant and there was mediation for Anger and Happiness. Thus, when US females think about the driverless condition, they exhibit anger, but exhibit happiness when they think about the human driver condition.
6.1.3. Indian Males
The standardized regression coefficient between type of driver and affect was statistically significant, as was the relationship between affect and willingness to ride. The significance of this indirect effect was tested using bootstrapping procedures (
Hayes 2013) with 10,000 bootstrapped samples. For Happiness, the bootstrapped 95% confidence interval ranged from −0.51 to −0.15. For Surprise, the bootstrapped 95% confidence interval ranged from −0.26 to −0.04. Thus, the indirect effect was statistically significant and there was mediation for Happiness and Surprise. Thus, when Indian males think about the driverless condition, they exhibit surprise, but exhibit happiness when they think about the human driver condition.
6.1.4. Indian Females
The standardized regression coefficient between type of driver and affect was statistically significant, as was the relationship between affect and willingness to ride. The significance of this indirect effect was tested using bootstrapping procedures (
Hayes 2013) with 10,000 bootstrapped samples. For Happiness, the bootstrapped 95% confidence interval ranged from −0.36 to −0.01. Thus, the indirect effect was statistically significant and there was mediation for Happiness. This indicates that when Indian females think about the human driver condition, they exhibit happiness.
6.2. Discussion—Study 2
The purpose of Study 2 was to examine how Type of Driver, Gender, and Nationality affected participants’ willingness to allow their child to ride in a school bus. The first hypothesis was strongly supported by the data and replicated the findings from Study 1. It is clear that, in general, participants are less willing to let their children ride in driverless school buses compared to school buses driven by traditional licensed human drivers. The second and third hypotheses were also supported by the data; however, significant interactions qualify these findings. As
Figure 2 reveals, US females were much further apart in WTR scores based on the type of driver compared to the other groups, while Indian females were not very far apart at all. Both male groups were moderately far apart as a function of type of driver. On average, US participants gave lower WTR scores compared to their Indian counterparts, but this was only significantly noticeable in the driverless conditions. The final hypothesis was also supported by the data. Emotions mediated all four of the Gender/Nationality combinations.
7. General Discussion
The purpose of the current set of experiments was to examine how gender and nationality can affect participants’ willingness to let their child ride in a driverless or traditional school bus. We predicted that participants would be less willing to let their child ride in a driverless school bus compared to a school bus driven by a traditional licensed human driver. We also predicted that these effects would vary based on participants’ gender and nationality. Lastly, we predicted that these findings would be mediated by at least one emotion.
All of our hypotheses were supported by the data. Across two experiments, the data reveal that participants are generally less willing to allow their child to ride in the driverless school bus compared to the traditional alternative. This result is line with previous studies in aviation (
Winter et al. 2015;
Rice and Winter 2015) and emergency medical services (
Winter et al. 2017) that have reported mild to moderate consumer unwillingness to fly or ride in driverless vehicles.
These findings varied as a function of gender and nationality, with significant and interesting interactions in the data. In all the gender/nationality groups, there was a moderately positive response to the traditional human driver, but most groups dropped dramatically for the driverless option. We note that US females were particularly opposed to the driverless school bus option, while Indian females were actually positive about it. US and Indian males were much closer with respect to WTR scores compared to their female counterparts. While Americans, in general, were more negative about the driverless option compared to their Indian counterparts, this distinction was greatest for the females. Though this is supported greatly by the literature on male and female risk-aversion, the reason for the strong nationality differences is not as clear. Potential reasons may include community-mindedness towards public transportation, differential marketing and media attention to driverless vehicles, or may be more focused on the differences between self-driving automobiles and the current methods of school transportation in those respective countries, as well as ease of current transportation. These potential reasons should be explored further, and are expanded upon in our limitation and future direction section.
Our last hypothesis was based on mediation, and the data strongly supported an affective explanation for the data. In all four gender/nationality groups, there was mediation for at least one emotion. Happiness was the only emotion that mediated in all four conditions, and it can be presumed that the human driver option made people happier than the driverless alternative. The negative emotions ranged from Fear and Sadness for US male participants. This finding replicates that found by Winter et al. who noted that US males reported fear when considering riding in a driverless ambulance (
Winter et al. 2017). In fact, fear and happiness were the same emotions reported in that study. In contrast, Indian males reported happiness and surprise. It may be that Indians are less fearful of new technology and are more surprised by it than fearful. More research should examine this finding using different paradigms.
Female participants from the United States showed mediation for happiness and anger. The latter emotion also showed up in Winter et al.’s study for US females (
Winter et al. 2017). In contrast, Indian females showed no negative emotions at all. Instead, happiness was the sole mediator for that group of participants. It is surprising that they were positive about both the human driver and the driverless option.
7.1. Theoretical Findings
In this study, we discovered parents are not very willing to let their children ride in an automated school bus. Compared to males and females in India, Americans are less willing to let their children ride automated school buses. Also, females in the US were less willing than males and had a much larger gap between their WTR ranges. Females have been shown to be less willing to engage in risky behaviors compared to males (
Charness and Gneezy 2012;
Henwood et al. 2008;
Schubert et al. 1999). Women overall are not as aggressive as males and are more cautious when making a decision where risk is involved (
Powell and Ansic 1997). For many years females were the primary caregivers of children so they are more protective than males and more averse to particular situations, which may result in a negative outcome (
Harrant and Vaillant 2008).
Further research should be conducted to understand a person’s willingness to trust in automation. According to
Lee and See (
2004), in order for individuals to trust automation we must put ourselves into situations that allow automation to control certain actions. Because the driverless technology is so new to consumers they are unsure of the reliability of the technology, which may account for consumers having less trust (
Dzindolet et al. 2003). More studies should be conducted in the future as driverless technology continues to be accessible to consumers.
Nationality and cultural differences play a role in determining a consumer’s willingness in putting their trust in new automated systems. Western cultures share a more individualistic view which influences people to question things more frequently which can provide less trust in automation (
Rice et al. 2014). Eastern cultures that are more collectivist focus more on what’s best for the entire group or team.
7.2. Practical Applications
As automation increases throughout society, and replaces jobs previously held by humans, it is important to consider the public’s perceptions and feelings toward new automation. Driverless (or autonomous) vehicle technology is growing in popularity, and it’s very possible that this technology may extend to school buses, as well. Our current two studies demonstrate that, in general, Americans are less willing to allow their children to ride a driverless (or fully autonomous) school bus compared to other nationalities. Americans view driverless school bus technology with fear and sadness, thus they do not want to put their loved ones in a potentially dangerous situation that invokes fear. This finding is in line with studies showing that Americans were less willing to ride in an automated ambulance (
Winter et al. 2017) and less willing to allow their children to ride an autonomous airplane (
Rice et al. 2014). For the immediate future, we recommend school bus companies refrain from implementing driverless school buses, as this could cause a lot of concern and fear in parents, and they may search for alternative means to bring their child to school. However, the technology for driverless vehicles does exist and is being implemented into vehicle designs by several car companies (e.g., Google, Tesla, etc.). The car companies will pave the way for driverless vehicles and allow the public to become accustomed with the technology. Once consumers have accepted personal driverless vehicles on the road, school bus companies can then start considering whether or not to automate school buses.
7.3. Limitations and Recommendations for Future Research
It is important to understand the limitations, which still exist within these data. Therefore, further investigation is needed in order to verify the findings of this research. First, this study used a convenience sample of participants from MTurk. This restricts the generalizability of the findings to those types of individuals that complete online human intelligence tasks in the US and in India. We also note that these two populations (US and India online users) may differ in socioeconomic status, and as such we caution generalizations of comparison specifically. Previous research has shown that in the U.S., MTurk data is as reliable as standard laboratory data, and in many cases may be more generalizable than standard laboratory research which relies on university student subject pools (
Buhrmester et al. 2011;
Germine et al. 2012;
Paolacci et al. 2010); however, it is simply not possible to gather a completely random sample of Americans, and thus external validity is always an issue. While it is certainly the case that Indian users of MTurk are more representative of the population as a whole compared to university subject pools in India, we again note the issues with external validity here. Also, we note that any comparisons between the two countries should be tested in future research using different samples for replication purposes.
The second factor that may play a significant limitation in our results is the failure to mention the presence of a human bus monitor, which has become more prevalent in American culture over the past decade. This addition to the hypothetical scenario could potentially have a positive affect towards Americans willingness to allow their children to ride in the driverless bus condition. Furthermore, the use of a hypothetical scenario limits how participants may respond compared to being faced with a real-world scenario. In addition, the hypothetical scenario was specific in terms of how long (in minutes) the bus ride was, which may not be equivalent across cultures, or individuals within a culture. In the United States, a 30-min ride may encompass a much larger distance and higher speeds compared to a 30-min ride in India, depending on the locale. Future research should address comparisons between cities and rural areas that have equivalent populations, traffic densities, and jurisdictional scales.
The hypothetical scenario, in addition, only captured surface-level perceptions and basic demographic info. Further understanding could be gathered if more background information about participant familiarity with self-driving vehicles, or reasons for or against willingness to ride were discussed (either in a quantitative or qualitative format. In order to prevent generalizations about cultural attitudes, the reasoning behind willingness should be explored. Finally, the location of where the bus ride takes place was limited to only two countries. Further research should expand this research to other cultures or specific regions within countries, in order to better understand consumer perceptions.
8. Conclusions
The purpose of the current study was to determine a parent’s willingness to allow a child to ride in a fully autonomous school bus. The findings from Study 1 strongly supported our hypothesis; parents are less willing to allow their child to ride in a school bus when operated autonomously, compared to when a human driver is in control. In Study 2, parents still showed less willingness to allow a child to ride an automated school bus compared to a licensed human driver. The data shows a significant interaction for WTR ratings being affected by gender and the nationality of the participant. US females’ WTR ratings between a child riding in an autonomous school bus and a human driving a school bus were farther apart than the other groups. Americans also had typically lower WTR scores than Indian participants in the driverless conditions. Unhappiness mediated the relationship in all four conditions, with various other emotions playing some part in some conditions. The data from this study provides information about automated systems and what variables (gender, nationality) could have an effect on our decision-making processes to allow our children to ride on automated school buses.
