Pyrosequencing Reveals the Predominance of Pseudomonadaceae in Gut Microbiome of a Gall Midge

 ,
,
Abstract
:1. Introduction
2. Results and Discussion

 %Similarity a %Similarity a |  | Hfg1 | Hfg2 | Hfg3 |
|---|---|---|---|---|
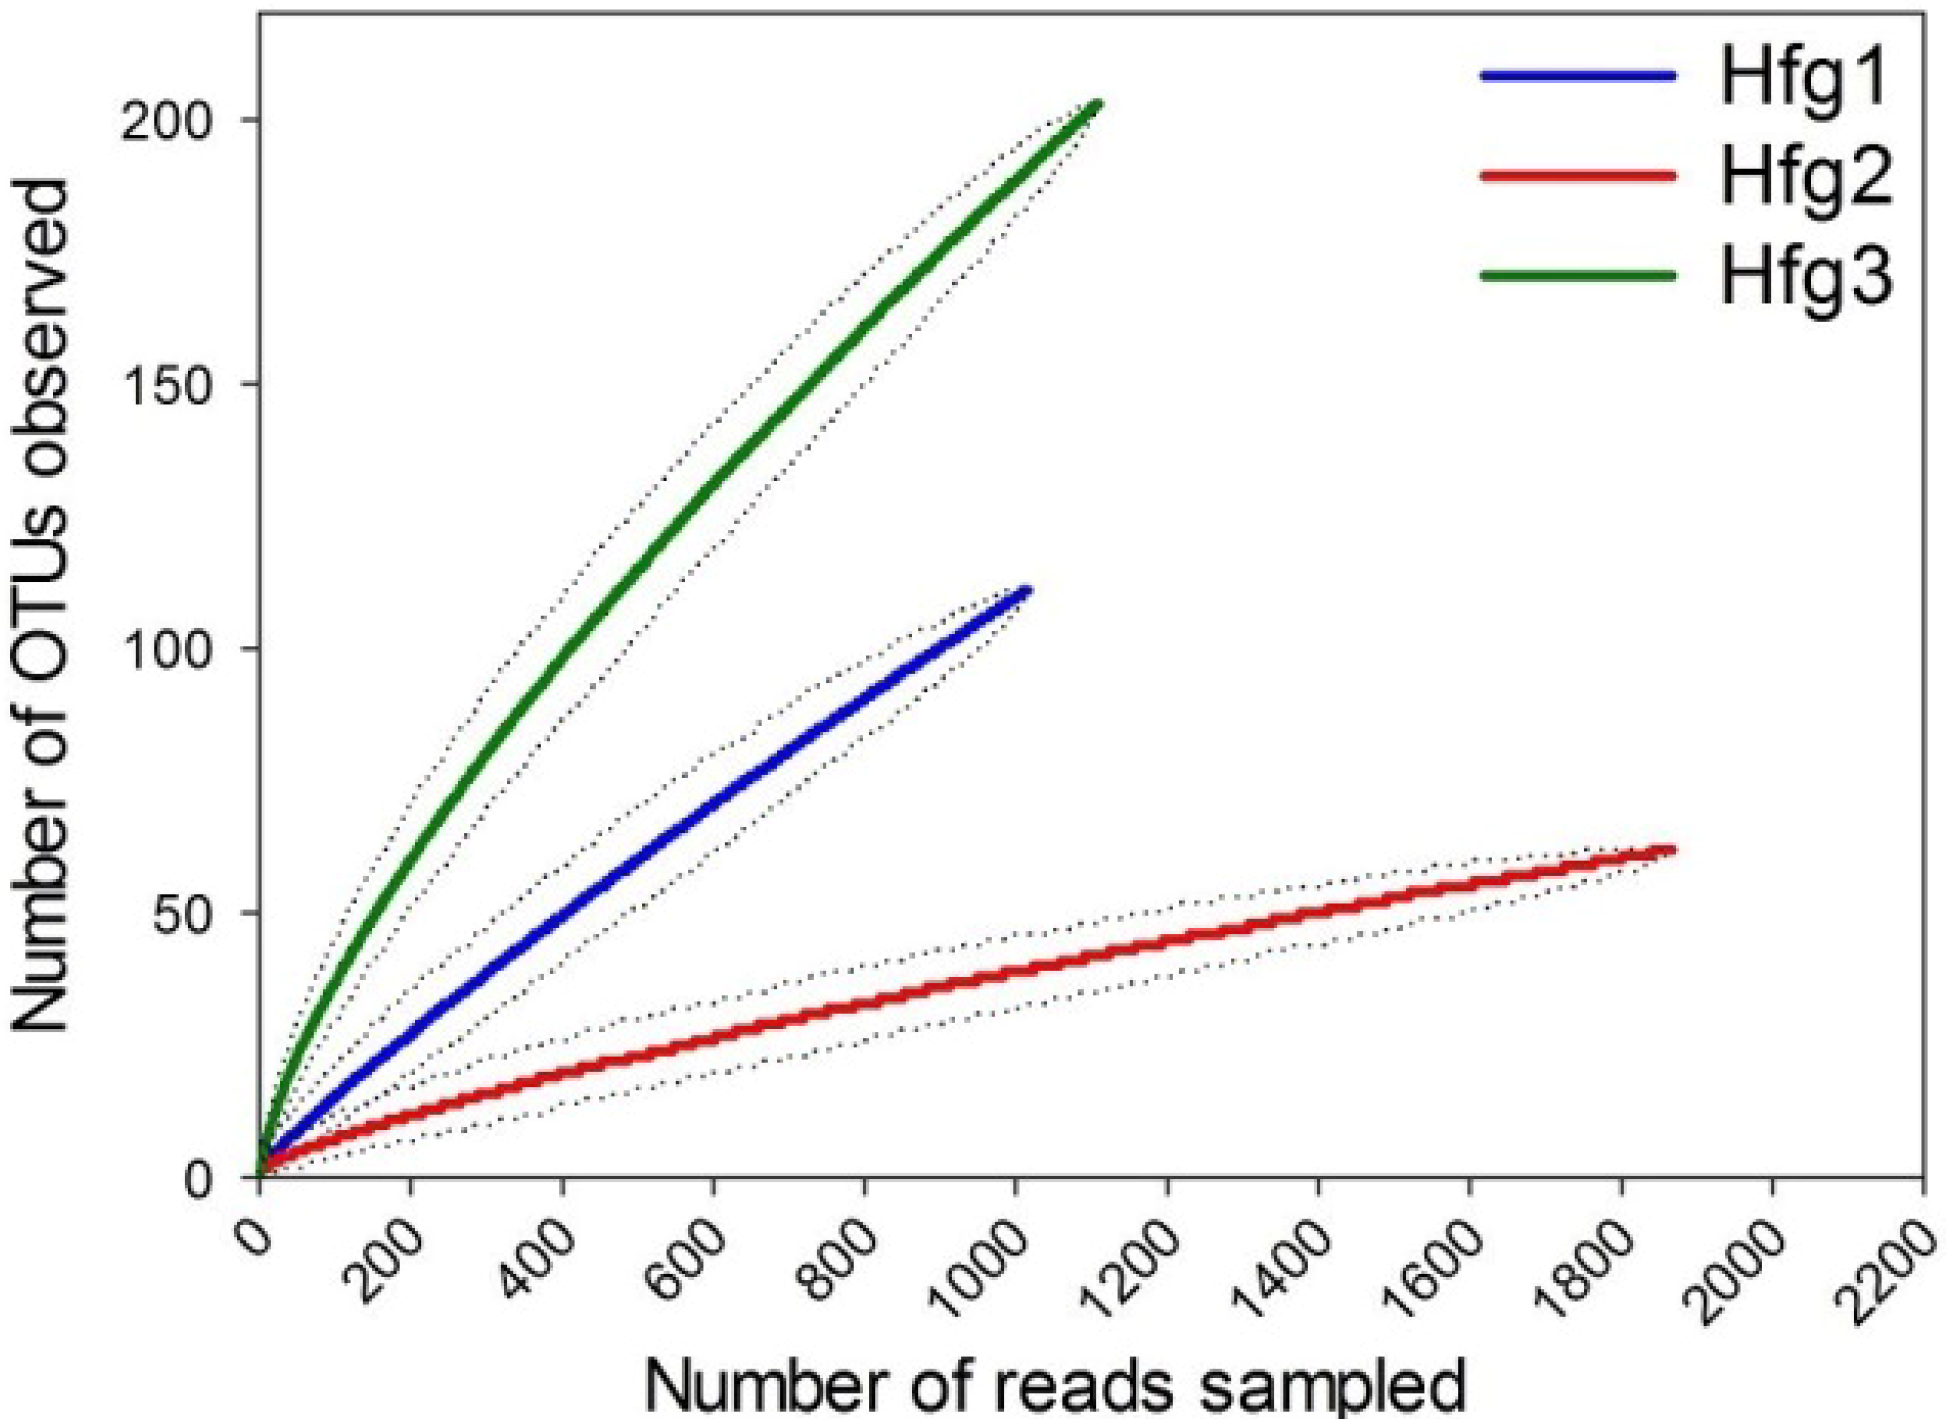
| ≥99 | Coverage (%) | 92.0 | 94.6 | 81.8 |
| Ace c | 1380.9 (1156.2, 1657.1) | 449.2 (331.8, 645.3) | 3004.3 (2627.2, 3442.3) | |
| Chao c | 433.1(331.8, 599.9) | 410.1(304.9, 590.2) | 1284.1 (917.1, 1867.4) | |
| ≥97 | Coverage (%) | 95.4 | 97.7 | 87.8 |
| Ace | 440.0 (323.1, 621.1) | 201.9 (132.8, 347.2) | 1411.7 (1196.9, 1673.2) | |
| Chao | 207.3 (162.9, 289.0) | 187.6 (122.8, 332.0) | 767.8 (537.6, 1159.2) | |
| ≥95 | Coverage (%) | 96.9 | 98.5 | 90.1 |
| Ace | 182.8 (126.7, 299.7) | 128.7 (82.9, 234.8) | 1132.9 (958.5, 1346.1) | |
| Chao | 153.4 (112.0, 241.2) | 103.1 (70.0, 186.2) | 521.7 (375.7, 774.5) | |
| ≥90 | Coverage (%) | 98.5 | 99.2 | 93.8 |
| Ace | 118.7 (88.6, 170.0) | 66.1 (41.6, 138.4) | 463.8 (375.6, 582.9) | |
| Chao | 73.6 (56.1,121.4) | 80.0 (44.0, 202.5) | 281.3 (206.6, 423.0) |


3. Experimental Section
3.1. Insect and Infestation
3.2. Gut Tissue and DNA Preparation
3.3. Template Preparation and Pyrosequencing
| Primer Name | Primer Sequence | Targeted Sample |
|---|---|---|
| U529R-FC-A33 | 5'-GCCTCCCTCGCGCCATCAGTGATGACCGCGGCKGCTGGC | Hfg1 |
| U529R-FC-A40 | 5'-GCCTCCCTCGCGCCATCAGTCACTACCGCGGCKGCTGGC | Hfg2 |
| U529R-FC-A90 | 5'-GCCTCCCTCGCGCCATCAGATACGACCGCGGCKGCTGGC | Hfg3 |
| Primer A | 5'-GCCTCCCTCGCGCCATCAG | |
| U529R | 5'-ACCGCGGCKGCTGGC | |
| U341F-FC-B | 5'-GCCTTGCCAGCCCGCTCAGCCTACGGGRSGCAGCAG | |
| Primer B | 5'-GCCTTGCCAGCCCGCTCAG | |
| U341F | 5'-CCTACGGGRSGCAGCAG |
3.4. Sequence Processing and Analysis
3.5. Estimation of Pseudomonas 16S rDNA Level in Hessian Fly Developmental Stages
Supplementary Files
Supplementary File 1Acknowledgments
Author Contributions
Conflicts of Interest
References
- Dillon, R.; Dillon, V. The gut bacteria of insects: nonpathogenic interactions. Annual Reviews in Entomology 2004, 49, 71–92. [Google Scholar] [CrossRef]
- Engel, P.; Moran, N.A. The gut microbiota of insects–diversity in structure and function. FEMS Microbiol. Rev. 2013, 37, 699–735. [Google Scholar] [CrossRef]
- Holmes, E.; Nicholson, J. Variation in gut microbiota strogly influences individual rodent phenotypes. Toxicological Sciences 2005, 87, 1–2. [Google Scholar] [CrossRef]
- Chapman, R.F. The Insects: Structure And Function; Cambridge University press: Cambridge, UK, 1998. [Google Scholar]
- Buchner, P. Endosymbiosis of Animals with Plant Microorganims; John Wiley & Sons: Chichester, UK, 1965. [Google Scholar]
- Hansen, A.K.; Moran, N.A. The impact of microbial symbionts on host plant utilization by herbivorous insects. Mol. Ecol. 2013, 23, 1473–1496. [Google Scholar] [CrossRef]
- Gagne, R.; Hatchett, J. Instars of the Hessian fly (Diptera: Cecidomyiidae). Ann. Entomol. Soc. Am. 1989, 82, 73–79. [Google Scholar]
- Ananthakrishnan, T.N. Biology of gall insects; Oxford and IBH: New Delhi, India, 1984. [Google Scholar]
- Pauly, P.J. Fighting the Hessian fly: American and British responses to insect invasion 1776–1789. Environ. Hist. 2002, 7, 485–507. [Google Scholar] [CrossRef]
- Harris, M.; Stuart, J.; Mohan, M.; Nair, S.; Lamb, R.; Rohfritsch, O. Grasses and gall midges: plant defense and insect adaptation. Annu. Rev. Entomol. 2003, 48, 549–577. [Google Scholar] [CrossRef]
- Harris, M.; Freeman, T.; Rohfritsch, O.; Anderson, K.; Payne, S.; Moore, J. Virulent Hessian fly (Diptera: Cecidomyiidae) larvae induce a nutritive tissue during compatible interactions with wheat. Ann. Entomol. Soc. Am. 2006, 99, 305–316. [Google Scholar] [CrossRef]
- Boosalis, G. Hessian fly in relation to the development of crown and basal stem rot of wheat. Phytopathology 1954, 44, 224–229. [Google Scholar]
- Mittapalli, O.; Shukle, R.H.; Sardesai, N.; Giovanini, M.P.; Williams, C.E. Expression patterns of antibacterial genes in the Hessian fly. J. Insect Physiol. 2006, 52, 1143–1152. [Google Scholar] [CrossRef]
- Bansal, R. Hessian Fly Associated Microbes: Dynamics, Transmission And Essentiality; ProQuest, UMI Dissertation Publishing: Ann Arbor, MI, USA, 2010. [Google Scholar]
- Bansal, R.; Hulbert, S.; Schemerhorn, B.; Reese, J.C.; Whitworth, R.J.; Stuart, J.J.; Chen, M. Hessian fly-associated bacteria: transmission, essentiality, and composition. PloS One 2011, 6, e23170. [Google Scholar]
- Warnecke, F.; Luginbühl, P.; Ivanova, N.; Ghassemian, M.; Richardson, T.H.; Stege, J.T.; Cayouette, M.; McHardy, A.C.; Djordjevic, G.; Aboushadi, N. Metagenomic and functional analysis of hindgut microbiota of a wood-feeding higher termite. Nature 2007, 450, 560–565. [Google Scholar]
- Cox-Foster, D.L.; Conlan, S.; Holmes, E.C.; Palacios, G.; Evans, J.D.; Moran, N.A.; Quan, P.; Briese, T.; Hornig, M.; Geiser, D.M. A metagenomic survey of microbes in honey bee colony collapse disorder. Science 2007, 318, 283–287. [Google Scholar] [CrossRef]
- Moran, N.A.; Hansen, A.K.; Powell, J.E.; Sabree, Z.L. Distinctive gut microbiota of honey bees assessed using deep sampling from individual worker bees. PLoS One 2012, 7, e36393. [Google Scholar]
- Neefs, J.; Van de Peer, Y.; De Rijk, P.; Goris, A.; De Wachter, R. Compilation of small ribosomal subunit RNA sequences. Nucleic Acids Res. 1991, 19, 1987–2015. [Google Scholar] [CrossRef]
- Fox, G.E.; Stackebrandt, E.; Hespell, R.B.; Gibson, J.; Maniloff, J.; Dyer, T.A.; Wolfe, R.S.; Balch, W.E.; Tanner, R.S.; Magrum, L.J.; et al. The phylogeny of prokaryotes. Science 1980, 209, 457–463. [Google Scholar]
- Huse, S.M.; Dethlefsen, L.; Huber, J.A.; Welch, D.M.; Relman, D.A.; Sogin, M.L. Exploring microbial diversity and taxonomy using SSU rRNA hypervariable tag sequencing. PLoS genetics 2008, 4, e1000255. [Google Scholar] [CrossRef]
- Schloss, P.D.; Westcott, S.L.; Ryabin, T.; Hall, J.R.; Hartmann, M.; Hollister, E.B.; Lesniewski, R.A.; Oakley, B.B.; Parks, D.H.; Robinson, C.J. Introducing mothur: open-source, platform-independent, community-supported software for describing and comparing microbial communities. Appl. Environ. Microbiol. 2009, 75, 7537–7541. [Google Scholar] [CrossRef]
- Tamura, K.; Nei, M. Estimation of the number of nucleotide substitutions in the control region of mitochondrial DNA in humans and chimpanzees. Mol. Biol. Evol. 1993, 10, 512–526. [Google Scholar]
- Tamura, K.; Peterson, D.; Peterson, N.; Stecher, G.; Nei, M.; Kumar, S. MEGA5: molecular evolutionary genetics analysis using maximum likelihood, evolutionary distance, and maximum parsimony methods. Mol. Biol. Evol. 2011, 28, 2731–2739. [Google Scholar] [CrossRef]
- Felsenstein, J. Confidence limits on phylogenies: an approach using the bootstrap. Evolution 1985, 39, 783–791. [Google Scholar] [CrossRef]
- Byers, R.A.; Gallun, R.L. Ability of the Hessian fly to stunt winter wheat: effect of larval feeding on elongation of leaves. J. Econ. Entomol. 1972, 65, 955–958. [Google Scholar]
- Rohfritsch, O. Patterns in gall development. In Biology of insect-induced galls; Shorthouse, J.D., Rohfritsch, O., Eds.; Oxford University Press: Oxford, UK, 1992; pp. 60–86. [Google Scholar]
- Prabhakar, C.S.; Sood, P.; Kanwar, S.S.; Sharma, P.N.; Kumar, A.; Mehta, P.K. Isolation and characterization of gut bacteria of fruit fly, Bactrocera tau (Walker). Phytoparasitica 2013, 41, 193–201. [Google Scholar] [CrossRef]
- Jing, X.; Wong, A.C.; Chaston, J.M.; Colvin, J.; McKenzie, C.L.; Douglas, A.E. The bacterial communities in plant phloem-sap-feeding insects. Mol. Ecol. 2014, 23, 1433–1444. [Google Scholar] [CrossRef]
- Wei, T.; Ishida, R.; Miyanaga, K.; Tanji, Y. Seasonal variations in bacterial communities and antibiotic-resistant strains associated with green bottle flies (Diptera: Calliphoridae). Appl. Microbiol. Biotechnol. 2014, 98, 4197–4208. [Google Scholar] [CrossRef]
- Broderick, N.A.; Robinson, C.J.; McMahon, M.D.; Holt, J.; Handelsman, J.; Raffa, K.F. Contributions of gut bacteria to Bacillus thuringiensis-induced mortality vary across a range of Lepidoptera. BMC Biology 2009, 7, 11. [Google Scholar] [CrossRef]
- Stavrinides, J.; McCloskey, J.K.; Ochman, H. Pea aphid as both host and vector for the phytopathogenic bacterium Pseudomonas syringae. Appl. Environ. Microbiol. 2009, 75, 2230–2235. [Google Scholar] [CrossRef]
- Zhang, F.; Huang, Y.H.; Liu, S.Z.; Zhang, L.; Li, B.T.; Zhao, X.X.; Fu, Y.; Liu, J.J.; Zhang, X.X. Pseudomonas reactans, a bacterial strain isolated from the intestinal flora of Blattella germanica with anti-Beauveria bassiana activity. Environ. Entomol. 2013, 42, 453–459. [Google Scholar] [CrossRef]
- Morales-Jiménez, J.; de León, A.V.; García-Domínguez, A.; Martínez-Romero, E.; Zúñiga, G.; Hernández-Rodríguez, C. Nitrogen-fixing and uricolytic bacteria associated with the gut of Dendroctonus rhizophagus and Dendroctonus valens (Curculionidae: Scolytinae). Microb. Ecol. 2013, 66, 200–210. [Google Scholar]
- Hagen, K.S. Dependence of the olive fly, Dacus oleae, larvae on symbiosis with Pseudomonas savastanoi for the utilization of olive. 1966, 209, 423–424. [Google Scholar]
- Harris, M.; Rose, S. Temporal changes in the egglaying behaviour of the Hessian fly. Entomol. Exp. Appl. 1989, 53, 17–29. [Google Scholar] [CrossRef]
- Chen, M.; Echegaray, E.; Whitworth, R.J.; Wang, H.; Sloderbeck, P.E.; Knutson, A.; Giles, K.L.; Royer, T.A. Virulence analysis of Hessian fly populations from Texas, Oklahoma, and Kansas. J. Econ. Entomol. 2009, 102, 774–780. [Google Scholar] [CrossRef]
- Stuart, J.; Hatchett, J. Morphogenesis and cytology of the salivary gland of the Hessian fly, Mayetiola destructor (Diptera: Cecidomyiidae). Ann. Entomol. Soc. Am. 1987, 80, 475–482. [Google Scholar]
- Doyle, J.J. A rapid DNA isolation procedure for small quantities of fresh leaf tissue. Phytochem. Bull 1987, 19, 11–15. [Google Scholar]
- Sambrook, J.; Fritsch, E.F.; Maniatis, T. Molecular cloning; Cold spring harbor laboratory press: New York, NY, USA, 1989; Volume 2. [Google Scholar]
- Bansal, R.; Mian, M.; Michel, A.P. Microbiome diversity of Aphis glycines with extensive superinfection in native and invasive populations. Env. Microbiol. Rep. 2014, 6, 57–69. [Google Scholar] [CrossRef]
- Schloss, P.D.; Gevers, D.; Westcott, S.L. Reducing the effects of PCR amplification and sequencing artifacts on 16S rRNA-based studies. PloS One 2011, 6, e27310. [Google Scholar] [CrossRef] [Green Version]
- Pruesse, E.; Quast, C.; Knittel, K.; Fuchs, B.M.; Ludwig, W.; Peplies, J.; Glöckner, F.O. SILVA: a comprehensive online resource for quality checked and aligned ribosomal RNA sequence data compatible with ARB. Nucleic Acids Res. 2007, 35, 7188–7196. [Google Scholar] [CrossRef]
- Pruesse, E.; Peplies, J.; Glöckner, F.O. SINA: accurate high-throughput multiple sequence alignment of ribosomal RNA genes. Bioinformatics 2012, 28, 1823–1829. [Google Scholar] [CrossRef]
- Huse, S.M.; Welch, D.M.; Morrison, H.G.; Sogin, M.L. Ironing out the wrinkles in the rare biosphere through improved OTU clustering. Environ. Microbiol. 2010, 12, 1889–1898. [Google Scholar]
- Quince, C.; Lanzen, A.; Davenport, R.J.; Turnbaugh, P.J. Removing noise from pyrosequenced amplicons. BMC Bioinformatics 2011, 12, 38. [Google Scholar] [CrossRef]
- Wang, Q.; Garrity, G.M.; Tiedje, J.M.; Cole, J.R. Naive Bayesian classifier for rapid assignment of rRNA sequences into the new bacterial taxonomy. Appl. Environ. Microbiol. 2007, 73, 5261–5267. [Google Scholar] [CrossRef]
- Pruesse, E.; Peplies, J.; Glöckner, F.O. SINA: accurate high-throughput multiple sequence alignment of ribosomal RNA genes. Bioinformatics 2012, 28, 1823–1829. [Google Scholar] [CrossRef]
- Chao, A.; Lee, S. Estimating the number of classes via sample coverage. Journal of the American Statistical Association 1992, 87, 210–217. [Google Scholar] [CrossRef]
- Chao, A. Nonparametric estimation of the number of classes in a population. Scand. J. Stat. 1984, 265–270. [Google Scholar]
- Giovanini, M.P.; Puthoff, D.P.; Nemacheck, J.A.; Mittapalli, O.; Saltzmann, K.D.; Ohm, H.W.; Shukle, R.H.; Williams, C.E. Gene-for-gene defense of wheat against the Hessian fly lacks a classical oxidative burst. Mol. Plant Microbe Interact. 2006, 19, 1023–1033. [Google Scholar] [CrossRef]
© 2014 by the authors; licensee MDPI, Basel, Switzerland. This article is an open access article distributed under the terms and conditions of the Creative Commons Attribution license (http://creativecommons.org/licenses/by/3.0/).
Share and Cite
Bansal, R.; Hulbert, S.H.; Reese, J.C.; Whitworth, R.J.; Stuart, J.J.; Chen, M.-S. Pyrosequencing Reveals the Predominance of Pseudomonadaceae in Gut Microbiome of a Gall Midge. Pathogens 2014, 3, 459-472. https://doi.org/10.3390/pathogens3020459
Bansal R, Hulbert SH, Reese JC, Whitworth RJ, Stuart JJ, Chen M-S. Pyrosequencing Reveals the Predominance of Pseudomonadaceae in Gut Microbiome of a Gall Midge. Pathogens. 2014; 3(2):459-472. https://doi.org/10.3390/pathogens3020459
Chicago/Turabian StyleBansal, Raman, Scot H. Hulbert, John C. Reese, Robert J. Whitworth, Jeffrey J. Stuart, and Ming-Shun Chen. 2014. "Pyrosequencing Reveals the Predominance of Pseudomonadaceae in Gut Microbiome of a Gall Midge" Pathogens 3, no. 2: 459-472. https://doi.org/10.3390/pathogens3020459