Article

Mycobacterium avium Subspecies paratuberculosis: Human Exposure through Environmental and Domestic Aerosols

1
Centre for Ecology and Hydrology, Lake Ecosystems Group, Lancaster Environment Centre, Library Avenue, Bailrigg, Lancaster LA1 4AP, UK
2
Faculty of Health and Medicine, Division of Biomedical and Life Sciences, Lancaster University, Lancaster LA1 4YQ, UK
3
Division of Diabetes and Nutritional Sciences, Franklin-Wilkins Building, King's College London, 150 Stamford Street, London SE1 9NH, UK
4
Cardiff School of Biosciences, Main Building, Museum Avenue, Cardiff CF10 3AT, UK
5
Royal Lancaster Infirmary, Ashton Road, Lancaster, Lancashire LA1 4RP, UK
*
Author to whom correspondence should be addressed.
Pathogens 2014, 3(3), 577-595; https://doi.org/10.3390/pathogens3030577
Submission received: 30 April 2014 / Revised: 1 July 2014 / Accepted: 11 July 2014 / Published: 16 July 2014

Abstract

:
Mycobacterium avium subspecies paratuberculosis (Map) causes Johne’s disease in animals and is significantly associated with Crohn’s disease (CD) in humans. Our previous studies have shown Map to be present in U.K. rivers due to land deposition from chronic livestock infection and runoff driven by rainfall. The epidemiology of CD in Cardiff showed a significant association with the River Taff, in which Map can be detected on a regular basis. We have previously hypothesized that aerosols from the river might influence the epidemiology of CD. In this preliminary study, we detected Map by quantitative PCR in one of five aerosol samples collected above the River Taff. In addition, we examined domestic showers from different regions in the U.K. and detected Map in three out of 30 independent samples. In detecting Map in river aerosols and those from domestic showers, this is the first study to provide evidence that aerosols are an exposure route for Map to humans and may play a role in the epidemiology of CD.

1. Introduction

Mycobacterium avium subspecies paratuberculosis (Map) is a member of the Mycobacterium avium complex [1,2]. It has the specific ability to cause chronic inflammation of the intestine, or Johne’s disease (JD) [3,4,5], which can affect many animal species, including primates [6,7]. This enteric pathogen is significantly associated with chronic inflammation of the intestine of the Crohn’s disease (CD) type in humans [8,9,10].
Subclinical infection is widespread in domestic livestock, especially cattle, sheep and goats [3]. Infection and disease has now spread worldwide [11,12], with Europe and North America being particularly affected [3,13]. It is estimated that the herd prevalence for JD in cattle in the USA is 68% [14] and 32% in U.K. [3,15,16]. Both clinically and sub-clinically infected animals can shed Map in variable numbers on to pasture in their faeces, depending on the animal, the pathogen strain and the disease characteristics [6]. The organism can survive for many months in agricultural slurry and in the wider environment [17,18,19,20].
Rain falling onto pastures contaminated with Map washes it into surface waters and into rivers [19,20]. Previously, we showed that Map was present in 32% of samples taken from the River Taff (Cardiff, South Wales, UK) and its presence was almost predictable from rain fall patterns and river flow [19], whereas its frequency in samples from the River Tywi was 69% and its presence predictable [20]. Furthermore, deposition and transport from the catchment was extensive in that Map was maintained in the river for several weeks at a time and was a consequence of the endemic presence of Map in cattle in the Taff catchment [19]. Pickup and co-workers [20] modelled the main human exposure routes of Map and suggested that although driven by shedding from clinically and sub-clinically infected animals, the presence and distribution of Map in the environment may also be influenced by other factors, such as slurrying and soil redistribution from water treatment that recycles Map back from the catchment to the river [19,20]. Water from rivers or reservoirs is used for abstraction and public supply. Inevitably Map has been detected in the drinking water supply systems [20,21,22,23,24,25,26]. Furthermore, mycobacteria, including M. avium subspecies avium, have been found in domestic showers [27,28,29].
Cardiff has one of the highest incidences of CD in the U.K., with a corrected incidence for the decade (1996–2005) of 6.6 per 105 population per year (with a 95% confidence interval of 58–76) with a concomitant increase in incidence in children under 16 [30,31]. This compares with 5.6 per 105 population per year (with a 95% confidence interval of 44–68) for the period 1991–1995 [32], 5.9/105/year for 1986–1990 [33] and 5.0/105/year over the period from 1976 to 1980 [34]. The epidemiological study carried out by Mayberry and Hitchens in the late 1970s [35] examined the incidence and geographical distribution of Crohn’s disease and ulcerative colitis in 25 electoral wards in the city of Cardiff. They found a statistically highly significant (p < 0.001) increase in the incidence of Crohn’s disease, but not of ulcerative colitis, in 11 of the city wards. Although eight of these high-incidence wards bordered the River Taff, their apparent geographical relationship with the river was not statistically significant [35,36]. Figure 1B shows the city of Cardiff with an indication of the direction of the prevailing south westerly winds [19]. The distribution of the wards with a high incidence of Crohn’s disease throughout the city is shown in Figure 1B [19]. The topography of the approaches to the southwest aspect of the river is characterized by hills to the north and south. The valley in between, open to the prevailing winds, is directly opposite the gap in the centre of the high-incidence wards on the windward bank of the river. On the leeward side, three additional high-incidence wards lie immediately adjacent to those bordering the river to the northeast. Previously, we suggested that this is the direction in which aerosols containing Map would be carried on the prevailing south westerly winds and proposed that, through aerosolisation of Map, this exposure route is an explanation for the observed disease clusters around the River Taff [19].
Figure 1. Relationship between disease clusters and prevailing wind in Cardiff, Wales, United Kingdom. (A) Location of the city of Cardiff within the UK (red dot); (B) distribution of the 11 electoral wards (shown with black boundaries) in the city of Cardiff that were shown previously (53, 54) to have a highly significant (p < 0.001) increase in the incidence of Crohn’s disease. The wards with the high incidence of Crohn’s disease are seen to lie along the River Taff (blue), which flows into the Bristol Channel (blue), with the exception of a gap in the centre stretch of the windward right bank of the river (facing downstream). This gap directly faces a valley between hills to the north and south, which is open to the prevailing southwesterly winds (black arrow; with permission from [19]). The dashed line represents the continuation of the coast. The white bar represents 3 km. The red dot represents the sampling site.
Pathogens 03 00577 g001
In the present study, we tested whether we could detect Map in aerosols originating from the River Taff, using a high volume impaction sampler (HVIS) designed for collecting particulate matter (PM 2.5–10; Figure 2) [35,36,37]. We also investigated domestic showers to find out whether they could be a source of exposure; thus seeking to extend the diverse routes for human exposure proposed by Pickup et al. [20].
Figure 2. Aerosol sampling using a high volume impaction system. (A) The system in place connected to a high volume vacuum pump (not shown); (B) the sampler showing the position of the four foam collection substrates; (C) the foam placed in position over one of the slit nozzle cascade impactors (see arrow); (D) the foam removed from the slit nozzle cascade impactors (ii) showing collected particles from the sampler (i).
Pathogens 03 00577 g002

2. Results

2.1. Aerosols

2.1.1. The Efficiency of Recovery of Bacteria from the Foam Collection Substrate

This is the first study to make use of the HVIS for microbiological analysis. The foam collection substrate, originally designed for particulate matter (PM10) capture, was tested for ease of recovering culturable bacteria, as it was anticipated that there would be some cell loss due to adsorption and derived from the clumping associated with mycobacteria. In separate experiments, foams were infused with E. coli JM101 and M. immunogenum over a serial dilution range delivering cell numbers from 10–107 CFU mL−1 for E. coli and 10–105 CFU mL−1 for M. immunogenum. For E. coli, the efficiency of recovery decreased with decreasing infusion concentration from approximately 200% (for 106/107 CFU mL−1 infusions, possibly due to cell multiplication at high cell density) to 69%–43% for an infused cell concentration in the range of 10–105, respectively. No CFU were recovered when the foam was seeded with 10 CFU mL−1. M. immunogenum was infused in the range 10–105 CFU mL−1 with CFU only being recovered from the 105 cell infusion at an efficiency of 0.05%. The detection of M. immunogenum by qPCR demonstrated variable recoveries of between 0.08% and 3.05% for the cell equivalent (CE) infusion range 10–107, respectively, indicating better recovery at low cell density. No CE were detected by qPCR when initially infused below concentrations of 101 CE mL−1. Overall results indicated that bacteria could be recovered from the foam collection substrate, originally designed for PM10 collection, but the efficiency of recovery is likely dependent on the concentration and cell type.

2.1.2. Analysis of River Taff Foam Collection Substrates

2.1.2.1. Culture

River aerosols were obtained on five occasions, with each filtering a total of 198 m3 of air per sampling session. Both heterotrophic plate counts and direct microscope counts were carried out on the bacteria recovered from the foam collection substrates located at the top, middle and bottom of the HVIS (Table 1; Figure 2).
Table 1. Assessment of the bacterial load of aerosols from the River Taff by epifluorescence microscopy and the culture of general heterotrophic bacteria. (Samples were collected between November, 2010, and September, 2011; ND, not determined).
Date (MM/DD/YY)Filter LevelCulturable Counts (R2A Agar)
Mean CFUs m−3
(Standard Deviation)
Direct Counts (DAPI)
Mean Cells m−3
(Standard Deviation)
11.09.10Top1.11 × 104 (±3.21 × 10³)1.89 × 10⁵ (±9.62 × 10⁴)
Upper Middle6.01 × 104 (±1.17 × 10⁴)1.60 × 10⁵ (±6.27 × 10⁴)
Lower MiddleNDND
Bottom1.19 × 102 (±1.06 × 10²)ND
05.24.11Top1.58 × 104 (±8.17 × 1032)2.58 × 10⁵ (±1.47 × 10⁵)
MiddleNDND
BottomNDND
06.15.11Top5.65 × 104 (±2.56 × 10⁴)ND
MiddleNDND
BottomNDND
08.17.11Top5.86 × 104 (±4.23 × 10³)5.20 × 10⁷ (±2.46 × 10⁷)
Upper middle1.27 × 105 (±2.45 × 10⁴)ND
Lower middle2.12 × 102 (±9.68 × 101)ND
Bottom 0ND
09.21.11Top3.50 × 104 (±2.19 × 10⁴)2.75 × 10⁵ (±1.64 × 10⁵)
Upper middle2.26 × 103 (±1.73 × 10²)3.91 × 10⁴ (±1.16 × 10⁴)
Lower middle3.90 × 101 (±5.08 × 10°)ND
Bottom0ND
The foams collected bacteria in decreasing numbers from “top” to “bottom” in the mean range 6.01 × 10⁴ to 3.90 × 101 CFU m−3 for culturable bacteria and in the mean range 5.2 × 10⁷ to 3.91 × 10⁴ CFU m−3 for direct counts. There was no significant difference between the culturable numbers collected on the top and upper middle foams (mean 4.7 × 10⁵ ± 7.2 × 10⁵ CFU m−3), but the difference in numbers between the top and lower middle and bottom were close to being significantly different (p = 0.06). Direct counts by microscopy for top and upper middle foams had a mean 8.8 × 10⁷ ± 2.1 × 10⁸ cells m3, with no significant difference between top and upper middle foams. Therefore, the HVIS collected the majority of bacteria from the air passing over the river in the top and upper middle collection substrates.

2.1.2.2. Molecular Analyses

16S rrn gene amplification was successful from all top and upper middle section foams throughout the sampling period. The bottom sections were all negative. PCR detection was not observed in samples where general heterotrophs numbered <103 CFU m−3 (Table 2).
Table 2. PCR detection of eubacteria (16S rrn gene) Mycobacterium spp. (gMyc) and Map (IS900 and F57) in aerosol collection foams collected from November, 2010, to September, 2011 (CE, cell equivalents).
Date (MM/DD/YY)Filter LevelEubacterial 16S rrn GeneMycobacterium spp. 16-23S rRNA ITS (gMyc) (CE m−3)Map IS900
(CE m−3)
Map F57
(CE m−3)
11.09.10Top+000
Upper Middle+01–100
Lower middle-000
Bottom-000
05.24.11Top+000
06.15.11Top+000
08.17.11Top+1–1000
Upper middle+000
Lower middle-000
Bottom-000
09.21.11Top+000
Upper middle+000
Lower middle-000
Bottom-000
Mycobacterial spp. were detected using the gMyc genus-specific assay in the foam on one occasion (08.17.11; Table 2). Map was detected by PCR (IS900 only) on a different occasion (11.09.10) and was found in the upper middle filter. Map was not detected by the confirmatory, but less sensitive, F57 PCR on any occasion. In summary, bacteria were detected on collection foams by culture and direct counts; the extracted DNA was of sufficient quality for PCR, and Map was detected in one sample by IS900 PCR.

2.2. Showers

Samples from the biofilms in showers tubes and heads were obtained from 23 homes across four counties in the U.K. ((Cumbria, Lancashire, Merseyside and West Sussex; 30 samples in total); Table 3).
Table 3. Detection of Mycobacterium spp. and Mycobacterium avium subspecies paratuberculosis in shower heads and tubes by culture and qPCR (ND, not determined; H represents a shower head being sampled from the same shower unit; a, b represent different showers from the same house; and numbers represent different locations). MGIT, mycobacterial growth indicator tubes.
Sample Location/NumberMicroscopy and CultureqPCR
Direct Counts and Standard Deviation.
(Cells L−1)
Mycobacterial Culture (MGIT)Mycobacterium spp. (CE L−1)Map IS900
(CE L−1)
Map F57
(CE L−1)
Cumbria-1NDND104–10500
Cumbria-2HND-106–10700
Cumbria-2ND-106–10700
Cumbria-3ND-103–10400
Cumbria-4ND-102–10300
Cumbria-5NDND000
Cumbria-6NDND000
Lancashire-1NDND103–10400
Lancashire-2NDND107–1081–100
Lancashire-3ND-107–10800
Lancashire-47.95 × 10⁸ (±4.02 × 10⁸)-105–10600
Lancashire-5ND-106–10700
Lancashire-6NDND108–10900
Lancashire-7ND+106–10700
Lancashire-8ND-103–10400
Lancashire-91.91 × 10⁹ (±6.07 × 10⁸)-106–10700
Lancashire-101.63 × 10⁹ (±5.05 × 10⁸)+107–10800
Merseyside -1ND-108–109103–104101–102
Merseyside-2ND-107–108102–103102–103
Merseyside-3ND-107–10800
West Sussex-1aHNDND107–10800
West Sussex-1aNDND106–10700
West Sussex-1bHND-106–10700
West Sussex-1bND+107–10800
West Sussex-2a1.64 × 109 (±7.39 × 10⁸)-109–101°00
West Sussex-2b2.25 × 109 (±1.02 × 10⁹)-104–10500
West Sussex-3aHND-104–10500
West Sussex-3aND-105–10600
West Sussex-3bND+105–10600
West Sussex-4HND-104–10500
Mycobacterium spp. were detected by qPCR in 28 (93%) samples covering all geographical regions. Their numbers ranged from 102 CE L−1 to 109–1010 CE L−1 with >20 samples containing more than 102–103 CE L−1 mycobacteria. The presence of viable mycobacteria was also confirmed by culture (with confirmation of acid-fastness by Kinyoun staining) in four out of six samples tested (Table 3). Map was detected in three samples from Merseyside and Lancashire, two samples of which were also positive in a confirmatory F57 PCR. Furthermore, Map was only detected in samples carrying the higher 107–108 general mycobacterial load (Table 3).

2.3. Discussion

This study employed culture and higher sensitivity qPCR assays to assess two routes of human exposure to Map via aerosols, as proposed by Pickup et al. [19,20], namely, those from rivers and domestic showers.

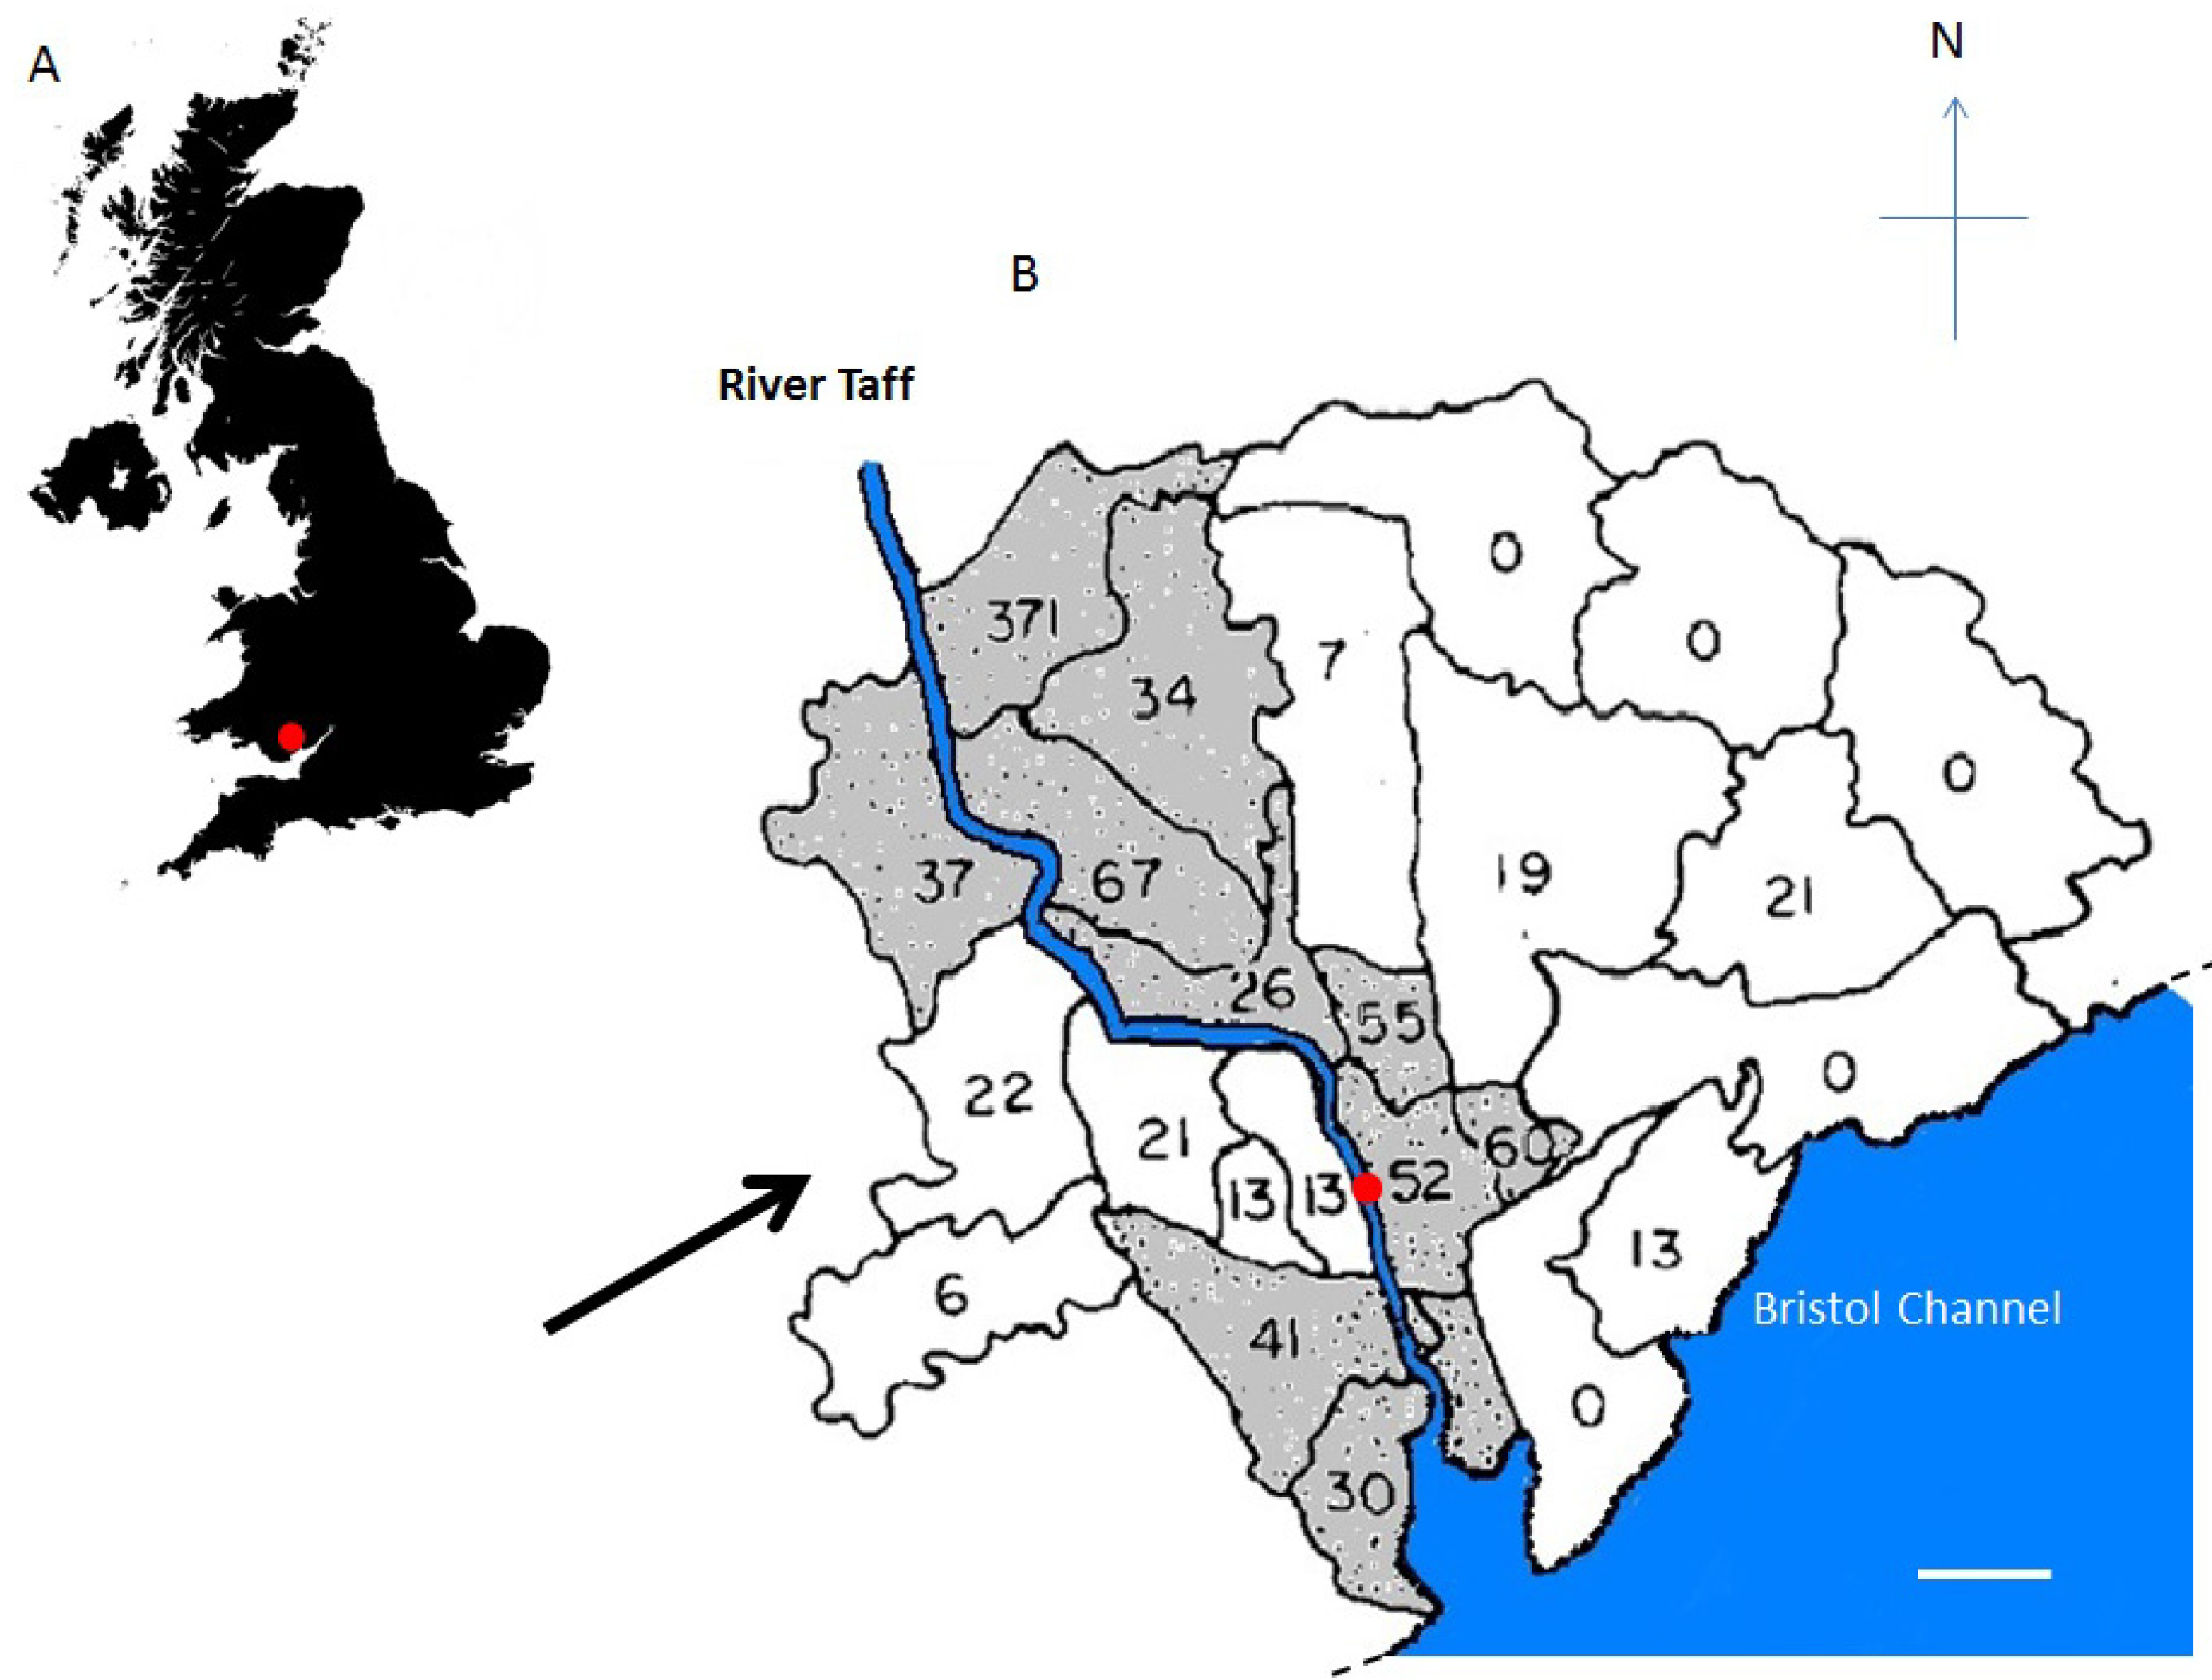
2.3.1. River Aerosols

Various types of collection devices are available, such as impingers with a low volume collection of 10–30 L min−1, although some have a capacity of approximately 1000 L min−1 [38,39]. Both dry and liquid collection systems have limitations, such as short collection times, impaction problems and low volume collection [38,40]. Our river sampling strategy for aerosols employed a high volume impaction system (HVIS; commonly referred to as the Cardiff Super-Sucker), which is normally used to study PM10 in urban and rural areas [37]. To our knowledge, there is no dedicated apparatus to facilitate the specific detection of aerosolized bacteria in such large volumes. As such, it was necessary to show the applicability of the HVIS system to the capture and recovery of bacteria in the present study. We demonstrated the use of the apparatus and showed that viable bacteria can be recovered from River Taff aerosols by culturing bacteria from 198 m3 air samples collected on each deployment. This recovery occurred despite the harsh physical and physiological conditions that the unit imposes on the bacteria and the non-standard collection foams used. The HVIS was placed near a weir, where the physical disturbance of the river would probably increase our chances of collecting aerosols.
Map was detected by IS900 qPCR, on one out of five sampling occasions, albeit in the range of 1–10 CE m3, but not by the less sensitive F57 PCR, which is consistent with the estimated Map numbers detected. In a previous qualitative study (presence/absence PCR; [19]), Pickup et al. (2005) sampled the river Taff waters for one year and reported that 32% of river samples at a location 1 km upstream from the present site were positive for Map [19]. The 2005 study [19] was the result of a feasibility study comprising seven ad hoc sampling sessions, previously spread out over several months. Map was detected in only one of those seven samples. However, its detection led to the more intensive sampling regime that was later reported [19]. We subsequently showed that the ad hoc feasibly study returned a low Map-positive rate because the bacterium is transported in the river in pulses driven by rainfall and that there are periods where Map is not detected [19,20], and we sampled on all, but one, of those occasions. The conclusions of the present study mirror that of our previous studies [19,20,41] in that sampling and detection methods likely underestimate actual Map numbers. More specifically, previous experience from ad hoc sampling and Map screening followed by more intense and frequent assessments in 2005 suggest that if we were able to collect aerosol samples on a twice weekly basis at the present sampling site, then our model for the River Taff would suggest a higher detection of Map in aerosol samples [19]. This is our intention in future studies.
Both the ability of aerosol droplets to concentrate bacteria and the spread of mycobacteria in aerosols are well documented [23,42,43,44,45,46,47]. More specifically, Map has been detected in aerosols in cattle barns and within the farm environment [48,49,50,51] and has been identified as a possible route for infection for Johne’s disease in cattle [52]. Although limited in scope and resolution, our feasibility study is the first to show that Map is airborne in non-farm environments, namely in aerosols emanating from rivers, and its presence fits the criteria in our understanding of the Map loading of rivers and its transportation drivers from the catchment [19].
This study also gives credence to our suggestion that the epidemiology of Crohn’s patients in Cardiff (UK) is affected by aerosols, due to the significant association with the river and the prevailing wind direction [19]. The study by Mayberry and Hitchens [35] examined the distribution of Crohn’s disease patients in Cardiff based on age, sex, religion, smoking, drinking and drug taking with no statistical difference within and between these parameters [35]. They found, however, that CD patients appeared in highly significant clusters and that these were closely associated with the course of the River Taff with larger concentrations of CD nearer the source mouth (Tiger Bay). Mayberry and Hitchens [35] suggested that environmental factors associated with the river may contribute to the disease distribution. We suggest that, although more study is needed, aerosols might be the missing factor suggested by Mayberry and Hitchens [35,36,53,54] and ourselves [19]. Taken together with our present results and those that show that Map is significantly associated with Crohn’s disease [8,10], these data suggest that the pattern of clustering of Crohn’s disease in Cardiff may have been due to the long-term inhalation of M. avium subsp. paratuberculosis from the River Taff.

2.3.2. Shower Heads

Furthermore, water is abstracted from rivers for domestic use. Given the widespread geographical distribution of Map [41] and its presence in water ways [19,20,24], it is not surprising that the delivery of domestic water supply may prove an issue. Mycobacteria have been found in drinking water [21,22,29], and pathogens, including mycobacteria, have been found in showerheads [27,29]. Furthermore, non-tuberculous mycobacteria (NTM) and other opportunistic human pathogens were enriched to high levels in many showerhead biofilms [27]. These authors concluded that showerheads may present a significant potential exposure to aerosolized microbes, including documented opportunistic pathogens. Our results support this with qPCR, showing 28 of 30 (93%) samples to be positive for Mycobacterium spp. in a range from 102–1010 CE L−1. Additionally, we report for the first time the specific detection Map in shower tubes in numbers from 101–104 CE L−1 with two samples confirmed as Map-positive by both IS900 and F57 PCR and one other unconfirmed Map-positive in which IS900 was detected solely (1–10 CE 1−1). The presence in the shower tube will result in frequent sloughing from the surface of the biofilm, resulting in the appearance of Mycobacterium spp. and Map in shower water and the potential for subsequent inhalation via shower-generated aerosols as suggested by Feazel et al. [27].

3. Experimental Section

3.1. Bacterial Strains and Culture

Escherichia coli strain JM101 was maintained on nutrient agar and cultured overnight at 30 °C in nutrient broth (Oxoid, UK) with shaking at 180 rpm. General heterotrophs were cultured at 30 °C on solid R2A medium (Oxoid, UK) for 48 h. Mycobacterium immunogenum ATCC 700505T was cultured at 30 °C for up to 1 week on Middlebrook 7H10 agar supplemented with OADC (10% v/v) and glycerol (5% v/v) (BD Biosciences, Oxford, UK) or in mycobacterial growth indicator tubes (MGITs), supplemented with OADC (10% v/v) [54]. Mycobacterium avium subsp. paratuberculosis K-10 (Map) and general mycobacteria from shower samples were cultured in the same way, but with the addition of polymyxin B sulphate (100 µg mL−1), cycloheximide (25 µg mL−1) and mycobactin J (2 µg mL−1); and increased incubation times of up to 6 months (Map culture only).

3.2. Sampling Sites

Aerosol sampling took place from the east bank on the River Taff at Blackweir, Bute Park Cardiff (GBOS ST170780), between November, 2010, and September, 2011. Shower samples were taken from a number of houses across England during the period 2011–2013.

3.3. Shower Sampling

Domestic shower samples were obtained by removal of the shower hose from the shower unit and shower head and emptied of standing water. Sterile glass beads (1 g; 5 mm in diameter) in 10 mL sterile 1 × PBS were poured into the pipe. The ends were sealed with alcohol-washed parafilm (Bemis Ltd, UK), and the pipe was manually shaken for 2 min to remove the internal biofilm. The contents were poured into a sterile McCartney bottle, sealed and put on ice prior to transport and processing: the culture of mycobacteria (Section 3.3.1), direct counts by microscopy (Section 3.5) and qPCR (Section 3.6 and Section 3.7). Counts obtained from 5-mL samples were converted to cells L−1 or CE L−1.

3.3.1. Recovery of Mycobacteria from Shower Biofilms

For the recovery of mycobacteria from shower samples, 5 mL of the sample obtained above was centrifuged for 30 min at 4000× g. Samples were then decontaminated to favour the growth of robust mycobacteria, whilst eradicating other bacteria and fungi. Concentrated shower samples were re-suspended in 1 mL 0.7% hexadecylpyridinium chloride and incubated at room temperature for 1 h. This was followed by centrifugation for 30 min at 4000× g and re-suspension in 500 µL sterile PBS. Two hundred microlitres of this sample were then inoculated into MGITs and 100 µL onto 7H10 solid medium in triplicate, as described above. Mycobacterial growth either as colonies on solid media or from clumped cells in MGITs was confirmed by checking for both acid fastness by Kinyoun staining (as per the manufacturer’s instructions; Becton Dickinson Diagnostics, Oxford, UK) and DNA extraction followed by quantitative real-time PCR (qPCR) using the Mycobacterium genus-specific assay described below.

3.4. Aerosol Sampling

3.4.1. Collection

Aerosol collection was carried out using a high-volume (low cut-off; 1100-1/min) impaction system (HVIS; Figure 2) linked to a 240 V voltage high performance vacuum pump [37,55]. The HVIS comprised a series of multistage round slit nozzle cascade impactors, which direct incoming air through four sterile polyurethane foam collection substrates labelled by position within the unit (top, upper and lower middle and bottom) [56,57] (Figure 2a,b). The HVIS was configured to collect particles in the ranges 10–2.5 µm and 2.5–0.1 µm, with the size being determined by the slit nozzles rather than the collection substrate [56] (Figure 2b). The HVIS was run for 3 h on the opposite river bank to the prevailing wind. Upon return to the laboratory, the multistage impactors were disassembled aseptically in a microbiological safety cabinet (Figure 2c), the circular foam collection substrates removed, cut into quarters using sterile scissors and placed at −80 °C in sterile plastic 50-mL centrifuge tubes (Figure 2d) until required. Each of the collection foams was processed separately. They were then aseptically transferred to stomacher bags and 20 mL sterile 1× PBS and placed in the stomacher (Stomacher® 80 Biomaster; Seward Ltd., Worthing, UK). Stomaching was performed at the “high speed” setting (300 rpm ±5%) for 5 min at room temperature. The total volume of this suspension was then decanted into sterile 50 mL tubes and cells concentrated to 1 mL by centrifugation 16,000× g for 10 min at room temperature. This final suspension was then used for culture and DNA extraction for qPCR estimates of cell numbers of mycobacteria and MAP.

3.4.2. Controlled Assessment of the Efficiency of Cell Recovery from Foam Substrates

To test the efficiency of recovery of cells foam substrates used in the HVIS aerosol collector, substrates were infused with E. coli JM101 (to give a representative sample of a fast growing general heterotrophy) and with M. immunogenum (a fast growing non-tuberculous mycobacterium, which aggregates into cell clumps, typical of mycobacteria). Foam substrates were cut into 1-cm strips and sterilised by autoclaving prior to use. Sterile foams were then placed into sterile 1.5-mL Eppendorf tubes and infused with 100 µL of cell suspension. This volume had previously been shown to be fully retained by the foam (not shown). Cultures of E. coli JM101 and M. immunogenum were grown to approximate cell concentrations of 108 mL−1 before centrifugation for 3 minutes at 3000× g and re-suspension in sterile 1 ×PBS. Separate cell suspensions of each culture were serially diluted to 10−7 in 1× PBS to provide an estimate of how the efficiency of recovery changed across a range of concentrations. Infused foams were undisturbed for 1 h at room temperature. They were then aseptically transferred to stomacher bags and processed as described previously. The final suspension was then used for culture and DNA extraction for qPCR estimates of cell numbers. E. coli and M. immunogenum were cultured as above, and the efficiency of cell recovery was determined by comparing the colony forming units CFU mL−1 (or cell equivalents, see below) recovered to that of the original cultures used for infusion. Due to cell clumping that affects mycobacterial CFU counts, M. immunogenum cell equivalents [55] were also assessed by qPCR, as described below.

3.5. Direct Microscope Counts

Direct counts were carried out using DAPI staining [58] using a Leitz labarlux S epifluorescence microscope at ×1250 magnification under UV excitation at 358 nm and emission at 430 nm.

3.6. DNA Extraction

Total nucleic acids were extracted from all samples using the MagMax total nucleic acid extraction kit (P/N AM1840, Life Technologies, Paisley, UK) according to manufacturer’s instructions, apart from replacement of kit-supplied carrier nucleic acid with molecular reagent water (Sigma Aldrich Ltd., Poole, UK). Cell lysis by bead beating was performed on a FastPrep®-24 instrument (MP Biomedicals, Loughborough, UK) for 2 cycles of 1 min at a speed of 6.5 m/s (with 5 min at room temperature in between cycles). All samples were processed in sterile 1.5-mL microcentrifuge tubes. Nucleic acid extractions were also performed with 200 μL of PCR water (Sigma Aldrich Ltd., Poole, UK) as a negative control. DNA quality and concentration were determined using a Nanodrop 8000 spectrophotometer (Labtech International Ltd., Ukfield, UK). Finally, all total nucleic acids were stored at −80 °C.

3.7. PCR Amplification and qPCR

End-point PCR amplification was carried out using a Veriti thermal cycler (P/N 4375786, Life Technologies) in MicroAmp 96-well thin-walled reaction plates (P/N 4346906, Life Technologies). Amplification of the 16S rrn gene was carried out using primers pE and pH’ [59]; Table 4). Reactions (20 µL) were performed using and in strict accordance with the instructions provided with the AmpliTaq Gold 360 Master Mix system (P/N 4398881, Life Technologies).
Table 4. PCR primers and hydrolysis probes used in this study. * Our designation as oligonucleotides were originally simply the forward and reverse primer Taqman probe when described in van Coppenraet et al. (2004).
OligonucleotideSequence and Fluorophore/Quencher (5'→3')Target GeneReference
pE (forward)AAACTCAAAGGAATTGACGGEubacterial 16S rrn gene[59]
pH’ (reverse)AAGGAGGTGATCCAGCCGCAEubacterial 16S rrn gene
MimmFP (forward)TTGATGTGCAGACGGATTCCM. immunogenum rpoB[55]
MimmRP (reverse)CAACCTCGCGCCAACGM. immunogenum rpoB
MimmTP (hydrolysis probe)VIC-TTGAATGGTTGGTCGGCTCGCC-TAMRAM. immunogenum rpoB
gMycFP * (forward)GGGGTGTGGTGTTTGAGMycobacterium genus 16S-23S rrn gene ITS[60]
gMycRP * (reverse)CTCCCACGTCCTTCATCMycobacterium genus 16S-23S rrn gene ITS
gMycP * (hydrolysis probe)6FAM-TGGATAGTGGTTGCGAGCATC-TAMRAMycobacterium genus 16S-23S rrn gene ITS
IS900qPCRF (forward)GATGGCCGAAGGAGATTGM. avium subsp. paratuberculosis IS900[61]
IS900qPCRR (reverse)CACAACCACCTCCGTAACCM. avium subsp. paratuberculosis IS900
IS900qPCRTM (hydrolysis probe)6FAM–ATTGGATCGCTGTGTAAGGACACGT–BHQM. avium subsp. paratuberculosis IS900
F57-F (forward)TACGAGCACGCAGGCATTCM. avium subsp. paratuberculosisF57[62]
F57-R (reverse)CGGTCCAGTTCGCTGTCATM. avium subsp. paratuberculosisF57
F57 Taqmanmgb (hydrolysis probe)VIC-CCTGACCACCCTTC-MGBM. avium subsp. paratuberculosisF57
Where practicable, all real-time quantitative PCR amplifications were performed and reported in accordance with the MIQE guidelines [62]. Amplifications were carried out in a 7500 FAST Real-Time PCR system (Life Technologies, Paisley, UK) in MicroAmp optical reaction plates (P/N N801–0560, Life Technologies). Primers and hydrolysis probes specific to each of Mycobacterium immunogenum, Mycobacterium spp. and Map are listed in Supplementary Table 1.
Map was detected by qPCR using single-tube duplex reactions that combined the previously described assays [61,62] to amplify Map-specific regions IS900 and F57, respectively. These assays comprised primers and hydrolysis probes described in Supplementary Table 1. Primer and probe concentrations were optimized such that each reaction (20 µL) contained the following: 10 µL of 2 × Environmental Master Mix (P/N 4396838, Life Technologies, UK); 1 µL (300 nM) of each primer (P/N 4304972, Life Technologies, UK) and 1 µL (250 nM) of each probe (P/N 450003, Life Technologies, UK); 2 µL of sterile PCR grade water (Sigma-Aldrich, UK); and 2 µL DNA. No template controls received sterilized PCR-grade water instead of DNA. The following cycling profile was used: one cycle of 95 °C for 10 min (for the activation of the AmpliTaq Gold enzyme) and 45 cycles of 95 °C for 15 s and 60 °C for 1 min. DNA used in standard curves was quantified and standard curves constructed in accordance with methods outlined in Rhodes et al., (2008), based upon a genome size of 4.83 Mbp for M. avium ssp. paratuberculosis K-10 (GenBank Accession No. NC002944) and an average number of gene copies per genome of 17 (IS900) and 1 (F57) [63,64]. The sensitivity of the IS900 and F57 assays was determined for the present study using serially-diluted Map K-10 DNA. The limit of detection of the combined duplex assay of IS900 and F57 was 20–50 cell equivalents (CE; see [55]). All reactions were carried out in triplicate. Inhibition of the PCR reaction was tested in a separate round of reactions after the initial MAP assessments by the addition of 2 ng of Map K-10 DNA (approximately 4 × 10⁵ genomes) to all samples and to control reactions where no sample DNA was added. No amplification, or a shift to a higher quantification cycle (Cq) value [65] when compared with the control reactions, was interpreted as inhibition.

4. Conclusions

Both river aerosol and shower unit results presented here are consistent with inhalation as a probable exposure route of M. avium subsp. paratuberculosis and other non-Map mycobacterial infections. Inhalation has been shown as a route for the infection of cattle [49,66]. M. avium subsp. avium demonstrates selective binding to pulmonary surfactant proteins [67]. Lung involvement is well described in adults with Crohn’s disease [67,68], and the disease in children often begins with a cough and a mild granulomatous tracheobronchitis [69,70,71,72,73]. Initial invasion via the oral route followed by Map’s substantial tissue tropism for the gut may result in chronic inflammation of the intestine [74,75]. Although Map is difficult to detect and even more difficult to culture, recent data has shown it to be significantly associated with Crohn’s disease and, if appropriate culture and PCR tests are done correctly, that almost everyone with chronic inflammation of the gut of the Crohn’s disease type is found to be infected with this chronic enteric pathogen [8,10,76,77,78,79,80]. Delivery of Map from showers and river aerosols may provide two previously undescribed human exposure routes for the pathogen significantly associated with Crohn’s disease.

Supplementary Files

Supplementary File 1

Acknowledgments

We wish to thank Natural Environment Research Council (Grant NE/F014791/1) and the NHS Grant (BLS7044; Hollian Richardson) for support and Dr. Tim Jones (Cardiff University) for the loan of the HVIS.

Author Contributions

R.P. wrote the paper. R.P., G.R., J. H.-T. and A.H. designed the experiments. R.P., A.W., H.R. and G.R. carried out the field work. H.R. performed the experiments. G.R., H.R., A.W., J. H.-T. and A.H. helped improve the manuscript.

Conflicts of Interest

The authors declare no conflict of interest.

References

  1. Thorel, M.F.; Krichevsky, M.; Levyfrebault, V.V. Numerical taxonomy of mycobactin-dependent mycobacteria, emended description of Mycobacterium avium, and description of Mycobacterium avium subsp avium subsp-nov, Mycobacterium avium subsp paratuberculosis subsp-nov, and Mycobacterium avium subsp silvaticum subsp-nov. Int. J. Syst. Bact. 1990, 40, 254–260. [Google Scholar] [CrossRef]
  2. Chacon, O.; Bermudez, L.E.; Barletta, R.G. Johne’s disease, inflammatory bowel disease, and Mycobacterium paratuberculosis. A. Rev. Microbiol. 2004, 58, 329–363. [Google Scholar] [CrossRef]
  3. Nielsen, S.S.; Toft, N. A review of prevalences of paratuberculosis in farmed animals in Europe. Prev. Vet. Med. 2009, 88, 1–14. [Google Scholar] [CrossRef]
  4. Buergelt, C.D.; Hall, C.; McEntee, K.; Duncan, J.R. Pathological evaluation of para-tuberculosis in naturally infected cattle. Vet. Path. 1978, 15, 196–207. [Google Scholar] [CrossRef]
  5. Over, K.; Crandall, P.G.; O’Bryan, C.A.; Ricke, S.C. Current perspectives on Mycobacterium avium subsp. paratuberculosis, johne’s disease, and crohn’s disease: A review. Crit. Rev. Microbiol. 2011, 37, 141–156. [Google Scholar] [CrossRef]
  6. Clarke, C.J. The pathology and pathogenesis of paratuberculosis in ruminants and other species. J. Comp. Pathol. 1997, 116, 217–261. [Google Scholar] [CrossRef]
  7. McClure, H.M.; Chiodini, R.J.; Anderson, D.C.; Swenson, R.B.; Thayer, W.R.; Coutu, J.A. Mycobacterium-paratuberculosis infection in a colony of stumptail macaques (Macaca arctoides). J. Infect. Dis. 1987, 155, 1011–1019. [Google Scholar] [CrossRef]
  8. Feller, M.; Huwiler, K.; Stephan, R.; Altpeter, E.; Shang, A.; Furrer, H.; Pfyffer, G.E.; Jemmi, T.; Baumgartner, A.; Egger, M. Mycobacterium avium subspecies paratuberculosis and crohn’s disease: A systematic review and meta-analysis. Lancet Infect. Dis. 2007, 7, 607–613. [Google Scholar] [CrossRef]
  9. Chiodini, R.J.; Chamberlin, W.M.; Sarosiek, J.; McCallum, R.W. Crohn’s disease and the mycobacterioses: A quarter century later. Causation or simple association? Crit. Rev. Microbiol. 2012, 38, 52–93. [Google Scholar] [CrossRef]
  10. Bull, T.J.; McMinn, E.J.; Sidi-Boumedine, K.; Skull, A.; Durkin, D.; Neild, P.; Rhodes, G.; Pickup, R.; Hermon-Taylor, J. Detection and verification of Mycobacterium avium subsp. paratuberculosis in fresh ileocolonic mucosal biopsy specimens from individuals with and without crohn’s disease. J. Clin. Microbiol. 2003, 41, 2915–2923. [Google Scholar] [CrossRef]
  11. Larsen, J.W.A.; Ware, J.K.W.; Kluver, P. Epidemiology of bovine Johne’s disease (bjd) in beef cattle herds in australia. Aust. Vet. J. 2012, 90, 6–13. [Google Scholar] [CrossRef]
  12. Olsen, I.; Siguroardottir, O.G.; Djonne, B. Paratuberculosis with special reference to cattle—A review. Vet. Q 2002, 24, 12–28. [Google Scholar] [CrossRef]
  13. Sorensen, O.; Rawluk, S.; Wu, J.; Manninen, K.; Ollis, G. Mycobacterium paratuberculosis in dairy herds in alberta. Can. Vet. J 2003, 44, 221–226. [Google Scholar]
  14. United States Department of Agriculture. Johne’s disease on U. S. Dairies, 1991–2007. Available online: http://www.aphis.usda.gov/animal_health/nahms/dairy/downloads/dairy07/Dairy07_is_Johnes.pdf (accessed on 11 July 2014).
  15. Department of the Environment, Food and Rural Affairs (UK). An Integrated Strategy to Determine the Herd Level Prevalence of Johne’s Disease in the uk Dairy Herd. Available online: http://archive.defra.gov.uk/foodfarm/farmanimal/diseases/atoz/documents/johnes-report0911.pdf (accessed on 11 July 2014).
  16. Caldow, G.; Strain, S.A.J.; Chapman, Z.; Kemp, R.; Cook, A.J. A survey to estimate the herd level prevalence of paratuberculosis in the dairy herd of the united kingdom. Cattle Pract. 2007, 15, 169–171. [Google Scholar]
  17. Whittington, R.J.; Marsh, I.B.; Reddacliff, L.A. Survival of Mycobacterium avium subsp. paratuberculosis in dam water and sediment. Appl. Environ. Microbiol. 2005, 71, 5304–5308. [Google Scholar] [CrossRef]
  18. Larsen, A.B.; Merkal, B.S.; Vardaman, T.H. Survival time of Mycobacterium paratuberculosis. Am. J. Vet. Res. 1956, 17, 549–551. [Google Scholar]
  19. Pickup, R.W.; Rhodes, G.; Arnott, S.; Sidi-Boumedine, K.; Bull, T.J.; Weightman, A.; Hurley, M.; Hermon-Taylor, J. Mycobacterium avium subsp. paratuberculosis in the catchment area and water of the river taff in south wales, united kingdom, an its potential relationship to clustering of crohn’s disease cases in the city of cardiff. Appl. Environ. Microbiol. 2005, 71, 2130–2139. [Google Scholar] [CrossRef]
  20. Pickup, R.W.; Rhodes, G.; Bull, T.J.; Arnott, S.; Sidi-Boumedine, K.; Hurley, M.; Hermon-Taylor, J. Mycobacterium avium subsp. paratuberculosis in lake catchments, in river water abstracted for domestic use, and in effluent from domestic sewage treatment works: Diverse opportunities for environmental cycling and human exposure. Appl. Environ. Microbiol. 2006, 72, 4067–4077. [Google Scholar] [CrossRef]
  21. Beumer, A.; King, D.; Donohue, M.; Mistry, J.; Covert, T.; Pfaller, S. Detection of Mycobacterium avium subsp. paratuberculosis in drinking water and biofilms by quantitative pcr. Appl. Environ. Microbiol. 2010, 76, 7367–7370. [Google Scholar] [CrossRef]
  22. Klanicova, B.; Seda, J.; Slana, I.; Slany, M.; Pavlik, I. The tracing of mycobacteria in drinking water supply systems by culture, conventional, and real time pcrs. Curr. Microbiol. 2013, 67, 725–731. [Google Scholar] [CrossRef]
  23. Falkinham, J.O. Ecology of nontuberculous mycobacteria-where do human infections come from? Preface. Sem. Resp. Crit. Care 2013, 34, 95–102. [Google Scholar] [CrossRef]
  24. Aboagye, G.; Rowe, M.T. Occurrence of Mycobacterium avium subspecies paratuberculosis in raw water and water treatment operations for the production of potable water. Wat. Res. 2011, 45, 3271–3278. [Google Scholar] [CrossRef]
  25. Gill, C.O.; Saucier, L.; Meadus, W.J. Mycobacterium avium subsp paratuberculosis in dairy products, meat, and drinking water. J. Fd Prot. 2011, 74, 480–499. [Google Scholar] [CrossRef]
  26. Hruska, K.; Kaevska, M. Mycobacteria in water, soil, plants and air: A review. Vete. Med. 2012, 57, 623–679. [Google Scholar]
  27. Feazel, L.M.; Baumgartner, L.K.; Peterson, K.L.; Frank, D.N.; Harris, J.K.; Pace, N.R. Opportunistic pathogens enriched in showerhead biofilms. P. Natl. Acad. Sci. USA 2009, 106, 16393–16398. [Google Scholar] [CrossRef]
  28. Thomson, R.; Tolson, C.; Carter, R.; Coulter, C.; Huygens, F.; Hargreaves, M. Isolation of nontuberculous mycobacteria (ntm) from household water and shower aerosols in patients with pulmonary disease caused by ntm. Am. J. Clin. Microb. 2013, 51, 3006–3011. [Google Scholar] [CrossRef]
  29. Falkinham, J.O., III; Iseman, M.D.; de Haas, P.; van Soolingen, D. Mycobacterium avium in a shower linked to pulmonary disease. J. Water Health 2008, 6, 209–213. [Google Scholar]
  30. Gunesh, S.; Thomas, G.A.O.; Williams, G.T.; Roberts, A.; Hawthorne, A.B. The incidence of crohn’s disease in cardiff over the last 75 years: An update for 1996–2005. Aliment. Pharm. Therap. 2008, 27, 211–219. [Google Scholar]
  31. Gunesh, S.K.; Hawthorne, B.A.; Thomas, G.A.O.; Williams, G.T.; Roberts, A. Incidence of crohn’s disease still rising in cardiff: 1931–2005. Gut 2007, 56, A110–A111. [Google Scholar]
  32. Yapp, T.R.; Stenson, R.; Thomas, G.A.O.; Lawrie, B.W.; Williams, G.T.; Hawthorne, A.B. Crohn’s disease incidence in cardiff from 1930: An update for 1991–1995. Eur. J. Gastroen. Hepat. 2000, 12, 907–911. [Google Scholar] [CrossRef]
  33. Thomas, G.A.O.; Millarjones, D.; Rhodes, J.; Roberts, G.M.; Williams, G.T.; Mayberry, J.F. Incidence of crohn’s-disease in cardiff over 60 years—1986–1990 an update. Eur. J. Gastroen. Hepat. 1995, 7, 401–405. [Google Scholar]
  34. Rose, J.D.R.; Roberts, G.M.; Williams, G.; Mayberry, J.F.; Rhodes, I. Cardiff crohns-disease jubilee—The incidence over 50 years. Gut 1988, 29, 346–351. [Google Scholar] [CrossRef]
  35. Mayberry, J.F.; Hitchens, R.A.N. Distribution of crohn’s disease in cardiff. Soc. Sci. Med. 1978, 12, 137–138. [Google Scholar] [CrossRef]
  36. Mayberry, J.F. Recent epidemiology of ulcerative colitis and crohn’s disease in cardiff. Int. J. Colorect. Dis. 1989, 4, 39–46. [Google Scholar] [CrossRef]
  37. Jones, T.; Moreno, T.; BeruBe, K.; Richards, R. The physicochemical characterisation of microscopic airborne particles in south wales: A review of the locations and methodologies. Sci. Total. Environ. 2006, 360, 43–59. [Google Scholar] [CrossRef]
  38. Xu, Z.; Wu, Y.; Shen, F.; Chen, Q.; Tan, M.; Yao, M. Bioaerosol science, technology, and engineering: Past, present, and future. Aerosol. Sci. Tech. 2011, 45, 1337–1349. [Google Scholar] [CrossRef]
  39. Li, M.; Qi, J.; Zhang, H.; Huang, S.; Li, L.; Gao, D. Concentration and size distribution of bioaerosols in an outdoor environment in the qingdao coastal region. Sci. Total. Environ. 2011, 409, 3812–3819. [Google Scholar] [CrossRef]
  40. Xu, Z.; Wei, K.; Wu, Y.; Shen, F.; Chen, Q.; Li, M.; Yao, M. Enhancing bioaerosol sampling by andersen impactors using mineral-oil-spread agar plate. PLoS One 2013, 8, e56896. [Google Scholar]
  41. Rhodes, G.; Henrys, P.; Thomson, B.C.; Pickup, R.W. Mycobacterium avium subspecies paratuberculosis is widely distributed in british soils and waters: Implications for animal and human health. Envir. Microbiol. 2013, 15, 2761–2774. [Google Scholar]
  42. Primm, T.P.; Lucero, C.A.; Falkinham, J.O. Health impacts of environmental mycobacteria. Clin. Microbiol. Rev. 2004, 17, 98–106. [Google Scholar] [CrossRef]
  43. Woodcock, A.H.; Kientzler, C.F.; Arons, A.B.; Blanchard, D.C. Giant condensation nuclei from bursting bubbles. Nature 1953, 172, 1144–1145. [Google Scholar] [CrossRef]
  44. Falkinham, J.O. Nontuberculous mycobacteria in the environment. Clin. Chest. Med. 2002, 23, 529–551. [Google Scholar] [CrossRef]
  45. Glazer, C.S.; Martyny, J.W.; Lee, B.; Sanchez, T.L.; Sells, T.M.; Newman, L.S.; Murphy, J.; Heifets, L.; Rose, C.S. Nontuberculous mycobacteria in aerosol droplets and bulk water samples from therapy pools and hot tubs. J. Occup. Health. Environ. Hygiene 2007, 4, 831–840. [Google Scholar] [CrossRef]
  46. Falkinham, J.O. Mycobacterial aerosols and respiratory disease. Emerg. Infect. Dis. 2003, 9, 763–767. [Google Scholar] [CrossRef]
  47. Wendt, S.L.; George, K.L.; Parker, B.C.; Gruft, H.; Falkinham, J.O. Epidemiology of infection by nontuberculous mycobacteria. Iii. Isolation of potentially pathogenic mycobacteria from aerosols. Am. Rev. Resp. Dis. 1980, 122, 259–263. [Google Scholar]
  48. Corner, L.A.L.; Pfeiffer, D.U.; Abbott, K.A. Unanswered questions about the transmission of Mycobacterium avium subspecies paratuberculosis. Vet. J. 2003, 165, 182–183. [Google Scholar] [CrossRef]
  49. Corner, L.A.L.; Pfeiffer, D.U.; Abbott, K.A. The respiratory tract as a hypothetical route of infection of cattle with Mycobacterium avium subspecies paratuberculosis. Aus. Vet. J. 2004, 82, 170–173. [Google Scholar] [CrossRef]
  50. Eisenberg, S.W.F.; Nielen, M.; Santema, W.; Houwers, D.J.; Heederik, D.; Koets, A.P. Detection of spatial and temporal spread of Mycobacterium avium subspecies paratuberculosis in the environment of a cattle farm through bio-aerosols. Vet. Microbiol. 2010, 143, 284–292. [Google Scholar] [CrossRef]
  51. Eisenberg, S.W.F.; Nielen, M.; Koets, A.P. Within-farm transmission of bovine paratuberculosis: Recent developments. Vet. Quart. 2012, 32, 31–35. [Google Scholar] [CrossRef]
  52. Eisenberg, S.W.F.; Koets, A.D.P.; Nielen, M.; Heederik, D.; Mortier, R; de Buck, J.; Orsel, K. Intestinal infection following aerosol challenge of calves with Mycobacterium avium subspecies paratuberculosis. Vet. Res. 2011, 42, 1–9. [Google Scholar]
  53. Mayberry, J. Review of environmental-factors and crohns-disease. Acta Hepato-Gastroenterol. 1979, 26, 257–259. [Google Scholar]
  54. Mayberry, J.; Rhodes, J.; Hughes, L.E. Incidence of crohn disease in cardiff between 1934 and 1977. Gut 1979, 20, 602–608. [Google Scholar] [CrossRef]
  55. Rhodes, G.; Fluri, A.; Gerber, M.; Henderson, A.; Ruefenacht, A.; Pickup, R.W. Detection of Mycobacterium immunogenum by real-time quantitative taqman pcr. J. Microbiol. Meth. 2008, 73, 266–268. [Google Scholar] [CrossRef]
  56. Kavouras, I.G.; Ferguson, S.T.; Wolfson, J.M.; Koutrakis, P. Development and validation of a high-volume, low-cutoff inertial impactor. Inhal. Toxicol. 2000, 12, 35–50. [Google Scholar] [CrossRef]
  57. Kavouras, I.G.; Koutrakis, P. Use of polyurethane foam as the impaction substrate/collection medium in conventional inertial impactors. Aerosol. Sci. Tech. 2001, 34, 46–56. [Google Scholar] [CrossRef]
  58. Porter, K.G.; Feig, Y.S. The use of dapi for identifying and counting aquatic microflora. Limnol. Oceanogr. 1980, 25, 943–948. [Google Scholar] [CrossRef]
  59. Edwards, U.; Rogall, T.; Blocker, H.; Emde, M.; Bottger, E.C. Isolation and direct complete nucleotide determination of entire genes—Characterization of a gene coding for 16s-ribosomal rna. Nucl. Acids Res. 1989, 17, 7843–7853. [Google Scholar] [CrossRef]
  60. Van Coppenraet, E.S.B.; Lindeboom, J.A.; Prins, J.M.; Peeters, M.F.; Claas, E.C.J.; Kuijper, E.J. Real-time pcr assay using fine-needle aspirates and tissue biopsy specimens for rapid diagnosis of mycobacterial lymphadenitis in children. Am. J. Clin. Microb. 2004, 42, 2644–2650. [Google Scholar] [CrossRef]
  61. Slana, I.; Kralik, P.; Kralova, A.; Pavlik, I. On-farm spread of Mycobacterium avium subsp paratuberculosis in raw milk studied by is900 and f57 competitive real time quantitative pcr and culture examination. Int. J. Food. Microbiol. 2008, 128, 250–257. [Google Scholar] [CrossRef]
  62. Schoenenbrucher, H.; Abdurnawjood, A.; Failing, K.; Buelte, M. New triplex real-time pcr assay for detection of Mycobacterium avium subsp paratuberculosis in bovine feces. Appl. Environ. Microbiol. 2008, 74, 2751–2758. [Google Scholar] [CrossRef]
  63. Li, L.L.; Bannantine, J.P.; Zhang, Q.; Amonsin, A.; May, B.J.; Alt, D.; Banerji, N.; Kanjilal, S.; Kapur, V. The complete genome sequence of mycobacterium avium subspecies paratuberculosis. P. Natl. Acad. Sci. USA 2005, 102, 12344–12349. [Google Scholar] [CrossRef]
  64. Poupart, P.; Coene, M.; Vanheuverswyn, H.; Cocito, C. Preparation of a specific rna probe for detection of Mycobacterium paratuberculosis and diagnosis of johnes disease. Am. J. Clin. Microb. 1993, 31, 1601–1605. [Google Scholar]
  65. Bustin, S.A.; Benes, V.; Garson, J.A.; Hellemans, J.; Huggett, J.; Kubista, M.; Mueller, R.; Nolan, T.; Pfaffl, M.W.; Shipley, G.L.; et al. The miqe guidelines: Minimum information for publication of quantitative real-time pcr experiments. Clin. Chem. 2009, 55, 611–622. [Google Scholar] [CrossRef]
  66. Eisenberg, S.; Nielen, M.; Hoeboer, J.; Bouman, M.; Heederik, D.; Koets, A. Mycobacterium avium subspecies paratuberculosis in bioaerosols after depopulation and cleaning of two cattle barns. Vet. Rec. 2011, 168, 587. [Google Scholar] [CrossRef]
  67. Kudo, K.; Sano, H.; Takahashi, H.; Kuronuma, K.; Yokota, S.; Fujii, N.; Shimada, K.; Yano, I.; Kumazawa, Y.; Voelker, D.; et al. Pulmonary collectins enhance phagocytosis of Mycobacterium avium through increased activity of mannose receptors. J. Immunol. 2004, 172, 7592–7602. [Google Scholar] [CrossRef]
  68. Storch, I.; Sachar, D.; Catz, S. Pulmonary manifestations of inflammatory bowel disease. Inflamm. Bowel Dis. 2003, 9, 104–115. [Google Scholar] [CrossRef]
  69. Bonniere, P.; Wallaert, B.; Cortot, A.; Marchandise, X.; Riou, Y.; Tonnel, A.B.; Colombel, J.F.; Voisin, C.; Paris, J.C. Latent pulmonary involvement in crohn’s disease: Biological, functional, bronchoalveolar lavage and scintigraphic studies. Gut 1986, 27, 919–925. [Google Scholar] [CrossRef]
  70. Calder, C.J.; Lacy, D.; Raafat, F.; Weller, P.H.; Booth, I.W. Crohn’s disease with pulmonary involvement in a 3 year old boy. Gut 1993, 34, 1636–1638. [Google Scholar] [CrossRef]
  71. Casey, M.B.; Tazelaar, H.D.; Myers, J.L.; Hunninghake, G.W.; Kakar, S.; Kalra, S.X.; Ashton, R.; Colby, T.V. Noninfectious lung pathology in patients with crohn’s disease. Am. J. Surg. Path. 2003, 27, 213–219. [Google Scholar] [CrossRef]
  72. Louis, E.; Louis, R.; Shute, J.; Lau, L.; Franchimont, D.; Radermecker, M.; Djukanovic, R.; Belaiche, J. Bronchial eosinophillic infiltration in crohn’s disease in the absence of pulmonary disease. Clin. Exp. Allergy 1999, 29, 660–666. [Google Scholar] [CrossRef]
  73. Mansi, A.; Cucchiara, S.; Greco, L.; Sarnelli, P.; Franco, M.T.; Santamaria, F. Bronchial hyperresponsiveness in children and adolescents with crohn’s disease. Am. J. Resp. Crit. Care 2000, 161, 1051–1054. [Google Scholar] [CrossRef]
  74. Hermon-Taylor, J. Gut pathogens: Invaders and turncoats in a complex cosmos. Gut Pathog. 2009, 1, 1–3. [Google Scholar] [CrossRef]
  75. Bannantine, J.P.; Bermudez, L.E. No holes barred: Invasion of the intestinal mucosa by Mycobacterium avium subspecies paratuberculosis. Infect. Immun. 2013, 81, 3960–3965. [Google Scholar] [CrossRef]
  76. Naser, S.A.; Ghobrial, G.; Romero, C.; Valentine, J.F. Culture of Mycobacterium avium subsp. paratuberculosis from the blood of patients with crohn’s disease. Lancet 2004, 364, 1039–1044. [Google Scholar] [CrossRef]
  77. Autschbach, F.; Eisold, S.; Hinz, U.; Zinser, S.; Linnebacher, M.; Giese, T.; Loffler, T.; Buchler, M.W.; Schmidt, J. High prevalence of Mycobacterium avium subspecies paratuberculosis is 900 DNA in gut tissues from individuals with crohn’s disease. Gut 2005, 54, 944–949. [Google Scholar] [CrossRef]
  78. Di Sabatino, A.; Paccagnini, D.; Vidali, F.; Rosu, V.; Biancheri, P.; Cossu, A.; Zanetti, S.; Corazza, G.R.; Sechi, L.A. Detection of Mycobacterium avium subspecies paratuberculosis (map)-specific is900 DNA and antibodies against map peptides and lysate in the blood of crohn’s disease patients. Inflamm. Bowel Dis. 2011, 17, 1254–1255. [Google Scholar] [CrossRef]
  79. Sechi, L.A.; Scanu, A.M.; Molicotti, P.; Cannas, S.; Mura, M.; Dettori, G.; Fadda, G.; Zanetti, S. Detection and isolation of Mycobacterium avium subspecies paratuberculosis from intestinal mucosal biopsies of patients with and without crohn’s disease in sardinia. Am. J. Gastroenterol. 2005, 100, 1529–1536. [Google Scholar] [CrossRef]
  80. Abubakar, I.; Myhill, D.; Aliyu, S.H.; Hunter, P.R. Detection of Mycobacterium avium subsp. paratuberculosis from patients with crohn’s disease using nucleic acid-based techniques: A systematic review and meta-analysis. Inflamm. Bowel Dis. 2008, 14, 401–410. [Google Scholar] [CrossRef]

