Article

Energetic and Peak Power Advantages of Series Elastic Actuators in an Actuated Prosthetic Leg for Walking and Running

Lauflabor Locomotion Laboratory, Institute of Sports Science, TU Darmstadt, Magdalenenstr. 27, Darmstadt 64289, Germany
*
Author to whom correspondence should be addressed.
Actuators 2014, 3(1), 1-19; https://doi.org/10.3390/act3010001
Submission received: 12 September 2013 / Revised: 6 February 2014 / Accepted: 21 February 2014 / Published: 27 February 2014
(This article belongs to the Special Issue Human Centered Actuators)

Abstract

:
A monoarticular series elastic actuator (SEA) reduces energetic and peak power requirements compared to a direct drive (DD) in active prosthetic ankle-foot design. Simulation studies have shown that similar advantages are possible for the knee joint. The aims of this paper were to investigate the advantages of a monoarticular SEA-driven hip joint and to quantify the energetic benefit of an SEA-driven leg (with monoarticular hip, knee and ankle SEAs), assuming that damping (negative power) is passively achieved. The hip SEA provided minor energetic advantages in walking (up to 29%) compared to the knee and the ankle SEA. Reductions in required peak power were observed only for speeds close to preferred walking speed (18% to 27%). No energetic advantages were found in running, where a DD achieved the best performance when optimizing for energy. Using an SEA at each leg joint in the sagittal plane reduced the positive work by 14% to 39% for walking and by 37% to 75% for running. When using an SEA instead of a DD, the contribution of the three leg joints to doing positive work changed: the knee contributed less and the hip more positive work. For monoarticular SEAs, the ankle joint motor did most of the positive work.

1. Introduction

Powered prosthetics that actively support the amputee in movement tasks require a great battery capacity. While semi-active (adjust damping) prosthetics, such as the C-Leg [1] or the Rheo Knee [2], have a runtime of one to two days, the active Power Knee [2] has a runtime of about five to 7 h. Because longer charging intervals will improve amputees’ quality of life, prolonging runtime should be addressed in the development process. Adding batteries is not feasible, due to weight constraints. The favorable approach should be to reduce energy requirements (ER) by improving system efficiency.
In addition to low energy consumption, the capability of the active prosthesis to reproduce human limb movements characterized by high angular acceleration, velocity and torque poses further important design goals. Finding an appropriate motor for mimicking the required joint profiles in prostheses is difficult. Direct drives (including appropriate transmission to comply with velocity and torque requirements) are a major contributor to system mass [3]. One way to reduce the motor’s mass is to increase the mechanical efficiency of, e.g., gear boxes or ball screws. Another way to achieve this goal is to reduce motor requirements by introducing elastic structures complementing the motor. For instance, design approaches using springs in series, in parallel or a mixture of both are utilized to exploit elastic recoil and decrease motor peak power requirements. Such bio-inspired solutions mimic the function of muscle fibers (motor), ligaments and tendons (springs). Several prosthetic foot designs based on elastic concepts have been developed [4,5,6,7,8,9,10]. However, complex elastic solutions with limited adaptability can decrease system variability, and solutions utilizing many mechanical parts can increase system weight, cost and failure rate. Hence, a compromise between design complexity to achieve energy and peak power requirements and system variability must be made.
A simple system design for mimicking muscle behavior is using series elastic actuators (SEAs, [11]). Calculations for the ankle joint have shown that a linear spring in series (mimicking the Achilles tendon) can reduce energy requirements by 41% and peak power requirements by 69% for walking at normal speed compared to a direct drive [12]. To validate the theoretical method, the results of calculations for the motor trajectory and optimal stiffness were included in a prosthetic foot design [4]. Walking tests showed that the method successfully overcame motor limitations. In another study, the same method including an SEA at the ankle joint was used for estimating energy and peak power requirements for a range of walking and running speeds [13]. Especially in running, high reductions could be identified when comparing SEA and direct drive. Results were almost comparable when using the same theoretical approach for a prosthetic knee [14]. Including a hip SEA did not result in benefits in the sagittal plane (walking at 0.8 m/s and 1.2 m/s, [15]).
The authors of [13,14] calculated energy requirements as the sum of positive and the absolute of negative motor work and compared their values to those achieved with a direct drive. Negative joint work can be realized by passive damping mechanisms. This technology has been already implemented in several prosthetic knees (e.g., C-Leg or 3R80, [1]). The torque required for stopping knee extension before touch-down and for stopping knee flexion after take-off (TO) and after touch-down is generated by the integrated mechanical dampers [16,17]. When excluding this negative work, reducing energy beyond the values calculated in [13,14] should be possible. Moreover, during these breaking phases, the motor could also be used to harvest energy for charging the batteries. This approach has been implemented in a orthotic knee [18] for walking and could be applied to further reduce battery requirements.
The current study addressed two specific aims. First, we investigated if energetic and peak power benefits observed for the ankle and knee SEA are also possible for a hip SEA. Energy and peak power requirements were compared between direct drive and SEA-driven joints. The combination of an energy (hip, knee) or peak power (ankle) optimized series spring stiffness and motor angle change that best matches biological torque angle profiles was identified.
Second, results on reductions for the ankle [13] and knee [14] were combined with novel results for the hip to identify the energetic requirements necessary for an actuated prosthetic or orthotic leg with three degrees of freedom. Energy requirements were calculated for situations with only positive mechanical work. We assumed that negative joint work can be generated by passive dampers.

2. Methods

2.1. Model Input Data

Previously collected data [19] were used as model input data. Subjects walked (Experiment I) and ran (Experiments I and II, Table 1) on a treadmill with integrated 3D force sensors (Kistler, 1,000 Hz) and synchronized high-speed infrared cameras (Qualisys, 240 Hz). In Experiment I, speeds were determined for each subject depending on the preferred transition speed (PTS). The mean PTS for all subjects was 2.07 m/s and represented 100%. Subjects walked and ran at 25%, 50%, 75%, 100% and 125% PTS. In Experiment II, subjects ran at fixed speeds of 3 m/s and 4 m/s. Although running speeds below 1.6 m/s are untypical in human gait, slower speeds and running-like motion in place can be performed. To analyze trends and to compare walking and running at the same speed, we decided to include running speeds down to 0.5 m/s.
Table 1. Experimental and subject characteristics (mean ± std).
Number of Subj.Age (years)Body Height (m)Body Mass (kg)Speeds (m/s)Leg Length (m)
Exp. I2125.4 ± 2.71.73 ± 0.0970.9 ± 11.70.52, 1.04, 1.55, 2.07, 2.590.96 ± 0.08
Exp. II723.7 ± 1.11.80 ± 0.1077.5 ± 8.83.0, 4.01.02 ± 0.07
For both experiments, hip, knee and ankle angles and corresponding torques (Figure 1) were calculated from force and camera data [19,20]. Torques were normalized to body mass and a resting leg length of 1 m defined as the distance between the center of mass (COM) and the center of pressure (COP) during stance. Joint angular velocities were calculated by numerical differentiation and multiplied by the torque to obtain reference joint power curves (Figure 2).
Figure 1. Hip, knee and ankle joint angle and joint torque for a gait cycle of human walking and running (mean of all subjects). Hip angle was calculated between the seventh cervical vertebra, trochanter major and a assumed rotational point at the knee (2 cm proximal to the lateral joint space on the lateral femoral condyle). The knee angle was calculated as the angle between the line connecting the greater trochanter major and the rotational knee point and the line connecting the rotational knee point and the lateral malleolus. The ankle angle was calculated by the rotational point of the knee, the lateral malleolus and the fifth metatarsophalangeal joint of the foot. Light grey lines represent slower speeds starting at 0.5 m/s. The black line represents maximum speed of 4 m/s (only running).
Actuators 03 00001 g001
Figure 2. Hip, knee and ankle joint power for a cycle of human walking and running (mean of all subjects). The light grey line represents lower speeds starting at 0.5 m/s. The black line represents maximum speed of 4 m/s (only running). The measured joint power is similar to the power necessary for a direct drive system to mimic the torque angle profile of each joint. These curves were used as a reference for calculating possible reductions in energy and peak power when using an series elastic actuator (SEA).
Actuators 03 00001 g002

2.2. Power and Energy Calculation

Actuator energy and peak power requirements were derived similar to [12,13]. In contrast to previous studies, a rotational SEA model was used to model stiffness independent of geometry and lever arm. The specified motor power represents only the necessary mechanical work and did not include system efficiencies and inertia. It was assumed that the motor needs the same amount of energy for thrusting (positive work) and damping (negative work).
Motor power P m was calculated as:
P m = M m · θ ˙ m
where M m is the motor torque and θ ˙ m is the motor angular velocity. M m is equal to the torsional spring torque, M s , and both are oppose of the external torque, M e x . θ ˙ m is the derivative of the motor angle, θ m , calculated from total actuator angle θ g and spring angle θ s .
θ m = θ g θ s
The spring angle was calculated based on Hook’s law.
M e x = K s · Δ θ s
where K s is the spring constant. The deflection of the spring, Δ x s , was calculated by subtracting the instantaneous spring angle, θ s , from the spring angle at rest, θ 0 .
Δ θ s = θ 0 θ s
Finally, the equation for calculating spring angle θ s is:
θ s = θ 0 M e x K s
By using θ s in Equation (2), motor angle θ m was calculated.
θ m = θ g + M e x K s θ 0
The derivation of Equation (6) results in motor angular velocity θ ˙ m .
θ ˙ m = θ ˙ g + M ˙ e x K s
The final equation for calculating motor power is:
P m = M m · ( θ ˙ g + M ˙ e x K s )
In Equation (8) and the figures, no absolute values of motor power were used, to get a better understanding of the mechanical joint and the resulting motor function (thrusting, damping). For calculating the peak power, only absolute values are taken into account. Energy requirement was calculated as the sum of positive and the amount of negative work.
E R = E + + | E | = P + ( t ) d t + P ( t ) d t
For the results of Section 3.2, only positive motor work was considered, and the second part of Equation (9) was not taken into account. Because normalized torques were used, the estimated power and energy requirements were also normalized to body mass. In addition, energy requirements were normalized to the distance traveled during the gait cycle, representing the cost of transport related to the SEA.
It is important to note that the theoretical SEA model used in this paper can produce torques in both directions representing the function of both extensors and flexors of all three joints.

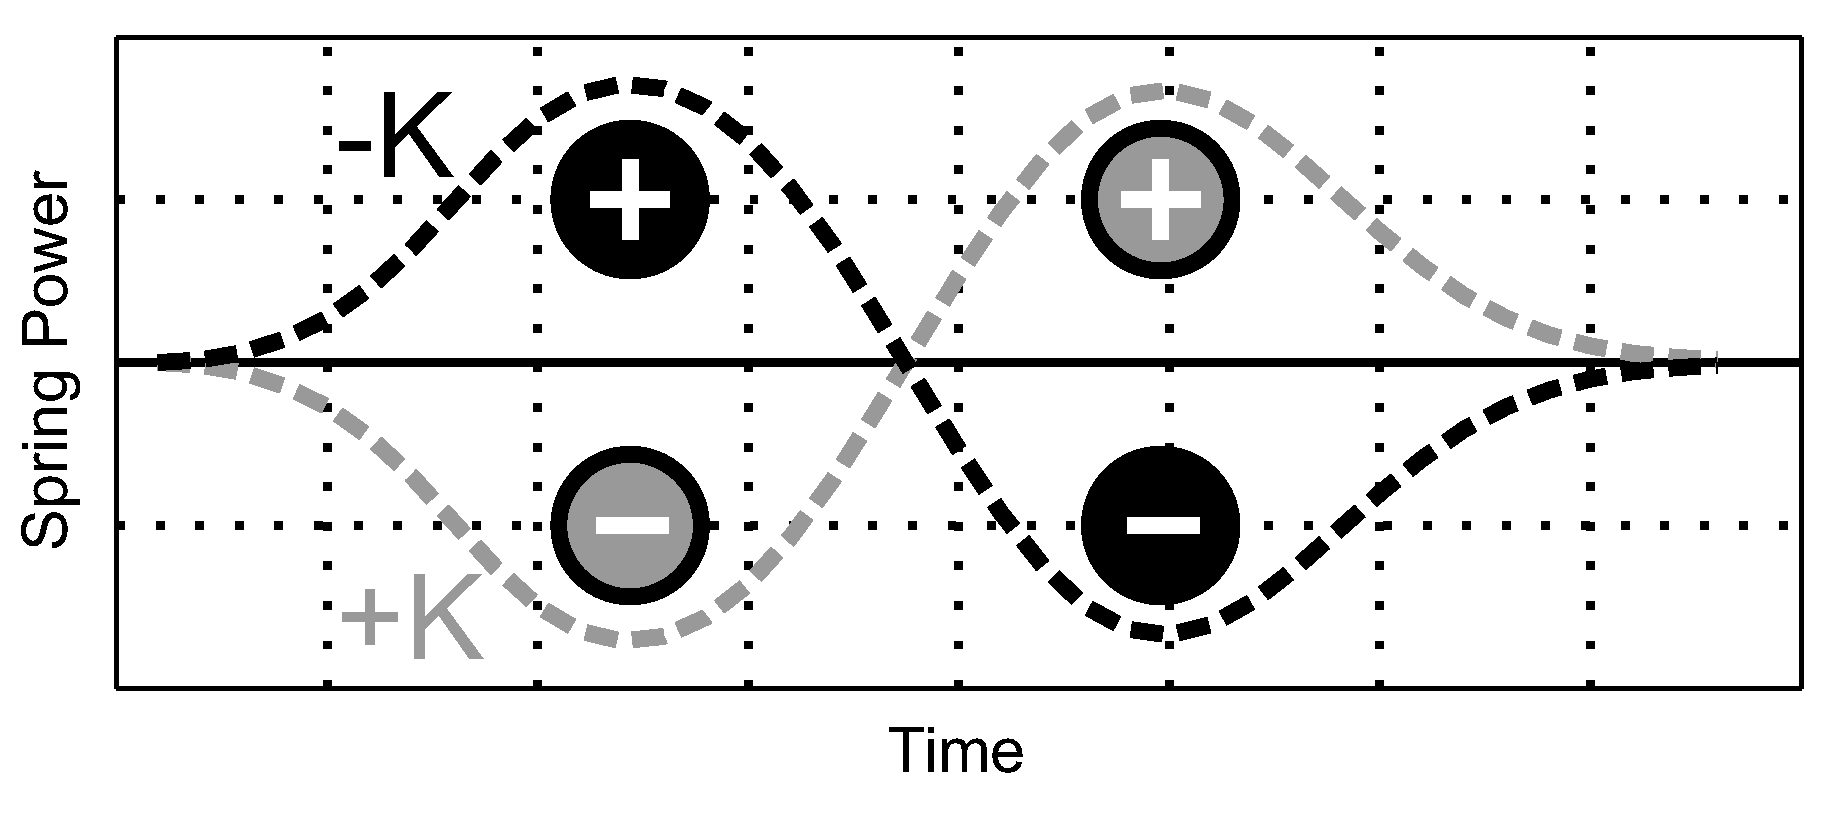
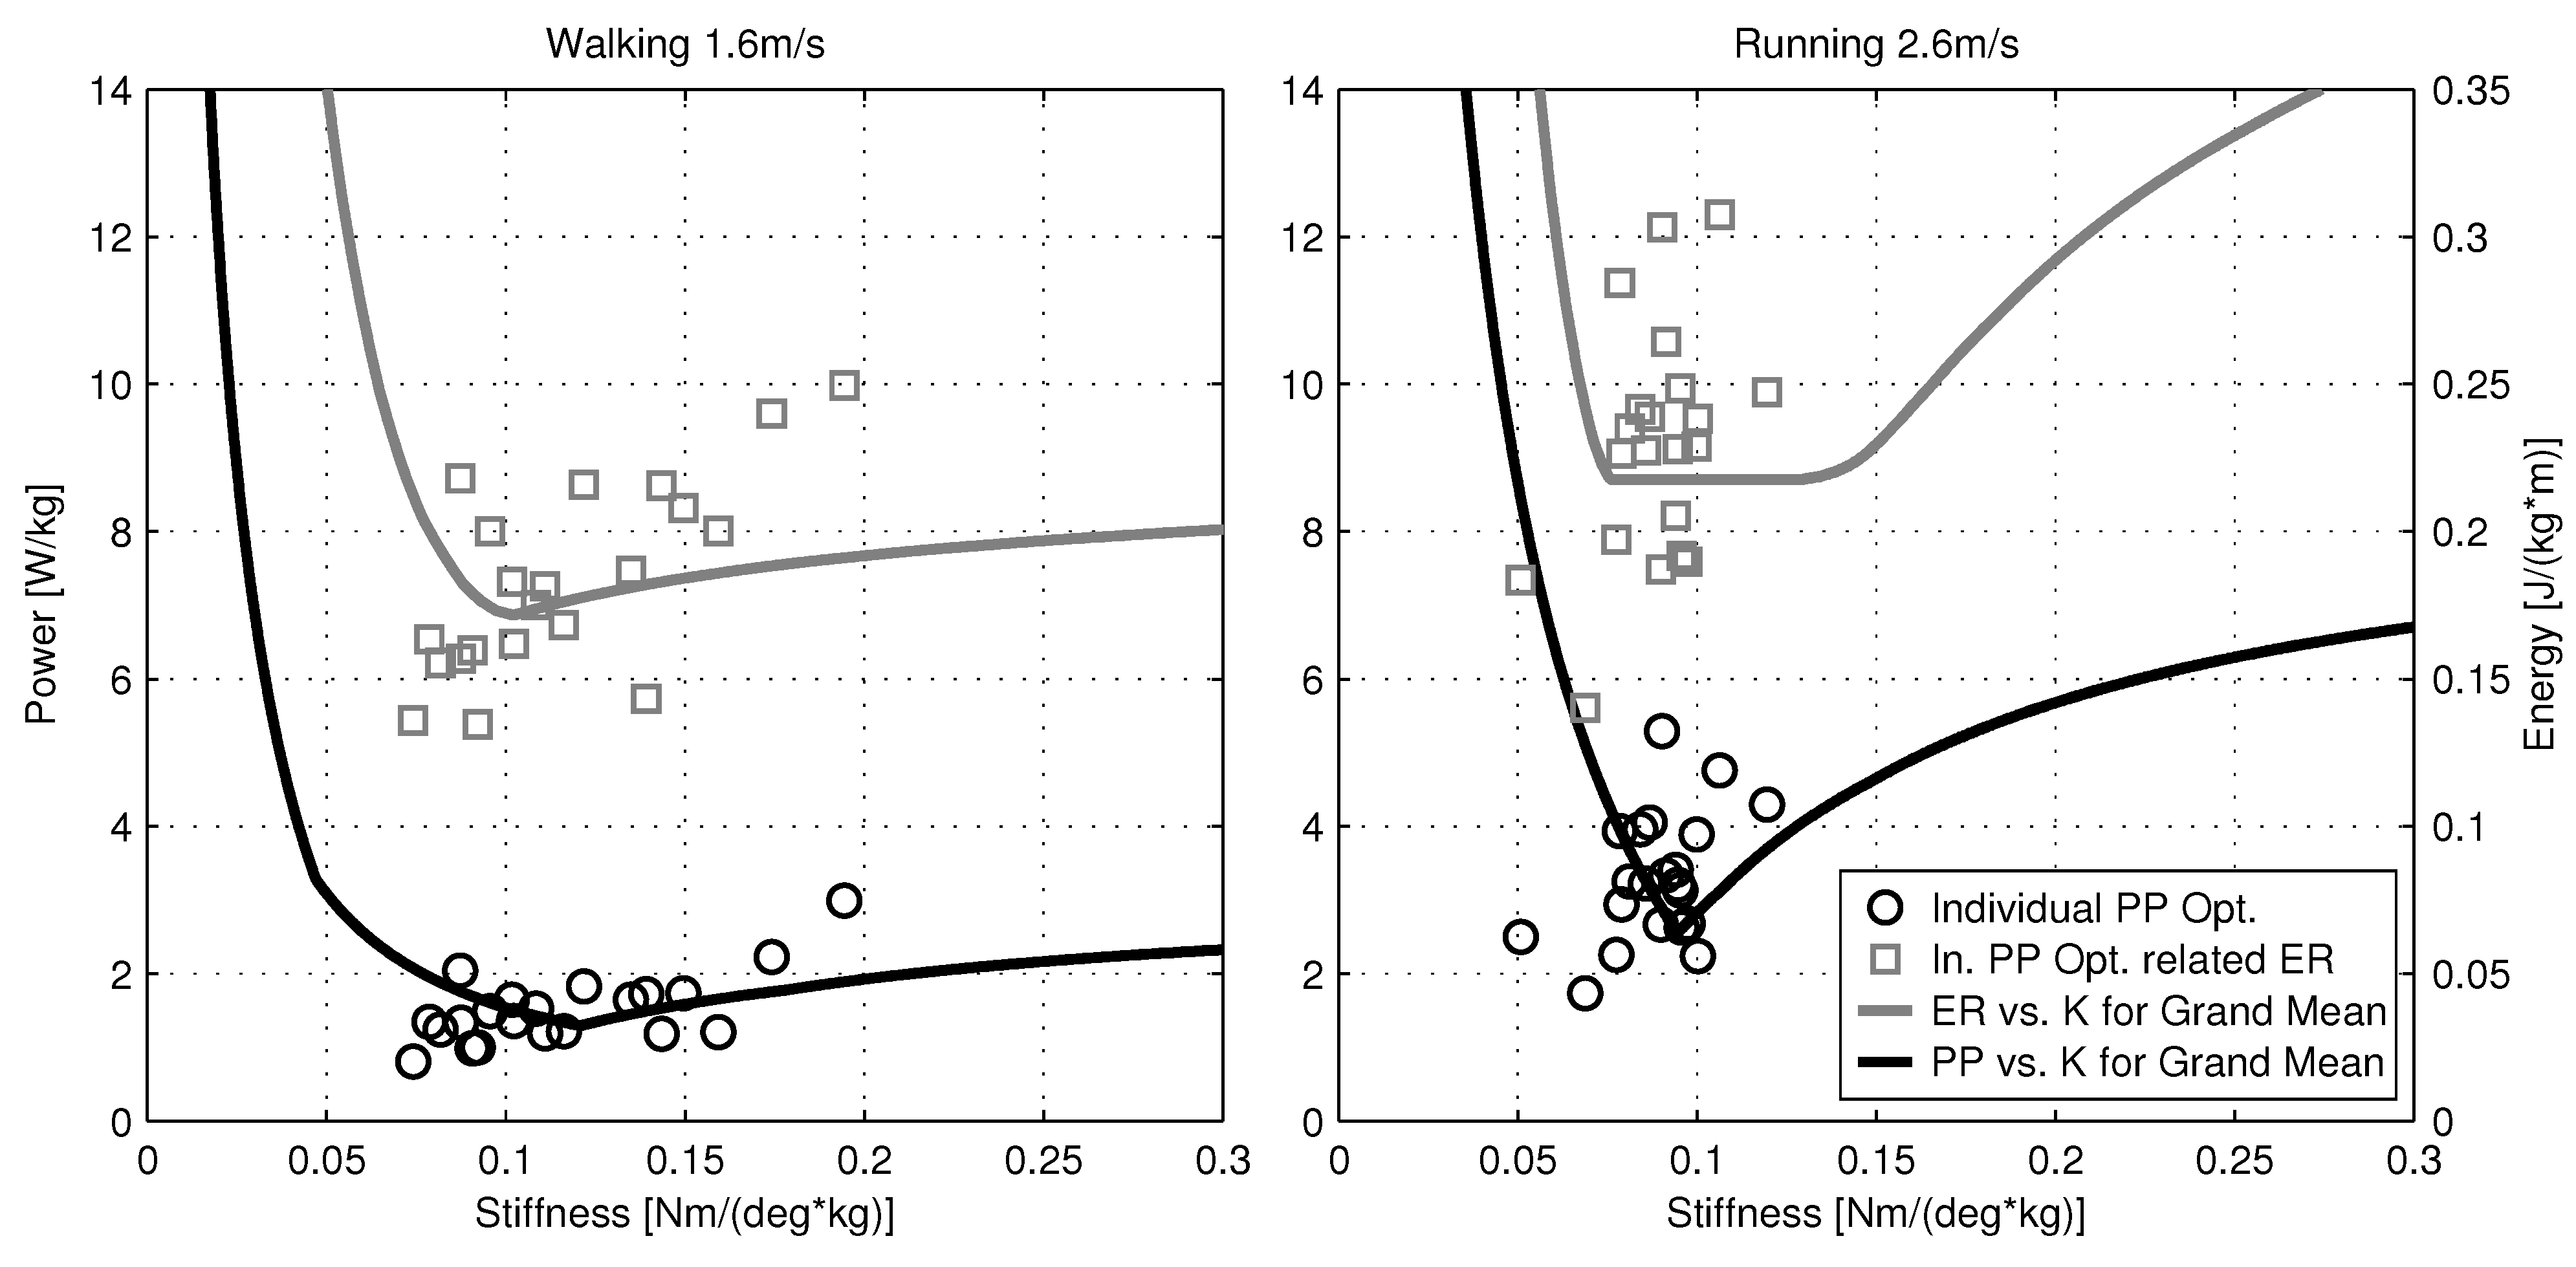
2.3. Finding the Optimal Stiffness

Optimal spring stiffness values, K s , for minimizing energy or peak power requirements were determined by a brute-force search method for each walking and running speed. Stiffness values between 0.01 Nm/(rad·kg) and 100 Nm/(rad·kg) with 0.01 Nm/(rad·kg) increments were included in Equation (8). Corresponding energy and peak power results were scanned for lowest values. The brute-force search method was used because computations require only some seconds to get a precise result from all possible solutions. Because normalized torque was used as an input, the results were normalized stiffness values (normalized to body mass).
For the hip and knee, joint stiffness was optimized for energy requirements. Grimmer et al. [13] have shown that peak power optimization at the ankle results in similar energy requirements as those observed for minimizing energy. In contrast, optimizing for minimal energy results in clearly higher peak power requirements. Hence, the ankle SEA was optimized for peak power to find K s . Minimum energy requirements and the corresponding peak power values of the SEA motor were compared to those for the direct drive.

3. Results

The main results of this theoretical investigation can be found in Figure 3 and Figure 4. Figure 3 shows the effect of series elastic elements on energy and peak power requirements for the hip, knee and ankle at various speeds for walking and running. Figure 4 shows a comparison of positive motor work between SEA and direct drive motors. It was assumed that negative work can be performed by passive dampers. The sum of positive work performed at the hip, knee and ankle was used to investigate the energy requirements of the leg in the sagittal plane.

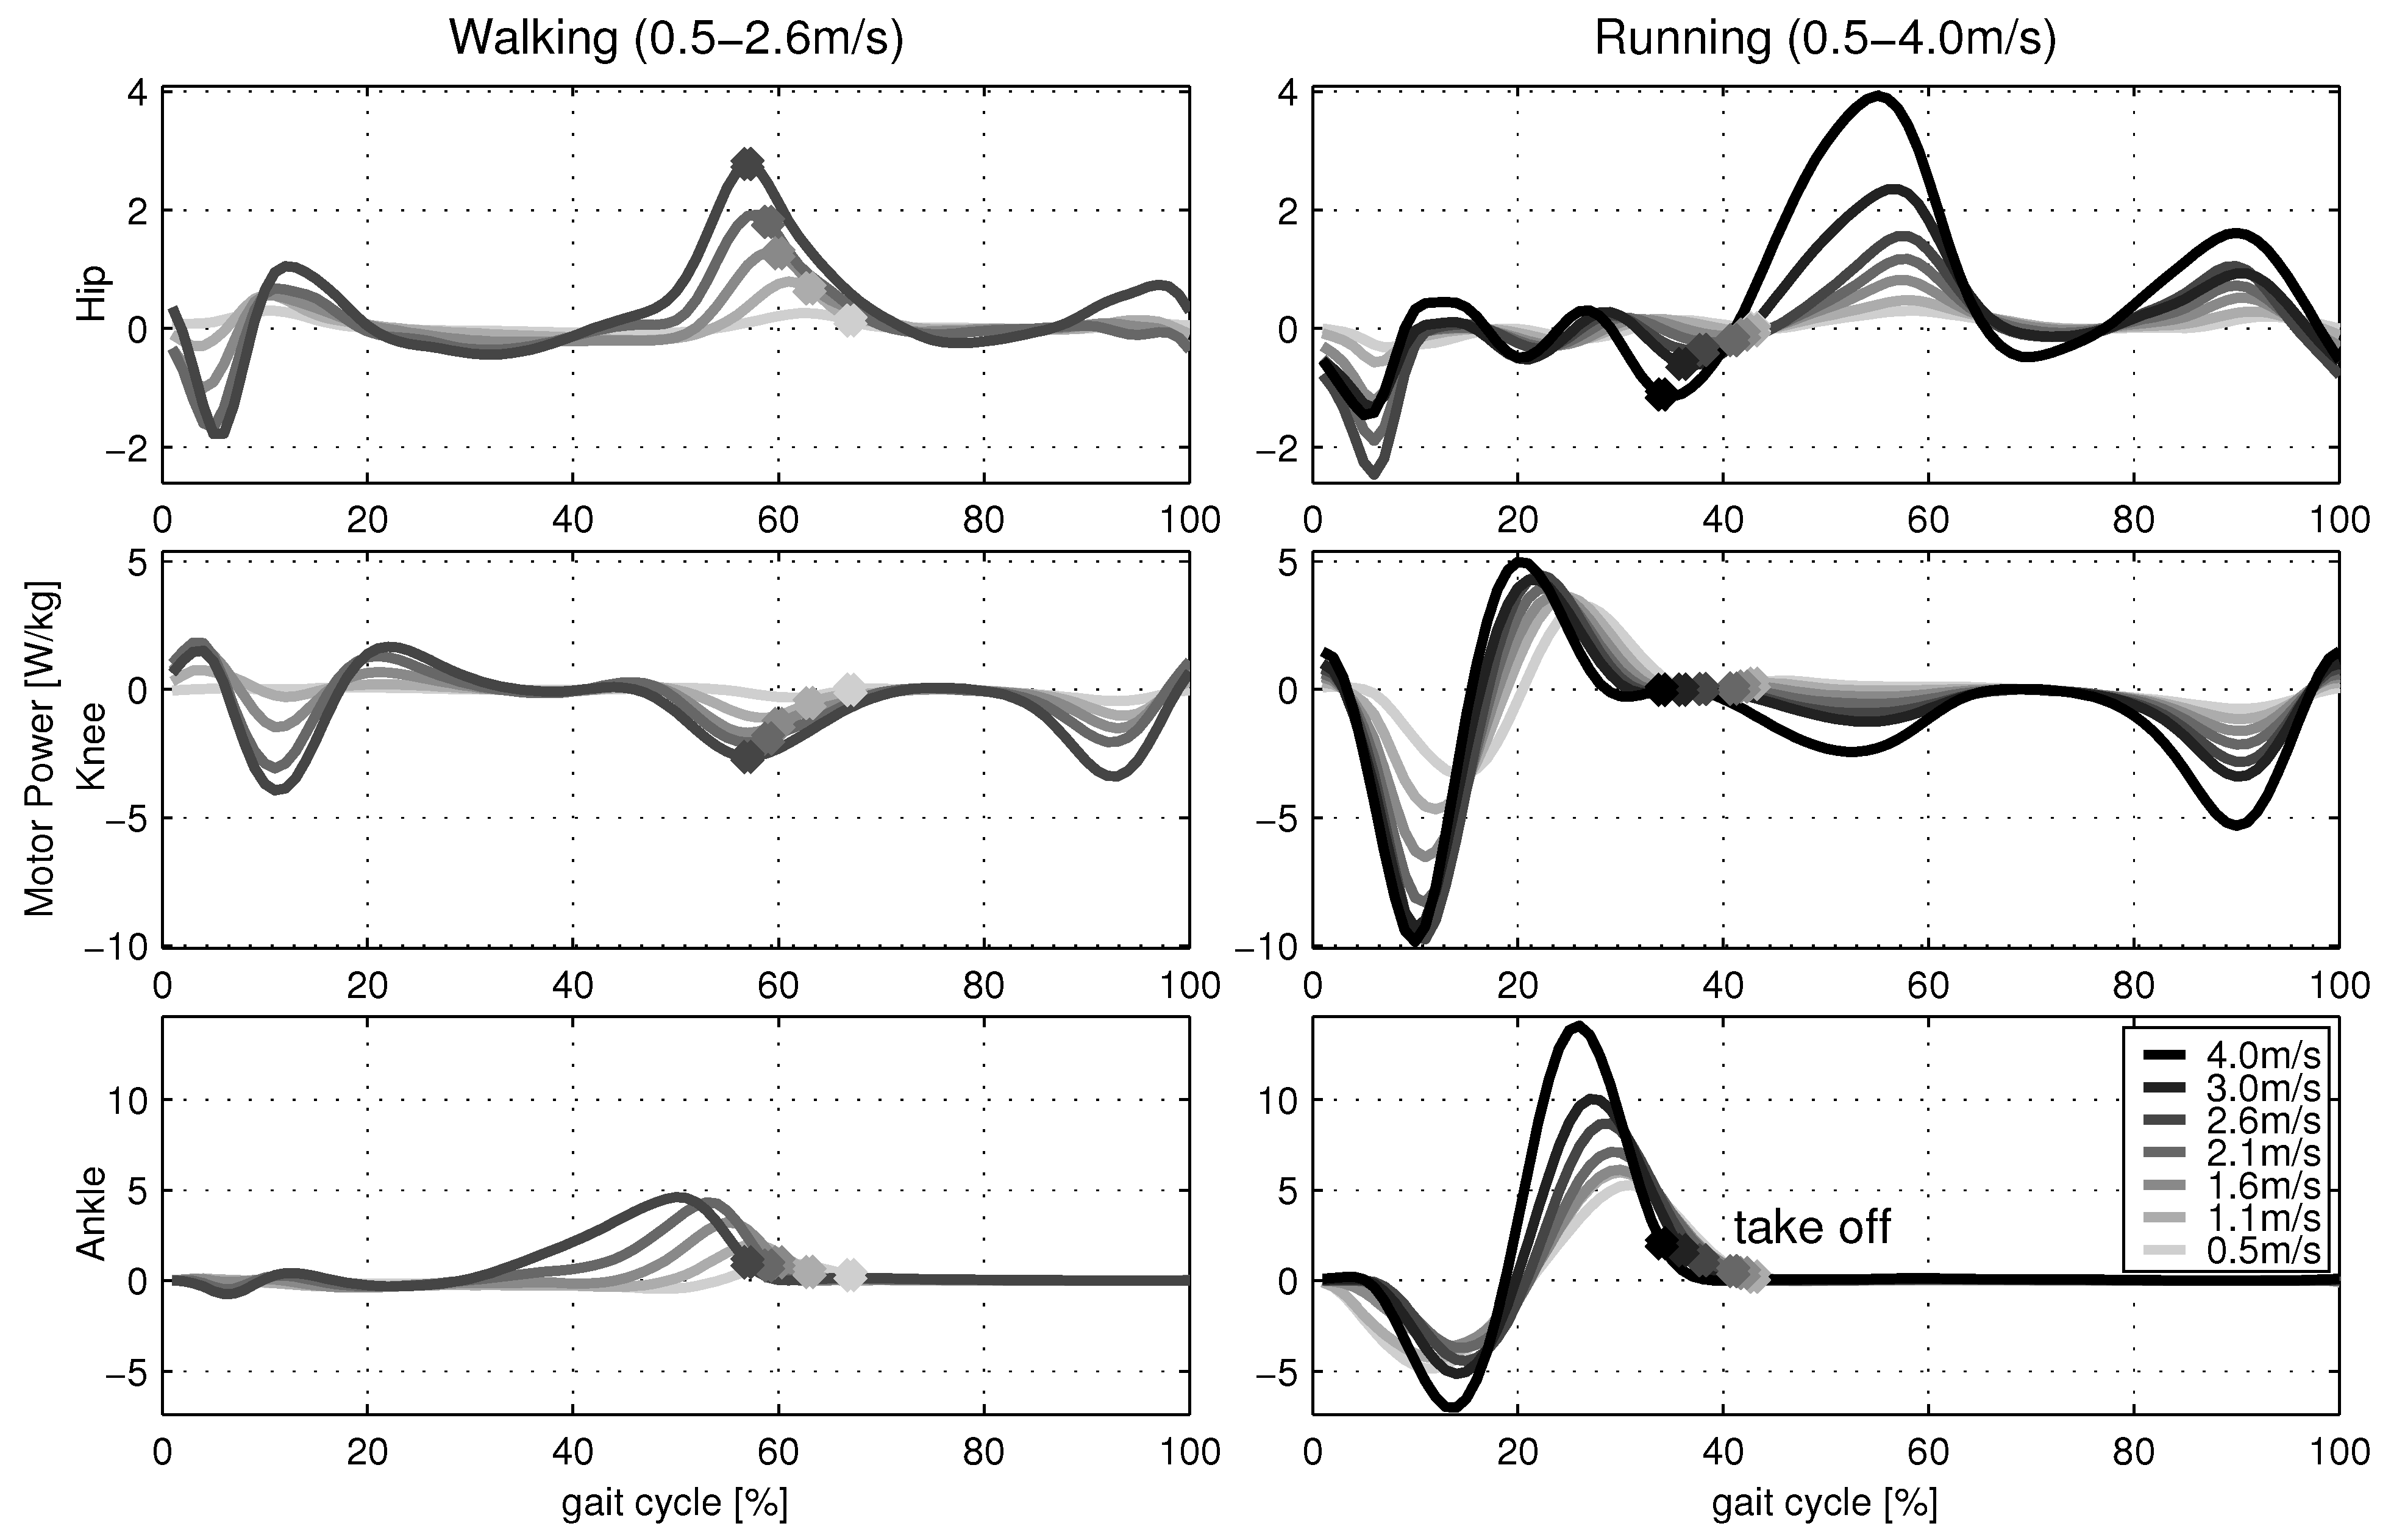
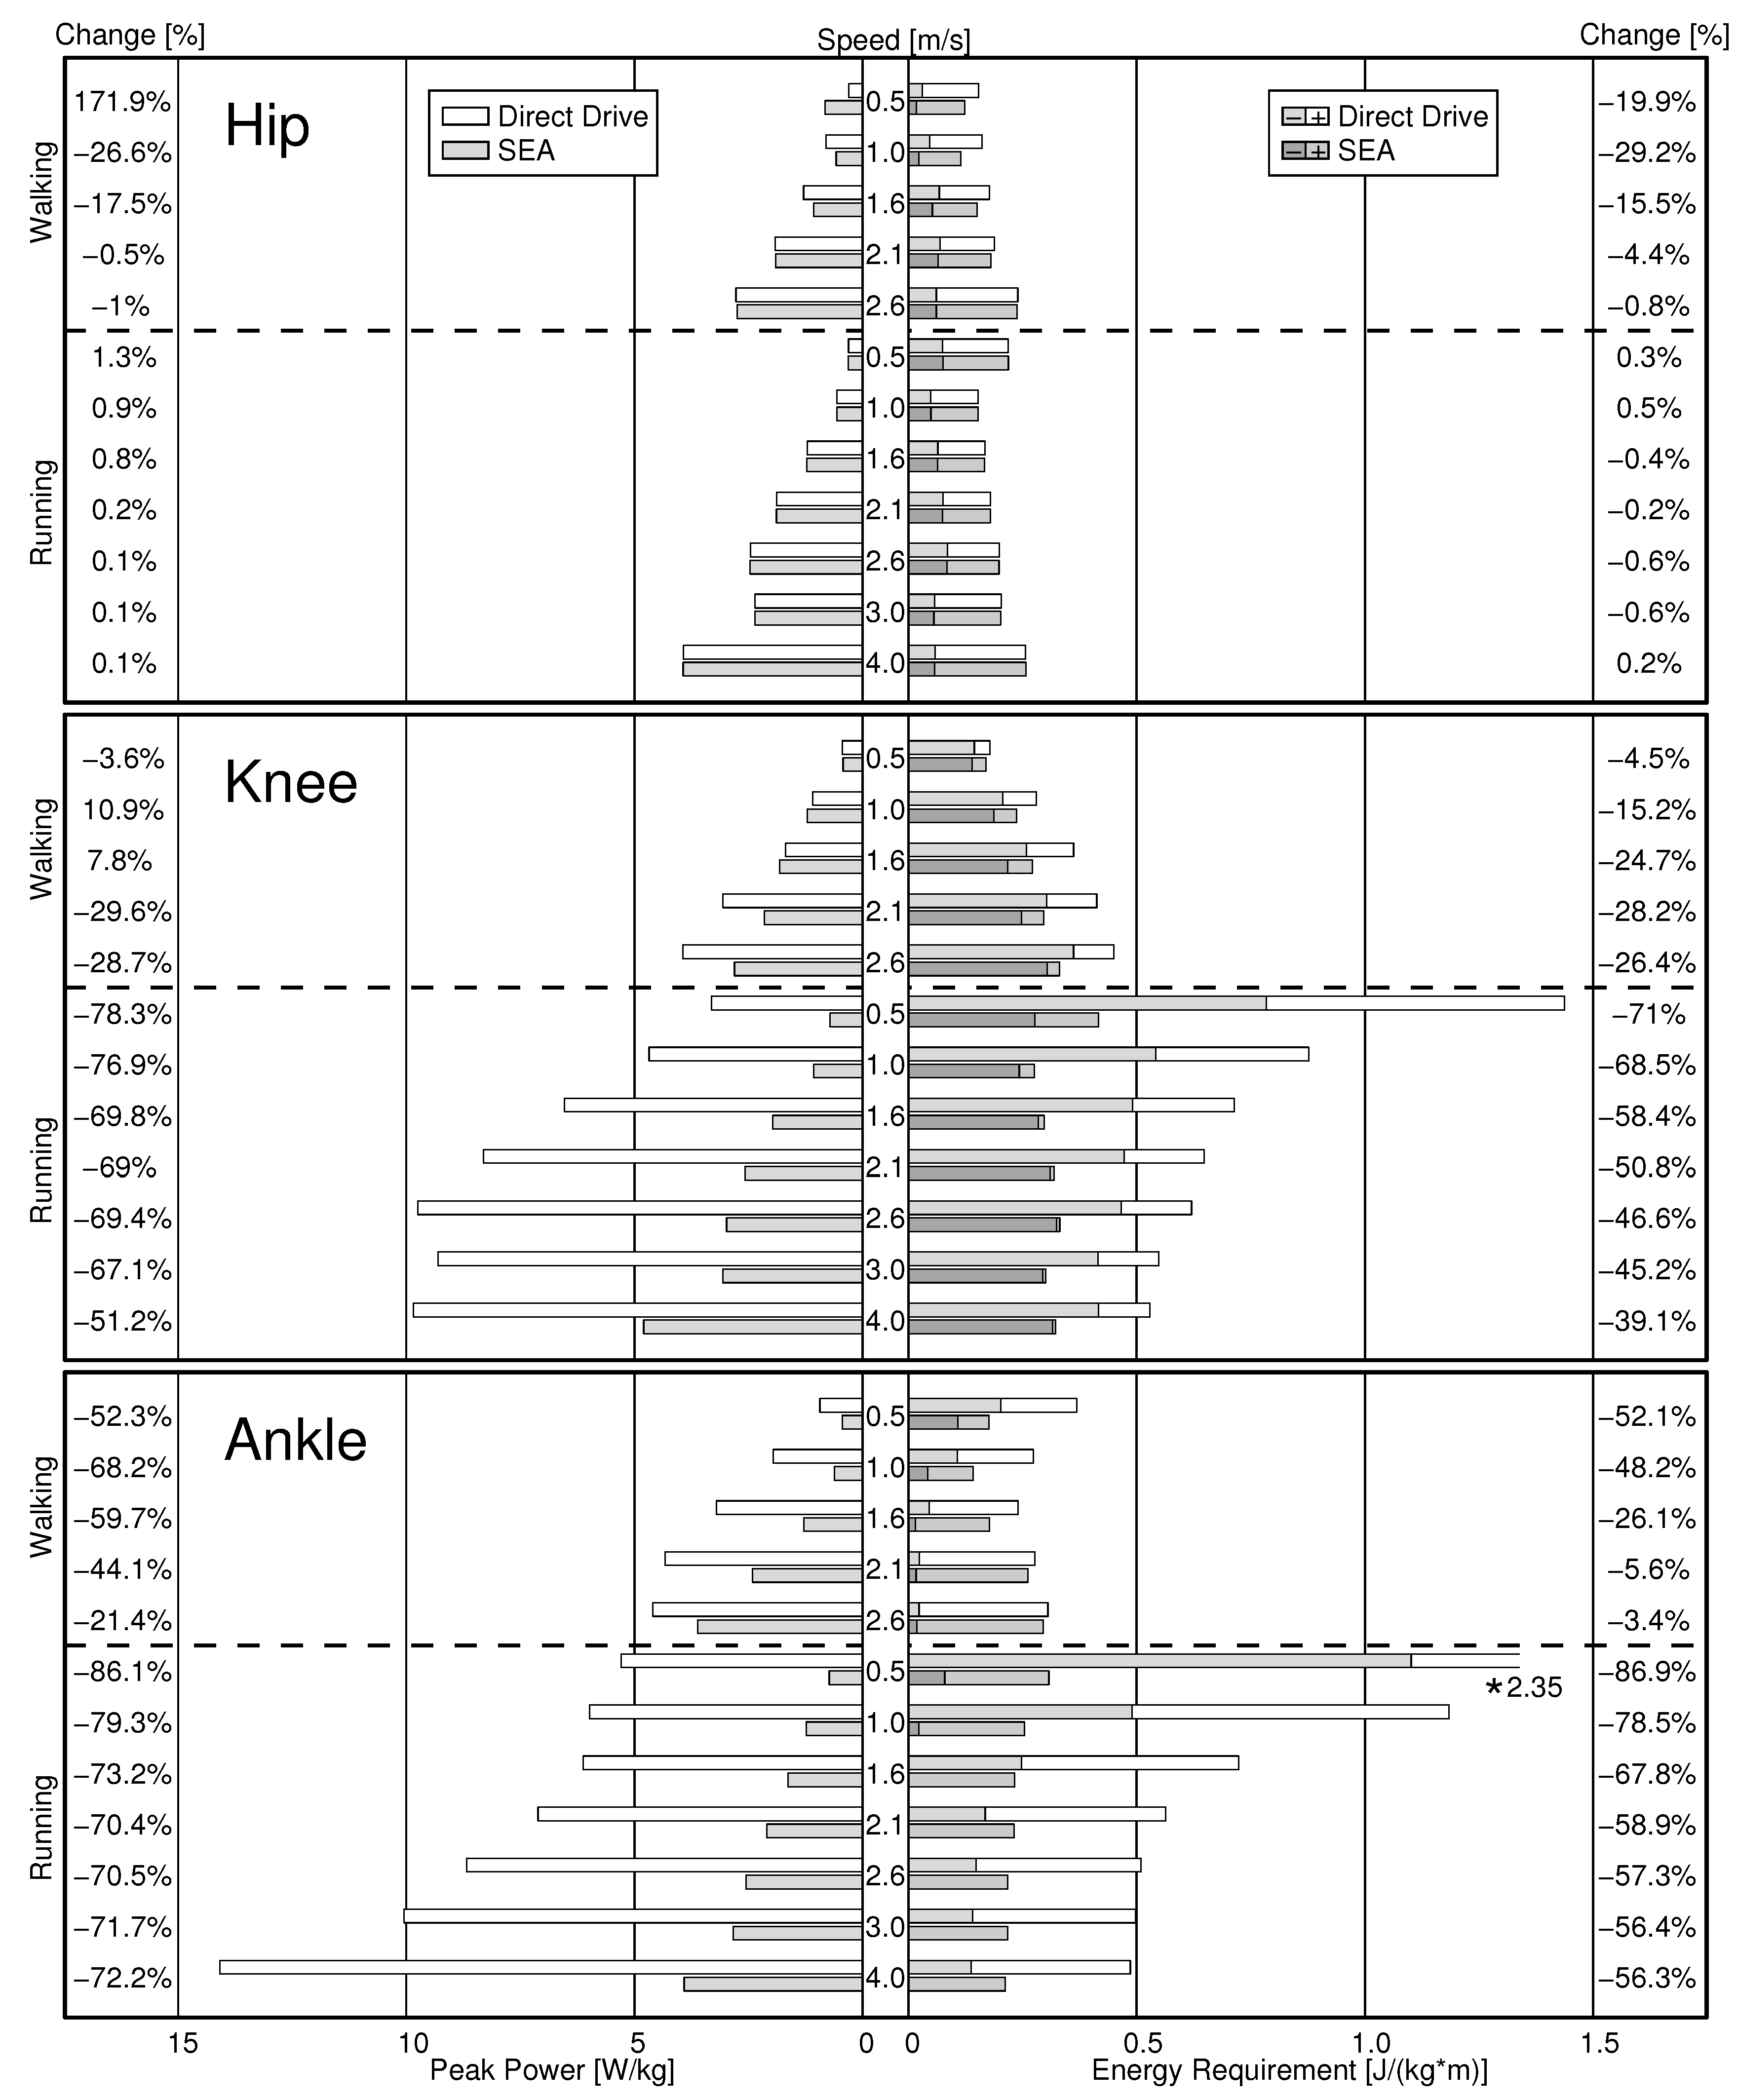
3.1. Peak Power and Energy Requirements at the Joint Level

3.1.1. Hip

When optimizing the hip SEA for minimum energy, benefits in peak power (18%–27%, Figure 3) were identified only for speeds close to preferred walking speed [21]. Peak power was drastically higher for the SEA than for the direct drive at very slow walking speed (172%). In addition, reductions in energy requirements of up to 29% were achieved for walking. For running, no considerable benefits in energy or peak power were found when using an SEA. Optimal stiffness for a hip SEA in running goes to infinity, causing the second term of Equation (8) to become zero. Consequently, θ ˙ m is equal to θ ˙ g , resulting in identical power curves for SEA and direct drive motors (Figure 5).

3.1.2. Knee

The stiffness of the knee SEA was optimized to minimize energy. Energy requirements were lower for the knee SEA compared to the direct drive for all walking (5%–28%) and running (39%–71%) speeds (Figure 3). Peak power was lower for the SEA at all running speeds (51%–78%). For walking, peak power for the SEA was higher for preferred speeds (8%–11%) and lower for speeds equal to or above PTS (about 29%).

3.1.3. Ankle

The ankle SEA was optimized to minimize peak power. Using an appropriate stiffness reduced peak power by 21% to 68% for the ankle SEA compared to the direct drive for walking and by 70% to 86% for running. In addition, energy requirements were lower for the ankle SEA than the direct drive for all walking (3%–52%) and running speeds (56%–87%, Figure 3).
Figure 3. Hip, knee and ankle joint peak power (left side) and energy requirements (right side) for different walking and running speeds for SEAs and direct drives. SEA spring stiffness was optimized to minimize energy requirements at the hip and the knee. At the ankle, spring stiffness was optimized to minimize peak power. The amount of negative work is shown as the darker parts of the energy requirement bars, and the amount of positive work is shown as the lighter parts of the energy requirement bars. The outer columns list the difference in energy and peak power requirements between the SEA and the direct drive (SEA/DD·100; in percent). The middle column lists the corresponding walking or running speeds.
Actuators 03 00001 g003

3.2. Positive Sagittal Leg Work
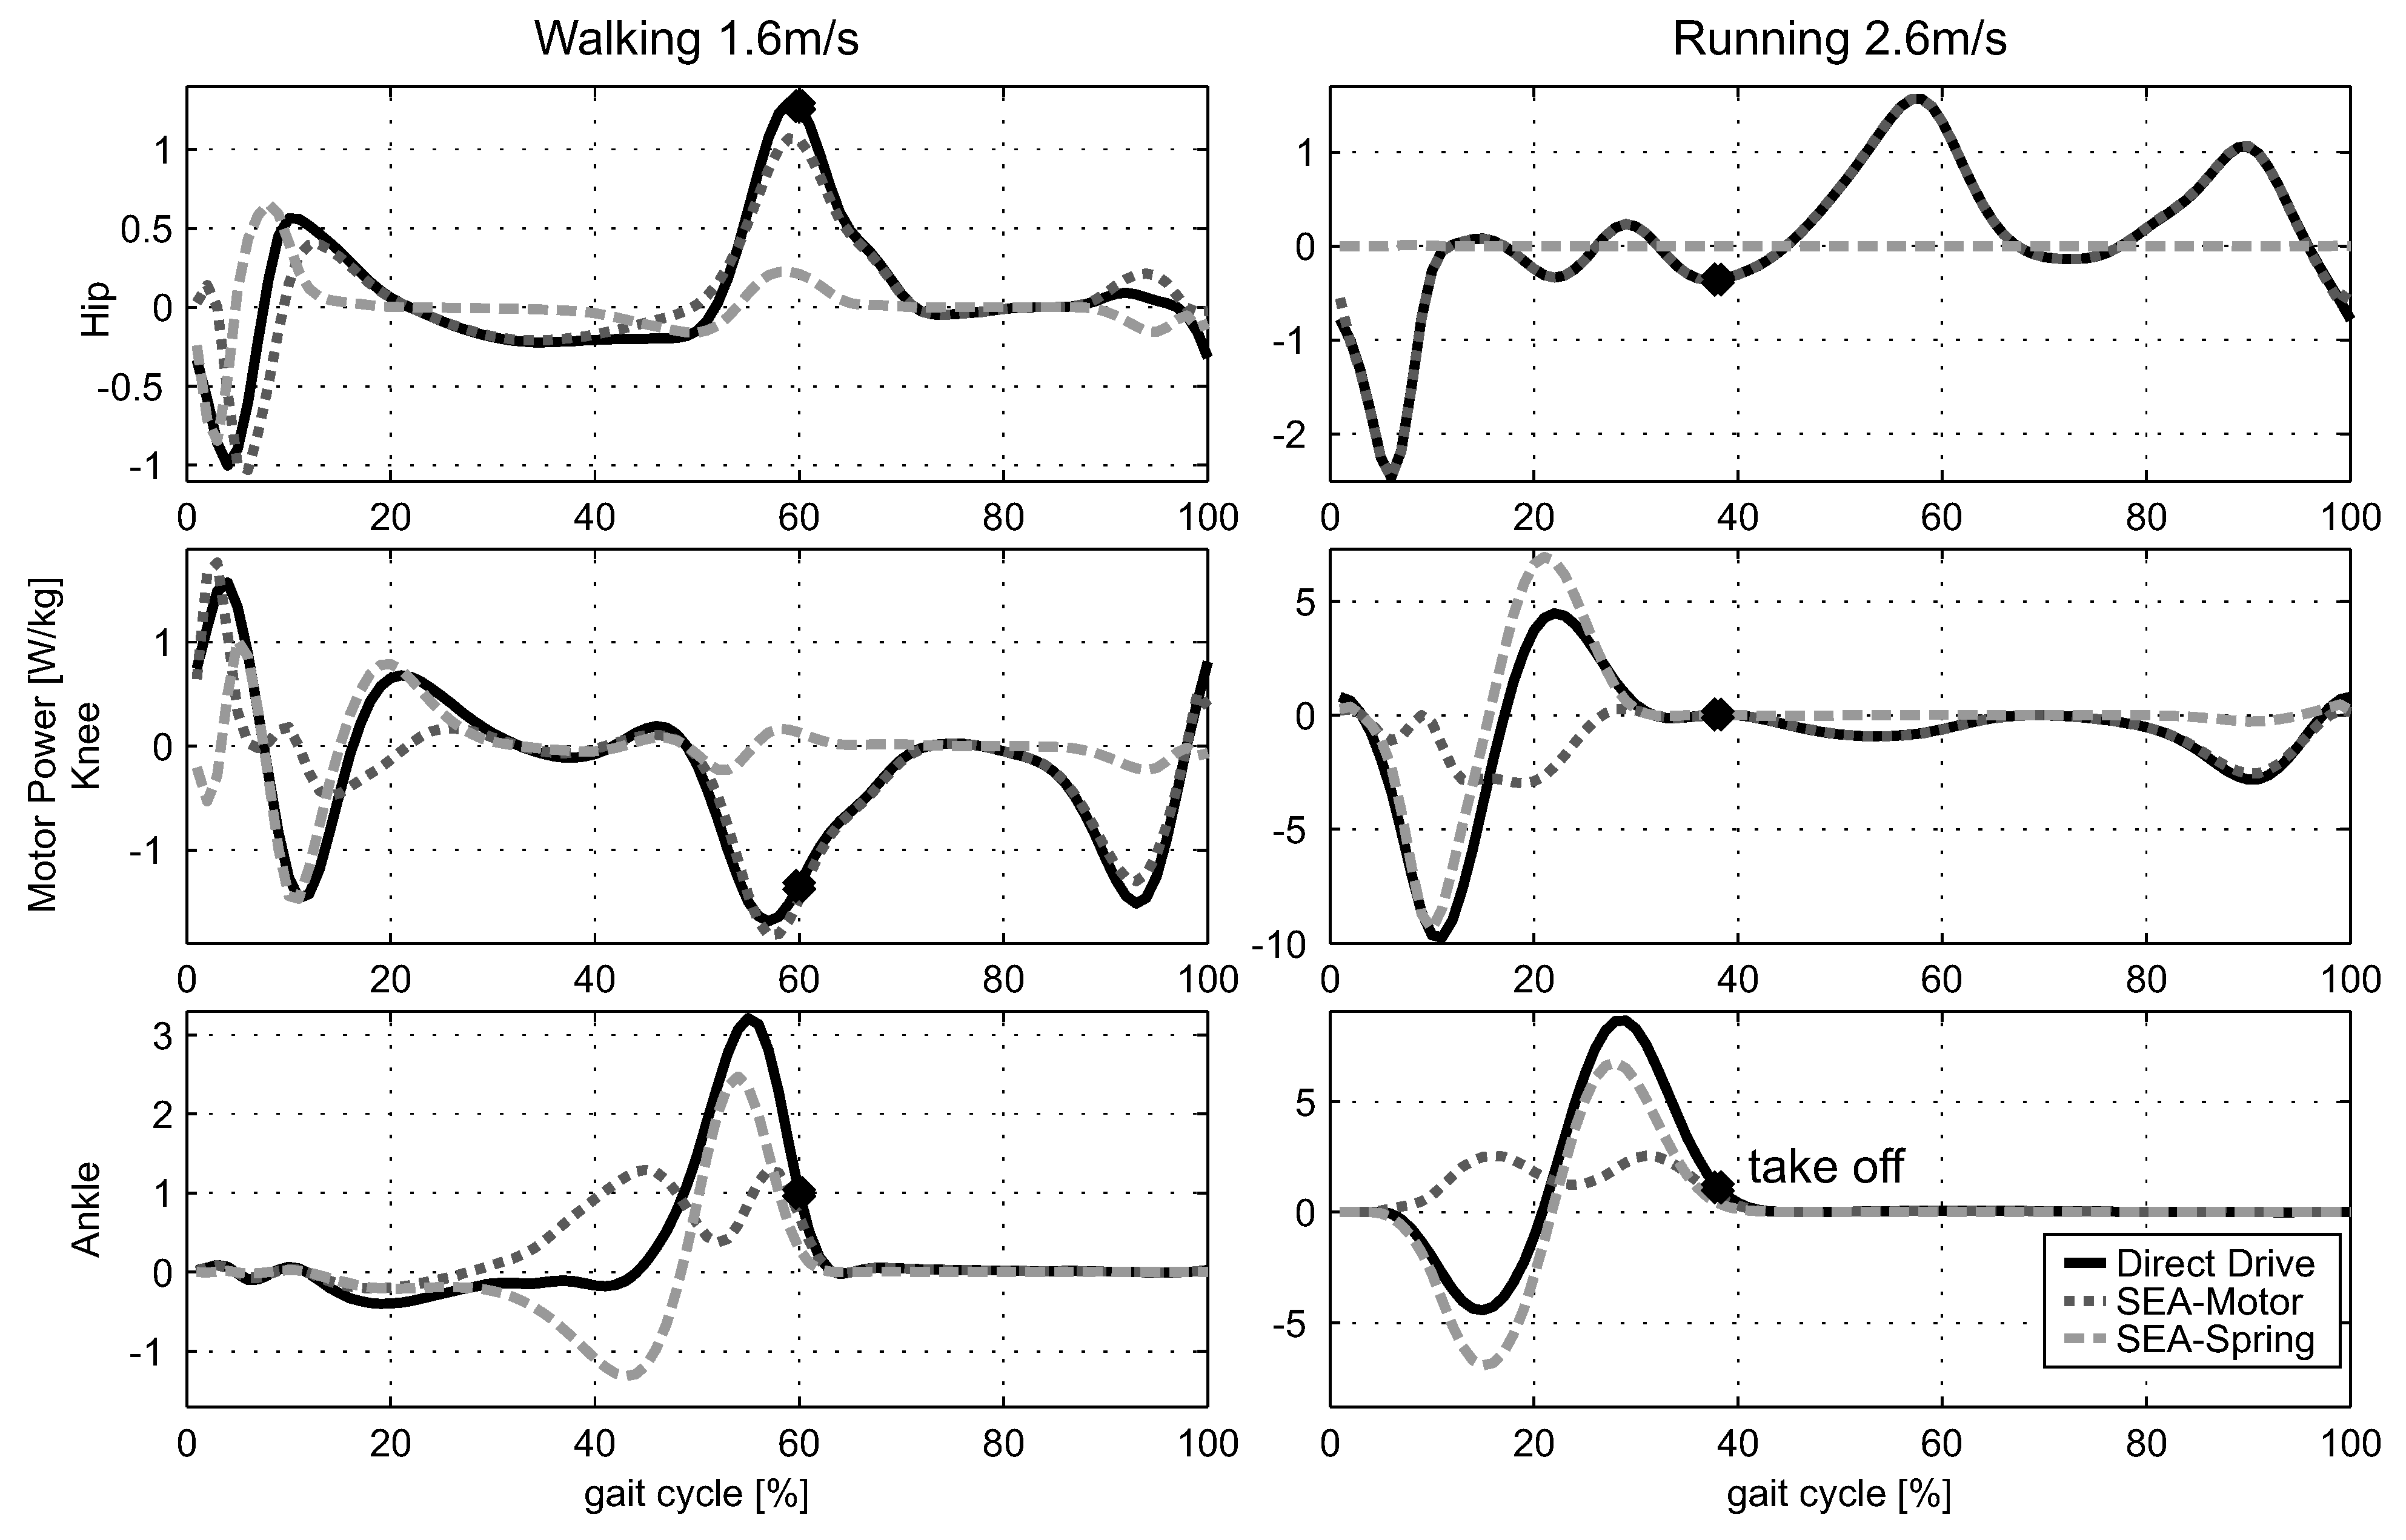
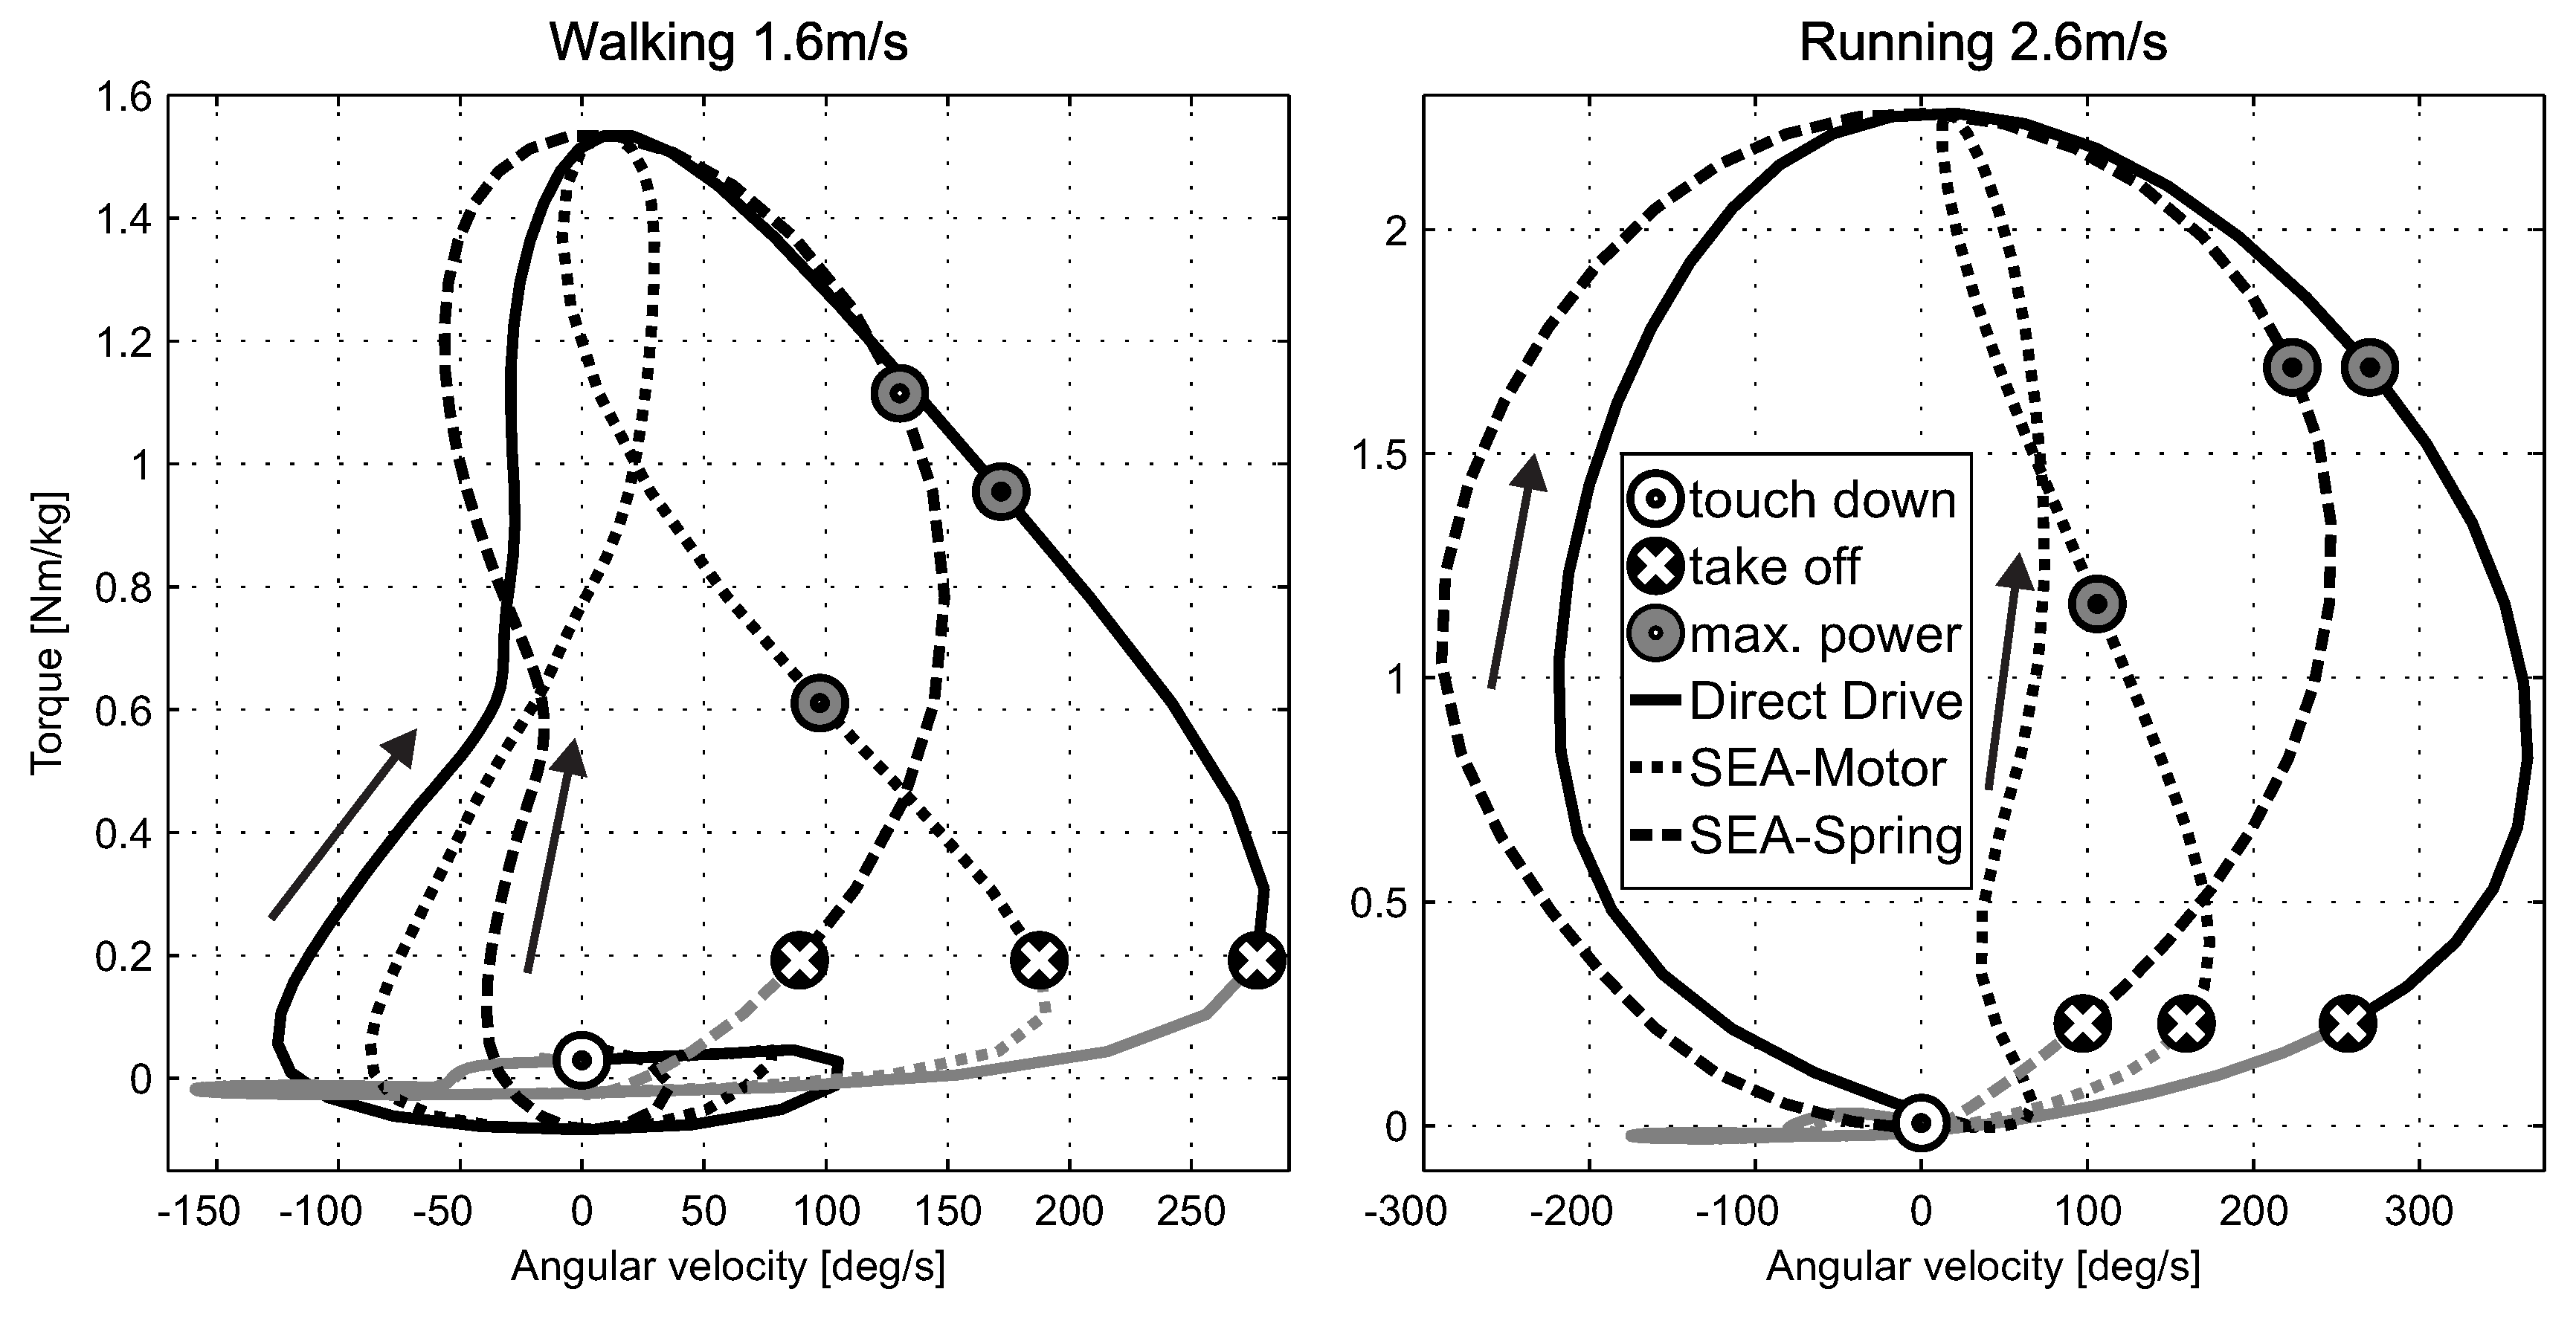
3.2.1. Direct Drive

Positive work increased with increasing walking speed (0.32–0.55 J/(kg·m)). For running, positive work decreased with increasing speeds up to 2.6 m/s (2.04–0.66 J/(kg·m)) and increased slightly for speeds beyond (Figure 4).
Figure 4. Absolute (top) and relative (bottom) positive motor work for a direct drive (DD, left)-driven leg (hip, knee and ankle) compared to a series elastic actuator (SEA, right)-driven leg for mimicking walking (W 0.5 m/s–W 2.6 m/s) and running (R 0.5 m/s–R 4.0 m/s). The preferred transition speed (PTS) where subjects typically change gait between walking and running was 2.1 m/s. Note that for some speeds, the total positive motor work does not add up to 100%, because relative motor work values were rounded to integers.
Actuators 03 00001 g004
The main contribution to the required energy was generated by the ankle joint (47%–61%). For walking, the hip was a more important energy source than the knee, especially at lower and higher speeds. In contrast, for running, the knee was a more important energy source than the hip for speeds up to 2.6 m/s, while the hip played an increasing role for speeds exceeding 2.6 m/s (Figure 4).

3.2.2. Series Elastic Actuator

Compared to a direct drive, the total required positive motor work was lower for the SEA-driven joints (14% to 39% walking) especially for running (37% to 75%, Figure 4). For both walking and running, the differences in total required work between the SEA and the direct drive decreased with increasing speed. The main reduction in total required work for the SEA compared to the direct drive was observed at the ankle and knee. With an SEA knee, no positive work was required for running. The ratio for providing overall positive leg work increases drastically for the hip joint.
Beyond the preferred transition speed (PTS, 2.1 m/s), less positive work was required for running (0.34 J/(kg·m)) than for walking (0.4 J/(kg·m); see Figure 4).

3.3. Stiffness

For walking, hip SEA stiffness increased with speed (optimized to minimize energy, Table 2). The least energy consumption a the highest walking and all running speeds was achieved using a rigid direct drive hip.
Table 2. Predicted optimal SEA stiffness values, K r (Nm/(deg·kg)), for minimizing peak power at the ankle and minimizing energy requirements at the knee and the hip (Figure 3) for walking and running at a wide range of speeds. Rotational stiffness values were normalized to body mass.
Gait Speed (m/s)Walking Running
0.51.01.62.12.6 0.51.01.62.12.63.04.0
Hip0.07120.18170.42380.9821rigid rigidrigidrigidrigidrigidrigidrigid
Knee0.18480.08730.10580.12150.1274 0.1370.12230.11590.12340.12920.1410.1508
Ankle0.11360.08570.12080.18220.2536 0.08870.09290.09370.09410.09460.11520.1239
At the knee, joint stiffness increased with increasing walking speed above 0.5 m/s (optimized to minimize energy requirements). For running, joint stiffness decreased with increasing speeds up to 1.6 m/s and increased for speeds beyond 1.6 m/s up to 4 m/s.
At the ankle, joint stiffness increased with increasing speeds for walking (above 0.5 m/s) and running (optimized to minimize peak power). Compared to walking, joint stiffness remained relatively constant across running speeds.

4. Discussion

In this study, we estimated the reduction in motor requirements for monoarticular SEAs compared to direct drives at the hip, knee and ankle during walking and running. While large energy and peak power benefits were identified for the ankle and the knee, for the hip, smaller benefits were observed for walking and none for running. Wang et al. [15] reported peak power reductions of up to 79% for slow to preferred walking speeds for a series spring at the ankle, which are higher than reductions predicted in our calculations (68%). Similar to our results, Wang et al. found no peak power benefits at the knee at these speeds. In contrast to our findings (27% reduction), no benefits in peak power at the hip were identified around preferred walking speed [15]. Moreover, Wang et al. observed peak power benefits at the hip of up to 60% for abduction and adduction. Because both methods are similar, the observed differences are likely mainly caused by differences in the torque and angle input data. In our study, we observed large differences between subjects (see Subsection 4.3), and hence, it is possible that the differences in results between our study and Wang et al. are caused by differences in study cohorts (Wang et al., N = 8 subjects; 24 years, 1.8 m, 69 kg).

4.1. Reason for the SEA Benefits

Interestingly, peak power and energy requirements were not reduced by tuning the SEA spring at the hip at any running speed. In contrast to the ankle, for walking, none or small reductions were observed for the hip and the knee. Especially running largely benefits from a serial spring at the knee and the ankle joint. Motor power is the product of required motor torque and motor velocity, and hence, at least one of the parameters must be reduced to increase system efficiency. As discussed by Grimmer et al. [22], motor torque can be reduced by a parallel spring, and motor velocity can be reduced by a series spring. Reductions in motor velocity are shown in Figure 6 for an SEA at the ankle. Because the spring generates some of the joint rotation, the motor has a smaller range of motion to match joint torque-angle curves, and the motor velocity decreases. Using this effect, peak power and energy requirements can be reduced for the SEA motor, as shown in Figure 5.
Figure 5. Hip, knee and ankle power for the gait cycle in human walking at 1.6 m/s and running at 2.6 m/s (mean of all subjects). The power is shown for the direct drive (black solid) and when an SEA drives the joint. For the latter, power is shared between the SEA motor (dark grey dotted) and the SEA spring (light grey dashed). The combination of the SEA motor and the SEA spring matches the direct drive situation. For the hip, for running, a rigid system without a spring requires the least energy. As a result, the SEA motor matches the direct drive behavior.
Actuators 03 00001 g005
Both parameters benefit from the elastic properties of the spring: energy can be stored and released by spring deflection. For instance, for the ankle for walking, the spring is elongated between 30% and 50% of the gait cycle. Energy is saved in the spring to be released during push off to support the motor. Similar effects can be identified for the knee and the hip for walking. For running, only the ankle and the knee benefit from using a series spring. The largest reductions in motor peak power and energy requirements are achieved when the series spring stiffness matches the slope of the torque-angle curves. The results of our optimization showed that stiffness values were within the ascending and descending parts of the torque-angle profiles (dashed lines, Figure 7). For example, for running, the ankle torque increases and the ankle angle decreases in the first 20% of the gait cycle. During this phase, the spring is loaded, which can be also observed for the power curves (Figure 5). The opposite happens from 20% to 40% of the gait cycle, where the torque decreases and the angle increases, and the spring is unloaded and releases the energy for push-off.
The stiffness results show that optimal joint stiffness can be approximated by estimating the mean slope of the joint torque-angle profile during the stance phase, as illustrated by the dashed lines in Figure 7. This stiffness closely resembles the smallest peak power and energy requirements. In contrast to an approximation, the optimization method used in our study provided a more accurate stiffness value, because it is optimized for selected criteria, such as the peak power or energy requirement.
Figure 6. Ankle torque: angular velocity curves for walking at 1.6 m/s and running at 2.6 m/s. The solid line represents human data, which is similar to that for a direct drive. The dotted line represents data for the SEA motor and the dashed line data for the SEA spring. Stance phase is indicated by a black line and flight phase by a grey line. The stance phase starts with touch-down and ends with take-off. The maximum power during push off is indicated for each case. Arrows indicate the path direction during the gait cycle. The series spring helps to reduce motor velocity, resulting in lower peak power.
Actuators 03 00001 g006
The brute-force method scanned only the positive stiffness region. However, we also identified optimal negative solutions for K for settings where a rigid system provided the best performance in the positive region (Table 2). While a spring with positive stiffness will first store the energy and release it later (Figure 8), a spring with negative stiffness would first release the energy to the system, and subsequently, energy is required to return it to the original state. Because the latter behavior is not realistic for a simple SEA, all negative stiffness solutions were not included in this investigation.
Figure 7. Hip, knee and ankle torque-angle curves for human walking at 1.6 m/s and running at 2.6 m/s (mean of all subjects). Arrows indicate the path direction during the gait cycle. The stance phase is shown in black, and the swing phase is shown in grey. Touch-down and take-off are indicated by a big dot. Small dots characterize time increments of 10% of the gait cycle starting at touch-down. The dashed line represents the slope of the optimal series stiffness listed in Table 2.
Actuators 03 00001 g007
Figure 8. Power curves for positive (+K) and negative (–K) stiffness when a load is applied. Because negative stiffness cannot be realized by an SEA, the corresponding results were neglected. In these cases, a rigid direct drive resulted in the smallest energetic requirements (Table 2).
Actuators 03 00001 g008
We believe that the mechanism of releasing energy first and subsequently returning it back may be realized through joint coupling. For instance, biarticular springs could be loaded by the knee, and this energy could be transferred to the hip. Hence, a resultant torque at the hip may behave similar to a spring with negative stiffness.
In addition to biarticular structures, non-linear elastic behavior, which is also found in nature, may contribute to the system’s efficiency. Non-linear elastic behavior could be implemented by changing the length of the lever arm or introducing non-linear stiffness. A progressive spring behavior could help to use the same design (no tuning of stiffness) for mimicking speed-dependent increases in optimal stiffness values identified for walking and running at all three joints (Table 2).

4.2. Positive Leg Work

The distribution of positive work necessary for driving the leg joints changes when using an SEA instead of a direct drive. Compared to the literature [23], our results for the direct drive indicate a smaller influence of the hip and greater influence of the ankle on positive work (about 10% for walking and running). Although Farris et al. [23] only analyzed speeds above 2 m/s, their data shows that with increasing running speed, the ankle and knee become less important contributors of positive energy, and the hip becomes an increasingly important contributor of positive energy (32% at 2 m/s to 39% at 3.25 m/s).
Farris et al. [23] proposed in vivo studies to distinguish between the positive work done by the muscle fascicles and the positive work done by the tendons. Our approach may represent an alternative approach for estimating the possible effects of work performed by the tendons. SEAs require up to 75% less absolute positive work than direct drives (Figure 4).
In our model, all the elastic actuators are monoarticular. We assume that biarticular SEAs can further decrease the positive work provided by motors, which is supported by simulations that use similar structures in principle [24] and with a muscle-like arrangement [25].
For running with SEA, the knee requires almost no positive work, indicating that a damping mechanism combined with a spring can provide nearly all the work required for mimicking the knee torque angle behavior.
We observed an interesting phenomenon for the positive work at the preferred transition speed (PTS) of 2.1 m/s. For direct drives, running required more positive work than walking at all speeds (Figure 4). However, for the SEAs, a change happens at PTS, where running needs less positive mechanical energy than walking. This behavior was also observed for the total mechanical work of the ankle and knee (Figure 3). A similar phenomenon has been previously observed in oxygen consumption experiments [26] and for more complex humanoid models [27]. Hence, in agreement with [27], the results of our study suggest that muscle mechanical energy expenditure may not be the only determinant, but it could be one important determinant for the preferred gait mode at a given speed.

4.3. Sensitivity of Results

Requirements for the joints were calculated from mean joint angle and mean joint torque data of up to 21 subjects (grand mean). For single subject mean torque and mean angle curves, an individual optimal K for minimizing peak power and energy requirements can be calculated. Exemplary results for the ankle of the 21 subject are presented in (Figure 9). Similar results can be obtained for the knee and the hip. In the worst case, individual peak power at the ankle was more than twice (231%) the grand mean. The corresponding standard deviation (SD) for peak power was approximately 32% for walking at 1.6 m/s and approximately 27% for running at 2.6 m/s. The corresponding energy requirements could increase to approximately 145% (SD 18% for walking and running). In addition, stiffness varied between subjects, and the SD for optimal stiffnesses was 29% for walking and 16% for running.
Figure 9. Peak power (black) and energy requirements (grey) in relation to spring stiffness K for walking at 1.6 m/s (left) and running at 2.6 m/s (right). The solid curves represent the values represent values for mean joint angle and mean joint torque as an input (21 subjects; grand mean). Single subject torque and angle curves were used to identify individual peak power optimum (small circles) and related stiffness. The corresponding individual energy requirement is indicated by a grey rectangle. In the worst case, peak power is more than two times the grand mean (231%), and the energy requirement is up to 145% of the grand mean.
Actuators 03 00001 g009
The large SD of the overall mean stiffness indicates that peak power and energy requirements may be rather high for some amputees when using it. The V-shape of the power-stiffness curve compared to the energy-stiffness curve (Figure 9) suggests that, especially for running, the energy requirement is less sensitive to a suboptimal stiffness than peak power. Both energy and peak power are more sensitive to below than to above optimal stiffness values.
The predicted optimal SEA stiffness values (Table 2) depended on speed and gait. A simple mechanism suitable for all speeds for walking and running should ensure a constant stiffness. Grimmer et al. [13] showed how a constant stiffness influences peak power and energy requirements at the ankle and identified an optimal configuration that entailed only minor increases in peak power and energy requirements. Similar results have been reported for the knee [14].
For powered prosthetic prototypes [28,29], mean values of joint torque and joint angle are used to estimate the required stiffness. Various studies [4,9] have shown remarkable gait performances using these values. We believe that performance could be further improved when using stiffness values optimized for individuals. Further investigating this paradigm would require a prosthetic foot design with changeable stiffness and a learning algorithm. Optimization criteria for the learning procedure could be leg symmetry to the healthy side combined with the peak power or energy requirements. The joint behavior of the healthy side could be measured with sensors placed on a brace.

4.4. Methodological Considerations

For the results presented in Figure 3, the absolute peak power was minimized. By using a damping mechanism, only the peak power resulting from positive work should be considered. Especially at the knee, this approach can change the peak power results dramatically.
Net joint torques shown in Figure 1 may result from the activation of antagonistic muscles, which would lead to a systematic underestimation of energy comparing our results with the values for human locomotion [25].
While in this paper we only considered the mechanical energy, the efficiency of the motor and the power train must be included for estimating the electrical energy. System characteristics, including frictional losses, damping, heat, structural deflection and other power losses [4], that are not considered will influence the estimation additionally. Depending on the type of gait, the motor speed and motor efficiency will change. A more detailed motor and mechanical system model and experimental results on powered prosthetics are required to make valid energetic predictions. As every prosthetic system uses different mechanical parts, gears and motors, the electrical requirements will be very design specific. The mechanical data presented in this work gives a good hint to what is possible for both gaits at various speeds when using a series spring to assist the motor at the hip, knee and ankle joint.

5. Conclusions

In this paper, we investigated the amount of reductions in energy and peak power requirements at the hip, knee and ankle for walking and running at various speeds with monoarticular series elastic actuators (SEAs) compared to a direct drive system. Large reductions in peak power and energy requirements were observed at the ankle. At the knee, comparable reductions were only observed for running. For walking, energy reductions were much smaller, and the peak power did not change at the preferred speeds. At the hip, an SEA reduced the energy requirements for all and the peak power around the preferred walking speeds. For running, there were no reduction. Based on these results, we recommend the use of elastic elements in artificial foot prostheses, and for running, a spring should be considered at the knee. In walking, including a series elastic spring at the knee and the hip would decrease the energy requirements. In addition to the analyzed parameters, elastic structures may increase gait robustness to uneven terrain or sudden changes in the ground. Furthermore, if the benefits in energy or peak power requirements are small, this could be a reason to consider the elastic structures for the system design.
When using an SEA instead of a direct drive, an interchange of providing positive work by the three leg joints was identified: the contribution of the knee decreased, and the contribution of the hip increased. For monoarticular SEAs, the ankle motor generates most of the positive work. We assume that biarticular structures could shift the main contribution proximally towards the hip by coupling joints similar to what is achieved by human muscles. It is possible that the lack of these structures in our design resulted in small benefits in peak power and energy requirements with a monoarticular SEA at the hip. Hence, this inter-joint coupling should be considered in an extended analysis of leg function in human walking and running. Anticipated reductions in peak power and energy requirements could lead to advanced designs of prosthetic systems utilizing both monoarticular and biarticular SEAs. This concept could be realized with a prosthetic device extended by an orthosis to couple the intact joints via biarticular structures to the replaced joints in the prosthesis, resulting in a hybrid ortho-prosthesis.

Acknowledgments

This work was supported by the DFGgrant SE1042/8. The authors acknowledge Susanne W. Lipfert for providing human data.

Author Contributions

Martin Grimmer is the main author of the article. He was responsible for the design and the realization of the study. Mahdy Eslamy was contributing on methodological questions for the study design. In addition he assisted for the discussion on the results. André Seyfarth was supervising the project and helped to finalize the article.

Conflicts of Interest

The authors declare no conflict of interest.

References

  1. Ottobock. Available online: http://www.ottobock.com (accessed on 1 August 2013).
  2. Ossur. Available online: http://www.ossur.com (accessed on 1 August 2013).
  3. Mathijssen, G.; Cherelle, P.; Lefeber, D.; Vanderborght, B. Concept of a series-parallel elastic actuator for a powered transtibial prosthesis. Actuators 2013, 2, 59–73. [Google Scholar] [CrossRef]
  4. Hitt, J.; Sugar, T.; Holgate, M.; Bellman, R. An active foot-ankle prosthesis with biomechanical energy regeneration. J. Med. Devices 2010. [Google Scholar] [CrossRef]
  5. Zhu, J.; Wang, Q.; Wang, L. PANTOE 1: Biomechanical design of powered ankle-foot prosthesis with compliant joints and segmented foot. In Proceedings of the IEEE/ASME International Conference on Advanced Intelligent Mechatronics (AIM), Montreal, ON, Canada, 6–9 July 2010; pp. 31–36.
  6. Sup, F.; Varol, H.; Mitchell, J.; Withrow, T.; Goldfarb, M. Self-contained powered knee and ankle prosthesis: Initial evaluation on a transfemoral amputee. IEEE Int. Conf. Rehabil. Robot. 2009, 2009, 638–644. [Google Scholar] [PubMed]
  7. Suzuki, R.; Sawada, T.; Kobayashi, N.; Hofer, E. Control method for powered ankle prosthesis via internal model control design. In Proceedings of the International Conference on Mechatronics and Automation (ICMA), Beijing, China, 7–10 August 2011; pp. 237–242.
  8. Herr, H.; Grabowski, A. Bionic ankle–foot prosthesis normalizes walking gait for persons with leg amputation. Proc. R. Soc. B: Biol. Sci. 2012, 279, 457–464. [Google Scholar] [CrossRef] [PubMed]
  9. Ferris, A.E.; Aldridge, J.M.; Rábago, C.A.; Wilken, J.M. Evaluation of a powered ankle-foot prosthetic system during walking. Arch. Phys. Med. Rehabil. 2012, 93, 1911–1918. [Google Scholar] [CrossRef] [PubMed]
  10. Cherelle, P.; Matthys, A.; Grosu, V.; Vanderborght, B.; Lefeber, D. The amp-foot 2.0: Mimicking intact ankle behavior with a powered transtibial prosthesis. In Proceedings of the 2012 4th IEEE RAS & EMBS International Conference on Biomedical Robotics and Biomechatronics (BioRob), Rome, Italy, 24–27 June 2012; pp. 544–549.
  11. Pratt, G.; Williamson, M. Series elastic actuators. In Proceedings of 1995 IEEE/RSJ International Conference on Intelligent Robots and Systems 95. Human Robot Interaction and Cooperative Robots, Pittsburgh, PA, USA, 5–9 August 1995.
  12. Hollander, K.; Sugar, T. Design of the robotic tendon. In Proceedings of the Design of Medical Devices Conference (DMD), Minneapolis, MN, USA, 13–14 April 2005.
  13. Grimmer, M.; Seyfarth, A. Stiffness adjustment of a Series Elastic Actuator in an ankle-foot prosthesis for walking and running: The trade-off between energy and peak power optimization. In Proceedings of the IEEE International Conference on Robotics and Automation (ICRA), Shanghai, China, 9–13 May 2011; pp. 1439–1444.
  14. Grimmer, M.; Seyfarth, A. Stiffness adjustment of a series elastic actuator in a knee prosthesis for walking and running: The trade-off between energy and peak power optimization. In Proceedings of the IEEE/RSJ International Conference on Intelligent Robots and Systems (IROS), San Francisco, CA, USA, 25–30 September 2011; pp. 1811–1816.
  15. Wang, S.; van Dijk, W.; van der Kooij, H. Spring uses in exoskeleton actuation design. In Proceedings of the IEEE International Conference on Rehabilitation Robotics (ICORR), Zurich, Switzerland, 29 June–1 July 2011; pp. 1–6.
  16. Segal, A.; Orendurff, M.; Klute, G.; McDowell, M.; Pecoraro, J.; Shofer, J.; Czerniecki, J. Kinematic and kinetic comparisons of transfemoral amputee gait using C-Leg and Mauch SNS prosthetic knees. J. Rehabil. Res. Dev. 2006, 43, 857–870. [Google Scholar] [CrossRef] [PubMed]
  17. Johansson, J.; Sherrill, D.; Riley, P.; Bonato, P.; Herr, H. A clinical comparison of variable-damping and mechanically passive prosthetic knee devices. Am. J. Phys. Med. Rehabil. 2005, 84, 563–575. [Google Scholar] [CrossRef] [PubMed]
  18. Donelan, J.; Li, Q.; Naing, V.; Hoffer, J.; Weber, D.; Kuo, A. Biomechanical energy harvesting: Generating electricity during walking with minimal user effort. Science 2008, 319, 807–810. [Google Scholar] [CrossRef] [PubMed]
  19. Lipfert, S. Kinematic and Dynamic Similarities between Walking and Running; Verlag Dr. Kovac: Hamburg, Germany, 2010; ISBN 978-3-8300-5030-8. [Google Scholar]
  20. Günther, M.; Sholukha, V.; Keßler, D.; Wank, V.; Blickhan, R. Dealing with skin motion and wobbling masses in inverse dynamics. J. Mech. Med. Biol. 2003, 3, 309–335. [Google Scholar] [CrossRef]
  21. Dal, U.; Erdogan, T.; Resitoglu, B.; Beydagi, H. Determination of preferred walking speed on treadmill may lead to high oxygen cost on treadmill walking. Gait Posture 2010, 31, 366–369. [Google Scholar] [CrossRef] [PubMed]
  22. Grimmer, M.; Eslamy, M.; Gliech, S.; Seyfarth, A. A comparison of parallel-and series elastic elements in an actuator for mimicking human ankle joint in walking and running. In Proceedings of the 2012 IEEE International Conference on Robotics and Automation (ICRA), Saint Paul, MN, 14–18 May 2012; pp. 2463–2470.
  23. Farris, D.; Sawicki, G. The mechanics and energetics of human walking and running: A joint level perspective. J. R. Soc. Interface 2012, 9, 110–118. [Google Scholar] [CrossRef] [PubMed]
  24. Van Den Bogert, A. Exotendons for assistance of human locomotion. Biomed. Eng. Online 2003, 2. [Google Scholar] [CrossRef] [PubMed] [Green Version]
  25. Sasaki, K.; Neptune, R.; Kautz, S. The relationships between muscle, external, internal and joint mechanical work during normal walking. J. Exp. Biol. 2009, 212, 738–744. [Google Scholar] [CrossRef] [PubMed]
  26. Hreljac, A.; Parker, D.; Quintana, R.; Abdala, E.; Patterson, K.; Sison, M. Energetics and perceived exertion of low speed running and high speed walking. Facta Univ. Ser.: Phys. Educ. Sport 2002, 1, 27–35. [Google Scholar]
  27. Sasaki, K.; Neptune, R. Muscle mechanical work and elastic energy utilization during walking and running near the preferred gait transition speed. Gait Posture 2006, 23, 383–390. [Google Scholar] [CrossRef] [PubMed]
  28. Au, S.K.; Herr, H.; Weber, J.; Martinez-Villalpando, E.C. Powered ankle-foot prosthesis for the improvement of amputee ambulation. Conf. Proc. IEEE Eng. Med. Biol. Soc. 2007, 2007, 3020–3026. [Google Scholar] [PubMed]
  29. Sup, F.; Varol, H.A.; Mitchell, J.; Withrow, T.; Goldfarb, M. Design and control of an active electrical knee and ankle prosthesis. In Proceedings of the 2nd IEEE RAS & EMBS International Conference on Biomedical Robotics and Biomechatronics, Scottsdale, AZ, USA, 19–22 October 2008; pp. 523–528.

