1. Introduction
It has been seen that pump-controlled hydraulic circuits have better efficiency compared to valve-controlled circuits. Cleasby and Plummer [
1] reported that their pump-controlled circuit consumed only 11% of energy required by a valve-controlled circuit to perform the same task. On the other hand, valve-controlled circuits, to date, exhibit better dynamic performance [
2]. However, machine efficiency is becoming a real concern from economic and environmental points of view, especially in mobile hydraulic industry. Throttling losses in valves represent one of the main energy losses in hydraulic circuits presently used in these machines. To reduce throttling losses, load-sensing technologies have been extensively used in the mobile industry [
3,
4]. However throttling losses still represent 35% of the energy received by a hydraulic system equipped with load-sensing technology in a typical excavating machine [
5]. Large energy saving can be obtained by eliminating/reducing metering losses. The purpose of this paper is to further contribute to the development of efficient, yet high-performance, pump-controlled actuation.
Pump-controlled circuits have been well-developed for double-rod cylinders [
6,
7,
8]. For example, the new Airbus A380 airliner aircraft, is equipped with this technology [
9]. However, single-rod cylinders are used in at least 80% of the electro-hydraulic applications [
8]. Many initiatives to develop pump-controlled circuits for single-rod cylinders have also been done [
1,
6,
10,
11,
12,
13,
14,
15,
16]. Rahmfeld and Ivantysynova [
11] introduced a circuit that comprises a variable displacement piston pump and two pilot-operated check valves (POCVs) to compensate for the differential flow in single-rod cylinders. Williamson et al. [
17] studied the performance of a skid-steer loader equipped with this circuit. They reported boom velocity oscillations and a pump mode of operation switching during lowering light loads at high speeds. Williamson et al. [
17] and Wang et al. [
12] showed that the circuit with two POCVs is unstable at low loading operations. To deal with this problem, Williamson and Ivantysynova [
18] designed and implemented a feedforward controller. Their solution was tested on custom-build pumps with fast rise time of 80 ms [
19]. Commonly-used pumps on the market [
20] possess a rise time of about 500 ms, like the one used in this research. Wang et al. [
12] replaced the POCVs with a closed-center three-way, three-position shuttle valve for flow compensation. They added two electrically-activated regulating valves to dampen the undesirable oscillations through leakage control. This approach, however, requires additional control effort and extra sensors that increases system cost and complexity. Calishan et al. [
13] simplified the previous design [
12] by utilizing an open-center shuttle valve to incorporate the leakage control together with flow compensation. The design required less control effort and showed stable performance. However, they reported that their solution works best under certain actuator velocities. Additionally, their experimental work is limited to low loading conditions and lacks the effect of mass inertia. Jalayeri et al. [
6,
21] and Altare and Vacca [
15] introduced the idea of regulating the load motion with the help of counterbalance valves, which belong to throttling elements. To compensate for the differential flow Jalayeri et al. [
21] used an on/off solenoid valve and a check valve, while Altare and Vacca [
15] utilized a special form of shuttle valve, which they called a dual-pressure valve. Both designs are more energy efficient as compared to conventional valve-controlled alternatives and accurate enough for many industrial applications. Nevertheless, these designs cannot regenerate energy [
21]. From the above discussion it is seen that in spite of the large amount of studies on the topic, throttle-less actuation technology for single rod cylinders has not been fully explored, compared to valve-controlled actuation, in terms of dynamic performance [
22].
In this paper, we first re-examine the undesirable performance of pump-controlled single rod actuation systems in detail. The effects of the cylinder area ratio, charge pump pressure, transmission lines losses, friction, and pilot-operated check valve characteristics on the performance of the actuator are investigated. Next, we introduce a new design that improves performance using limited flow restriction in the problematic regions. We show how specially-utilized counterbalance valves can be incorporated in a novel manner in the circuit to enhance the performance and, at the same time, allow energy regeneration. The trade-off between energy efficiency and performance is also investigated.
2. Circuit Utilizing Two Pilot Operated Check Valves
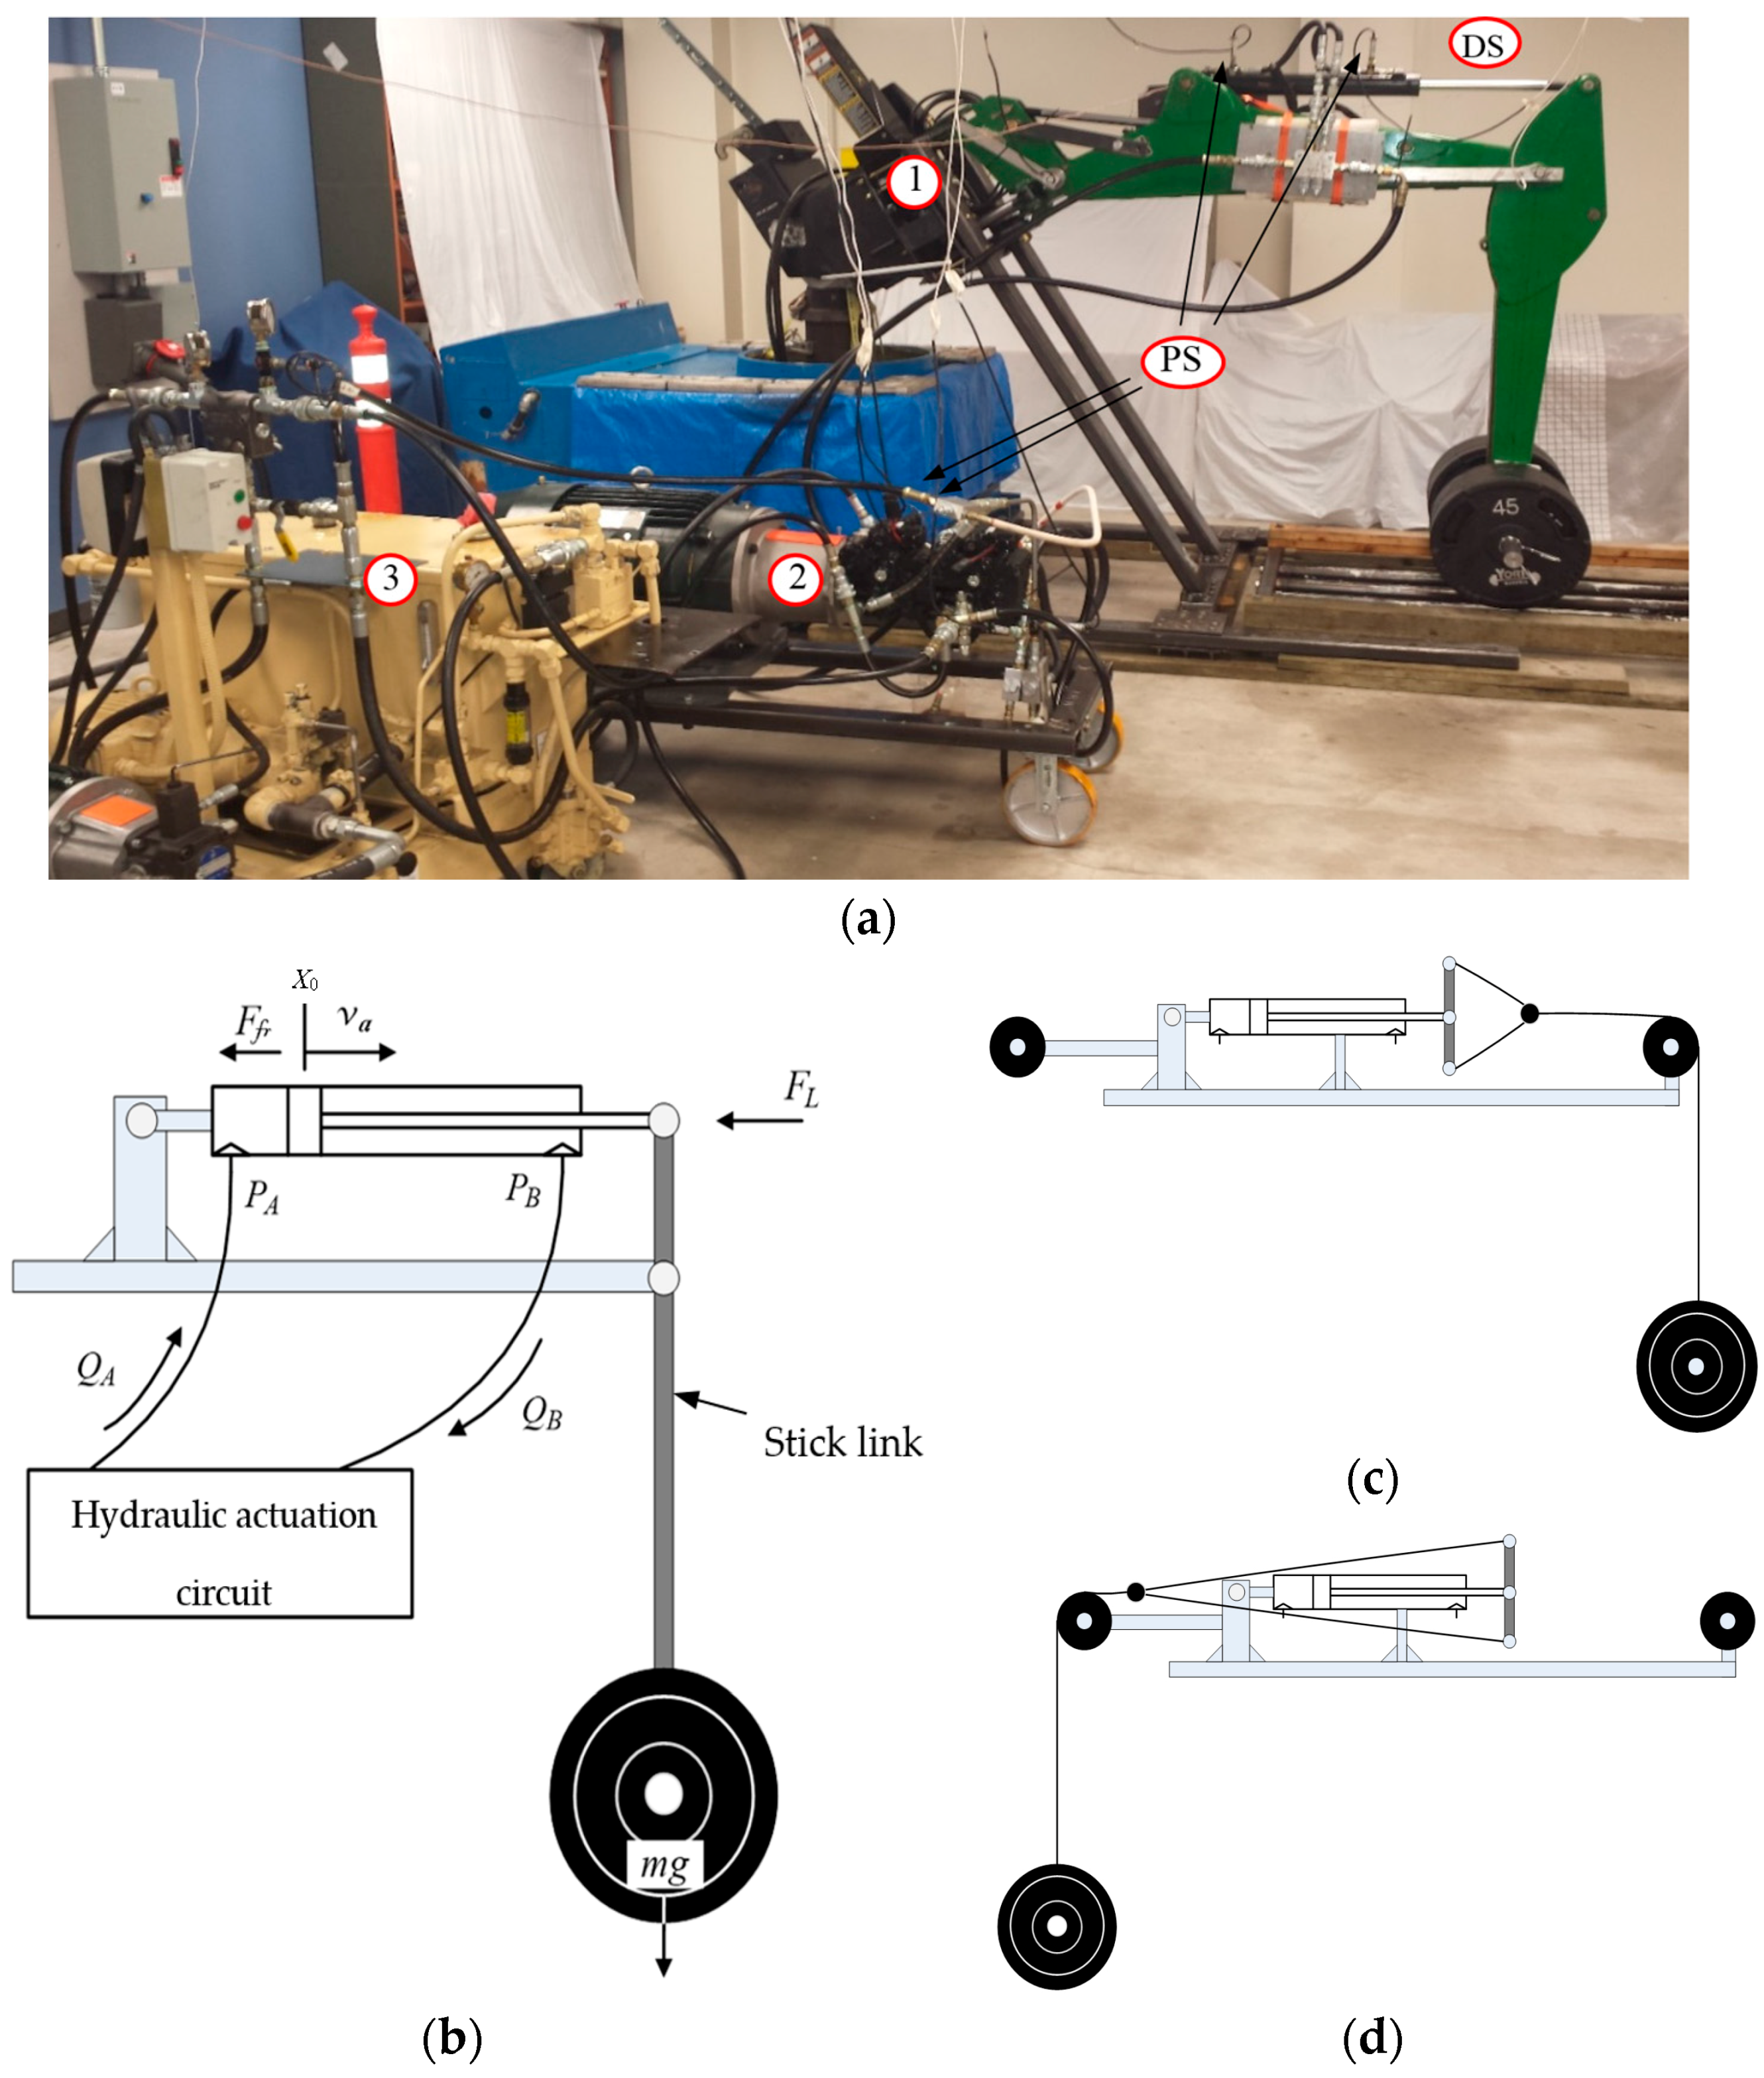
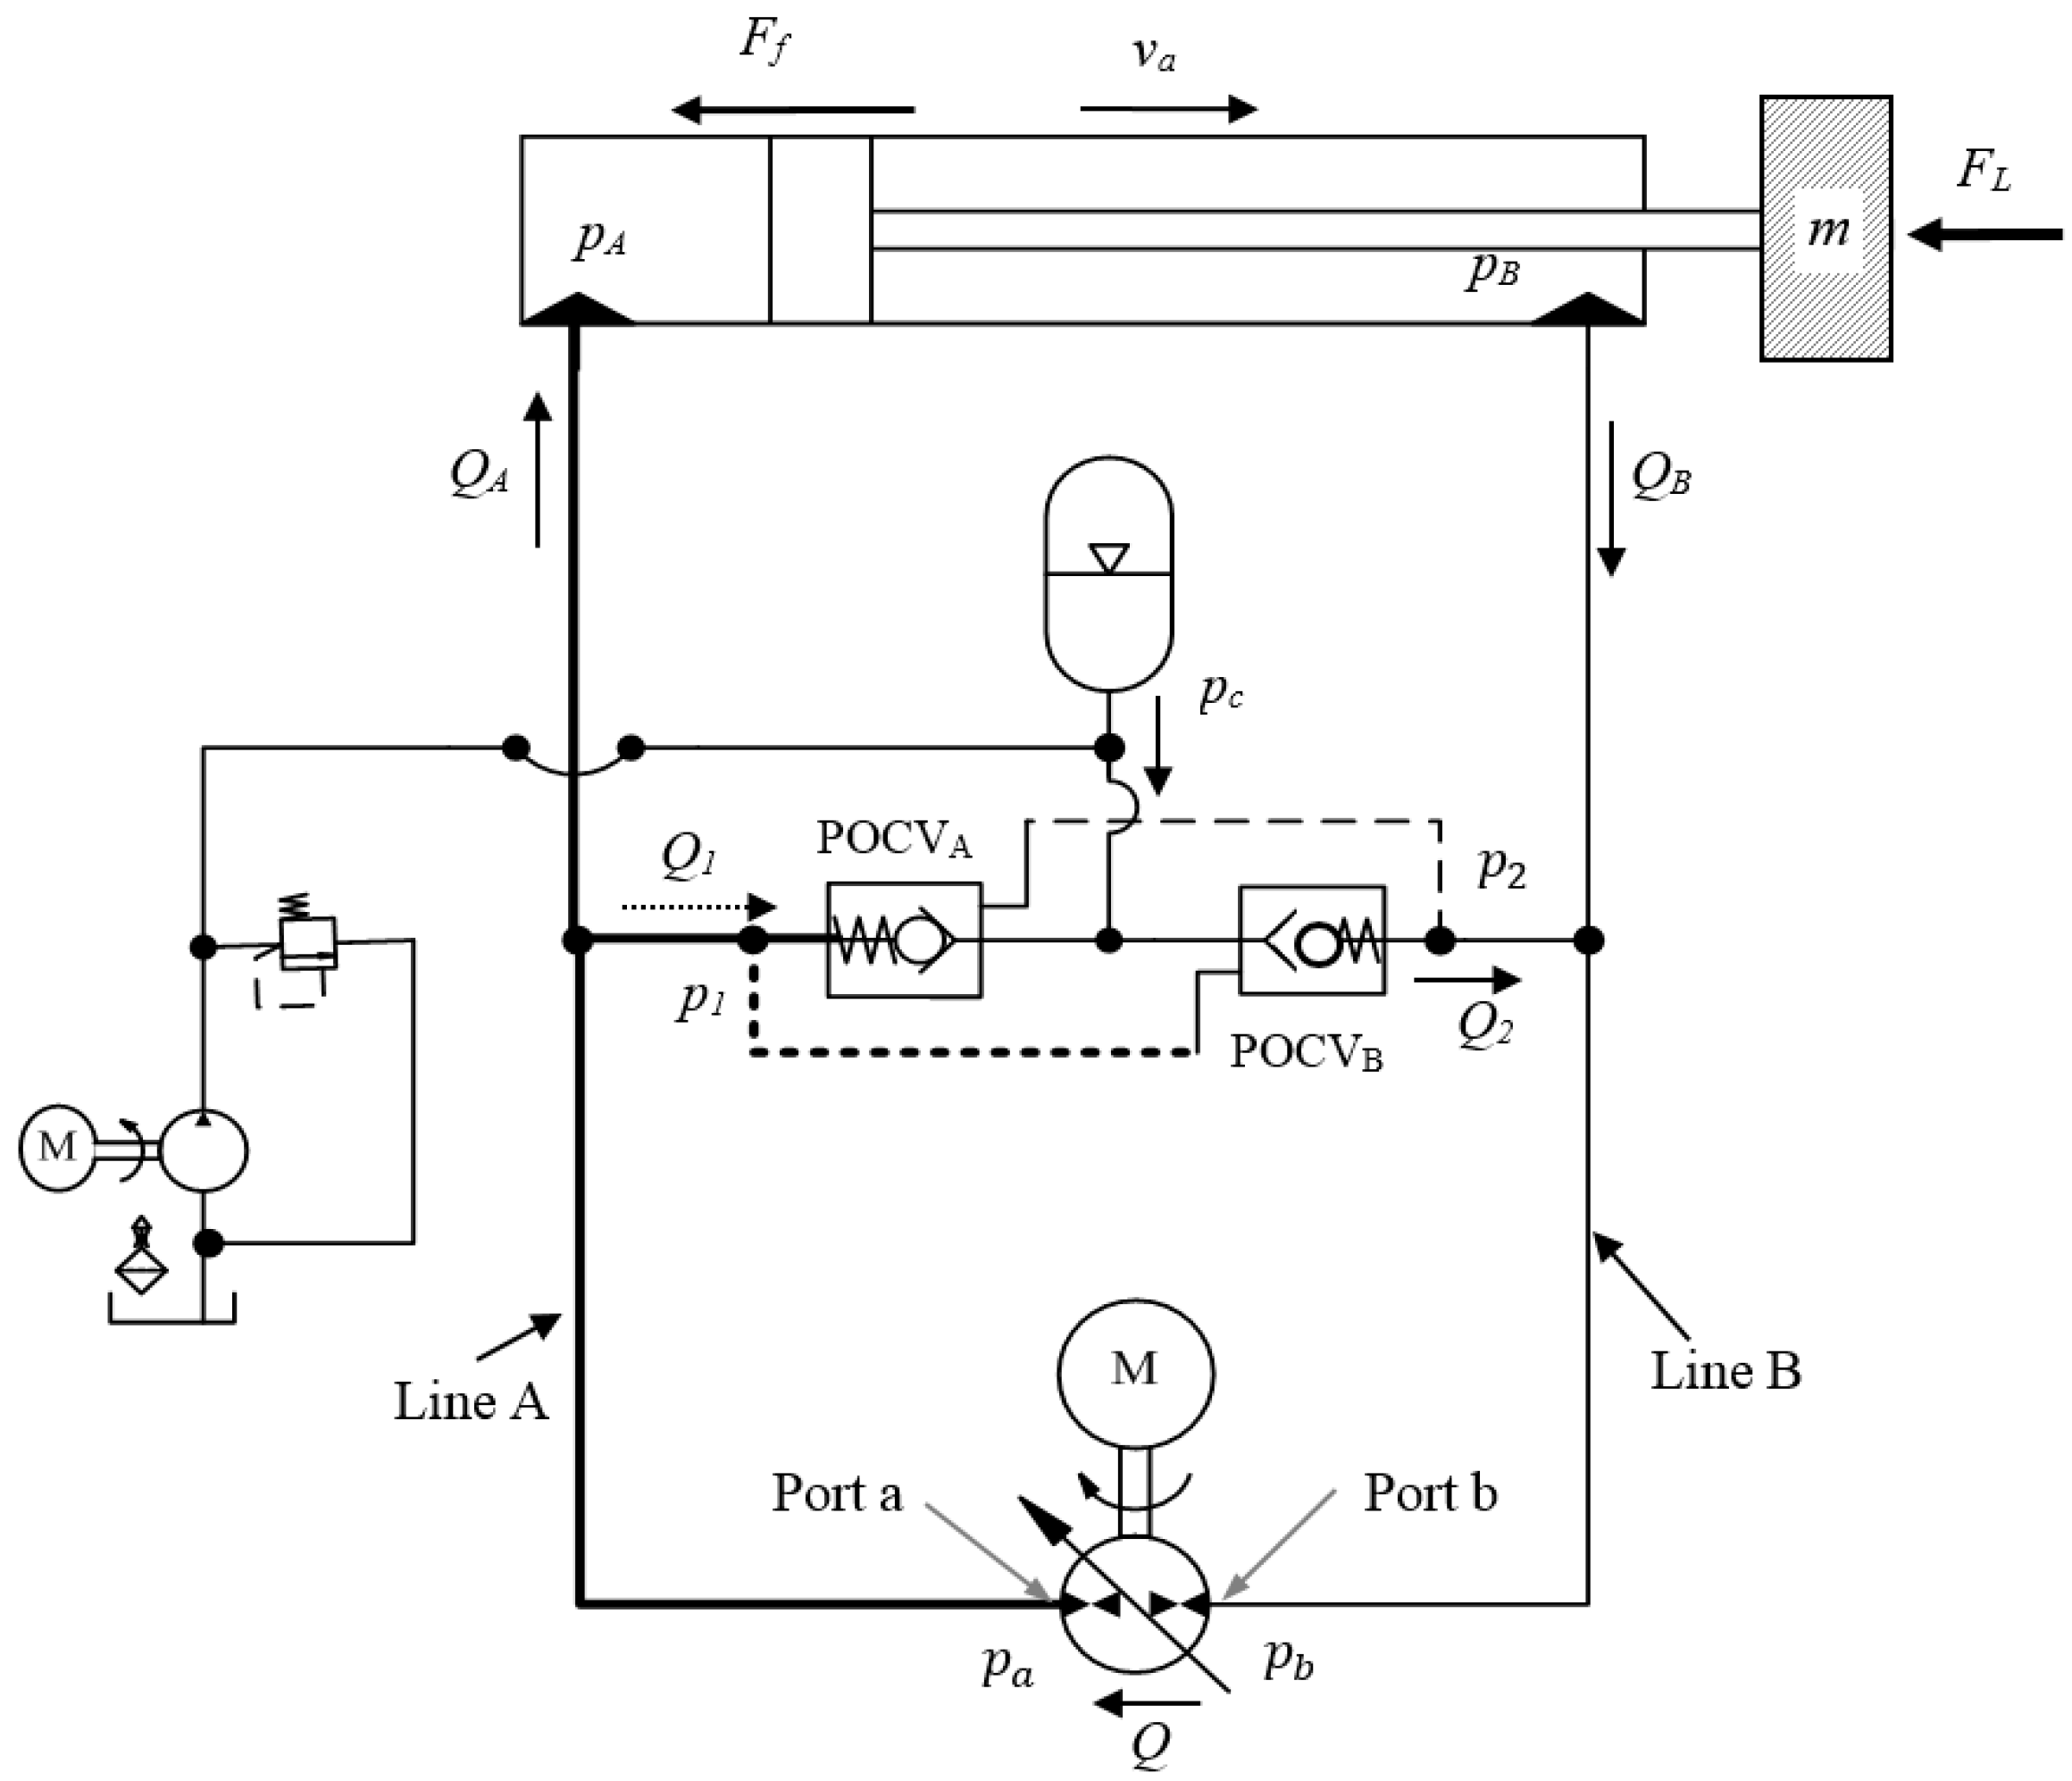
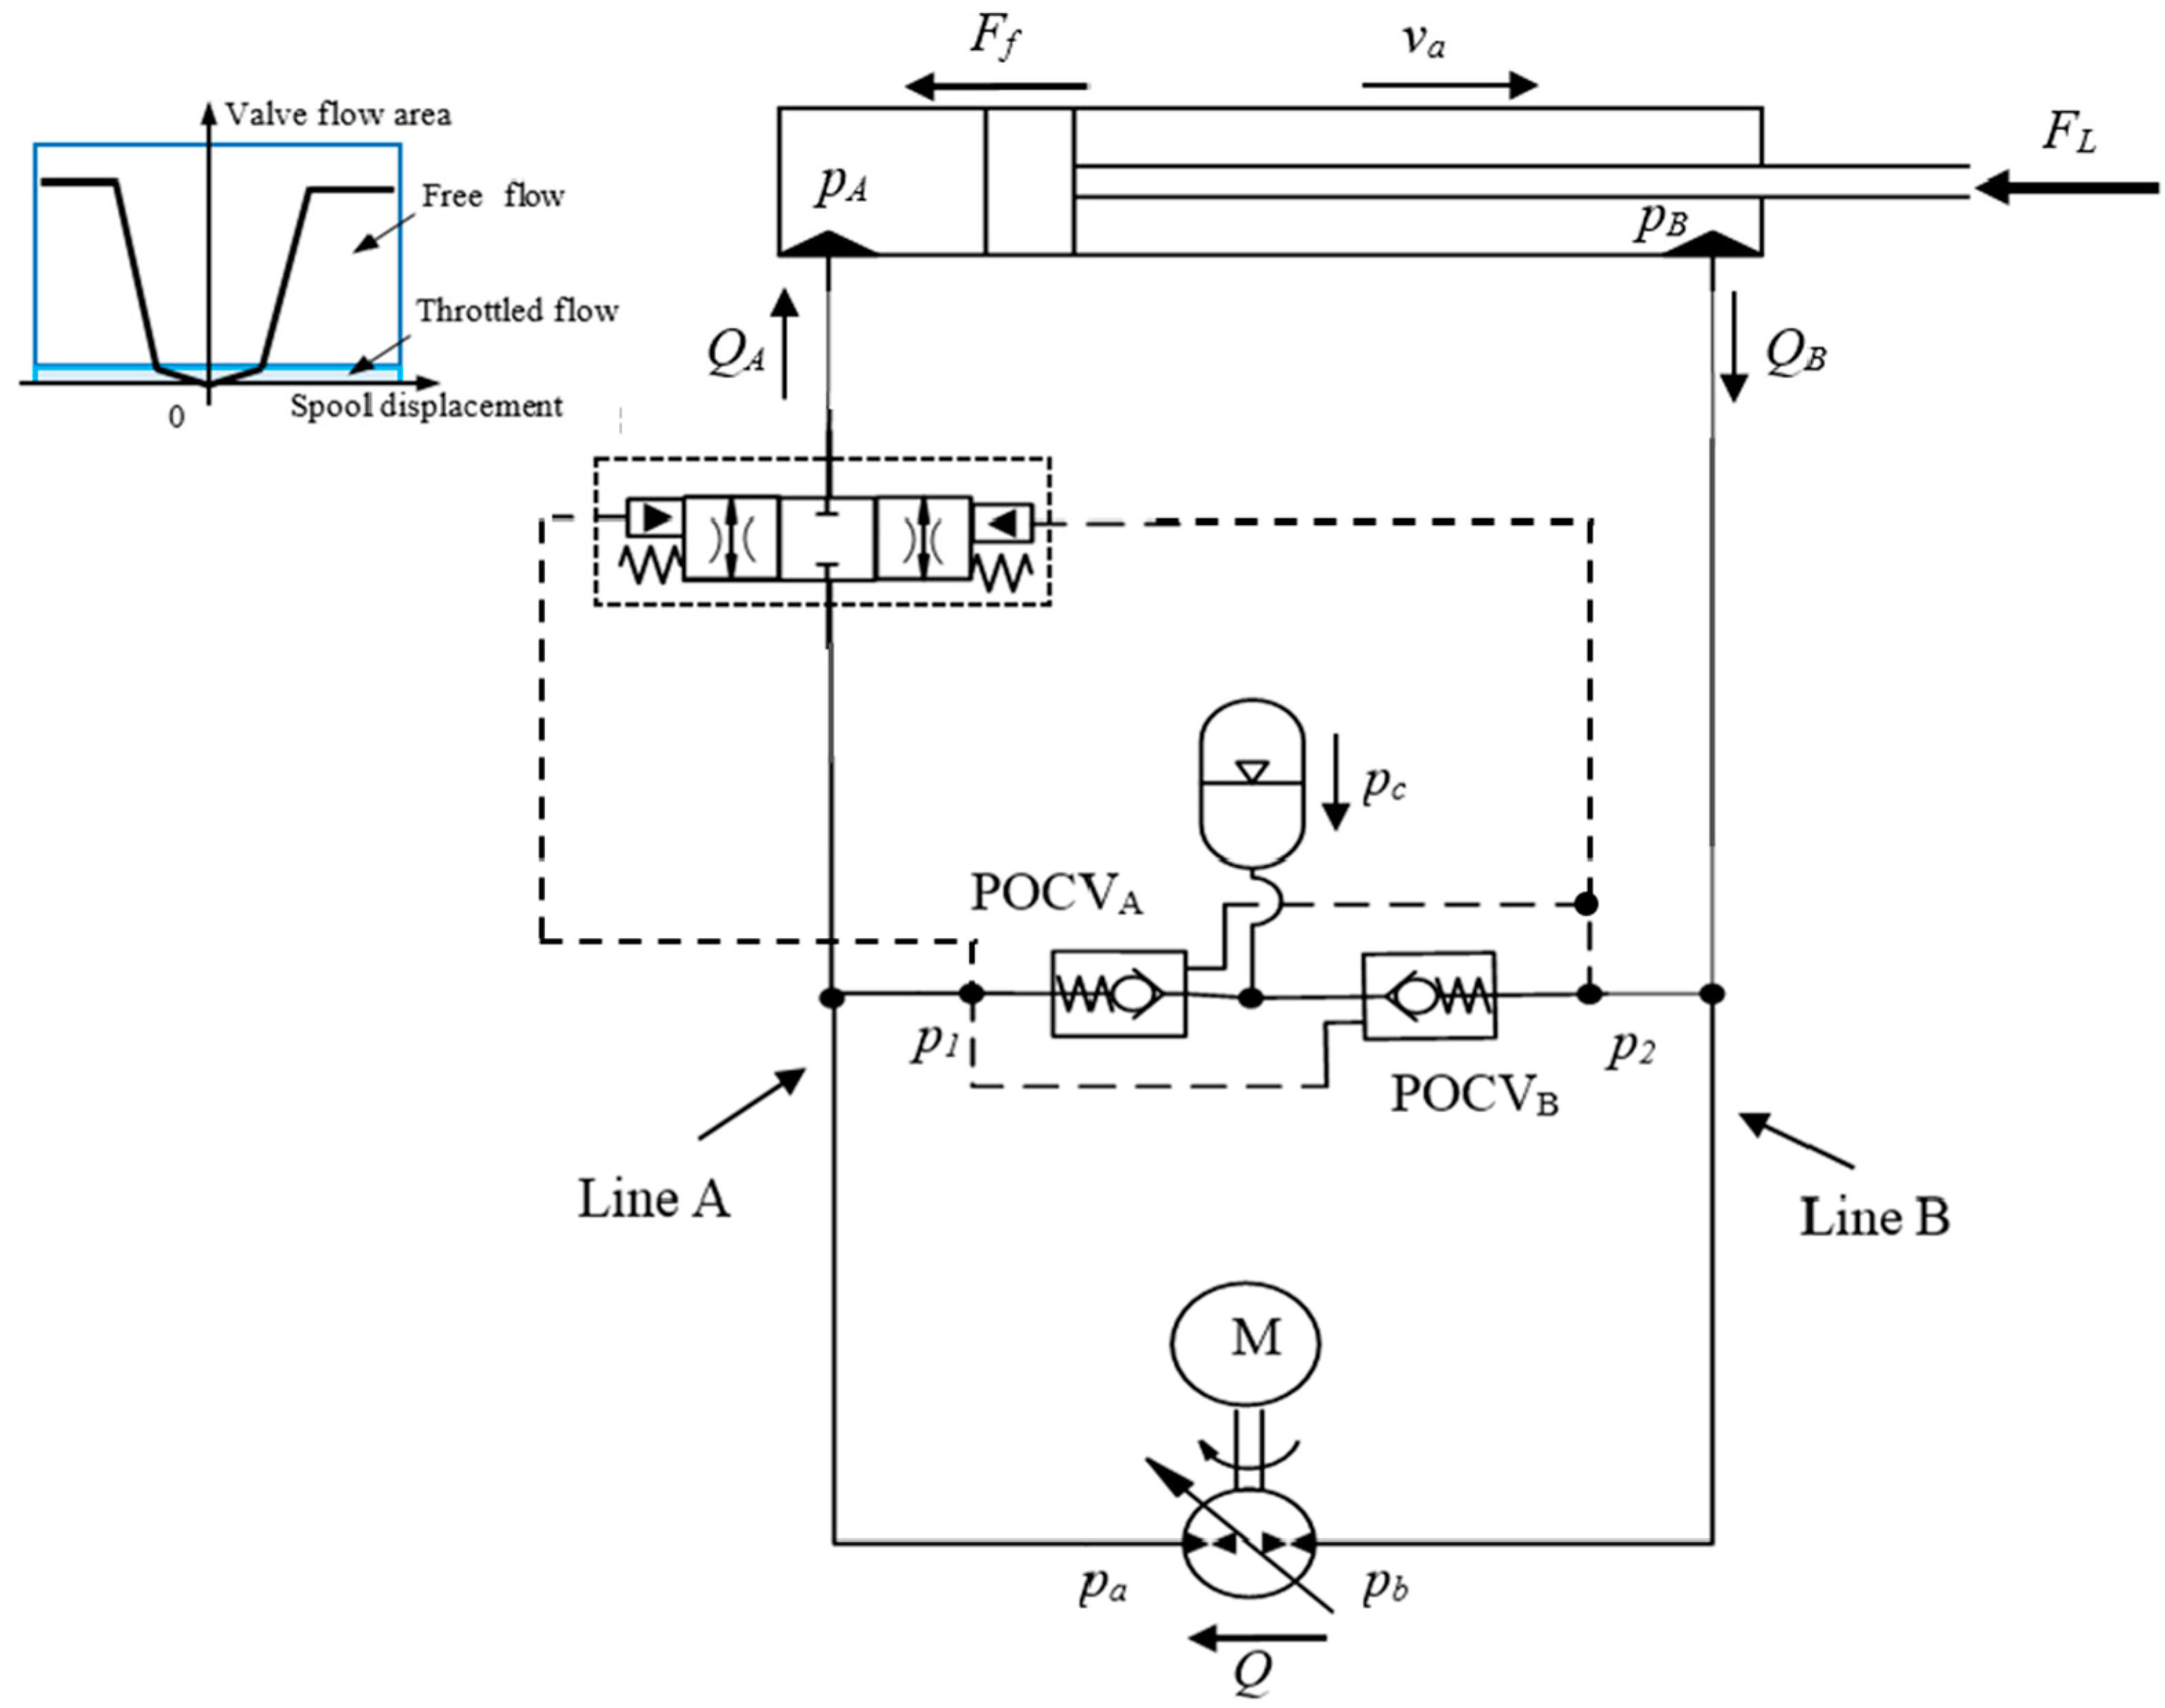
Figure 1 shows the commonly used circuit that utilizes two pilot operated check valves (POCVs) for motion control of a single-rod hydraulic actuator. Piloted lines to both POCVs are pressurized through the cross-pressure line of the circuit. The accumulator in the charging circuit is meant to boost the charge pump supplement flow to the circuit when needed. Pressure difference across the pump is defined as
, where
and
are pressures at the pump ports.
is the flow rate through the pump, which is positive when the hydraulic oil flows from port b to port a. The circuit works in pumping mode if
and
possess the same sign. Otherwise, it works in motoring mode. From the actuator perspective, when the cylinder velocity,
, and external force,
, have the same sign (for example, the cylinder extends against the load) the actuator works in resistive mode. Otherwise it works in assistive mode.
Consider extending the actuator against the resistive external load, as shown in
Figure 1, the pump delivers flow
in a clockwise direction to the cap side of the cylinder through transmission line A. As the pressure in line A (
,
and
) builds up, it opens the cross pilot-operated check valve, POCV
B, which allows flow,
, to compensate for the cylinder differential flow. In this case, the main pump works in pumping mode. Clearly, motion will not begin unless the POCVs are in the proper working positions to compensate for the differential flow of the cylinder. Otherwise, poor responses would be experienced in certain regions of operation, which will be discussed next.
The dynamics of the actuator can be described as follows:
where
represents the equivalent moving mass. Pressures at actuator ports are denoted by
and
.
are the flow rates to and from the actuator ports. Piston effective areas are represented by
and
.
is the oil bulk modulus. The oil volumes at each side of the cylinder are represented by
and
.
Friction force,
, is assumed to be the sum of the Stribeck, Coulomb, and viscus friction components [
23]:
where
represents the Coulomb friction;
and
denote breakaway friction force increase and velocity transition coefficients, respectively;
and
are the viscous and Coulomb friction coefficients, respectively.
represents the preload force generated due to seal deformation inside the cylinder during installation. In Equation (5), Coulomb friction
is assumed to be the summation of the seals deformation due to, initially, preloading force, and the force related to the seal squeezing due to the operational pressure effect. It is clear from Equation (5) that the Coulomb friction increases as the load and corresponding actuator pressures increase.
Amongst various types of POCVs, the commonly-used one uses the pilot line pressure referenced to charge pressure
[
12]. This type is preferred in the pump-controlled circuits because it provides less interference margin during operation of both valves in the circuit, which supports the system stability [
12]. The dynamics of a POCV have low impact on the overall system dynamics. Hence, it is simply considered as a switching element in this paper. POCVs are normally closed and can be opened in two ways. They can be opened through the pilot line pressure as presented in Equation (6), or through the charge line pressure described by Equation (7) [
19,
24]. The two cracking conditions are represented, for POCV
B, by the following equations:
where
and
are the POCV pilot ratio and cracking pressure, respectively. In this circuit, the operation of POCVs is mainly controlled by the pilot pressures
and
, while actuator motion is monitored by pressures
and
. The differences between
and
and
and
are due to the losses in the transmission lines. This pressure drop is calculated using the lumped resistance model as follows [
21]:
where
is the flow in a transmission line, and
and
represent the combined viscous friction in transmission line and local drag coefficients, respectively. In normal operation only one of the POCVs is expected to be opened while the other is closed. However, interference in operation is expected when the two activating pressures
and
are close to each other [
12]. This undesirable interference shows up in three ways: either both valves are closed or both are open or they alternatively open and close.
Williamson and Ivantysynova [
17] observed that when lowering light loads at high speeds during assistive retraction mode the above circuit encounters low performance. They reported that when the pump changes operating modes during actuator movement, the cylinder encounters a sudden change in velocity. Wang et al. [
12] identified these conditions as operating the circuit around the critical load,
. Critical load was identified as the actuating force when pressure at both chambers of the actuator equals to the charge pressure, i.e.,
where
. Calishan et al. [
13] further specified two load limits (
and
) for this zone in a load-velocity (
–
) plane, as shown in
Figure 2.
and
are the loads when the shuttle valve reaches fully open from the center position in either direction of motion. The values of these limits depend on the shuttle valve operational pressures and the actuator effective areas.
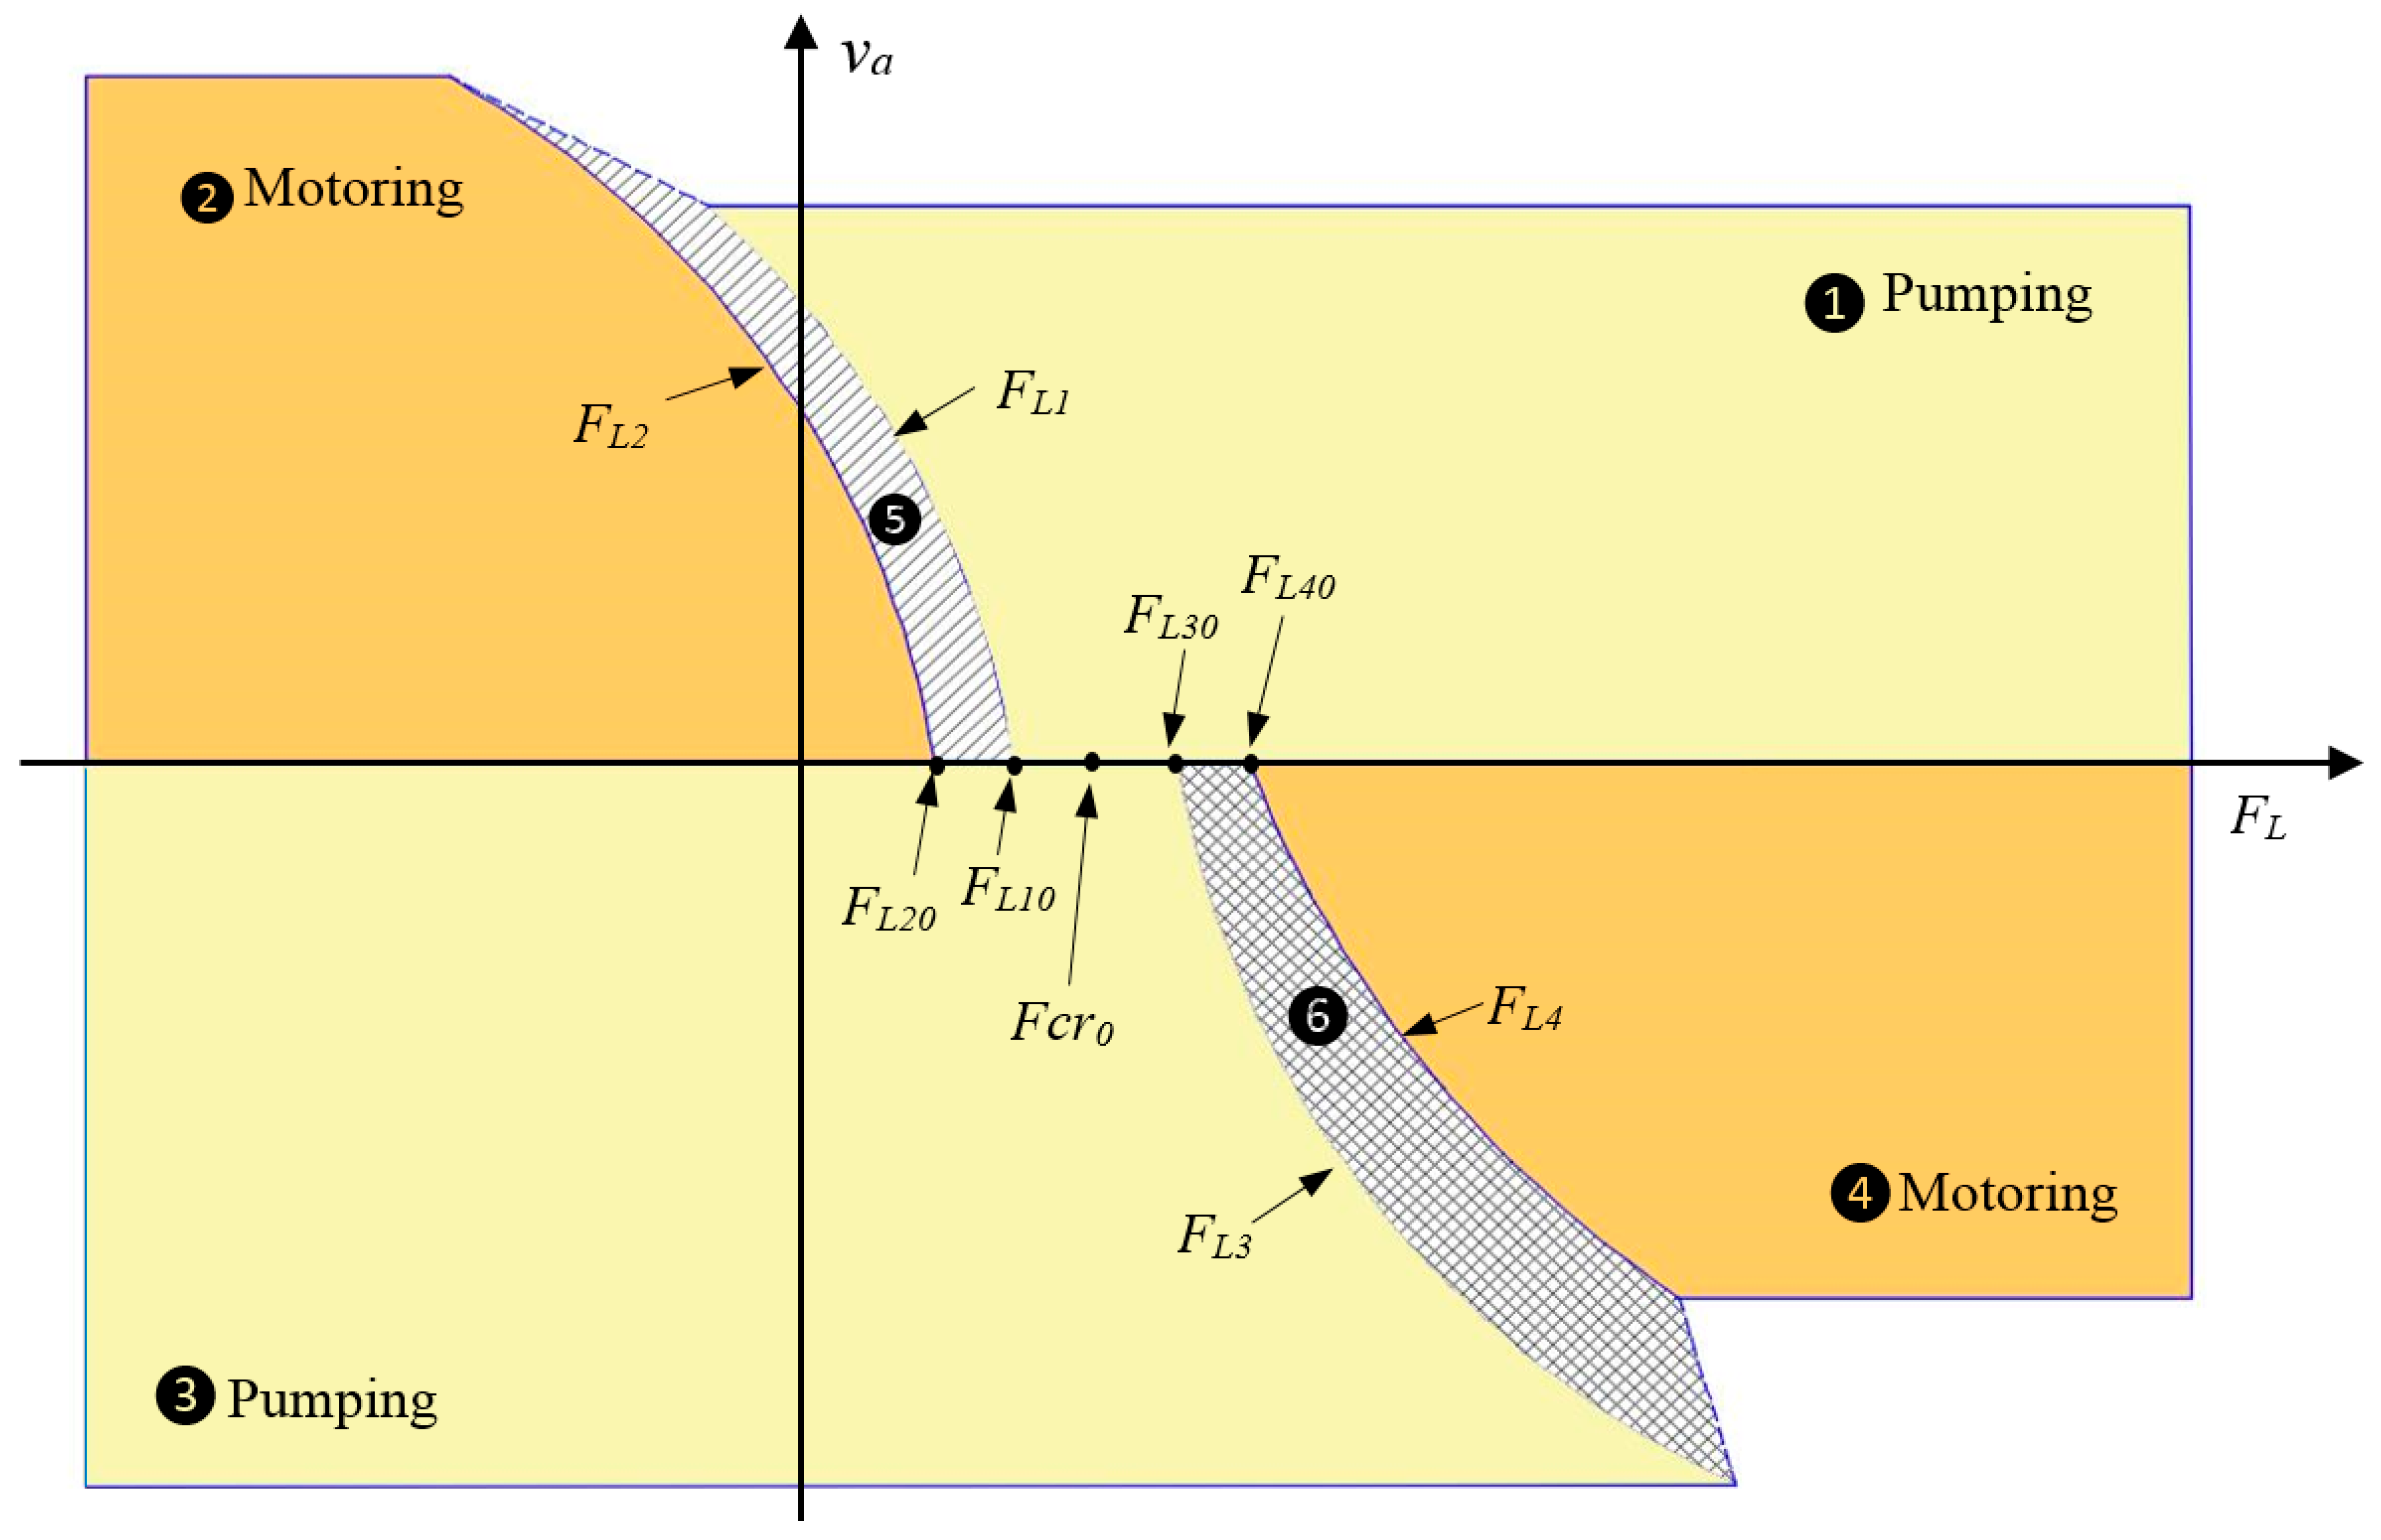
Here we further illustrate how transition lines losses, POCVs characteristics, and frictional force contribute to the location and shape of the undesirable regions (critical zones). To include the transmission lines losses effect, the critical force,
, is defined as the actuating force at the cylinder when both pressures at the POCVs pilot ports are equal, i.e.,
. During this condition, the pressure at the cylinder chambers and POCVs piloting ports are different due to pressure losses in transmission lines, described by a quadratic relation in Equation (8), which affects the critical zone shape. Initially at zero velocity, critical force can be represented as
. Transmission line losses depend on the flow rates and direction of motion. Accordingly, the critical force regions are represented by a quadratic curve as shown in
Figure 3.
The width of the critical zone in circuits with the POCVs (difference between
and
and
and
in
Figure 3) depends on the cracking pressures of the POCVs and actuator piston areas. Let the force
be defined as the corresponding force created at the cylinder due to the extra pressure required to open the POCV. Note that corresponding force to the pressure needed to open POCV
A,
, is higher than that is needed to open POCV
B,
. In pumping mode, the pump generates the required cracking pressure
to guarantee proper configurations of POCVs. However, in the motoring mode, the external load works to create this cracking pressure.
To study the effect of the friction force components on the shape of the critical zones, we rearrange the actuator equation of motion (ignoring the inertial and Stribeck frictional terms) to find out the external load,
, at critical condition:
Since friction force acts against the actuator velocity, the above equation shows that friction force affects the critical zone shape differently in the upper and lower sections of the
plane. As seen in
Figure 3, during positive velocity, Coulomb friction component shifts the critical zone to the left while viscous friction bends it to the left with an angle related to the viscous friction coefficient. These effects are reversed for negative velocities.
Built upon the above analysis,
Figure 3 shows the different limits describing the undesirable performance regions. Regions 1, 2, 3, and 4 in
Figure 3 represent the good performance areas, while the performance deterioration occurs in regions 5 and 6. Mathematical representation of the different limit lines can be shown as follows:
where at zero velocity we have,
,
,
, and
. With reference to
Figure 3, region 5 represents the pump mode of operation switching (motoring to pumping) during actuator extension. Pressures at both sides of the circuit are almost equal and less than the charge pressure which keeps both POCVs open. In this case charge pump supplies both sides of the circuit with hydraulic flow and the actuator velocity is not fully controllable. While region 6 represents the pump mode of operation switching (motoring to pumping) during actuator retraction. Pressures at both sides of the circuit are almost equal and higher than the charge pressure and both valves, initially, are critically closed. Opening POCV
B supports motoring mode while motion decelerates due to less assistive load. On the other hand opening POCV
A supports pumping mode and motion acceleration. Consequently, the pump mode of operation and POCVs configuration keeps switching and pressure and velocity oscillates.
3. Experimental Verification of Poor Performance Regions
Figure 4 shows the test rig constructed for this study and its schematic drawing. The test rig is a John Deere backhoe attachment (JD-48) equipped with an electrically-controlled variable displacement pump unit, a charge pressure unit and instrumentations. It is designed to facilitate the implementation of different hydraulic actuation circuits.
Figure 4a shows the full setup of the test rig where motion of the mass at the end of the stick link generates the four quadrants of operation at the actuator. Furthermore, the external force at the actuator varies proportionally to the actuator displacement.
Figure 4c,d shows the reconfigured setup where load is considered to be constant, which assists extension and retraction, respectively. Specifications of the main components are given in
Table 1.
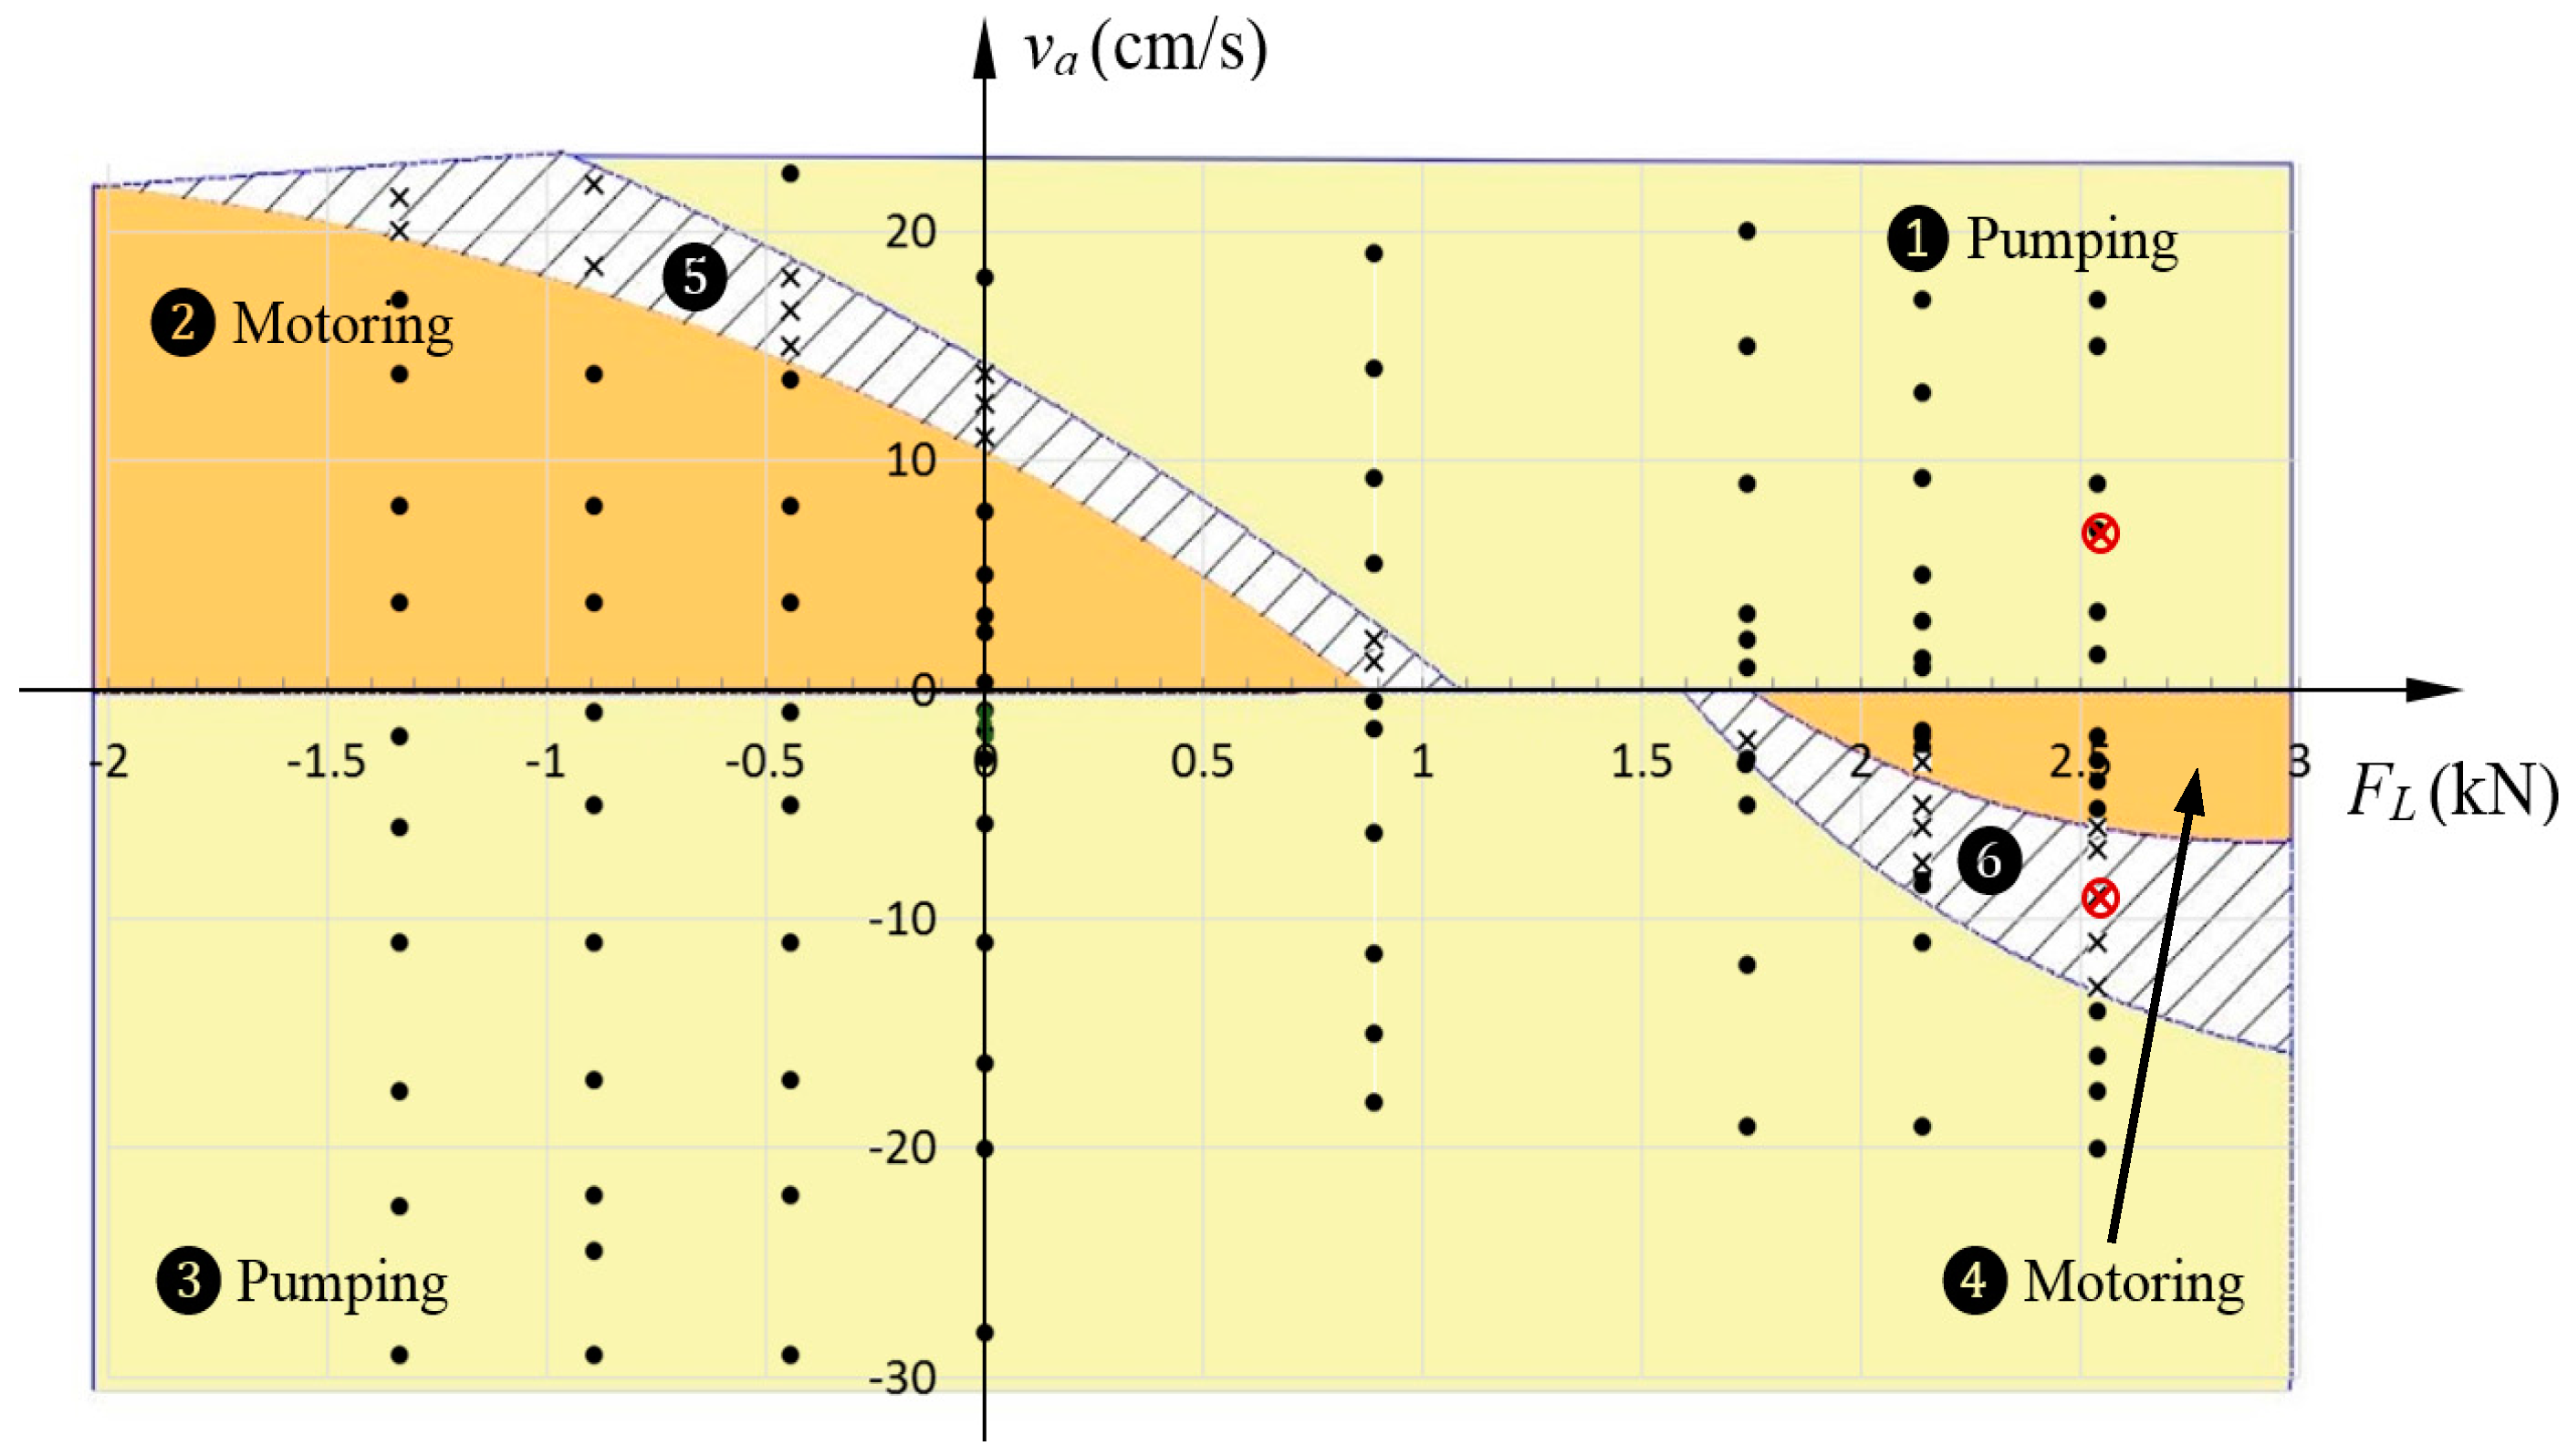
Different loading conditions (mass of 0, 41, 82, 123, 164, 204, and 245 kg) were applied to the stick actuator and responses were obtained at different velocities in each of the four quadrants. Experimental work was performed on the reconfigured setup of the test rig shown in
Figure 4c,d. Experimental results showed good performance when pump runs only in single mode of operation away from the switching regions shown in
Figure 3. However, performance deteriorates at certain regions.
Figure 5 shows the results categorized based on quality of performance and plotted on the
plane. Each vertical set of points in the figure represents different actuator velocities for one load value. Areas hatched with dashed lines are regions where the pump switches the mode of operation during actuator extension and retraction. Operation in these regions exhibits deteriorated performance.
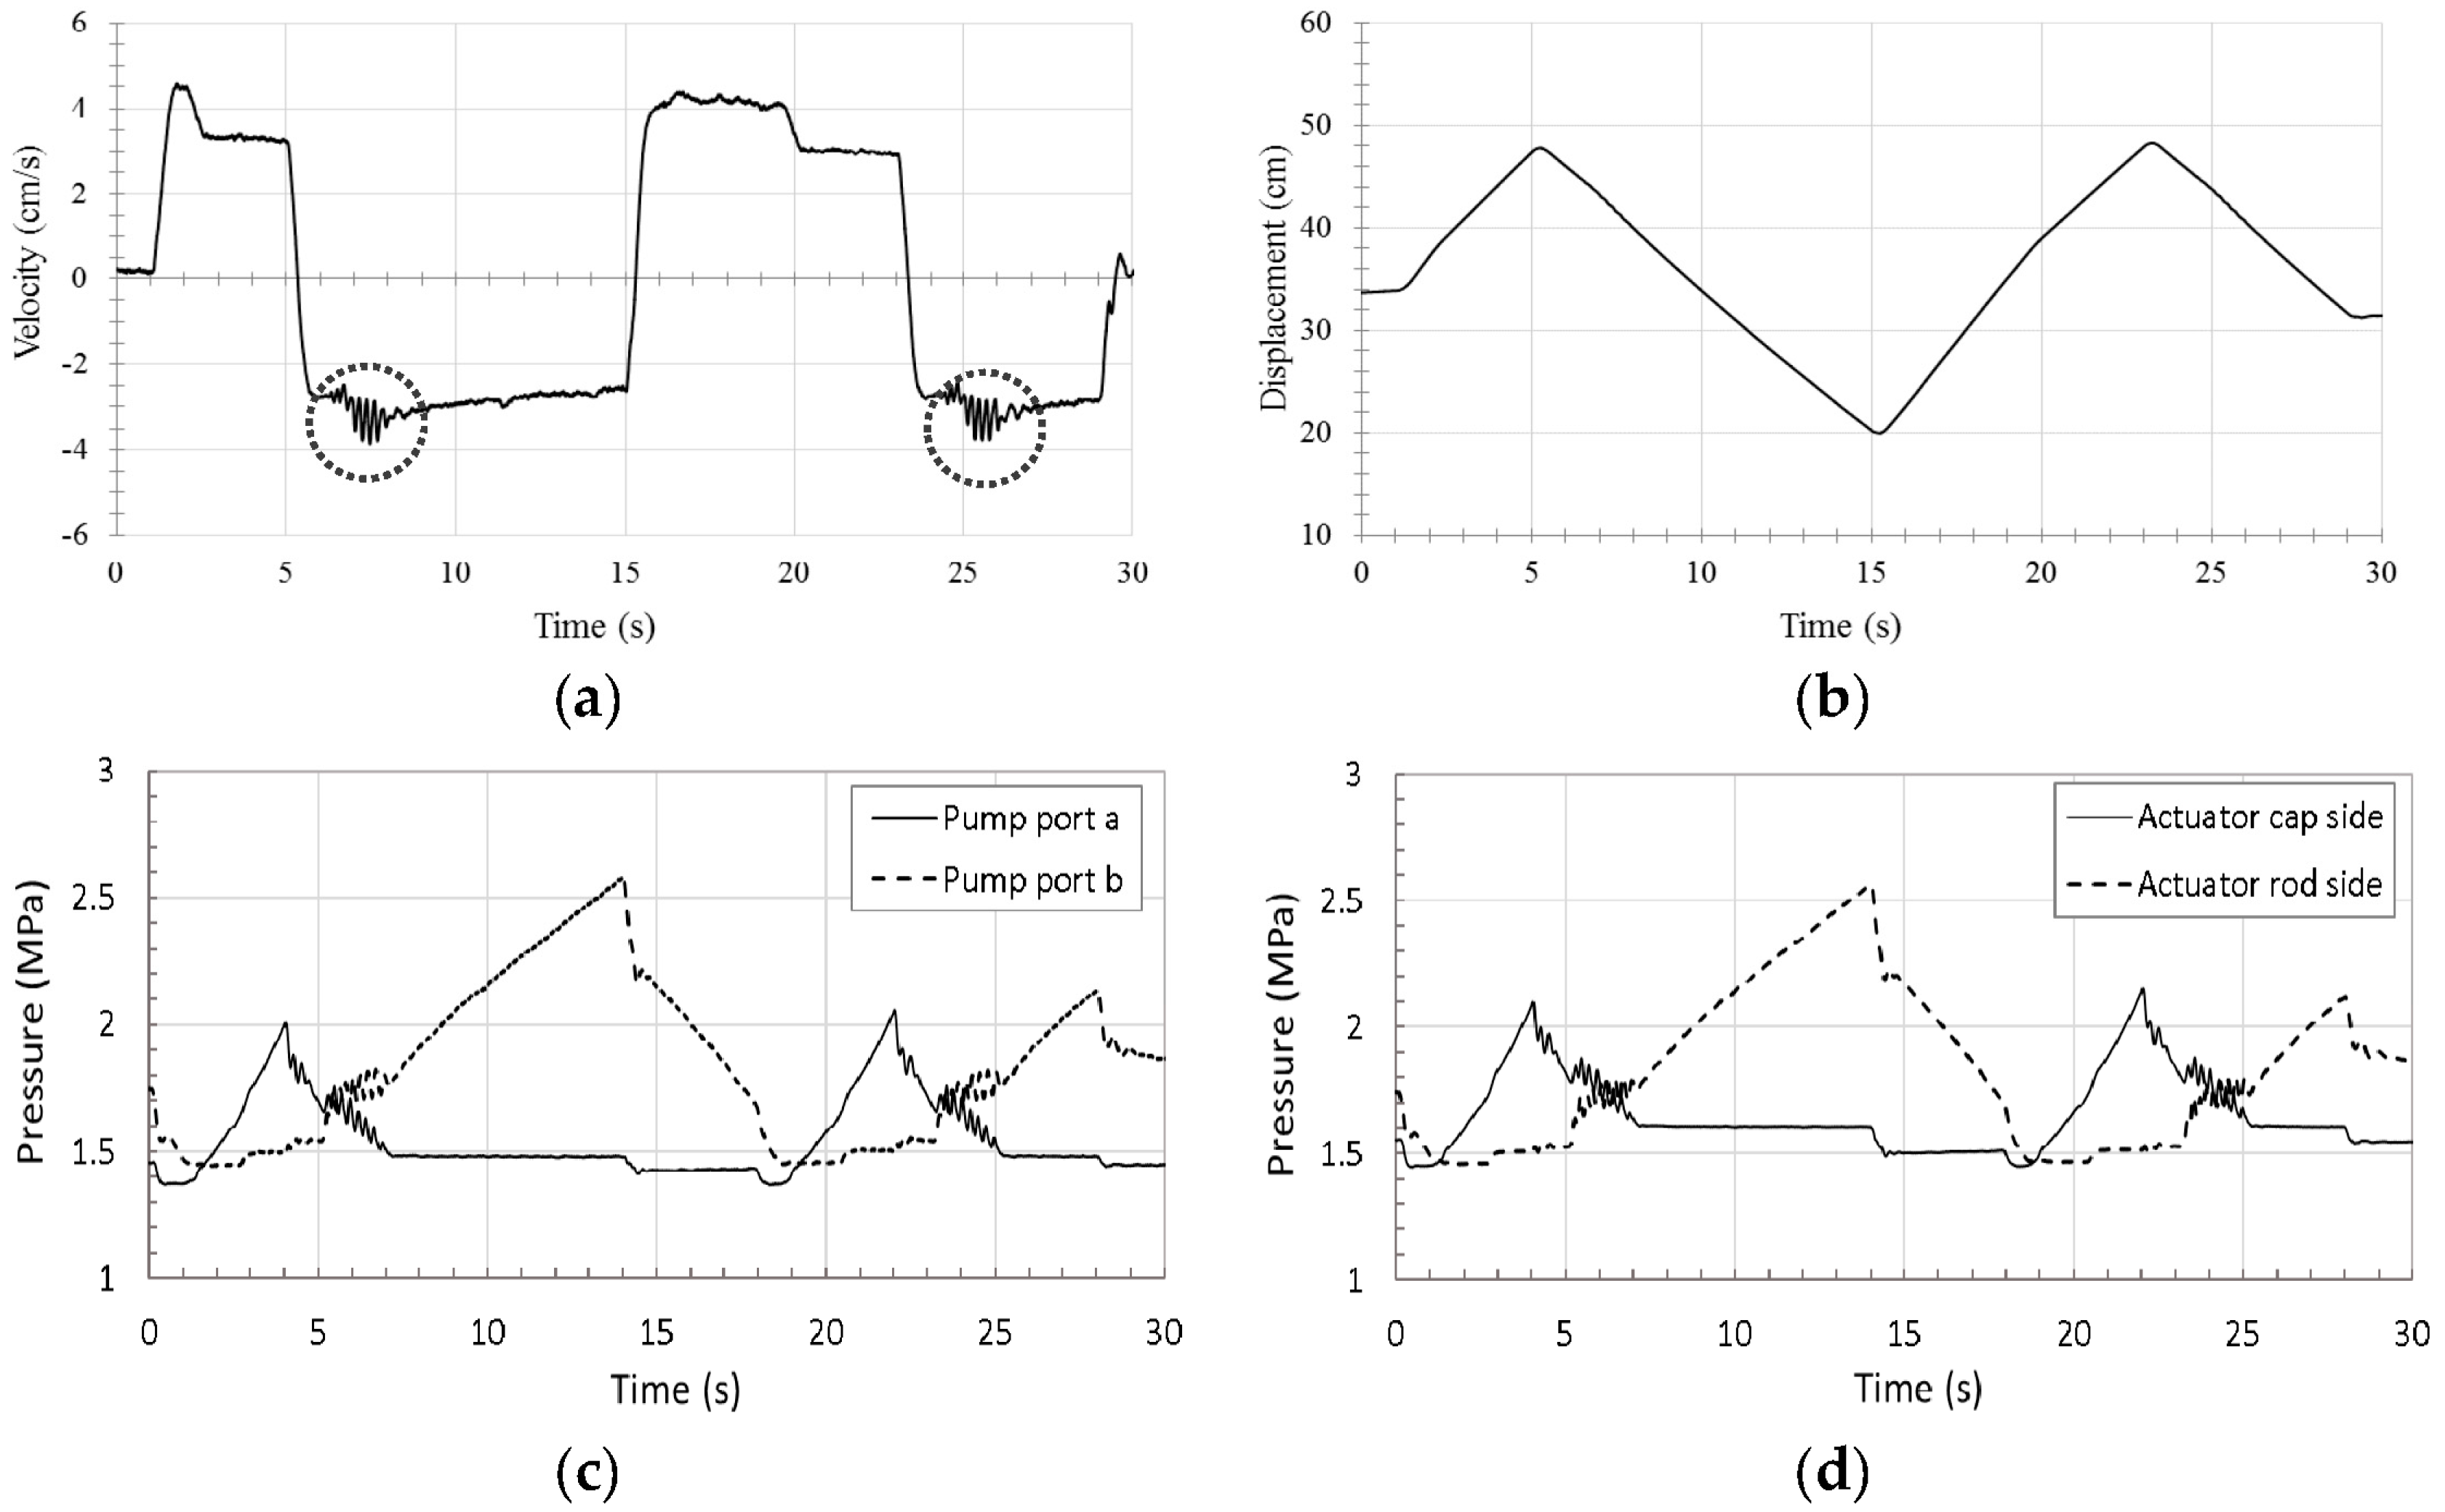
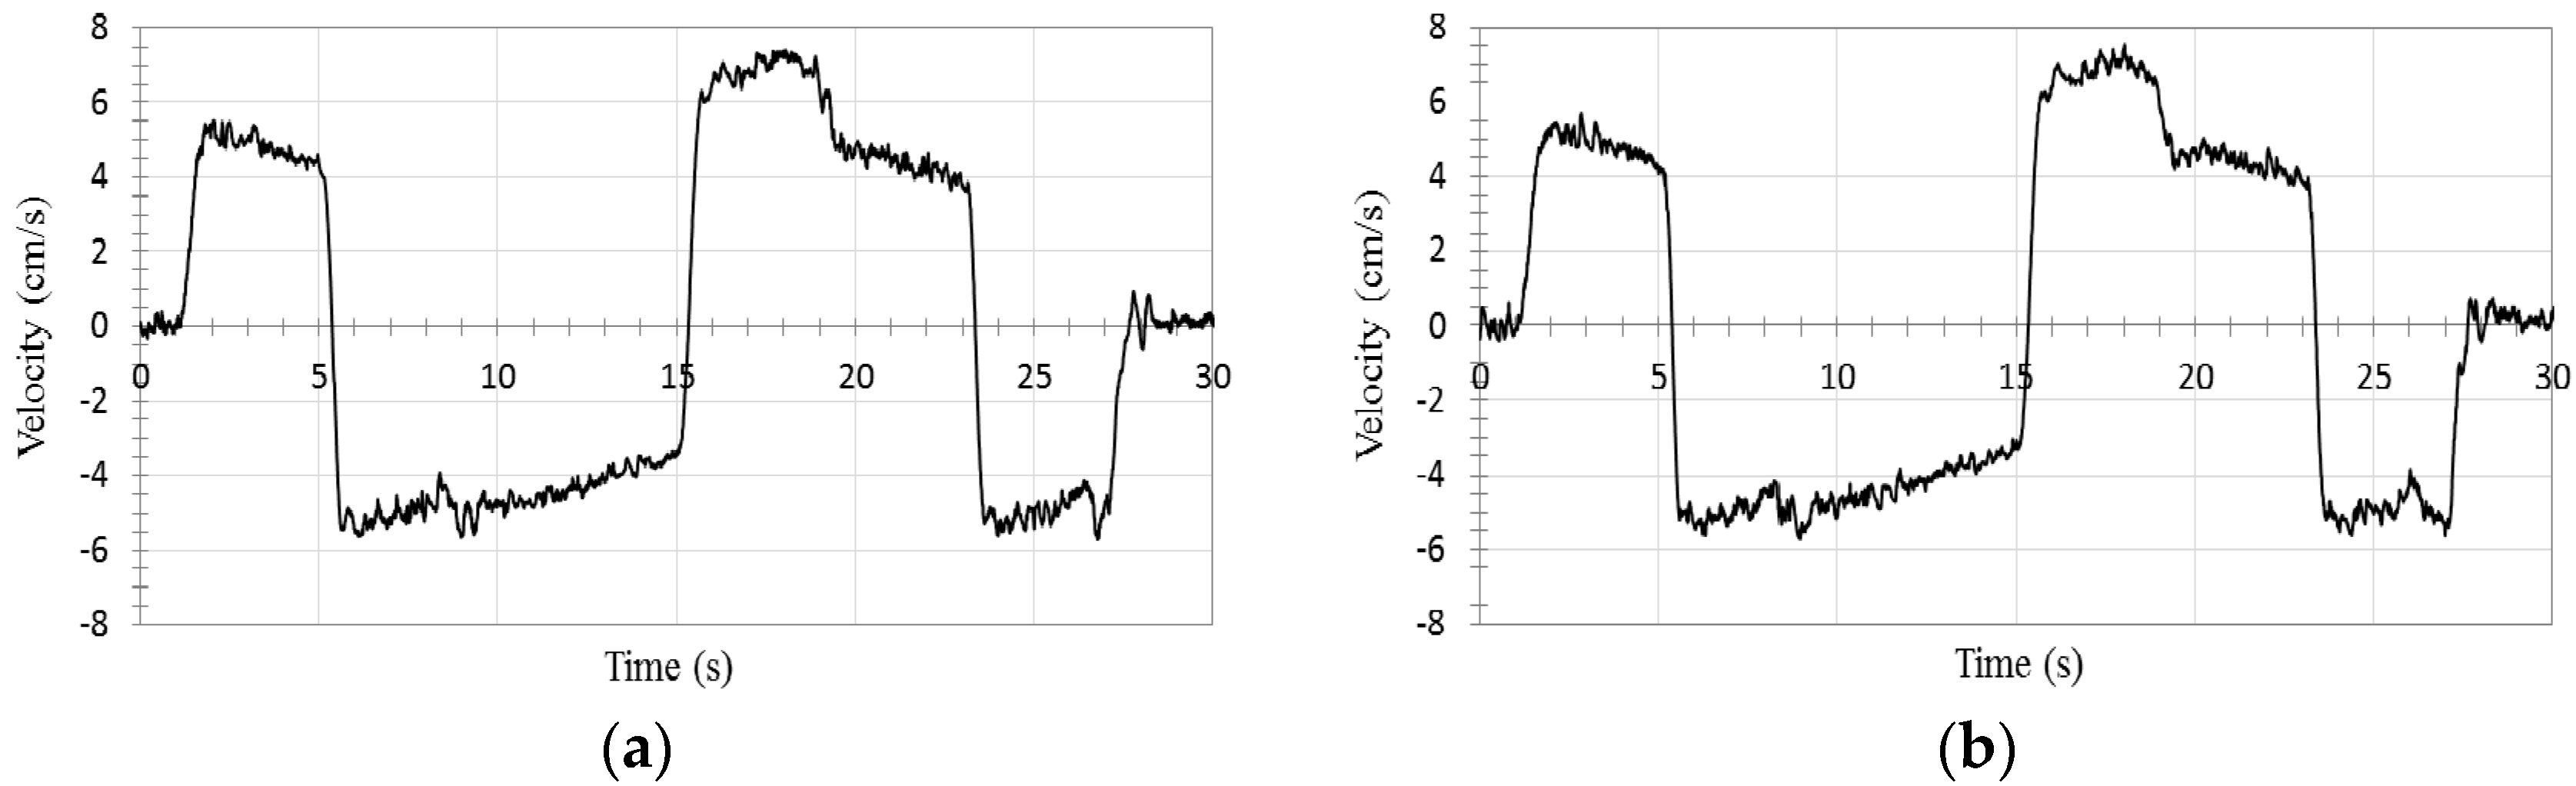
Figure 6 shows a typical circuit performance covering two regions. The experiment was done for a 245 kg mass during extension (
= 5 cm/s) and retraction (
= −9 cm/s). As can be seen, the second portion illustrates the circuit performance at oscillatory retraction.
It is clearly seen that experimental results validate the discussion presented earlier. In the next section we present a circuit that improves the performance while maintaining efficiency.
4. Proposed Circuit
The main idea behind the new circuit is to utilize flow throttling to control the actuator motion, exclusively, in the regions where responses are not satisfactory. In other regions, motion is controlled in a throttle-less manner. Throttling of hydraulic fluid creates a pressure drop across the valve orifices maintaining increased pressure in cylinder chambers compared to pump ports, which contribute towards a stiffer actuator [
21,
25]. The proposed circuit possesses a comparable energy efficiency and energy regeneration ability to the circuit with POCVs at high loading conditions and the stability of the circuits with throttling valves at low loading conditions. Furthermore, the new design does not require additional electronic control which is desirable in industrial settings. In order to achieve such a goal, a special valve is needed to be fitted in either transmission lines A or B. The special valve should be pilot-operated through the same pilot lines to the POCVs in order to dampen the undesirable responses in the regions of interest. Additionally, it should also throttle the flow in the transmission line when the two pilot pressures are close to each other. Finally, it should allow free flow in and out of the actuator when the two pilot pressures are not close to each other and throttling is unnecessary.
Figure 7 shows the proposed circuit incorporating the special valve installed in line A of the circuit. For illustration simplicity, the charging system is represented only by accumulator.
Locating the valve in line A is preferred since initial experiments showed that oscillatory motions occur during actuator retraction of assistive load (see also
Figure 5). The valve is activated by pressures from the two POCVs pilot inputs. The valve should be designed with a special flow area as function of the piloting pressure differential. A spool-sleeve throttling configuration and balance springs should be used such that the valve possesses the area profile shown in the inset of
Figure 7. Presently such a valve is not commercially available in the market. Thus, in order to implement this circuit, we use two counterbalance valves (CBVs). Generally, CBVs are throttling valves used for safety requirements through the whole working range actuator operation. They have been used in some pump-controlled applications [
6,
15,
21,
26], but with no ability to regenerate energy [
21]. Here, the CBVs are utilized to only restrict flow at low loading conditions to enhance the performance while allowing free flow at high loading conditions to allow energy regeneration.
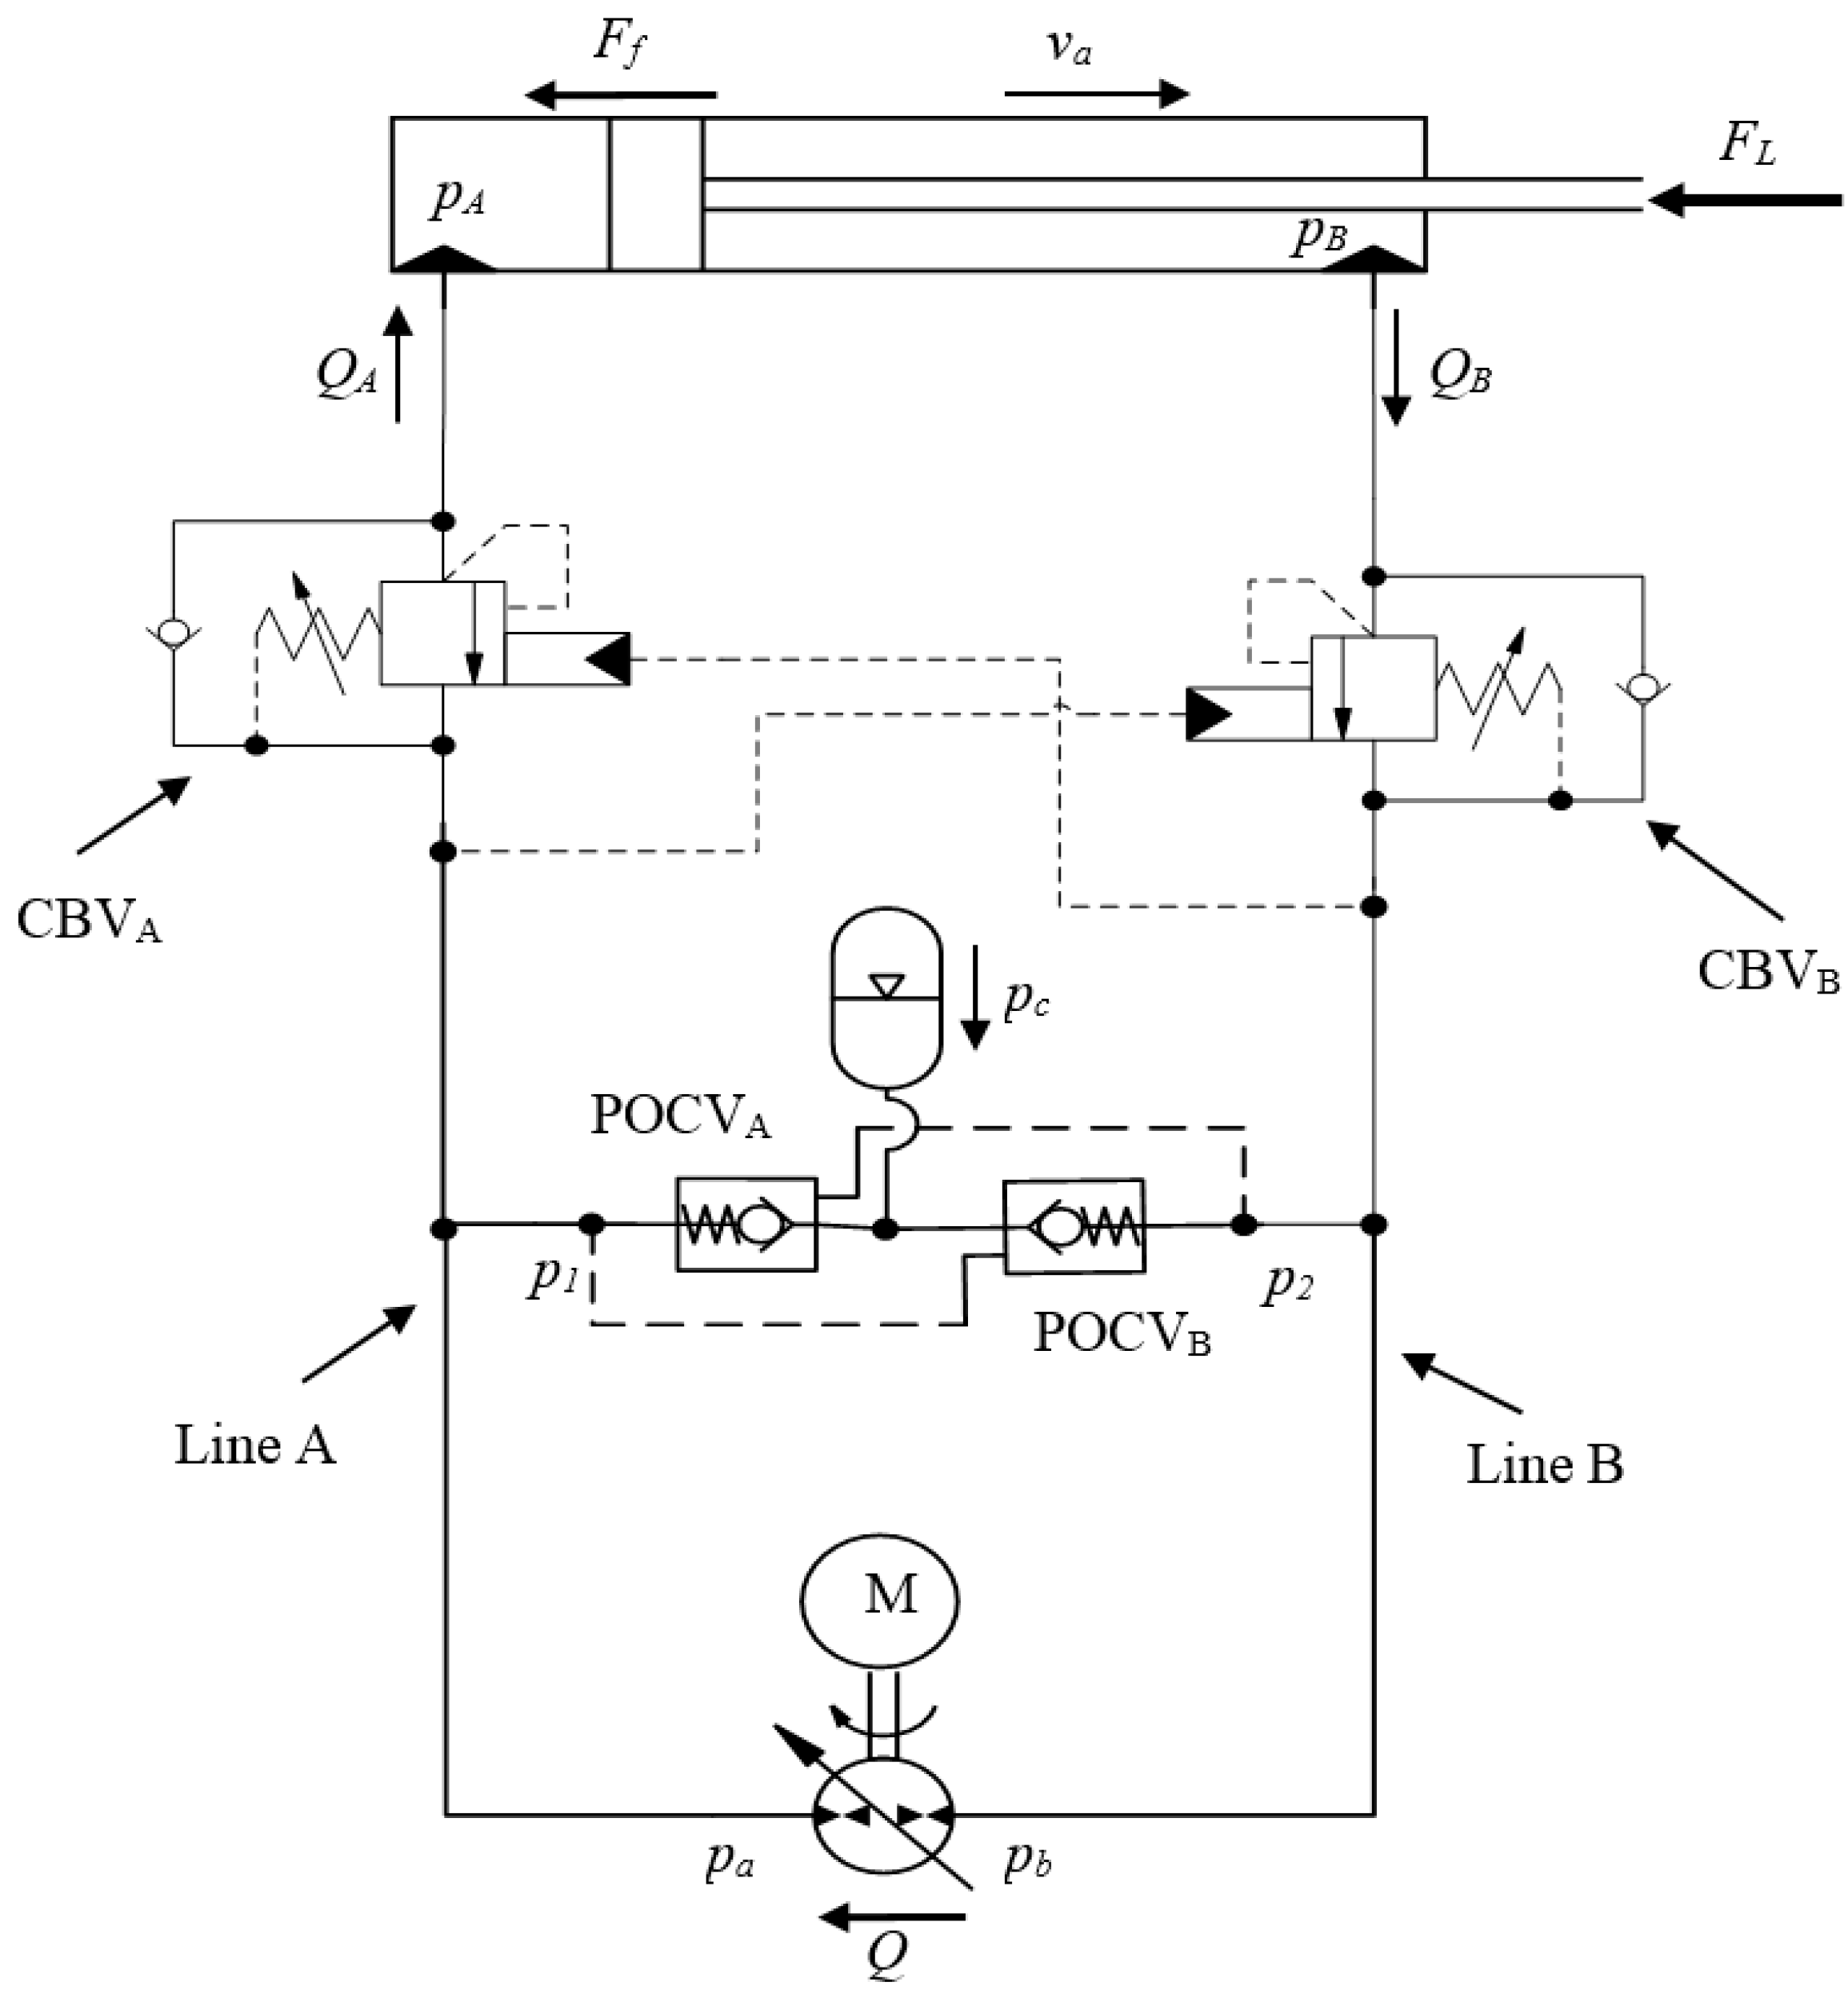
Figure 8 shows the proposed circuit implementation utilizing CBVs.
The need for two CBVs is due to the fact that CBVs restrict the flow in only one direction of motion. Note that each CBV is activated by two pressures; the first one is the pump cross-pilot pressure and the other one is the load-induced pressure (see
Figure 8). Both activation lines indicate the loading condition of the circuit which allows adjusting the CBVs to work in the required range of interest. Careful selections of CBVs flow ratings, pilot ratios and cracking pressures are needed for high performance. Given our circuit specifications, the low loading conditions is considered when the circuit pressure values are less than 15% of the maximum operating pressure (given number) in the circuit. At this loading condition, the CBVs act as a throttling valve while at higher loading conditions they are fully open with minimum pressure drop. Using an oversized CBVs provides a kind of parabolic relation between the throttling area and activating pressures which satisfies the above requirement.
5. Experimental Evaluation of Proposed Circuit
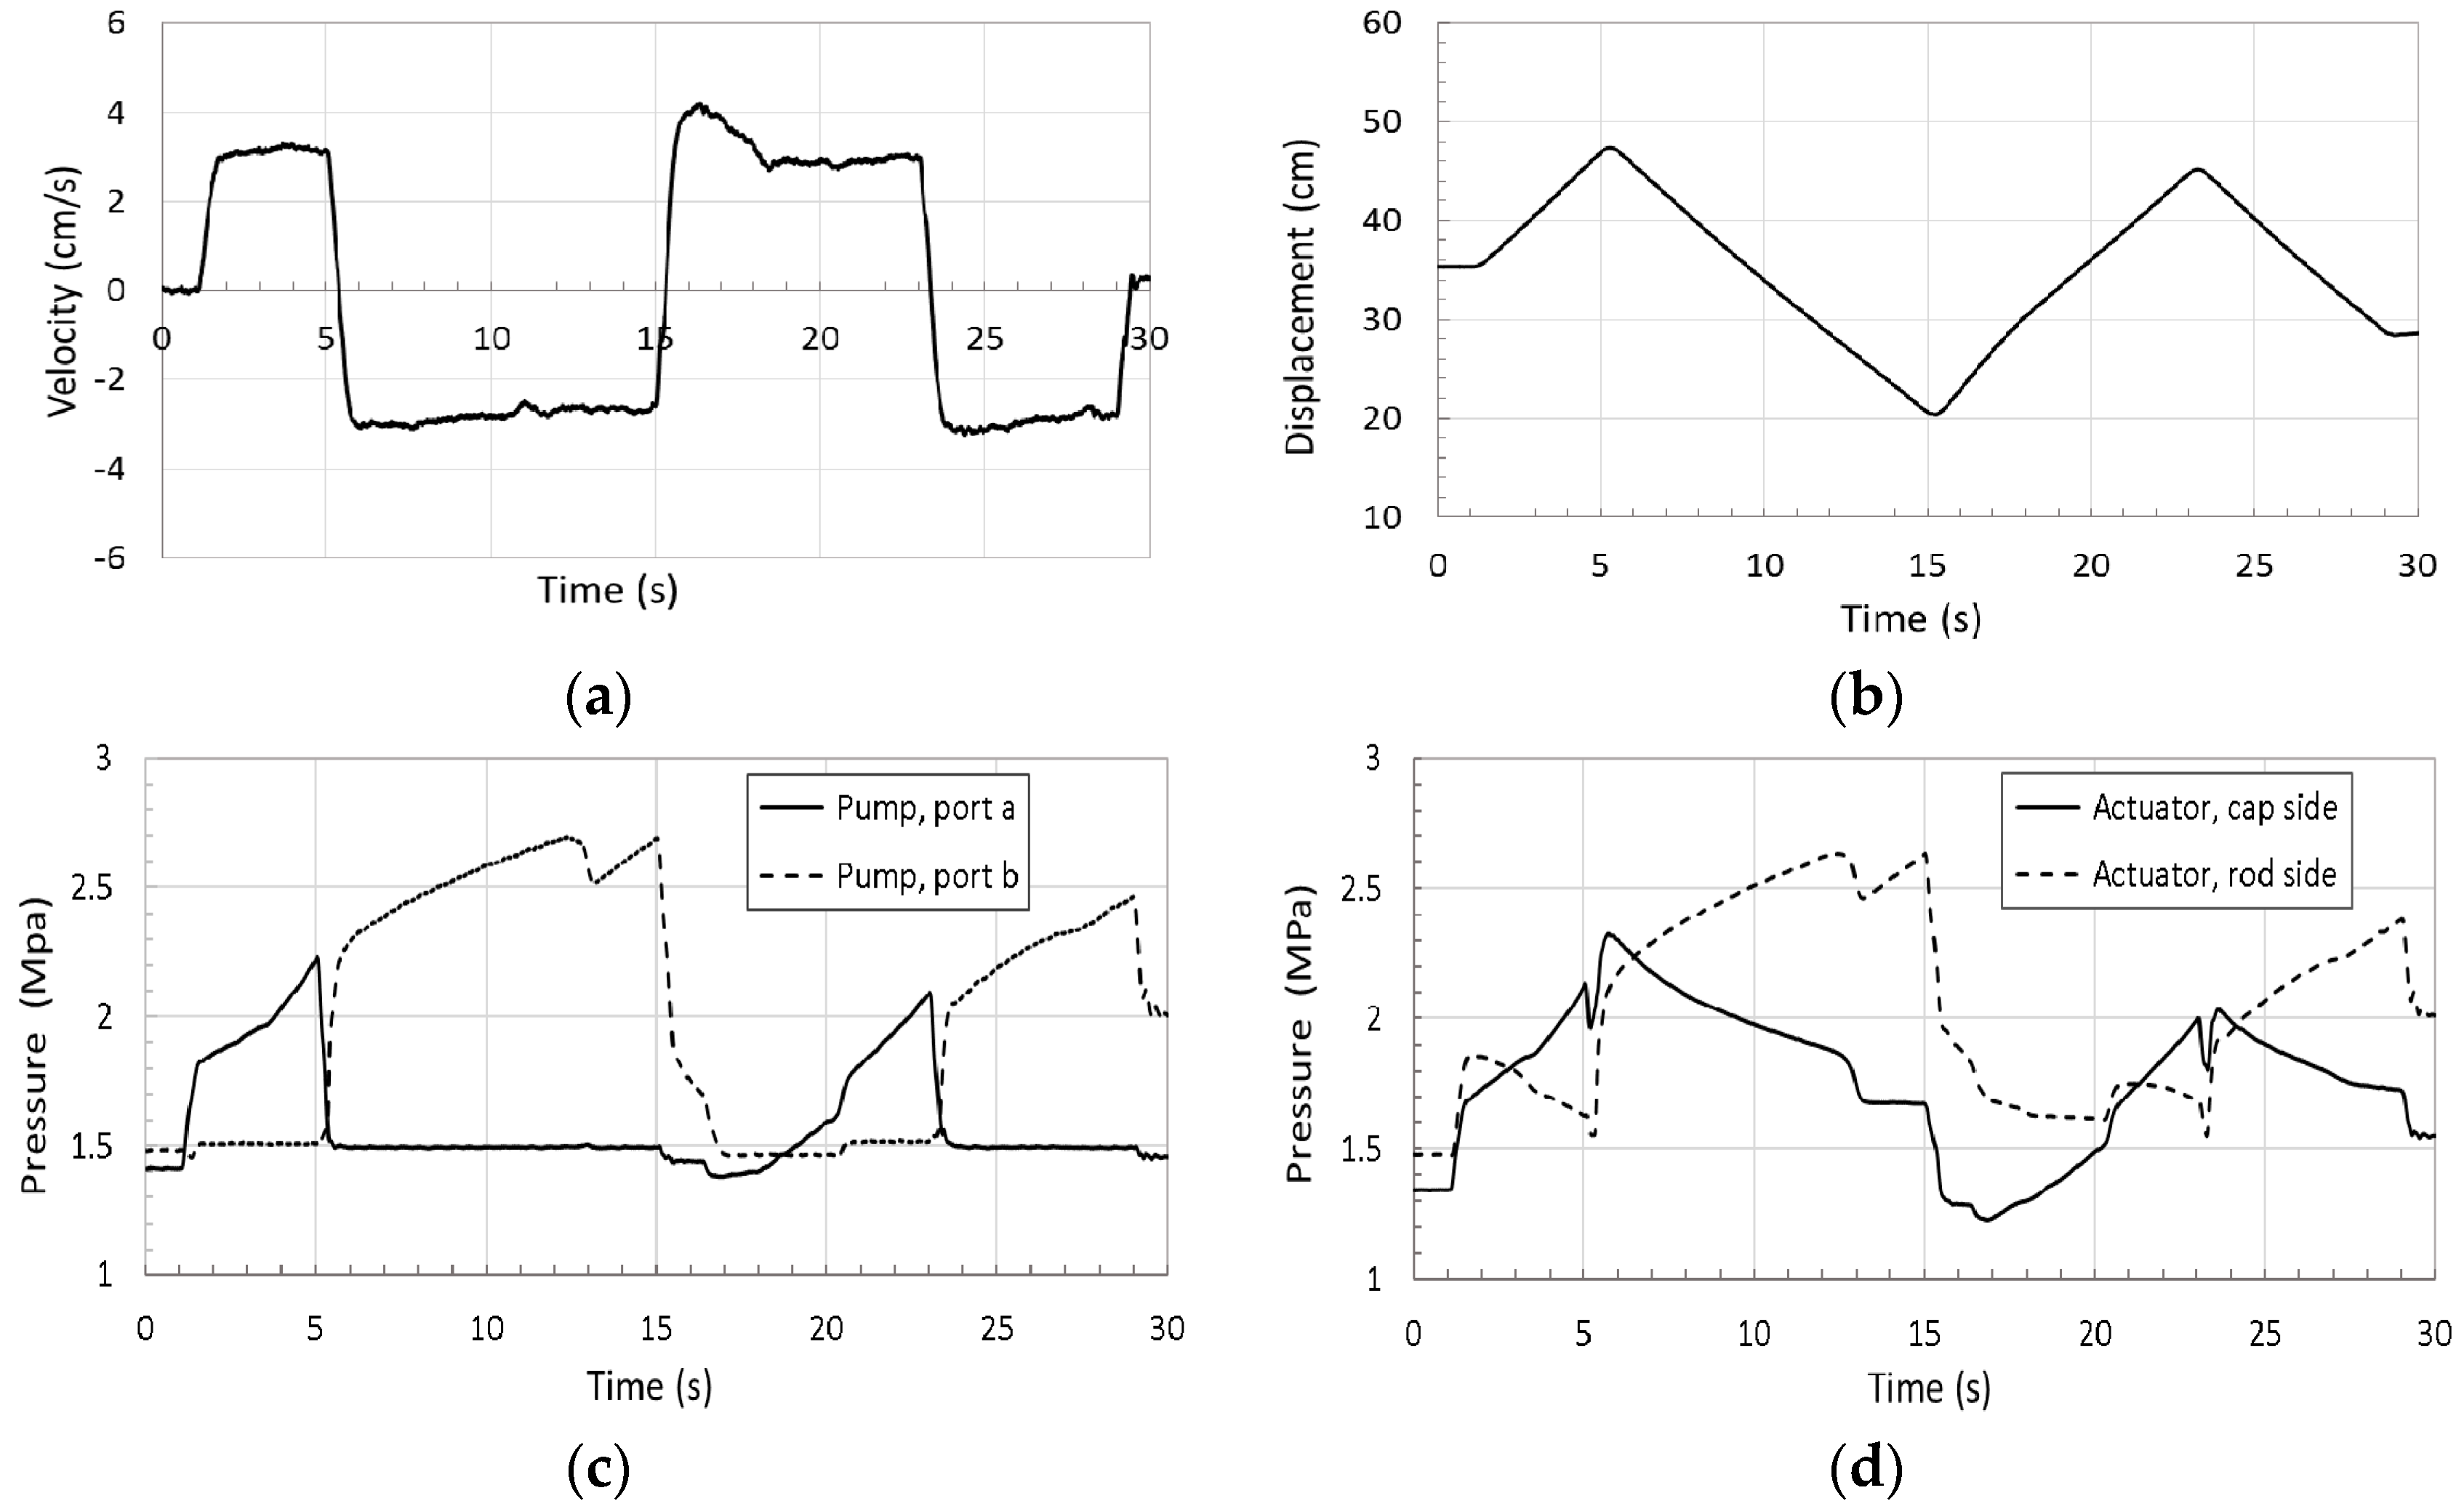
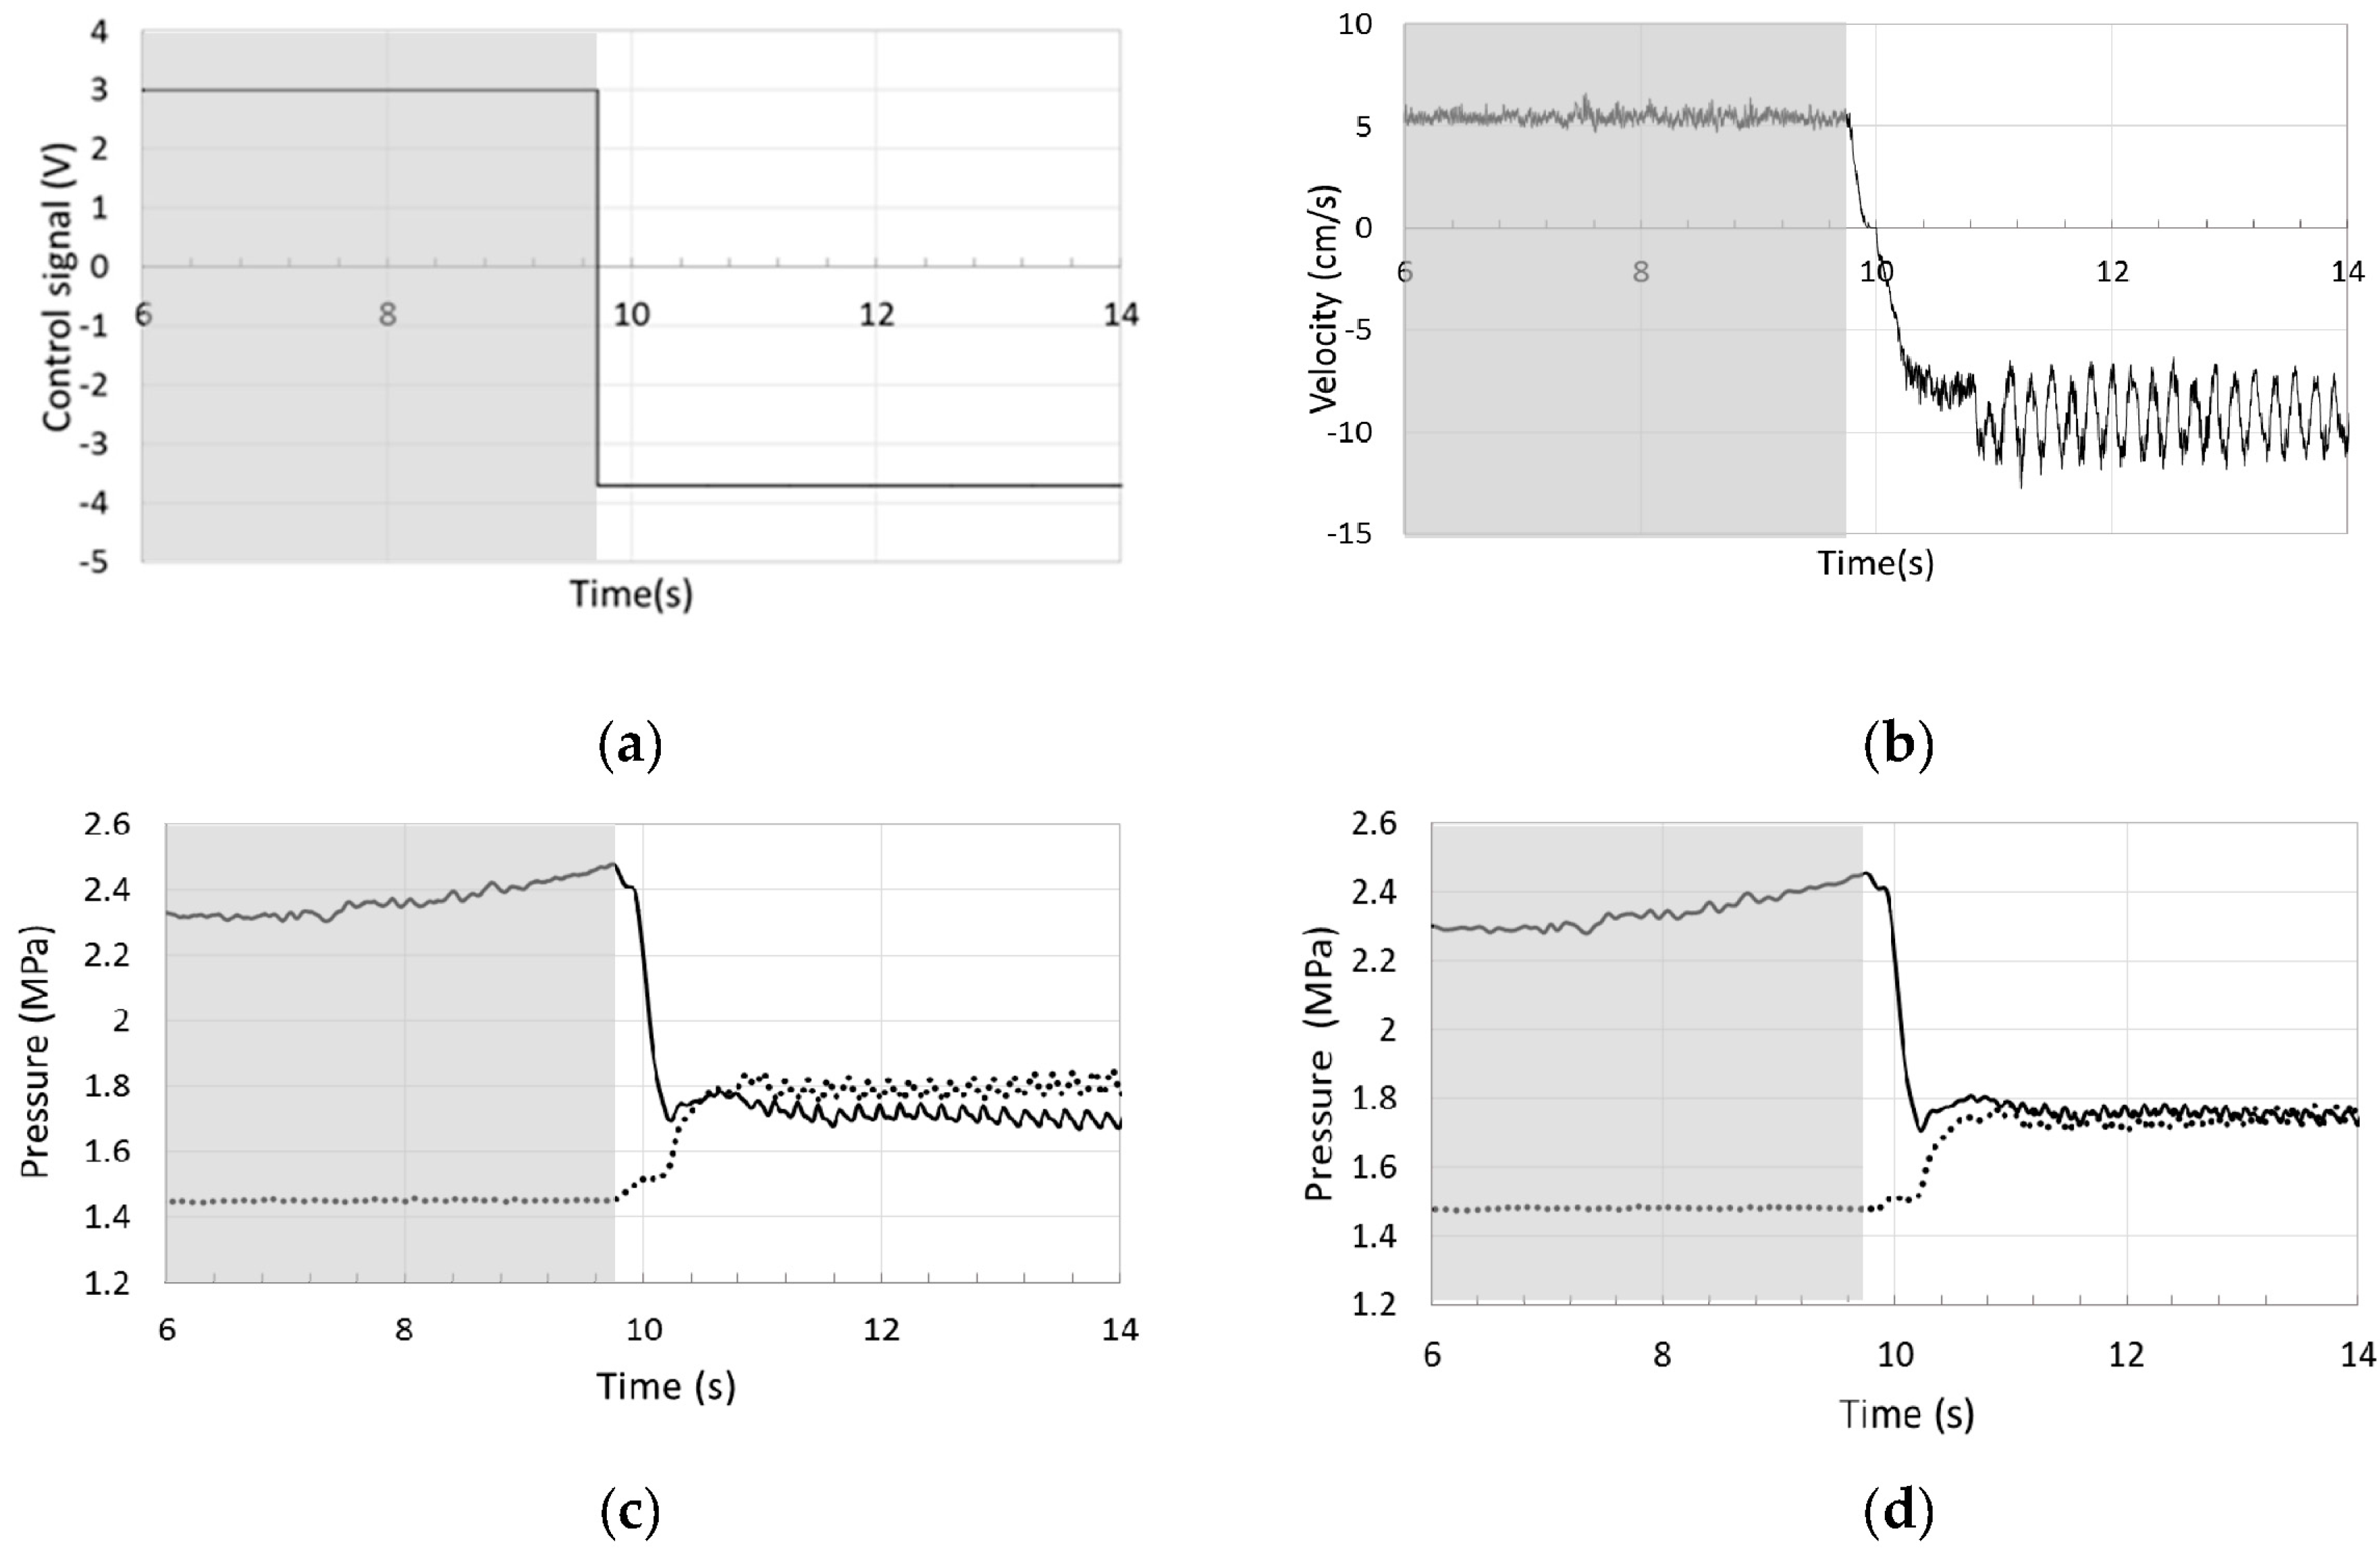
The first experiment was designed to demonstrate performance improvements at low loading conditions. The second set of tests were performed to show the circuit performance and energy consumption during operation that cover all four quadrants. The first experiment is designed to prove the oscillation-free response of the proposed circuit in the critical region 6. It was done on the reconfigured setup of the test rig in
Figure 4c. As was explained earlier, the system oscillation is expected during actuator retraction when the two pressures at both sides of the circuit are close to each other.
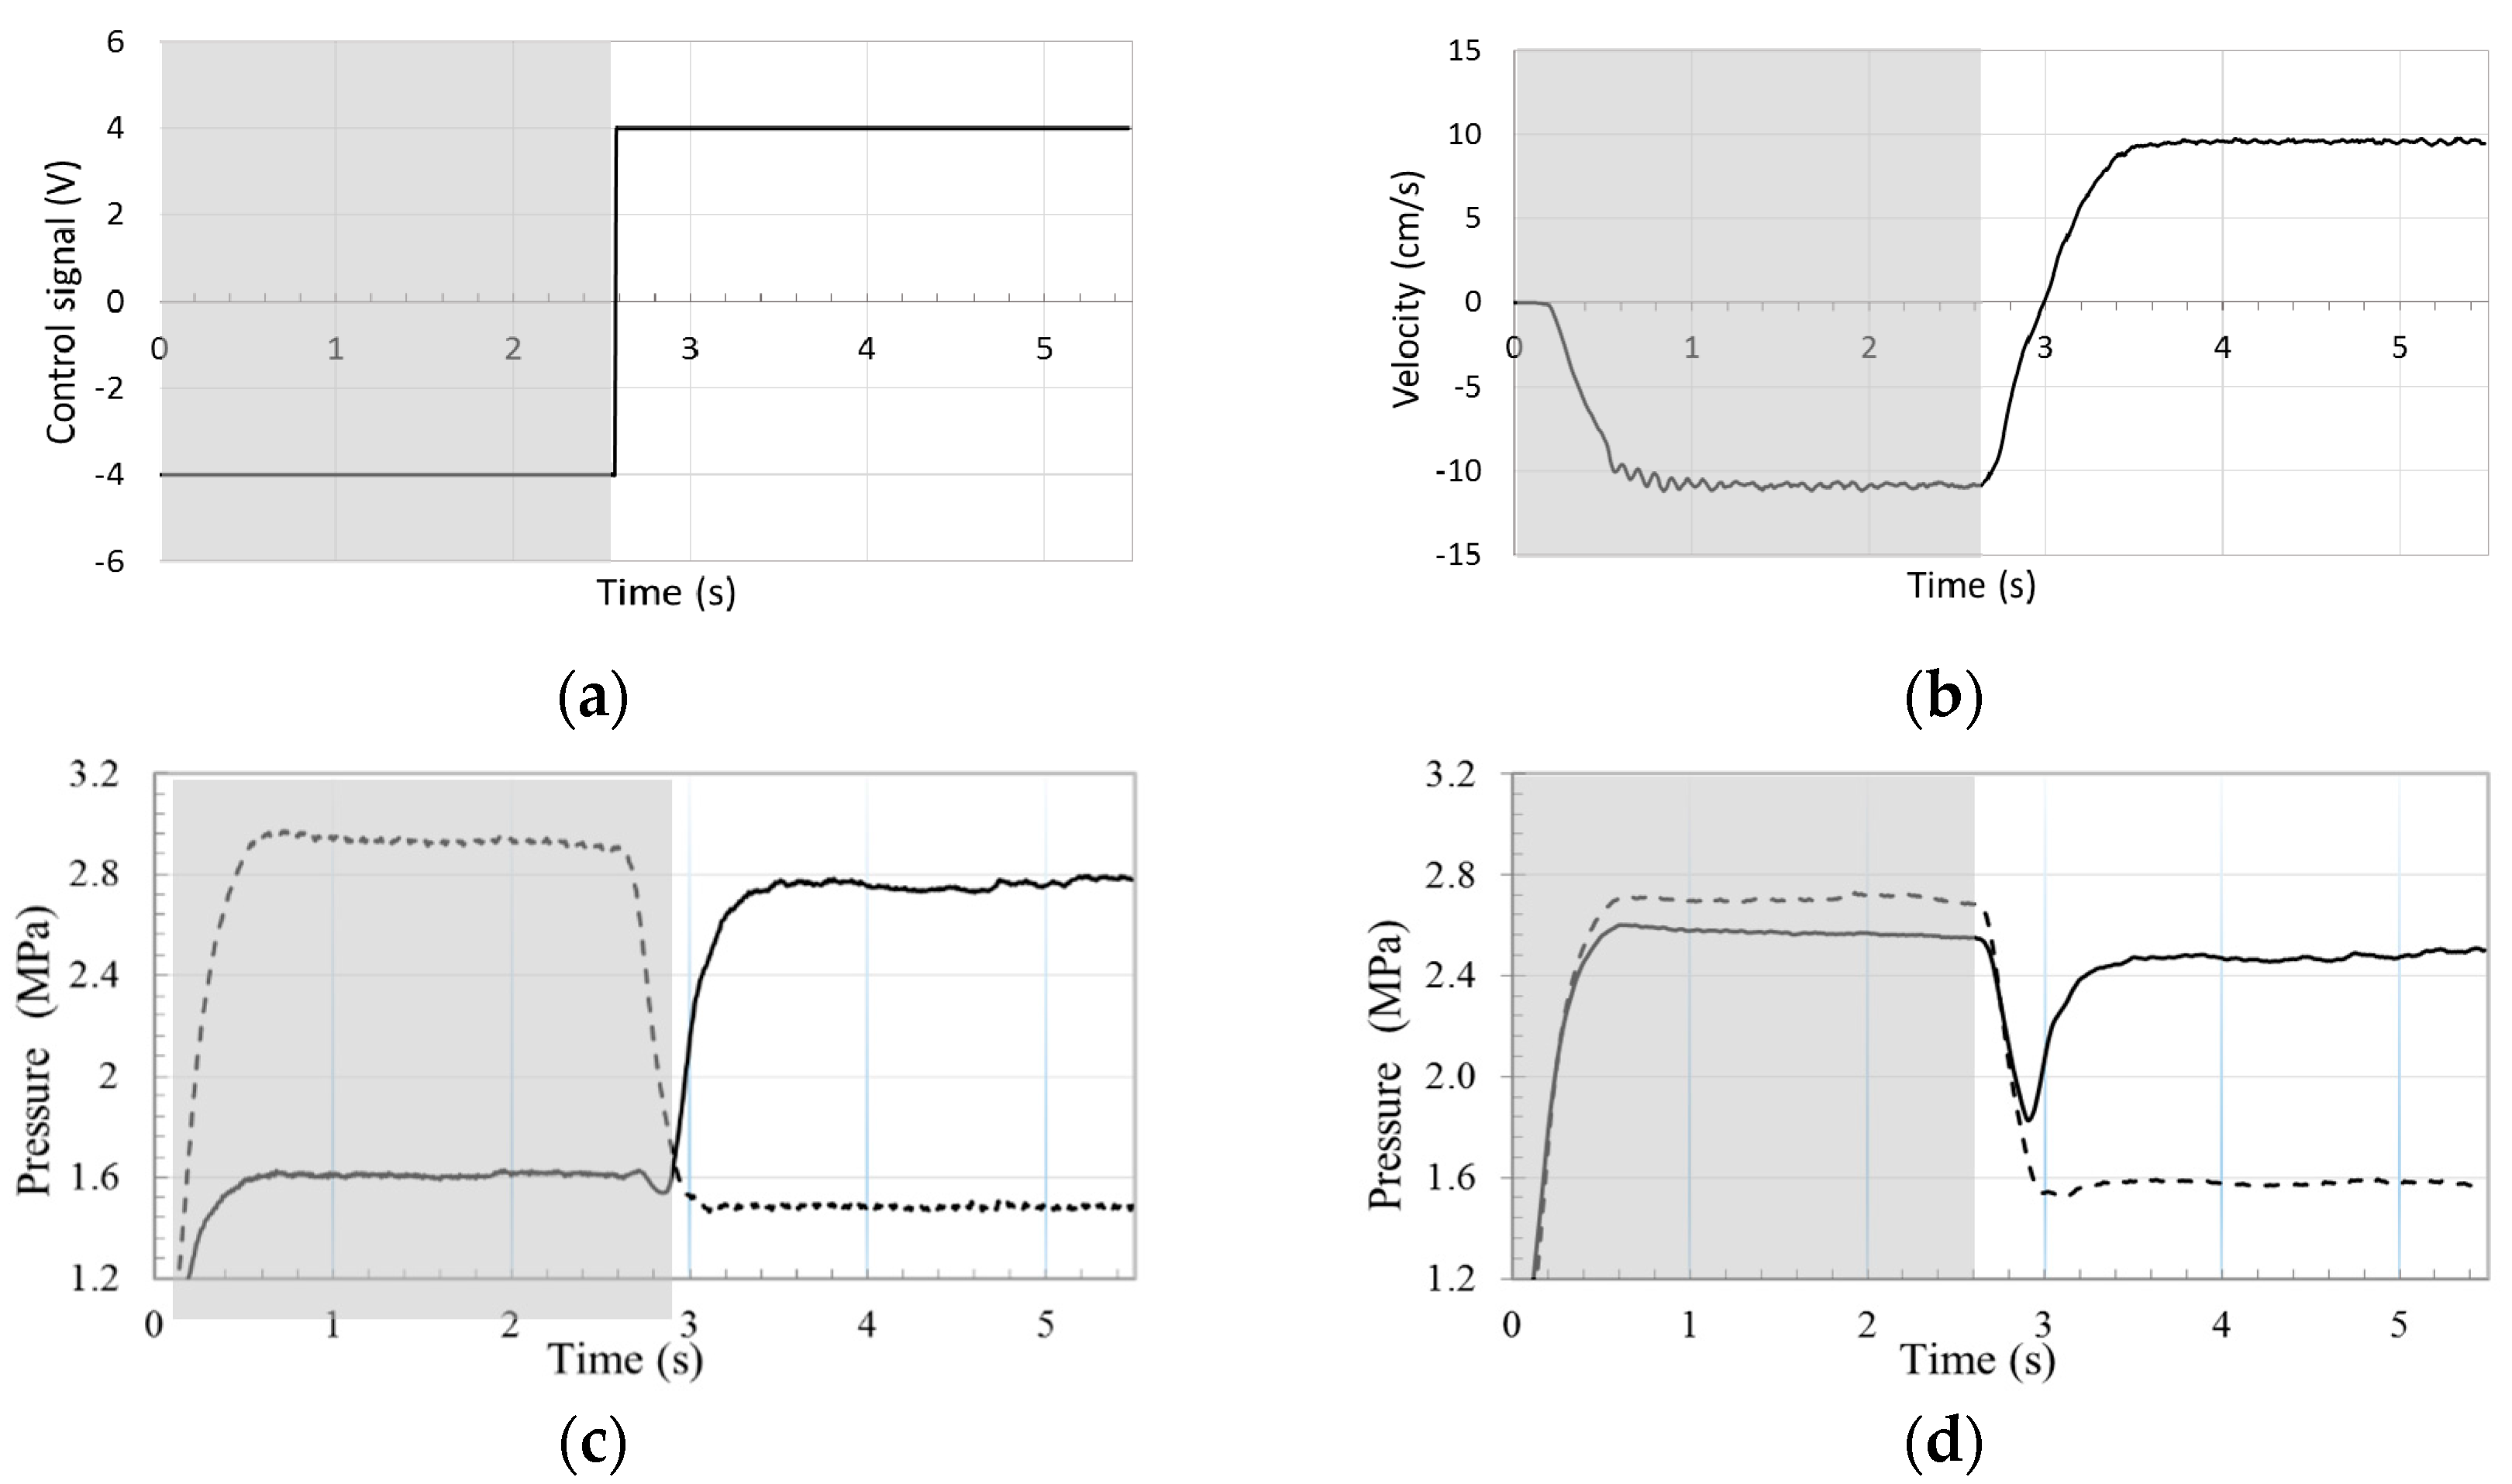
Figure 9 shows the performance in a typical retraction—extension of actuator with constant load (245 kg mass). This figure shows that actuator velocity and pressure graphs are non-oscillatory in the retraction portion (negative control signal) where the two pressures at the actuator ports are close to each other.
In the second set of experiments, two masses (41 kg and 368 kg) were applied to the full setup shown in
Figure 4a. The experiments were repeated for both the circuit that utilizes the POCVs and the proposed circuit (see
Figure 1 and
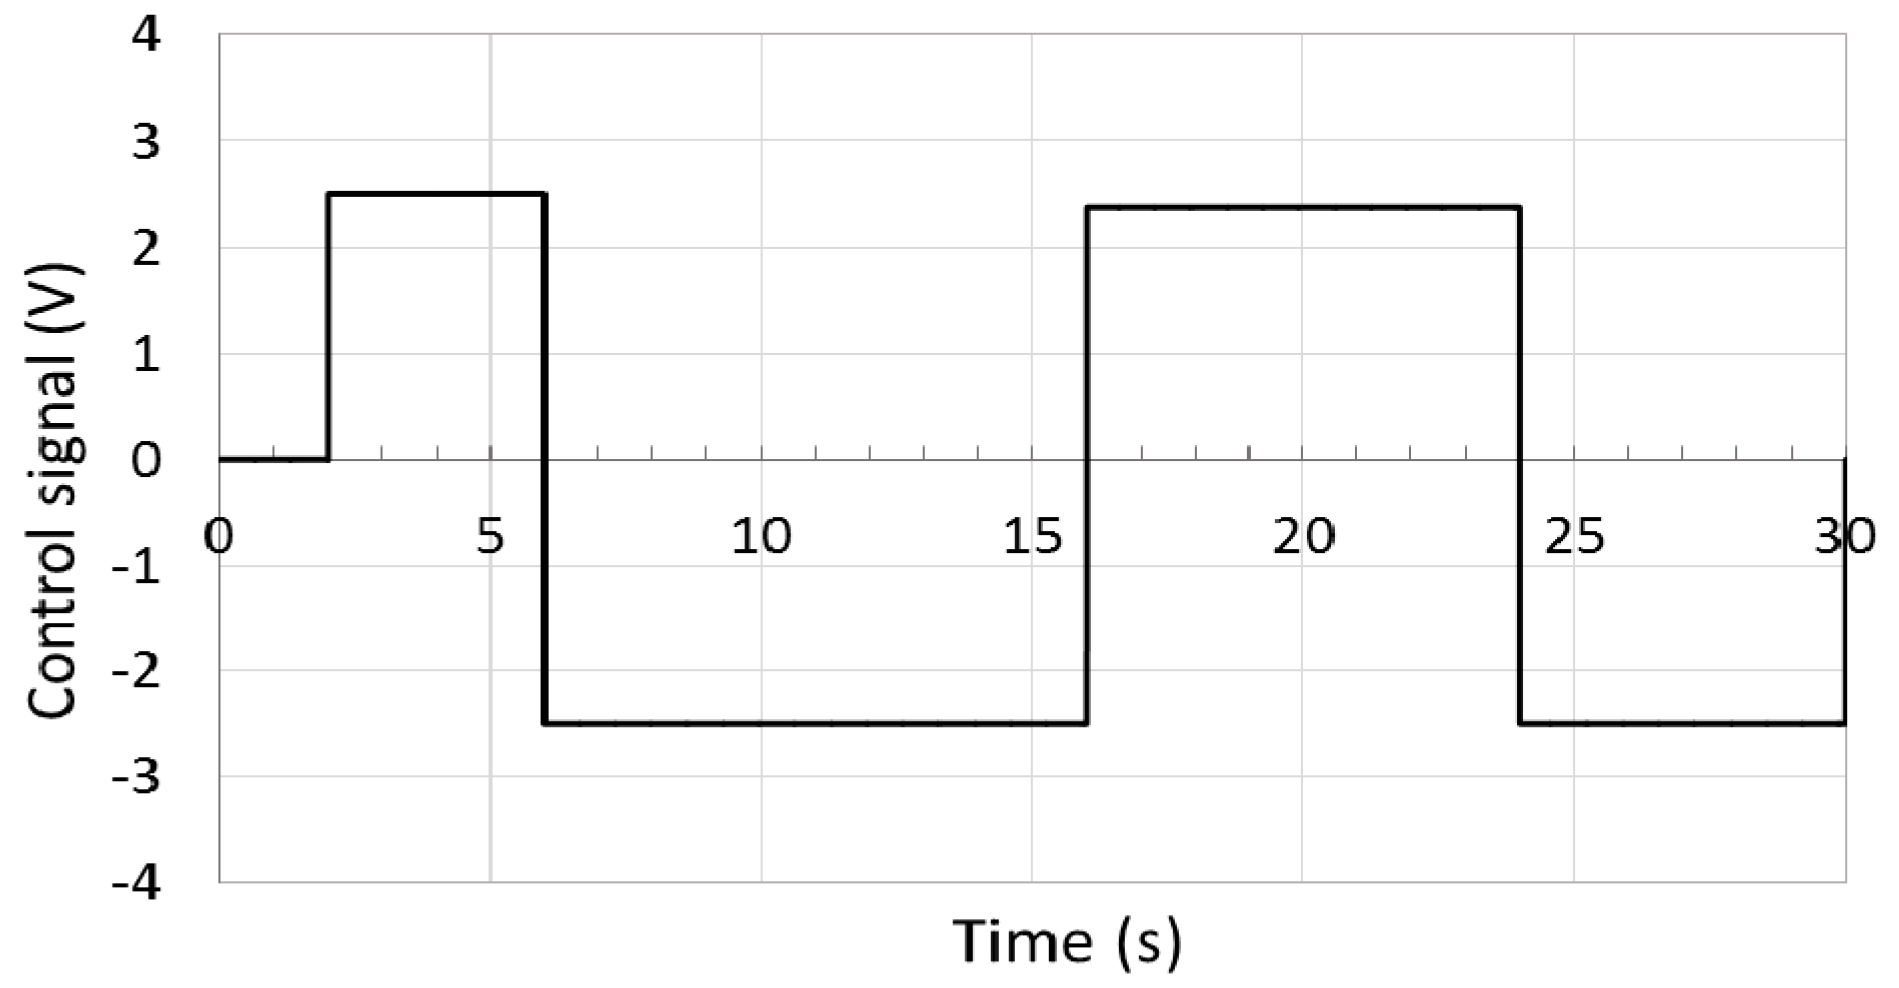
Figure 9). First, a wave square control signal input (
Figure 10) was applied to the pump to move the stick link carrying a 41 kg mass.
Results for both circuits are shown in
Figure 11,
Figure 12 and
Figure 13. It is clear that the circuit with the POCVs only exhibits oscillation during switching from assistive to resistive loading modes in actuator retraction. The oscillatory response is shown clearly in velocity, pump pressures, and actuator pressures. Results also show that performance of the proposed circuit is smooth without any significant oscillation during switching modes.
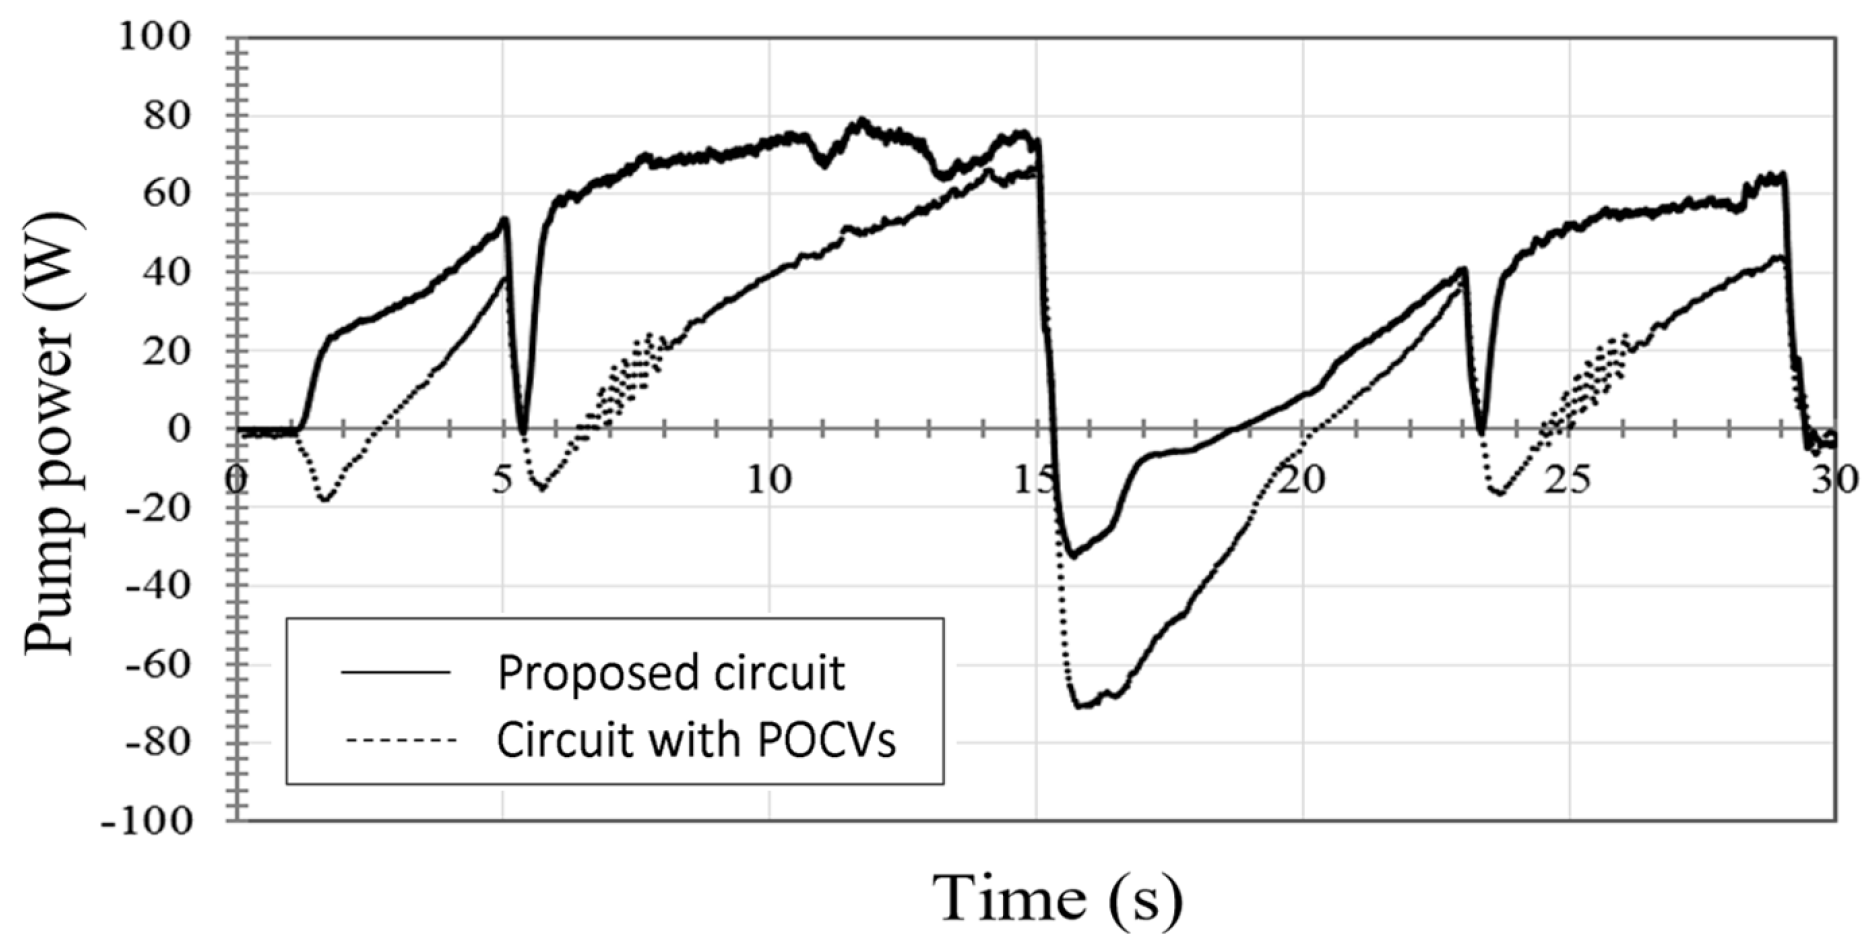
The proposed circuit, however, consumes more energy than the circuit with only POCVs as shown in
Figure 13. The delivered/received hydraulic energy from/to the pump to the circuit is calculated as the multiplication of the measured pressure differential across the pump by the flow rate,
.
was calculated by multiplying the actuator measured velocity and the piston effective area. Results showed that both circuits consume energy when load is resistive and recuperate energy when the load is assistive. For this experiment, the average delivered hydraulic energy from the pump to the circuit was 17.1 W for circuit that utilizes only POCVs and was 36 W for the proposed circuit. The average received (recuperated) hydraulic energy from the circuit to the pump are 7.2 W and 2.9 W for circuit that utilizes only POCVs and the proposed circuit, respectively. The extra energy consumed by the proposed circuit was used to overcome the hydraulic resistance generated by the CBVs to stabilize the system. Note that the extra needed energy decreases as the load increases. This can be observed for the experiment with 368 kg mass attached to the stick link. One more observation is that the original circuit reached a slightly higher stroke and performed slightly more mechanical work than the proposed circuit in the same time duration. This is attributed to the response delay in the proposed circuit due to the extra resistance of the CBVs.
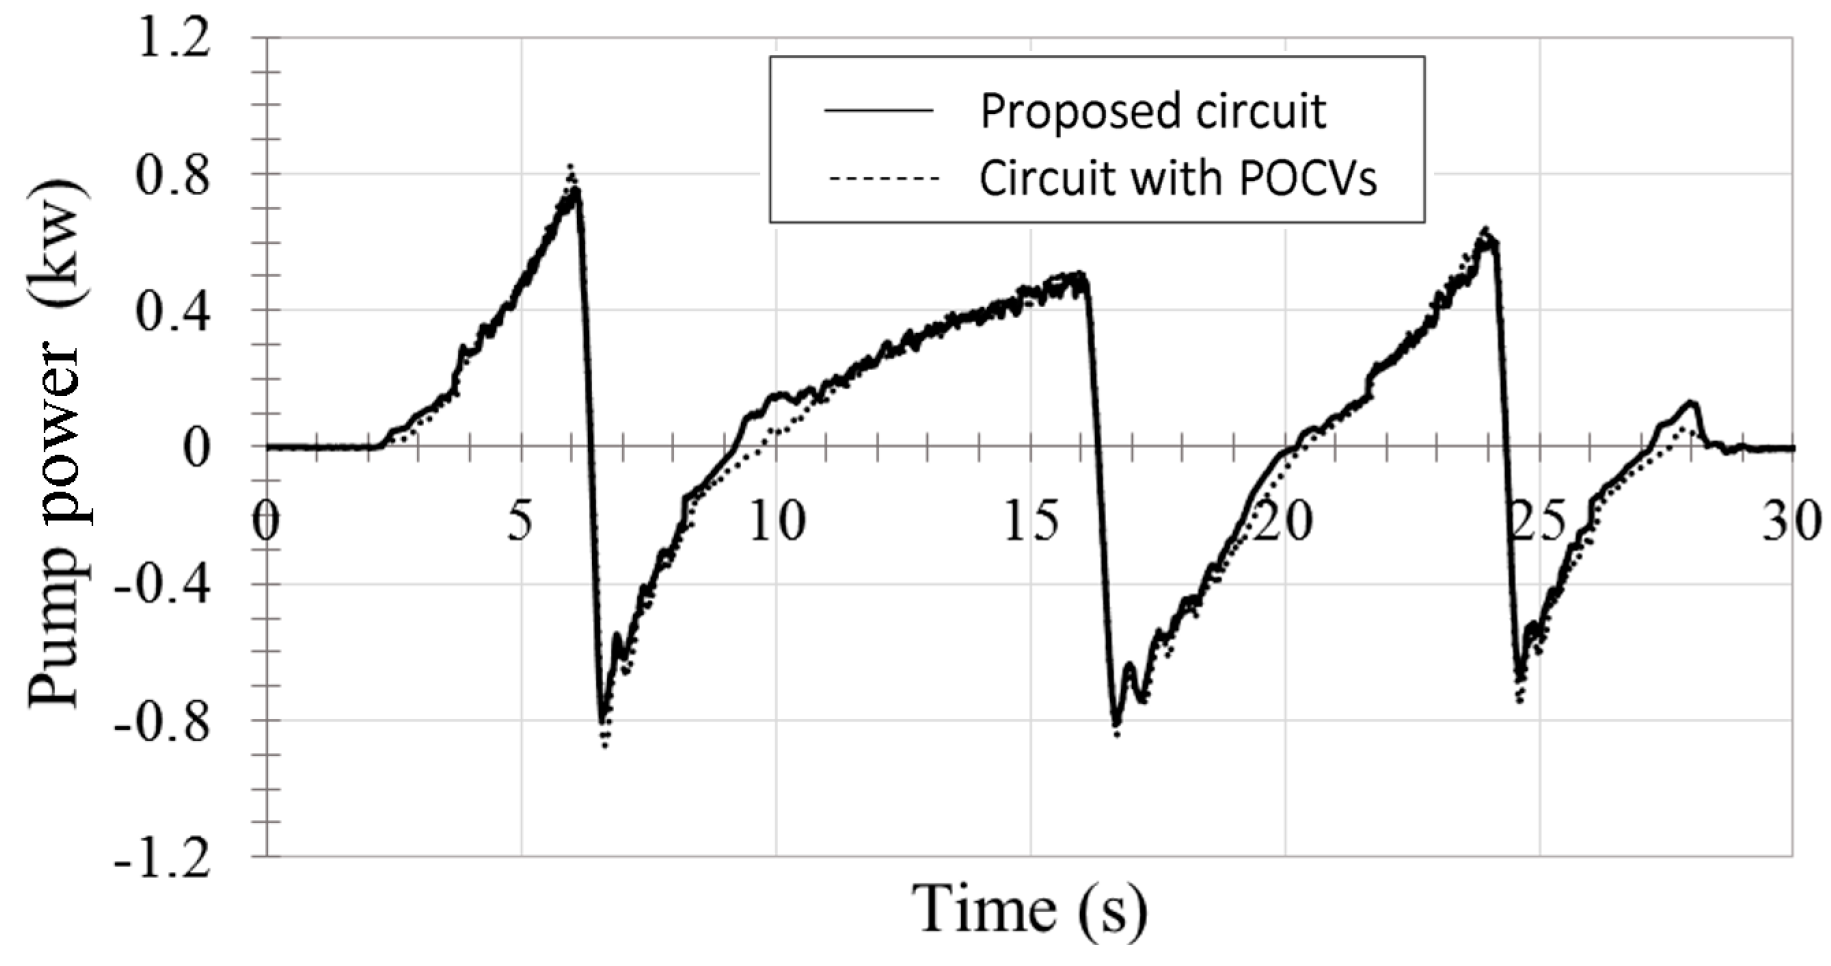
Figure 14 shows the actuator velocity at four quadrants of operation for 368 kg mass for the circuit with only the POCVs and the proposed circuit. Results show that performances were acceptable for both circuits. Acceptable results refer to responses that do not exhibit oscillations.
The main pump delivered/received hydraulic energies are shown in
Figure 15. It is clear from the graph that the energy consumptions for both circuits are almost the same. The average delivered hydraulic energies from the pump to the circuit are 145.1 W and 148.9 W for circuit that utilizes only POCVs and the proposed circuit, respectively. The average received (recuperated) hydraulic energies from the circuit to pump are 108.7 W and 102.2 W for the circuit that utilizes only POCVs and the proposed circuit, respectively. We also need to mention that the charge pump in both circuits consumed about 49.5 W. The average total delivered/received hydraulic energy for the circuit with POCVs only and the proposed circuit, including the charge pump consumption, are 85.9 W and 96.2 W, respectively, i.e., the proposed circuit consumed 12% more energy compared to a commonly used pump-controlled circuit that uses only POCVs at the maximum loading condition in our test rig (which is almost half of the actuator capacity).


