Modeling the Static Force of a Festo Pneumatic Muscle Actuator: A New Approach and a Comparison to Existing Models


1
Department of Electrical Engineering and Computer Science, Control Systems Group, Technical University of Berlin, Einsteinufer 17, D-10587 Berlin, Germany
2
Department VII, Electrical Engineering, Mechatronics and Optometry, Beuth Hochschule Berlin University of Applied Science, Luxemburger Straße 10, D-13353 Berlin, Germany
*
Author to whom correspondence should be addressed.
Actuators 2017, 6(4), 33; https://doi.org/10.3390/act6040033
Submission received: 7 September 2017
/
Revised: 15 October 2017
/
Accepted: 20 October 2017
/
Published: 2 November 2017
(This article belongs to the Special Issue Pneumatic Actuators)
Abstract
:In this paper, a new approach for modeling the static force characteristic of Festo pneumatic muscle actuators (PMAs) will be presented. The model is physically motivated and therefore gives a deeper understanding of the Festo PMA. After introducing the new model, it will be validated through a comparison to a measured force map of a Festo DMSP-10-250 and a DMSP-20-300, respectively. It will be shown that the error between the new model and the measured data is below 4.4% for the DMSP-10-250 and below 2.35% for the DMSP-20-300. In addition, the quality of the presented model will be compared to the quality of existing models by comparing the maximum error. It can be seen that the newly introduced model is closer to the measured force characteristic of a Festo PMA than any existing model.
1. Introduction
In recent years, pneumatic muscle actuators (PMAs, Figure 1) were integrated in many robotic systems [1,2,3,4] and are still particularly favored, especially in applications that have to be lightweight and powerful.
As can be seen in [6], most robotic systems driven by PMAs, but also driven by other actuators, require an underlying torque controller. While integrating PMAs in robotic systems, the control of PMAs and especially the precise torque control of PMA-driven joints consequently becomes an essential feature. The modeling of PMAs, strongly coupled to model-based controller designs, is therefore still a much discussed topic.
On the one hand, PMAs have their own dynamics, like hysteresis [7], some thermodynamic effects [8,9] and can even be interpreted as a spring–damper combination [10]. On the other hand, it has been shown in [11,12,13] that controlling PMAs, with only a static force map approach, can lead to accurate and high-performance controller designs. The reason is that the PMA dynamics are dominated by the fluid dynamics of the air inside the PMA and the stream of mass characterizing the valve that controls the PMA [14,15]. Nevertheless, a model describing the static PMA force precisely is crucial for the accuracy of the torque controller. Finding the most accurate model to describe the static force characteristic is therefore one goal of this paper.
Different approaches for modeling the static force characteristic of PMAs can be found in literature. The most popular approach is based only on air compression [16]. Although this approach is valid for McKibben PMAs, it is shown by measurements in [14] that this approach does not hold for Festo PMAs. To improve the accuracy of the model presented in [16], the model has been extended in many different ways [8,9,17,18]. It has been shown that these extensions are leading to fewer errors between measured static force maps and the forces predicted by the models. Another approach for the specific use on Festo PMAs has been presented in [12]. The basic idea is the approximation of a Festo PMA as a piston with a virtual, pressure-dependent piston area and a spring that counteracts the expansion. A second approach for the specific use on Festo PMAs is presented in [19], where the static force characteristic is supposed to behave like a mechanical spring with variable stiffness. Because of uncertain parameters, all models, except the first presented in [16], have in common that they must be identified by minimization of the error between a measured static force map and the force defined by the model. By comparing the maximum error, it will be shown in this paper how the accuracy of existing models varies. Furthermore, a new approach for modeling the static force characteristic of Festo PMAs will be presented. The model is physically motivated and therefore gives a deeper understanding of the Festo PMA. After introducing the new model in Section 3 and an explicit discussion of existing models in Section 4.1, all models will be compared to a measured force map of a Festo DMSP-10-250 (DMSP-<initial inner diameter in millimeter>-<initial length in millimeter>) and a DMSP-20-300 in Section 4.3. It will be shown that the error between the new model and the measured data is below 4.4% for the DMSP-10-250 and below 2.35% for the DMSP-20-300. In addition, the quality of the presented model will be compared to the quality of existing models by comparing the maximum error.
2. The Static Force Characteristic
A PMA is characterized by its force map. The PMA force is a function of the muscle pressure p and its length L, as can be found in [5,17,20,21]. The force map (Figure 2) can be read in the following way: Starting with an unfastened PMA at initial conditions, which means initial length and atmospheric pressure, the PMA does not exert any force. Now putting pressure inside, the PMA gets shorter until it is fully contracted (about 25% [5]). The exerted force is still zero. While pulling the pressurized PMA back to initial length, the PMA will react with the maximum force. The exerted force can be varied between zero and a length-dependent upper limit by varying the PMA pressure [13].
3. A New Model of the Static Force Characteristic
PMAs are a combination of a flexible tube and two stiff aluminium connectors (see Figure 1). The membrane that the tube is made of is a combination of a stiff aramid fiber mesh and a flexible rubber that encloses the air inside the PMA. While putting pressure inside the PMA, the membrane expands and, due to the stiff aramid fibers, the PMA gets shorter. According to [17], the approach for the presented PMA model also is that the fiber length stays constant and therefore only the membrane rubber deforms.
3.1. PMA Volume
Following the ideas of [14,15,17], the PMA volume can be approximated by a cylinder. The volume
of a cylinder is a function of length L and diameter D. Cutting the PMA membrane open and flattening it to a plain (Figure 3), the dependency of the diameter on the length can be calculated by using the Pythagoras theorem [17]. Supposing that is constant, the diameter equation
holds, whereby
The index 0 indicates the initial state of the PMA, with atmospheric pressure , initial length , inner diameter , membrane thickness and fiber angle . In [14], it is proven by measurements that the initial fiber angle is . This is the only value that can be found in literature. The initial membrane thickness, for both the DMSP-10-250 and the DMSP-20-300, can easily be calculated from the given initial inner diameter and the measurable outer initial diameter of the PMA rubber tube.
Inserting the functional dependency on the diameter back into the approximated volume (1), the PMA volume loses its dependency on the diameter and is only a function of the PMA length:
3.2. Energy-Based Modeling
While pulling a contracted PMA, the muscle reacts with a force against the pulling direction. The virtual work of the PMA is given through
Furthermore, the virtual work of the PMA can be separated into two parts. On the one hand, the virtual work has to be done to change the included air volume. On the other hand, additional virtual work is necessary to change the potential energy of the elastic membrane rubber. Therefore,
always holds.
3.2.1. Virtual Work of the Changing Air Volume
The virtual work needed to change the included air volume inside is given by
3.2.2. Elastic Energy of the Membrane
While putting pressure inside the PMA, the actuator gets shorter and expands. The deformation of the membrane is a plane state strain and can be described by the strain in direction of the PMA length and the PMA perimeter . Rotating the coordinate system by the membrane fiber angle , the deformation is given by the strain in fiber direction and the direction of pure rubber that is perpendicular to the fiber direction (see Figure 4). Following the approach of a constant fiber length, the strain is always zero. This means that the PMA membrane only expands perpendicularly to the fibers.
For this paper, a one-dimensional state of stress is assumed and, therefore, according to Hooke’s law, the tension inside the rubber will be approximated by
where the modulus of elasticity is supposed to be a function of the PMA length.
Following the approach of a one-dimensional membrane deformation, the strain
is given by the Pythagoras theorem.
Rotating the tension back to initial coordinates, it is possible to calculate the tension in length direction
and the tension in perimeter direction of the PMA
Multiplying the tension with the edge surfaces of the unreeled membrane, the virtual work to deform the membrane in length direction is given through
This approach neglects any effect of lateral contraction. The virtual work that is necessary to deform the membrane in perimeter direction can be calculated in an analog way:
The negative sign in Equation (13) is necessary because an increase in length of the PMA has to result in a decreasing perimeter, and this is defined to be positive for this paper.
3.2.3. Summarizing the Energy
It must be noted that Equation (14) is positive, in case the PMA exerts a pulling force.
Because the modulus of elasticity of the membrane rubber and the fiber angle cannot be measured directly, both terms are identified by minimization. The modulus of elasticity used in Equations (10) and (11) is approximated by a polynomial of the third order:
This order is chosen by experiment. It can be seen that higher order polynomials do not lead to better results. However, for lower order polynomials, the calculated error, defined later in this paper (Equation (23)), is much higher. Furthermore, the approximately known fiber angle is corrected by a constant :
is now used as the new, corrected fiber angle. In this paper, all parameters and () have to be identified through solving the minimization problem (22). The parameters and are calculated in such a way that the quadratic error between a measured force map and the forces predicted by the models is the smallest. A more detailed discussion of the optimization will be given later in this paper.
4. Validation and Comparison to Existing Models
4.1. Existing Models
Defining a valid model describing the static force characteristic of a PMA is still a much discussed topic. The first model that was introduced to describe a McKibben Muscle [16] was only based on the energy that is needed to change the inner PMA air volume. Effects of elasticity of the membrane material were fully neglected:
It is shown in [14] that the remaining error between the measured static force characteristic of a Festo PMA and (17) is not negligible. The reason for this is that the Festo PMA stores potential energy in its deformed membrane and the McKibben PMA does not.
A modified version of Equation (17) is presented in [8,9], where Equation (17) has been corrected by two additional factors and :
Although the parameters and were calculated directly in [8,9], in this paper, both parameters will be identified by solving the minimization (22). A third improved, inspired by Equation (17) model variant is presented in [18]:
A model for the specific use on a Festo PMA is presented in [12]. This model is a combination of the pressure-virtual-piston-area product and a length-dependent counter force . The idea is that the PMA behaves like a combination of a pneumatic piston with a variable piston area and a mechanical spring that counteracts the expansion of the PMA:
In [19], the static force characteristic of a Festo PMA is supposed to be equivalent to a mechanical spring, with a displacement-pressure-dependent spring stiffness :
4.2. Test Rig
The static force maps of a Festo DMSP-10-250 and a DMSP-20-300 have been measured with the test rig depicted in Figure 5.
During the measurement, all screws are fastened and the PMA length is fixed. The pressure is varied between the length-dependent lower limit and the maximum pressure. While varying the pressure, the PMA force is measured by a 1D-forcesensor KD9363-0.5t and a GSV-1A measurement amplifier, both from ME-Meßsysteme GmbH (Hennigsdorf, Germany). Combining the pressure-dependent force characteristics for different lengths, it is easy to determine the static force characteristic as shown in Figure 2. To reduce the influence of measurement errors, the measurement process has been repeated ten times. The depicted force map therefore shows the mean values. Both measured force maps, for the Festo DMSP-10-250 and the DMSP-20-300, can be found in the appendix in Table A1 and Table A2, respectively.
4.3. Results
The measured static force maps are characterizing the force behavior of the Festo DMSP-10-250 and DMSP-20-300, respectively. First, the presented PMA models (14), (18)–(21) are identified by minimizing the quadratic error between the measured force map and the force map calculated by the model. The optimization has been solved by using the MATLAB (R2015b, The MathWorks, Inc., Natick, MA, USA) function fminsearch:
Because the optimization problem (22) is nonlinear, only a local, start point-dependent minimum can be found. The start point for all models was identified by iterative testing. It can be seen that good results—in the sense of a small error—can be achieved if the start points are chosen with respect to the physical meaning and within a proper range. According to the SI units— for lengths and bar for pressure—any parameter and () is set to 1 if it is only multiplied to a length-dependent factor and to if it is multiplied by the pressure. The modulus of elasticity of rubber, necessary for Equation (14), is supposed to be in the area of , and therefore the chosen start point is set to . The initial fiber angle in Equation (14) is supposed to be correct. The chosen parameter estimation’s start points for all models are given without units in Table 1.
To demonstrate the validity of the the estimated parameters and defining the new model (14), they are given in Table 2. As assumed, the values for the modulus of elasticity are in the range of , and the initial fiber angle is only slightly corrected by for the DMSP-10-250 and for the DMSP-20-300, respectively.
All identified models can now be used for calculating their own specific force maps. The error between the calculated and the measured force map
is defined as the maximum difference between a measured and a calculated force point, normalized to the maximum measured force. Multiplied by 100, the error is given by percentage and is shown in Table 3.
It can be seen in Table 3 that the presented model is closer to the measured static force map of the Festo DMSP-10-250 and DMSP-20-300 than any existing model. The error of Equation (14) for the Festo DMSP-10-250 is smaller than 4.4% and, for the Festo DMSP-20-300, smaller than 2.35%. Furthermore, it can be seen that Equation (17) leads to a maximum error for both PMAs and does not seem to be accurate enough to describe the static force characteristic of a Festo PMA.
5. Conclusions
In this paper, a new approach for modeling the static force characteristic of Festo PMAs is presented. After a detailed derivation of the new model (14), the validity of the model is demonstrated by a comparison to a measured static force map of a Festo DMSP-10-250 and DMSP-20-300, respectively. It is shown that the maximum error between the„true“ force and the one predicted with Equation (14) is smaller than 4.4% for the Festo DMSP-10-250 and smaller than 2.35% for the Festo DMSP-20-300. Furthermore, it is shown that the presented model is closer to the measured data than any existing model that can be found in literature.
Acknowledgments
All presented research results have been supported by the German Federal Ministry for Economic Affairs and Energy (BMWi), especially The Central Innovation Programme for SMEs and the research project Development of a PMA-driven Exoskeleton for the Upper Body (project number ZF4007503). Furthermore, special thanks are extended to Michael Drummond, who developed the excellent test rig that has been used for measuring all static force maps.
Author Contributions
Mirco Martens was the main author of the manuscript and developed the presented model of a Festo pneumatic muscle actuator. Furthermore, Mirco Martens investigated the new model and all existing models under the aspect of accuracy by comparing them to the measured static force maps. Ivo Boblan was the main supervisor and adviser of the work and contributed to the manuscript by reviewing and revising its contents.
Conflicts of Interest
The authors declare no conflict of interest. The founding sponsors had no role in the design of the study; in the collection, analyses, or interpretation of data; in the writing of the manuscript, and in the decision to publish the results.
Appendix A. Measurement Data
Appendix A.1. Force Map of DMSP-20-300

Table A1.
Measured force map of a Festo DMSP-20-300 in .
| Length [m] | 0.296 | 0.282 | 0.267 | 0.25 | 0.237 | 0.222 | |
|---|---|---|---|---|---|---|---|
| Pressure [Pa] | |||||||
| 35,000 | 0 | 0 | 0 | 0 | 0 | 0 | |
| 60,000 | 54.9 | 0 | 0 | 0 | 0 | 0 | |
| 85,000 | 113.4 | 0 | 0 | 0 | 0 | 0 | |
| 110,000 | 179 | 0 | 0 | 0 | 0 | 0 | |
| 135,000 | 241.8 | 0 | 0 | 0 | 0 | 0 | |
| 146,250 | 273.3 | 21.1 | 0 | 0 | 0 | 0 | |
| 157,500 | 300.2 | 42.9 | 0 | 0 | 0 | 0 | |
| 168,750 | 331 | 70.3 | 0 | 0 | 0 | 0 | |
| 180,000 | 355.6 | 93.7 | 0 | 0 | 0 | 0 | |
| 197,500 | 402.5 | 131 | 27.7 | 0 | 0 | 0 | |
| 215,000 | 446.5 | 165.2 | 61.6 | 0 | 0 | 0 | |
| 232,500 | 495.9 | 204.1 | 92.7 | 0 | 0 | 0 | |
| 250,000 | 543.4 | 244.7 | 122 | 0 | 0 | 0 | |
| 281,250 | 623.5 | 309.7 | 170.2 | 42.8 | 0 | 0 | |
| 312,500 | 708.8 | 380.4 | 221 | 80.6 | 0 | 0 | |
| 343,750 | 787.9 | 443.7 | 277.4 | 118.7 | 0 | 0 | |
| 375,000 | 870.9 | 518.9 | 328 | 157.6 | 0 | 0 | |
| 450,000 | 1065.2 | 676.4 | 462.3 | 252.1 | 65.5 | 0 | |
| 525,000 | 1268.9 | 837.5 | 587.8 | 352.3 | 124.7 | 0 | |
| 600,000 | 1460.1 | 1004 | 714.8 | 443.5 | 188.1 | 0 | |
| 675,000 | 1653.5 | 1164.3 | 840.7 | 535.8 | 253.3 | 0 | |
Appendix A.2. Force Map of DMSP-10-250
Table A2.
Measured force map of a Festo DMSP-10-250 in .
| Length [m] | 0.25 | 0.234 | 0.219 | 0.204 | 0.198 | |
|---|---|---|---|---|---|---|
| Pressure [Pa] | ||||||
| 5000 | 0 | 0 | 0 | 0 | 0 | |
| 68,750 | 32.1667 | 0 | 0 | 0 | 0 | |
| 132,500 | 84.8333 | 0 | 0 | 0 | 0 | |
| 196,250 | 139.5 | 0 | 0 | 0 | 0 | |
| 260,000 | 195.6667 | 0 | 0 | 0 | 0 | |
| 285,000 | 217.6667 | 17 | 0 | 0 | 0 | |
| 310,000 | 239.6667 | 35.1667 | 0 | 0 | 0 | |
| 335,000 | 261.6667 | 52.6667 | 0 | 0 | 0 | |
| 360,000 | 283.8333 | 71.3333 | 0 | 0 | 0 | |
| 402,187 | 321.5 | 101.5 | 22.8333 | 0 | 0 | |
| 444,375 | 359 | 132.3333 | 46.1667 | 0 | 0 | |
| 486,562 | 396.6667 | 162.5 | 69.3333 | 0 | 0 | |
| 528,750 | 434.3333 | 193.6667 | 92.1667 | 0 | 0 | |
| 559,062 | 461.6667 | 216.3333 | 109.3333 | 11.5 | 0 | |
| 589,375 | 488.3333 | 238.1667 | 126.3333 | 23.3333 | 0 | |
| 619,688 | 515.8333 | 261 | 142.6667 | 35 | 0 | |
| 650,000 | 542.5 | 282.8333 | 158.6667 | 46 | 0 | |
References
- Boblan, I.; Maschuw, J.; Engelhardt, D.; Schulz, A.; Schwenk, H.; Bannasch, R.; Rechenberg, I. A human-like robot hand and arm with fluidic muscles: Modelling of a muscle driven joint with an antagonistic setup. In Proceedings of the 3rd International Symposium on Adaptive Motion in Animals and Machines, Ilmenau, Germany, 25–30 September 2005. [Google Scholar]
- Caldwell, D.G.; Tsagarakis, N.G.; Kousidou, S.; Costa, N.; Sarakoglou, I. “Soft” exoskeletons for upper and lower body rehabilitation—Design, control and testing. Int. J. Humanoid Robot. 2007, 4, 549–573. [Google Scholar] [CrossRef]
- Balasubramanian, S.; Wei, R.; Perez, M.; Shepard, B.; Koeneman, E.; Koeneman, J.; He, J. RUPERT: An exoskeleton robot for assisting rehabilitation of arm functions. In Proceedings of the 2008 Virtual Rehabilitation, Vancouver, BC, Canada, 25–27 August 2008. [Google Scholar]
- Noritsugu, T.; Tanaka, T. Application of rubber artificial muscle manipulator as a rehabilitation robot. IEEE/ASME Trans. Mechatron. 1997, 2, 259–267. [Google Scholar] [CrossRef] [Green Version]
- Festo AG. Datasheet—Fluidic Muscle DMSP/MAS; Festo AG: Esslingen am Neckar, Germany, 2016. [Google Scholar]
- Siciliano, B.; Sciavicco, L.; Villani, L.; Oriolo, G. Motion Control. In Robotics: Modelling, Planning and Control; Springer: London, UK, 2009; pp. 303–361. [Google Scholar]
- Lin, C.J.; Lin, C.R.; Yu, S.K.; Chen, C.T. Hysteresis modeling and tracking control for a dual pneumatic artificial muscle system using Prandtl-Ishlinskii model. Mechatronics 2015, 28, 35–45. [Google Scholar] [CrossRef]
- Andrikopoulos, G.; Nikolakopoulos, G.; Manesis, S. Incorporation of thermal expansion in static force modeling of pneumatic artificial muscles. In Proceedings of the 2015 23rd Mediterranean Conference on Control and Automation (MED), Torremolinos, Spain, 16–19 June 2015; pp. 414–420. [Google Scholar]
- Andrikopoulos, G.; Nikolakopoulos, G.; Manesis, S. Novel Considerations on static force modeling of pneumatic muscle actuators. IEEE/ASME Trans. Mechatron. 2016, 21, 2647–2659. [Google Scholar] [CrossRef]
- Kerscher, T.; Albiez, J.; Zollner, J.M.; Dillmann, R. Evaluation of the dynamic model of fluidic muscles using quick-release. In Proceedings of the First IEEE/RAS-EMBS International Conference on Biomedical Robotics and Biomechatronics, Pisa, Italy, 20–22 February 2006; pp. 637–642. [Google Scholar]
- Hildebrandt, A.; Sawodny, O.; Neumann, R.; Hartmann, A. A cascaded tracking control concept for pneumatic muscle actuators. In Proceedings of the 2003 European Control Conference (ECC), Cambridge, UK, 1–4 September 2003; pp. 2517–2522. [Google Scholar]
- Hildebrandt, A.; Sawodny, O.; Neumann, R.; Hartmann, A. Cascaded control concept of a robot with two degrees of freedom driven by four artificial pneumatic muscle actuators. In Proceedings of the 2005 American Control Conference, Portland, OR, USA, 8–10 June 2005. [Google Scholar]
- Martens, M.; Passon, A.; Boblan, I. A sensor-less approach of a torque controller for pneumatic muscle actuator driven joints. In Proceedings of the 2017 3rd International Conference on Control, Automation and Robotics (ICCAR), Nagoya, Japan, 22–24 April 2017; pp. 477–482. [Google Scholar]
- Boblan, I. Modellbildung und Regelung Eines Fluidischen Muskelpaares. Ph.D. Thesis, Technical University of Berlin, Berlin, Germany, 2010. [Google Scholar]
- Tóthová, M.; Pitel, J. Simulation of actuator dynamics based on geometric model of pneumatic artificial muscle. In Proceedings of the 2013 IEEE 11th International Symposium on Intelligent Systems and Informatics (SISY), Subotica, Serbia, 26–28 September 2013; pp. 233–237. [Google Scholar]
- Schulte, H. The Characteristics of the McKibben Artificial Muscle. In The Application of External Power in Prosthetics and Orthotics; National Academy of Sciences—National Research Council: Washington, DC, USA, 1961. [Google Scholar]
- Chou, C.P.; Hannaford, B. Static and dynamic characteristics of McKibben pneumatic artificial muscles. In Proceedings of the 1994 IEEE International Conference on Robotics and Automation, San Diego, CA, USA, 8–13 May 1994; pp. 281–286. [Google Scholar]
- Sárosi, J.; Biro, I.; Nemeth, J.; Cveticanin, L. Dynamic modeling of a pneumatic muscle actuator with two-direction motion. Mech. Mach. Theory 2015, 85, 25–34. [Google Scholar] [CrossRef]
- Wickramatunge, K.C.; Leephakpreeda, T. Study on mechanical behaviors of pneumatic artificial muscle. Int. J. Eng. Sci. 2010, 48, 188–198. [Google Scholar] [CrossRef]
- Kelasidi, E.; Andrikopoulos, G.; Nikolakopoulos, G.; Manesis, S. A survey on pneumatic muscle actuators modeling. In Proceedings of the 2011 IEEE International Symposium on Industrial Electronics, Subotica, Serbia, 8–10 September 2011; pp. 1263–1269. [Google Scholar]
- Tsagarakis, N.; Caldwell, D.G. Improved modelling and assessment of pneumatic muscle actuators. In Proceedings of the 2000 ICRA IEEE International Conference on Robotics and Automation, San Francisco, CA, USA, 24–28 April 2000. [Google Scholar]
Figure 1.
Different Festo pneumatic muscle actuators (PMAs). The depicted connector form is called DMSP. See the data sheet [5] for further information.
Figure 1.
Different Festo pneumatic muscle actuators (PMAs). The depicted connector form is called DMSP. See the data sheet [5] for further information.
Figure 2.
Measured static force map of a Festo DMSP-10-250 with an initial length of and an initial inner diameter of .
Figure 2.
Measured static force map of a Festo DMSP-10-250 with an initial length of and an initial inner diameter of .
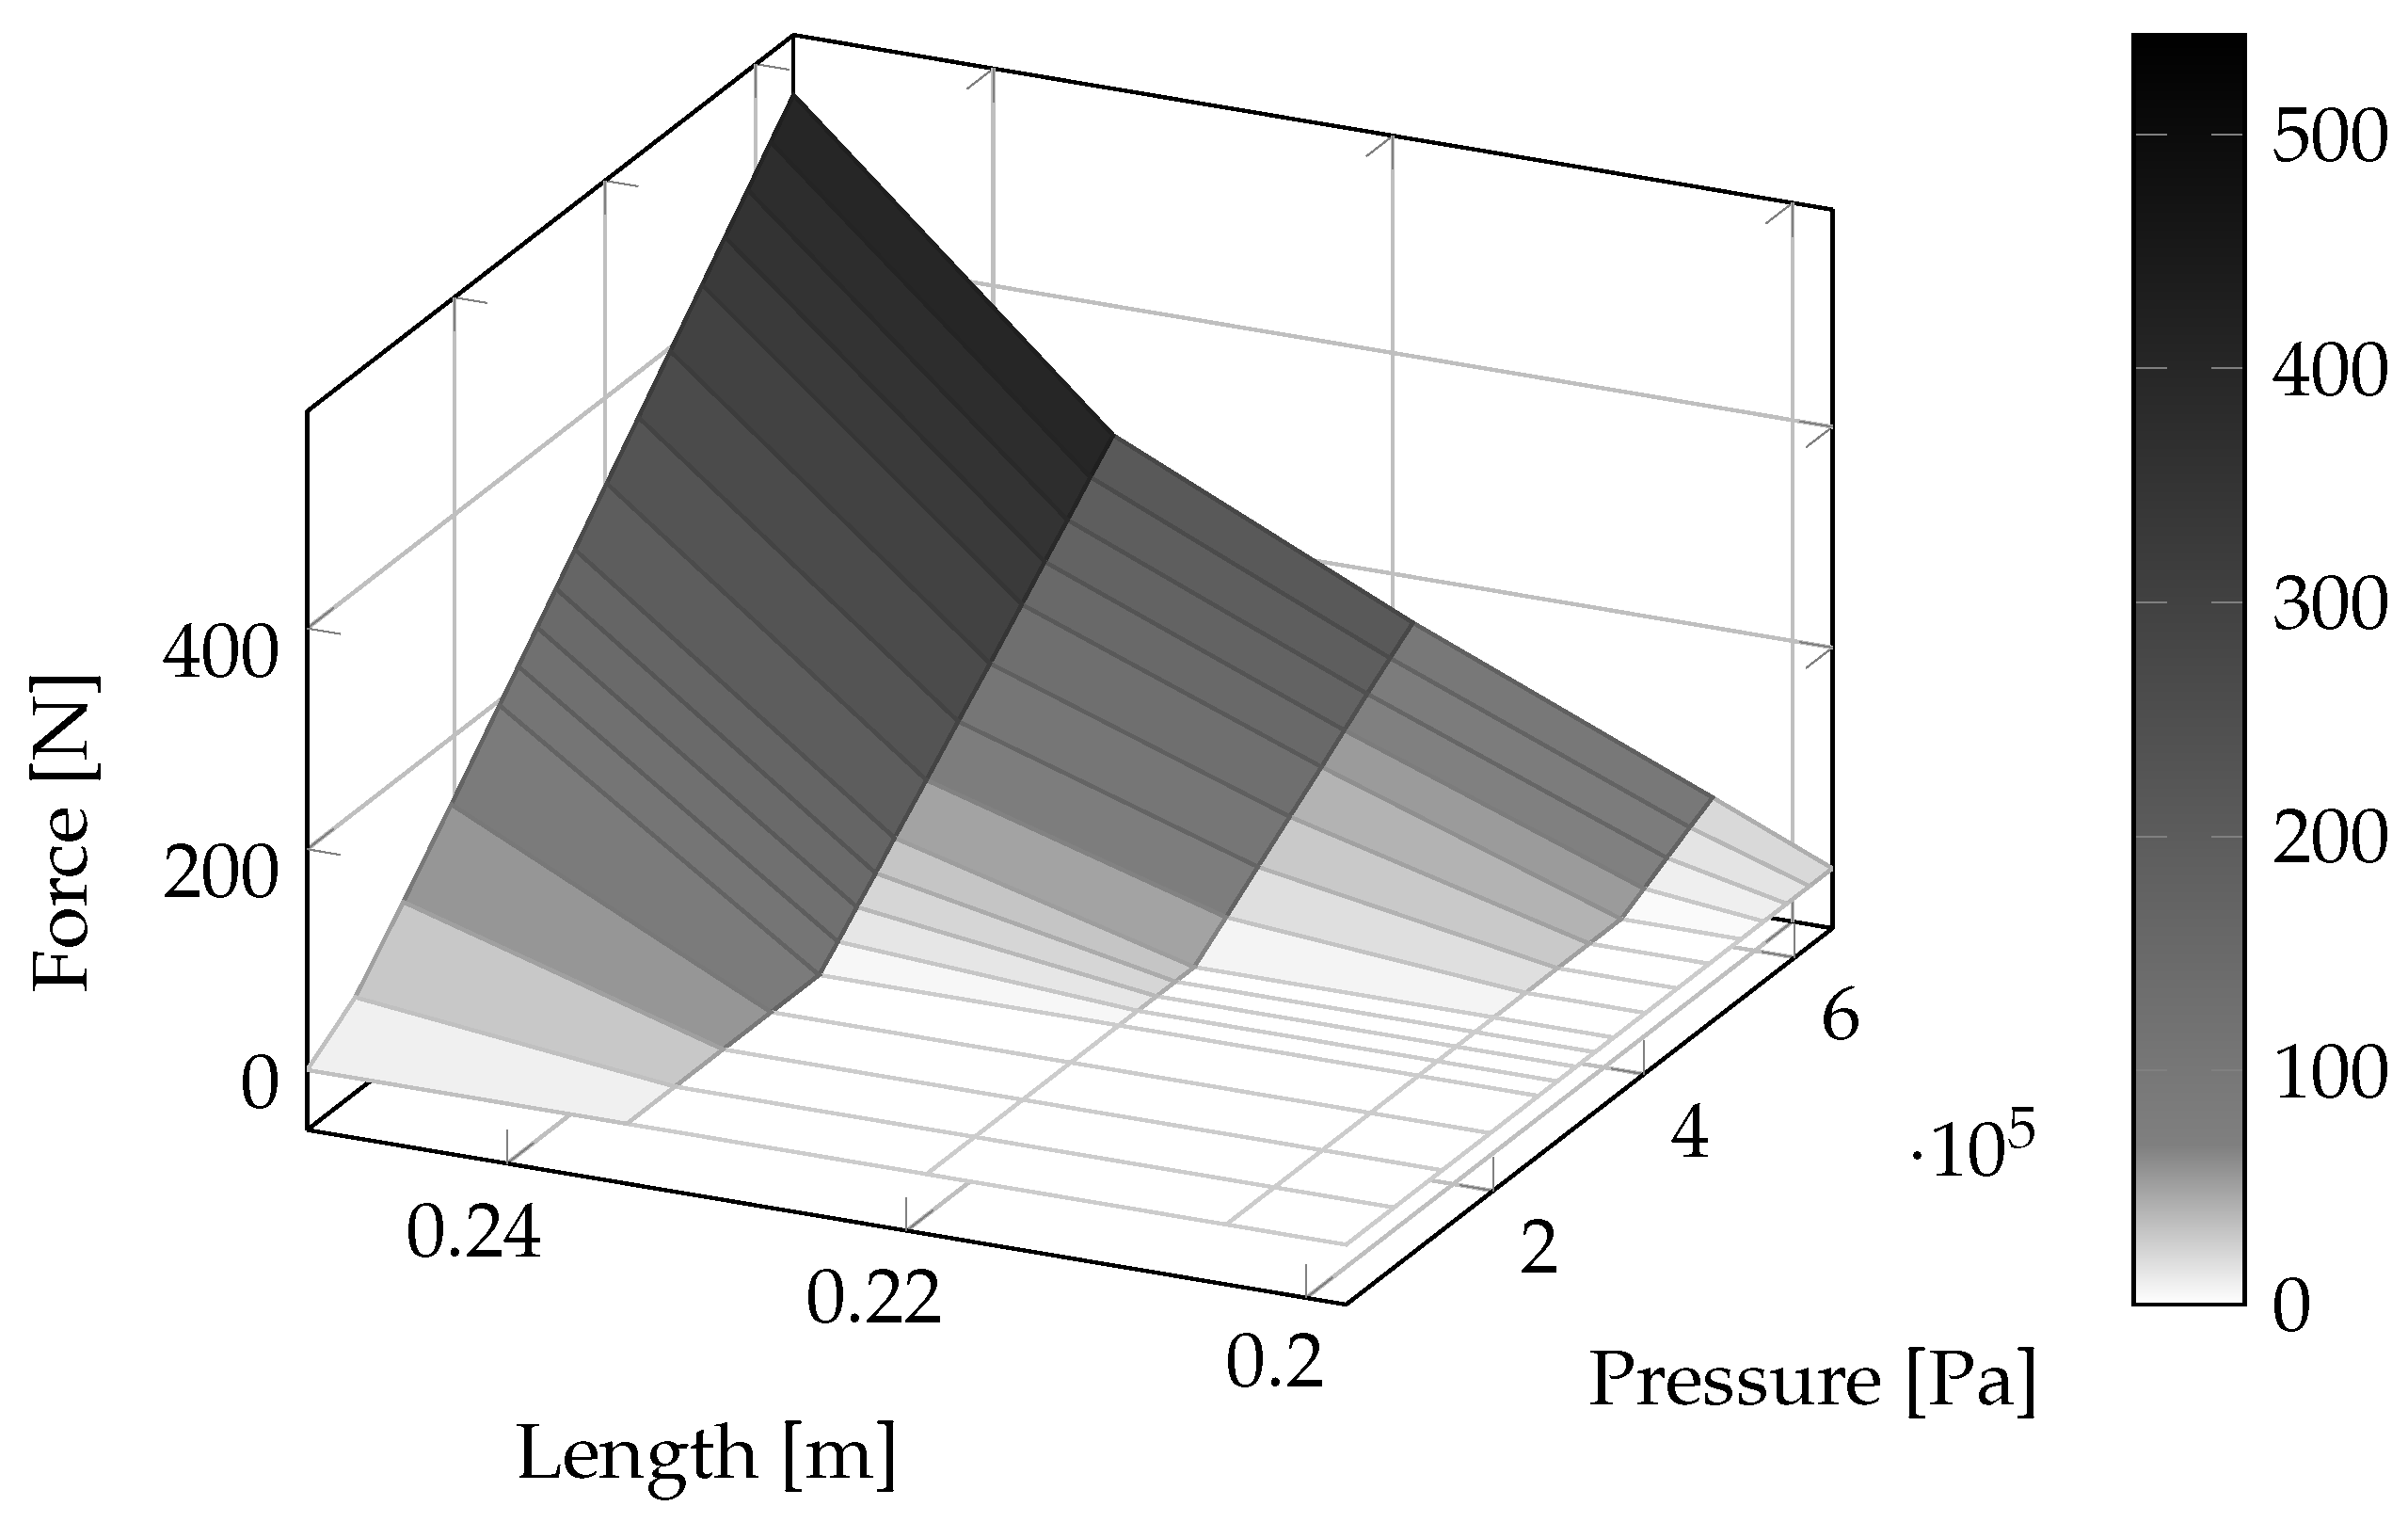
Figure 3.
Unreeled membrane of PMA.

Figure 4.
Schematic of the PMA membrane and the fiber angle.

Figure 5.
Photo of the test rig that the characteristic force maps have been measured with.

Table 1.
Start points of parameter estimation for all models without units.
| - | - | - | - | - | - | - | |||
| 1 | 1 | - | - | - | - | - | |||
| - | 1 | 1 | 1 | 1 | 1 | ||||
| 1 | 1 | - | 1 | - | - | ||||
| 0 | - | - | - | - |
Table 2.
Estimated parameters for ; optimization start point is given in Table 1.
Table 2.
Estimated parameters for ; optimization start point is given in Table 1.
| DMSP-10-250 | |||||
| DMSP-20-300 |
Table 3.
Force error of each model by percentage.
| of | ||||||
|---|---|---|---|---|---|---|
| DMSP-10-250 | 46.1% | 20.05% | 13.49% | 10.12% | 5.1% | 4.4% |
| DMSP-20-300 | 30% | 13.04% | 8.2% | 5.75% | 3.59% | 2.35% |
© 2017 by the authors. Licensee MDPI, Basel, Switzerland. This article is an open access article distributed under the terms and conditions of the Creative Commons Attribution (CC BY) license (http://creativecommons.org/licenses/by/4.0/).
Share and Cite
MDPI and ACS Style
Martens, M.; Boblan, I. Modeling the Static Force of a Festo Pneumatic Muscle Actuator: A New Approach and a Comparison to Existing Models. Actuators 2017, 6, 33. https://doi.org/10.3390/act6040033
AMA Style
Martens M, Boblan I. Modeling the Static Force of a Festo Pneumatic Muscle Actuator: A New Approach and a Comparison to Existing Models. Actuators. 2017; 6(4):33. https://doi.org/10.3390/act6040033
Chicago/Turabian StyleMartens, Mirco, and Ivo Boblan. 2017. "Modeling the Static Force of a Festo Pneumatic Muscle Actuator: A New Approach and a Comparison to Existing Models" Actuators 6, no. 4: 33. https://doi.org/10.3390/act6040033
Note that from the first issue of 2016, this journal uses article numbers instead of page numbers. See further details here.