A Calibrated Lumped Element Model for the Prediction of PSJ Actuator Efficiency Performance


Department of Industrial Engineering, Aerospace Sector, Universitá degli Studi di Napoli “Federico II”, p.le Tecchio 80, 80125 Naples, Italy
*
Author to whom correspondence should be addressed.
Actuators 2018, 7(1), 10; https://doi.org/10.3390/act7010010
Submission received: 16 February 2018
/
Revised: 8 March 2018
/
Accepted: 16 March 2018
/
Published: 16 March 2018
(This article belongs to the Special Issue Physical Modelling and Estimator-Based Control as Basis of Energy-Efficient Actuators)
Abstract
:Among the various active flow control techniques, Plasma Synthetic Jet (PSJ) actuators, or Sparkjets, represent a very promising technology, especially because of their high velocities and short response times. A practical tool, employed for design and manufacturing purposes, consists of the definition of a low-order model, lumped element model (LEM), which is able to predict the dynamic response of the actuator in a relatively quick way and with reasonable fidelity and accuracy. After a brief description of an innovative lumped model, this work faces the experimental investigation of a home-designed and manufactured PSJ actuator, for different frequencies and energy discharges. Particular attention has been taken in the power supply system design. A specific home-made Pitot tube has allowed the detection of velocity profiles along the jet radial direction, for various energy discharges, as well as the tuning of the lumped model with experimental data, where the total device efficiency has been assumed as a fitting parameter. The best fitting value not only contains information on the actual device efficiency, but includes some modeling and experimental uncertainties, related also to the used measurement technique.
1. Introduction
Plasma Synthetic Jet (PSJ) actuators, or Sparkjets, are able to produce very high jet velocities, without the aid of any moving parts, affecting the structure of the flow-field to be controlled and allowing a positive variation of the aerodynamic forces on an aircraft. A plasma synthetic jet actuator is a device developed at the beginning of the century [1], which soon has become the object of study of several research groups [2,3]. It is mainly composed of 2 or 3 electrodes embedded in a small cavity linked to the external environment through an orifice. The operating cycle begins with an electrical discharge between the electrodes, which increases sharply pressure and temperature inside the cavity. The high-pressure air exhausts through the orifice, converting the increased internal energy into kinetic one. In the end, fresh air is drawn back inside the cavity, refilling the device for the next pulse. After a limited number of cycles the device reaches a periodic behavior, generating a synthetic jet.
In the last few years the interest of the scientific community on this topic has grown considerably, producing several numerical and experimental contributions. Being a very recent technology, many works were focused on the device response [4,5,6], varying the operating and the geometric conditions, with few works on the interaction with a boundary layer [7] or in cross-flow conditions [8]. At the same time, different numerical simulations [9,10] and physical models [11,12,13] have been developed to predict the behavior of the device and to investigate its main characteristics.
Following the research line of the lumped models [14], which are very useful for design and manufacturing practical purposes, a novel physical model, able to predict the time variation of all thermodynamic quantities in the cavity as well as the jet velocity at the orifice, was reported in [15]. This work aims at presenting an experimental investigation of a home-designed and manufactured PSJ actuator, composed of two parts in Macor and two tungsten electrodes, with major details on the power supply system and the tuning procedure of the lumped model for the prediction of PSJ actuator efficiency performance based on the total pressure measurements.
2. Physical Model
The PSJ device is modeled as a cylindrical geometry cavity, with an internal volume , and a nozzle (or orifice) of length l and diameter d. The governing equations are based on two main assumptions. First, the model is lumped, namely thermodynamic and transport properties are averaged in the whole cavity volume. Furthermore, to consider the real gas effects, produced by the high temperatures reached within the cavity, the air is considered at local thermodynamic equilibrium [16].
2.1. Energy Deposition
The energy deposition is a very complex process which involves different stages, each characterized by its own efficiency, due to various electrical and physical effects that reduce the amount of energy transferred to the fluid in each discharge [5,13]. Within the present model, a total efficiency, considering the losses linked to parasitic resistances and inductances and the non-uniform heating effects of the arc discharge, has been introduced, with typical values of .
When the discharge time is very short, s, the energy deposition process can be considered instantaneous because the spark discharge occurs in only a few s, providing an amount of energy of some mJ [17]. Usually this occurs for a capacitor-based supply system, in which the discharge time is governed by the electrical characteristics of the capacitors within the circuit. In these conditions, the energy deposition takes place in such a short time that the heating process can be modeled as a constant specific volume process.
In these conditions, at the end of the energy deposition process, the state variables can be easily computed with the following equations system, considering the time instants i (before the arc formation process) and (after the spark).
in which , T and p are air density, temperature and pressure, respectively; is the air gas constant and it is temperature dependent because it includes compressibility effects, i.e., , with being the air gas constant at standard conditions. The subscript c refers to all the quantities computed within the cavity; whereas the subscript e to those evaluated at the nozzle exit. is total amount of energy provided by the power supply system; is the effective amount of energy supplied to the fluid, is the air mass and the constant volume specific heat.
2.2. Discharge and Refresh Phases
Once the energy discharge has occurred, high-pressure fluid exhausts through the orifice, converting its increased internal energy into the kinetic one. This phase can be simulated as the discharge process of a reservoir connected to the external ambient by means of a relatively short nozzle, or orifice. The application of the mass conservation law to the system composed of the reservoir and the nozzle leads to the following relationship:
with U indicating the exit velocity, the orifice area, t the time.
The energy equation inside the whole cavity volume has to be enforced too:
where u and h are internal energy and thermodynamic enthalpy, respectively, and is the total amount of heat power exchanged through the entire surface of the system, as will be discussed in Section 2.2.1.
It is worth noting that Equation (3) is valid for s; however, when the discharge time is significantly longer, the energy deposition can not be considered a constant volume process anymore, because the ejection and the heating processes occur simultaneously. In this case, the energy deposition does not need to be modeled as an independent process, but it should be treated as a jet stage with both heat input (arc energy discharge) and output (heat losses through the actuator walls) terms [13]. By combining Equations (1) and (3), it is possible to obtain:
The application of the compressible unsteady Bernoulli’s equation, between a point inside the cavity (where the flow velocity is practically null) and the exit section of the nozzle, yields a third equation for these phases:
where K is the head loss coefficient, including entrance/exit losses at exit orifice; is the modified effective length, representing the distance between the two points of application of Bernoulli’s equation. The choice of the values for the head loss coefficient and the effective length has been treated in various previous papers. For piezo-driven synthetic jets, usually these terms have been determined by making a best fitting between numerical and experimental data or by using some empirical expressions [18,19]. Due to the lack of literature works on this topic for PSJ actuators, the previous quantities have been considered as fitting parameters and their values have been determined by matching the results of the lumped model with numerical simulations made with OpenFOAM code and reported in Section 2.3.
Another convenient equation for the flow along the nozzle is the classic isentropic relationship linking the thermodynamic properties inside the cavity to those at the orifice exit:
with being the specific heats ratio, which in the present case of real gas is considered as a function of the temperature.
The exit flow condition, namely choked or unchoked flow, selects the equation required to close the problem. The establishment of a condition or the other one depends on the critical ratio of the cavity pressure to the exit pressure, i.e.,
where is the mean value between the two states (i.e., cavity and exit section) involved. If the pressure ratio, after the energy deposition, is greater than or equals that computed with Equation (7), the flow is choked, otherwise an unchoked regime is assumed.
For choked flow, the nozzle exit condition is that the exit Mach number is sonic:
On the other hand, if the flow is unchoked, the Kutta condition is imposed:
where denotes the external ambient pressure.
All the governing equations, written for both the choked and the unchoked case, can be found in the Appendix.
2.2.1. Heat Transfer
The total heat power , included in the cavity energy balance (Equations (3) and (4)), is considered as the sum of two terms: the first due to the external natural convection mechanism, while the second due to the radiative heat transfer.
where and are the exchange surface and the relevant surface of emission, respectively, is the convective heat transfer coefficient (equal to 50 WmK [11]), is the external ambient temperature, is the emissivity coefficient (in the case of ceramic material it is equal to about ) and is the Stefan-Boltzmann constant. Note that here the cavity wall is supposed to constitute a vanishing thermal resistance, which is validated by the occurrence of a very small Biot number.
2.3. CFD Simulations
As mentioned in the previous section, the head loss coefficient, K, and the effective orifice length, , have been considered as fitting parameters and their values have been determined by matching the results of the lumped model with detailed multidimensional CFD simulations obtained with OpenFOAM computer code. The amount of energy supplied to the fluid for each cycle is mJ; the grid developed for the computations is fully structured with 46040 cells; it consists of a wedge shaped thin slice, with a opening angle, having the longitudinal sharp edge on the symmetry axis. The computational domain is long and wide in radial direction. Further numerical details, including the boundary conditions and the definition of transport properties, can be found in [15].
As done by de Luca et al. [18], the effective orifice length has been evaluated as: , setting and , making a best fit with the CFD numerical results. Note that for these simulations, the energy deposition has been assumed instantaneous.
The previous calibration process allows one to determine the actuator response (thermodynamic quantities whitin the cavity as well as the jet velocity exit) once defined the device geometrical characteristics and the discharge properties (power and discharge time). A comparison with experimental data requires, in addition, the knowledge of the effective amount of energy supplied to the fluid in each discharge, which is strictly related to its efficiency. The efficiency value is eventually determined with a best-fit (tuning) procedure as described in Section 3.3.
2.4. LEM Analysis
The present LEM model, validated in [20], has allowed the investigation of both single pulse mode and repetitive working regimes, providing insights on the major actuation characteristics. An interesting result lies in the finding that the device seems to behave like a Helmholtz resonator, that justifies the presence of high frequency oscillations observed in the time interval between two subsequent discharge pulses [15]. This occurrence has been already detected during the operation of piezo-driven synthetic jet actuators [18]. The Helmholtz natural frequency evaluated by the lumped-element modeling, which is a function of the operating conditions because it depends on thermodynamics variables, agrees very closely with analytical predictions. This constitutes an additional theoretical validation of the lumped model.
3. Experimental Measurements
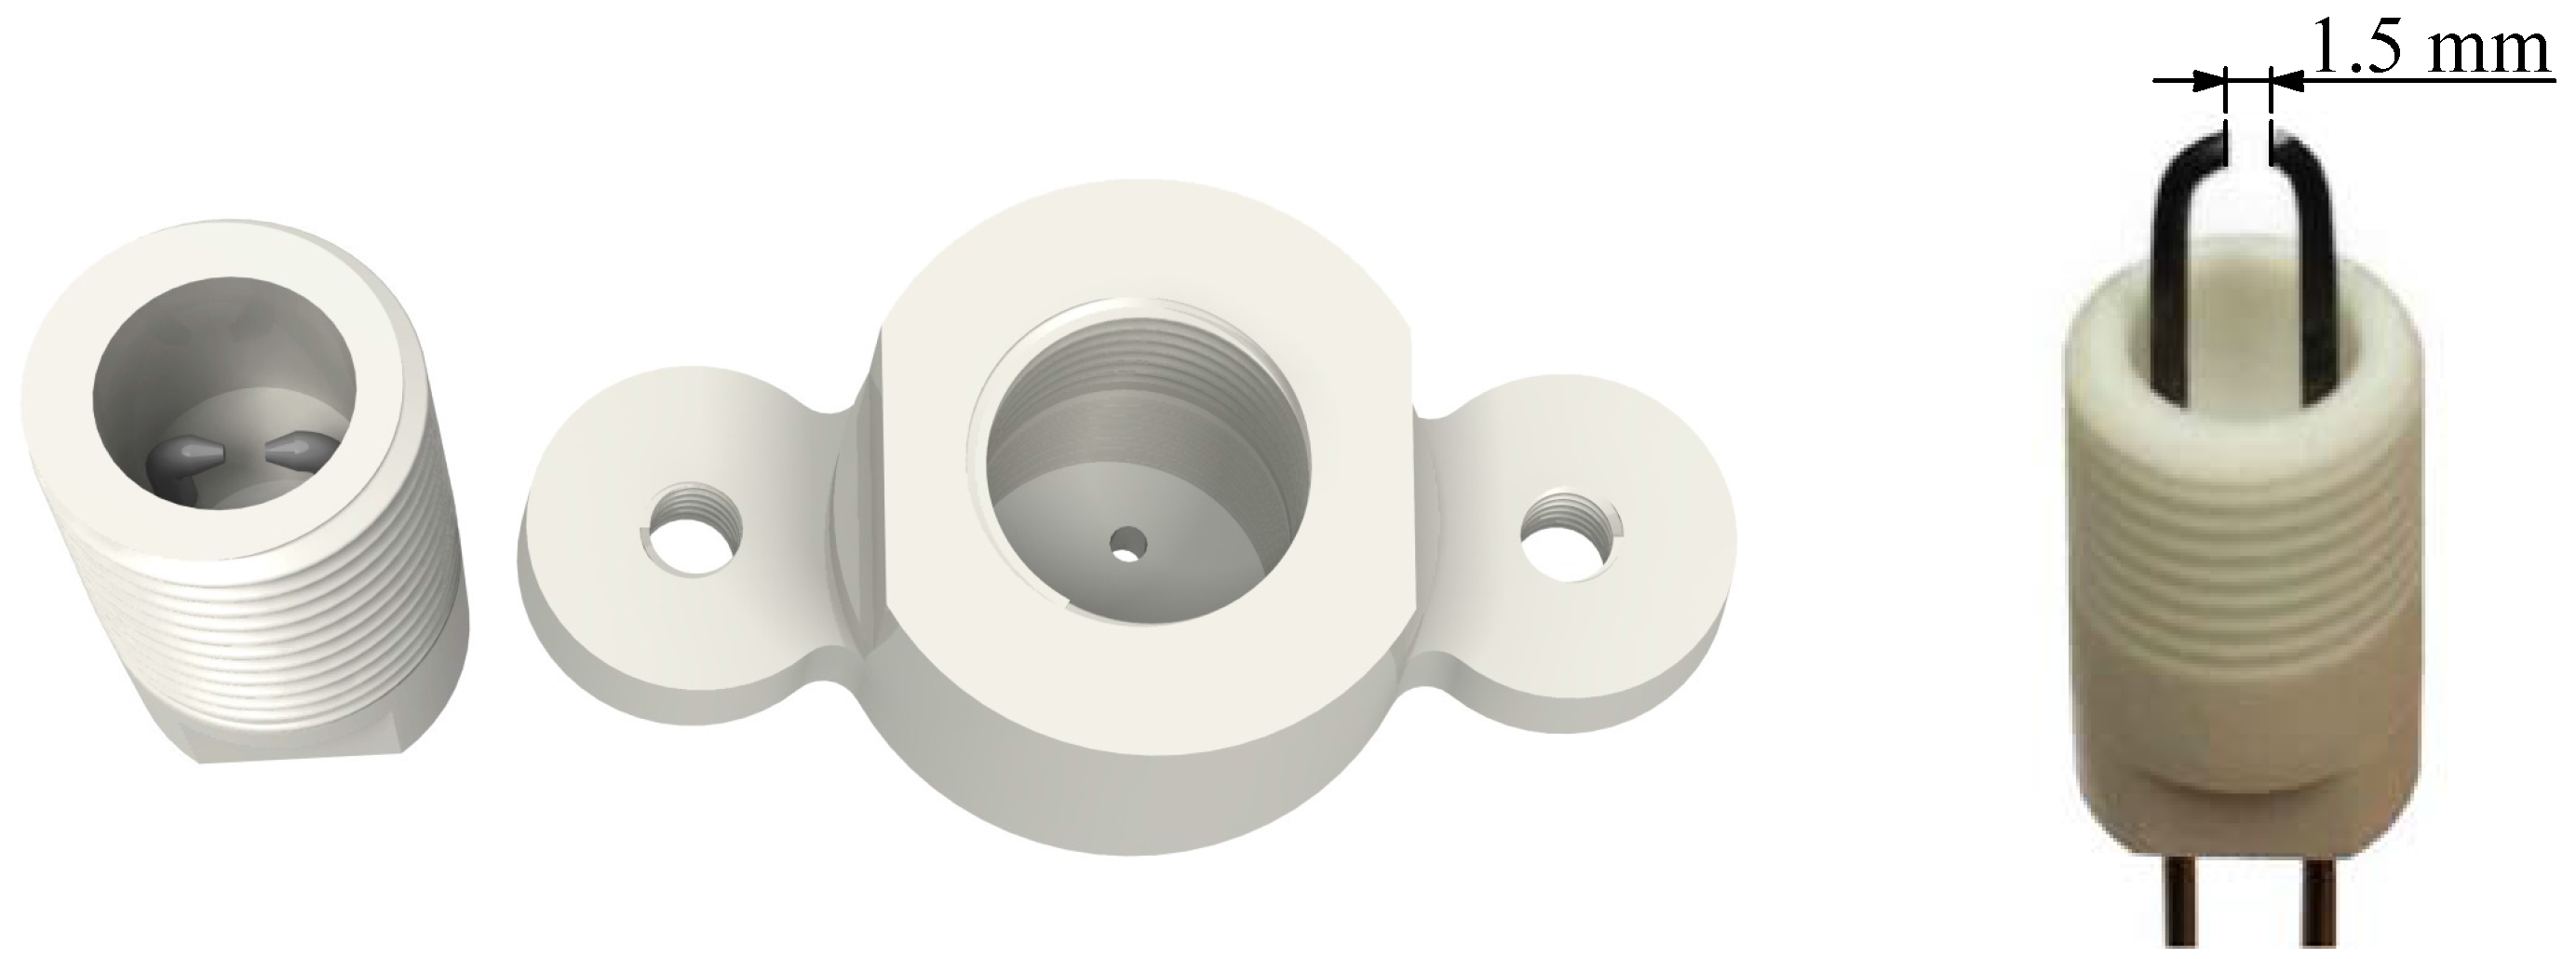
The actuator is mainly composed of a two-part case built in MACOR, with two tungsten electrodes and a dedicated power supply system. The coupling between the case parts is guaranteed by a gas-tight tread. The actuator cavity has a cylindrical geometry (6 mm in diameter and 6 mm high) with an orifice of 1 mm in diameter and 2 mm in length. The electrodes, with a diameter of 1 mm and placed at a distance of mm, are located in the bottom part via through holes and blocked with a non-conductive bond, making a replacement extremely easy. Figure 1 presents a CAD reconstruction of the actuator, with a detail about the electrodes location.
3.1. Power Supply System
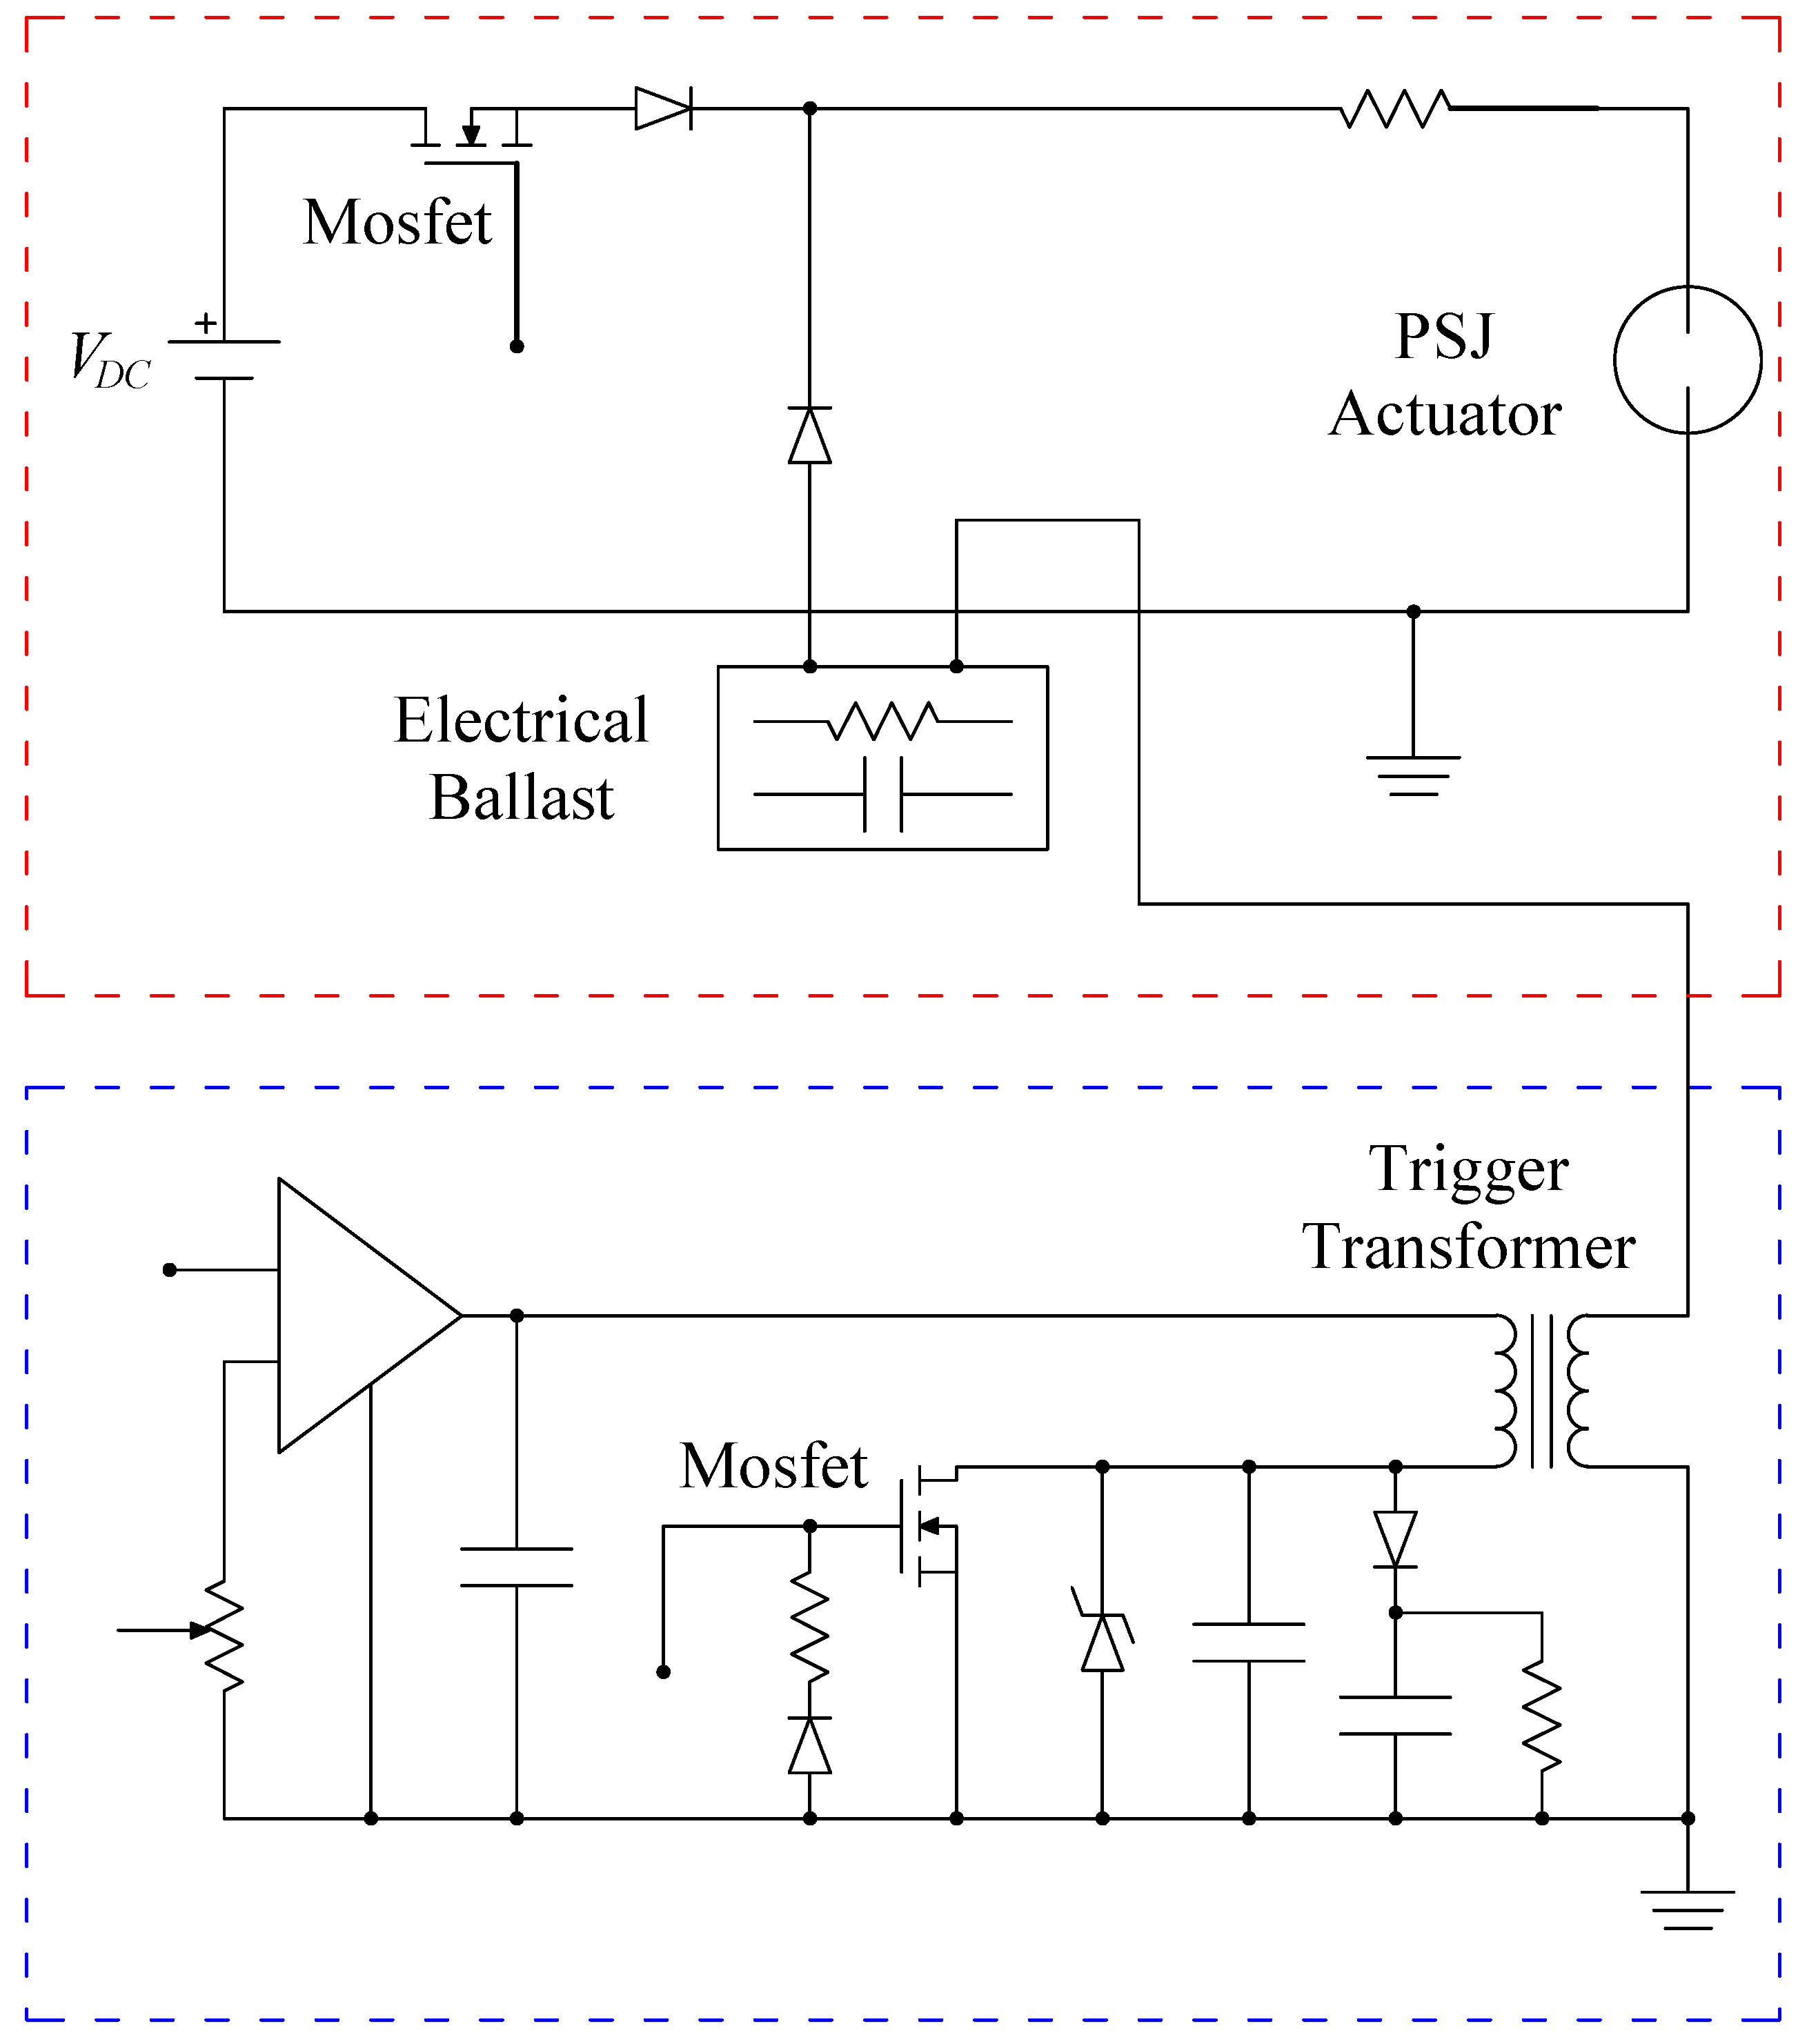
The power supply system makes use of a trigger transformer, in the so-called pseudo-series mode [5], to trigger the spark discharge. It is mainly constituted of a high-voltage trigger device and an external supply system (sustain device), which provides electrical power to the first one, as depicted in Figure 2.
The working principles of both circuits will be hereafter described [13]:
- The trigger circuit is mainly composed of an internal DC power supply, a flyback circuit and a trigger transformer. The DC power supply provides a 24 V adjustable voltage, which, through the flyback converter, is lead to values of V. When switched on, the capacitors inside the circuit begin to discharge across the trigger transformer (with a ratio of ) that quickly (in a few s) raises the voltage between the electrodes. If the peak trigger voltage is higher than the air breakdown voltage between the electrodes a trigger spark is formed.
- The sustain circuit is represented by an external DC power supply (TDK-Lambda Gen-600), whose discharge time is controlled by a Mosfet transistor, a mixer and an electrical ballast. The power supply can provide a voltage up to 600 V, which by itself it is not able to produce a spark between the electrodes. The mixer has the role to combine the electrical outputs of the trigger and the sustain circuits; while the electrical ballast provides a protection to the system.
The operating cycle starts with a high-voltage trigger pulse to produce a channel between the electrodes, that reduces the breakdown voltage below the electrodes voltage provided by the sustain circuit; thus, when the Mosfet is turned on, an electrical arc is formed inside the cavity. The purpose of the trigger spark is to momentarily reduce the local breakdown voltage between the anode and the cathode and to define the actuation frequency; the amount of energy provided to the fluid in each cycle can be controlled with the external power supply, by varying the sustain voltage, or through the Mosfet transistor, by changing the duration of the discharge. Moreover, a further control of the discharge current is provided by a variable resistor (10–100 ), located beyond the mixer.
The electrical supply system allows the variation of the trigger voltage in a range from to 12 kV, the choice of the actuation frequency from 1 up to 1000 Hz and the selection of the Mosfet operating duty cycle (namely the sustain discharge duration) from 0 to .
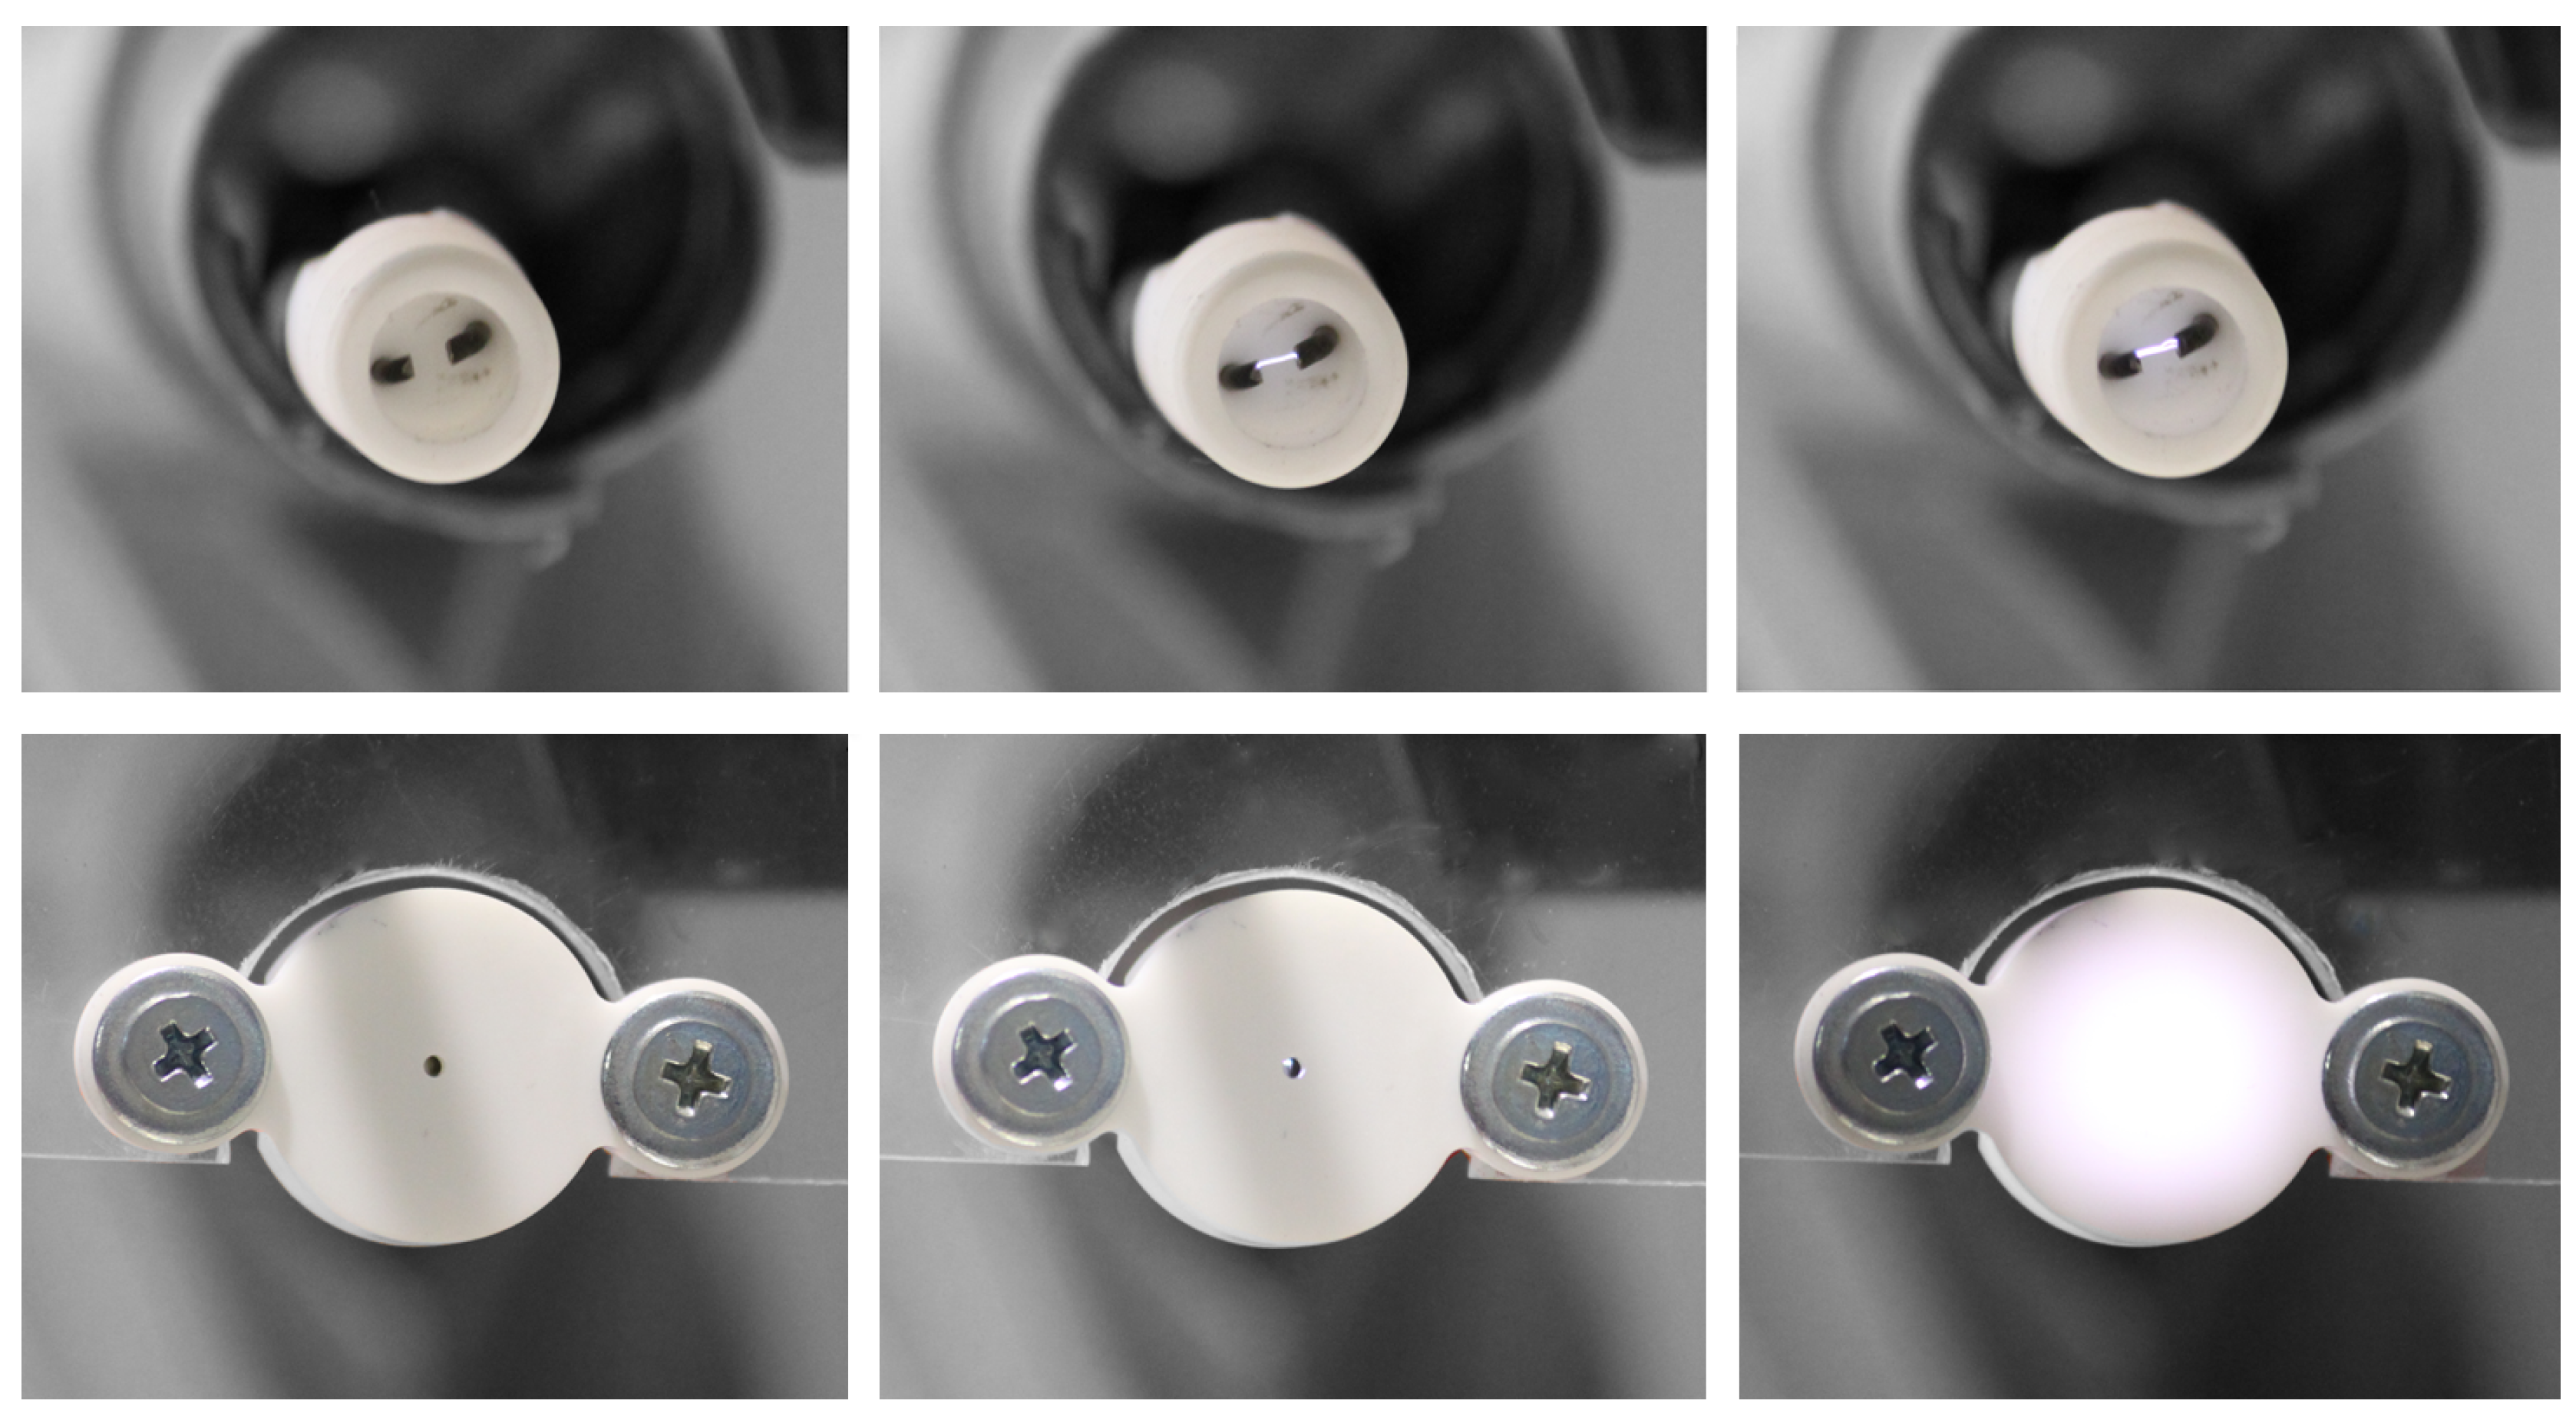
During the experimental campaign, the PSJ actuator has been mounted on a dedicated structure, equipped with two cross tables to align all the elements. Figure 3 presents a very interesting comparison of the device operating electrical phases. The pictures of the first row report only the actuator bottom part; the pictures of the second one, instead, show the whole device. Starting from the left, it is possible to examine the device in the turned off condition, then during the trigger mode and, finally, during the operating regime. Note that when the top part is removed both electrical arcs are clearly visible, with the sustain one being much more intense. In some cases it is possible to note a bifurcation of the electrical arc discharges during its working mode. Considering the complete device, the high-voltage trigger discharges are barely appreciable and, due to their short duration, the energy supplied to the fluid is negligible; on the other hand, in operating conditions the energy discharges are clearly visible leading to the PSJ formation.
3.2. Total Pressure Measurements
The PSJ total pressure has been measured with a home-made Pitot tube placed 1 diameter downstream of the nozzle exit, Figure 4, with a mm external and a mm internal diameter, connected with a Mouser sensor pressure transducer (Mouser, Mansfield, TX, USA) (range: in , accuracy: ), whose output signal has been acquired with a data-acquisition system (USB Instruments DS1M12 or “Stingray”). The time-averaged total pressure is computed by averaging the signal acquired for 10 s, assuming the transducer reference pressure equal to the ambient one.
In this experimental campaign the actuator has been tested for relatively small energy depositions, hence the classic Bernoulli equation at the orifice exit can be assumed to be valid. The measure of the actuator external temperature with a FLIR SC6000 Series Infrared Camera (Flir, Wilsonville, OR, USA) has allowed a good estimation of the actual air density, and eventually of the jet velocity, with a uncertainty estimation of about , computed with the standard procedures of literature. The IR camera was accurately calibrated with a blackbody for the whole measurement range; the noise equivalent temperature level of the camera is about 20 mK, and the rms error from the blackbody calibration is less than K.
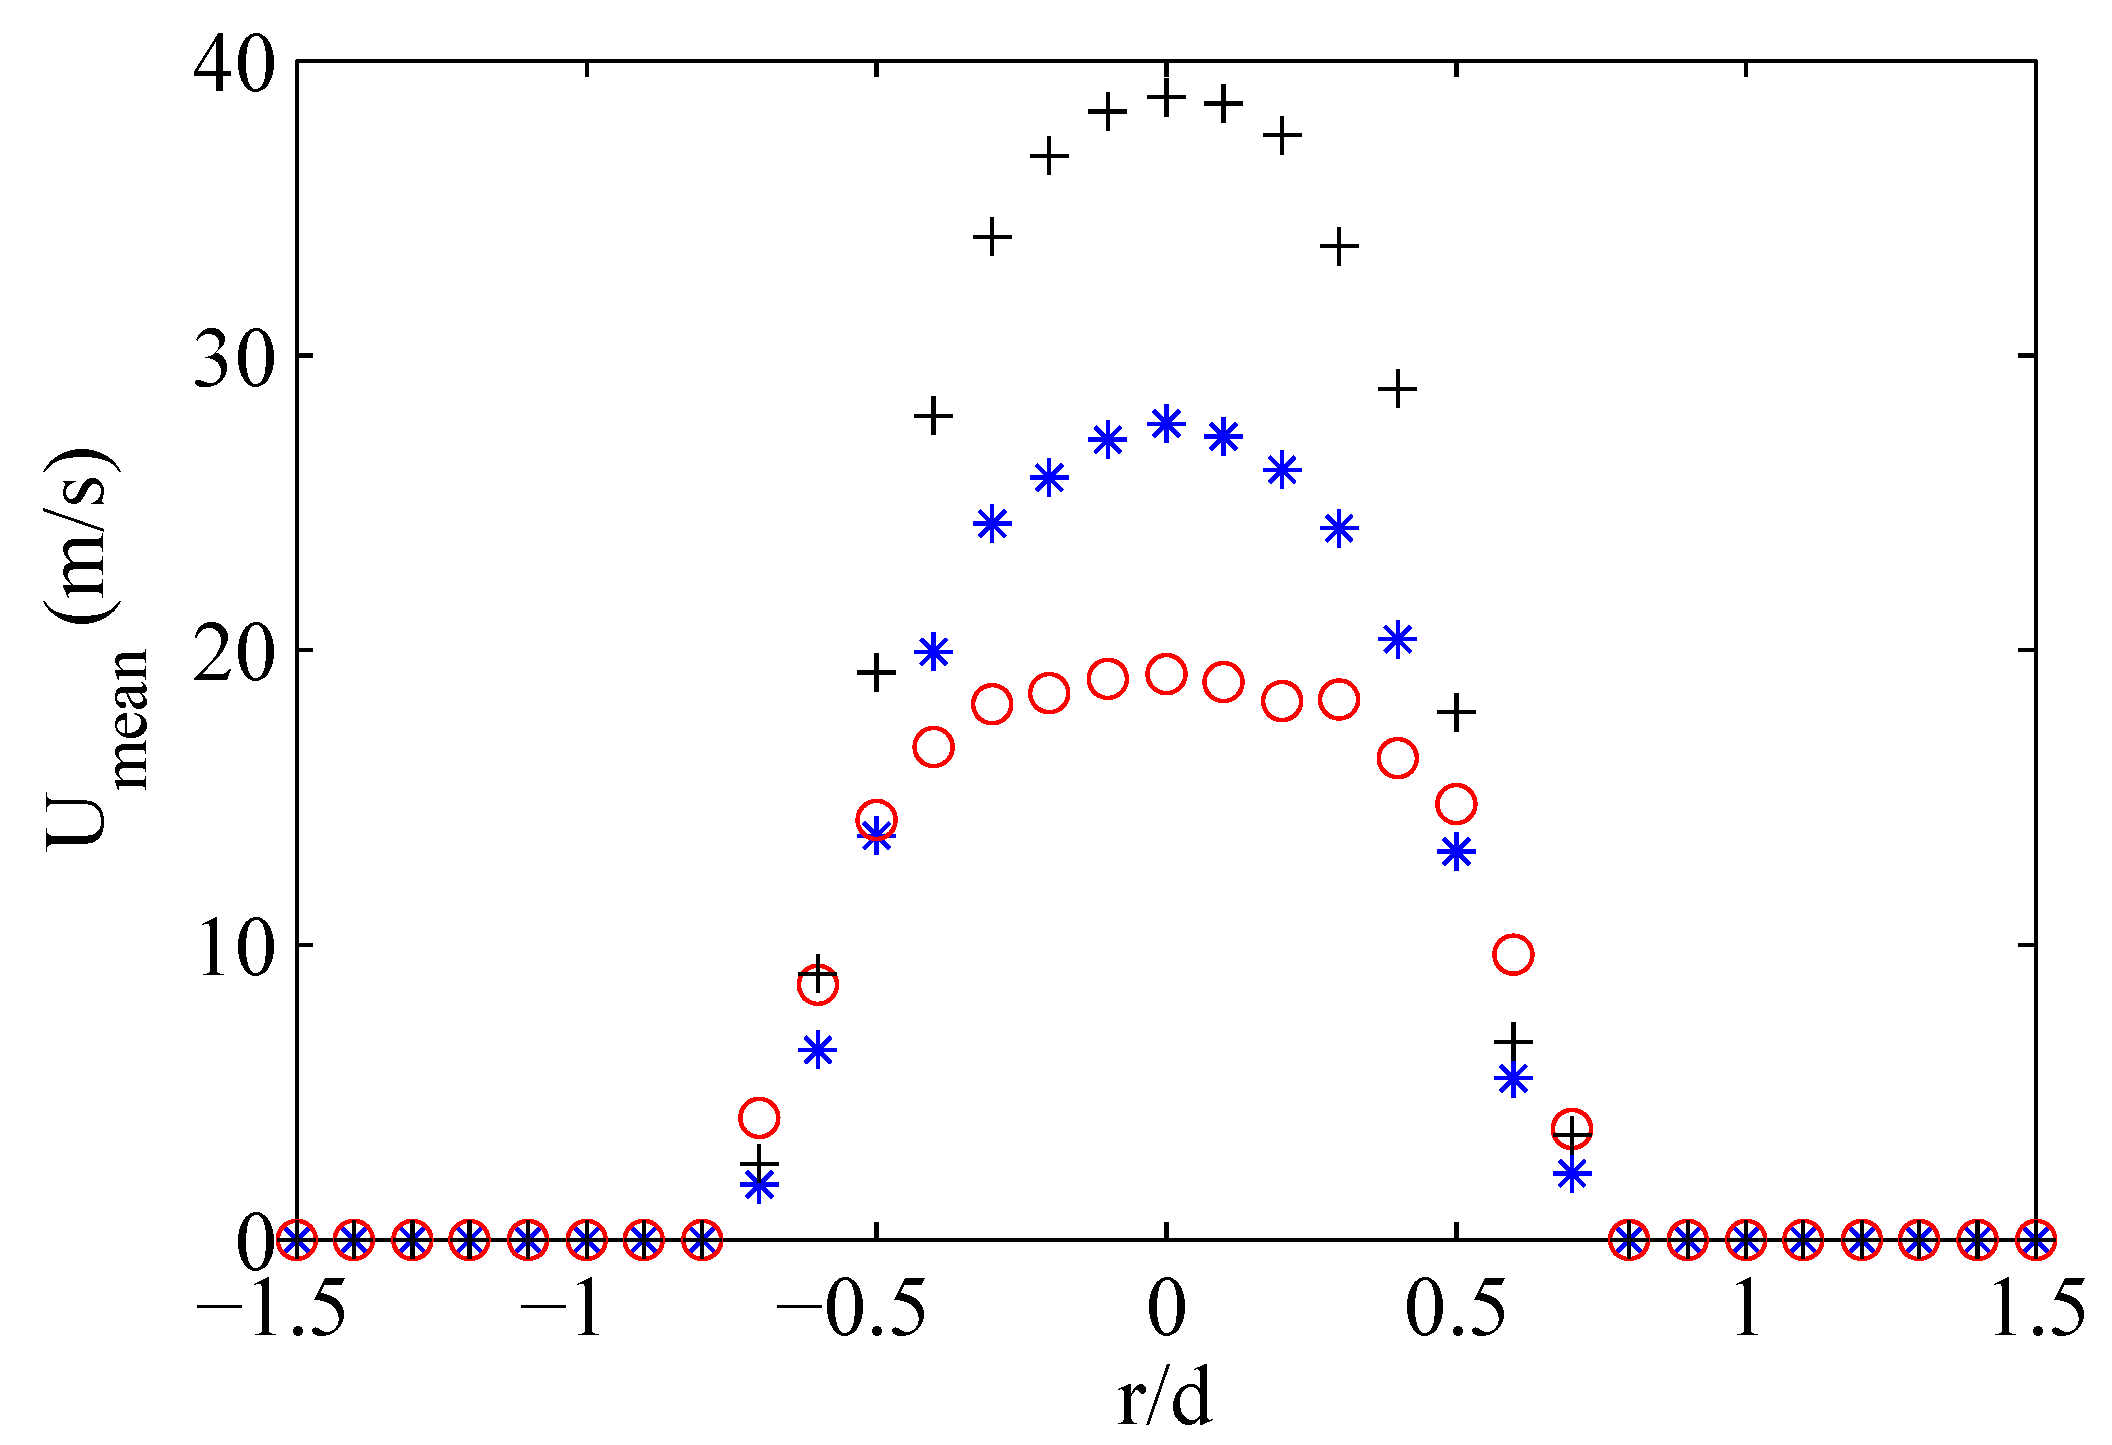
Typical jet (mean) velocity profiles in the radial direction are reported in Figure 5; the measurements have been acquired with a fixed frequency of 500 Hz, a duty cycle of , and three values of discharge energy, . As for piezo-driven synthetic jets, the PSJ device typically exhibits bell-shaped velocity profiles, whose shape around the symmetry axis can be related to the Stokes number defined as , being f the actuation circular frequency, d the orifice diameter and the air kinematic viscosity. As a measure of the ratio between the unsteady forces and the viscous forces, a higher Stokes number results in a thinner boundary layer along the orifice wall and therefore in a top-hat shaped inner velocity profile ( mJ, case) [21]. Hence, a higher energy discharge produces an increase in the kinematic viscosity, which in turn leads to a lower Stokes number with the resulting change from top-hat to near-parabolic shaped velocity profile ( mJ, case). Note that the velocity profiles appear larger than the orifice diameter, this effect being due both to the natural spreading of the jet and the use of the Pitot tube with a relative large diameter as compared to the orifice one. In fact, since the Pitot tube intrinsically provides an average spatial velocity, close to the shear layer at nozzle exit, the high velocity gradients appear reduced. This effect occurs for all the Stokes numbers here considered. Moreover, for the parabolic shaped profile (lowest S), an underestimation of the peak velocity is expected (up to 6% error); whereas no maximum velocity reduction is expected for the top-hat profile (highest S). On the other hand, as will be discussed in next section about the model tuning, one can take advantage from the intrinsic averaging property of the Pitot tube, by assuming, to within an acceptable engineering approximation, that the Pitot reading can be directly compared with the jet velocity LEM output. In the range of deposited energy values of the present test conditions, the jet peak velocity seems to increase almost linearly. For these cases the temperatures measured with the infrared camera are in the range from 85 to 165 C. In the case of MACOR (ceramic material) the emissivity coefficient has been considered equal to .
3.3. Tuning of the Lumped Model
Once the total pressure and velocity measurements have been acquired, the lumped model has been tuned with the experimental results: the basic idea was to carry out a best-fit between the experimental data and the LEM computations of the time-averaged total pressure and velocity, assuming the total efficiency of the device as the fitting parameter. LEM simulations were conducted for 80 actuation cycles (usually the device reaches a periodic behavior after 20/25 cycles); a mean total pressure value was computed at the last cycle of the simulation considering the ejection phase only [12]. These total pressure values were compared with the Pitot tube data. In the end, the best fitting procedure has yielded the value of . Note that this fitting parameter not only contains information on the actual device efficiency, but includes some modeling and experimental uncertainties, related also to the used measurement technique.
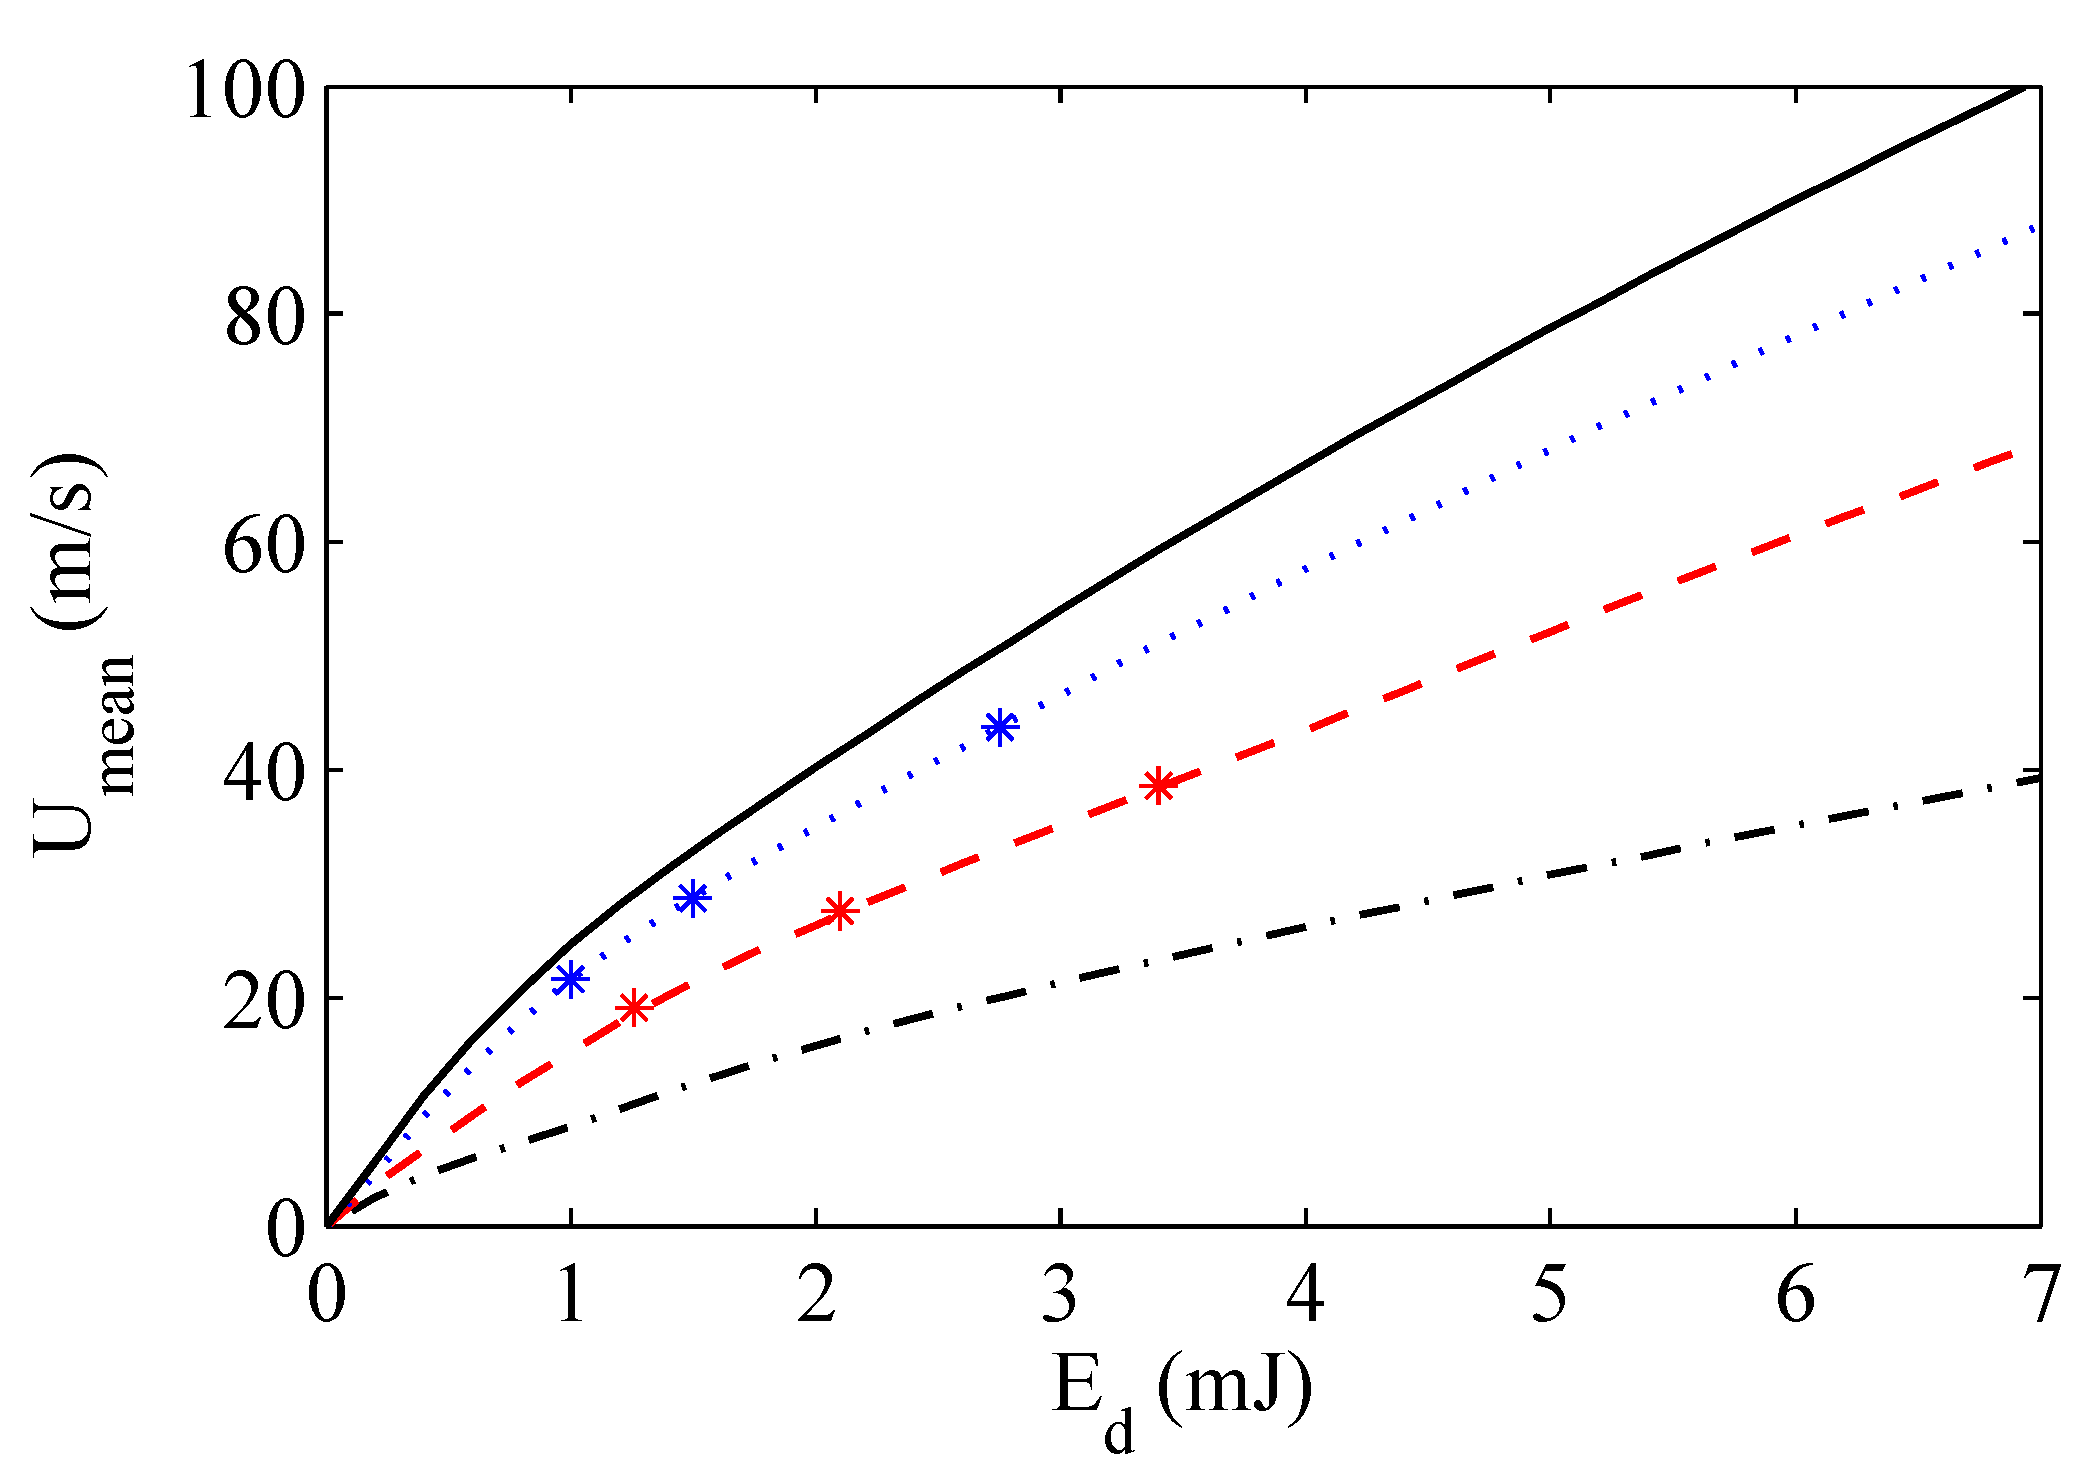
Figure 6 presents a comparison between numerical jet mean velocity, obtained using the total pressure data, and the experimental measurements acquired at the centerline of the jet. It should be noted that the jet velocity has been experimentally evaluated 1 diameter away from the nozzle exit, where the velocity peak should be approximately located. Since no special investigation has been made to confirm in depth this occurrence, one has to handle with caution the efficiency evaluation, namely one can assume that this is a conventional estimation. The LEM model seems to be able to predict, with a good accuracy, the jet mean velocity as a function of actuation frequency and discharged energy. In addition, it is worth noting that, except for very low discharged energy values, the variation with the energy is almost linear; it is also evident that increasing in actuation frequency produces increasingly higher jet velocities.
4. Conclusions
The goal of this paper has been to experimentally investigate a home-designed PSJ actuator, composed of two parts in Macor, two tungsten electrodes and the power supply system, for different frequencies and discharged energy values. Total pressure measurements, obtained with a suitable home-made Pitot tube, have allowed to obtain the velocity profiles along the jet radial direction and to perform the tuning of a lumped model, able to predict the temporal evolution of the main fluid dynamic variables of the device, with the experimental data, where the total device efficiency has been assumed as a fitting parameter. The best fitting value is .
Acknowledgments
This work has been partially funded with grants of CleanSky 2 project.
Author Contributions
All the authors conceived and contributed equally to the writing of the manuscript.
Conflicts of Interest
The authors declare no conflict of interest.
Appendix
The model is constituted by three ordinary differential equations (Equations (2), (4) and (5)), and a non-linear algebraic relation (Equation (6)), that should be particularized for the exit conditions (Equation (8) or Equation (9)).
Summary of Choked Equations
In the case of choked flow the governing equations are combined with Equation (8), to recast the system of equations in the following convenient form:
Summary of Unchoked Equations
When the energy discharge is not powerful enough to cause an increase of cavity pressure greater than its critical value, the flow issues through the orifice in unchoked regime. In this condition the system of equations is conveniently handled in the following way:
References
- Grossman, K.R.; Cybyk, B.Z.; VanWie, D.M. Sparkjet actuators for flow control. AIAA Pap. 2003. [Google Scholar] [CrossRef]
- Narayanaswamy, V.; Raja, L.L.; Clemens, N.T. Characterization of a high-frequency pulsed-plasma jet actuator for supersonic flow control. AIAA J. 2010, 48, 297–305. [Google Scholar] [CrossRef]
- Caruana, D.; Rogier, F.; Dufour, G.; Gleyzes, C. The Plasma Synthetic Jet Actuator, Physics, Modeling and Flow Control Application and Separation. AerospaceLab 2013, AL 06-10, 1–13. [Google Scholar]
- Emerick, T.; Ali, M.Y.; Foster, C.; Alvi, F.S.; Popkin, S. SparkJet characterizations in quiescent and supersonic flowfields. Exp. Fluids 2014, 55, 1854. [Google Scholar] [CrossRef]
- Popkin, S.H.; Cybyc, B.Z.; Foster, C.H.; Alvi, F.S. Experimental Estimation of SparkJet Efficiency. AIAA J. 2016, 54, 1831–1845. [Google Scholar] [CrossRef]
- Zong, H.; Kotsonis, M. Formation, evolution and scaling of plasma synthetic jets. J. Fluid Mech. 2018, 837, 147–181. [Google Scholar] [CrossRef]
- Zong, H.; Kotsonis, M. Interaction between plasma synthetic jet and subsonic turbulent boundary layer. Phys. Fluids 2017, 29, 045104. [Google Scholar] [CrossRef]
- Chedevergne, F.; Leon, O.; Bodoc, V.; Caruana, D. Experimental and numerical response of a high-Reynolds-number M = 0.6 jet to a Plasma Synthetic Jet actuator. Int. J. Heat Fluid Flow 2015, 56, 1–15. [Google Scholar] [CrossRef]
- Laurendeau, F.; Chedevergne, F.; Casalis, G. Transient ejection phase modeling of a Plasma Synthetic actuator. Phys. Fluids 2014, 26, 125101. [Google Scholar] [CrossRef]
- Laurendeau, F.; Leon, O.; Chedevergne, F.; Senoner, J.-M.; Casalis, G. Particle Image Velocimetry Experiment Analysis Using Large-Eddy Simulation: Application to Plasma Actuators. AIAA J. 2017, 55, 3767–3780. [Google Scholar] [CrossRef]
- Sary, G.; Dufour, G.; Rogier, F.; Kourtzanidis, K. Modeling and Parametric Study of a Plasma Synthetic Jet for Flow Control. AIAA J. 2014, 52, 1591–1603. [Google Scholar] [CrossRef]
- Zong, H.; Wu, Y.; Li, L.; Song, H.; Zhang, Z.; Jia, M. Analytic model and frequency characteristics of plasma synthetic jet actuator. Phys. Fluids 2015, 27, 1–21. [Google Scholar] [CrossRef]
- Zong, H.; Wu, Y.; Song, H.; Jia, M. Efficiency Characteristic of Plasma Synthetic Jet Actuator Driven by Pulsed Direct-Current Discharge. AIAA J. 2016, 54, 3409–3420. [Google Scholar] [CrossRef]
- Chiatto, M.; Capuano, F.; Coppola, G.; de Luca, L. LEM Characterization of Synthetic Jet Actuators Driven by Piezoelectric Element: A Review. Sensors 2017, 17, 1216. [Google Scholar] [CrossRef] [PubMed]
- Chiatto, M.; de Luca, L. Numerical and experimental frequency response of plasma synthetic jet actuators. AIAA Pap. 2017. [Google Scholar] [CrossRef]
- Capitelli, M.; Colonna, G.; Gorse, C.; D’Angola, A. Transport properties of high temperature air in local thermodynamic equilibrium. Eur. Phys. J. D 2010, 11, 279–289. [Google Scholar]
- Belinger, A.; Naudé, N.; Cambronne, J.P.; Caruana, D. Plasma synthetic jet actuator electrical and optical analysis of the discharge. J. Phys. D Appl. Phys. 2014, 47, 1–11. [Google Scholar] [CrossRef]
- De Luca, L.; Girfoglio, M.; Chiatto, M.; Coppola, G. Scaling properties of resonant cavities driven by piezo-electric actuators. Sens. Actuators A Phys. 2016, 247, 465–474. [Google Scholar] [CrossRef]
- Girfoglio, M.; Greco, C.S.; Chiatto, M.; de Luca, L. Modelling of efficiency of synthetic jet actuators. Sens. Actuators A Phys. 2015, 233, 512–521. [Google Scholar] [CrossRef]
- Chiatto, M. Synthetic Jet Actuators for Flow Control. Ph.D. Thesis, Department of Industrial Engineering, University of Naples “Federico II”, Naples, Italy, 2017. [Google Scholar]
- Zhou, J.; Tang, H.; Zhong, S. Vortex Roll-Up Criterion for Synthetic Jets. AIAA J. 2009, 47, 1252–1262. [Google Scholar] [CrossRef]
Figure 1.
CAD reconstruction of the home-made Plasma Synthetic Jet (PSJ) actuator (left), and detail of the electrodes location (right).
Figure 1.
CAD reconstruction of the home-made Plasma Synthetic Jet (PSJ) actuator (left), and detail of the electrodes location (right).

Figure 2.
The power supply system: the red box contains the sustain circuit, while the blue the trigger one.
Figure 2.
The power supply system: the red box contains the sustain circuit, while the blue the trigger one.

Figure 3.
Actuator operating electrical phases. Device bottom part only (top row) and whole device (bottom row).
Figure 3.
Actuator operating electrical phases. Device bottom part only (top row) and whole device (bottom row).

Figure 4.
PSJ actuator with the Pitot probe.
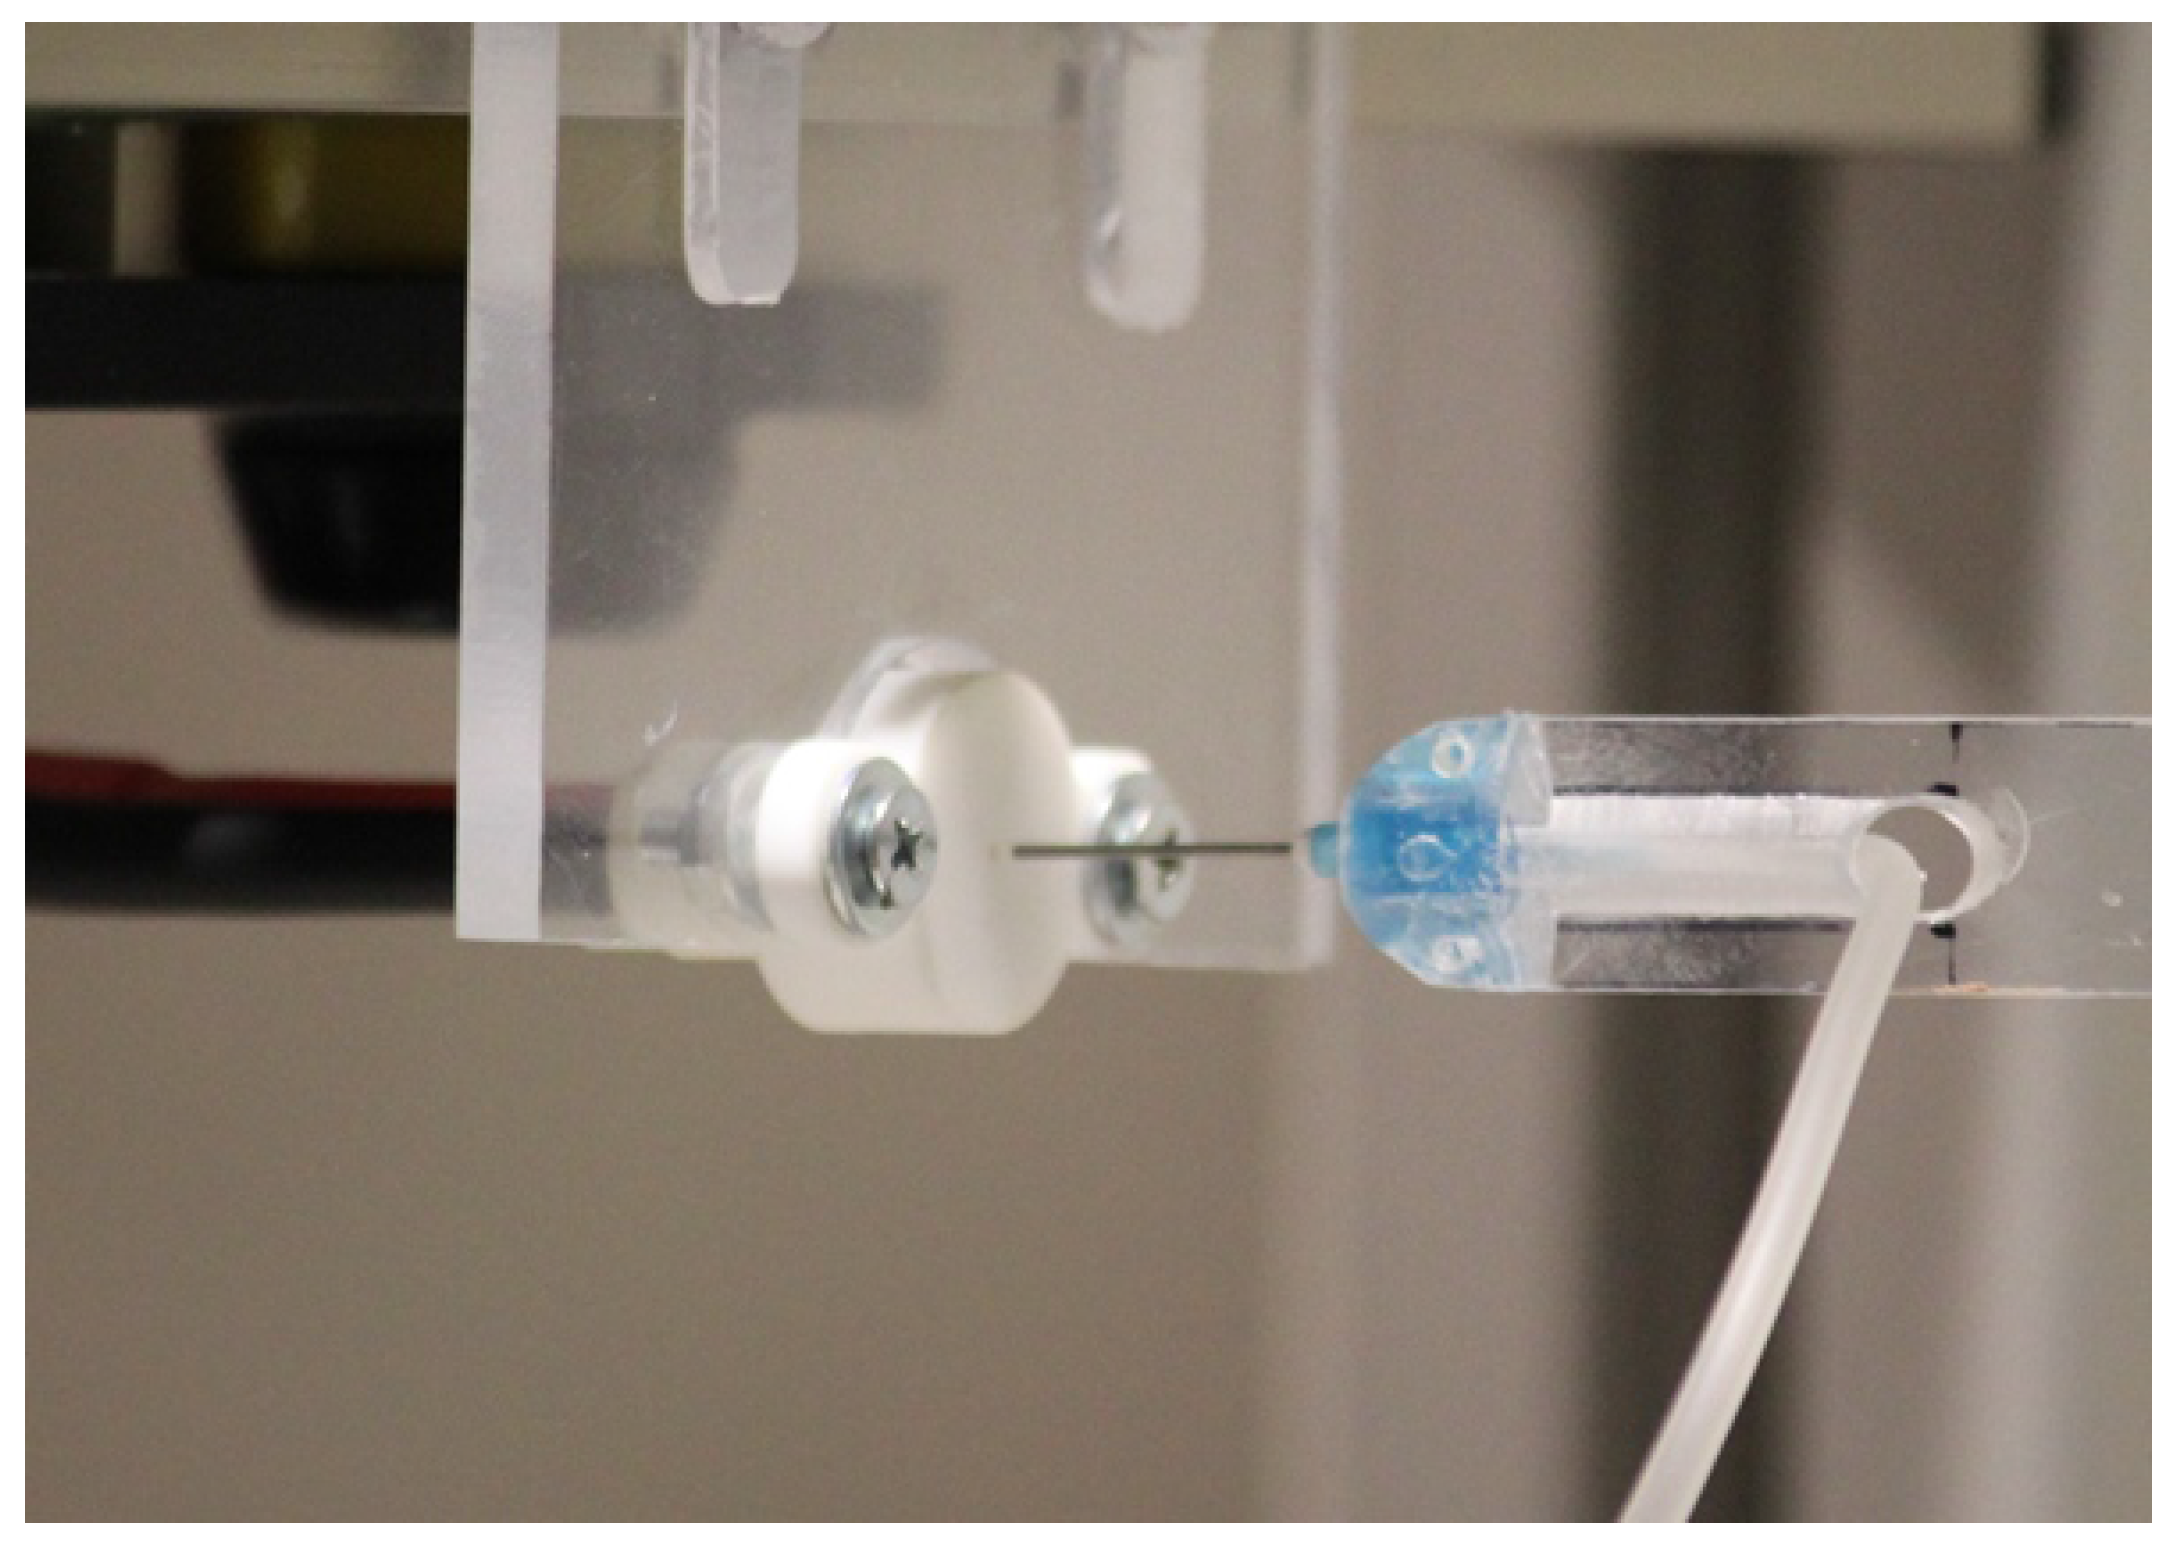
Figure 5.
Jet velocity profiles in the radial direction for different discharged energy. Red markers are the results for mJ (), blue ones for mJ (), and black ones for mJ ().
Figure 5.
Jet velocity profiles in the radial direction for different discharged energy. Red markers are the results for mJ (), blue ones for mJ (), and black ones for mJ ().

Figure 6.
Variation of the mean jet velocity (Pitot tube measurements) with the discharged energy for different actuation frequencies. Black solid line refers to Hz, blue dotted line to Hz, red dashed line Hz, black dashed-dotted line to Hz. Star markers represent experimental data.
Figure 6.
Variation of the mean jet velocity (Pitot tube measurements) with the discharged energy for different actuation frequencies. Black solid line refers to Hz, blue dotted line to Hz, red dashed line Hz, black dashed-dotted line to Hz. Star markers represent experimental data.
© 2018 by the authors. Licensee MDPI, Basel, Switzerland. This article is an open access article distributed under the terms and conditions of the Creative Commons Attribution (CC BY) license (http://creativecommons.org/licenses/by/4.0/).
Share and Cite
MDPI and ACS Style
Chiatto, M.; Palumbo, A.; De Luca, L. A Calibrated Lumped Element Model for the Prediction of PSJ Actuator Efficiency Performance. Actuators 2018, 7, 10. https://doi.org/10.3390/act7010010
AMA Style
Chiatto M, Palumbo A, De Luca L. A Calibrated Lumped Element Model for the Prediction of PSJ Actuator Efficiency Performance. Actuators. 2018; 7(1):10. https://doi.org/10.3390/act7010010
Chicago/Turabian StyleChiatto, Matteo, Andrea Palumbo, and Luigi De Luca. 2018. "A Calibrated Lumped Element Model for the Prediction of PSJ Actuator Efficiency Performance" Actuators 7, no. 1: 10. https://doi.org/10.3390/act7010010
Note that from the first issue of 2016, this journal uses article numbers instead of page numbers. See further details here.