Article

Toxin Variability Estimations of 68 Alexandrium ostenfeldii (Dinophyceae) Strains from The Netherlands Reveal a Novel Abundant Gymnodimine

1
Alfred Wegener Institute Helmholtz Centre for Polar and Marine Research, Am Handelshafen 12, Bremerhaven 27570, Germany
2
Finnish Institute for Verification of the Chemical Weapons Convention (VERIFIN), Department of Chemistry, University of Helsinki, P. O. Box 55, Helsinki FI-00014, Finland
3
Department of Pharmacy, University of Napoli Federico II, Via D. Montesano 49, Napoli 80131, Italy
*
Author to whom correspondence should be addressed.
Microorganisms 2017, 5(2), 29; https://doi.org/10.3390/microorganisms5020029
Submission received: 28 April 2017 / Revised: 17 May 2017 / Accepted: 21 May 2017 / Published: 26 May 2017
(This article belongs to the Special Issue Toxic Cyanobacteria and Toxic Dinoflagellates)

Abstract

:
Alexandrium ostenfeldii is a toxic dinoflagellate that has recently bloomed in Ouwerkerkse Kreek, The Netherlands, and which is able to cause a serious threat to shellfish consumers and aquacultures. We used a large set of 68 strains to the aim of fully characterizing the toxin profiles of the Dutch A. ostenfeldii in consideration of recent reports of novel toxins. Alexandrium ostenfeldii is known as a causative species of paralytic shellfish poisoning, and consistently in the Dutch population we determined the presence of several paralytic shellfish toxins (PST) including saxitoxin (STX), GTX2/3 (gonyautoxins), B1 and C1/C2. We also examined the production of spiroimine toxins by the Dutch A. ostenfeldii strains. An extensive liquid chromatography-tandem mass spectrometry (LC-MS/MS) analysis revealed a high intraspecific variability of spirolides (SPX) and gymnodimines (GYM). Spirolides included 13-desMethyl-spirolide C generally as the major compound and several other mostly unknown SPX-like compounds that were detected and characterized. Besides spirolides, the presence of gymnodimine A and 12-Methyl-gymnodimine A was confirmed, together with two new gymnodimines. One of these was tentatively identified as an analogue of gymnodimine D and was the most abundant gymnodimine (calculated cell quota up to 274 pg cell−1, expressed as GYM A equivalents). Our multi-clonal approach adds new analogues to the increasing number of compounds in these toxin classes and revealed a high strain variability in cell quota and in toxin profile of toxic compounds within a single population.

1. Introduction

In recent years, harmful algal blooms (HAB) have occurred with an increasing frequency [1,2], posing a serious risk for human health mainly by production of potent toxins which accumulate throughout the food chain. On the other hand, already back in 1938, a species of the genus Alexandrium was believed to be responsible for shellfish poisoning in Belgium. The causative species Pyrodinium phoneus [3] was successively inferred to be Alexandrium ostenfeldii [4]. Compared to other Alexandrium species, A. ostenfeldii, currently assumed to be conspecific with A. peruvianum [5], is a barely studied species of the genus. It has a wide geographical distribution including temperate waters of Europe [6], the eastern coast of North America [7], the western coast of South America [8], the southern tip of South America [9], New Zealand [10], and the west coast of Greenland [11]. In the past decade, A. ostenfeldii gained increasing attention because dense coastal blooms of this species were reported, e.g. from South America [8], the Northern Baltic Sea [12], the estuaries of the US East Coast [13,14] and, more recently, in The Netherlands [15]. These blooms represent a major concern for public health protection as some Alexandrium spp. are a source of paralytic shellfish toxins (PST) responsible for a neurotoxic syndrome. Firstly [16], PST in A. ostenfeldii were detected in strains from the Danish Limfjord, a finding that was later confirmed for other strains from other locations such as the Baltic Sea [5] and Chilean fjords [17]. PSTs represent one of the most serious groups of microalgal toxins and mainly consist of saxitoxin (STX), neosaxitoxin (NEO), gonyautoxins (GTX), and their N-sulfocarbamoyl variants, the B- and C-toxins [18].
Although the genus Alexandrium most often has been associated with PST production—as about 10 of the approximately 30 Alexandrium species are PST sources [19]—some strains of A. ostenfeldii lack the ability to produce PST. Alexandrium ostenfeldii currently is mainly linked to the production of spirolides (SPX), fast-acting toxins initially discovered in digestive glands of shellfish [20] and then in Atlantic Canadian strains of A. ostenfeldii [7]. Toxicity of SPX strongly depends on the cycloimine group which constitutes the pharmacophore [21]. Whereas the first studies identified spirolides A, B, C and D as well as two C and D isomers and some derivatives (13-desMethyl-spirolide C and D), subsequent work indicated that the diversity of these groups of compounds produced by A. ostenfeldii was much larger (Table 1), with spirolide G and its 20-Methyl derivative reported from Norway [22] and 27-Hydroxy-13,19-didesMethyl-spirolide C and a few other analogues described from a Mediterranean strain of A. ostenfeldii, some of which are still uncharacterized [23,24]. Two new SPX showing a unique dispiroketal system, spirolide H and I, were also isolated from Atlantic Canadian samples [25]. A thorough analysis of 36 strains of A. ostenfeldii from Greenland revealed the presence of 12 different SPX analogues, 8 of which had not been identified so far. Moreover, SPX composition varied considerably among strains indicating both a high variability of SPX within A. ostenfeldii and a high intraspecific variability in toxin profile as well [11].
To complicate the entire scenario even more, A. ostenfeldii has recently been reported to be also a producer of gymnodimines (GYM), another group of toxins which share the pharmacophoric cycloimine moiety with SPX [26]. Gymnodimines and SPX are thus both members of the spiroimine group of toxins (including also pinnatoxins, prorocentrolides, pteriatoxins and spiro-prorocentrimine) collectively related to spiroimine shellfish poisoning (SSP) based on their negative effects on neuromuscular, sensory, digestive and respiratory systems [27,28,29]. Gymnodimines only had been reported from some species of the genus Karenia [30,31], until 12-Methyl-gymnodimine A (12-Me-GYM A) was identified in A. ostenfeldii collected in brackish water from the east coast of the United States together with PST and SPX [26]. Just a few years later, a second GYM, namely gymnodimine A (GYM A), was found together with 12-Me-GYM A in A. ostenfeldii from The Netherlands [32], where this species since 2012 has formed recurrent noxious blooms in the Scheldt estuary [15]. In addition to GYM, a first characterisation of the Dutch bloom population [32] using 20 clonal strains revealed that all clones produced PST and SPX as well, with a particularly high intraspecific variability in the cellular amounts of spiroimines. SPX included 13-desMethyl-spirolide C as major compound, but the presence of low levels of several other SPX-like compounds in all clones was noted [32] yet not further investigated.
As a follow-up of the study, the major aim of the present study was to fully characterize A. ostenfeldii from the Netherland by liquid chromatography-tandem mass spectrometry regarding these minor components of the spiroimine group of toxins. Moreover, we aimed to more thoroughly analyze the intraspecific variability of the toxin profile both in a qualitative and quantitative perspective, by using a large set of 68 clonal strains. During our study, a Finnish research group identified a new GYM, gymnodimine D, as the major GYM in Baltic A. ostenfeldii strains [33]. Moreover, this group identified more than 30 other albeit minor GYM-like compounds [33], indicating that a considerable diversity of GYM might be a common feature for A. ostenfeldii. These findings prompted us to include this new set of compounds in our toxin screening.

2. Materials and Methods

2.1. Culture

Alexandrium ostenfeldii used for this study were collected in July 2013 during a bloom in the Ouwerkerkse Kreek (51°62’ N, 3°99’ E), The Netherlands [32]. A total of 68 strains were established by single-cell isolation using microcapillary into individual wells of a 96-well plate pre-filled with diluted North Sea water with a salinity of 10. Culture medium was sterile-filtered (0.2 μm VacuCap filters, Pall Life Sciences, Dreieich, Germany) and enriched with 1/2 strength K-medium [35] that was modified by omitting the addition of ammonium. The pH of the culture medium was adjusted to pH 8.0 (EcoScan Series, Eutech instruments, Thermo Scientific, Dreieich, Germany) by adding 1 M hydrochloric acid. Stock cultures were routinely grown non-axenic at a salinity of 10, a temperature of 15 °C, and an incoming photon flux density of 50 μmol photons m−2 s−1 on a 16:8 h light–dark cycle.

2.2. Toxin Screening

For toxin analysis, all strains were grown in 70 mL plastic culture flasks. For each harvest, cell density was determined by settling Lugol-fixed samples (2% final concentration) and counting >600 cells in a 2 mL counting chamber with an inverted microscope (Zeiss Axiovert 40C, Göttingen, Germany) at 200× magnification. Cultures at a cell density ranging from 1000 to 3500 cells mL−1 were harvested by centrifugation (Eppendorf 5810R, Hamburg, Germany) at 3220× g for 10 min. Subsamples of 15 mL for analyses of spiroimine toxins and of 50 mL for analyses of PST were taken. Cell pellets were transferred to 1 mL microtubes, again centrifuged (16,000× g, 5 min, Centrifuge 5415R, Eppendorf, Hamburg, Germany), and stored frozen (−20 °C) until extraction.

2.3. Post-Column Derivatization Analyses of PST

Cell pellets for PST analysis were extracted with 0.03 M acetic acid by reciprocal shaking at maximum speed (6.5 m s−1) for 45 s in a FP 120 FastPrep instrument (Bio101, Thermo Savant, Illkirch, France). After centrifugation, the supernatant was spin-filtered (pore-size 0.45 mm, Millipore Ultrafree, Eschborn, Germany), the filtrate transferred into a HPLC vial (Agilent Technologies, Waldbronn, Germany) and kept at −20 °C until analysis. PST analyses were performed as ion pair chromatography on an octadecyl stationary phase (C18) with two subsequent isocratic elutions: 15 min with 6 mM 1-octanesulphonic acid and 6 mM 1-heptanesulphonic acid in 40 mM ammonium phosphate, adjusted to pH 7.0 with dilute phosphoric acid and 0.75% tetrahydrofuran (THF) and then switched within 1 min to 13 mM 1-octanesulphonic acid in 50 mM phosphoric acid adjusted to pH 6.9 with ammonium hydroxide, 15% of acetonitrile and 1.5% of THF for 24 min. Post-column derivatization was performed with 10 mM periodic acid in 550 mM ammonium hydroxide and subsequently 0.75 N nitric acid: both reagents were added at a constant flow of 4 mL min−1. Toxin derivatives were detected by fluorescence detection (λex = 333 nm; λem = 395 nm). All toxins were identified and quantitated against an external calibration curve containing C1/2, B1, STX, NEO, GTX-1 to 4, dcGTX-2/3 and dcSTX. These toxins were purchased from the certified reference material (CRM) program of the National Research Council (NRC, Halifax, NS, Canada). Limits of detection (LOD) were defined as the signal-to-noise (S/N) ratio higher than three and are given on a per-cell basis. However, LODs were calculated with the mean cell numbers of all strains and thus only reflect orders of magnitude rather than exact values (Appendix A, Table A1).

2.4. Extraction

Cell pellets were transferred to 2 mL microcentrifuge tubes (neoLab, Heidelberg, Germany) containing 0.5 g lysing matrix D (Thermo Savant, Illkirch, France). Subsequently, the pellets were suspended in 500 µL methanol (Merck, Darmstadt, Germany) and homogenized by reciprocal shaking at maximum speed (6.5 m s−1) for 45 s in a FP 120 FastPrep instrument (Bio101, Thermo Savant, Illkirch, France). After homogenization, the samples were centrifuged (16,000 g, 15 min, 4 °C, Centrifuge 5415R, Eppendorf, Hamburg, Germany) and the supernatant was transferred to a spin-filter (pore-size 0.45 mm, Millipore Ultrafree, Eschborn, Germany) and centrifuged for 30 s at 3220 g. Filtrates were transferred into HPLC vials (Agilent Technologies, Waldbronn, Germany) and stored at −20 °C.

2.5. Analyses of Spiroimines by Liquid Chromatography-Tandem Mass Spectrometry (LC-MS/MS)

The spiroimine measurements were performed on a triple-quadrupole mass spectrometer (API 4000 Q Trap, AB-Sciex, Darmstadt, Germany) with a Turbo V ion source coupled to an Agilent 1100 LC liquid chromatograph (Waldbronn, Germany). The LC was equipped with a solvent reservoir, in-line degasser (G1379A), binary pump (G1311A), refrigerated autosampler (G1329A/G1330B) and a temperature-controlled column oven (G1316A). The separation was carried out on an analytical C8 reverse phase column (50 mm × 2 mm) packed with 3 μm Hypersil BDS 120 Å (Phenomenex, Aschaffenburg, Germany) and thermostated at 20 °C. The flow-rate was 0.2 mL min−1 and a gradient elution performed, where eluent A consisted of water and eluent B was methanol/water (95:5 v/v), both containing 2.0 mM ammonium formate and 50 mM formic acid. Initial conditions were 5% of eluent B. After injection, a linear gradient to 100% B in 10 min was performed and followed by isocratic elution until 20 min. Then the eluent composition was set to initial conditions within 1 min followed by 9 min column equilibration. The total run time was 30 min. The mass spectrometric parameters were as follows: Curtain gas: 20 psi, CAD (collision activated dissociation) gas: medium, ion-spray voltage: 5500 V, temperature: 650 °C, nebulizer gas: 40 psi, auxiliary gas: 70 psi, interface heater: on, declustering potential: 121 V, entrance potential: 10 V, exit potential: 22 V. The collision energy was 57 V for each transition.
For spiroimine screening [M + H]+ > [M + H – H2O]+ transitions of the known GYM were included into the SRM method of LC-MS analysis: m/z 508 > 490 for GYM A, m/z 522 > 504 for 12-Me-GYM A and m/z 524 > 506 for gymnodimines B, C and D. In addition, we included two transitions (m/z 510 > 492 and 526 > 508) of as yet unidentified GYM in Baltic strains of A. ostenfeldii [33]. Furthermore, transitions of all SPX reported in the literature were included in the method (Table 2).
Measurements were performed in the positive ion-mode and dwell times of 40 ms were used for each transition. SPX were calibrated against an external calibration curve of 13-desMethyl-spirolide C (certified reference material; NRC, Halifax, NS, Canada) and expressed as 13-desMethyl-spirolide C equivalents. For the calibration curve, the following concentrations of 13-desMethyl-spirolide C were used: 10 pg μL−1, 50 pg μL−1, 100 pg μL−1 and 1000 pg μL−1. Likewise, GYM were calibrated against an external calibration curve of GYM A (CRM; NRC, Halifax, NS, Canada) and expressed as GYM A equivalent. 12-Methyl-gymnodimine A was purchased from Biomol GmbH (Hamburg, Germany) and used for compound identification. For quantifying GYM, the following concentrations of a standard solution of GYM A were used: 10 pg μL−1, 50 pg μL−1, 500 pg μL−1 and 1000 pg μL−1. Limits of detection were defined as S/N ≥ 3 and are given as means of all strains in Appendix A, Table A2. Data acquisition and processing was performed with the Analyst Software (version 1.5, AB Sciex, Darmstadt, Germany). In addition, collision-induced dissociation (CID) spectra were recorded of all detected compounds.

2.6. Analyses of Spiroimines by Liquid Chromatography–High-Resolution Mass Spectrometry (LC–HRMS)

Compound (6) by Orbitrap Fusion

Strain OKNL20 was measured with Orbitrap Fusion high-resolution mass spectrometer (Thermo Scientific, San José, CA, USA) connected to Dionex Ultimate 3000 UHPLC (Thermo Scientific, Dionex, Germering, Germany). Heated ESI source (HESI) was used with a positive mode ionisation. EASY-ICTM ion source with fluoranthene was used for internal calibration. The separation was performed with a C18 column (Acquity UPLC BEH 2.1 × 50 mm, 1.7 µm, Waters). The elution gradient was started with 90% of eluent A (0.1% HCOOH in MilliQ water) and 10% of eluent B (0.1% HCOOH in acetonitrile). The elution gradient was changed from eluent A 90% to A 10% (0–10 min), changed back to eluent A 90% at 10.1 min, and equilibrated until 12 min with eluent A 90%. The flow rate was 0.6 mL min−1, the column oven temperature was set to 40 °C, and the injection volume was 3 µL. The scan range was 100–600 m/z, resolution: 120,000, spray voltage: 3 kV, ion transfer tube temperature: 350 °C, and vaporizer temperature: 300 °C. The product ions of MS2 fragmentation at m/z 510 are listed in Table 3. The results were obtained with collision-induced dissociation (CID) energy of 35%. Higher-energy collisional dissociation (HCD) energy of 35% was also applied for fragmentation, and it produced the product ion typical for GYM (m/z 136). The mass tolerances were set to 3.00 ppm, and the charge was +1.

2.7. Accurate Mass Measurements of Spiroimines by Hybrid Linear Ion Trap Orbitrap FTMS

2.7.1. Solid Phase Extraction (SPE) Clean-Up

Combined extracts of the A. ostenfeldii strains OKNL35 and OKNL43 were dissolved in 250 µL of H2O and loaded on a Strata-X C18, 6 mL (Phenomenex, Torrance, CA, USA) equilibrated with H2O. The cartridge was washed with 10 mL of H2O and then eluted with 10 mL of H2O/CH3CN (7:3, v/v), 10 mL of H2O/CH3CN (1:1, v/v), 10 mL of acetonitrile and 10 mL of MeOH. Each SPE eluate was evaporated to dryness and dissolved in 1.5 mL of MeOH before analyses.

2.7.2. Liquid Chromatography–High-Resolution Mass Spectrometry (LC–HRMS)

The analyses were performed on the crude extract of A. ostenfeldii strains OKNL35 and OKNL43 and SPE eluates by using a hybrid linear ion trap LTQ Orbitrap XL™ Fourier transform mass spectrometer (FTMS) equipped with an ESI ION MAX™ source (Thermo Fisher, San José, CA, USA) coupled to a Dionex Ultimate 3000 system which included a solvent reservoir, in-line degasser, quaternary pump and refrigerated autosampler and column oven. The following conditions were used: a 3 µm Hypersil C8 BDS, 50 × 2.00 mm column (Phenomenex, Torrance, CA, USA) at room temperature. Eluent A was H2O and B was a 95% acetonitrile/H2O solution, both containing 2 mM ammonium formate and 50 mM formic acid as suggested [40]. The flow rate was 0.2 mL min−1. A fast-gradient elution, 10–100% B in 10 min followed by 100% B for 15 min, was used in most of the experiments. A slow-gradient (10–30% B over 2 min, 30–80% B over 16 min, 80–100% B in 3 min, and hold 5 min) was also used to separate potentially interfering compounds. Injection volume was 5 μL. Full scan high-resolution mass spectrometry (HRMS) experiments (positive ions) were acquired in the m/z 400–1000 range at a resolving power (RP) of 100,000 (FWHM at m/z 400). The following source settings were used: spray voltage = 4.2 kV (SPX) and 4.5 kV (GYM), capillary temperature = 400 °C, capillary voltage: 14 V (SPX) and 20 V (GYM), sheath gas flow = 27 (SPX) and 35 (GYM), auxiliary gas flow = 0 (SPX) and 5 (GYM), and tube lens voltage = 100 V. Calculation of elemental formulae was performed on the mono-isotopic peak of each ion cluster using Xcalibur software v2.0.7 (Thermo Fisher, San José, CA, USA) at a 5 ppm mass tolerance.

3. Results

3.1. Toxin Profile

All 68 strains showed the same PST profile consisting of C1/C2, GTX2/3, B1 and STX with variable cell quotas (Table 4). Several compounds corresponding to various spiroimines were also detected (Table 2). Five spiroimines were detected in the strains by SRM screening and four of them were identified by comparison of retention times and CID spectra with those of previously isolated compounds. These four spiroimines include 13-desMethyl-spirolide C (Table 1), 27-Hydroxy-13-desMethyl-spirolide C, gymnodimine A and 12-Methyl-gymnodimine A (Figure 1). As the fifth spirolide, a yet unknown spirolide with a pseudo-molecular ion at m/z 694 (1) was detected.
Precursor ion scans of the characteristic spirolide fragment at m/z 164, which is characteristic for SPX [41], revealed the presence of four more precursor ions with m/z 696 (2), m/z 710 (3), m/z 720 (4) and m/z 722 (5). The CID experiments of these precursor masses displayed the typical A- and B-type fragments characteristic for SPX (Figure 2). In addition, high-resolution mass spectrometric (HRMS) measurements further confirmed the presence of the known spiroimines as well as of compounds (2)–(5) and additionally revealed the presence of two more gymnodimines with m/z 510 (6) and m/z 526 (7) (Table 5). Finally, HRMS measurements and CID spectra were recorded for all the detected pseudo-molecular ions to obtain information on the identity of these compounds. The accurate mass of pseudo-molecular ion of (1) at m/z 694.4322 fitted with an elemental composition of C41H60O8N (Table 5). In contrast, CID spectra of compounds m/z 510 (6) and m/z 526 (7) showed typical GYM fragments (Figure 3) e.g., the loss of water and a product ion at m/z 136.
The typical A-type SPX fragment cluster of (1) (Figure 2B) was downshifted of 16 Da in comparison to 13-desMethyl-spirolide C [41,42]. In addition to the B-type fragment at m/z 164, ions not commonly observed in SPX CID spectra appeared at m/z 248, 274 and 292. The CID spectrum of (2) (Figure 2C) contained the same type-A and -B fragments as (1), while its pseudo-molecular ion and associated water losses were up-shifted of 2 Da. Compound (3) displayed an identical CID spectrum as 13-desMethyl-spirolide C except for the pseudo molecular ion cluster, which was up-shifted of 18 Da (Figure 2E). In contrast, the C1 to C11 part (Figure 4) of (4) (Figure 2F) was identical to that of 13-desMethyl-spirolide C (Figure 2A), as mass differences from the pseudo molecular ions and the A-type fragments of both compounds were identical (230 Da; m/z 692–462 and 720–490). The mass difference between (4) and 13-desMethyl-spirolide C was 28 Da. Compound (5) in turn showed an identical CID spectrum as (3) except for an up-shift of 2 Da of the pseudo molecular ion cluster (Figure 2G).

3.2. Toxin Variability

PST cell quotas among strains ranged from 11.3 to 88.2 pg cell−1 (mean 45.7 pg cell−1) (Appendix A: Table A3, Figure 4A). The PST profile was very consistent among all the strains (Figure 4D) with a dominance of C1/C2 (mean relative abundances of 82.3%) and lesser contributions of GTX2/3 (12.8%), STX (3.8%), and B1 (1.1%). As the only exception, one strain (OKNL68, Appendix A, Table A3) had a slightly different relative composition and contained relatively less C1/C2 (44.6%) and higher relative contributions of the other compounds (GTX2/3: 42.1%, STX: 10.2%; B1: 3.1%).
Total SPX cell quotas (expressed as 13-desMethyl-spirolide C equivalents) among strains ranged from 0.09 to 5.6 pg cell−1 (mean: 1.2 pg cell−1) (Appendix A: Table A4, Figure 4). For all spirolides there was a high variability both in cell quota and relative contribution to total SPX among the strains (Figure 4B,E). One spirolide was detected in all strains (13-desMethyl-spirolide C), whereas other spirolides were below detection limit in several strains (Table 4). 13-desMethyl-spirolide C generally dominated the spirolide profile (Figure 4E) but nevertheless relative contribution among strains ranged from 17% to 98%. 27-Hydroxy-13-desMethyl-spirolide C was present in 37 strains and showed the lowest range of relative contribution to total SPX (0–8.8%). Compounds (1) and (2) were detected in just a few strains (7 and 2 strains, respectively), and relative contribution varied greatly. Likewise, cell quotas of individual spirolides varied among strains with fold changes between a minimum (defined here as the strains with the lowest amount above detection limit) ranging from 1-fold (compound (2)) to 273-fold (13-desMethyl-spirolide C) (Table 4).
The total amount of GYM (expressed as GYM A equivalents) per cell among strains ranged from 40.7 to 295.0 pg cell−1 (mean: 144.7 pg cell−1) (Appendix A Table A4). Overall, (6) was the dominant compound. It was detected in all the strains and accounted for 77% to 100% of all GYM content. As for the other gymnodimines, GYM A and (7) were not detected in about 10% of the strains, while 12-Me-GYM A was detected in about half of the strains (Table 4). Cell quotas of individual gymnodimines varied considerably among strains (Figure 4C,D) with fold changes between a minimum (defined here as the strain with the lowest amount above detection limit) ranging from 5-fold (12-Me-GYM A) to 59-fold (GYM A) (Table 4).

4. Discussion

Our study of multiple clones of a brackish water population of A. ostenfeldii revealed a conserved qualitative PST profile but high quantitative variability of individual PST, and a high structural diversity and quantitative variability of spiroimines. As we analysed intracellular compounds, and autonomous spiroimine production by bacteria has never been reported, we argue that a potential contribution of extracellular bacteria in the cultures is unlikely and that secondary metabolite variability indeed is a phenotypic trait of the different strains. Previously, relatively few spiroimines have been reported in the literature [43]. This is probably because this group of compounds normally does not receive as much attention as toxins that are known to cause illness in humans. Spiroimines indeed show little oral toxicity and thus are not regarded as a risk for consumers of contaminated shellfish. However, they do have severe and fast neurotoxic effect after intraperitoneal injection into mice and thus deserve attention. With this work, we add five novel spirolides and two new gymnodimines produced by A. ostenfeldii to the growing list of spiroimines. Furthermore, our results highlight a high variability of toxin cell quotas among multiple strains of one algal population. Toxin cell quotas are well known to be modulated by environmental factors [44,45]. In our study, however, all strains were grown under identical environmental conditions (growth medium, nutrients, light and temperature) and were sampled for toxin analysis during active growth at a comparable cell density of about 1000–3500 cells mL−1, which corresponds to a mid-exponential phase. Moreover, for a selected number of strains of the Dutch A. ostenfeldii population, detailed culture experiments [32] revealed a generally low deviation of replicate cultures (relative standard deviation of 10% for PST, 8% for GYM, and 7% for SPX). We therefore conclude that our non-replicated analysis of multiple strains indeed reflects considerable genetically based intraspecific variability in the quantity of produced toxins.
Variability of various traits is well known within microalgal populations [46,47,48]. Such high variability might facilitate widely variable phenotypic responses within a population to changes in biotic and/or abiotic conditions, and make populations resilient to changes in environmental and climatic conditions. Variability thus may be the result of adaption to variable environmental conditions [49], which presumably are high in the small and shallow Ouwerkerkse Kreek. Future studies on the Dutch bloom population and/or other toxic microalgal blooms are needed to determine if and to what extend phenotypic (e.g., chemical) variability determined here coincide with genotypic (e.g., as estimated with microsatellite markers) variability.

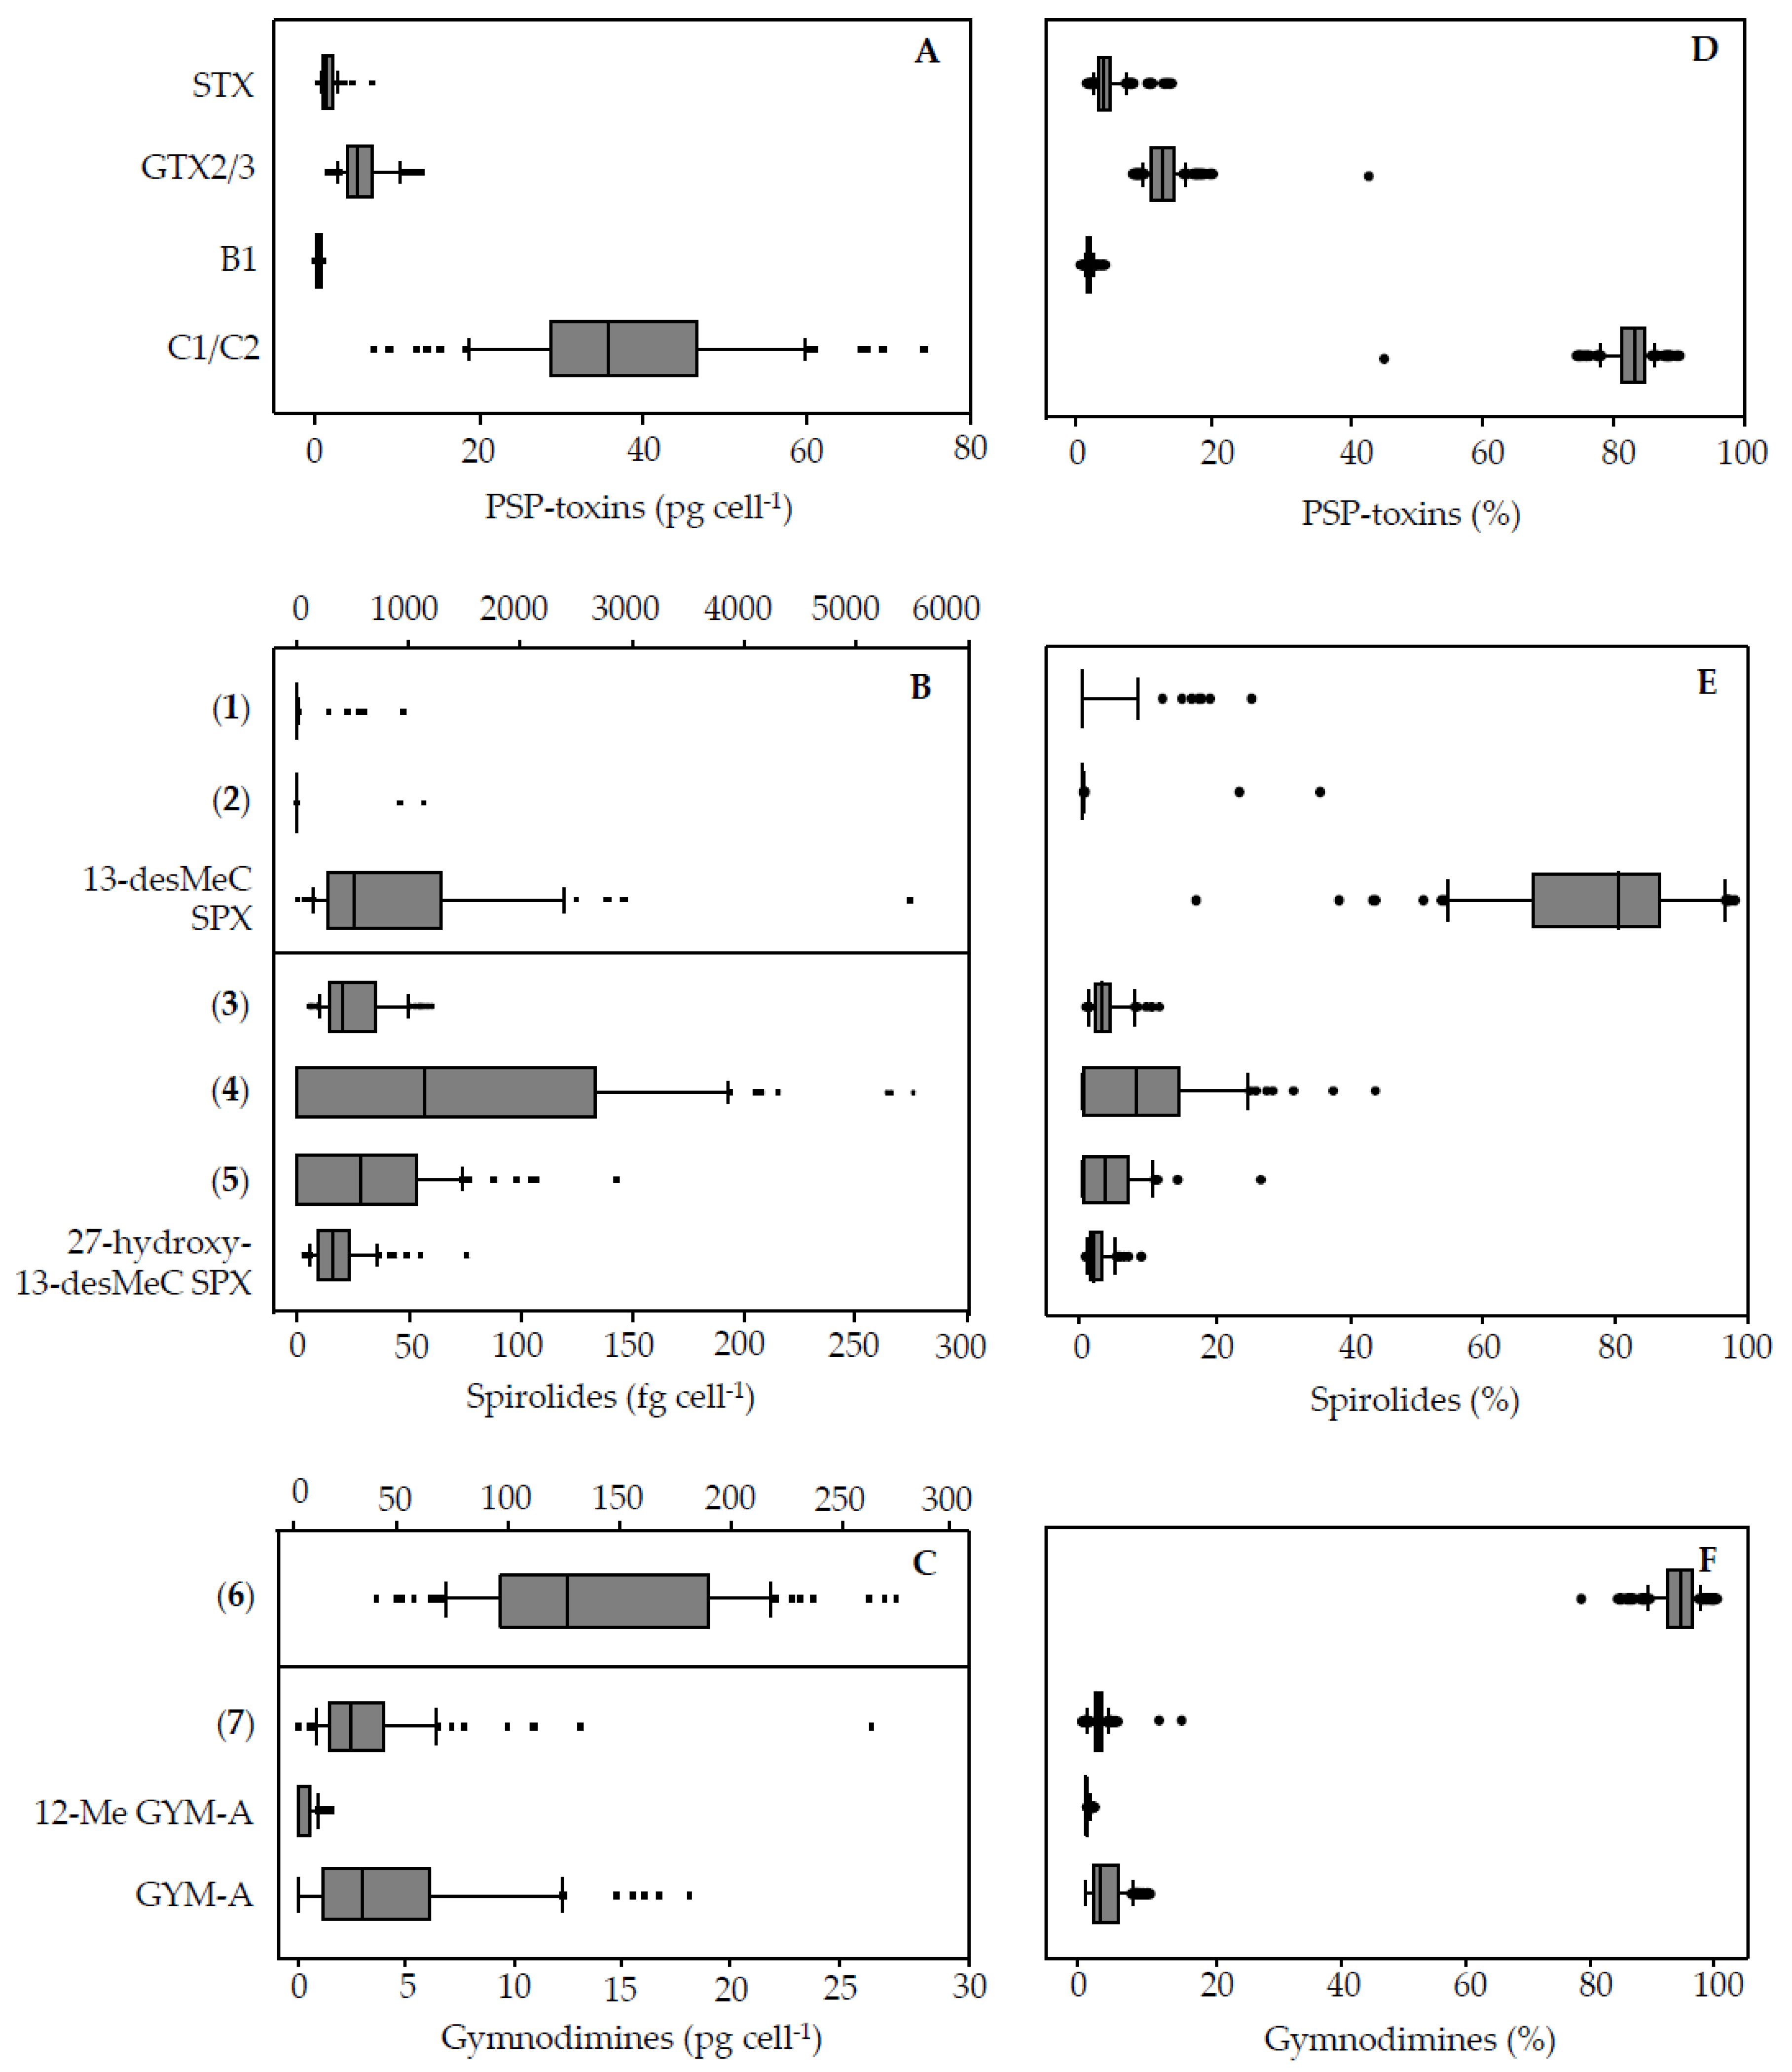
4.1. Paralytic Shellfish Poisoning Toxins

For PST, the toxin profile was identical for all strains with very little intraspecific variability in relative contribution. It presented a dominance of C1/2, lesser amounts of GTX2/3 and STX, and traces of B1. This agrees with earlier results for a small set of strains from the same A. ostenfeldii population [32]. Compared to other A. ostenfeldii strains, this PST profile is identical to that of A. ostenfeldii from the US coast, but different from that of strains from the Baltic Sea and Peru, which lack C1/2 and B1 [5], and different from a strain from China, which is unique in producing just neosaxitoxin [5].
In contrast to the PST profile, quantitative variability in cellular PST content was high with fold-changes between the lowest and highest quota ranging from 8 (GTX 2/3) to 18 (SPX) (Table 4). Total PST contents measured in the present study and based on analysis of 68 A. ostenfeldii strains was in the range 11.3–88.2 pg cell−1 (7.8-fold), in good agreement with the total toxin content reported earlier (9.5–51.0 pg cell−1; 5.4-fold) [32], although these authors included only 20 A. ostenfeldii strains in their study. This suggests that an analysis of a higher number of strains does not provide further insights into PST variability within a single population.

4.2. Spiroimine Structural Diversity

4.2.1. Spirolides

Differently from PST, our study of a larger number of strains of the Dutch A. ostenfeldii population revealed interesting information about spiroimines. Whereas the presence of 13-desMethyl-spirolide C and 27-Hydroxy-13-desMethyl-spirolide C as dominant spirolides had been reported in the previous study [
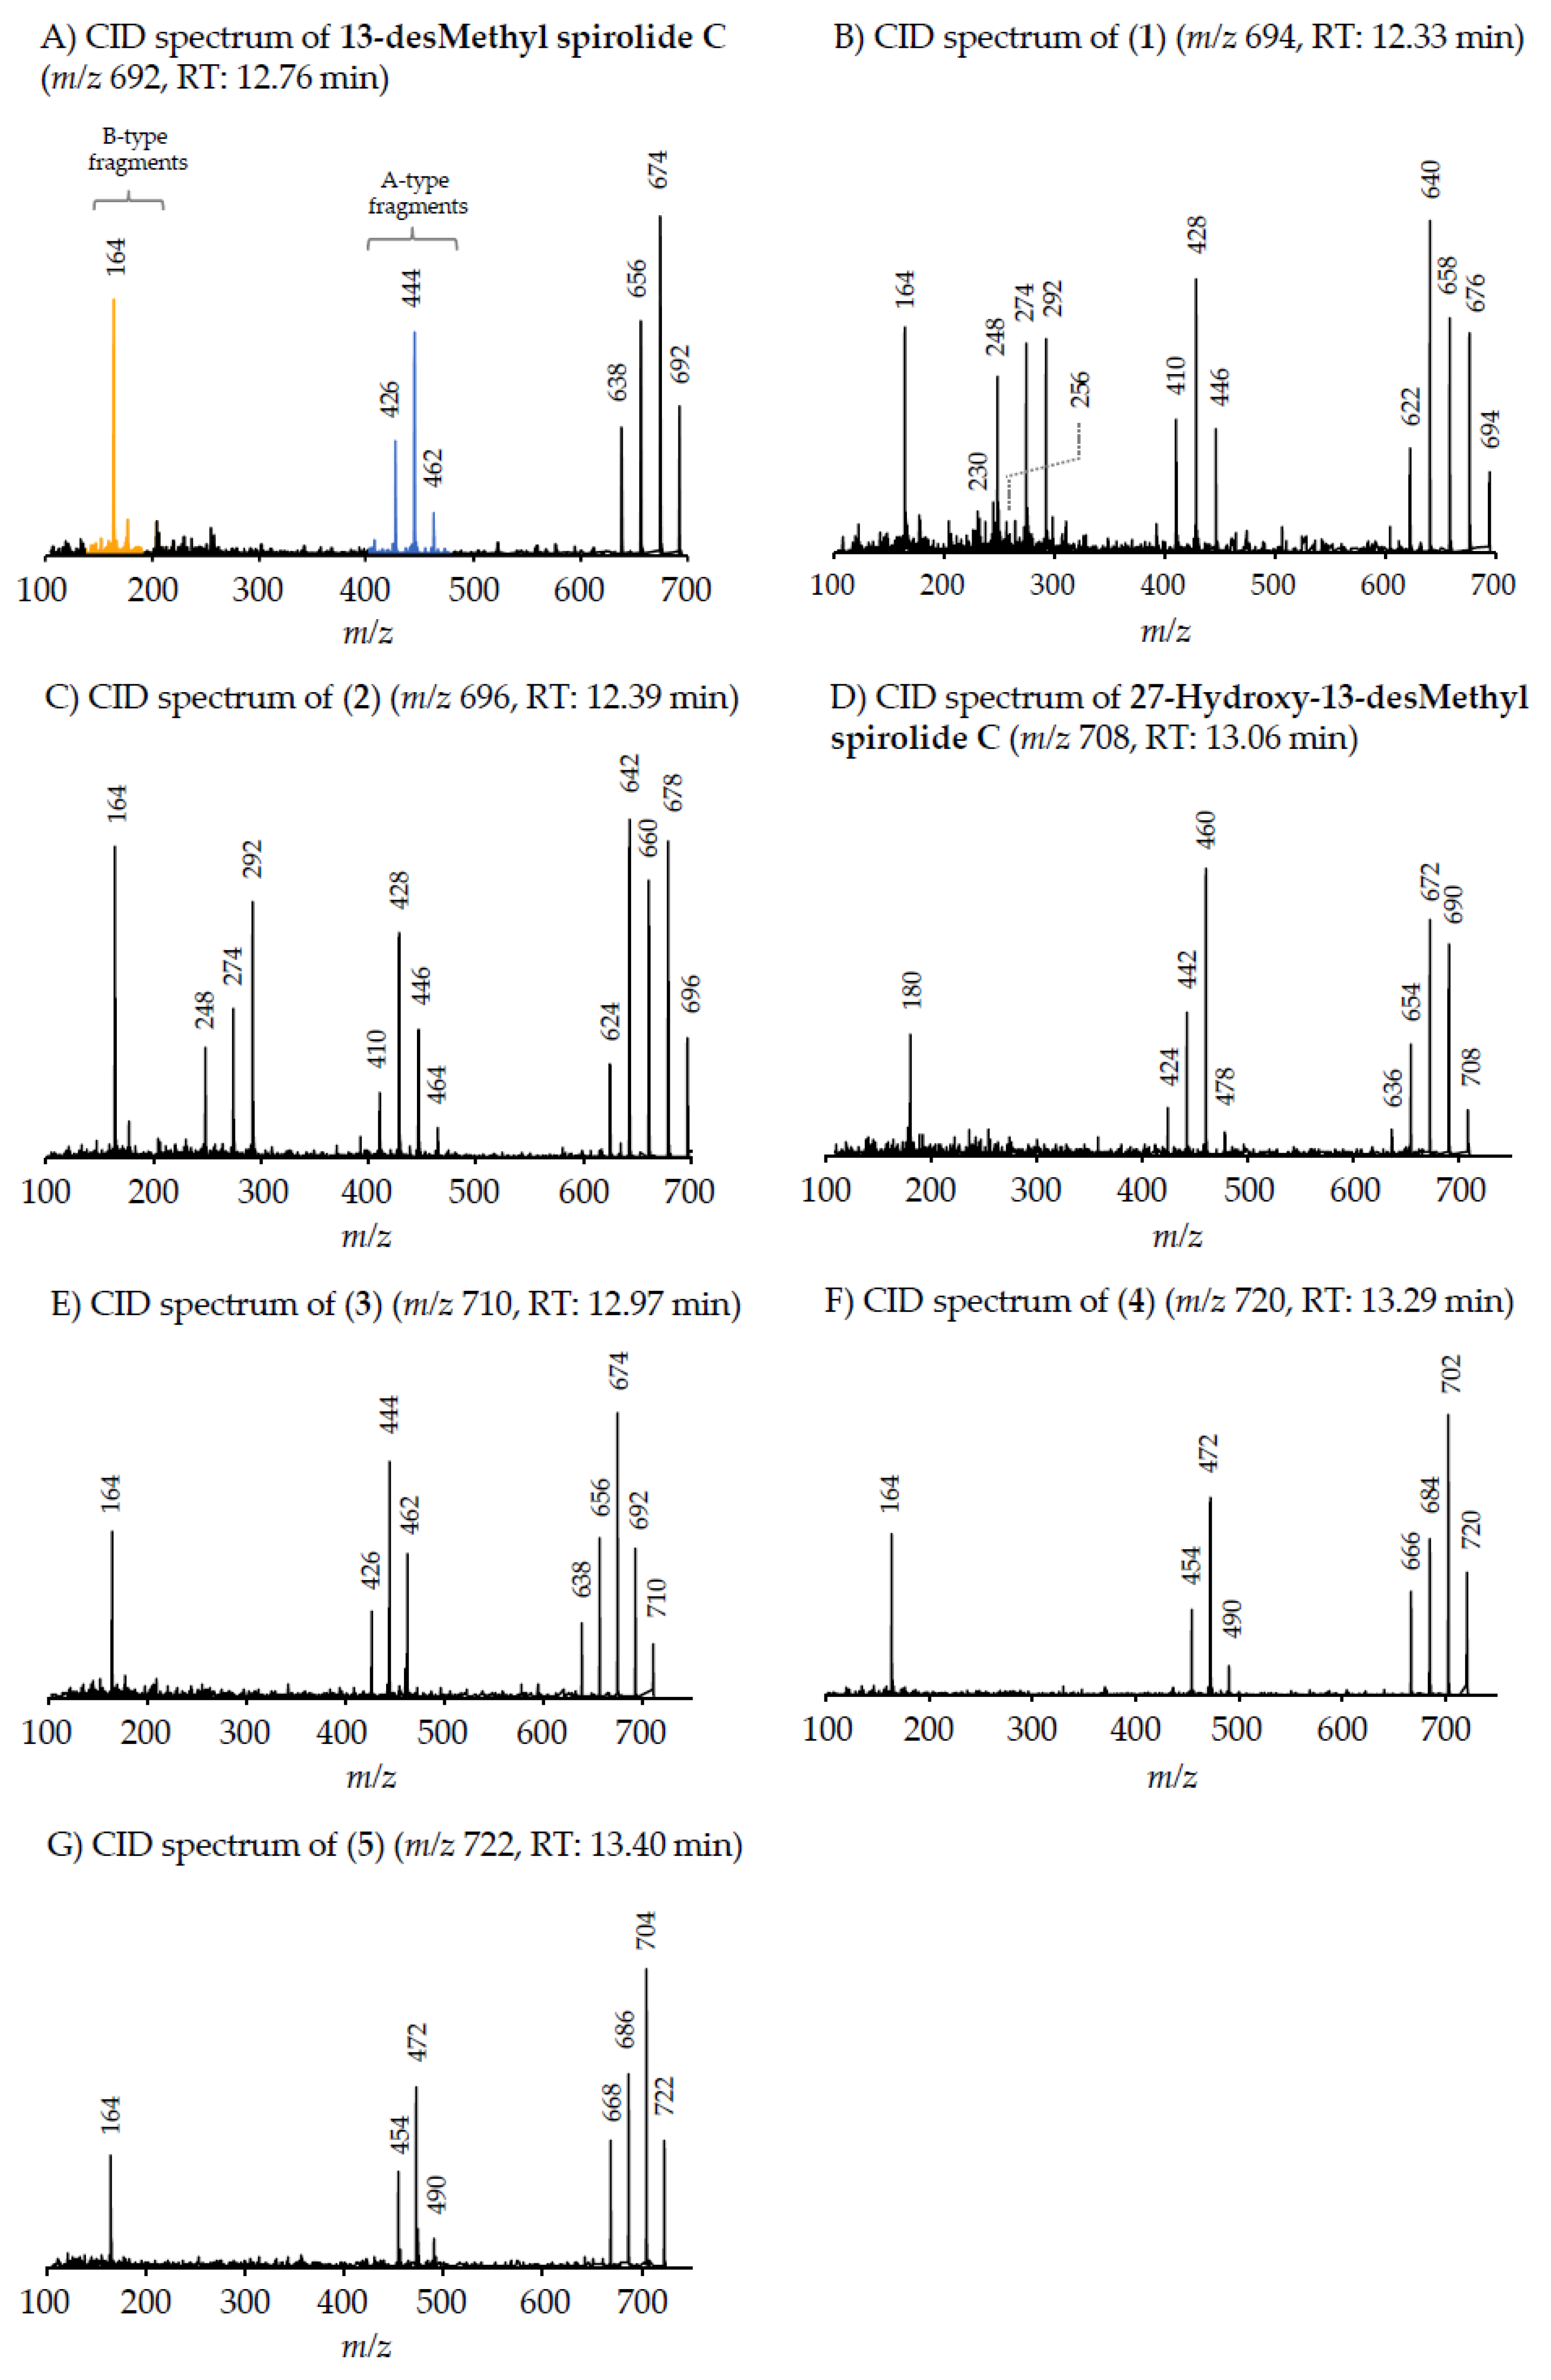
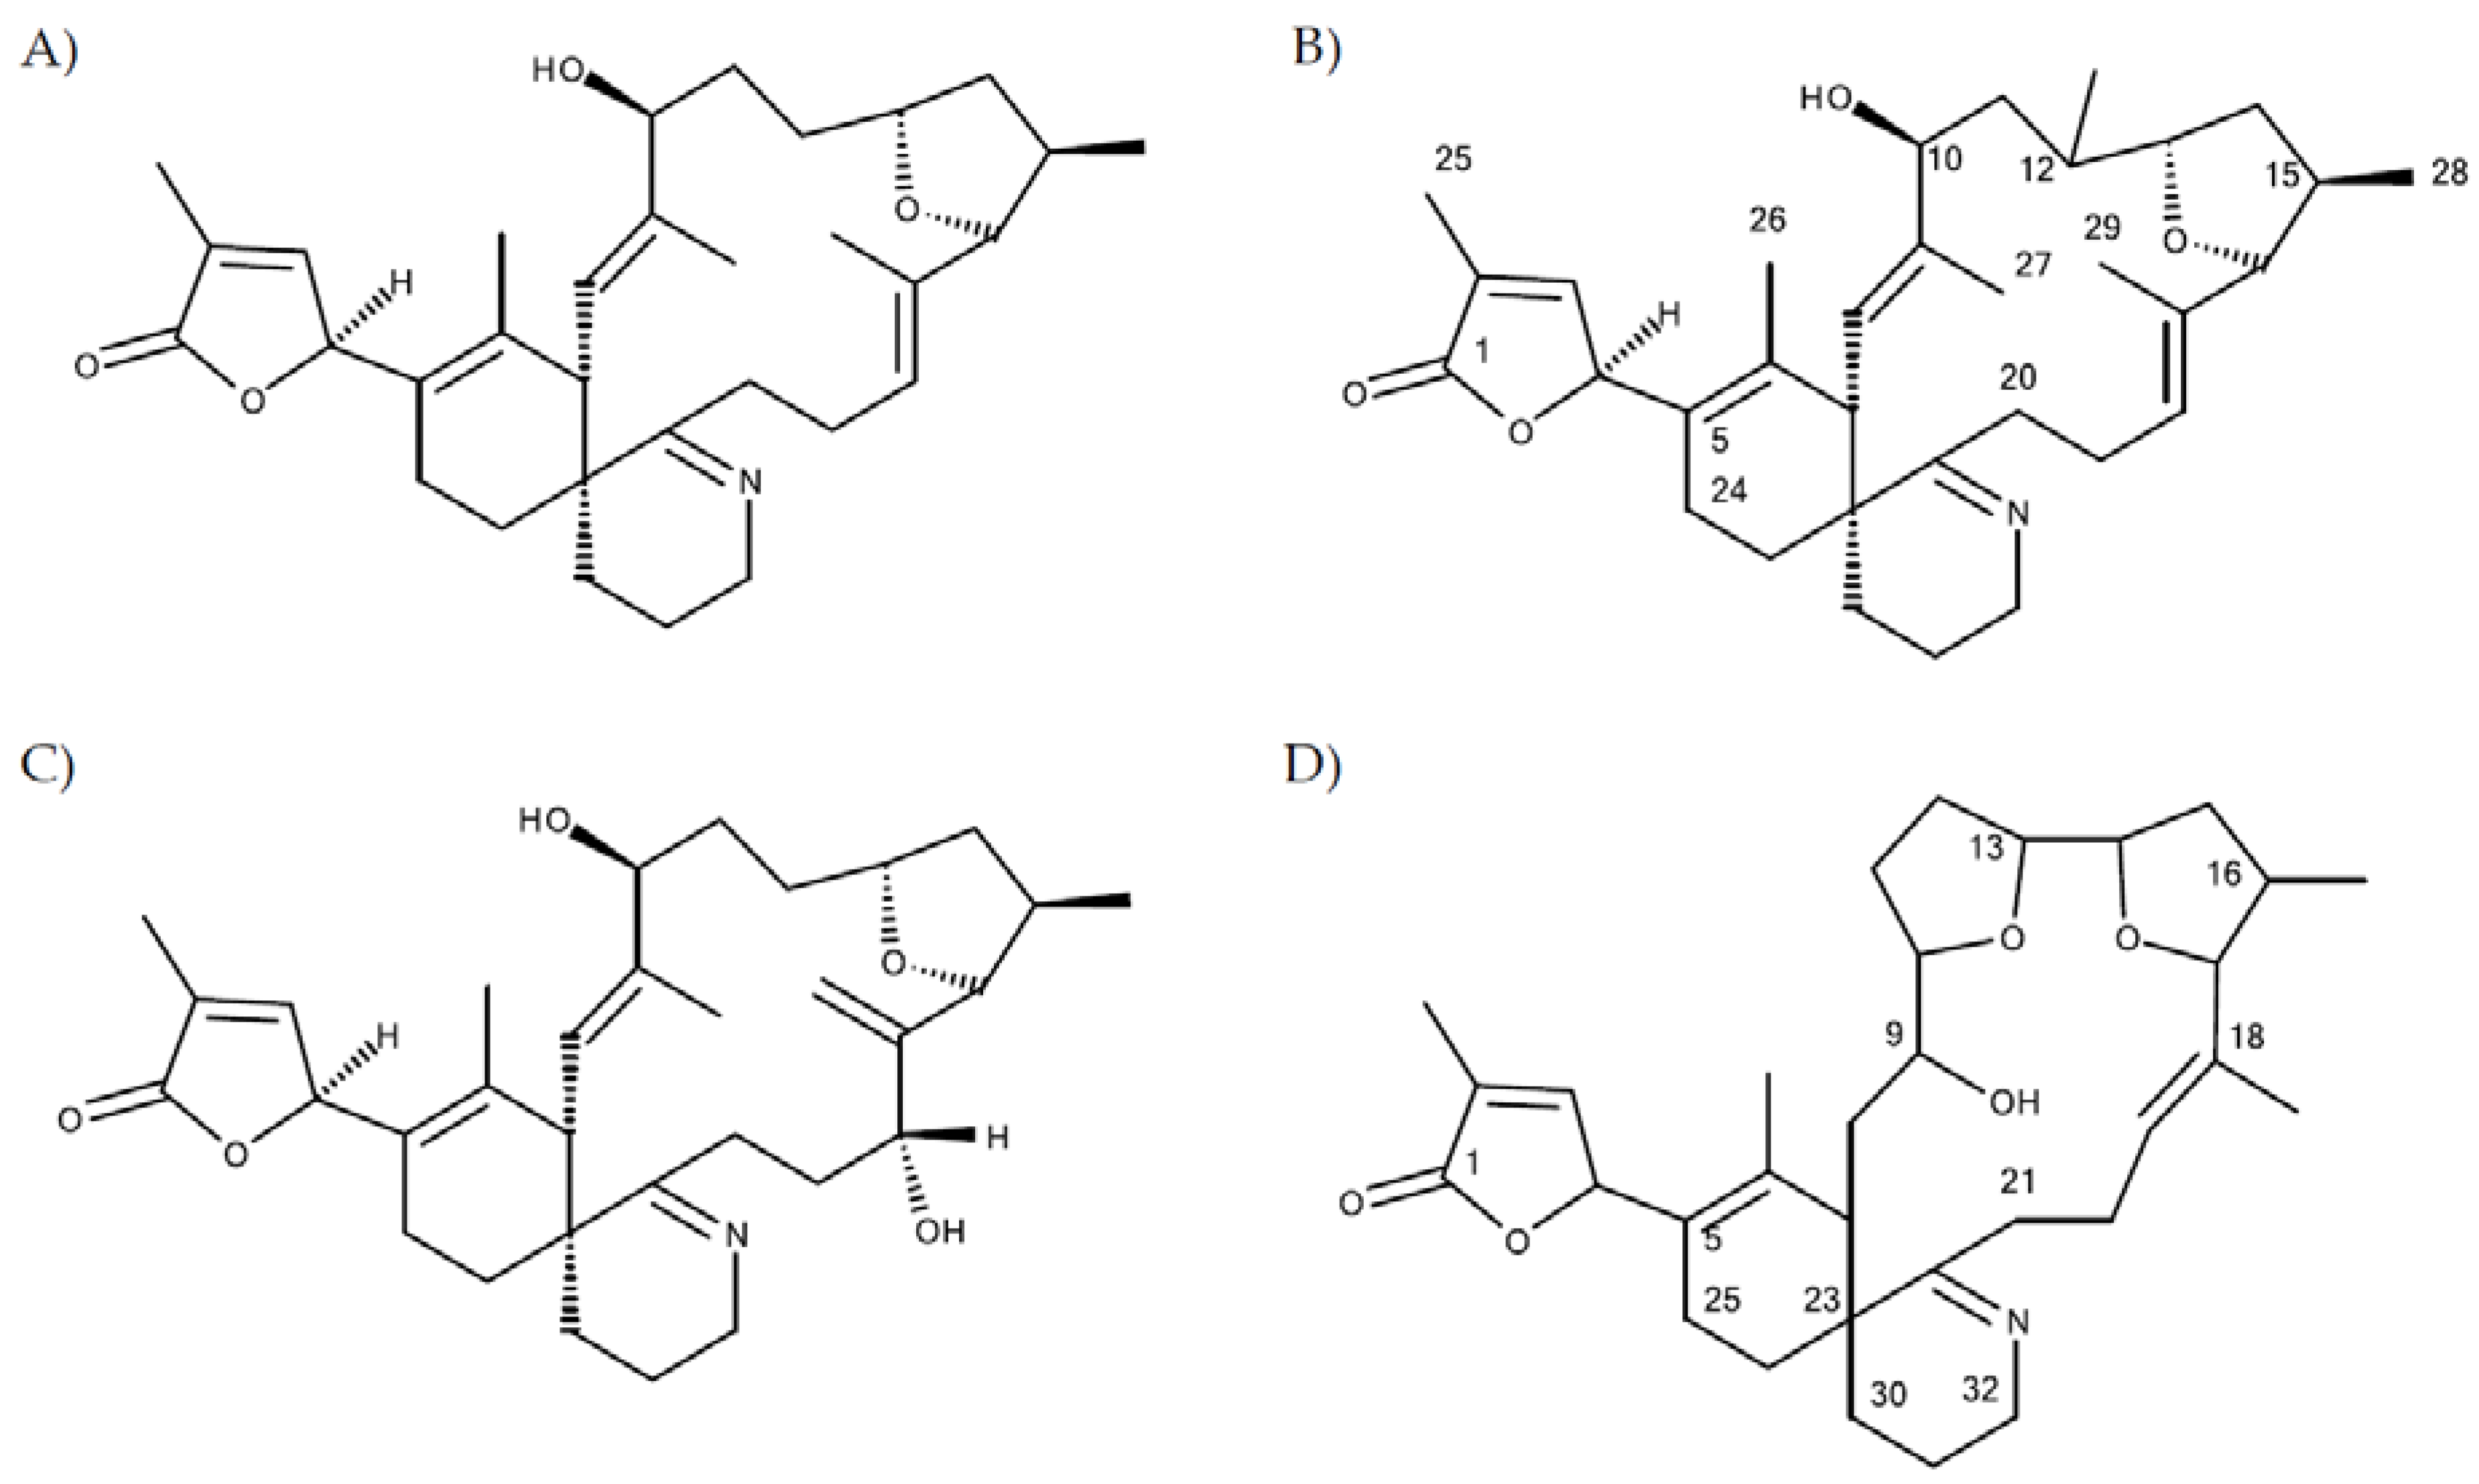
32], we detected and characterised a total of five additional and yet unreported spirolide analogues. This identification is based on the characteristic fragmentation pattern of SPX, which consists of three fragment groups: the first fragment cluster consists of the protonated molecular ion and several water losses, typically in the mass range between 650 and 750 Da. The second characteristic SPX fragment group (A type, Figure 2A) is produced by the loss of the butenolide side chain of the molecule, which is formed after a retro-Diels–Alder opening of the SPX macrocycle and subsequent water losses. This fragment cluster typically occurs in the mass range of 400 to 500 Da [41], except for G-type SPX, where this cluster is shifted to lower masses [22]. The third SPX fragment group (B-type, Figure 2A) consists of the cyclic imine ring with an ethylene rest of the macrocycle at m/z 150, 164 or 180 (depending on the degree of methylation and/or hydroxylation). In addition to the two known SPX, the five new SPX with pseudo molecular ions at m/z 694, 696, 710, 720 and 722 could be characterized by their typical fragmentation pattern contained in CID spectra (Figure 2A–G). Although structure elucidation ultimately will require NMR analysis, the recorded CID spectra nevertheless allow a clear mass spectrometric characterization.

Compound 1

Compound (1) with a molecular formula C41H60O8N presents one methylene less and one oxygen more than 13-desMethyl-spirolide C (C42H62O7N). Its CID spectrum displays a molecular ion cluster that shows four subsequent water losses, whereas the CID spectrum of 13-desMethyl-spirolide C only shows three water losses (Figure 2A,B). This confirms the presence of an additional hydroxyl group in (1). Moreover, in contrast to 13-desMethyl-spirolide C, the A-type fragment cluster of (1) was down-shifted of 16 Da (Figure 2A,B), which clearly indicated that the additional hydroxyl group must be in the C1 to C11 part of the molecule (
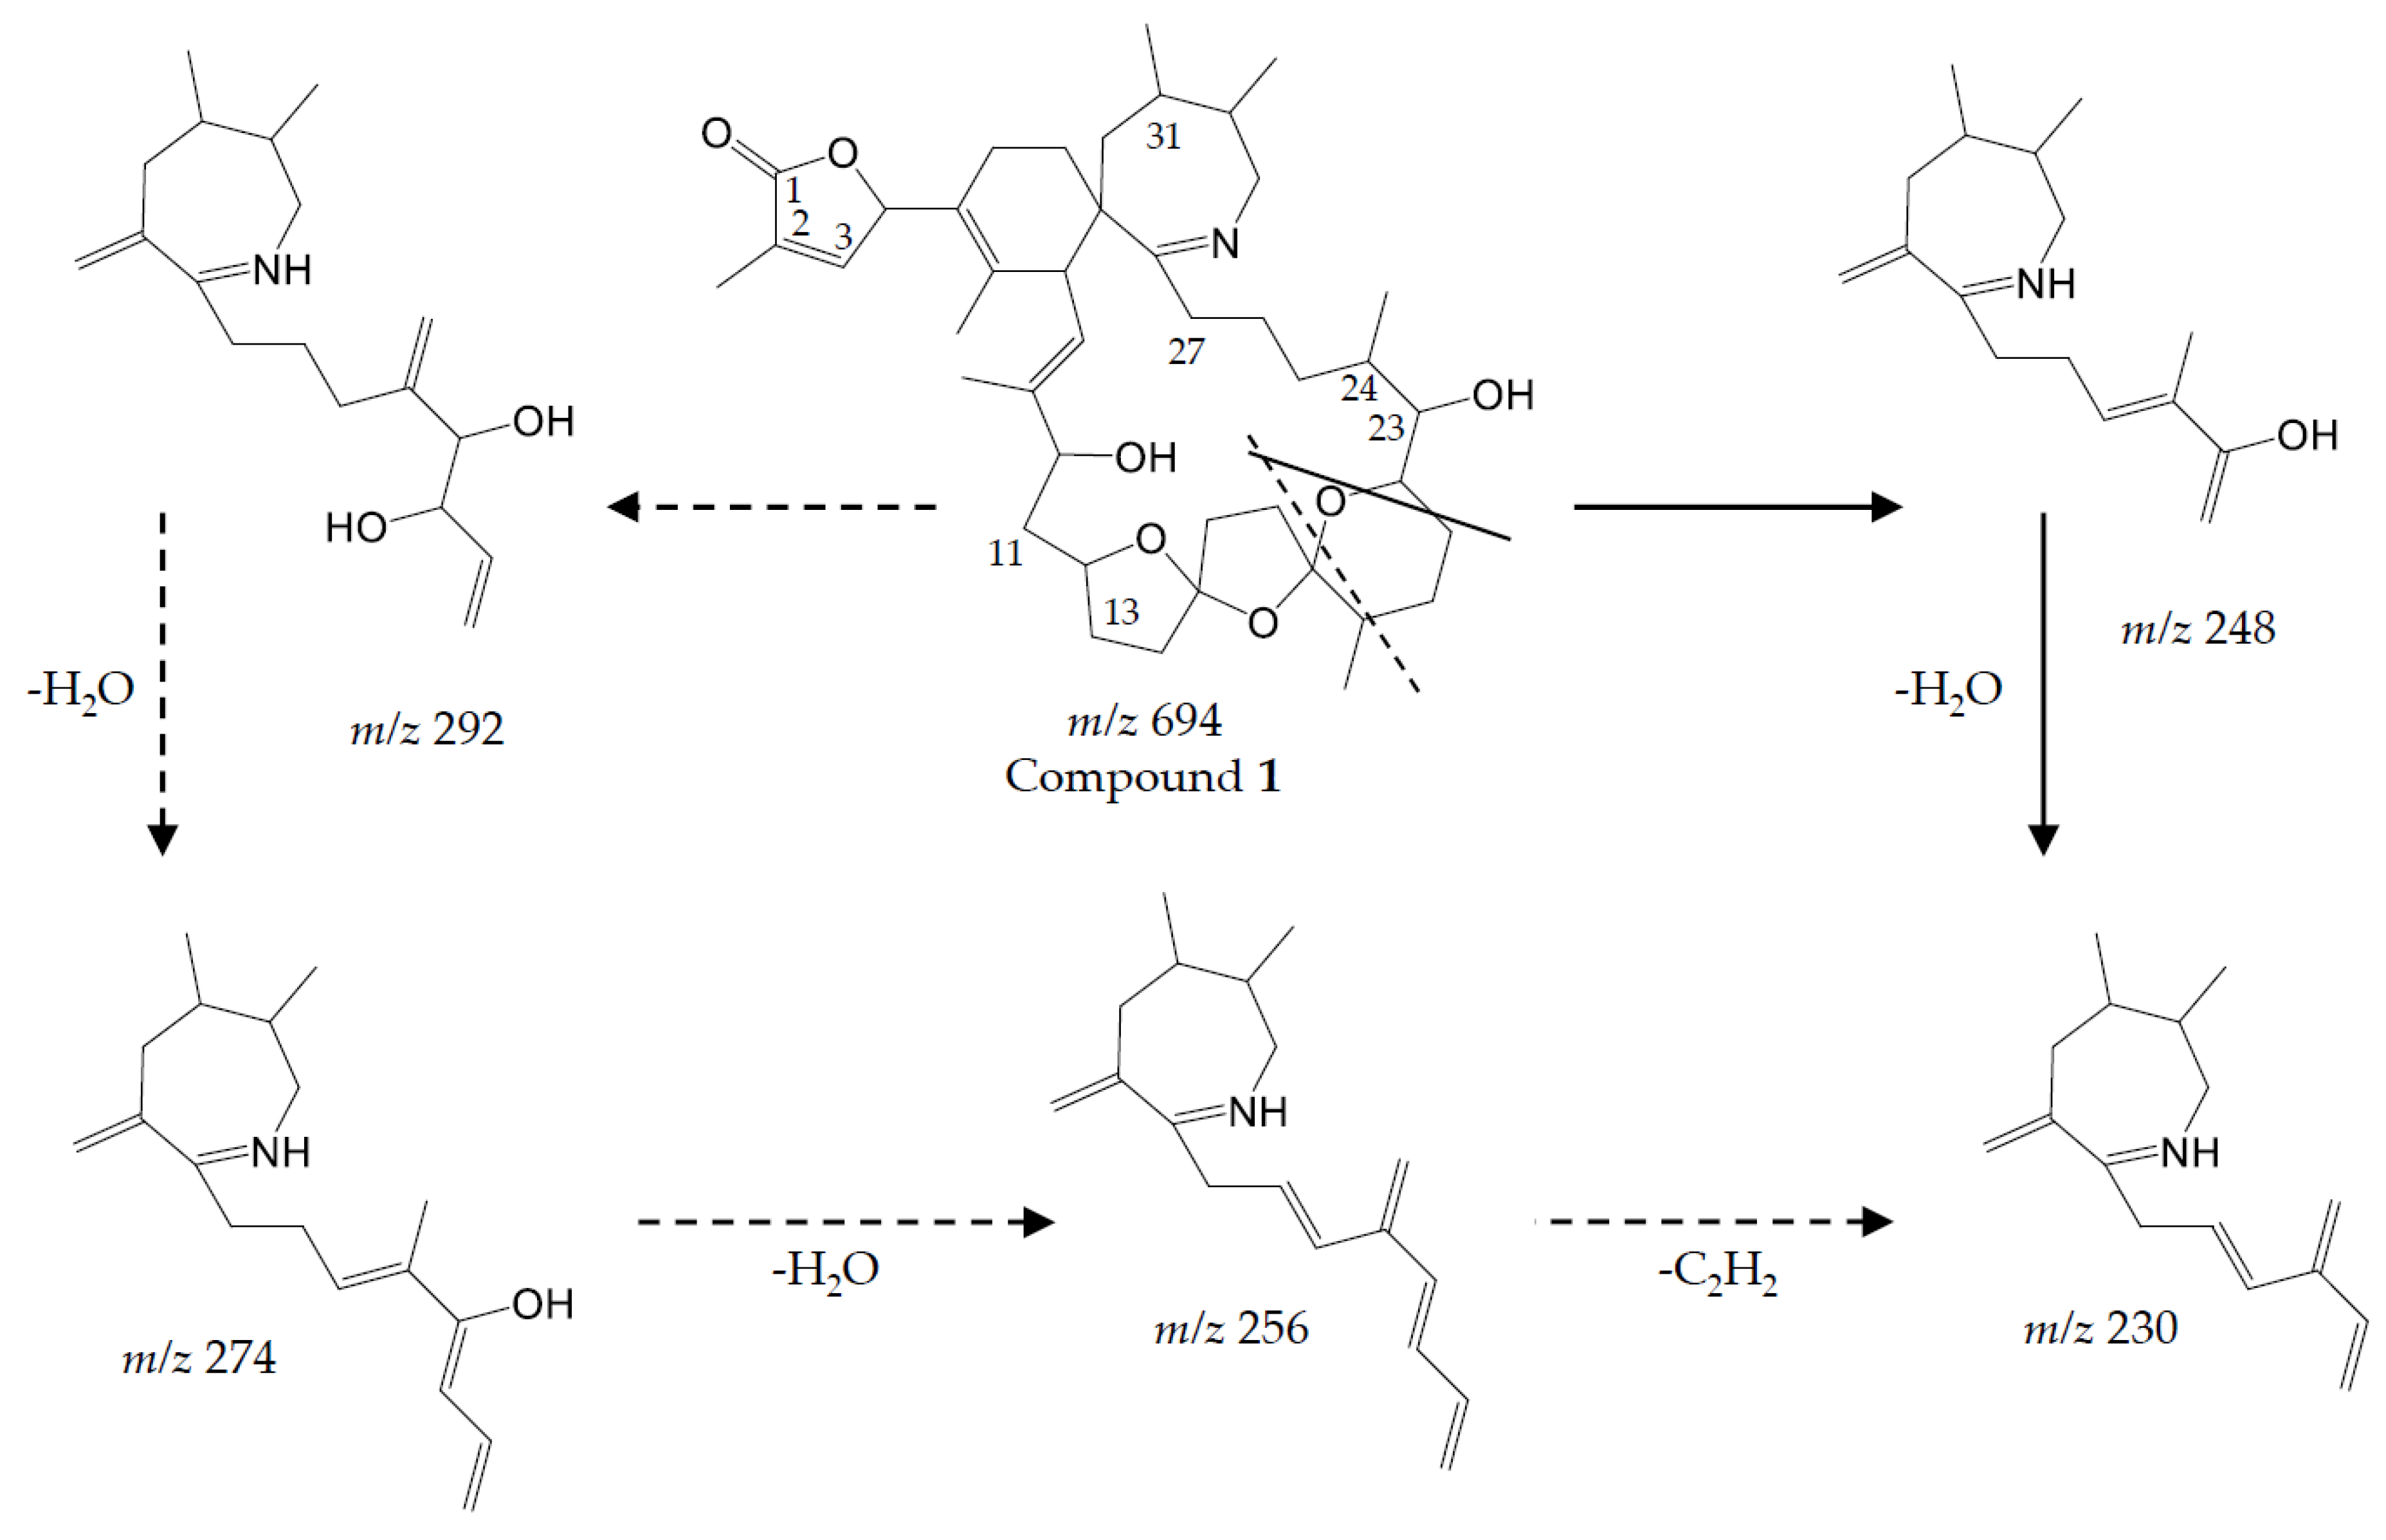
Figure 5). On the other hand, the spectrum of (1) showed an additional cluster including ions at m/z 230, 248, 256, 274 and 292 (Figure 2B) that is typically not observed in CID spectra of SPX. This unusual formation of the m/z 248 fragment can be explained by the typical SPX ether ring cleavage (solid line in Figure 5) including an additional hydroxyl group at the C22–C27 part of the structure. However, in contrast to 27-Hydroxy-13-desMethyl-spirolide C, (1) does not produce a m/z 180 fragment and 27-Hydroxy-13-desMethyl-spirolide C does not produce the above-mentioned atypical ion cluster observed in (1) (Figure 2D) indicating that the hydroxylation cannot be at the C27 position. On the other hand, the fragments m/z 292, 274 and 256 can be explained by a modified cleavage of the ether ring (dashed lines in Figure 5). Such a modification requires a different chemistry in close vicinity of the ether ring, which argues for a hydroxylation at C22 or C23. In summary, interpretation of the CID fragments versus those of 13-desMethyl-spirolide C indicates the presence of a hydroxyl group between C1 and C11 and another one most likely at C23. The structure of (1) would thus be consistent with the structure of 11,23-diHydroxy-19-deHydroxy-13,19-didesMethyl-spirolide C.

Compound 2

The CID spectrum of (2) (Figure 2C) is identical to that of (1) (Figure 2B) except for a 2 Da up-shift (Table 5) of the molecular ion cluster. This indicates a reduction of a double bond in the part of the molecule between C1 and C12. In this part of the molecule, there are two double bonds that may be reduced: Δ2,3 and Δ8,9. Since a reduction of the double bond in the butenolide ring (C2/3) of the molecule has been observed in other SPX-like compounds such as spirolide B and D, which are 2,3-reduced forms of spirolides A and C [20], it is thus reasonable to assume that (2) is the Δ2,3 reduced form (instead of the Δ8,9) of compound (1).

Compound 3

Compound (3) displays an identical CID spectrum as 13-desMethyl-spirolide C (Figure 2E) except for the pseudo molecular ion cluster, which is up-shifted of 18 Da. This and the elemental formula of C42H64O8N (Table 5) indicate a reduction of a double bond and a hydroxylation in the C1 to C11 part of the molecule in comparison to 13-desMethyl-spirolide C (C42H62O7N), or even an opening of the lactone ring, which, however, has never been observed so far. However, due to lacking fragmentation of this part of the molecule, the positions of these modifications cannot be determined by mass spectral analyses.

Compound 4

In contrast, the C1 to C11 part of (4) is identical with 13-desMethyl-spirolide C as mass differences from the pseudo molecular ions and the A-type fragments of both compounds are identical (230 Da; 692–462 and 720–490) (Figure 2A,F). The mass difference between (4) and 13-desMethyl-spirolide C is 28 Da and corresponds to two methylene groups, which, in comparison to 13-desMethyl-spirolide C, could be two additional methyl groups in the C12 to C33 part of the molecule, extensions of the carbon chain or a combination of both. Since no other fragments are formed, a more precise localization of these modifications is not possible by mass spectrometry alone.

Compound 5

Compound (5) in turn shows an identical CID spectrum as (4), except for an up-shift of 2 Da of the pseudo molecular ion cluster (Figure 2F,G). Like in the case of (1) and (2) as discussed above, this mass shift most likely results from a reduction of one of the two double bonds (Δ2,3 or Δ8,9).

4.2.2. Gymnodimines

In addition to the seven SPX, the Dutch strains produced at least four different GYM. Reports about the occurrence of both SPX and GYM in A. ostenfeldii are relatively recent, with the first record of 12-Me-GYM A being reported in A. ostenfeldii strains from the U.S. [26]. Gymnodimine A first has been isolated from shellfish harvested in New Zealand [31], and consequently from a toxic Gymnodinium sp. [50], but were first reported in A. ostenfeldii from The Netherlands [32], and preliminarily had been detected in Canadian A. ostenfeldii [51].
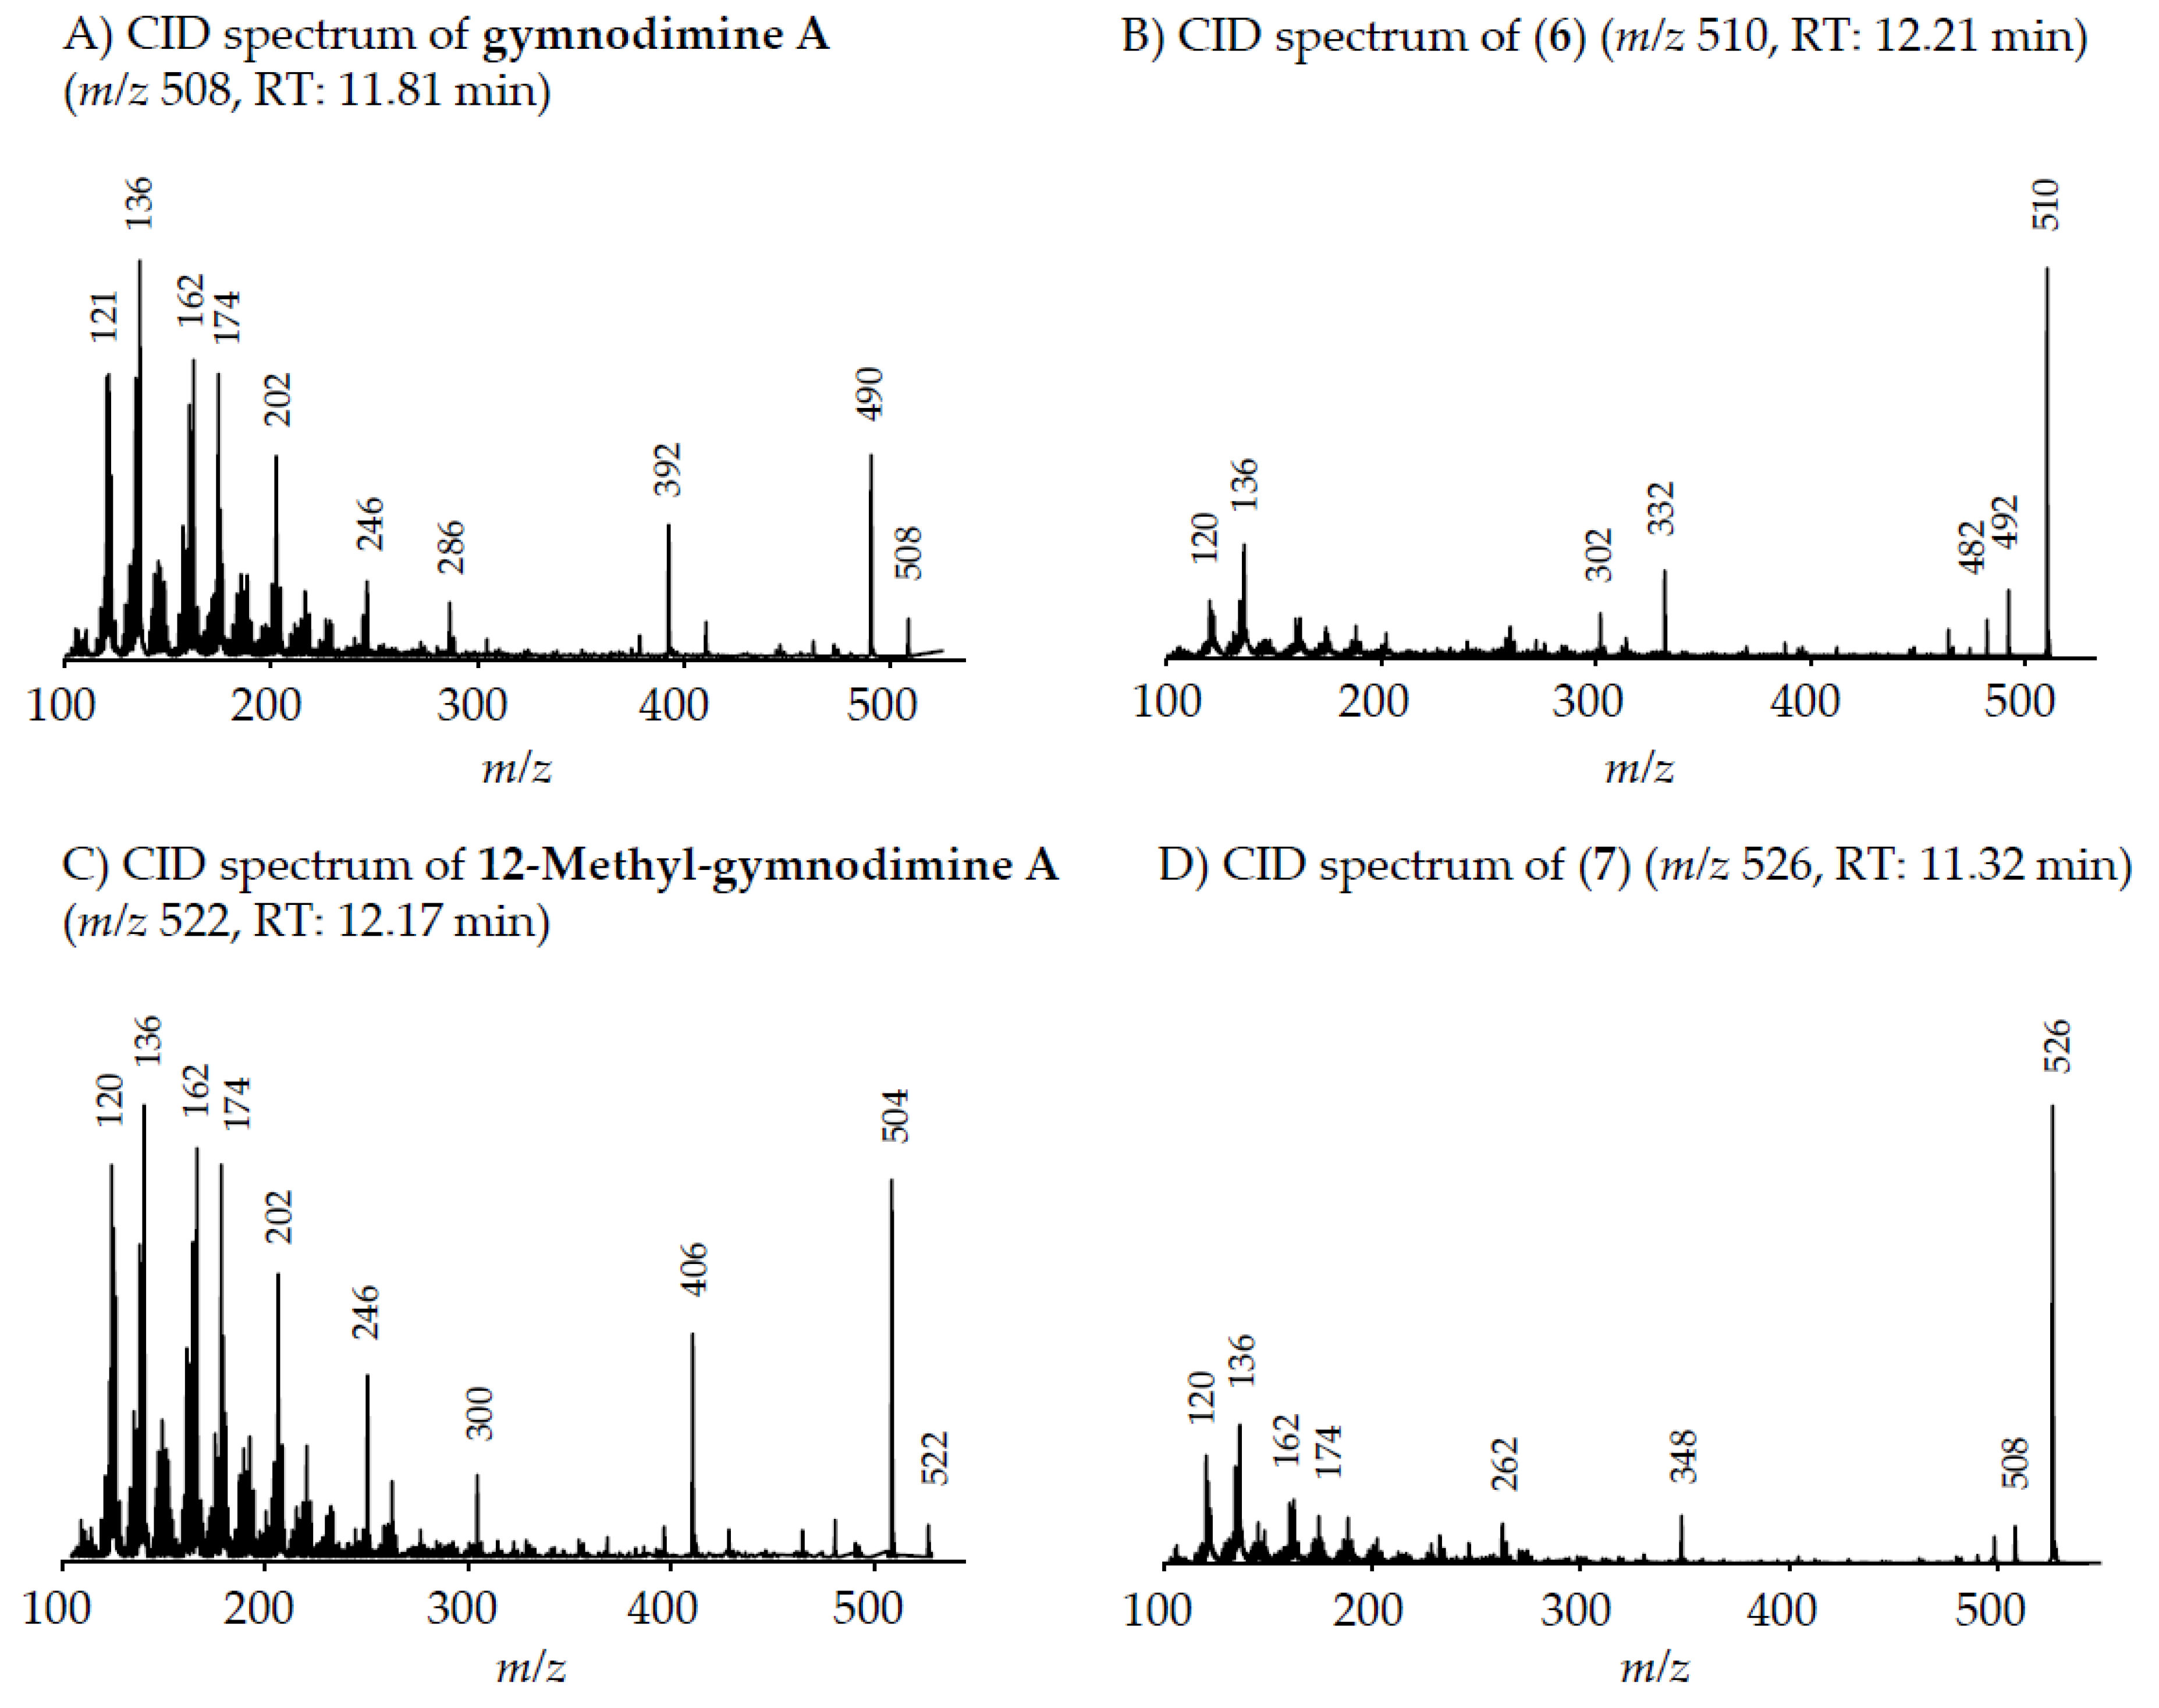
Two of the gymnodimines of the Dutch A. ostenfeldii (GYM A and 12-Me-GYM A) have been described in the previous analysis of the same population [32]. However, our in-depth analysis revealed the presence of two additional gymnodimines so far unreported. While GYM A and 12-Me-GYM A were unambiguously identified by comparison to the reference standards, evidence for the classification of compounds (6) and (7) as GYM is that they elute within a small retention time window and that they fall in the same mass range. Most importantly, the CID spectra of GYM A and 12-Me-GYM A on the one hand, and those of (6) ([M + H]+ m/z 510) and (7) ([M + H]+ m/z 526) on the other hand, share common features. CID spectra of GYM are not very characteristic, but they show several low-mass fragment ion clusters at m/z 120, 136, 162, 174 and 202 with m/z 136 being the most abundant of the aforementioned ions (Figure 3A,C). These patterns are shared among all four spectra, which indicate a chemical similarity between all four compounds. Especially, (6) and (7) show almost identical spectra except for an up-shift of 16 Da of the fragments above m/z 300, indicating that (7) is a hydroxylated form of (6) (
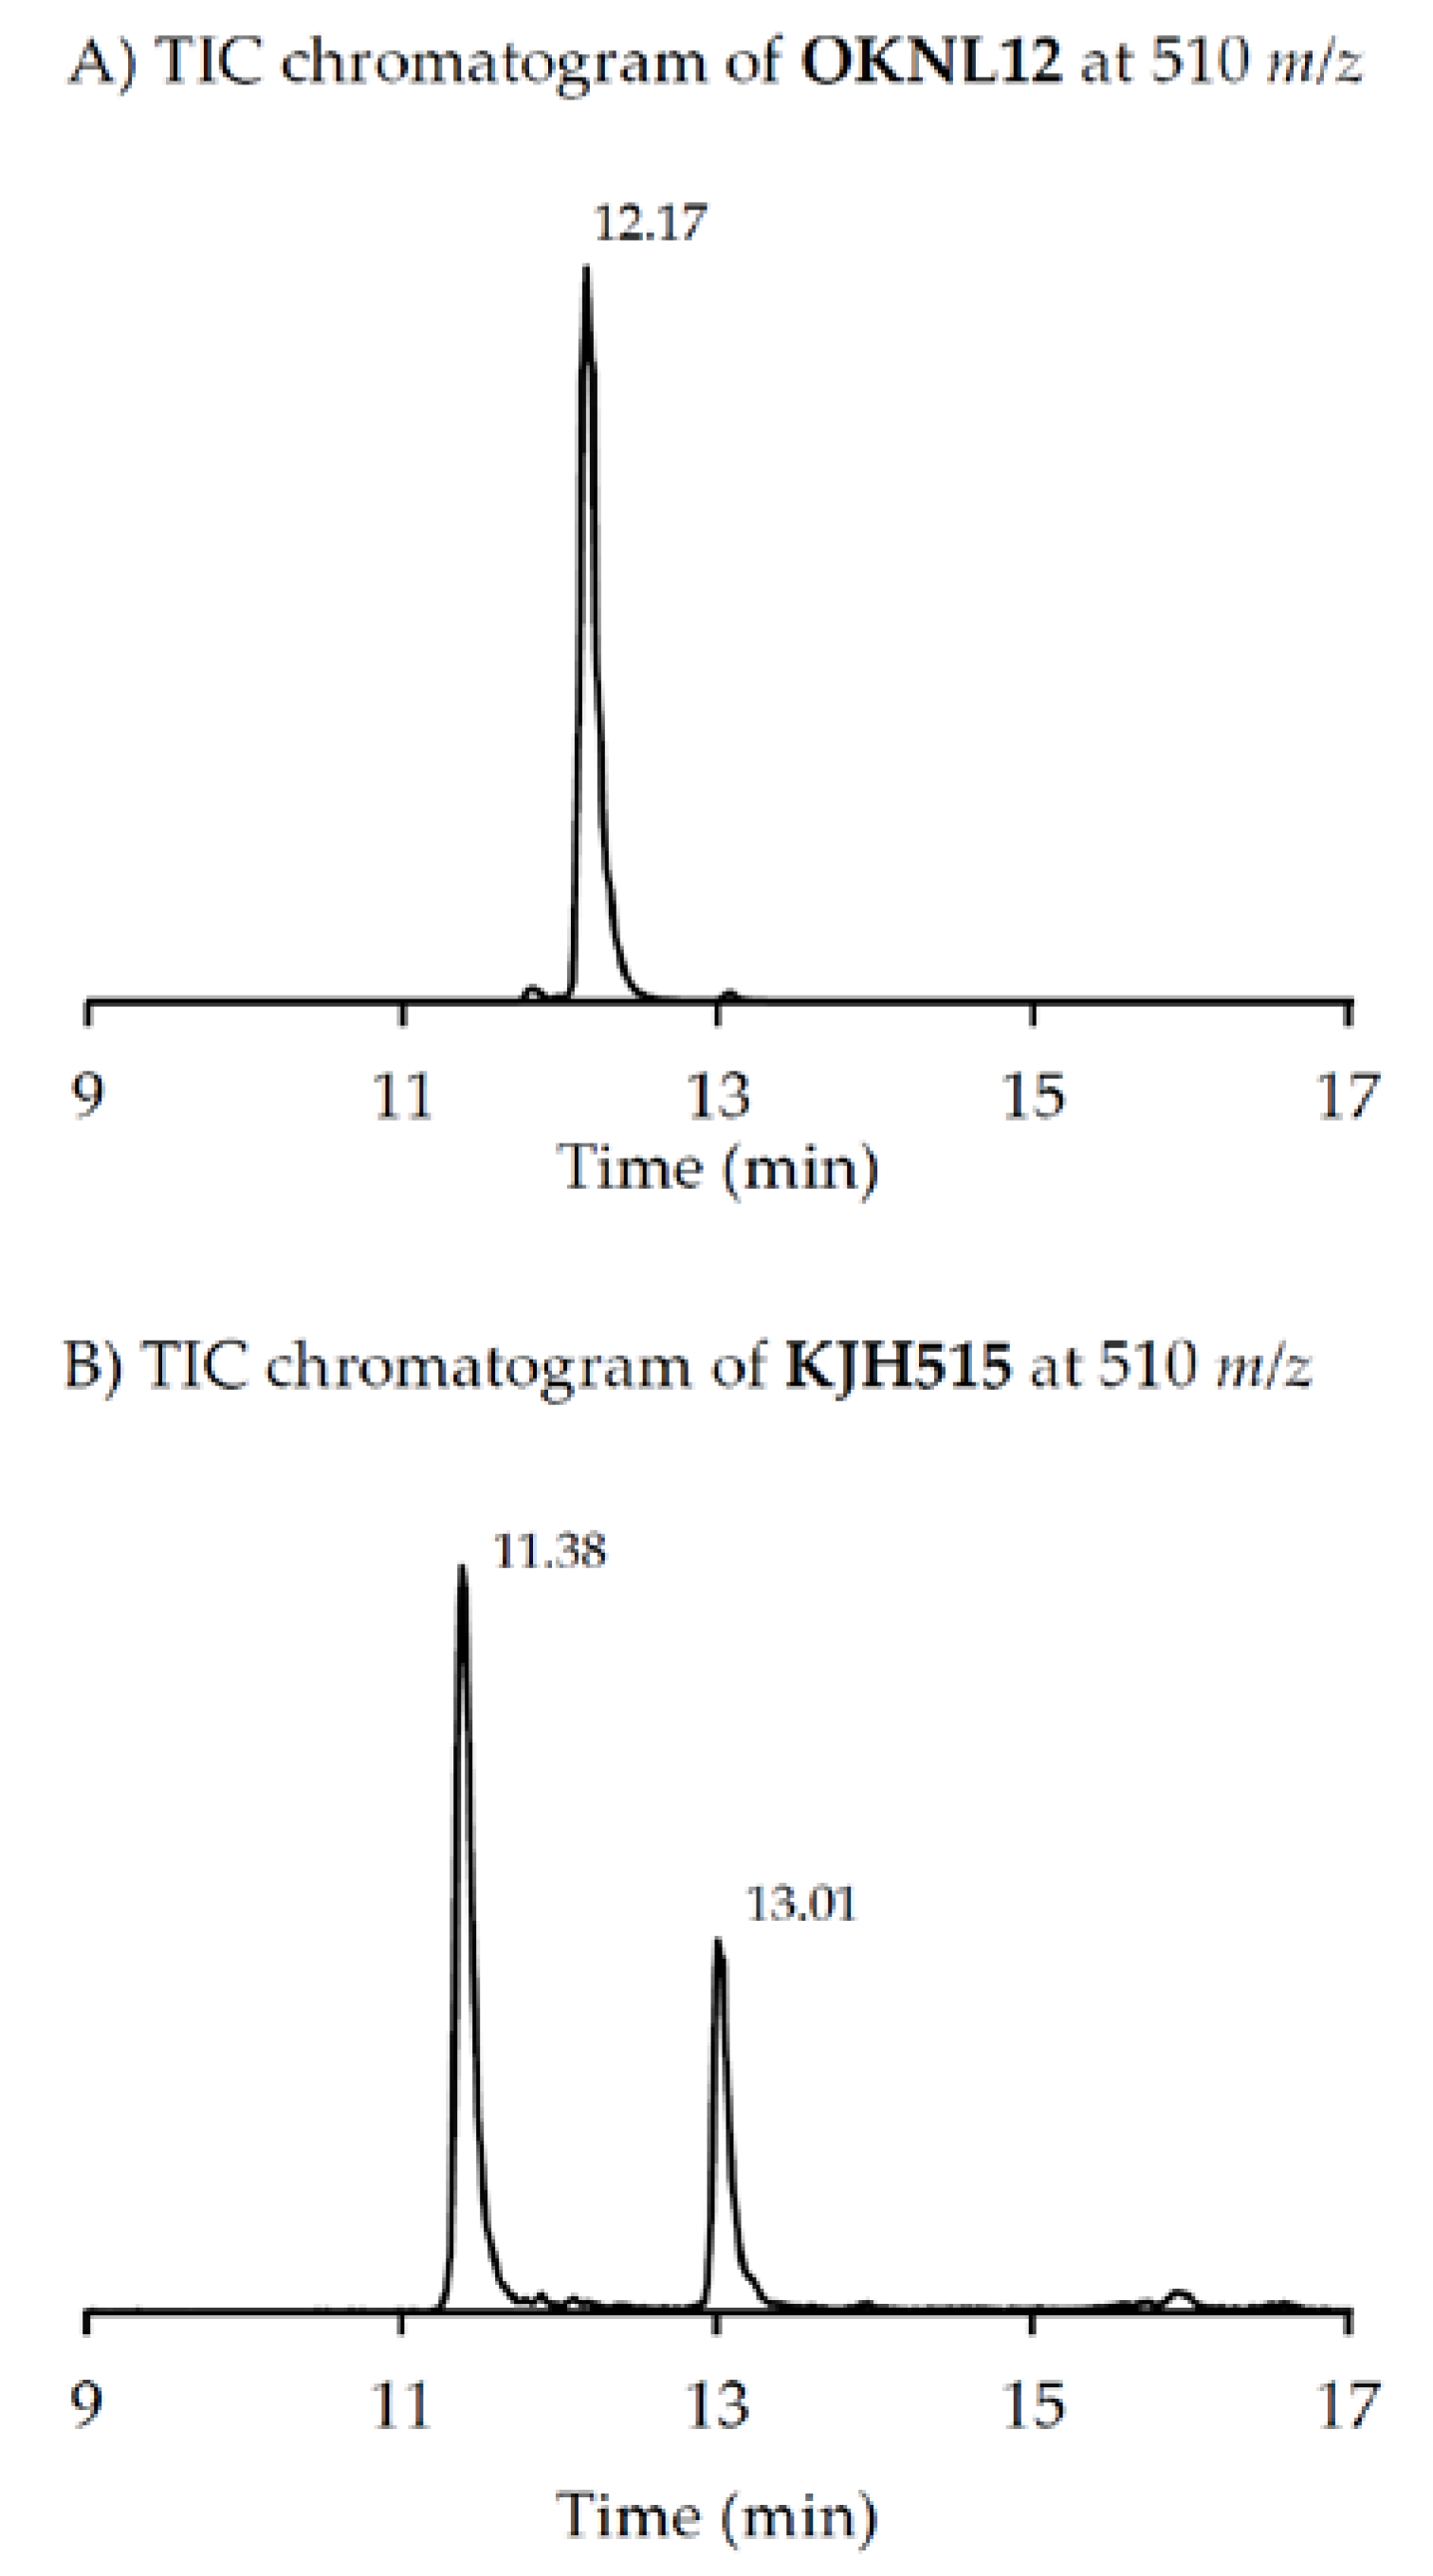
Figure 3B,D). Besides the new GYM D (m/z 524), very recently two other GYM analogues with m/z 510 (without structural elucidation) have been found in Baltic strains of A. ostenfeldii [33], but the compound of the Dutch strains is a third compound as it can be chromatographically separated from the other two analogues (Figure 6). Comparison of the mass spectrum of (6) with that of gymnodimine D [33] showed very close similarities. Interestingly, (6) (major compound) has a mass difference of 14 Da to gymnodimine D ([M+H]+ at m/z 524) (Figure 3B; [33]). Furthermore, intense product ions were detected at m/z 332 and 302 (Figure 2B), which correspond to the typical product ions at m/z 346 and 316 detected for gymnodimine D [33] also with a 14 Da mass difference. The difference between the compounds must be located between carbons 16–21 in gymnodimine D, and (6) apparently is a gymnodimine D analogue with one carbon shorter chain in the macrocyclic ring or a demethylated gymnodimine D.

4.3. Qualitative and Quantitative Variability among Strains

As discussed before, structural diversity of spiroimines within the population was high. Moreover, variability in spiroimine profiles among strains was high. Whereas some spiroimines (2 out of 11, namely 13-desMeC SPX and compound 6) were present in all strains, the majority (9 out of 11) was lacking in a few strains (Appendix A, Table A4). The most plausible reason for the presence of different spiroimines in different A. ostenfeldii strains is a differing presence and/or expression of biosynthetic genes in these strains, but the possibility that some low-expressed spiroimines were below the detection limit in some strains cannot be ruled out (Appendix A, Table A1 and Table A2).
Notably, the spiroimines which were detected in most strains include both quantitatively dominant compounds (e.g., 6) and minor compounds (e.g., 3). On the other hand, congeners not detectable in all strains include compounds generally low in quantity (e.g., 5) or compounds (e.g., 2) that were found in just a few strains, and at times being a dominant compound (Table 4, Figure 4).
Most importantly, a new gymnodimine that was the most abundant spiroimine was detected in the Dutch A. ostenfeldii. This major GYM (6) previously had been overlooked due to the targeted approach of the Selected Reaction Monitoring (SRM) that only detects compounds that a priori are included in the analyte list. However, the detection of GYM D and numerous related compounds [33] with a more sensitive Orbitrap mass spectrometer in the full scan mode prompted us to search for these compounds as well. Under the assumption of an identical molar response of (6) and GYM A, the maximum cell quota of (6) reached up to 274 pg cell−1 (GYM A equivalents), which corresponds to a 10 to 1000-fold higher cell quota of the various strains than the two gymnodimines reported before. This convincingly shows that qualitative and quantitative comparisons of spiroimines of different A. ostenfeldii strains depend on the analytical depth with which samples are analysed and the compatibility of the applied methods.
A high diversity and large intraspecific variability of cell quotas suggests that none of the spiroimine compounds has a vital role in primary cell metabolism, but that they are secondary metabolites. It is difficult to determine the evolutionary drivers for such a high diversity and variability of spiroimines as their ecological function remains unknown. It has been suggested that gymnodimines and spirolide share a common biosynthetic pathway [26], which may be an indication for a common function of both toxin classes. The toxic effect on vertebrates has been shown to be dependent of the cycloimine moiety of the molecules [21]. When the cycloimine function is cleaved by hydrolysis, the compounds lose their toxicity. However, the cycloimine moiety apparently is not the only pre-requisite for toxicity: It has been shown [25] that spirolides H and I were non-toxic, even though they possessed the cycloimine moiety. However, these two spirolides consisted only of a dispiroketal ring system in the macrocycle instead of a trispiroketal system as in all the other spirolides. This is clear evidence that, in the case of spirolides, toxicity does not depend on a single structural element alone. On the other hand, it should be considered that vertebrate toxicity most likely is not the true ecological function of spiroimines but rather is a coincidental side effect. The presence of high amounts of complex molecules requiring elaborate synthesis machinery implies that there should be a role or benefit for the producing cell. However, clear evidence for such a role of spiroimines, e.g., in interactions with potential grazers or competitors, is lacking.
Whatever the role and function of spiroimines is, structural variability does not seem to fundamentally influence it; otherwise, one would expect more conserved structures. High structural variability is certainly not an exclusive feature of spiroimines. For example, 93 structural yessotoxin variants were found in one strain of Protoceratium reticulatum [52], and numerous analogues of azaspiracids have been detected in different strains of Amphidomataceae [53]. Modifications of the, in most cases conserved, polyketide backbone include methylations and demethylations, hydration of double bonds or additional unsaturations, hydroxylations and dehydroxylations, to name the most common ones. In some cases, chain extensions or shortenings have also been observed. In a few cases, glycosylations [52] and phosphorylations [54] were reported.
As a general conclusion, our results, together with other recent reports on A. ostenfeldii [11,33], point out that spiroimines diversity in A. ostenfeldii probably is underestimated and deserves increased attention, and that, for comparison, A. ostenfeldii strains from other locations should be analysed with comparable methods and analytical depth. For the new and abundant spiroimine congeners, information on their toxicity is needed to evaluate their potential risk for human health. Finally, our multi-strain study revealed that studying one or a very few strains of a microalgal population is of limited suitability to fully describe secondary metabolite diversity and variability.

Acknowledgments

We thank Dedmer van de Waal for providing the field bloom sample from which the A. ostenfeldii strains used in the present study were isolated. Thanks to Wolfgang Drebing for technical support in spiroimine analysis, as well as to Annegret Müller for PST measurements. Financial support was provided by the PACES research program of the Alfred Wegener Institute as part of the Helmholtz Foundation initiative in Earth and Environment and K.H. has received funding from the Academy of Finland (project 251609).

Author Contributions

Urban Tillmann and Bernd Krock conceived and designed the experiments; Helge Martens and Urban Tillmann performed the experiments, Carmela Dell’Aversano and Luciana Tartaglione contributed LC–HRMS measurements; Kirsi Harju contributed Orbitrap Fusion measurements; Helge Martens, Carmela Dell’Aversano, Luciana Tartaglione, Kirsi Harju and Bernd Krock analyzed the data; Bernd Krock, Urban Tillmann and Helge Martens wrote the paper.

Conflicts of Interest

The authors declare no conflict of interest.

Appendix A

Table A1. Mean limits of detection (LOD, S/N = 3) for PST based on mean cell numbers of the analyzed strains. Values are expressed in fg cell−1.
StandardLOD
C1/25.1
GTX 22.2
B19.4
GTX 32.5
STX2.1
Table A2. Mean limits of detection (LOD, S/N = 3) for spiroimines based on mean cell numbers of the analyzed strains. Values are expressed in fg cell−1.
StandardLOD
13-desMe C13.7
GYM A290.3
Table A3. Cell quotas of PST. Values are expressed in pg cell−1.
StrainC1/C2B1GTX2/3STXTotal
OKNL-1140.880.795.636.8154.11
OKNL-1230.930.194.460.7136.29
OKNL-1331.890.315.351.1438.69
OKNL-1454.900.417.981.0664.35
OKNL-1544.190.335.792.0052.31
OKNL-1619.500.262.413.4125.58
OKNL-1742.310.364.021.0447.73
OKNL-1830.810.215.310.7637.09
OKNL-1969.140.489.652.5081.77
OKNL-2049.660.235.151.4456.48
OKNL-2160.810.428.062.2371.52
OKNL-2266.580.4112.661.9181.56
OKNL-2327.590.243.790.9832.60
OKNL-2435.420.333.581.7741.10
OKNL-2547.45<LOD7.900.9156.26
OKNL-2638.410.326.981.3647.07
OKNL-2767.420.3910.672.7381.21
OKNL-2866.960.566.132.2775.92
OKNL-2929.690.367.781.9139.74
OKNL-3049.230.685.624.4059.93
OKNL-3124.070.402.782.1929.44
OKNL-3240.880.476.781.3449.47
OKNL-3344.760.595.252.1352.73
OKNL-3418.450.262.790.8822.38
OKNL-3545.520.674.452.2352.87
OKNL-3632.810.244.711.3139.07
OKNL-3736.840.254.000.5141.60
OKNL-3827.960.284.901.4734.61
OKNL-3933.090.224.850.6838.84
OKNL-4045.900.226.832.0755.02
OKNL-4115.190.231.620.8217.86
OKNL-4234.360.274.441.3840.45
OKNL-4350.540.685.893.0660.17
OKNL-4435.870.335.021.8943.11
OKNL-4525.690.283.581.0230.57
OKNL-4632.840.225.901.1240.08
OKNL-4746.640.685.853.4156.58
OKNL-4836.290.514.921.4443.16
OKNL-4939.510.545.781.7047.53
OKNL-5053.190.946.141.6361.90
OKNL-5141.870.886.802.2151.76
OKNL-5232.790.564.121.2738.74
OKNL-5374.360.5411.721.5388.15
OKNL-5432.960.607.181.1841.92
OKNL-5532.090.493.602.5338.71
OKNL-5653.760.8312.352.1369.07
OKNL-5713.630.542.700.6717.54
OKNL-5843.630.507.930.9152.97
OKNL-5924.790.513.612.1431.05
OKNL-6022.330.413.971.3228.03
OKNL-6129.570.474.291.2135.54
OKNL-6219.530.193.180.5223.42
OKNL-6343.440.696.010.4850.62
OKNL-6457.140.8012.782.3173.03
OKNL-6559.240.779.032.9371.97
OKNL-6624.360.454.841.2330.88
OKNL-6744.260.637.631.0153.53
OKNL-687.200.506.791.6516.14
OKNL-6946.470.7110.851.0359.06
OKNL-7030.940.395.151.1337.61
OKNL-7159.850.7011.353.1275.02
OKNL-7223.020.493.500.5227.53
OKNL-7318.450.603.052.5624.66
OKNL-749.000.221.760.3711.35
OKNL-7530.150.192.670.5633.57
OKNL-7632.890.333.850.9237.99
OKNL-7712.500.121.510.4814.61
OKNL-7829.990.244.320.7235.27
Table A4. Cell quotas of spiroimines. Values are expressed in fg cell−1.
StrainGYM A12-Me-GYM A13-desMe C(1)(2)27-Hydroxy-13-desMe C(3)(4)(5)(6)(7)Total
OKNL-11928<LOD343<LOD<LOD281815262200,6174085206,233
OKNL-12728215485463<LOD<LOD7655<LOD<LOD197,58926,529238,542
OKNL-13<LOD<LOD303<LOD<LOD<LOD<LOD<LOD<LOD121,491<LOD121,794
OKNL-1433951073408<LOD<LOD243612363150,0607675162,857
OKNL-1516,658<LOD1586<LOD<LOD4235<LOD<LOD223,220<LOD241,541
OKNL-161477361255<LOD<LOD<LOD165831115,8862421120,505
OKNL-1710,047<LOD280<LOD<LOD<LOD27<LOD27197,2914821212,493
OKNL-184041603392<LOD<LOD1828<LOD48194,4802935202,545
OKNL-194518123510125<LOD<LOD16<LOD<LOD176,7323785186,412
OKNL-2015,520<LOD314<LOD<LOD3437<LOD<LOD268,80510,896295,606
OKNL-2119074319423<LOD<LOD<LOD<LOD<LOD86,686228891,429
OKNL-2212,383<LOD302<LOD<LOD161813958199,7291245213,890
OKNL-235901<LOD213<LOD<LOD<LOD14834063,36613,07982,696
OKNL-24<LOD<LOD157<LOD<LOD<LOD15<LOD<LOD150,6582455153,285
OKNL-251474<LOD312<LOD<LOD<LOD256123118,4222125122,442
OKNL-261203<LOD20<LOD<LOD<LOD<LOD5231140,9222672144,900
OKNL-27<LOD<LOD1401<LOD<LOD252213953208,334528210,502
OKNL-28<LOD<LOD149<LOD<LOD221414655274,020788275,194
OKNL-291005319114<LOD<LOD<LOD14411674,436181377,758
OKNL-3011,024<LOD75<LOD<LOD<LOD<LOD<LOD<LOD121,534<LOD132,633
OKNL-31986<LOD521<LOD<LOD<LOD<LOD531973,498147376,550
OKNL-32943<LOD459<LOD<LOD<LOD21451986,256147989,222
OKNL-334641898192<LOD<LOD18<LOD8032121,7492230129,840
OKNL-341721579620<LOD<LOD<LOD23693598,6431907103,597
OKNL-35308<LOD2124470921556019174261,7235365271,291
OKNL-361351<LOD452<LOD<LOD<LOD157637122,7141553126,198
OKNL-374374857681<LOD<LOD14161075375,678229584,075
OKNL-3813684351954<LOD<LOD<LOD18813993,132181798,844
OKNL-394874<LOD448<LOD<LOD<LOD16<LOD<LOD93,171<LOD98,509
OKNL-40<LOD<LOD1184<LOD<LOD152618273215,4062539219,425
OKNL-411606356300<LOD<LOD<LOD14562694,071183698,265
OKNL-42486311102921<LOD<LOD4958276143226,3439711245,474
OKNL-4318,125<LOD502<LOD<LOD2827266105232,6671772253,492
OKNL-4412,242<LOD356<LOD<LOD273819277163,6533179179,764
OKNL-4537838032496<LOD<LOD2647<LOD<LOD139,8281668148,651
OKNL-467499<LOD700<LOD<LOD<LOD<LOD<LOD<LOD76,279248086,958
OKNL-47623312632026<LOD<LOD4319<LOD<LOD134,6435576149,803
OKNL-489668<LOD138760911362117<LOD<LOD104,5903871121,299
OKNL-4916,028<LOD709<LOD<LOD182126498202,7181393221,249
OKNL-501053<LOD930285<LOD215320888197,4936347206,478
OKNL-515840<LOD287<LOD<LOD<LOD<LOD662398,564948105,728
OKNL-523384588857<LOD<LOD173812051117,7634273127,091
OKNL-5358458791622<LOD<LOD425021674190,8462657202,231
OKNL-541627485694<LOD<LOD<LOD23562993,308<LOD96,222
OKNL-5512,160<LOD2041<LOD<LOD182815667114,1015323133,894
OKNL-5614,775<LOD996<LOD<LOD224813244127,7445740149,501
OKNL-571267343802<LOD<LOD<LOD17<LOD<LOD53,936152357,888
OKNL-58363712232789<LOD<LOD3754206107159,4955243172,791
OKNL-5933407102774<LOD<LOD2622<LOD<LOD120,1103369130,351
OKNL-602020436977<LOD<LOD<LOD19<LOD<LOD73,686197479,112
OKNL-612213608988<LOD<LOD19<LOD<LOD<LOD91,097248497,409
OKNL-622899<LOD593<LOD<LOD<LOD<LOD442361,320173066,609
OKNL-632588725215<LOD<LOD<LOD20<LOD<LOD114,407943118,898
OKNL-64<LOD<LOD2083<LOD<LOD223619473180,4777084189,969
OKNL-65<LOD<LOD280<LOD<LOD<LOD3710844162,6643674166,807
OKNL-663875<LOD326<LOD<LOD<LOD<LOD472165,556179871,623
OKNL-67<LOD<LOD1012<LOD<LOD172111740149,9443865155,016
OKNL-686673<LOD2775968<LOD1934<LOD<LOD117,0311174128,674
OKNL-695131728158<LOD<LOD1823<LOD<LOD175,5496465188,072
OKNL-7030626832940567<LOD233514866128,4844025140,033
OKNL-71<LOD2951102<LOD<LOD245613446198,9471074201,678
OKNL-721114337606<LOD<LOD<LOD14462347,89295350,985
OKNL-737290<LOD1486<LOD<LOD2527953482,527260994,093
OKNL-742771<LOD265<LOD<LOD<LOD<LOD562736,980100941,108
OKNL-752878593425<LOD<LOD1620<LOD<LOD128,4122731135,075
OKNL-76<LOD<LOD487<LOD<LOD141410243158,3034002162,965
OKNL-772195397416<LOD<LOD<LOD<LOD341545,188106849,313
OKNL-787656<LOD82<LOD<LOD<LOD<LOD592787,556296898,348

References

  1. Hallegraeff, G.M. Ocean Climate Change, Phytoplankton Community Responses, and Harmful Algal Blooms: A Formidable Predictive Challenge. J. Phycol. 2010, 46, 220–235. [Google Scholar] [CrossRef]
  2. Glibert, P.; Anderson, D.; Gentien, P.; Granéli, E.; Sellner, K. The Global, Complex Phenomena of Harmful Algal Blooms. Oceanography 2005, 18, 136–147. [Google Scholar] [CrossRef]
  3. Wołoszyńska, J.; Conrad, W. Pyrodinium phoneus, sp., agent de la toxicité des moules de canal maritime de Bruges Zeebrugge. Bull. Mus. Roy. Hist. Nat. Belg. 1939, 15, 1–5. [Google Scholar]
  4. Balech, E. The Genus Alexandrium Halim (Dinoflagellata); Sherkin Island, Co.: Cork, Ireland, 1995; p. 151. [Google Scholar]
  5. Kremp, A.; Tahvanainen, P.; Litaker, W.; Krock, B.; Suikkanen, S.; Leaw, C.P.; Tomas, C.; Clerck, O. Phylogenetic relationships, morphological variation, and toxin patterns in the Alexandrium ostenfeldii (Dinophyceae) complex: Implications for species boundaries and identities. J. Phycol. 2014, 50, 81–101. [Google Scholar] [CrossRef] [PubMed]
  6. Balech, E.; Tangen, K. Morphology and taxonomy of toxic species in the tamarensis group (Dinophyceae): Alexandrium excavatum (Braarud) comb. nov. and Alexandrium ostenfeldii (Paulsen) comb. nov. Sarsia 1985, 70, 333–343. [Google Scholar] [CrossRef]
  7. Cembella, A.D.; Lewis, N.I.; Quilliam, M.A. The marine dinoflagellate Alexandrium ostenfeldii (Dinophyceae) as the causative organism of spirolide shellfish toxins. Phycologia 2000, 39, 67–74. [Google Scholar] [CrossRef]
  8. Sánchez, S.; Villanueva, P.; Carbajo, L. Distribution and concentration of Alexandrium peruvianum (Balech and de Mendiola) in the Peruvian coast (03°24′–18°20′ LS) between 1982–2004. In Proceedings of the XI International Conference on Harmful Algal Blooms, Cape Town, South Africa, 15–19 November 2004. [Google Scholar]
  9. Almandoz, G.O.; Montoya, N.G.; Hernando, M.P.; Benavides, H.R.; Carignan, M.O.; Ferrario, M.E. Toxic strains of the Alexandrium ostenfeldii complex in southern South America (Beagle Channel, Argentina). Harmful Algae 2014, 37, 100–109. [Google Scholar] [CrossRef]
  10. MacKenzie, L.; White, D.; Oshima, Y.; Kapa, J. The resting cyst and toxicity of Alexandrium ostenfeldii (Dinophyceae) in New Zealand. Phycologia 1996, 35, 148–155. [Google Scholar] [CrossRef]
  11. Tillmann, U.; Kremp, A.; Tahvanainen, P.; Krock, B. Characterization of spirolide producing Alexandrium ostenfeldii (Dinophyceae) from the western Arctic. Harmful Algae 2014, 39, 259–270. [Google Scholar] [CrossRef]
  12. Kremp, A.; Lindholm, T.; Dressler, N.; Erler, K.; Gerdts, G.; Eirtovaara, S.; Leskinen, E. Bloom forming Alexandrium ostenfeldii (Dinophyceae) in shallow waters of the Åland Archipelago, Northern Baltic Sea. Harmful Algae 2009, 8, 318–328. [Google Scholar] [CrossRef]
  13. Borkman, D.G.; Smayda, T.J.; Tomas, C.R.; York, R.; Strangman, W.; Wright, J.L.C. Toxic Alexandrium peruvianum (Balech and de Mendiola) Balech and Tangen in Narragansett Bay, Rhode Island (USA). Harmful Algae 2012, 19, 92–100. [Google Scholar] [CrossRef]
  14. Tomas, C.R.; van Wagoner, R.M.; Tatters, A.O.; White, K.D.; Hall, S.; Wright, J.L.C. Alexandrium peruvianum (Balech and Mendiola) Balech and Tangen a new toxic species for coastal North Carolina. Harmful Algae 2012, 17, 54–63. [Google Scholar] [CrossRef]
  15. Burson, A.; Matthijs, H.C.; de Bruijne, W.; Talens, R.; Hoogenboom, R.; Gerssen, A.; Visser, P.M.; Stomp, M.; Steur, K.; van Scheppingen, Y.; et al. Termination of a toxic Alexandrium bloom with hydrogen peroxide. Harmful Algae 2014, 31, 125–135. [Google Scholar] [CrossRef] [PubMed]
  16. Hansen, P.J.; Cembella, A.D.; Moestrup, Ø. The marine dinoflagellate Alexandrium ostenfeldii: Paralytic shellfish toxin concentration, composition, and toxicity to a tintinnid ciliate. J. Phycol. 1992, 28, 597–603. [Google Scholar] [CrossRef]
  17. Salgado, P.; Riobó, P.; Rodríguez, F.; Franco, J.M.; Bravo, I. Differences in the toxin profiles of Alexandrium ostenfeldii (Dinophyceae) strains isolated from different geographic origins: Evidence of paralytic toxin, spirolide, and gymnodimine. Toxicon 2015, 103, 85–98. [Google Scholar] [CrossRef] [PubMed]
  18. Cembella, A.D. Ecophysiology and metabolism of paralytic shellfish toxins in marine microalgae. In Physiological Ecology of Harmful Algal Blooms; Anderson, D.M., Cembella, A.D., Hallegraeff, G.M., Eds.; Springer: Berlin, Germany, 1998; pp. 381–403. [Google Scholar]
  19. Anderson, D.M.; Alpermann, T.J.; Cembella, A.D.; Collos, Y.; Masseret, E.; Montresor, M. The globally distributed genus Alexandrium: Multifaceted roles in marine ecosystems and impacts on human health. Harmful Algae 2012, 14, 10–35. [Google Scholar] [CrossRef] [PubMed]
  20. Hu, T.; Curtis, J.M.; Oshima, Y.; Quilliam, M.A.; Walter, J.A.; Watson-Wright, W.M.; Wright, J.L.C. Spirolides B and D, two novel macrocycles isolated from the digestive glands of shellfish. J. Chem. Soc. Chem. Commun. 1995, 2159–2161. [Google Scholar] [CrossRef]
  21. Hu, T.; Curtis, J.M.; Walter, J.A.; Wright, J.L. Characterization of biologically inactive spirolides E and F: Identification of the spirolide pharmacophore. Tetrahedron Lett. 1996, 37, 7671–7674. [Google Scholar] [CrossRef]
  22. Aasen, J.; MacKinnon, S.L.; LeBlanc, P.; Walter, J.A.; Hovgaard, P.; Aune, T.; Quilliam, M.A. Detection and identification of spirolides in Norwegian shellfish and plankton. Chem. Res. Toxicol. 2005, 18, 509–515. [Google Scholar] [CrossRef] [PubMed]
  23. Ciminiello, P.; Dell’Aversano, C.; Fattorusso, E.; Forino, M.; Grauso, L.; Tartaglione, L.; Guerrini, F.; Pistocchi, R. Spirolide Toxin Profile of Adriatic Alexandrium ostenfeldii Cultures and Structure Elucidation of 27-Hydroxy-13,19-Didesmethyl Spirolide C. J. Nat. Prod. 2007, 70, 1878–1883. [Google Scholar] [CrossRef] [PubMed]
  24. Ciminiello, P.; Dell’Aversano, C.; Iacovo, E.D.; Fattorusso, E.; Forino, M.; Grauso, L.; Tartaglione, L.; Guerrini, F.; Pezzolesi, L.; Pistocchi, R. Characterization of 27-hydroxy-13-desmethyl spirolide C and 27-oxo-13,19-didesmethyl spirolide C. Further insights into the complex Adriatic Alexandrium ostenfeldii toxin profile. Toxicon 2010, 56, 1327–1333. [Google Scholar] [CrossRef] [PubMed]
  25. Roach, J.S.; LeBlanc, P.; Lewis, N.I.; Munday, R.; Quilliam, M.A.; MacKinnon, S.L. Characterization of a Dispiroketal Spirolide Subclass from Alexandrium ostenfeldii. J. Nat. Prod. 2009, 72, 1237–1240. [Google Scholar] [CrossRef] [PubMed]
  26. Van Wagoner, R.M.; Misner, I.; Tomas, C.R.; Wright, J.L. Occurrence of 12-methylgymnodimine in a spirolide-producing dinoflagellate Alexandrium peruvianum and the biogenetic implications. Tetrahedron Lett. 2011, 52, 4243–4246. [Google Scholar] [CrossRef]
  27. Cembella, A.; Krock, B. Cyclic imine toxins: Chemistry, biogeography, biosynthesis and pharmacology. In Seafood and Freshwater Toxins: Pharmacology, Physiology, and Detection; Botana, L.M., Ed.; CRC Press: Boca Raton, FL, USA, 2008; pp. 561–580. ISBN 9781466505148. [Google Scholar]
  28. Gill, S.; Murphy, M.; Clausen, J.; Richard, D.; Quilliam, M.; MacKinnon, S.; LaBlanc, P.; Mueller, R.; Pulido, O. Neural injury biomarkers of novel shellfish toxins, spirolides: A pilot study using immunochemical and transcriptional analysis. Neurotoxicology. 2003, 24, 593–604. [Google Scholar] [CrossRef]
  29. Guéret, S.M.; Brimble, M.A. Spiroimine shellfish poisoning (SSP) and the spirolide family of shellfish toxins: Isolation, structure, biological activity and synthesis. Nat Prod Rep. 2010, 27, 1350–1366. [Google Scholar] [CrossRef] [PubMed]
  30. Miles, C.O.; Wilkins, A.L.; Stirling, D.J.; MacKenzie, A.L. New analogue of gymnodimine from a Gymnodinium species. J. Agric. Food Chem. 2000, 48, 1373–1376. [Google Scholar] [CrossRef] [PubMed]
  31. Seki, T.; Satake, M.; MacKenzie, L.; Kaspar, H.F.; Yasumoto, T. Gymnodimine, a new marine toxin of unprecedented structure isolated from New Zealand oysters and the dinoflagellate, Gymnodinium sp. Tetrahedron Lett. 1995, 36, 7093–7096. [Google Scholar] [CrossRef]
  32. Van de Waal, D.B.; Tillmann, U.; Martens, H.; Krock, B.; van Scheppingen, Y.; John, U. Characterization of multiple isolates from an Alexandrium ostenfeldii bloom in The Netherlands. Harmful Algae 2015, 49, 94–104. [Google Scholar] [CrossRef]
  33. Harju, K.; Koskela, H.; Kremp, A.; Suikkanen, S.; La Iglesia, P.; de Miles, C.O.; Krock, B.; Vanninen, P. Identification of gymnodimine D and presence of gymnodimine variants in the dinoflagellate Alexandrium ostenfeldii from the Baltic Sea. Toxicon 2016, 112, 68–76. [Google Scholar] [CrossRef] [PubMed]
  34. Christian, B.; Below, A.; Dreßler, N.; Scheibner, O.; Luckas, B.; Gerdts, G. Are spirolides converted in biological systems?—A study. Toxicon 2008, 51, 934–940. [Google Scholar] [CrossRef] [PubMed]
  35. Keller, M.D.; Selvin, R.C.; Claus, W.; Guillard, R.R.L. Media for the culture of oceanic ultraphytoplankton. J. Phycol. 1987, 23, 633–638. [Google Scholar] [CrossRef]
  36. MacKinnon, S.L.; Walter, J.A.; Quilliam, M.A.; Cembella, A.D.; LeBlanc, P.; Burton, I.W.; Hardstaff, W.R.; Lewis, N.I. Spirolides isolated from Danish strains of the toxigenic dinoflagellate Alexandrium ostenfeldii. J. Nat. Prod. 2006, 69, 983–987. [Google Scholar] [CrossRef] [PubMed]
  37. Hu, T.; Burton, I.W.; Cembella, A.D.; Curtis, J.M.; Quilliam, M.A.; Walter, J.A.; Wright, J.L. Characterization of spirolides A, C, and 13-desmethyl C, new marine toxins isolated from toxic plankton and contaminated shellfish. J. Nat. Prod. 2001, 64, 308–312. [Google Scholar] [CrossRef] [PubMed]
  38. Sleno, L.; Chalmers, M.J.; Volmer, D.A. Structural study of spirolide marine toxins by mass spectrometry. Part II. Mass spectrometric characterization of unknown spirolides and related compounds in a cultured phytoplankton extract. Anal. Bioanal. Chem. 2004, 378, 977–986. [Google Scholar] [CrossRef] [PubMed]
  39. Aasen, J.A.B.; Hardstaff, W.; Aune, T.; Quilliam, M.A. Discovery of fatty acid ester metabolites of spirolide toxins in mussels from Norway using liquid chromatography/tandem mass spectrometry. Rapid Commun. Mass Spectrom. 2006, 20, 1531–1537. [Google Scholar] [CrossRef] [PubMed]
  40. Quilliam, M.A.; Hess, P.; Dell’Aversano, C. Recent developments in the analysis of phycotoxins by liquid chromatography-mass spectrometry. In Mycotoxins and Phycotoxins in Perspective at the Turn of the Millenium, Proceedings of the Xth International IUPAC Symposium on Mycotoxins and Phycotoxins, Sao Paulo, Brazil, 22–25 May 2000; De Koe, W.J., Samson, R.A., Van Egmond, H.P, Sabino, M., Eds.; Ponsen and Looijen: Wageningen, The Netherlands, 2001; pp. 383–391. [Google Scholar]
  41. Sleno, L.; Windust, A.J.; Volmer, D.A. Structural study of spirolide marine toxins by mass spectrometry. Part I. Fragmentation pathways of 13-desmethyl spirolide C by collision-induced dissociation and infrared multiphoton dissociation mass spectrometry. Anal. Bioanal. Chem. 2004, 378, 969–976. [Google Scholar] [CrossRef] [PubMed]
  42. Ciminiello, P.; Dell’Aversano, C.; Fattorusso, E.; Magno, S.; Tartaglione, L.; Cangini, M.; Pompei, M.; Guerrini, F.; Boni, L.; Pistocchi, R. Toxin profile of Alexandrium ostenfeldii (Dinophyceae) from the Northern Adriatic Sea revealed by liquid chromatography-mass spectrometry. Toxicon 2006, 47, 597–604. [Google Scholar] [CrossRef] [PubMed]
  43. Molgó, J.; Aráoz, R.; Benoit, E.; Iorga, B. Cyclic imine toxins: Chemistry, origin, metabolism, pharmacology, toxicology, and detection. In Seafood and Freshwater Toxins: Pharmacology, Physiology, and Detection; Botana, L.M., Ed.; CRC Press: Boca Raton, FL, USA, 2014; pp. 951–990. ISBN 9781466505148. [Google Scholar]
  44. Maclean, C.; Cembella, A.D.; Quilliam, M.A. Effects of Light, Salinity and Inorganic Nitrogen on Cell Growth and Spirolide Production in the Marine Dinoflagellate Alexandrium ostenfeldii (Paulsen) Balech et Tangen. Bot. Mar. 2003, 46, 466–476. [Google Scholar] [CrossRef]
  45. Tatters, A.O.; van Wagoner, R.M.; Wright, J.L.; Tomas, C.R. Regulation of spiroimine neurotoxins and hemolytic activity in laboratory cultures of the dinoflagellate Alexandrium peruvianum (Balech & Mendiola) Balech & Tangen. Harmful Algae 2012, 19, 160–168. [Google Scholar]
  46. Alpermann, T.J.; Tillmann, U.; Beszteri, B.; Cembella, A.D.; John, U. Phenotypic variation and genotypic diversity in a planktonic population of the toxigenic marine dinoflagellate Alexandrium tamarense (Dinophyceae). J. Phycol. 2010, 46, 18–32. [Google Scholar] [CrossRef]
  47. Burkholder, J.M.; Glibert, P.M. Intraspecific variability: An important consideration in forming generalisations about toxigenic algal species. Afr. J. Mar. Sci. 2006, 28, 177–180. [Google Scholar] [CrossRef]
  48. Maranda, L.; Anderson, D.M.; Shimizu, Y. Comparison of toxicity between populations of Gonyaulax tamarensis of eastern North American waters. Estuar. Coast. Shelf Sci. 1985, 21, 401–410. [Google Scholar] [CrossRef]
  49. Kremp, A.; Godhe, A.; Egardt, J.; Dupont, S.; Suikkanen, S.; Casabianca, S.; Penna, A. Intraspecific variability in the response of bloom-forming marine microalgae to changed climate conditions. Ecol. Evol. 2012, 2, 1195–1207. [Google Scholar] [CrossRef] [PubMed]
  50. Seki, T.; Satake, M.; MacKenzie, A.L.; Kaspar, H.F.; Yasumoto, T. Gymnodimine, a novel toxic imine isolated from the Foveaux Strait oysters and Gymnodinium sp. In Harmful and Toxic Algal Blooms; Yasumoto, T., Oshima, Y., Fukuyo, Y., Eds.; Intergovernmental Oceanographic Commission of UNESCO: Paris, France, 1996; pp. 495–498. [Google Scholar]
  51. Harju, K.; Kremp, A.; Suikkanen, S.; Kankaanpää, H.; Vanninen, P. Mass spectrometric screening of novel gymnodimine-like compounds in isolates of Alexandrium ostenfeldii. In Proceedings of the 16th International Conference on Harmful Algae, Wellington, New Zealand, 27–31 October 2014. [Google Scholar]
  52. Miles, C.O.; Samdal, I.A.; Aasen, J.A.; Jensen, D.J.; Quilliam, M.A.; Petersen, D.; Briggs, L.M.; Wilkins, A.L.; Rise, F.; Cooney, J.M.; Lincoln MacKenzie, A. Evidence for numerous analogs of yessotoxin in Protoceratium reticulatum. Harmful Algae 2005, 4, 1075–1091. [Google Scholar] [CrossRef]
  53. Hess, P.; McCarron, P.; Krock, B.; Kilcoyne, J.; Miles, C. Azaspiracids: Chemistry, biosynthesis, metabolism, and detection. In Seafood and Freshwater Toxins: Pharmacology, Physiology, and Detection; Botana, L.M., Ed.; CRC Press: Boca Raton, FL, USA, 2014; pp. 799–822. ISBN 9781466505148. [Google Scholar]
  54. Tillmann, U.; Borel, C.M.; Barrera, F.; Lara, R.; Krock, B.; Almandoz, G.O.; Witt, M.; Trefault, N. Azadinium poporum from the Argentine Continental Shelf, Southwestern Atlantic, produces azaspiracid-2 and azaspiracid-2 phosphate. Harmful Algae 2016, 51, 40–55. [Google Scholar] [CrossRef] [PubMed]
Figure 1. Structures of: (A) gymnodimine A; (B) 12-Methyl-gymnodimine A; (C) gymnodimine C and (D) gymnodimine D.
Microorganisms 05 00029 g001
Figure 2. Collision-induced (CID) spectra of all determined spirolides: (A) 13-desMethyl-spirolide C; (B) compound (1); (C) compound (2); (D) 27-Hydroxy-13-desMethyl-spirolide C; (E) compound (3); (F) compound (4) and (G) compound (5).
Microorganisms 05 00029 g002
Figure 3. CID spectra of all determined gymnodimines: (A) gymnodimine A; (B) compound (6); (C) 12-Methyl-gymnodimine A and (D) compound (7).
Microorganisms 05 00029 g003
Figure 4. Box–Wisker Plots for absolute (AC) and relative values (DF) of PST, spirolides and gymnodimines.
Microorganisms 05 00029 g004
Figure 5. Putative fragmentation pattern of m/z 230–292 fragments of compound (1).
Microorganisms 05 00029 g005
Figure 6. Total Ion Chromatograms (TIC) of A. ostenfeldii strains (A) OKNL12 and (B) KJH515.
Microorganisms 05 00029 g006
Table 1. Structures of known spirolides [24,25,26,34] and corresponding m/z of their [M + H]+ ions.
Microorganisms 05 00029 i001 Microorganisms 05 00029 i002
SpirolideR1R2R3R42,3m/zSpirolideR1R22,3m/z
AHCH3CH3H+692.5EHCH3+710.5
BHCH3CH3H694.5FHCH3712.5
CCH3CH3CH3H+706.5
DCH3CH3CH3H708.5
13-desMe CCH3HCH3H+692.5
13,19-didesMe CCH3HHH+678.5
27-Hydroxy-13-desMe CCH3HCH3OH+694.5
27-oxo-13-desMe CCH3HCH3=O+692.5
13-desMe DCH3HCH3H694.5
Microorganisms 05 00029 i003 Microorganisms 05 00029 i004
Spirolide2,3m/zSpirolideRm/z
H+650.5GH692.5
I652.520-Me GCH3706.5
Table 2. Mass transitions of spiroimines included in liquid chromatography-tandem mass spectrometry (LC-MS/MS) analysis (m/z; precursor ion → fragment ion), retention times and characteristic group fragments. Compounds detected in A. ostenfeldii from The Netherlands and their respective data are printed in bold.
Mass Transition (m/z)Common NameReferenceRetention Time (min)m/z
Group 1Group 2Group 3Group 4
Spirolides
650 → 164Spirolide H[25] 650/632/614402/384206164
652 → 164Spirolide I[25] 652/634/616402/384206164
678 → 16413,19-didesMethyl-spirolide C[23,36] 678/660/642/624448/430/412/394 164
692 → 150Spirolide A[37] 692/674/624444/390190150
692 → 16413-desMethyl-spirolide CThis study, [37]12.76692/674/656/638462/444/426 164
692 → 164Spirolide G[22] 692/674/656/638378 164
694 → 150Spirolide B[20,21] 694/676/658/640462/444/426 150
694 → 16413-desMethyl spirolide D[38] 694/676/658/640444/426230/204/177164
694 → 164(1)This study12.33694/676/658/640/622446/428/410292/274/248164
696 → 164(2)This study12.39696/678/660/642/624464/446/428/410292/274/248164
706 → 164Spirolide C[37] 706/688/638458/404204164
706 → 16420-Methyl-spirolide G[39] 706/688/670/652392/374/346258164
708 → 164Spirolide D[20,39] 708/690/672/654458/440230/206/204/177164
708 → 18027-Hydroxy-13-desMethyl-spirolide CThis study, [24]13.06708/690/672/654/636478/460/442/424 180
710 → 164(3)This study12.97710/692/674/656/638462/444/426 164
720 → 164(4)This study13.29720/702/684/666490/472/454 164
722 → 164(5)This study13.40722/704/686/668490/472/454 164
Gymnodimines
508 → 490Gymnodimine AThis study, [31]11.81508/490/392/286/246/202/174/162/136/121
510 → 492(6)This study12.21510/492/482/332/302/136/120
522 → 50412-Methyl-gymnodimine AThis study, [26]12.17522/504/406/300/246/202/174/162/136/120
526 → 508(7)This study11.32526/508/348/262/174/162/136/120
Table 3. Calculated and measured accurate masses (m/z) for [M + H]+ at m/z 510 and its product ions obtained with Liquid Chromatography–High-Resolution Mass Spectrometry (LC–HRMS).
FormulaRelative Intensity (%)CalculatedMeasuredΔ, ppm
C31H44O5N+100510.3214510.32242.0
C31H42O4N+62492.3108492.31192.1
C30H44O4N+14482.3265482.32782.7
C31H40O3N+6474.3003474.30111.7
C30H44O3N+7466.3316466.33252.0
C30H42O3N+5464.3159464.31671.6
C29H38O4N+3464.2795464.28052.0
C30H42O2N+7448.3210448.32181.8
C23H34O4N+7388.2482388.24891.7
C20H30O3N+29332.2220332.22251.6
C20H28O2N+3314.2115314.21191.5
C19H28O2N+6302.2115302.21191.6
C17H26ON+3260.2009260.20131.4
C17H24ON+2258.1852258.18571.8
C14H20N+4202.1590202.15952.1
C13H20N+5190.1590190.15942.0
C13H18N+3188.1434188.14382.2
C11H16N+3162.1277162.12812.3
C11H14N+2160.1121160.11252.3
Table 4. Range and fold change of cell quota of PST and spiroimine compounds. Transitions are mentioned in m/z. Samples size was N = 68; ni describes the absolute number of strains in which the toxin was detected. Numbers in brackets next to “<LOD” indicate the lowest level of compound recorded above detection limit which was used to calculate fold-changes (LOD = Limit of detection; PST = paralytic shellfish toxins; STX = saxitoxin; GTX = gonyautoxins; GYM = gymnodimines).
TransitionCompoundniMinimum (fg cell−1)Maximum (fg cell−1)Fold Change
PST
STX68370680018
GTX2/368150012,8008
B167<LOD (120)9409
C1/C268720074,40010
Spirolides
692-16413-desMe C68205500273
694-164(1)7<LOD (20)97042
696-164(2)2<LOD (920)11001
708-18027-Hydroxy-13-desMe C37<LOD (10)806
710-164(3)54<LOD (10)605
720-164(4)45<LOD (30)2808
722-164(5)47<LOD (10)14010
Gymnodimines
508-490GYM A58<LOD (310)18,10059
510-492(6)6837,000274,0007
522-50412-Me-GYM A30<LOD (300)15005
526-508(7)63<LOD (530)26,50050
Table 5. Exact masses of the pseudo-molecular ions and elemental formula of spirolides contained in A. ostenfeldii extract measured on the LTQ-Orbitrap MS. Ring double bond (RDB) equivalents and errors in ion assignments (ppm) are also reported.
Name[M + H]+, m/zFormulaRDBΔ, ppm
Spirolides
13-desMe C692.4521C42H62O7N12.50.029
(1)694.4322C41H60O8N12.51.232
(2)696.4474C41H62O8N11.50.583
27-Hydroxy-13-desMe C708.4477C42H62O8N11.50.996
(3)710.4615C42H64O8N11.5−1.611
(4)720.4817C44H66O7N12.52.331
(5)722.4974C44H68O7N11.5−2.256
Gymnodimines
GYM A508.3417C32H46O4N10.5−0.856
(6)510.3208C31H44O5N10.5−1.176
12-Me-GYM A522.3575C33H48O4N10.5−0.546
(7)526.3158C31H44O6N10.5−0.978

