3.1. Within-Day and Between-Day Effects on the Impedance Values at Acupuncture Points
The standard error of the means (SEMs) of the IV measurements at the individual APs were high (
Table 2). The mean impedance and the SEMs on the left side were non-significantly higher than those on the right side: 1,965 ± 1,326
versus 1,761 ± 1,262 kΩ, respectively. However, this difference was less for the nine APs considered on both sides: 1,975 ± 932 compared to 1,836 ± 754 kΩ. The AP with the highest mean IVs was ST18 (3,618 ± 404 and 4,179 ± 418 kΩ); APs with the lowest IVs were BL30R (868 ± 59 kΩ), BL30L (827 ± 39 kΩ) and BL29L (856 ± 54 kΩ). The variation was greater between APs than within APs.
Table 2.
Mean, median, standard error of the mean (SEM), highest and lowest impedance values in Experiment 1.
Table 2.
Mean, median, standard error of the mean (SEM), highest and lowest impedance values in Experiment 1.
| | Impedance values (kΩ) |
| AP | Mean | Median | SEM | Lowest | Highest |
| BL21R | 1,845 | 1,299 | 234.4 | 416 | 17,586 |
| BL20R | 1,971 | 1,389 | 215.7 | 357 | 13,450 |
| BL19R | 1,651 | 1,365 | 145.1 | 324 | 10,688 |
| BL18R | 1,318 | 1,143 | 102.9 | 419 | 10,102 |
| BL17R | 1,387 | 1,115 | 113.1 | 519 | 8,920 |
| BL16R | 1,710 | 1,133 | 173.6 | 269 | 12,042 |
| BL15R | 1,613 | 1,376 | 162.5 | 436 | 17,687 |
| BL14R | 1,757 | 1,281 | 153.4 | 57 | 9,674 |
| BL22R | 2,070 | 1,516 | 213.8 | 107 | 13,539 |
| BL23R | 1,554 | 1,084 | 197.6 | 107 | 13,555 |
| BL46-02R | 1,533 | 1,141 | 185.9 | 136 | 18,467 |
| ST18L | 3,618 | 1,833 | 403.6 | 584 | 18,358 |
| BL30R | 868 | 731 | 59.1 | 76 | 3,713 |
| R overall | 1,761 | 1,262 | | 293 | 12,906 |
| BL20L | 2,495 | 1,548 | 331.5 | 292 | 18,267 |
| BL43-01L | 2,973 | 1,843 | 323.9 | 303 | 16,517 |
| BL17L | 1,899 | 1,359 | 215.6 | 259 | 14,829 |
| BL16L | 1,737 | 1,155 | 224.0 | 141 | 16,381 |
| BL15L | 1,605 | 1,300 | 164.9 | 155 | 16,800 |
| BL14L | 1,498 | 1,197 | 106.8 | 190 | 6,765 |
| BL22L | 1,775 | 1,285 | 186.3 | 297 | 16,431 |
| BL46-02L | 1,765 | 1,488 | 159.3 | 303 | 13,245 |
| ST18L | 4,179 | 1,918 | 417.8 | 589 | 17,814 |
| BL30L | 827 | 753 | 38.7 | 230 | 3,280 |
| BL29L | 856 | 739 | 53.8 | 235 | 3,485 |
| L overall | 1,965 | 1,326 | | 272 | 13,075 |
| Overall | 1,854 | 1,291 | | 283 | 12,984 |
Table 3.
Results of the ANOVA (P) for the log-transformed impedance values (in kΩ) for the cow, within-day (Hr), and between-day effects.
Table 3.
Results of the ANOVA (P) for the log-transformed impedance values (in kΩ) for the cow, within-day (Hr), and between-day effects.
| | | Variables |
| AP | Mean ± SEM | Cow | Hr | Days |
| BL21R | 7.24 ± 0.073 | <0.01 | - | - |
| BL20R | 7.29 ± 0.070 | - | - | - |
| BL19R | 7.23 ± 0.072 | <0.05 | - | - |
| BL18R | 7.05 ± 0.056 | <0.05 | <0.1 | - |
| BL17R* | 7.08 ± 0.083 | - | - | - |
| BL16R | 7.17 ± 0.105 | <0.05 | - | - |
| BL15R | 7.23 ± 0.063 | <0.1 | - | - |
| BL14R | 7.22 ± 0.104 | <0.001 | <0.01 | <0.1 |
| BL22R | 7.36 ± 0.095 | <0.001 | <0.01 | <0.05 |
| BL23R | 7.02 ± 0.119 | <0.01 | <0.1 | - |
| BL46-02R | 7.07 ± 0.095 | <0.001 | <0.01 | <0.05 |
| ST18R | 7.75 ± 0.116 | - | <0.1 | - |
| BL30R | 6.57 ± 0.101 | <0.01 | <0.1 | - |
| BL20L* | 7.44 ± 0.099 | <0.05 | - | - |
| BL43-01L | 7.65 ± 0.072 | <0.1 | <0.05 | <0.05 |
| BL17L | 7.27 ± 0.066 | <0.1 | - | - |
| BL16L | 7.12 ± 0.104 | <0.05 | - | - |
| BL15L | 7.18 ± 0.076 | <0.05 | - | - |
| BL14L | 7.13 ± 0.099 | <0.001 | - | - |
| BL22L | 7.24 ± 0.093 | <0.01 | <0.1 | - |
| BL46-02L | 7.31 ± 0.050 | - | - | - |
| ST18L | 7.93 ± 0.084 | <0.05 | <0.05 | - |
| BL30L | 6.62 ± 0.066 | <0.001 | <0.05 | <0.01 |
| BL29L | 6.60 ± 0.094 | <0.01 | - | <0.1 |
The cow effect was significant for most APs, except for BL 20R, 17R, 15R, 43-01L, 17L, 46-02L, and ST18R (
Table 3). The within-day effect (hour) was significant for BL 14R, 22R and 46-02R (
p < 0.01), and 43-01L, 30L and ST18R (
p < 0.05). The between-day effect was significant for BL 22R, 46-02R, 43-01L (
p < 0.05) and 30L (
p < 0.01).
The mean regression coefficients showed a cow effect for BL17L, a within-day (i.e., between-hour) effect for BL21R, and a between-day effect for BL14R. For BL22R the regression coefficient differed from 0.
The log-transformed IVs at 22 APs were distributed normally, except for BL17R and BL20L (
Table 3). Of the nine APs measured bilaterally, the IVs at five points (BL 14, 16, 17, 22 and 30) were significantly correlated (
p < 0.001,
p < 0.001,
p < 0.05,
p < 0.001 and
p < 0.001, respectively), but the IVs at 4 APs (BL15, BL20, BL46-02 and ST18) did not correlate significantly with their pair. The IVs at BL14R, BL16R, BL16L and BL29L were significantly correlated with those measured at 20, 21, 19 and 20 APs respectively. The IVs at BL20L correlated more often with the IVs of APs located on the left, while those of ST18L correlated more often with the IVs of APs located on the right. The IV of BL43-01L did not correlate positively with the IVs of any other AP, but did correlate negatively with BL18R and BL19R (
p < 0.05). IVs at BL20R, BL19R and BL46-02 correlated with IVs at only four other APs.
3.2. Effect of Dairy Production Factors on the Impedance Values at 24 Acupuncture Points
The mean IV on the left side was not significantly different than that on the right side; the overall mean and SEM were 1,993 ± 1,463 kΩ (
Table 4). ST18 had the highest means (right: 3,427 ± 1,860 and left: 3,804 ± 1,876 kΩ). IVs were lowest at BL29L (1,269 ± 1,005 kΩ), BL30R (1,204 ± 1,014 kΩ) and BL30L (1,315 ± 1,860 kΩ).
Only ST18 did not show a farm effect. The IVs on all other APs were lower on farm B (conventional, no milk robot) than on D (conventional, milk robot). Most IVs from farm D were equal to those of farm C (organic, milk robot), except for BL 15R (p < 0.05), 17R (p < 0.05), 30R (p < 0.05), 14L (p < 0.01) and 43-01L (p < 0.05). The mean IVs were higher on farms C and D than on farms A and B.
For all three months, the period of lactation had a significant effect on BL43-01L (p < 0.05); the effect on BL16R was close to significant (p < 0.1). Days in lactation contributed significantly only to the June model for BL21R and to the July model for ST18R and BL30R. Parity contributed significantly to the July model for BL21R (p < 0.05); the contributions of parity to the July model for BL15R and ST18R were close to significant (p < 0.1), as were those for the June model of BL20R and BL18R (p < 0.1). Age contributed significantly to the June model for ST18L (p < 0.05), and its contribution was close to significant for BL15R and BL20L (p < 0.1)
In the June model, the variable “milk robot” contributed highly significantly to the model for most APs, except for ST18R, ST18L and BL30L. In the July model, the contribution was less important but was significant for nine APs. Other variables that contributed significantly to the models were the number of inseminations, body condition score, length of the preceding lactation, kg milk and kg milk fat of the current and preceding month and of the preceding year, and the cell count and the urea content in milk.
Table 4.
Mean, median, SEMs, highest and lowest impedance values in Experiment 2.
Table 4.
Mean, median, SEMs, highest and lowest impedance values in Experiment 2.
| | Impedance values (kΩ) |
| AP | Mean | Median | SEM | Lowest | Highest |
| BL21R | 1,940 | 1,498 | 132.4 | 319 | 16,716 |
| BL20R | 2,087 | 1,534 | 145.0 | 189 | 17,426 |
| BL19R | 2,098 | 1,549 | 141.3 | 162 | 17,448 |
| BL18R | 1,734 | 1,506 | 93.8 | 160 | 16,365 |
| BL17R | 1,799 | 1,446 | 127.1 | 216 | 18,427 |
| BL16R | 1,610 | 1,414 | 85.2 | 201 | 15,123 |
| BL15R | 1,675 | 1,417 | 87.5 | 319 | 15,365 |
| BL14R | 1,698 | 1,396 | 99.6 | 245 | 16,086 |
| BL22R | 1,930 | 1,468 | 142.5 | 170 | 18,211 |
| BL23R | 1,867 | 1,441 | 128.6 | 199 | 18,140 |
| BL46-02R | 2,238 | 1,523 | 162.1 | 324 | 17,858 |
| ST18R | 3,427 | 1,860 | 209.7 | 490 | 18,217 |
| BL30R | 1,204 | 1,014 | 77.4 | 232 | 16,451 |
| R overall | 1,939 | 1,467 | | 248 | 17,064 |
| BL20L | 2,145 | 1,618 | 139.6 | 294 | 17,505 |
| BL43-01L | 2,720 | 1,683 | 186.4 | 326 | 18,264 |
| BL17L | 1,741 | 1,509 | 91.3 | 226 | 13,559 |
| BL16L | 1,854 | 1,469 | 119.2 | 133 | 17,467 |
| BL15L | 1,779 | 1,444 | 110.7 | 172 | 17,457 |
| BL14L | 1,928 | 1,403 | 137.9 | 132 | 16,622 |
| BL22L | 1,682 | 1,416 | 93.0 | 233 | 15,318 |
| BL46-02L | 2,493 | 1,541 | 180.0 | 363 | 16,907 |
| ST18L | 3,804 | 1,876 | 234.2 | 468 | 18,118 |
| BL30L | 1,315 | 1,081 | 82.9 | 200 | 15,468 |
| BL29L | 1,269 | 1,005 | 92.0 | 190 | 13,598 |
| L overall | 2,057 | 1,459 | | 248 | 16,389 |
| Overall | 1,993 | 1,463 | | 248 | 16,755 |
The adjusted R2 values were strongest for the models of BL14L in June and BL30R in July: 0.801 and 0.896, including 11 and 16 variables, respectively. The models of both ST18 left and right gave low R2 values in June but high in July. The R2 values of the models for right BL17, 18 and 30, and left BL 14, 17, 20, 29 and 43-01 were >0.5 in both June and July, including between 5 and 16 variables. For the stepwise regression, only the model for BL20L had a consistently high R2: 0.76 for June and 0.62 for July. The factor “milk-robot” dominated the model for BL30R in June but not in July. R2 values consistently >0.4 were scored by the models of right BL18, 19, 23, 29 and 30, and left BL 20 and 30. Overall, BL18R, BL30R, and BL20L gave consistently good correlations with the variables implemented, but the number of variables included was only 2 to 7.
The variable most represented in the regression models was “milk robot”. For the month of June, its contribution was highly significant for 15 APs, and in July, it was significant for 8 APs. The IV of most APs was higher for cows from the two farms using a milk robot. This indicates either chronic health or nutrition problems. Other variables that contributed to the models and were also related to suboptimal health were the number of inseminations, the body condition score, the cell count and the urea content in milk.
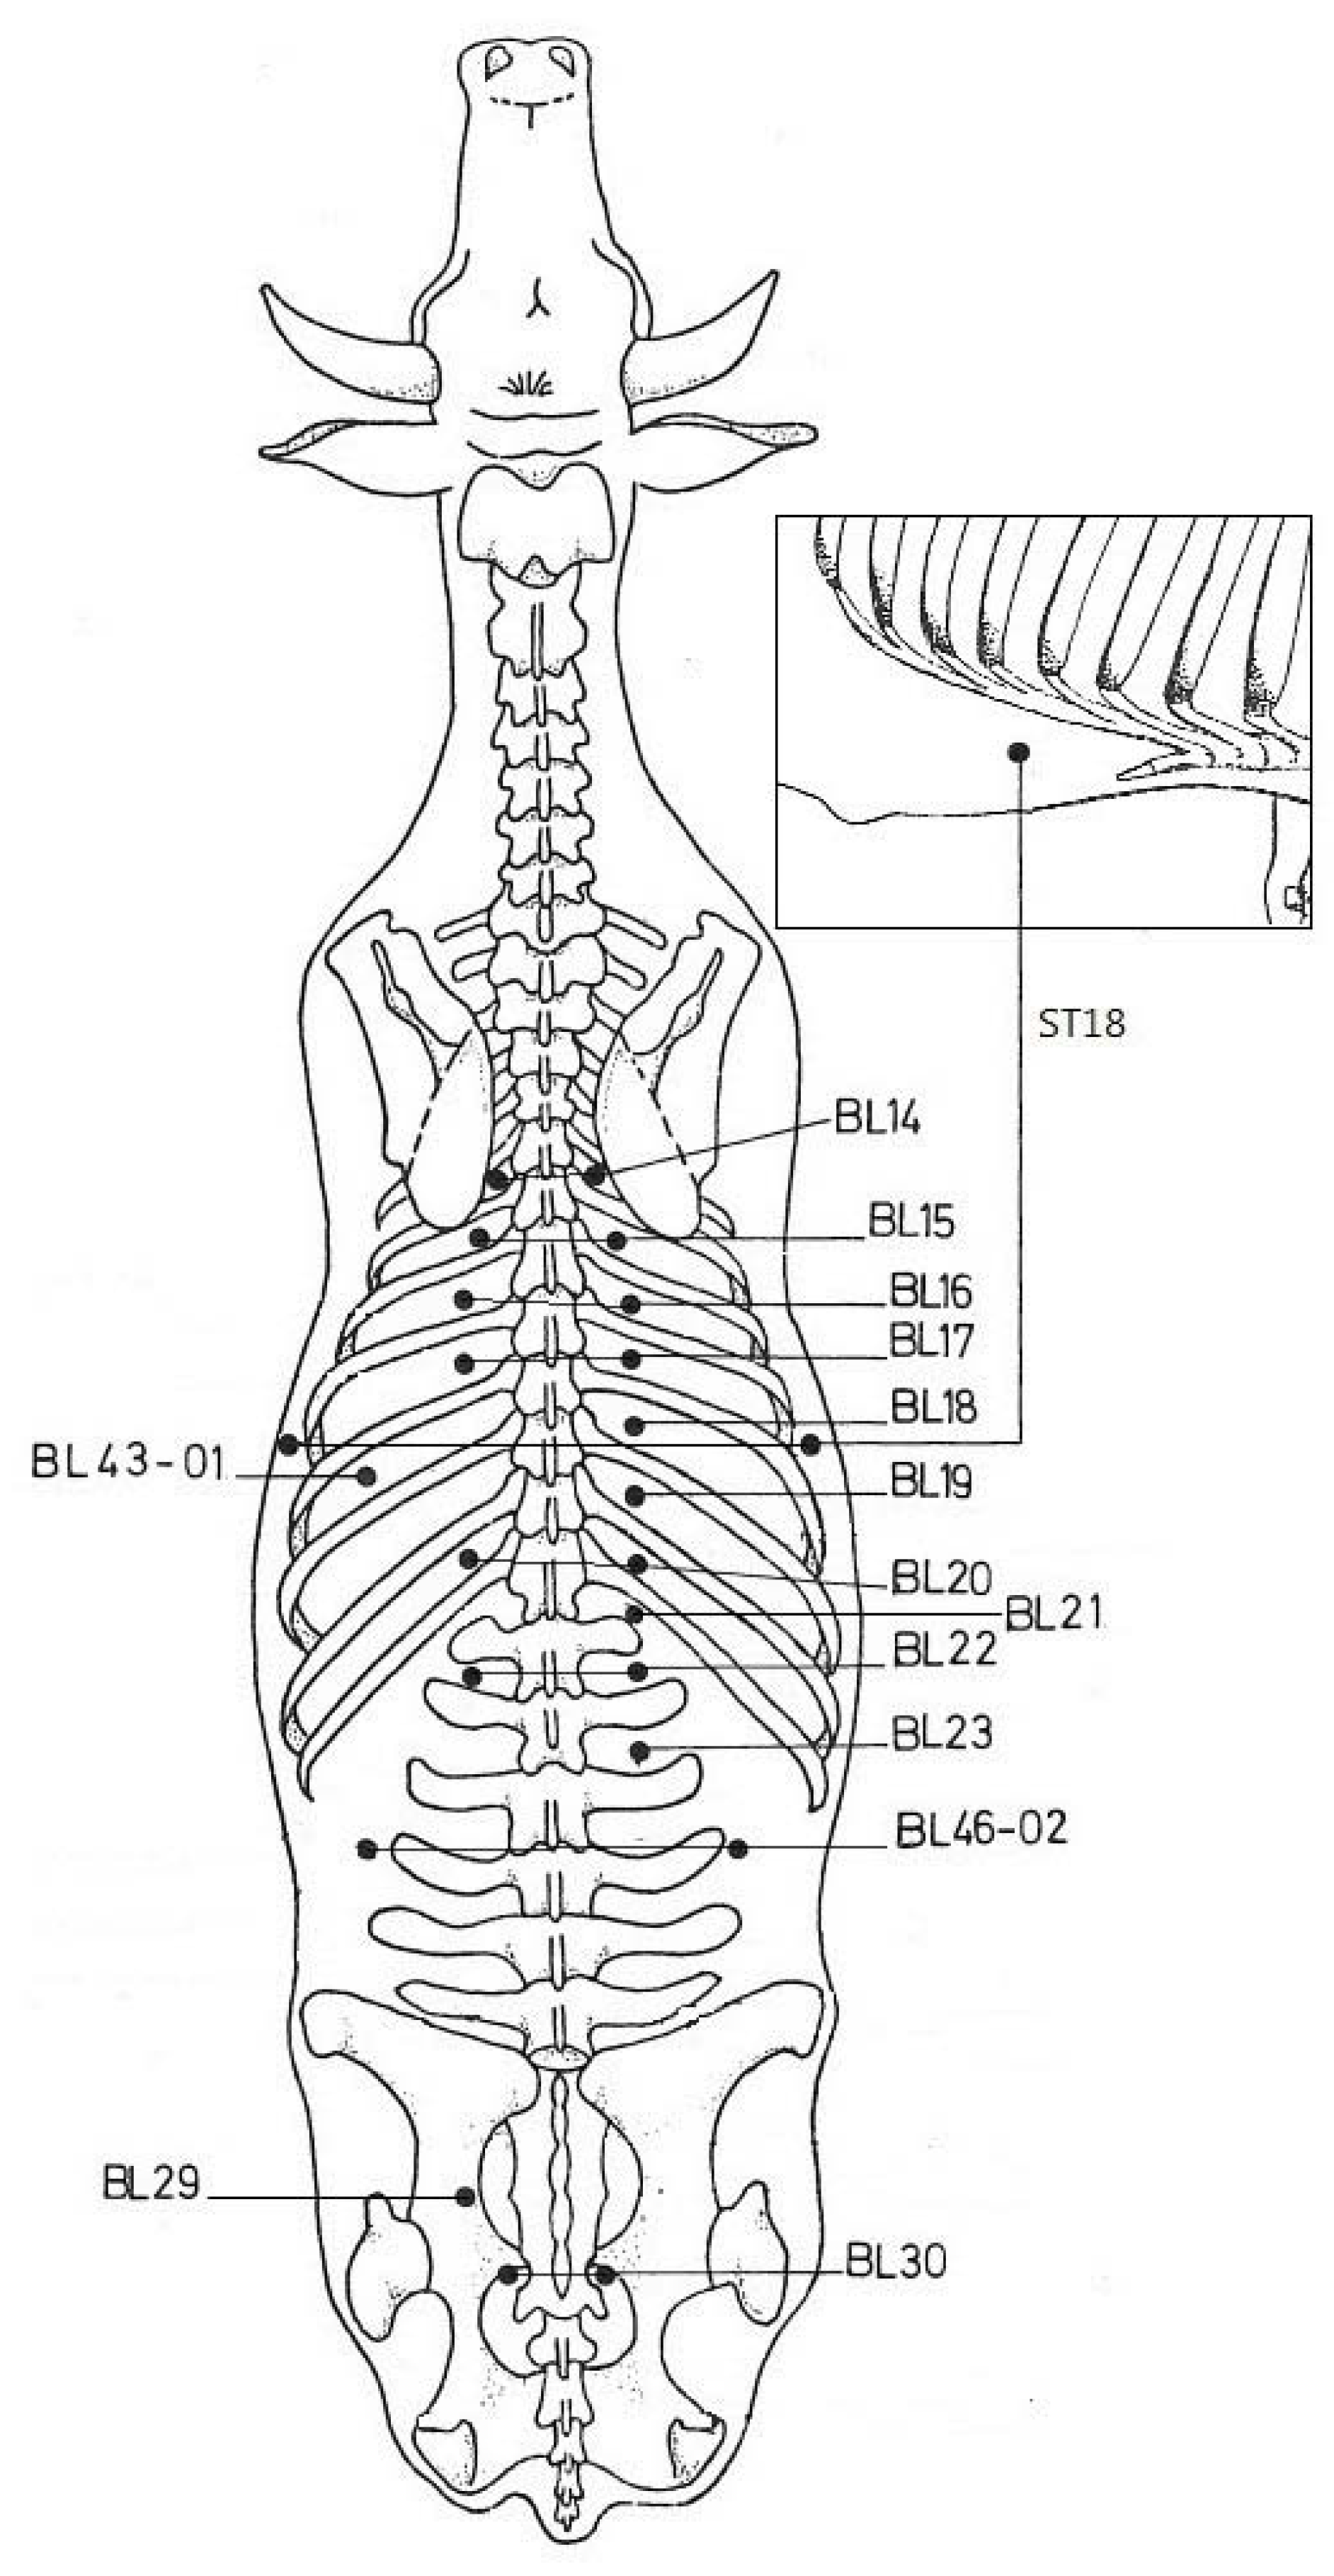
3.3. Acupuncture Points Recommended for Future Use and Study
The within-day (between hours) effect for BL 14R, 22R, 46-02R, 43-01L, 30L and ST18L excludes these APs for standard EAP diagnostic procedures. This conclusion is reinforced by the effect of lactation period on BL43-01L, and of age on ST18L. The effect of days in lactation on BL21R and BL30R makes these APs less relevant; the contribution of parity to BL21R reinforces this conclusion. The near-significant (
p = 0.1) contribution of parity to the monthly models of the effect of hour for BL18R, BL15R and ST18R, plus the near-significant contribution of age to the June model of BL15R and the near-significant effect of hour on BL18R and ST18R probably excludes these for diagnostic use. ST18 is related to the udder [
8], which might explain the strong relation with age, parity and hour (
Table 5).
Table 5.
The organs associated to the 24 APs according to Kothbauer [
8].
Table 5.
The organs associated to the 24 APs according to Kothbauer [8].
| APs | Associated organs right | Associated organs left |
| BL14 | Pericardium | Pericardium |
| BL15 | Heart | Heart |
| BL16 | Lung | Lung |
| BL17 | Lung, udder (right front) | Lung, udder (left front) |
| BL18 | Liver, abomasum, omasum | - |
| BL19 | Diaphragm, liver | Diaphragm |
| BL20 | Spleen, pancreas | Spleen, pancreas |
| BL21 | Ovary, indigestion | |
| BL22 | Ovary, endocrine | Ovary, endocrine |
| BL23 | Kidney, ovary, testis | - |
| BL29 | - | Bladder |
| BL30 | Udder (right back) | Udder (left back) |
| BL43-01 | Rumen | Rumen |
| BL46-02 | Small intestine | Large intestine |
| ST18 | Udder (milk yield) | Udder (milk yield) |
The non-normal distributions of IVs on BL17R and BL20L might be related to a physiological problem that we could not establish; they are recommended for further study, together with other APs for which no negative or positive advice can be given (
Table 6). The differences between the IVs for BL17R and BL14L of cows from the conventional and organic farms that both use a milk robot argue for using these APs for diagnostics, but the first needs further study.
Table 6.
The APs recommended for reference, diagnostics and further study.
Table 6.
The APs recommended for reference, diagnostics and further study.
| Recommended for: | APs on the right | APs on the center |
| Reference | | | BL19R | BL20R | | | | | BL46-02L |
| Diagnostics | | | | | | BL14L | BL16L | BL17L | |
| Further study | BL16R | BL17R | BL18R | BL23R | BL30R | BL15L | BL20L | BL22L | BL29L |
The non-significant cow effect for BL20R and BL46-02L and the correlation of BL19R with only four other APs, make these APs good reference points; BL46-02L is a suitable reference because of its low correlation with other APs. Disturbance at BL46-02 indicates intestinal disorders such as: diarrhea, catarrhal or regular enteritis, hemorrhage, obstipation, intestinal colic. Traditionally, the left side is more related to the colon, while the right side seems to be more related to the small intestine (
Table 5).
Of the three APs shown in
Table 6 as suitable for diagnostics, BL14L was chosen due to the high adjusted R
2 value of the June model and BL 17L, due to the significant cow effect. BL16L has been added due to its correlation with 19 other APs. BL20L merits further study due to the high significance of two explanatory models and its non-normal distribution. Disturbances in BL14 and BL17 indicate respiratory and lung disorders; disturbances in BL14 also indicate functional heart disorders (
Table 5). Disturbances in BL19R and BL20 may be indicative of liver disorders, upsets of abomasum or omasum, adrenaline deficiency, general weakness, and recovery after chronic disease, anemia and blood disorders; BL19 is also a pain point for peritonitis or pericarditis [
8]. The use of BL45 (between the 11th and 12th rib), showing high IVs in herds with health stress [
1], might also be considered.
We recommend pursuing the identification of normal values, effect of time (season), and of the most appropriate APs related to dairy cow performance, and to do so while developing and testing diagnostic and treatment equipment for use while the cow is standing in a milk parlor. It would also be worthwhile to investigate other as yet untested APs on the spleen and liver meridians. Hardware- and software-supported tools are now available that measure the reduction in the variation of the IV in one AP (ΔΚΩ/s) while a treatment is being applied [
6]. This new software should be used on the APs indicated for diagnostics, to identify the optimal frequency of these waves for therapeutics.


