The Influence of Climate, Soil and Pasture Type on Productivity and Greenhouse Gas Emissions Intensity of Modeled Beef Cow-Calf Grazing Systems in Southern Australia


Abstract
:Simple Summary
Abstract
1. Introduction
2. Experimental Section
2.1. Sites Simulated

| Site | Location | Lat., Long. | Climate | Pasture species | Soil type | Temp Min (°C) | Temp Max (°C) | Rainfall (mm) |
|---|---|---|---|---|---|---|---|---|
| Albany | SW Western Australia | −34.90, 117.80 | Temperate | Kikuyu (Pennisetum clandestinum), subterranean clover (Trifolium subterranean) | Petroferric brown sodosol | 10.7 | 20.5 | 780 |
| Dookie | N Victoria | −36.37, 145.70 | Mediterranean | Phalaris (Phalaris aquatic), subterranean clover, annual ryegrass (Lolium rigidum) | Vertic calic red chromosol | 8.1 | 20.3 | 576 |
| Vasey | SW Victoria | −38.25, 145.93 | Mediterranean | Phalaris, subterranean clover | Yellow sodosol | 7.4 | 19.1 | 624 |
| Wagga Wagga | S New South Wales | −41.08, 145.77 | Mediterranean | Phalaris, subterranean clover, annual ryegrass | Red chromosol/leptic tenosol | 9.6 | 22.2 | 549 |
2.2. Whole System Model
2.3. Cow and Calf Grazing Systems at Each Site
2.4. Grazing System Greenhouse Gas Emissions
2.5. Data Analysis
3. Results
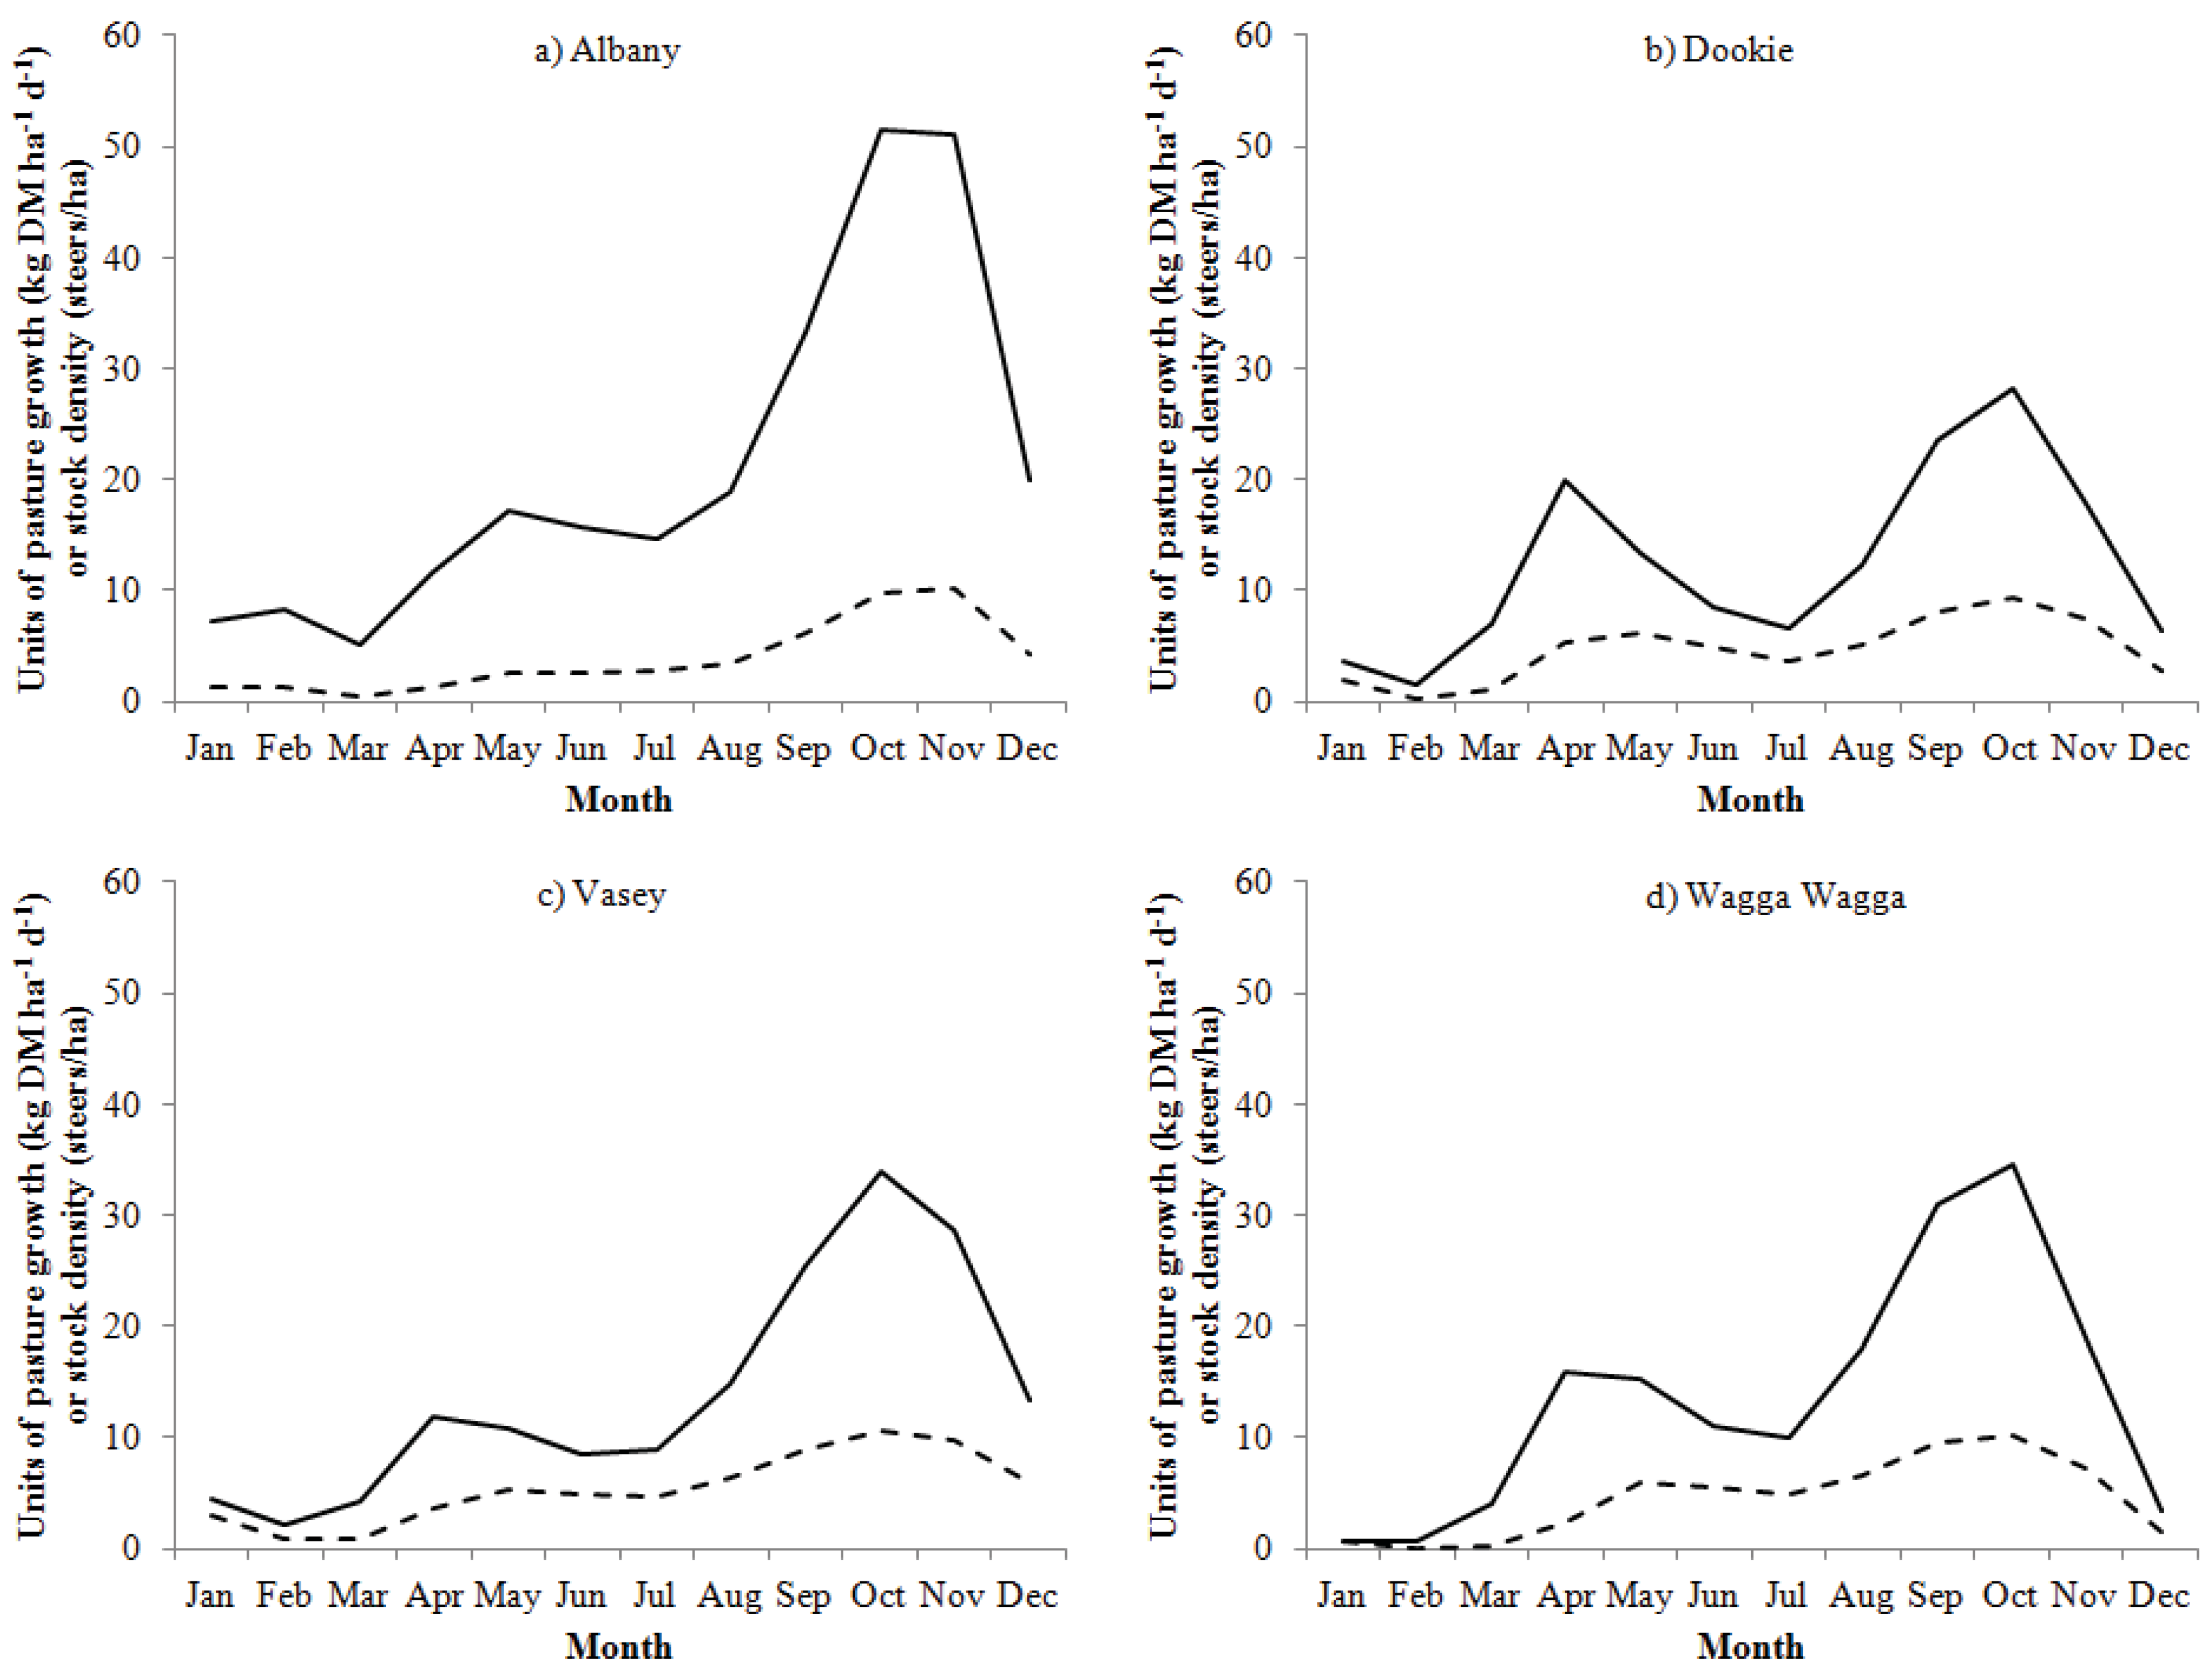
3.1. Productivity
| Site | Units | Pasture | Pasture + supplementary feed |
|---|---|---|---|
| Albany | Kikuyu/subclover pasture and stocking rate 0.6 cows/ha | ||
| Cow live weight | kg/hd/d | 474 (11) | 474 (12) |
| Calf live weight at weaning | kg/hd | 96.2 (7.2) | 100 (0.2) |
| ME required | MJ/hd/d | 85.3 (1.1) | 85.9 (0.5) |
| Pasture intake | t DM/ha | 1.9 (0.2) | 1.9 (0.1) |
| Supplement intake | t DM/ha | 0 | 0.04 (0.05) |
| ME content | MJ/kg DM | 9.6 (0.1) | 9.7 (0.1) |
| DM digestibility | % | 60.2 (0.8) | 60.3 (0.8) |
| Pasture cut | t DM/ha | 0 | 1.5 (0.7) |
| Dookie | Phalaris/subclover/annual ryegrass pasture and stocking rate 0.8 cows/ha | ||
| Cow live weight | kg/hd/d | 455 (3) | 457 (3) |
| Calf live weight at weaning | kg/hd | 62.5 (18) | 100 (0.2) |
| ME required | MJ/hd/d | 81.3 (2.1) | 86.5 (0.2) |
| Pasture intake | t DM/ha | 0.8 (0.5) | 1.0 (0.4) |
| Supplement intake | t DM/ha | 0 | 0.5 (0.2) |
| ME content | MJ/kg DM | 9.8 (0.3) | 10.2 (0.1) |
| DM digestibility | % | 60.9 (1.7) | 63.6 (0.6) |
| Pasture cut | t DM/ha | 0 | 0.3 (0.7) |
| Vasey | Phalaris/subclover pasture and stocking rate 0.9 cows/ha | ||
| Cow live weight | kg/hd/d | 456 (1) | 457 (1) |
| Calf live weight at weaning | kg/hd | 73.4 (10) | 100 (0.2) |
| ME required | MJ/hd/d | 82.5 (1.3) | 86.3 (0.1) |
| Pasture intake | t DM/ha | 1.2 (0.3) | 1.5 (0.3) |
| Supplement intake | t DM/ha | 0 | 0.5 (0.1) |
| ME content | MJ/kg DM | 9.9 (0.2) | 10.2 (0.1) |
| DM digestibility | % | 61.9 (1.0) | 63.5 (0.5) |
| Pasture cut | t DM/ha | 0 | 0.6 (0.6) |
| Wagga Wagga | Phalaris/subclover/annual ryegrass pasture and stocking rate 0.8 cows/ha | ||
| Cow live weight | kg/hd/d | 456 (2) | 457 (3) |
| Calf live weight at weaning | kg/hd | 74.9 (16) | 100 (0.2) |
| ME required | MJ/hd/d | 83.1 (1.8) | 86.5 (0.2) |
| Pasture intake | t DM/ha | 0.9 (0.4) | 1.1 (0.4) |
| Supplement intake | t DM/ha | 0 | 0.3 (0.2) |
| ME content | MJ/kg DM | 10.0 (0.3) | 10.2 (0.1) |
| DM digestibility | % | 62.4 (1.6) | 64.9 (0.7) |
| Pasture cut | t DM/ha | 0 | 0.6 (0.8) |
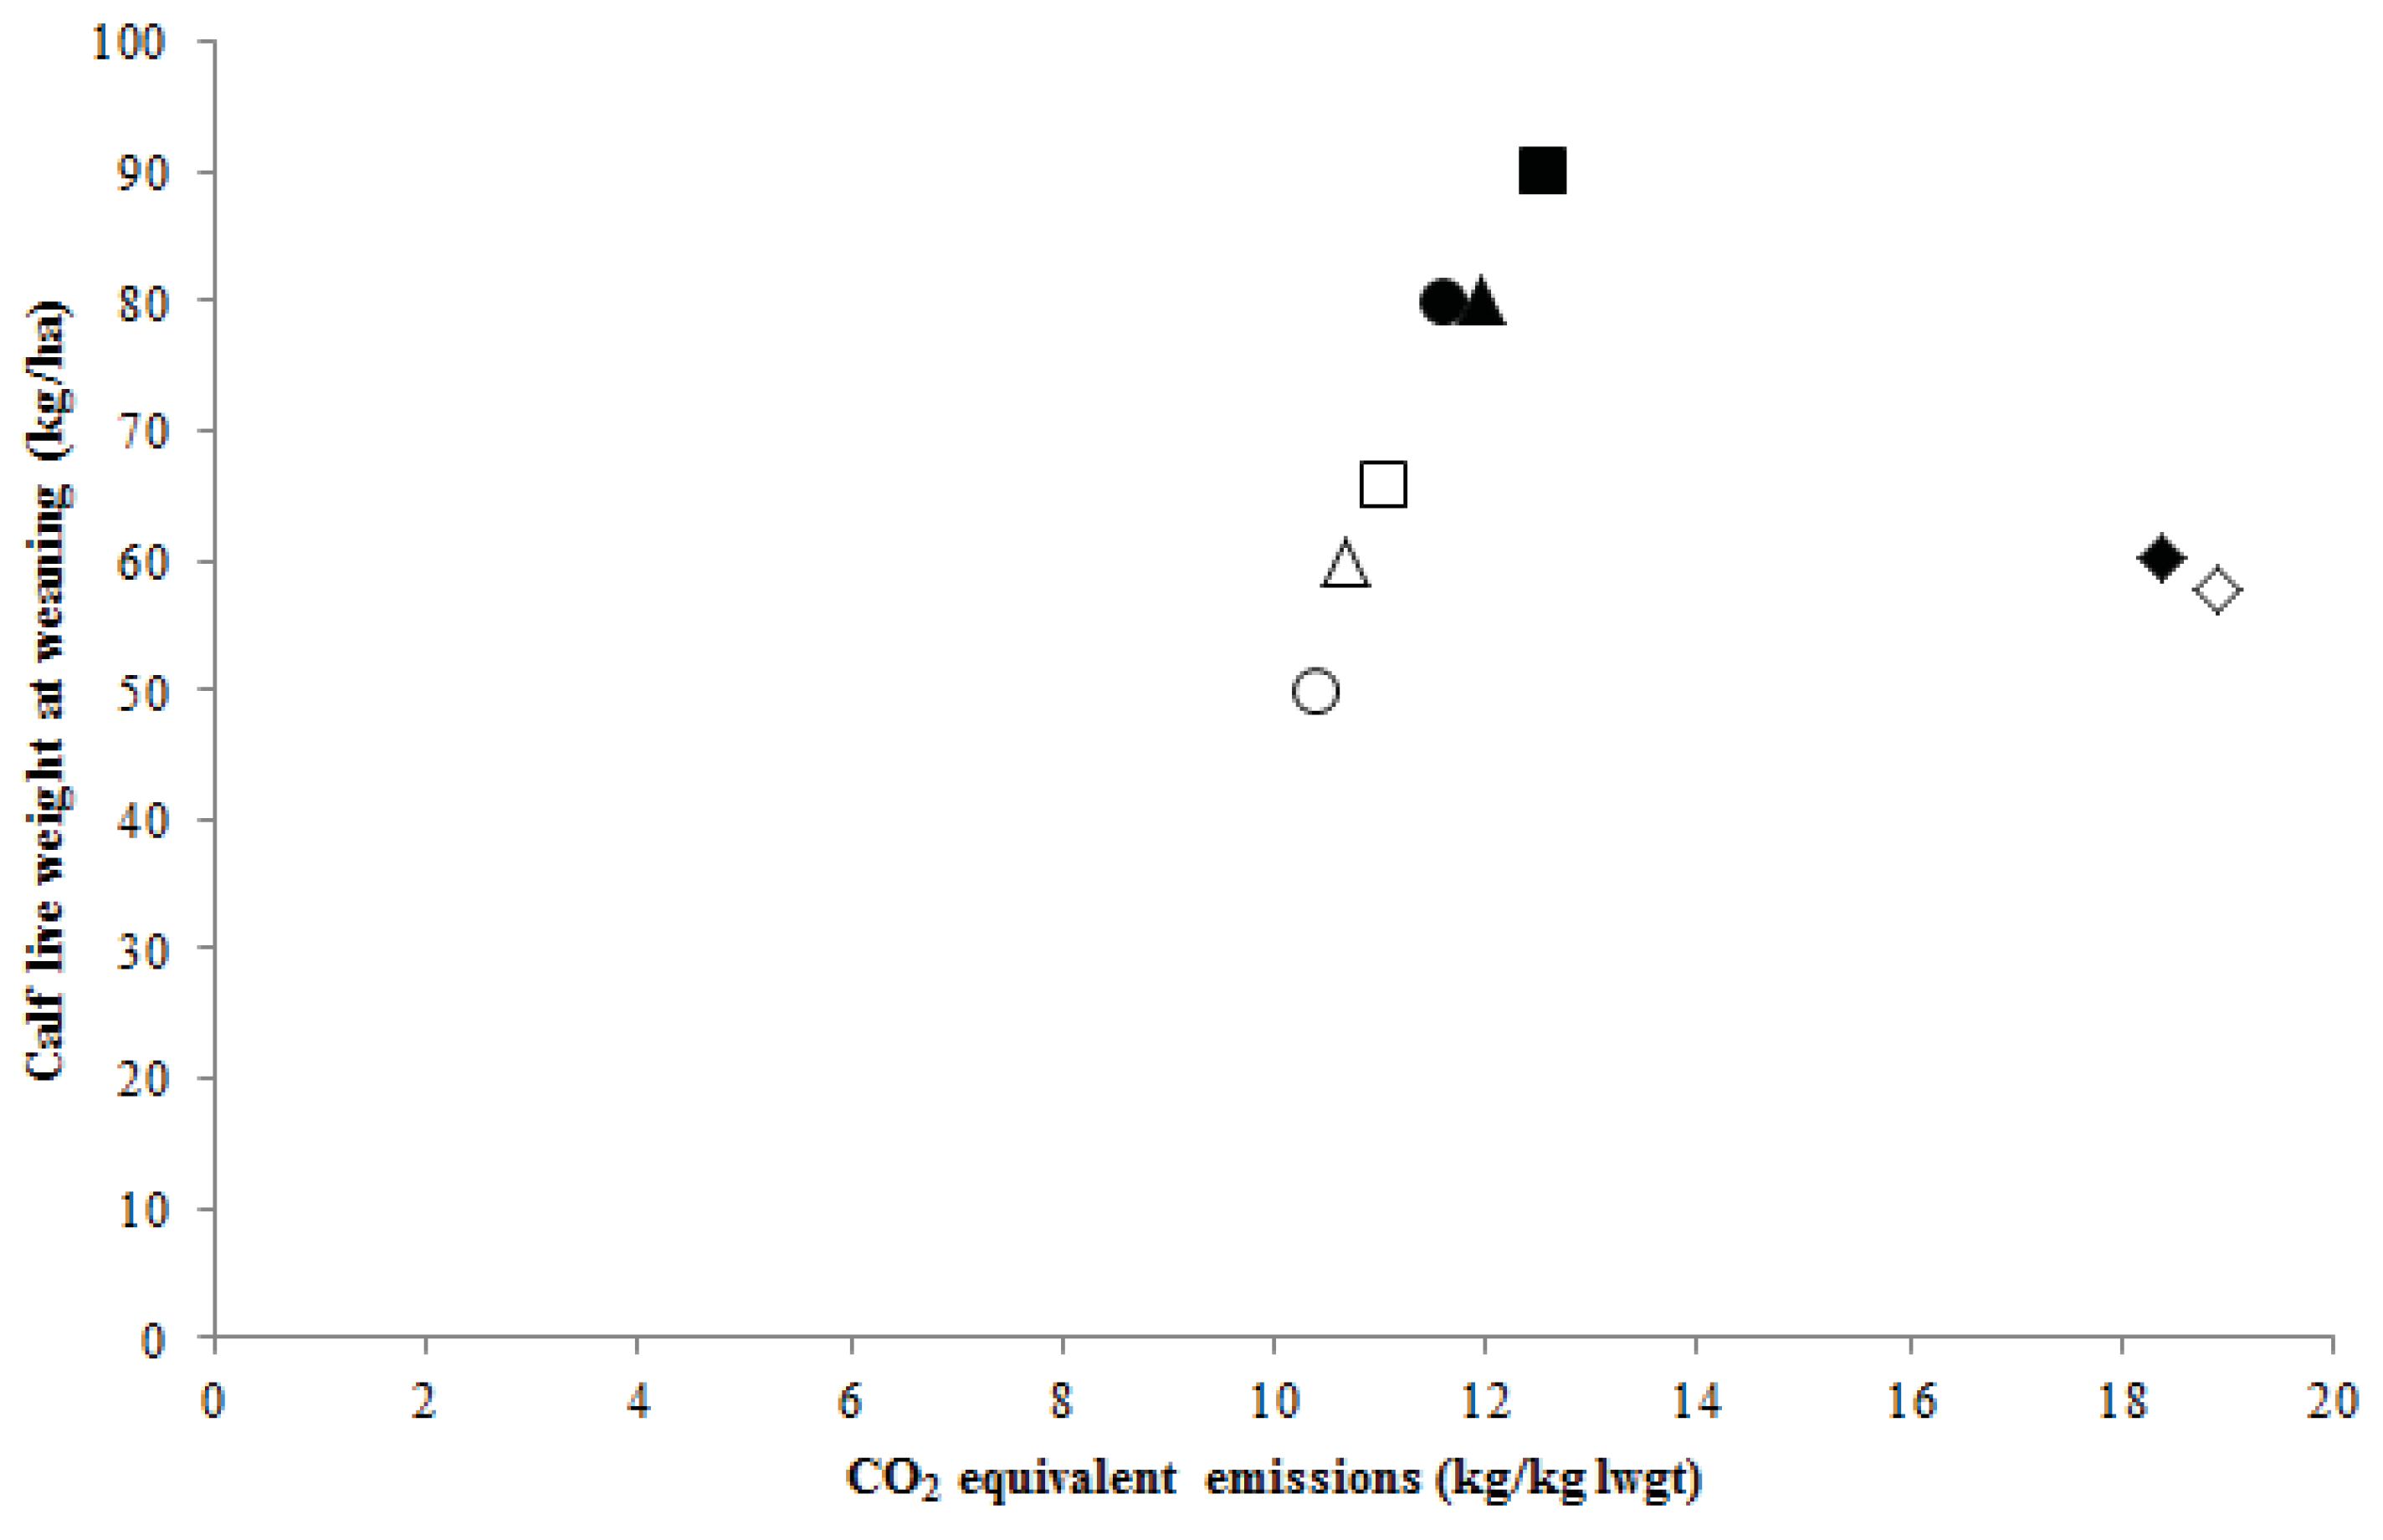
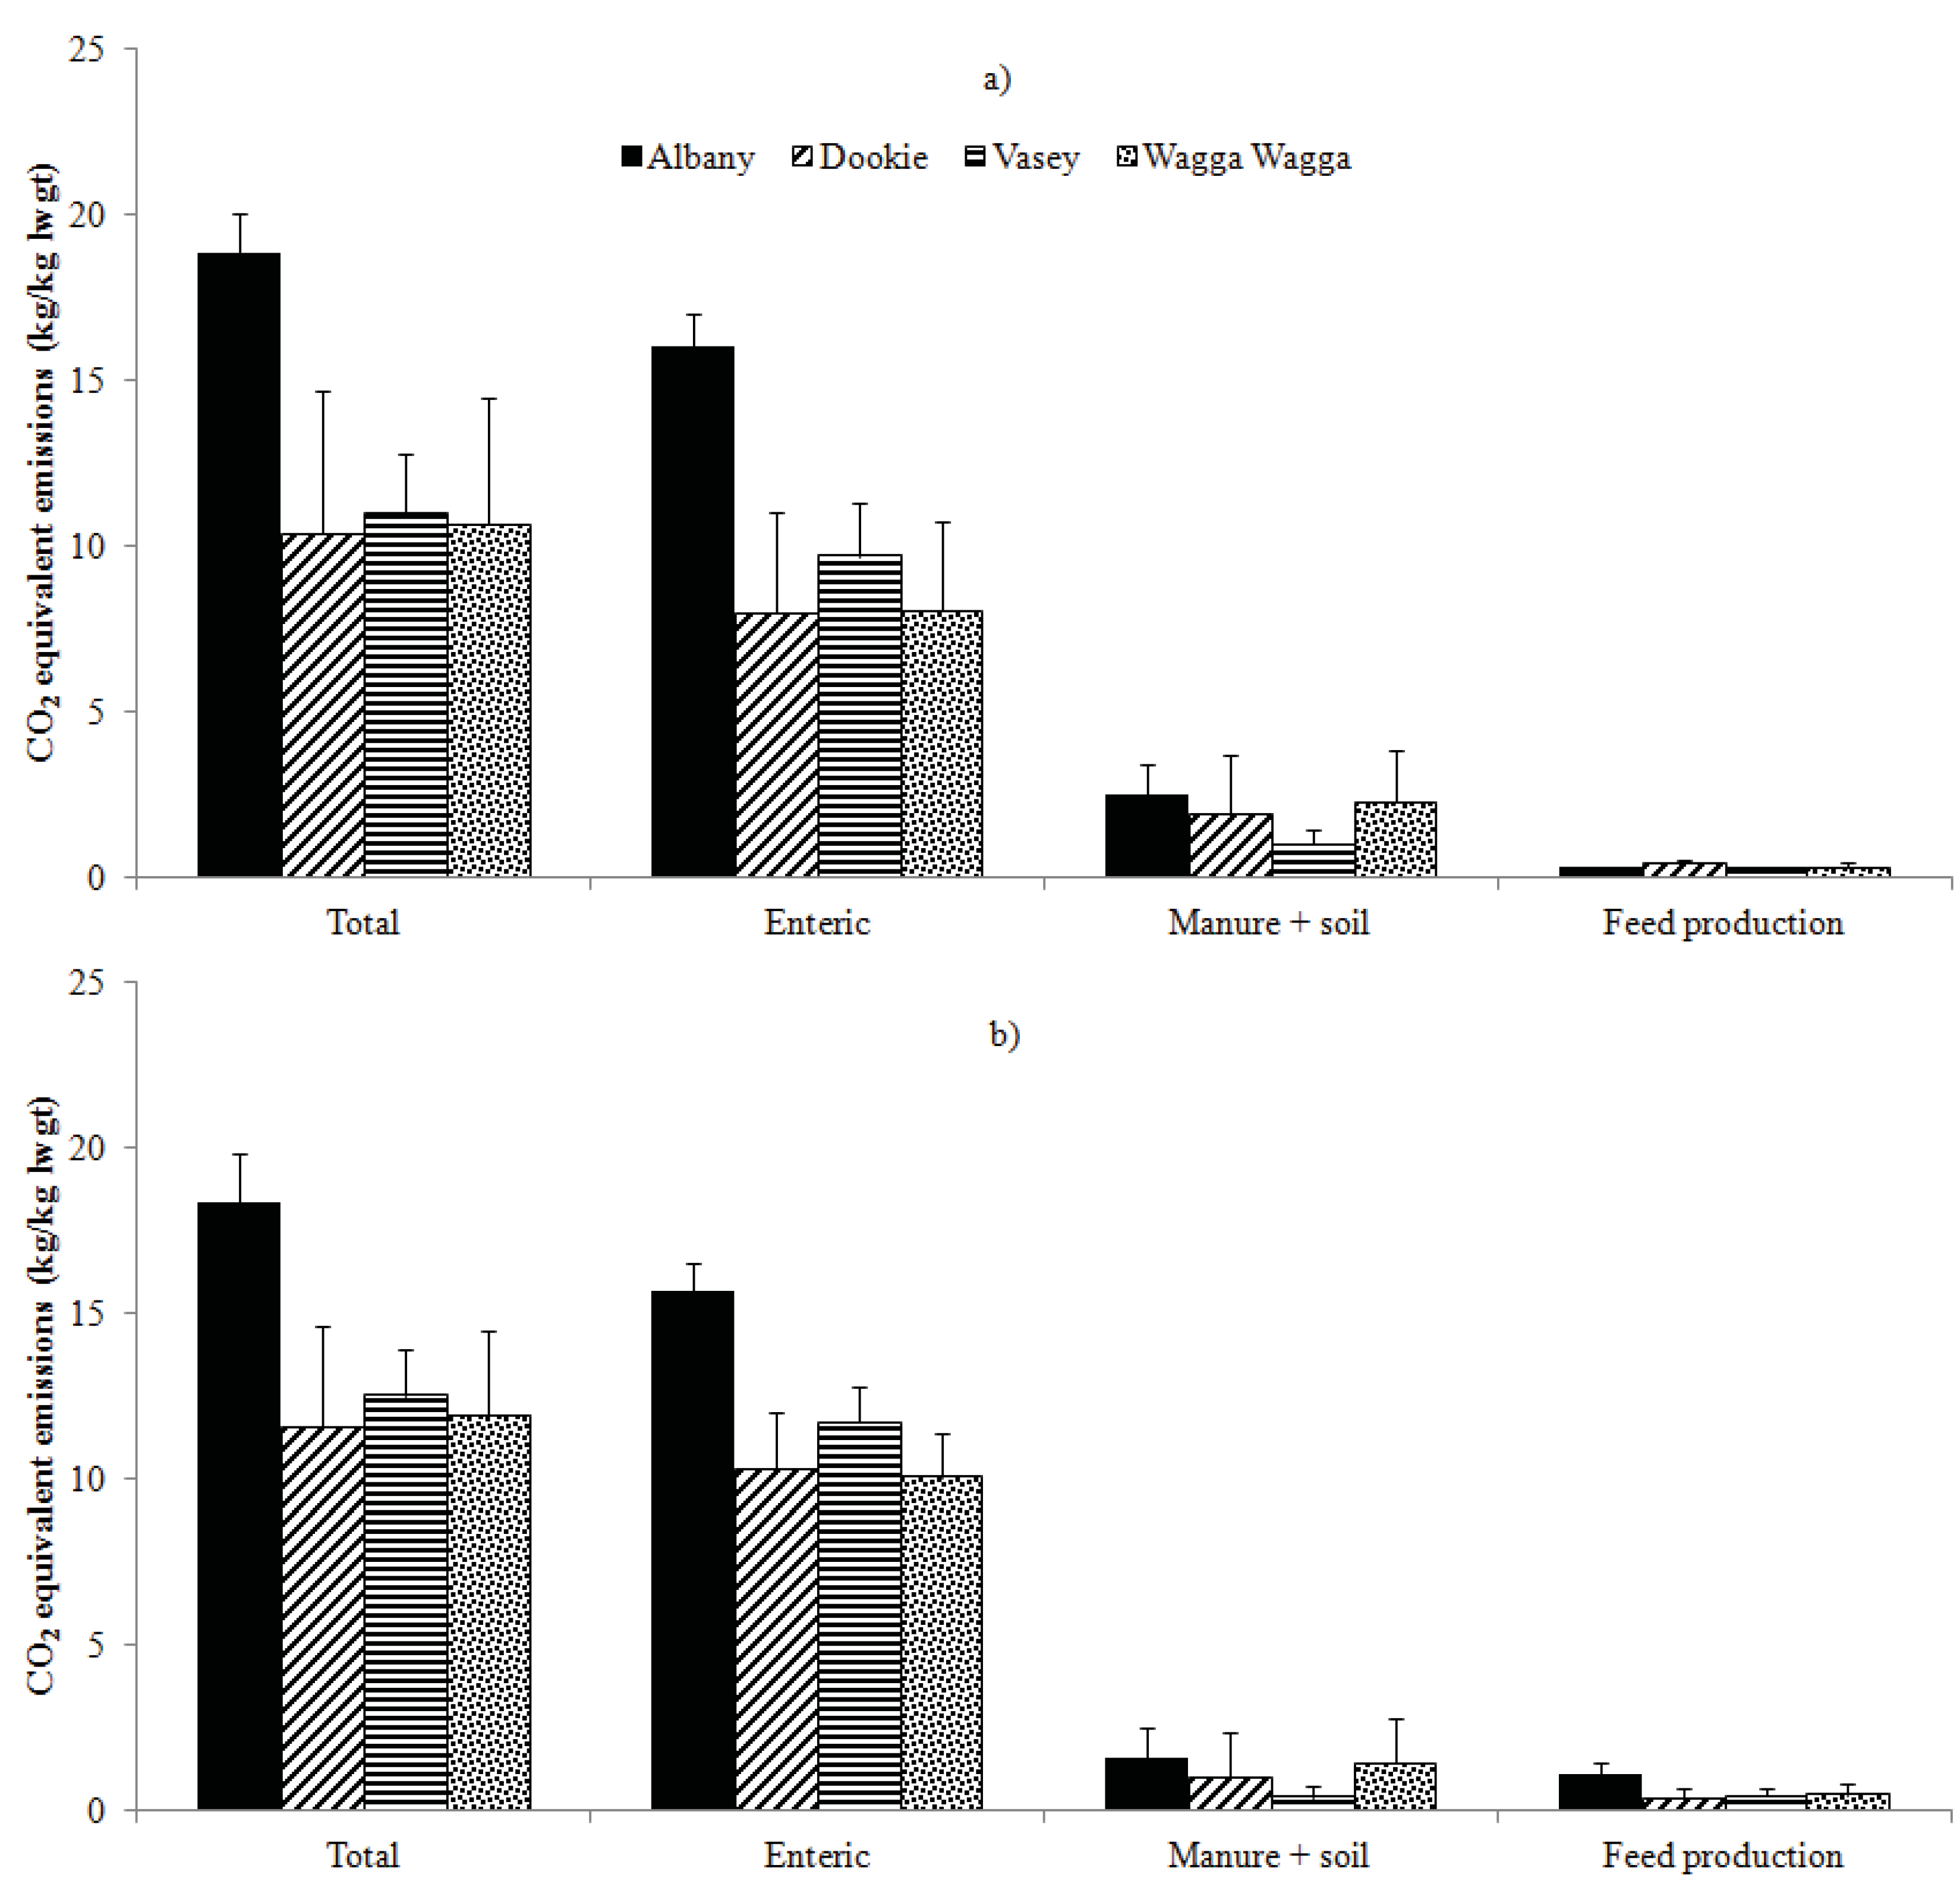
3.2. Greenhouse Gas Emissions and Productivity
| Site | Units | Pasture | Pasture + supplementary feed |
|---|---|---|---|
| Albany | Kikuyu/subclover pasture and Stocking rate 0.6 cows/ha | ||
| Enteric CH4 | kg CO2-eq./ha | 926 (68) | 944 (51) |
| Enteric CH4 | % GEI | 7.4 (0.1) | 7.4 (0.1) |
| Enteric CH4 | g CH4/kg DDM | 40.6 (0.3) | 40.6 (0.3) |
| Manure CH4 | kg CO2-eq./ha | 29.7 (2.7) | 30.2 (2.2) |
| Leaching | kg CO2-eq./ha | 5.3 (3.1) | 5.2 (2.9) |
| Volatilisation | kg CO2-eq./ha | 12.6 (2.2) | 12.8 (2.5) |
| Denitrification | kg CO2-eq./ha | 99.3 (54.7) | 100 (56.3) |
| Legume fixation | kg N/ha | 58.4 (18.6) | 64.7 (17.2) |
| Total CO2-eq. | t/ha | 1.1 (0.1) | 1.1 (0.1) |
| Dookie | Phalaris/subclover/annual ryegrass pasture and Stocking rate 0.8 cows/ha | ||
| Enteric CH4 | kg CO2-eq./ha | 427 (260) | 825 (137) |
| Enteric CH4 | % GEI | 7.8 (0.1) | 7.8 (0.1) |
| Enteric CH4 | g CH4/kg DDM | 42.4 (1.0) | 41.2 (0.6) |
| Manure CH4 | kg CO2-eq./ha | 12.6 (7.4) | 22.9 (4.3) |
| Leaching | kg CO2-eq./ha | 0.1 (0.3) | 0.2 (0.3) |
| Volatilisation | kg CO2-eq./ha | 5.3 (3.9) | 7.9 (2.7) |
| Denitrification | kg CO2-eq./ha | 93.9 (110.9) | 100 (112) |
| Legume fixation | kg N/ha | 16.4 (6.0) | 16.9 (6.5) |
| Total CO2-eq. | t/ha | 0.6 (0.4) | 0.9 (0.2) |
| Vasey | Phalaris/subclover pasture and Stocking rate 0.9 cows/ha | ||
| Enteric CH4 | kg CO2-eq./ha | 645 (148) | 1055 (98) |
| Enteric CH4 | % GEI | 7.8 (0.1) | 7.8 (0.1) |
| Enteric CH4 | g CH4/kg DDM | 41.9 (0.5) | 40.8 (0.3) |
| Manure CH4 | kg CO2-eq./ha | 18.7 (4.2) | 29.7 (3.2) |
| Leaching | kg CO2-eq./ha | 1.6 (1.8) | 1.8 (2.0) |
| Volatilisation | kg CO2-eq./ha | 8.8 (2.8) | 12.1 (3.3) |
| Denitrification | kg CO2-eq./ha | 42.6 (23.0) | 47.0 (23.9) |
| Legume fixation | kg N/ha | 26.2 (7.8) | 29.8 (7.2) |
| Total CO2-eq. | t/ha | 0.7 (0.2) | 1.1 (0.1) |
| Wagga Wagga | Phalaris/subclover/annual ryegrass pasture and Stocking rate 0.8 cows/ha | ||
| Enteric CH4 | kg CO2-eq./ha | 501 (228) | 807 (104) |
| Enteric CH4 | % GEI | 7.9 (0.1) | 7.9 (0.1) |
| Enteric CH4 | g CH4/kg DDM | 42.0 (0.9) | 41.2 (0.6) |
| Manure CH4 | kg CO2-eq./ha | 14.1 (6.2) | 22.1 (3.2) |
| Leaching | kg CO2-eq./ha | 0.001 (0.003) | 0.002 (0.004) |
| Volatilisation | kg CO2-eq./ha | 6.8 (3.6) | 9.2 (2.9) |
| Denitrification | kg CO2-eq./ha | 124.3 (97.1) | 136 (106) |
| Legume fixation | kg N/ha | 18.0 (6.0) | 19.3 (6.6) |
| Total CO2-eq. | t/ha | 0.7 (0.3) | 1.0 (0.2) |

4. Discussion
4.1. Productivity
4.2. Greenhouse Gas Emissions and Productivity
5. Conclusions
Acknowledgments
Conflict of Interest
Appendix
References
- Steinfeld, H.; Gerber, P.; Wassenaar, T.; Castel, V.; Rosales, M.; de Haan, C. Livestock’s Long Shadow—Environmental Issues and Options; FAO Report; FAO: Rome, Italy, 2006. [Google Scholar]
- Intergovernmental Panel on Climate Change, Climate Change Series; Cambridge University Press: New York, NY, USA, 2007.
- The Australian Government Submission to the UN Framework Convention on Climate Change; National Inventory Report 2007—Volume 1; Department of Climate Change and Energy Efficiency: Canberra, ACT, Australia, 2009.
- Cullen, B.R.; Johnson, I.R.; Eckard, R.J.; Lodge, G.M.; Walker, R.G.; Rawnsley, R.P.; McCaskill, M.R. Climate change effects on pasture systems in south-eastern Australia. Crop Pasture Sci. 2009, 60, 933–942. [Google Scholar] [CrossRef]
- Howden, S.M.; Crimp, S.J.; Stokes, C.J. Climate change and Australian livestock systems: Impacts, research and policy issues. Aust. J. Exp. Agric. 2008, 48, 780–788. [Google Scholar] [CrossRef]
- Ash, A.J.; Prinsen, J.H.; Myles, D.J.; Hendricksen, R.E. Short-term effects of burning native pasture in spring on herbage and animal production in south-east Queensland. Proc. Austr. Soc. Anim. Prod. 1982, 14, 377–380. [Google Scholar]
- Boeckx, P.; van Cleemput, O. Estimates of N2O and CH4 fluxes from agricultural lands in various regions in Europe. Nutr. Cycl. Agroecosyst. 2001, 60, 35–47. [Google Scholar] [CrossRef]
- Eckard, R.J.; Cullen, B.R. Impacts of future climate scenarios on N2O emissions from pasture-based dairy systems in SE Australia. Anim. Feed Sci. Technol. 2011, 166-167, 736–748. [Google Scholar] [CrossRef]
- Cullen, B.R.; Eckard, R.J. Impacts of future climate scenarios on the balance between productivity and total greenhouse gas emissions from pasture based dairy systems in south-eastern Australia. Anim. Feed Sci. Technol. 2011, 166-167, 721–735. [Google Scholar] [CrossRef]
- Bell, M.; Eckard, R.; Cullen, B. The effect of future climate scenarios on the balance between productivity and greenhouse gas emissions from sheep grazing systems. Livest. Sci. 2012, 147, 126–138. [Google Scholar] [CrossRef]
- Mason, W.K.; Lamb, K.; Russell, B. The Sustainable Grazing Systems Program: New solutions for livestock producers. Aust. J. Exp. Agric. 2003, 43, 663–672. [Google Scholar] [CrossRef]
- Andrew, M.H.; Lodge, G.M. The Sustainable Grazing Systems National Experiment: 1. Introduction and Methods. J. Exp. Agric. 2003, 43, 695–709. [Google Scholar] [CrossRef]
- Johnson, I.R.; Lodge, G.M.; White, R.E. The Sustainable Grazing Systems Pasture Model: Description, philosophy and application to the SGS National Experiment. Aust. J. Exp. Agric. 2003, 43, 711–728. [Google Scholar] [CrossRef]
- Sandford, P.; Wang, X.; Greathead, K.D.; Gladman, J.H.; Speijers, J. Impact of Tasmanian blue gum belts and kikuyu-based pasture on sheep production and groundwater recharge in south-western Western Australia. Aust. J. Exp. Agric. 2003, 43, 755–767. [Google Scholar] [CrossRef]
- Ridley, M.; Christy, B.P.; White, R.E.; McLean, T.; Green, R. North-East Victoria SGS National Experiment site: Water and nutrient losses from grazing systems on contrasting soil types and levels of inputs. Aust. J. Exp. Agric. 2003, 43, 799–815. [Google Scholar] [CrossRef]
- Chapman, D.F.; McCaskill, M.R.; Quigley, P.E.; Thompson, A.N.; Graham, J.F.; Borg, D.; Lamb, J.; Kearney, G.; Saul, G.R.; Clark, S.G. Effect of grazing method and fertiliser inputs on the productivity and sustainability of phalaris-based pastures in Western Victoria. Aust. J. Exp. Agric. 2003, 43, 785–798. [Google Scholar] [CrossRef]
- Isbell, R.F. Australian Soil and Land Survey Handbook: The Australian Soil Classification; CSIRO Publishing: Collingwood, VIC, Australia, 1996. [Google Scholar]
- Cullen, B.R.; Eckard, R.J.; Callow, M.N.; Johnson, I.R.; Chapman, D.F.; Rawnsley, R.P.; Garcia, S.C.; White, T.; Snow, V.O. Simulating pasture growth rates in Australian and New Zealand grazing systems. Aust. J. Exp. Agric. 2008, 59, 761–768. [Google Scholar]
- Johnson, I.R.; Chapman, D.F.; Snow, V.O.; Eckard, R.J.; Parsons, A.J.; Lambert, M.G.; Cullen, B.R. DairyMod and EcoMod: Biophysical pastoral simulation models for Australia and New Zealand. Aust. J. Exp. Agric. 2008, 48, 621–631. [Google Scholar] [CrossRef]
- Lodge, G.M.; Johnson, I.R. Agricultural drought analyses for temperate Australia using a biophysical pasture model. 1. Identifying and characterising drought periods. Aust. J. Exp. Agric. 2008, 59, 1049–1060. [Google Scholar]
- Jeffrey, S.J.; Carter, J.O.; Moodie, K.M.; Beswick, A.R. Using spatial interpolation to construct a comprehensive archive of Australian climate data. Environ. Modell. Softw. 2001, 16, 309–330. [Google Scholar] [CrossRef]
- McDowall, M.M.; Hall, D.J.M.; Johnson, D.A.; Bowyer, J.; Spicer, P. Kikuyu and annual pasture: A characterization of a productive and sustainable beef production system on the South Coast of Western Australia. Aust. J. Exp. Agric. 2003, 43, 769–783. [Google Scholar] [CrossRef]
- Drought Feeding and Management of Beef Cattle: A Guide for Farmers and Land Managers; Department of Primary Industries, Victorian Government: Melbourne, Australia, 2007.
- Neal, M.; Neal, J.; Fulkerson, W.J. Optimal choice of dairy forages in eastern Australia. J. Dairy Sci. 2007, 90, 3044–3059. [Google Scholar] [CrossRef]
- Bell, M.J.; Wall, E.; Russell, G.; Simm, G.; Stott, A.W. The effect of improving cow productivity, fertility, and longevity on the global warming potential of dairy systems. J. Dairy Sci. 2011, 94, 3662–3678. [Google Scholar] [CrossRef]
- Guinee, J.B.; Gorree, M.; Heijungs, R.; Huppes, G.; Kleijn, R.; De Koning, A.; van Oers, L.; Wegener Sleeswijk, A.; Suh, S.; Udo de Haes, H.A.; de Bruijn, H.; van Duin, R.; Huijbregts, M.A.J.; Lindeijer, E.; Roorda, A.A.H.; van der Ven, B.L.; Weidema, B.P. Handbook on Life Cycle Assessment: Operational Guide to the ISO Standards; Kluwer Academic Publishers: Leiden, The Netherlands, 2002. [Google Scholar]
- McCaskill, M.R.; Ridley, A.M.; Okom, A.; White, R.E.; Andrew, M.H.; Michalk, D.L.; Melland, A.; Johnston, W.H.; Murphy, S.R. SGS Nutrient Theme: environmental assessment of nutrient application to extensive pastures in the high rainfall zone of southern Australia. Aust. J. Exp. Agric. 2003, 43, 927–944. [Google Scholar] [CrossRef]
- White, R.E.; Christy, B.P.; Ridley, A.M.; Okom, A.E.; Murphy, S.R.; Johnston, W.H.; Michalk, D.L.; Sanford, P.; McCaskill, M.R.; Johnson, I.R.; Garden, D.L.; Hall, D.J.M.; Andrew, M.H. SGS Water Theme: Influence of soil, pasture type and management on water use in grazing systems across the high rainfall zone of southern Australia. Aust. J. Exp. Agric. 2003, 43, 907–926. [Google Scholar] [CrossRef]
- Sandford, P.; Cullen, B.R.; Dowling, P.M.; Chapman, D.F.; Garden, D.L.; Lodge, G.M.; Andrew, M.H.; Quigley, P.E.; Murphy, S.R.; McG King, W.; Johnson, W.H.; Kemp, D.R. SGS Pasture Theme: Effect of climate, soil factors and management on pasture production and stability across the high rainfall zone of southern Australia. Aust. J. Exp. Agric. 2003, 43, 945–959. [Google Scholar] [CrossRef]
- Morgan, J.A.; LeCain, D.R.; Pendall, E.; Blumenthal, D.M.; Kimball, B.A.; Carrillo, Y.; Williams, D.G.; Heisler-White, J.; Dijkstra, F.A.; West, M. C4 grasses prosper as carbon dioxide eliminates desiccation in warmed semi-arid grassland. Nature 2011, 476, 202–205. [Google Scholar] [CrossRef]
- Eckard, R.J.; Grainger, C.; de Klein, C.A.M. Options for the abatement of methane and nitrous oxide from ruminant production: A review. Livest. Sci. 2010, 130, 47–56. [Google Scholar] [CrossRef]
- Martin, C.; Morgavi, D.P.; Doreau, M. Methane mitigation in ruminants: From microbe to the farm scale. Animal 2010, 4, 351–365. [Google Scholar] [CrossRef]
- Cottle, D.J.; Nolan, J.V.; Wiedemann, S.G. Ruminant enteric methane mitigation: A review. Anim. Prod. Sci. 2011, 51, 491–514. [Google Scholar] [CrossRef]
- Ulyatt, M.J.; Lassey, K.R.; Shelton, I.D.; Walker, C.F. Methane emission from dairy cows and wether sheep fed subtropical grass-dominant pastures in midsummer in New Zealand. New Zeal. J. Agr. Res. 2002, 45, 227–234. [Google Scholar] [CrossRef]
- Blaxter, K.L.; Clapperton, J.L. Prediction of the amount of methane produced by ruminants. Brit. J. Nutr. 1965, 19, 511–522. [Google Scholar] [CrossRef]
- Kennedy, P.M.; Charmley, E. Methane yields from Brahman cattle fed tropical grasses and legumes. Anim. Prod. Sci. 2012, 52, 225–239. [Google Scholar] [CrossRef]
- Alcock, D.J.; Hegarty, R.S. Potential effects of animal management and genetic improvement on enteric methane emissions, emissions intensity and productivity of sheep enterprises at Cowra, Australia. Anim. Feed Sci. Technol. 2011, 166-167, 749–760. [Google Scholar] [CrossRef]
- Biswas, W.K.; Graham, J.; Kelly, K.; John, M.B. Global warming contributions from wheat, sheep meat and wool production in Victoria, Australia—A life cycle assessment. J. Clean. Prod. 2010, 18, 1386–1392. [Google Scholar] [CrossRef]
- Basset-Mens, C.; Ledgard, S.; Boyes, M. Eco-efficiency of intensification scenarios for milk production in New Zealand. Ecol. Econ. 2009, 68, 1615–1625. [Google Scholar] [CrossRef]
- Peters, G.M.; Rowley, H.V.; Wiedemann, S.; Tucker, R.; Short, M.D.; Schulz, S. Red meat production in Australia: Life cycle assessment and comparison with overseas studies. Environ. Sci. Technol. 2010, 44, 1327–1332. [Google Scholar]
- Beauchemin, K.A.; Janzen, H.H.; Little, S.M.; McAllister, T.A.; McGinn, S.M. Mitigation of greenhouse gas emissions from beef production in western Canada—Evaluation using farm-based life cycle assessment. Anim. Feed Sci. Technol. 2011, 166-167, 663–677. [Google Scholar] [CrossRef]
- Browne, N.A.; Eckard, R.J.; Behrendt, R.; Kingwell, R.S. A comparative analysis of on-farm greenhouse gas emissions from agricultural enterprises in south eastern Australia. Anim. Feed Sci. Technol. 2011, 166-167, 641–652. [Google Scholar] [CrossRef]
- Eckard, R.J.; Johnson, I.; Chapman, D.F. Modelling nitrous oxide abatement strategies in intensive pasture systems. Int. Congr. Ser. 2006, 1293, 76–85. [Google Scholar] [CrossRef]
- Dalal, R.; Wang, W.; Robertson, G.; Parton, W. Nitrous oxide emission from Australian agricultural lands and mitigation options: A review. Aust. J. Soil Res. 2003, 41, 165–195. [Google Scholar] [CrossRef]
- Mitchell, P.J. Gross energy levels in regrowths of six pasture species, and relations with digestibility and chemical composition. Aust. J. Exp. Agric. 1974, 14, 33–37. [Google Scholar] [CrossRef]
- McDonald, P.; Henderson, A.R.; Ralton, I. Energy changes during ensilage. J. Sci. Food Agric. 1973, 24, 827–834. [Google Scholar] [CrossRef]
- Donaldson, E.; Edwards, R.A. Feeding value of silage: Silages made from freshly cut grass, wilted grass and formic acid treated wilted grass. J. Sci. Food Agric. 1976, 27, 536–544. [Google Scholar] [CrossRef]
- Nottle, M.C. Digestible energy of wheat and oat grains when fed to sheep. Aust. J. Exp. Agric. 1971, 11, 610–614. [Google Scholar] [CrossRef]
- Intergovernmental Panel on Climate Change, 2006 IPCC Guidelines for National Greenhouse Gas Inventories. In Agriculture, Forestry and other Land Use; Eggleston, H.S.; Buendia, L.; Miwa, K.; Ngara, T.; Tanabe, K. (Eds.) Institute for Global Environmental Strategies (IGES): Hayama, Japan, 2006; Volume 4.
- Bell, M.; Cullen, B.; Eckard, R. Effect on nitrogen losses from a sheep grazing system by the randomised distribution of excreta. In Proceedings of International Congress on Modelling and Simulation, Perth, Australia, 12–16 December; 2011. [Google Scholar]
- Granli, T.; Bøckman, O.C. Nitrous oxide from agriculture. Norw. J. Agr. Sci. Suppl. 1994, 12, 7–128. [Google Scholar]
- Vleeshouwer, L.M.; Verhagen, A. Carbon emission and sequestration by agricultural land use: A model study for Europe. Global Change Biol. 2002, 8, 519–530. [Google Scholar] [CrossRef]
- Wells, C. Total Energy Indicators of Agricultural Sustainability: Dairy Farming Case Study; Ministry of Agriculture and Forestry: Wellington, New Zealand, 2001. [Google Scholar]
- Lovett, D.K.; Shalloo, L.; Dillon, P.; O’Mara, F.P. A systems approach to quantify greenhouse gas fluxes from pastoral dairy production as affected by management regime. Agr. Syst. 2006, 88, 156–179. [Google Scholar] [CrossRef]
© 2012 by the authors; licensee MDPI, Basel, Switzerland. This article is an open access article distributed under the terms and conditions of the Creative Commons Attribution license (http://creativecommons.org/licenses/by/3.0/).
Share and Cite
Bell, M.J.; Cullen, B.R.; Eckard, R.J. The Influence of Climate, Soil and Pasture Type on Productivity and Greenhouse Gas Emissions Intensity of Modeled Beef Cow-Calf Grazing Systems in Southern Australia. Animals 2012, 2, 540-558. https://doi.org/10.3390/ani2040540
Bell MJ, Cullen BR, Eckard RJ. The Influence of Climate, Soil and Pasture Type on Productivity and Greenhouse Gas Emissions Intensity of Modeled Beef Cow-Calf Grazing Systems in Southern Australia. Animals. 2012; 2(4):540-558. https://doi.org/10.3390/ani2040540
Chicago/Turabian StyleBell, Matthew J., Brendan R. Cullen, and Richard J. Eckard. 2012. "The Influence of Climate, Soil and Pasture Type on Productivity and Greenhouse Gas Emissions Intensity of Modeled Beef Cow-Calf Grazing Systems in Southern Australia" Animals 2, no. 4: 540-558. https://doi.org/10.3390/ani2040540