Selection of Meat Inspection Data for an Animal Welfare Index in Cattle and Pigs in Denmark


Section for Animal Welfare and Disease Control, Department of Veterinary and Animal Sciences, University of Copenhagen, DK-1870 Frederiksberg C, Denmark
*
Author to whom correspondence should be addressed.
Animals 2017, 7(12), 94; https://doi.org/10.3390/ani7120094
Submission received: 27 September 2017
/
Revised: 27 November 2017
/
Accepted: 5 December 2017
/
Published: 6 December 2017
(This article belongs to the Special Issue Proceedings of 7th International Conference on the Assessment of Animal Welfare at Farm and Group Level)
Abstract
:Simple Summary
Despite being important to the general public, the monitoring of animal welfare is not systematic. The Danish political parties agreed in 2012 to establish national animal welfare indices for cattle and pigs, and here we assess the potential for using data from the systematic meat inspection to contribute to such indices. We demonstrate that although a number of recordings may be relevant for animal welfare, differences in recording practices between slaughterhouses can be so large that correction is not deemed feasible. For example, significant differences in tail fractures in pigs and sows were recorded between abattoirs, despite the fact that this condition should be easier to diagnose compared to e.g., the more consistently recorded “chronic arthritis” in cows. The study findings suggest that some recordings may be useful for inclusion in animal welfare indices, but that their relevance should be assessed along with the recording practices if included. Furthermore, factors such as appropriate behaviour are also important to monitor as part of the welfare of both cattle and pigs.
Abstract
National welfare indices of cattle and pigs are constructed in Denmark, and meat inspection data may be used to contribute to these. We select potentially welfare-relevant abattoir recordings and assess the sources of variation within these with a view towards inclusion in the indices. Meat inspection codes were pre-selected based on expert judgement of having potential animal welfare relevance. Random effects logistic regression was then used to determine the magnitude of variation derived at the level of the farm or abattoir, of which farm variation might be associated with welfare, whereas abattoir variation is most likely caused by differences in recording practices. Codes were excluded for use in the indices based on poor model fit or a large abattoir effect. There was a large abattoir effect for most of the codes modelled and these codes were deemed to be not appropriate to be carried forward to the welfare index. A few were found to be potentially useful for a welfare index: Eight for slaughter pigs, 15 for sows, five for cattle <18 months of age, and six for older cattle. The absolute accuracy of each code/combination could not be assessed, only the relative variation between farms and abattoirs.
1. Introduction
In 2012, a joint agreement between the political parties represented in the Danish parliament decided to establish animal welfare indices [1]. The purpose of the development of national indices for cattle and pigs was to enable surveillance of the state of animal welfare nationally and in the longer term decide areas where animal welfare can be improved. Animal welfare is, however, a multifactorial concept with different stakeholders traditionally thought to emphasise different aspects [2,3,4]. To create an index that is transparent it was decided to choose a hedonistic approach to animal welfare. This approach places the emphasis on the experiences of the animal [5], with the consequence that e.g., disease or reduced growth are only taken into account if they have an impact on the affective state of the animal. This is the same approach as the one taken in the EU-project Welfare Quality [6]. The indices were to be constructed using farm visits, but in order to make the monitoring as efficient and cheap as possible, there was also a desire to include register data whenever possible.
Meat inspection is carried out routinely on all cattle and pigs carcasses according to legislation from EU and Denmark [7,8] in order to safeguard food and animal welfare at slaughter. The meat inspection data may also be used for purposes such as creation of an index of animal welfare. A number of challenges exist prior to such use. For example, all meat inspection parameters recorded for food safety reasons are not necessarily relevant in relation to animal welfare at the farm, and some are related to acute disease conditions, which may have occurred during transport, and some are fairly non-specific recordings. Furthermore, differences in recording practices and thresholds may differ between slaughterhouses [9,10,11], which may result in differences in sensitivity and specificity of the meat inspection data in relation to the intended target conditions between the slaughterhouses. Finally, rare conditions may be difficult to appraise statistically, although they are of sufficient severity to highly motivate inclusion in a welfare index.
The objectives of the present study were to provide a statistical assessment of meat inspection data to (a) select codes of relevance to an animal welfare index based on prevalence and welfare impact; (b) assess the contribution of each slaughterhouse on the variation in prevalence of each relevant meat inspection variable; and (c) provide estimates of a correction factor for each slaughterhouse for each of the relevant meat inspection code.
The assessments were done separately for cattle aged <18 months (hereafter denoted ‘calf’), cattle aged ≥18 months (hereafter denoted ‘cow’), slaughter pigs, and sows.
2. Materials and Methods
Meat inspection data for 2012 were provided by the Danish Veterinary and Food Administration (Glostrup, Denmark) and used for the data analyses. The meat inspections are done by official technicians as laid down in the EU legislation [7]. A specific protocol is given in a government circular [8], according to which an official veterinarian has the overall responsibility of the recording as specified in the EU legislation. Observations are recorded electronically at the carcass inspection station and verified by government veterinarians and uploaded to a meat inspection database located with the Danish Food and Agricultural Council (Axelborg, Copenhagen V, Denmark). The data were summarised into the number of animals slaughtered and prevalence of code, for each combination of farm of origin, abattoir, animal type (pig, sow, calf, cow), and slaughter date. Data were provided from all major pig (n = 9) and sow (n = 3) abattoirs, including 5381 pig farms and 1781 sow farms. Slaughterhouses processing relatively few cattle were excluded, i.e., all slaughterhouses with less than 10,000 cattle slaughtered in 2012 were not included in the following analyses. This resulted in data from eight slaughterhouses being used, with a total of 10,718 farms providing data for cows and 7019 farms providing data on calves. Cows and calves were slaughtered in the same abattoirs, whereas pigs and sows were slaughtered in separate plants. Due to the purpose of the study, namely to create an index reported annually, observations from all dates were then combined at the level of farm, abattoir, code and animal type. This was referred to as a “batch”, i.e., a batch consisted of the number of pigs, sows, cattle <18 months, or cattle ≥18 months of age slaughtered at a specific abattoir from a specific farm within 2012.
2.1. Exclusion of Codes
Some irrelevant “commercial codes” (such as information about contamination, missing organs and slaughter line issues) were excluded from the data. Specific meat inspection codes were also excluded where they were not deemed relevant to the purpose of the study, which was to assess changes in on-farm welfare of cattle and pigs, excluding transport to the abattoir and slaughter. Consequently, codes were excluded due to (a) possibly being related to transport; (b) acute conditions, which could have occurred during transport; (c) central nervous system (CNS) conditions, while they are relatively unspecific and difficult to assess at the abattoir; (d) not related to animal welfare (when using the hedonistic definition mentioned previously); and (e) being non-specific conditions. Further, codes were excluded if they had a low prevalence combined with a low impact on welfare.
All individual codes were 3-digit (listed in Appendix A). Codes that were judged to be equivocations as far as animal welfare was concerned were collapsed into a single category. For example, all codes associated to included liver conditions in cattle were collapsed (374, 375, 377, 379, 381 to 374375377379381), and abscesses were collapsed to 570577580584585 irrespective if they occurred in the front part (570), mid-part (577), rear part (580), extremities (584) or head (585). If an animal had one of these conditions, it was classified as having the condition. The decisions were based on consensus between three of the authors (Hans Houe, Søren Saxmose Nielsen, Björn Forkman) and other experts (Sine Andreassen and Anne Marie Michelsen). See Appendix A, Table A1 (pigs) and Table A2 (cattle) for specific descriptions of the individual codes.
2.2. Estimation of Abattoir Effects for Each Code and Category
Random effects logistic regression using R [12] was done as described in detail in Denwood et al. [13]. Briefly, the random effect logistic regression models were fitted using the glmer-function in the lme4 package in R [14]. The random effects model with binomial response was used to assess the relative variance explained by the farm of origin, abattoir, and residual extra-binomial variance at the level of “batch” observation (interaction of Farm and Abattoir). Models were fitted separately for each combination of animal type and code. To assess if abattoir and farm effects were present, the statistical significance of the random effects of Abattoir and Farm were individually tested using a numerical approach as described by Lewis et al. [15] and Denwood et al. [13]—where these were not deemed to be significant, they were removed.
Animal type/code combinations with either fewer than 50 positive batches, or no batches with more than 1 positive animal, were not analysed using the random effects model (where batch as previously defined is the number of pigs, sows or cattle of a given type slaughtered at a specific abattoir from a specific farm). These datasets contain insufficient information for the random effects results to be numerically stable. Model fit was assessed against the distribution of deviance statistics from data generated using the fitted model. The general form of the model is as follows:
where the subscript i denotes each observed combination of farm and abattoir, f denotes the farm associated with batch i, and k denotes the abattoir associated with batch i. The explanatory variables consist of a common intercept A and random effect of batch B (which were included for every model), and random effects of farm C and abattoir D (which were tested for significance as discussed above). The response variable Yi (the number of observed positive recordings for batch i) was described using a Binomial distribution, according to the fitted probability pi and total number of recordings Ni. The 95% confidence intervals for the estimates within the random effects associated with each farm and abattoir were generated using a parametric bootstrap approach. We note that a subset of this data has already been presented to illustrate the statistical methodology developed to analyse the data [13], but here we consider the welfare implications of the analyses rather than the statistical methods themselves, and also widen the scope to include both pigs and cattle.
Logit (pi) = A + Bi + Cf + Dk
Yi ~ Binomial(pi, Ni)
The resulting random effect coefficients (on the logit scale) for codes where a statistically significant abattoir effect was identified were subsequently used to divide the modelled codes into those where: (i) correction of slaughterhouse effects might be useful for further use of the code; (ii) correction for slaughterhouse effect would be deemed controversial; and (iii) correction would be deemed inappropriate. For the former, random effect coefficients of between −1 and 1 were deemed potentially useful to generate correction factors, (under the assumption that they had acceptable sensitivity and specificity; this assumption is not assessed in this article). Any correction should be done on the logit scale, but for explanatory purposes, a random effect coefficient of 1 on the logit scale corresponds to a correction of approximately 2.7 times the average, and a random effect coefficient of −1 corresponds to a correction of 0.37 times the average (these approximations are only accurate for prevalences <20%; otherwise a correction has to be done on the logit scale). For larger random effects estimates it is likely that there is a systematic difference in recording procedure between slaughterhouses, so if the absolute random effect coefficient was between 1 and 2 (prevalences +/−2.7 to 7.4 times different between the abattoirs), then correction was deemed questionable; and if >2 then it was deemed inappropriate.
3. Results
3.1. Code Selection
The pig and sow data originally included 76 non-commercial meat inspection codes, while codes 101, 111, 113, 114, 115, 451, 501, 535, 542, 901, 903, 904 were excluded possibly being transport-related, codes 221, 287, 320, 350, 371, 402, 431, 471, 504, 506, 531, 551, 608 where considered possibly acute conditions, code 203 is a central nervous system diagnosis, and codes 181, 382, 385, 565, 815, 829, 890 were not deemed animal welfare related, while codes 602 and 603 are non-specific condition and 572 and 634 had a very low prevalence with likely low impact on animal welfare. A total of 20 individual codes and 8 categories thus remained (Table 1 and Table 2).
The cattle data originally included 84 non-commercial meat inspection codes while codes 101, 113, 115, 451, 535, 536, 537, 538, 542 were excluded as transport related, codes 133, 221, 258, 287, 320, 334, 350, 365, 371, 402, 431, 471, 501, 504, 506, 531 as acute conditions, 204 and 304 as central nervous system conditions, 119, 181, 382, 524, 551, 560, 561, 562, 563, 565, 815, 890 as not related to animal welfare, and 335 was considered non-specific. This resulted in the 19 codes and 9 categories listed in Table 3 and Table 4.
3.2. Descriptive Statistics
3.3. Random Effects Logistic Regression
3.3.1. Pig and Sow Data
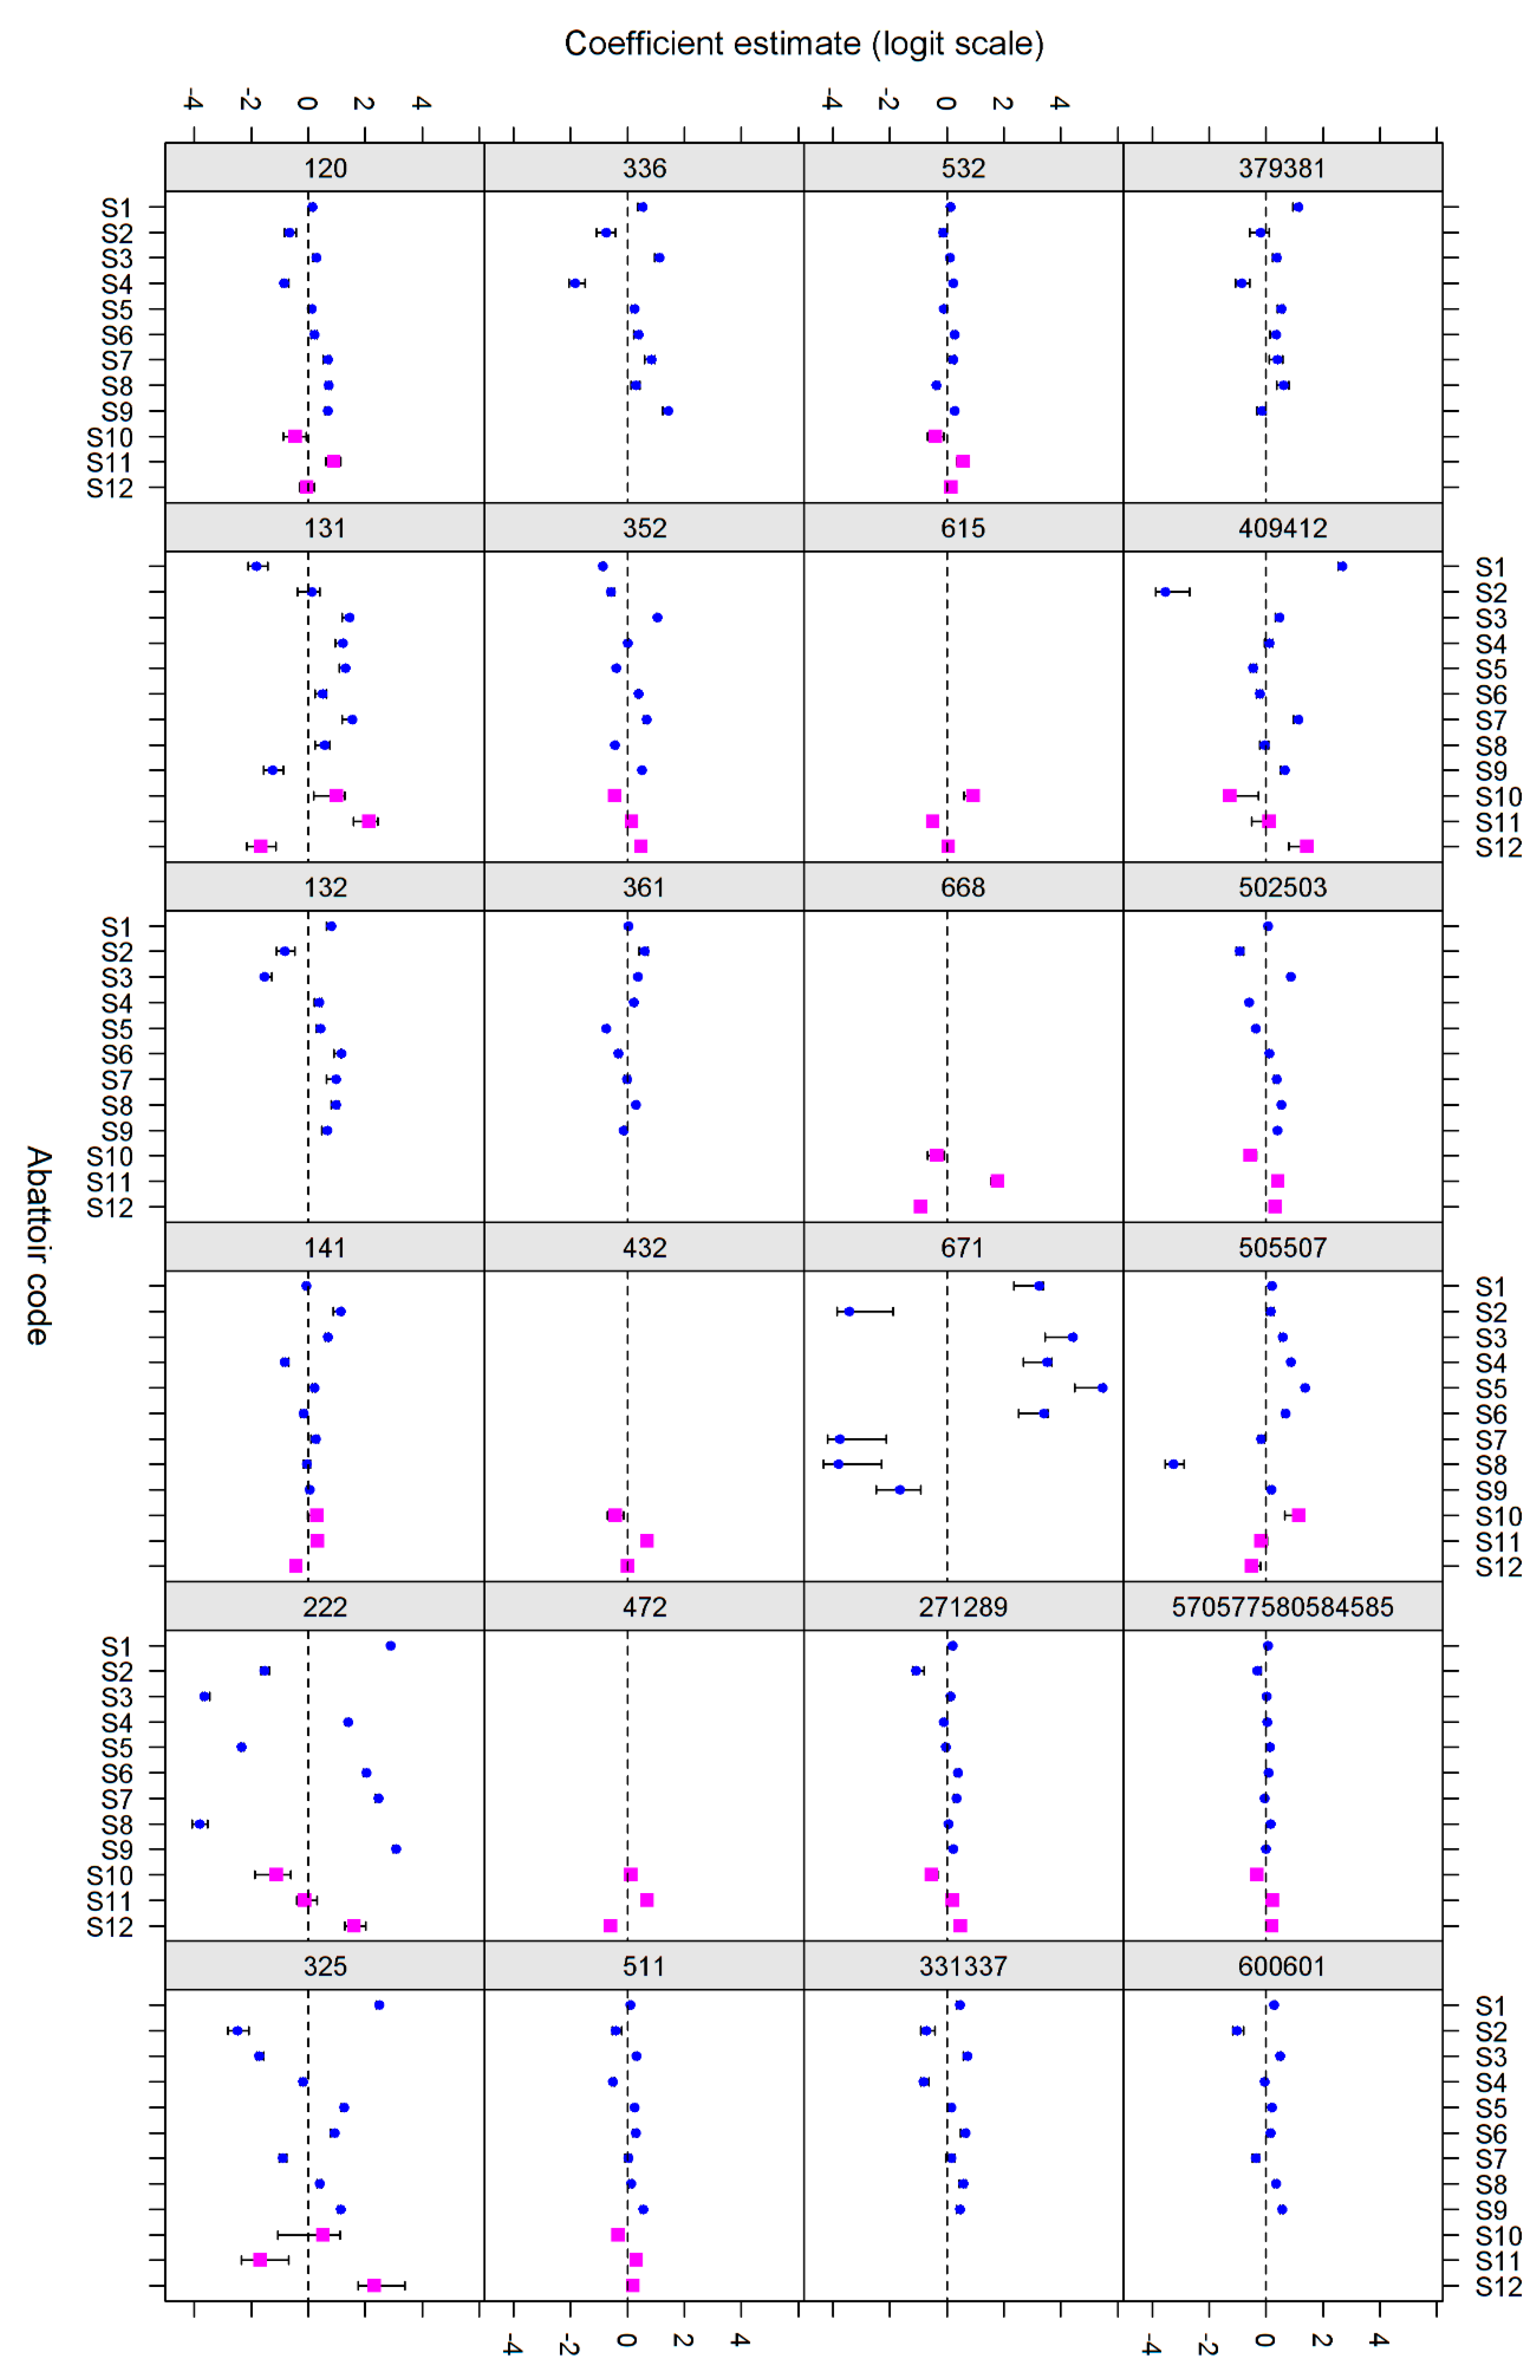
Eleven codes were removed from each of the pig and sow data because of poor model fit, which was primarily as a result of low numbers of observations (Table 5). Of the remaining 31 codes or combinations for each animal group, there was evidence of Abattoir-only variance for two sow-codes, Farm-only variance for five of each sow and slaughter pig codes, and both sources of variance for 33 combinations (eight combinations had neither random effect term fitted). For example, for code 120 in pigs, the variance effect due to abattoirs was 0.29, the farm effect was 0.38 and the residual 0.15. Thus, the farm effect was biggest, but there was still considerable difference between slaughterhouses (all abattoir and farm random effects terms presented are statistically significant). However for sows, the slaughterhouse effect appeared to be largest (0.36 vs. 0.26) meaning that the slaughterhouse effect seemed to be larger than that of disease. Figure 1 shows a graphical summary of the random effects.
3.3.2. Calf and Cow Data
Twenty-four and 19 codes were removed from the calf and cow datasets, respectively due to no and poor model fit, with 20 codes in calves and 25 codes cows producing acceptable model fits (Table 6). Of the remaining combinations, there was evidence of Abattoir-only variance for 8, Farm-only variance for five, and both levels of variance for 13 combinations (12 combinations had neither random effect term fitted). A summary graph illustrating the results is shown in Figure 2.
There is substantially more agreement for the abattoir random effect estimates for the cattle data than for the pig data. However, there is still some variation in the magnitude of random effects estimates between codes, suggesting that caution should be taken when interpreting codes. There is a striking similarity between the estimates produced for calf and cow data, especially for disease codes 271289, 412, 570577580584585 and 602604.
3.3.3. Pigs, Sows, and Cattle Combined
There was an abattoir effect for (a) all 31 modelled slaughter pig codes (12 individual and five code categories); (b) 26 of 31 modelled sow codes (12 individual and five categories); (c) all 21 modelled codes in cattle <18 months (four individual and five categories); and (d) 26 of 27 modelled adult cattle codes (seven individual and six categories) (Table 7). Including both the codes and categories with an abattoir effect and those without, (a) four codes and four categories (15 codes in total) were deemed potentially useful in pigs; (b) 10 codes and five categories (23 codes in total) were deemed potentially useful in sows; (c) two codes and three categories (14 codes in total) were deemed potentially useful in cattle <18 months; and (d) five categories (17 codes in total) were deemed potentially useful in cattle ≥18 months of age (Table 7). The potentially useful codes with descriptions are listed in Table 8.
4. Discussion
This study provides estimates of the differences in meat inspection recording due to farm and abattoir effect for a selection of meat inspection codes from three sow, nine pig and eight cattle abattoirs. “Farm”-associated variation is considered to be due to differences in health or welfare conditions at farms, whereas “abattoir”-associated variation might be considered to occur due to differences in recording at different abattoirs. However, it should be noted that a proportion of this variation may also be due to any systematic difference in the average prevalence of disease between the subsets of farms that primarily send animals to a specific abattoir for slaughter.
Among 76 meat inspection codes in pigs and sows, 42 were used as single codes or in categories in the random effect analyses. Thirty-one codes could be modelled in pig abattoirs and 31 could be modelled in sow abattoirs, but the codes were not exactly the same because different conditions were more prevalent in some types of animals than others. A farm and an abattoir type effect existed for all of these 31 pig codes and an abattoir effect existed for all but six codes/categories (132 (skinny), 230 (endocarditis), 379381 (liver conditions) and 600601 (tail-bite or association infection) in sows.
Among 84 meat inspection codes in cattle, 44 were used as single codes or in categories. Twenty codes could be modelled for calves and 25 for adult cattle. There was a significant abattoir effect for all but one code (532 (chronic arthritis or arthrosis)) in adult cattle.
There does not seem to be a great deal of consistency in abattoir effects between different disease codes in either pigs or sows, although some pairs of codes (for example Codes 336 (gastric ulcers) and 120 (circulatory affection) in pigs) do show some agreement. A similar analysis conducted using 2013 and 2014 data also revealed some variation from year to year (data not shown). There are also substantial differences in the estimate for the variance partition due to abattoir between disease codes, indicating that it is not likely to be feasible to use a single correction factor for all disease codes, if correction factors were to be used to even out the observed bias. For example, abattoir S10 was above average for five, and below for 11 codes and code categories, while abattoir S5 was above average for 13 and below average for seven codes and code categories (Figure 1). The individual random effect estimate for each abattoir can be interpreted as the effect of the abattoir on the reported prevalence of each code after accounting for differences between farms. This effect is relative to an 'average' abattoir with an effect size of 0 (i.e., a random effects estimate), so it can be used as the basis of a correction factor by multiplying the estimate by −1 and adding this to the logit of the average prevalence to come up with an expected logit prevalence at each abattoir. For prevalence <20%, which is true of almost all relevant slaughter codes, this can be reasonably approximated using the exponent of the abattoir effect multiplied by the observed prevalence. Obviously these estimates are conditional on the 2012 data being fully representative of future observations, and no effect of date/time of year has been accounted for so the correction factors can only safely be applied to a dataset representing a full calendar year of observations.
For some codes, the results presented here suggest a considerable and significant difference in recording levels between abattoirs. The magnitude of the differences between abattoirs was most frequently observed in the range –1 to 1 (on the logit scale), but for some codes and categories the differences were somewhat larger or substantially larger (Table 7). For these codes, there would seem to be some structural differences in the recording procedures, and consequently applying a simple correction factor without addressing understanding of the major underlying differences in recording procedure may not be a sensible or viable approach. When the differences are smaller, then use of a correction factor to “even out” small variations between abattoirs may be useful to allow a more robust comparison of observed farm prevalence. There are some farms that only use one slaughterhouse, which should not be a problem for slaughterhouse effects, as slaughterhouses always have more than one farm. However, it constitutes a challenge that batch and farm effects confound each other for some farms, where a farm has a single batch and therefore two random effect levels for a single observation. Therefore, we may have challenges in separating the farm and batch effect, and interpretation of the data should focus on the abattoir effect, not the any potential farm-effect. It is also important to note that the random effects components presented are only estimates, and represent only indications of relative differences between welfare indicators and between abattoir and farm effects. Although it is theoretically possible to obtain confidence intervals for these via a procedure such as parametric bootstrapping, this is computationally impossible for this dataset. We also note the increased potential for shrinkage for the abattoir random effect relative to that for farm due to the large difference in the number of abattoirs (eight for cattle, nine for pigs and three for sows) vs. farms (10,718 farms for adult cattle, 7019 farms for calves, 5381 farms for pigs and 1781 farms for sows). This means that the variation between abattoirs is likely to be somewhat underestimated relative to that between farms. However, this does not affect our conclusions because of the focus on the abattoirs, not the farms.
Table 8 provides a list of meat inspection codes and descriptions for those codes and categories where there was no detected abattoir effect or where the effect was within −1 and 1 on the logit scale, i.e., they were within 2.7 times higher or lower than the mean prevalence. The listed conditions all have some relation to animal welfare, but we have refrained from specifying how much they would eventually contribute. This is dealt with in the weighting and aggregation in other parts of the main project. Furthermore, this study does not inform if the conditions are recorded accurately. Differences in accuracy of recording practices are likely to be the main cause of differences between slaughterhouses resulting in the high abattoir effects; differences in recording accuracy has also been demonstrated for clinical recordings [16]. It can be speculated that the conditions not recorded by some meat inspectors are those that are considered to be least severe. There are no data in the present study to suggest so, but it could be object of speculation. The conditions listed in Table 8 are those that are more specific and this supports the notion that they may be more accurately recorded. However, a condition such as gastric ulcers (code 336) in pigs might also be considered fairly specific and easy to diagnose, but there is still quite a large difference between the slaughterhouses. Chronic pericarditis (code 222) is also fairly specific and appears to be recorded relatively similarly in adult cattle across slaughterhouses, but this is not the case in pigs and sows, where the prevalence can still be high in some slaughterhouses (e.g., 5.1% in pigs in S1) but not in others (0.006% pigs in S6). Use of the data would depend on a farm-effect, because this effect should reflect the differences in the conditions.
A number of additional requirements are necessary if the data should be used for national animal welfare monitoring. Firstly, the recordings should measure animal welfare with some level of accuracy, the recordings should be objective, consistent over time and feasible to implement. A basic assumption for use of the correction factors is that the time period used is representative. The recording level can differ within the same abattoir over time as we have previously demonstrated [10]. However, if the correction factors are updated regularly, e.g., annually, then this is only of minor importance. A more important assumption is that farmers do no send specific pigs (with e.g., higher or lower perceived prevalence of welfare-related conditions) to specific slaughterhouses, which would mean that true prevalence is made artificially high or low by the correction. Another example may be if certain types of pigs associated with particularly good or bad welfare are predominantly slaughtered at a particular slaughterhouse. For example, organic pigs are often slaughtered at specific slaughterhouses such as S4, and they may have different levels of disease. This could lead to e.g., a high prevalence at the abattoir slaughtering these specific pigs. Slaughterhouse S4 had a higher prevalence of codes 131 (emaciated), 132 (skinny), 222 (chronic pericarditis), 361 (hernias) and 505507 (healed tail and rib fractures), none of which is likely to be associated specifically to organic production. Farmers probably do not send pigs to slaughterhouses in any kind of balanced way, but we have no possible means to estimate this at the moment. For now, we have to accept that we cannot differentiate low slaughterhouse sensitivity from a slaughterhouse, where everyone sends the healthy animals, i.e., we assume that the distribution of true disease is random between slaughterhouses, which may be nonsense due to spatial effects of disease prevalence for some conditions, but not for others. However, it is not really possible to deem based on the data at hand. It should be noted that approximately 20% of sows are slaughtered in abattoirs not included in this study, while this is the case for less than 1% of slaughter pigs. Almost all cattle slaughtered in Denmark during 2012 were also included. However, it was not possible to correct for any imbalances in the data, which are observational in nature. The next steps in any data aggregation are also important but will not be covered here, as they are beyond the scope of the present paper. A thorough analysis has been included and published in a report from the Danish Veterinary and Food Administration including technical appendices [17].
Use of the data for an animal welfare index would also presume that all animals are slaughtered in Denmark. A high proportion of piglets are exported, and the number of sows slaughtered outside Denmark is also significant. Such animals would therefore not contribute to an animal welfare index.
5. Conclusions
We recommend to proceed with the codes and categories listed in Table 8, while they have some relation to animal welfare and differences in recording between abattoirs seem minimal to moderate. However, the accuracy of recording has not been assessed, and the magnitude of the relation to animal welfare has not been assessed either, although a qualitative assessment has been done. A full assessment would not be feasible. The codes and categories not included in Table 8 should not be used without further addressing differences between slaughterhouses. Last but not least, if the codes and categories are included in indices used for national governance, it should be recalled they are numeric simplifications of complex concepts [18].
Acknowledgments
We acknowledge the input from Sine Norlander Andreassen and Anne Marie Michelsen (University of Copenhagen) for assistance in selection of codes that should be modelled, and Professor in Veterinary Pathology, Henrik Elvang Jensen, Dept. of Veterinary and Animal Sciences at University of Copenhagen) for assessment of which codes that should be considered possibly representing acute stages of disease. The study was funded by the Danish Veterinary and Food Administration.
Author Contributions
Hans Houe, Björn Forkman, Søren Saxmose Nielsen and Matthew James Denwood conceived and designed the study. Søren Saxmose Nielsen and Matthew James Denwood managed the data. Søren Saxmose Nielsen did the descriptive statistic, and Matthew James Denwood performed the analytical statistics. Søren Saxmose Nielsen, Hans Houe, Björn Forkman and Matthew James Denwood wrote the paper.
Conflicts of Interest
The authors declare no conflict of interest.
Appendix A. Description on Meat Inspection Codes

Table A1.
Descriptions of pig meat inspection codes (translated from Ministerial circular 9611 [8]) including exclusion criterion for excluded codes.
Table A1.
Descriptions of pig meat inspection codes (translated from Ministerial circular 9611 [8]) including exclusion criterion for excluded codes.
| Code | Code Description | Exclusion Criterion 1 |
|---|---|---|
| 101 | Disturbed overall well-being; excited/exhausted | Transport |
| 111 | Dead at arrival | Transport |
| 113 | Rejected from being slaughtered; killed at ante-mortem inspection; dying | Transport |
| 114 | Dead in stable | Transport |
| 115 | Emergency slaughter | Transport |
| 120 | Circulatory affection; anaemic appearance; dropsy; oedema | |
| 131 | Emaciated | |
| 132 | Skinny | |
| 141 | Pyaemia, blood poisoning, pyaemic abscesses, splenitis or nephritis following blood poisoning | |
| 181 | Abnormal smell (not boar taint), taste, colour | Not welfare |
| 203 | Brain abscess; CNS symptoms in stable | CNS |
| 221 | Acute pericarditis | Acute |
| 222 | Chronic pericarditis | |
| 230 | Endocarditis, acute or healed | |
| 250 | Atrophic rhinitis, sinusitis, rhinitis | |
| 258 | Acute/sub-acute pneumonia and necrosis of the lungs under and under 25% | |
| 271 | Chronic pneumonia; aerogenic abscesses in the lungs | |
| 287 | Fibrinous pleuritis over and under 25% | Acute |
| 289 | Chronic pleuritis, serositis | |
| 320 | Acute stomatitis or enteritis, cattharal or fibrinous | Acute |
| 325 | Chronic stomatitis or enteritis, adhesions | |
| 331 | Rectal prolapse, bowel prolapse | |
| 336 | Gastric ulcers | |
| 337 | Haemorrhagic bowel syndrome, rectal stricture | |
| 350 | Acute peritonitis, extensive or local | Acute |
| 352 | Chronic peritonitis, peritoneal abscess, peritoneal discoloration (following splenic torsion) | |
| 361 | Umbilical hernia, inguinal hernia, scrotal hernia | |
| 371 | Acute hepatitis, extensive or local | Acute |
| 379 | Chronic hepatitis, hepatic necrosis | |
| 381 | Jaundice (toxic, infectious, following hepatosis | |
| 382 | Jaundice (physiological, neonatal) | Not welfare |
| 385 | Hepatic milk spots | Not welfare |
| 402 | Acute nephritis | Acute |
| 409 | Mycotoxic nephropathy | |
| 412 | Chronic nephritis incl. nephritic degeneration and necrosis | |
| 431 | Acute metritis | Acute |
| 432 | Chronic metritis, retained placenta, uterine prolapse | |
| 446 | Rupture of the vagina, vaginitis, vaginal prolapse | |
| 451 | Recent farrowing, abortion, foetus in last 10th of pregnancy (suspicion) | Transport |
| 471 | Acute mastitis | Acute |
| 472 | Chronic mastitis | |
| 501 | Acute fracture | Transport |
| 502 | Chronic fracture | |
| 503 | Infected fracture, open fracture >6 h | |
| 504 | Acute tail fracture | Acute |
| 505 | Healed tail fracture | |
| 506 | Acute rib fracture | Acute |
| 507 | Healed rib fracture | |
| 511 | Acute, chronic, local and healed myelitis, including associated abscesses | |
| 531 | Acute, infectious arthritis | Acute |
| 532 | Chronic arthritis, osteoarthritis | |
| 535 | Hip dislocation/joint dislocation | Transport |
| 542 | Lameness | Transport |
| 551 | High and low degree of PSE/DFD (pale, soft and exudative) | Acute |
| 565 | Suspicion on notifiable disease | Not welfare |
| 570 | Abscess in front part | |
| 572 | Muscle atrophy | Not welfare & low prev. |
| 577 | Abscess in mid part | |
| 580 | Abscess in rear part | |
| 584 | Abscess in leg/toe, elephantiasis in leg | |
| 585 | Abscess in head, blood ear, curly ear, elephantiasis in ear | |
| 600 | Tail bite, locally, limited | |
| 601 | Tail bite/tail infection | Non-specific |
| 602 | Scar/contusion/bursitis | Non-specific |
| 603 | Wound, inflammation, eczema, insect bite | |
| 608 | Acute erysipelas | |
| 615 | Shoulder wound | |
| 634 | Sarcoptes scabei in pigs | Not welfare & low prev. |
| 668 | Injection injury | |
| 671 | Frostbite/corrosion | |
| 815 | Suspicion on poisoning or medical residues | Not welfare |
| 829 | Caseous lymphadenitis | Not welfare |
| 890 | Malignant tumour, benign, unspecific tumour | Not welfare |
| 901 | Skin lesions, not human inflicted or human-inflicted below acceptable threshold | Transport |
| 903 | Bite marks | Transport |
| 904 | Skin lesions, human inflicted, including excessive use of tattoo hammer, suspicion on violation of animal welfare | Transport |
1 Exclusion criteria: “transport”: possibly related to transport; “acute”: possibly an acute condition; “not welfare”: not deemed likely to have a significant impact on animal welfare; “non-specific”: non-specific condition.
Table A2.
Descriptions of cattle meat inspection codes (translated from Ministerial circular 9611 [8]) including exclusion criterion for excluded codes.
Table A2.
Descriptions of cattle meat inspection codes (translated from Ministerial circular 9611 [8]) including exclusion criterion for excluded codes.
| Code | Code Description | Exclusion Criterion 1 |
|---|---|---|
| 101 | Disturbed overall well-being; excited/exhausted | Transport |
| 113 | Rejected from being slaughtered; killed at ante-mortem inspection; dying | Transport |
| 115 | Emergency slaughter | Non-specific |
| 120 | Circulatory affection; anaemic appearance; dropsy; oedema | |
| 131 | Emaciated | |
| 133 | Tucked up | Acute |
| 141 | Pyaemia, blood poisoning, pyaemic abscesses, splenitis or nephritis following blood poisoning | |
| 181 | Abnormal smell, taste, colour, consistency, texture, exudative | Not welfare-related |
| 204 | CNS symptoms in stable | CNS |
| 221 | Acute pericarditis | Acute |
| 222 | Chronic pericarditis | |
| 223 | Traumatic pericarditis, reticuloperitonitis, splenitis etc. | |
| 230 | Endocarditis, acute or healed, blood clot | |
| 258 | Acute/subacture pneumoia, aspiration pneumonia and necrosis of the lungs over and under 25% | Acute |
| 271 | Chronic pneumonia, aerogenous abscesses | |
| 287 | Acute pneumonia over and under 25% | Acute |
| 289 | Chronic pneumonia, serositis | |
| 291 | Pulmonary strongylosis/lungworm | |
| 304 | BSE/suspicion | CNS |
| 320 | Acute gastroenteritis, cathral/fibrinous | Acute |
| 325 | Chronic gastroenteritis | |
| 334 | Ruminal atony | Acute |
| 335 | Geo-sediment | Non-specific |
| 336 | Abomasal/ruminal ulcer | |
| 350 | Acute peritonitis, extensive or local | Acute |
| 352 | Chronic peritonitis, abscess in peritoneum incl. subphrenic abscesses | |
| 361 | Umbilical hernia, inguinal hernia, scrotal hernia | |
| 365 | Ruminal tympany | Acute |
| 371 | Acute hepatitis, extensive (incl. diffuse/extensive acute or subacute necrosis) or locally (individual acute or subacute necrosis) | Acute |
| 374 | Fatty liver | |
| 375 | Acute, subacute and chronic liver abscesses, liver abscess in calves (nutritional in origin), abscesses not part of a pyaemic spread | |
| 377 | Flukes | |
| 379 | Chronic hepatitis, hepatic necrosis, chronic parasitic hepatitis incl. scarring in the liver, hepatic cirrhosis | |
| 381 | Jaundice (toxic, infectious, following hepatosis | |
| 382 | Jaundice (physiological, neonatal) | Not welfare-related |
| 402 | Acute nephritis | Acute |
| 412 | Chronic nephritis incl. nephritic degeneration and necrosis, pyelonephrtis, cysts in the kidneys, purulent nephritis | |
| 431 | Acute metritis | Acute |
| 432 | Chronic metritis, retained placenta, uterine prolapse, hydrallantois, uterine rupture | |
| 446 | Vaginal rupture, vaginitis, vaginal prolapse | |
| 451 | Recent calving, abortion, foetus in last 10th of gestation (suspicion) | Transport |
| 471 | Acute/necrotic mastitis | Acute |
| 472 | Chronic mastitis, incl. fungal | |
| 476 | Traumatised teat/teat amputation | |
| 501 | Acute fracture | Acute |
| 502 | Chronic fracture | |
| 503 | Infected fracture, open, >6 h | |
| 504 | Acute tail fracture | Acute |
| 505 | Healed tail fracture | |
| 506 | Acute rib fracture | Acute |
| 507 | Healed rib fracture | |
| 509 | Hoof condition/overgrown hoofs | |
| 511 | Acute, chronic and local osteomyelitis, blood poisoning | |
| 524 | Periostal pigmentation, spot wise melanosis | Not welfare-related |
| 531 | Acute, infectious arthritis | Acute |
| 532 | Chronic arthritis, osteoarthritis | |
| 535 | Lameness, left front leg | Transport |
| 536 | Lameness, right front leg | Transport |
| 537 | Lameness, left rear leg | Transport |
| 538 | Lameness, right rear leg | Transport |
| 542 | Hip dislocation/joint dislocation | Transport |
| 551 | High and low degree of DFD (dry, farm and dry) | Not welfare-related |
| 560 | Cysticercus bovis, more than 10 | Not welfare-related |
| 561 | Cysticercus bovis, 10 or less (below 2 years) | Not welfare-related |
| 562 | Cysticercus bovis, 10 or less (above 2 years) | Not welfare-related |
| 563 | Sarcocystocis/sarcosporidia | Not welfare-related |
| 565 | Suspicion of notifiable disease, incl. bovine tuberculosis suspicion | Not welfare-related |
| 570 | Abscess in front/chest | |
| 572 | Muscle atrophy (with code 574) | |
| 574 | Muscle atrophy (with 572: 574 no longer used) | |
| 577 | Abdominal abscess, back to pelvis | |
| 580 | Abdominal abscess, pelvis and below | |
| 584 | Abscess in leg/hoof | |
| 585 | Abscess in head, incl. tongue (actinomycosis) | |
| 600 | Tail trauma/amputated tail | |
| 602 | Hock, hip, chest and thigh lesions and swellings | |
| 603 | Wound, inflammation, eczema, insect bite | |
| 604 | Neck, back, ischial, pinbone abrasions | |
| 631 | Scabies in cattle | |
| 641 | Ring worm | |
| 668 | Injection injury | |
| 807 | Ketosis | |
| 815 | Suspicion on poisoning or medical residues | Not welfare-related |
| 890 | Malignant tumour, benign, unspecific tumour | Not welfare-related |
1 Exclusion criteria: “transport”: possibly related to transport; “acute”: possibly an acute condition; “not welfare”: not deemed likely to have a significant impact on animal welfare; “non-specific”: non-specific condition.
References
- Anon. Forlig om Veterinærområdet (Settlement on the Veterinary Area); Case No. 17872, Doc. No. 455060; Danish Ministry for Food, Agriculture and Fisheries: Copenhagen, Denmark, 2012. [Google Scholar]
- Appleby, M.; Sandøe, P. Philosophical debate on the nature of well-being: Implications for animal welfare. Anim. Welf. 2002, 11, 283–294. [Google Scholar]
- Lassen, J.; Sandøe, P.; Forkman, B. Happy pigs are dirty!—Conflicting perspectives of animal welfare. Livest. Sci. 2006, 103, 221–230. [Google Scholar] [CrossRef]
- Ingemann, R.; Sandøe, P.; Enemark, P.; Forkman, B. Conflicting goals of welfare assessment schemes: A case study. Anim. Welf. 2009, 18, 487–495. [Google Scholar]
- Fraser, D. Assessing animal welfare at the farm and group level: The interplay of science and values. Anim. Welf. 2003, 12, 433–443. [Google Scholar]
- Bortreau, R.; Veissier, I.; Butterworth, A.; Bracke, M.B.M.; Keeling, L.J. Definition of criteria for overall assessment of animal welfare. Anim. Welf. 2007, 16, 225–228. [Google Scholar]
- Regulation (EC) No 854/2004 of the European Parliament and of the Council of 29 April 2004 Laying down Specific Rules for the Organisation of Official Controls on Products of Animal Origin Intended for Human Consumption. Available online: http://eur-lex.europa.eu/legal-content/EN/TXT/?uri=celex:32004R0854 (accessed on 6 December 2017).
- Anon. Cirkulære om Udøvelse af Kødkontrol. CIR1H nr 9611 af 19/12/2011. (Government Circular on Conduct of Meat Inspection in Denmark, in Danish); Danish Veterinary and Food Administration: Glostrup, Denmark, 2011. [Google Scholar]
- Enøe, C.; Christensen, G.; Andersen, S.; Willeberg, P. The need for built-in validation of surveillance data so that changes in diagnostic performance of post-mortem meat inspection can be detected. Prev. Vet. Med. 2003, 57, 117–125. [Google Scholar] [CrossRef]
- Nielsen, S.S.; Michelsen, A.M.; Jensen, H.E.; Barington, K.; Opstrup, K.V.; Agger, J.F. The apparent prevalence of skin lesions suspected to be human-inflicted in Danish finishing pigs at slaughter. Prev. Vet. Medicine 2014, 117, 200–206. [Google Scholar] [CrossRef] [PubMed]
- Nielsen, S.S.; Nielsen, G.B.; Denwood, M.J.; Haugegaard, J.; Houe, H. Comparison of recording of pericarditis and lung disorders at routine meat inspection with findings at systematic health monitoring in Danish finisher pigs. Acta Vet. Scand. 2015, 57. [Google Scholar] [CrossRef] [PubMed]
- R Core Team. R: A Language and Environment for Statistical Computing; R Foundation for Statistical Computing: Vienna, Austria, 2017; Available online: http://www.R-project.org/ (accessed on 21 September 2017).
- Denwood, M.J.; Houe, H.; Forkman, B.; Nielsen, S.S. Random effect selection in generalised linear models: A practical application to slaughterhouse surveillance data in Denmark. In Proceedings of the Society for Veterinary Epidemiology and Preventive Medicine annual meeting held in Ghent, SVEPM, Ghent, Belgium, 25–27 March 2015; pp. 135–145. [Google Scholar]
- Bates, D.; Maechler, M.; Bolker, B.; Walker, S. lme4: Linear Mixed-Effects Models Using Eigen and S4. R Package Version 1.1-6. Available online: http://CRAN.R-project.org/package=lme4 (accessed on 14 August 2017).
- Lewis, F.; Butler, A.; Gilbert, L. A unified approach to model selection using the likelihood ratio test. Methods Ecol. Evol. 2011, 2, 155–162. [Google Scholar] [CrossRef]
- Houe, H.; Vaarst, M.; Enevoldsen, C. Clinical parameters for assessment of udder health in Danish dairy herds. Acta Vet. Scand. 2002, 43, 173–184. [Google Scholar] [PubMed]
- Danish Veterinary and Food Administration. Udvikling af Nationale Dyrevelfærdsindekster for kvæg og svin (Development of National Animal Welfare Indices for Cattle and Pigs, in Danish); Danish Veterinary and Food Administration: Glostrup, Denmark, 2016; Available online: https://www.foedevarestyrelsen.dk/SiteCollectionDocuments/Dyrevelfaerd%20og%20veterinaermedicin/Slutrapport%20indeksprojekt%20FINAL%20VERSION.pdf and appendices: https://www.foedevarestyrelsen.dk/SiteCollectionDocuments/Dyrevelfaerd%20og%20veterinaermedicin/Bilag%20til%20rapport%20om%20dyrevelf%C3%A6rdsindekser.pdf; (accessed on 16 November 2017). [Google Scholar]
- Hansen, H.; Mühlen-Schulte, A. The power of numbers in global governance. J. Int. Relat. Dev. 2012, 15, 455–465. [Google Scholar] [CrossRef]
Figure 1.
Individual estimates for the variance partition effect of each abattoir (95% confidence intervals shown as bars) for each code in pigs (S1–S9, blue) and sows (S10–S12, pink).
Figure 1.
Individual estimates for the variance partition effect of each abattoir (95% confidence intervals shown as bars) for each code in pigs (S1–S9, blue) and sows (S10–S12, pink).

Figure 2.
Individual estimates for the effect of each abattoir (95% confidence intervals shown as bars) for each code in calves (pink) and adult cattle (blue).
Figure 2.
Individual estimates for the effect of each abattoir (95% confidence intervals shown as bars) for each code in calves (pink) and adult cattle (blue).
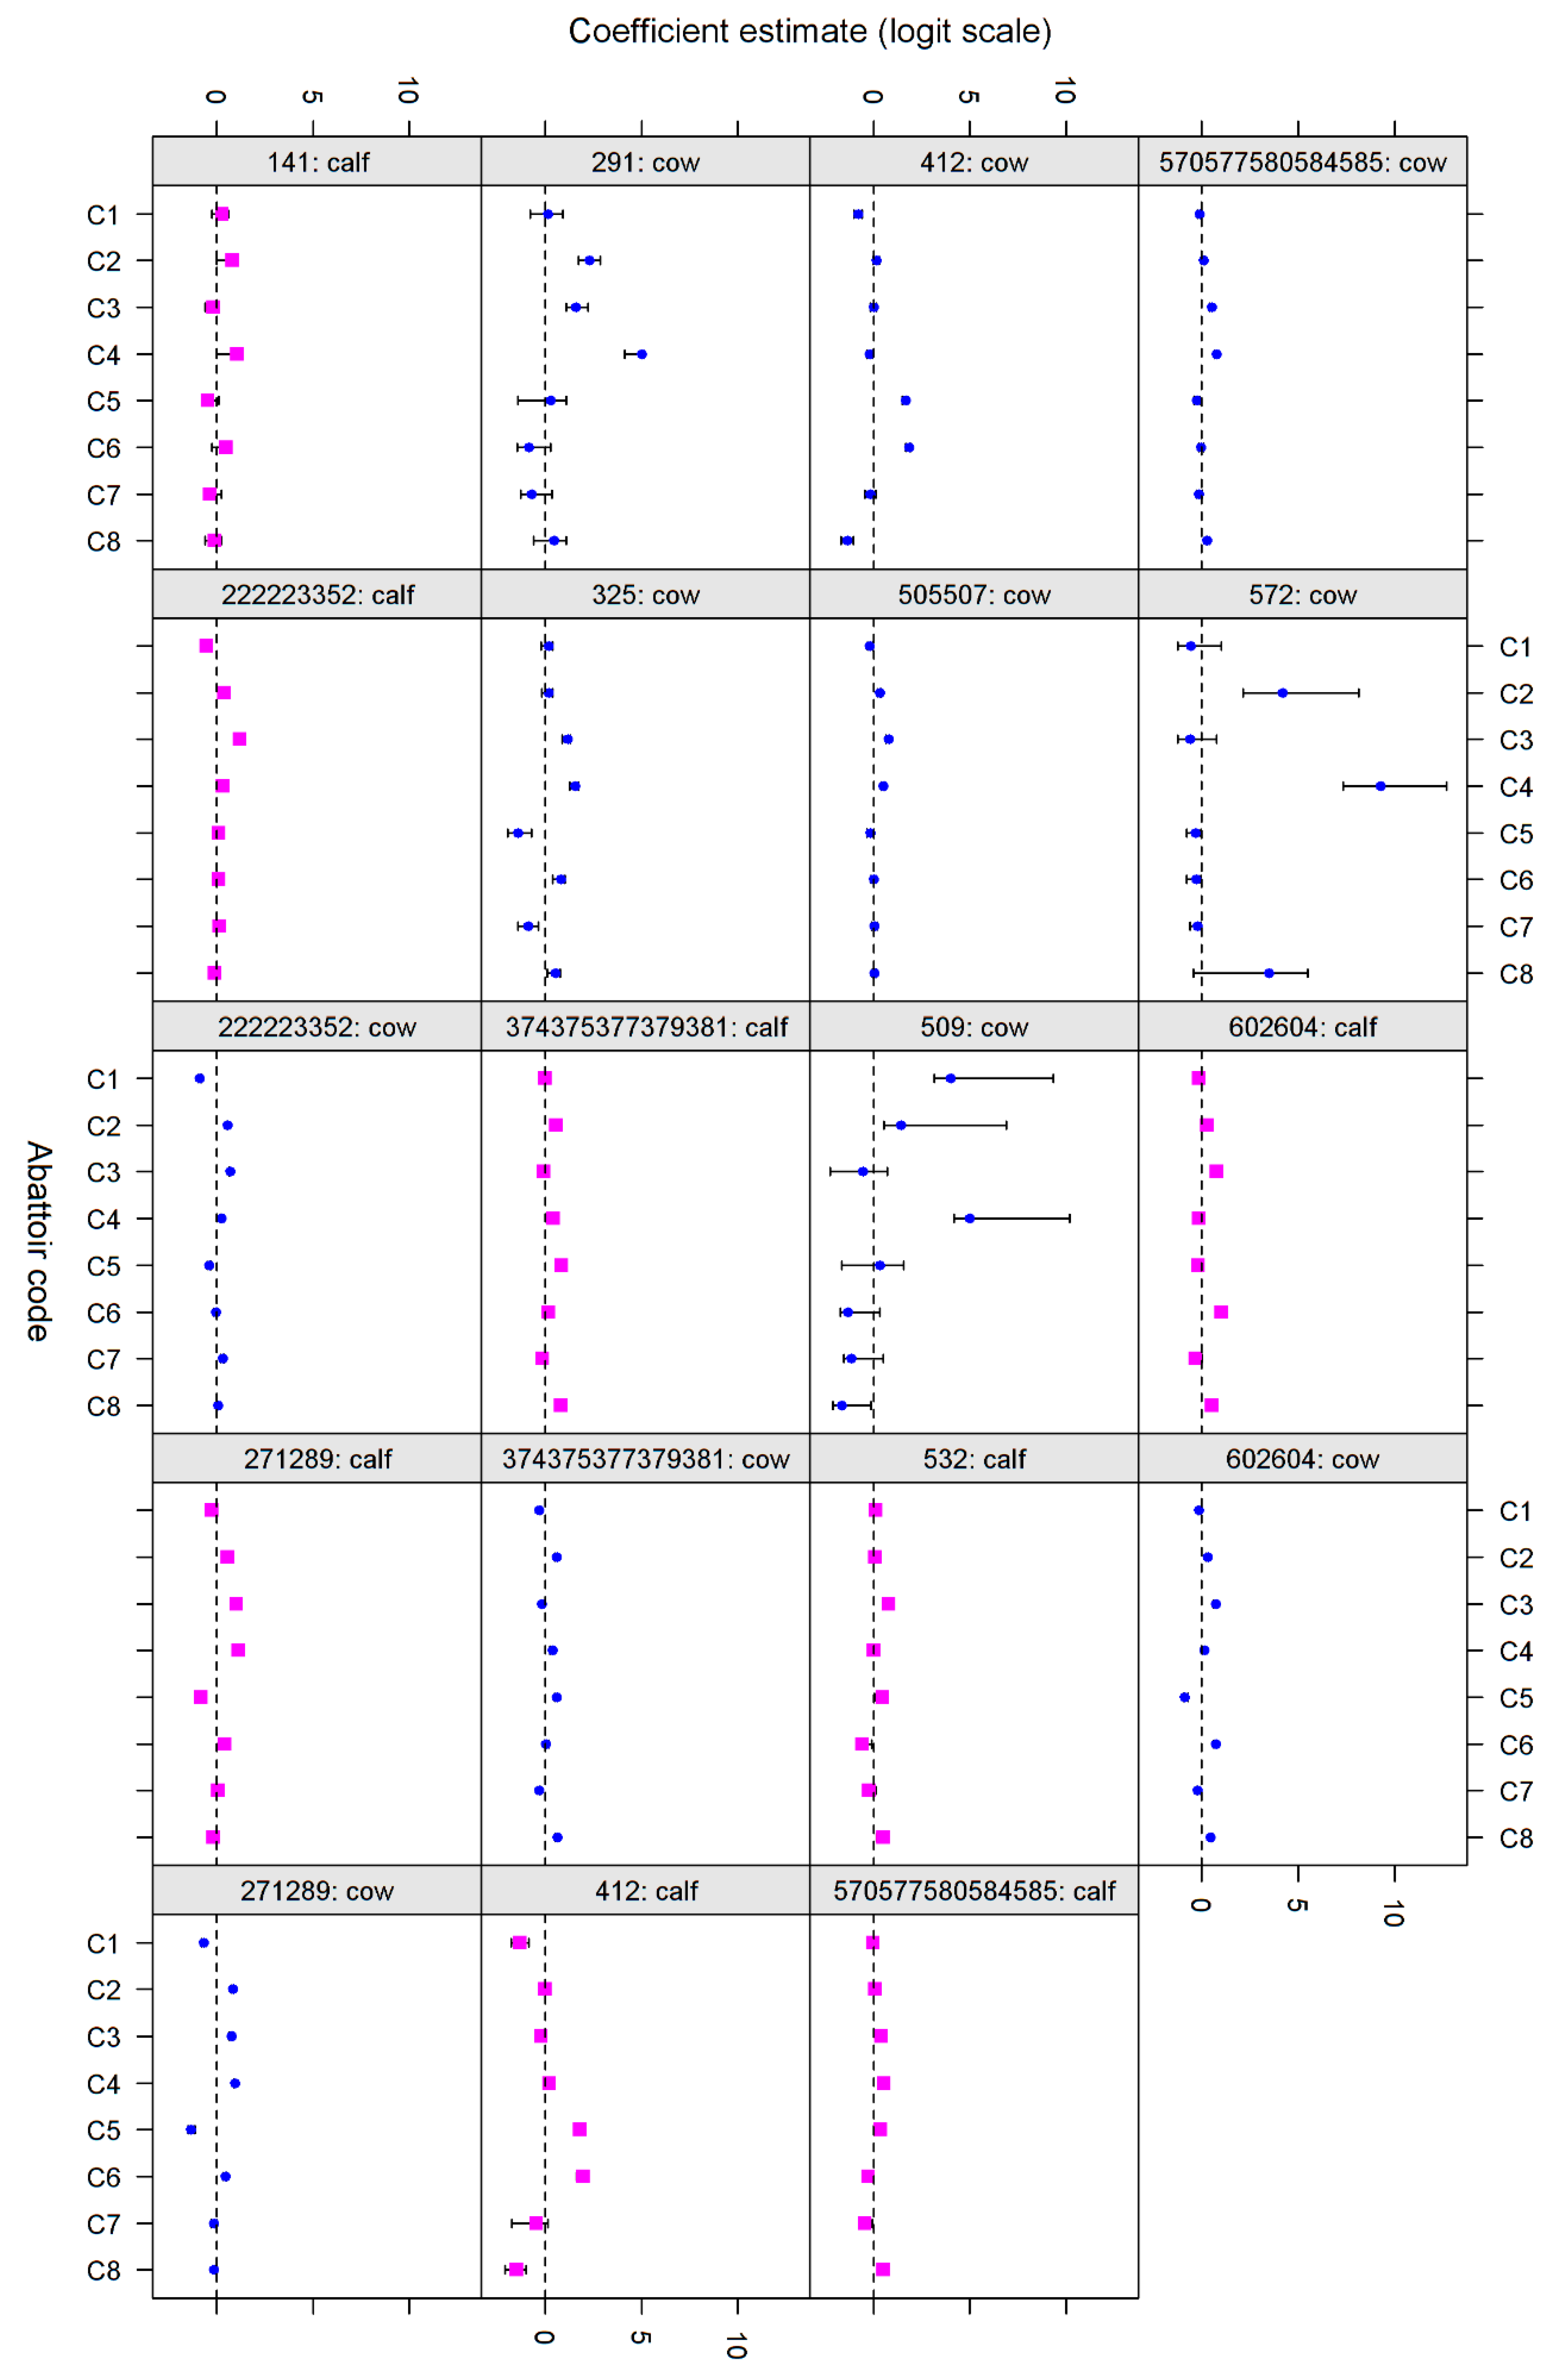
Table 1.
Prevalence (number and %) of selected slaughter recording codes in slaughter pigs slaughtered at the nine largest slaughterhouses (S1–S9) in Denmark in 2012.
Table 1.
Prevalence (number and %) of selected slaughter recording codes in slaughter pigs slaughtered at the nine largest slaughterhouses (S1–S9) in Denmark in 2012.
| Code/Category | S1 | S2 | S3 | S4 | S5 | S6 | S7 | S8 | S9 | |||||||||
|---|---|---|---|---|---|---|---|---|---|---|---|---|---|---|---|---|---|---|
| No. | % | No. | % | No. | % | No. | % | No. | % | No. | % | No. | % | No. | % | No. | % | |
| 120 | 1076 | 0.038 | 76 | 0.017 | 1177 | 0.043 | 207 | 0.014 | 450 | 0.066 | 483 | 0.074 | 1673 | 0.075 | 1744 | 0.038 | 736 | 0.042 |
| 131 | 15 | 0.001 | 24 | 0.005 | 414 | 0.015 | 181 | 0.012 | 127 | 0.019 | 42 | 0.006 | 22 | 0.001 | 640 | 0.014 | 105 | 0.006 |
| 132 | 999 | 0.035 | 26 | 0.006 | 77 | 0.003 | 307 | 0.021 | 267 | 0.039 | 264 | 0.040 | 701 | 0.031 | 997 | 0.022 | 820 | 0.047 |
| 141 | 1130 | 0.040 | 695 | 0.155 | 2442 | 0.089 | 274 | 0.019 | 370 | 0.054 | 256 | 0.039 | 974 | 0.044 | 2460 | 0.054 | 674 | 0.039 |
| 222 | 144,357 | 5.115 | 269 | 0.060 | 186 | 0.007 | 17,200 | 1.179 | 21,771 | 3.202 | 38 | 0.006 | 124,856 | 5.599 | 1199 | 0.026 | 35,780 | 2.061 |
| 230 | 108 | 0.004 | 9 | 0.002 | 59 | 0.002 | 71 | 0.005 | 23 | 0.003 | 14 | 0.002 | 123 | 0.006 | 50 | 0.001 | 76 | 0.004 |
| 250 | 32 | 0.001 | 0 | 0.000 | 19 | 0.001 | 307 | 0.021 | 99 | 0.015 | 10 | 0.002 | 315 | 0.014 | 635 | 0.014 | 65 | 0.004 |
| 258 | 606 | 0.021 | 163 | 0.036 | 558 | 0.020 | 81 | 0.006 | 179 | 0.026 | 7 | 0.001 | 202 | 0.009 | 573 | 0.013 | 415 | 0.024 |
| 325 | 23,299 | 0.826 | 26 | 0.006 | 337 | 0.012 | 853 | 0.058 | 198 | 0.029 | 671 | 0.102 | 5808 | 0.260 | 11,443 | 0.252 | 3067 | 0.177 |
| 336 | 598 | 0.021 | 26 | 0.006 | 1068 | 0.039 | 25 | 0.002 | 210 | 0.031 | 114 | 0.017 | 1419 | 0.064 | 748 | 0.016 | 324 | 0.019 |
| 352 | 8571 | 0.304 | 1787 | 0.399 | 50,966 | 1.856 | 10,631 | 0.729 | 8835 | 1.299 | 2975 | 0.453 | 23,951 | 1.074 | 21,634 | 0.477 | 18,736 | 1.079 |
| 361 | 35,679 | 1.264 | 9197 | 2.051 | 44,529 | 1.621 | 22,010 | 1.508 | 8490 | 1.249 | 12,063 | 1.839 | 23,201 | 1.040 | 27,088 | 0.597 | 16,647 | 0.959 |
| 432 | 1 | 0.000 | 0 | 0.000 | 9 | 0.000 | 15 | 0.001 | 3 | 0.000 | 0 | 0.000 | 10 | 0.000 | 13 | 0.000 | 3 | 0.000 |
| 446 | 15 | 0.001 | 0 | 0.000 | 0 | 0.000 | 0 | 0.000 | 0 | 0.000 | 0 | 0.000 | 1 | 0.000 | 13 | 0.000 | 1 | 0.000 |
| 472 | 0 | 0.000 | 1 | 0.000 | 0 | 0.000 | 0 | 0.000 | 0 | 0.000 | 0 | 0.000 | 1 | 0.000 | 0 | 0.000 | 0 | 0.000 |
| 511 | 7455 | 0.264 | 591 | 0.132 | 8208 | 0.299 | 2458 | 0.168 | 1575 | 0.232 | 1786 | 0.272 | 8028 | 0.360 | 12,295 | 0.271 | 5102 | 0.294 |
| 532 | 7168 | 0.254 | 869 | 0.194 | 6763 | 0.246 | 5422 | 0.372 | 2069 | 0.304 | 1025 | 0.156 | 6277 | 0.281 | 8631 | 0.190 | 5559 | 0.320 |
| 615 | 0 | 0.000 | 1 | 0.000 | 1 | 0.000 | 0 | 0.000 | 0 | 0.000 | 0 | 0.000 | 0 | 0.000 | 0 | 0.000 | 0 | 0.000 |
| 668 | 18 | 0.001 | 4 | 0.001 | 5 | 0.000 | 10 | 0.001 | 0 | 0.000 | 6 | 0.001 | 7 | 0.000 | 26 | 0.001 | 0 | 0.000 |
| 671 | 1538 | 0.054 | 0 | 0.000 | 5689 | 0.207 | 903 | 0.062 | 0 | 0.000 | 0 | 0.000 | 6 | 0.000 | 18,026 | 0.397 | 961 | 0.055 |
| 271289 | 577,000 | 20.44 | 26,789 | 5.97 | 324,914 | 11.83 | 340,360 | 23.33 | 145,978 | 21.47 | 145,853 | 22.23 | 556,686 | 24.96 | 1,056,773 | 23.30 | 417,572 | 24.06 |
| 331337 | 1065 | 0.038 | 52 | 0.012 | 1275 | 0.046 | 143 | 0.010 | 188 | 0.028 | 274 | 0.042 | 898 | 0.040 | 1253 | 0.028 | 788 | 0.045 |
| 379381 | 564 | 0.020 | 22 | 0.005 | 254 | 0.009 | 36 | 0.002 | 64 | 0.009 | 86 | 0.013 | 126 | 0.006 | 512 | 0.011 | 159 | 0.009 |
| 409412 | 14,333 | 0.508 | 3 | 0.001 | 1468 | 0.053 | 569 | 0.039 | 739 | 0.109 | 216 | 0.033 | 1460 | 0.065 | 1009 | 0.022 | 486 | 0.028 |
| 502503 | 5849 | 0.207 | 324 | 0.072 | 12,354 | 0.450 | 1636 | 0.112 | 1851 | 0.272 | 2179 | 0.332 | 6266 | 0.281 | 6011 | 0.133 | 3799 | 0.219 |
| 505507 | 3540 | 0.125 | 506 | 0.113 | 4924 | 0.179 | 4210 | 0.289 | 614 | 0.090 | 22 | 0.003 | 2567 | 0.115 | 17,251 | 0.380 | 3506 | 0.202 |
| 570577580584585 | 125,332 | 4.441 | 13,485 | 3.007 | 114,327 | 4.163 | 67,749 | 4.643 | 26,267 | 3.863 | 33,172 | 5.056 | 87,630 | 3.929 | 217,152 | 4.789 | 77,687 | 4.475 |
| 600601 | 35,958 | 1.274 | 1254 | 0.280 | 32,702 | 1.191 | 16,264 | 1.115 | 3823 | 0.562 | 8021 | 1.223 | 29,909 | 1.341 | 42,827 | 0.944 | 17,065 | 0.983 |
| Total slaughtered | 2,822,288 | 448,412 | 2,746,407 | 1,459,135 | 679,914 | 656,049 | 2,230,130 | 4,534,853 | 1,735,829 | |||||||||
Table 2.
Prevalence (number and %) of selected slaughter recording codes in sows slaughtered at the three largest sow slaughterhouses (S10–S12) in Denmark in 2012.
Table 2.
Prevalence (number and %) of selected slaughter recording codes in sows slaughtered at the three largest sow slaughterhouses (S10–S12) in Denmark in 2012.
| Code/Category | S10 | S11 | S12 | |||
|---|---|---|---|---|---|---|
| No. | % | No. | % | No. | % | |
| 120 | 5 | 0.052 | 583 | 0.263 | 103 | 0.101 |
| 131 | 7 | 0.073 | 500 | 0.226 | 4 | 0.004 |
| 132 | 10 | 0.104 | 396 | 0.179 | 143 | 0.140 |
| 141 | 24 | 0.250 | 521 | 0.235 | 108 | 0.106 |
| 222 | 4 | 0.042 | 300 | 0.135 | 781 | 0.766 |
| 230 | 0 | 0.000 | 148 | 0.067 | 31 | 0.030 |
| 250 | 0 | 0.000 | 0 | 0.000 | 2 | 0.002 |
| 258 | 3 | 0.031 | 41 | 0.018 | 11 | 0.011 |
| 325 | 2 | 0.021 | 4 | 0.002 | 124 | 0.122 |
| 336 | 1 | 0.010 | 27 | 0.012 | 22 | 0.022 |
| 352 | 112 | 1.168 | 4754 | 2.145 | 2999 | 2.940 |
| 361 | 21 | 0.219 | 160 | 0.072 | 84 | 0.082 |
| 432 | 14 | 0.146 | 1113 | 0.502 | 259 | 0.254 |
| 446 | 0 | 0.000 | 8 | 0.004 | 1 | 0.001 |
| 472 | 345 | 3.596 | 12,860 | 5.802 | 1721 | 1.687 |
| 511 | 95 | 0.990 | 4384 | 1.978 | 1815 | 1.779 |
| 532 | 18 | 0.188 | 1361 | 0.614 | 399 | 0.391 |
| 615 | 178 | 1.856 | 905 | 0.408 | 700 | 0.686 |
| 668 | 29 | 0.302 | 6180 | 2.788 | 219 | 0.215 |
| 671 | 0 | 0.000 | 0 | 0.000 | 2 | 0.002 |
| 271289 | 818 | 8.527 | 40,100 | 18.092 | 23,947 | 23.477 |
| 331337 | 1 | 0.010 | 82 | 0.037 | 18 | 0.018 |
| 379381 | 2 | 0.021 | 96 | 0.043 | 39 | 0.038 |
| 409412 | 0 | 0.000 | 71 | 0.032 | 125 | 0.123 |
| 502503 | 45 | 0.469 | 3076 | 1.388 | 1259 | 1.234 |
| 505507 | 39 | 0.407 | 218 | 0.098 | 70 | 0.069 |
| 570577580584585 | 649 | 6.765 | 25,012 | 11.285 | 11,383 | 11.160 |
| 600601 | 17 | 0.177 | 153 | 0.069 | 167 | 0.164 |
| Total slaughtered | 9593 | 221,645 | 102,002 | |||
Table 3.
Prevalence of selected slaughter recording codes or categories in 212,826 cattle <18 months of age slaughtered at the eight largest cattle slaughterhouses (C1–C8) in 2012.
Table 3.
Prevalence of selected slaughter recording codes or categories in 212,826 cattle <18 months of age slaughtered at the eight largest cattle slaughterhouses (C1–C8) in 2012.
| Code/Category | C1 | C2 | C3 | C4 | C5 | C6 | C7 | C8 | ||||||||
|---|---|---|---|---|---|---|---|---|---|---|---|---|---|---|---|---|
| No. | % | No. | % | No. | % | No. | % | No. | % | No. | % | No. | % | No. | % | |
| 120 | 3 | 0.0106 | 3 | 0.0055 | 7 | 0.0162 | 15 | 0.0306 | 4 | 0.0458 | 0 | 0 | 1 | 0.0294 | 2 | 0.0099 |
| 131 | 1 | 0.0035 | 5 | 0.0092 | 8 | 0.0185 | 1 | 0.002 | 0 | 0 | 1 | 0.0168 | 1 | 0.0294 | 0 | 0 |
| 141 | 19 | 0.0674 | 71 | 0.1311 | 17 | 0.0393 | 82 | 0.1673 | 1 | 0.0115 | 6 | 0.1006 | 0 | 0 | 9 | 0.0448 |
| 230 | 5 | 0.0177 | 10 | 0.0185 | 18 | 0.0416 | 26 | 0.053 | 2 | 0.0229 | 2 | 0.0335 | 0 | 0 | 2 | 0.0099 |
| 291 | 0 | 0 | 11 | 0.0203 | 5 | 0.0116 | 41 | 0.0836 | 0 | 0 | 0 | 0 | 0 | 0 | 0 | 0 |
| 325 | 12 | 0.0426 | 9 | 0.0166 | 35 | 0.0809 | 31 | 0.0632 | 0 | 0 | 3 | 0.0503 | 0 | 0 | 27 | 0.1343 |
| 336 | 0 | 0 | 0 | 0 | 1 | 0.0023 | 2 | 0.0041 | 0 | 0 | 0 | 0 | 0 | 0 | 0 | 0 |
| 361 | 3 | 0.0106 | 0 | 0 | 0 | 0 | 7 | 0.0143 | 3 | 0.0344 | 0 | 0 | 0 | 0 | 2 | 0.0099 |
| 412 | 11 | 0.039 | 83 | 0.1533 | 54 | 0.1247 | 94 | 0.1918 | 83 | 0.951 | 68 | 1.14 | 3 | 0.0882 | 6 | 0.0298 |
| 432 | 0 | 0 | 0 | 0 | 0 | 0 | 3 | 0.0061 | 0 | 0 | 0 | 0 | 0 | 0 | 0 | 0 |
| 446 | 0 | 0 | 0 | 0 | 0 | 0 | 0 | 0 | 0 | 0 | 0 | 0 | 0 | 0 | 0 | 0 |
| 509 | 13 | 0.0461 | 2 | 0.0037 | 3 | 0.0069 | 36 | 0.0734 | 0 | 0 | 0 | 0 | 1 | 0.0294 | 0 | 0 |
| 511 | 6 | 0.0213 | 20 | 0.0369 | 22 | 0.0508 | 30 | 0.0612 | 1 | 0.0115 | 1 | 0.0168 | 0 | 0 | 5 | 0.0249 |
| 532 | 94 | 0.3337 | 192 | 0.3546 | 311 | 0.7184 | 156 | 0.3183 | 44 | 0.5041 | 6 | 0.1006 | 6 | 0.1764 | 113 | 0.5619 |
| 572 | 0 | 0 | 1 | 0.0018 | 0 | 0 | 48 | 0.0979 | 0 | 0 | 0 | 0 | 0 | 0 | 0 | 0 |
| 600 | 6 | 0.0213 | 1 | 0.0018 | 2 | 0.0046 | 12 | 0.0245 | 0 | 0 | 0 | 0 | 0 | 0 | 0 | 0 |
| 603 | 1 | 0.0035 | 1 | 0.0018 | 0 | 0 | 6 | 0.0122 | 1 | 0.0115 | 0 | 0 | 3 | 0.0882 | 0 | 0 |
| 668 | 0 | 0 | 0 | 0 | 0 | 0 | 0 | 0 | 0 | 0 | 0 | 0 | 0 | 0 | 0 | 0 |
| 807 | 0 | 0 | 0 | 0 | 0 | 0 | 0 | 0 | 0 | 0 | 0 | 0 | 0 | 0 | 0 | 0 |
| 222223352 | 344 | 1.221 | 2230 | 4.1186 | 3758 | 8.6812 | 1420 | 2.8971 | 158 | 1.8103 | 129 | 2.1626 | 66 | 1.94 | 414 | 2.0587 |
| 271289 | 726 | 2.5769 | 4597 | 8.4903 | 5956 | 13.7587 | 6377 | 13.0103 | 104 | 1.1916 | 287 | 4.8114 | 103 | 3.0276 | 597 | 2.9687 |
| 374375377379381 | 2788 | 9.896 | 8381 | 15.4791 | 3418 | 7.8958 | 6282 | 12.8165 | 1313 | 15.0435 | 551 | 9.2372 | 220 | 6.4668 | 2876 | 14.3013 |
| 472476 | 0 | 0 | 2 | 0.0037 | 0 | 0 | 1 | 0.002 | 0 | 0 | 0 | 0 | 0 | 0 | 0 | 0 |
| 502503 | 12 | 0.0426 | 11 | 0.0203 | 23 | 0.0531 | 15 | 0.0306 | 8 | 0.0917 | 3 | 0.0503 | 3 | 0.0882 | 3 | 0.0149 |
| 505507 | 50 | 0.1775 | 133 | 0.2456 | 222 | 0.5128 | 149 | 0.304 | 20 | 0.2291 | 21 | 0.3521 | 1 | 0.0294 | 34 | 0.1691 |
| 570577580584585 | 161 | 0.5715 | 366 | 0.676 | 401 | 0.9263 | 539 | 1.0997 | 76 | 0.8708 | 22 | 0.3688 | 7 | 0.2058 | 218 | 1.084 |
| 602604 | 192 | 0.6815 | 571 | 1.0546 | 846 | 1.9543 | 331 | 0.6753 | 57 | 0.6531 | 138 | 2.3135 | 18 | 0.5291 | 282 | 1.4023 |
| 631641 | 0 | 0 | 158 | 0.2918 | 10 | 0.0231 | 18 | 0.0367 | 15 | 0.1719 | 0 | 0 | 0 | 0 | 0 | 0 |
| Total slaughtered | 28,173 | 54,144 | 43,289 | 49,015 | 8728 | 5965 | 3402 | 20,110 | ||||||||
Table 4.
Prevalence of selected slaughter recording codes or combinations (“code”) in 248,580 cattle ≥18 months of age slaughtered at the eight largest cattle slaughterhouses (C1–C8) in 2012.
Table 4.
Prevalence of selected slaughter recording codes or combinations (“code”) in 248,580 cattle ≥18 months of age slaughtered at the eight largest cattle slaughterhouses (C1–C8) in 2012.
| Code | C1 | C2 | C3 | C4 | C5 | C6 | C7 | C8 | ||||||||
|---|---|---|---|---|---|---|---|---|---|---|---|---|---|---|---|---|
| No. | % | No. | % | No. | % | No. | % | No. | % | No. | % | No. | % | No. | % | |
| 120 | 18 | 0.0486 | 58 | 0.115 | 30 | 0.0747 | 158 | 0.2694 | 10 | 0.0661 | 13 | 0.0964 | 12 | 0.1211 | 11 | 0.0462 |
| 131 | 20 | 0.054 | 67 | 0.1328 | 30 | 0.0747 | 79 | 0.1347 | 0 | 0 | 11 | 0.0816 | 9 | 0.0908 | 18 | 0.0756 |
| 141 | 87 | 0.2351 | 125 | 0.2478 | 87 | 0.2167 | 233 | 0.3973 | 4 | 0.0265 | 39 | 0.2893 | 42 | 0.4237 | 44 | 0.1847 |
| 230 | 64 | 0.173 | 77 | 0.1526 | 91 | 0.2266 | 147 | 0.2507 | 2 | 0.0132 | 15 | 0.1113 | 26 | 0.2623 | 40 | 0.168 |
| 291 | 2 | 0.0054 | 27 | 0.0535 | 10 | 0.0249 | 633 | 1.0794 | 1 | 0.0066 | 0 | 0 | 0 | 0 | 2 | 0.0084 |
| 325 | 44 | 0.1189 | 60 | 0.1189 | 133 | 0.3312 | 293 | 0.4996 | 2 | 0.0132 | 32 | 0.2374 | 3 | 0.0303 | 42 | 0.1764 |
| 336 | 0 | 0 | 0 | 0 | 4 | 0.01 | 1 | 0.0017 | 0 | 0 | 1 | 0.0074 | 0 | 0 | 0 | 0 |
| 361 | 2 | 0.0054 | 0 | 0 | 1 | 0.0025 | 2 | 0.0034 | 1 | 0.0066 | 1 | 0.0074 | 0 | 0 | 0 | 0 |
| 412 | 65 | 0.1757 | 240 | 0.4757 | 162 | 0.4035 | 193 | 0.3291 | 329 | 2.1756 | 351 | 2.6037 | 34 | 0.343 | 23 | 0.0966 |
| 432 | 12 | 0.0324 | 37 | 0.0733 | 19 | 0.0473 | 23 | 0.0392 | 4 | 0.0265 | 11 | 0.0816 | 4 | 0.0404 | 3 | 0.0126 |
| 446 | 1 | 0.0027 | 1 | 0.002 | 0 | 0 | 5 | 0.0085 | 0 | 0 | 0 | 0 | 0 | 0 | 0 | 0 |
| 509 | 102 | 0.2757 | 10 | 0.0198 | 1 | 0.0025 | 450 | 0.7674 | 1 | 0.0066 | 0 | 0 | 0 | 0 | 0 | 0 |
| 511 | 30 | 0.0811 | 87 | 0.1724 | 59 | 0.1469 | 168 | 0.2865 | 3 | 0.0198 | 17 | 0.1261 | 21 | 0.2119 | 24 | 0.1008 |
| 532 | 93 | 0.2513 | 142 | 0.2815 | 263 | 0.655 | 304 | 0.5184 | 63 | 0.4166 | 36 | 0.267 | 17 | 0.1715 | 138 | 0.5794 |
| 572 | 0 | 0 | 4 | 0.0079 | 0 | 0 | 875 | 1.4921 | 0 | 0 | 0 | 0 | 0 | 0 | 1 | 0.0042 |
| 600 | 6 | 0.0162 | 1 | 0.002 | 5 | 0.0125 | 76 | 0.1296 | 1 | 0.0066 | 0 | 0 | 0 | 0 | 0 | 0 |
| 603 | 6 | 0.0162 | 8 | 0.0159 | 7 | 0.0174 | 69 | 0.1177 | 1 | 0.0066 | 1 | 0.0074 | 9 | 0.0908 | 0 | 0 |
| 668 | 3 | 0.0081 | 2 | 0.004 | 3 | 0.0075 | 15 | 0.0256 | 0 | 0 | 0 | 0 | 0 | 0 | 1 | 0.0042 |
| 807 | 0 | 0 | 14 | 0.0277 | 15 | 0.0374 | 36 | 0.0614 | 0 | 0 | 11 | 0.0816 | 1 | 0.0101 | 0 | 0 |
| 222223352 | 617 | 1.6674 | 3721 | 7.3752 | 3249 | 8.092 | 3049 | 5.1993 | 418 | 2.7642 | 543 | 4.0279 | 560 | 5.6497 | 1091 | 4.581 |
| 271289 | 419 | 1.1323 | 2773 | 5.4962 | 1933 | 4.8143 | 3454 | 5.89 | 86 | 0.5687 | 485 | 3.5977 | 202 | 2.0379 | 486 | 2.0406 |
| 374375377379381 | 2539 | 6.8616 | 8480 | 16.8077 | 3226 | 8.0347 | 7403 | 12.6241 | 2414 | 15.9635 | 1341 | 9.9473 | 664 | 6.699 | 3775 | 15.8507 |
| 472476 | 218 | 0.5891 | 183 | 0.3627 | 10 | 0.0249 | 148 | 0.2524 | 2 | 0.0132 | 10 | 0.0742 | 2 | 0.0202 | 1 | 0.0042 |
| 502503 | 57 | 0.154 | 34 | 0.0674 | 57 | 0.142 | 60 | 0.1023 | 21 | 0.1389 | 24 | 0.178 | 8 | 0.0807 | 17 | 0.0714 |
| 505507 | 314 | 0.8486 | 758 | 1.5024 | 968 | 2.4109 | 1048 | 1.7871 | 136 | 0.8994 | 147 | 1.0904 | 109 | 1.0997 | 282 | 1.1841 |
| 570577580584585 | 578 | 1.562 | 988 | 1.9583 | 1169 | 2.9115 | 2302 | 3.9255 | 201 | 1.3292 | 235 | 1.7432 | 144 | 1.4528 | 602 | 2.5277 |
| 602604 | 1527 | 4.1267 | 3551 | 7.0382 | 4308 | 10.7295 | 3372 | 5.7501 | 297 | 1.964 | 1323 | 9.8138 | 377 | 3.8035 | 1902 | 7.9862 |
| 631641 | 0 | 0 | 10 | 0.0198 | 0 | 0 | 10 | 0.0171 | 1 | 0.0066 | 0 | 0 | 0 | 0 | 0 | 0 |
| Total slaughtered | 37,003 | 50,453 | 40,151 | 58,642 | 15,122 | 13,481 | 9912 | 23,816 | ||||||||
Table 5.
Selected codes resulting in lack of variance partition estimates due to no model fit (too few positive observations), poor model fit and acceptable model fit for data on pigs and sows.
Table 5.
Selected codes resulting in lack of variance partition estimates due to no model fit (too few positive observations), poor model fit and acceptable model fit for data on pigs and sows.
| Group | Model Fit | Codes & Code Combinations |
|---|---|---|
| Pigs | No model fit | 432, 446, 451, 472, 572, 615, 634 |
| Poor model fit | 230, 250, 258, 668 | |
| Acceptable model fit | 120, 131, 132, 141, 222, 325, 336, 352, 361, 511, 532, 671, 271289, 331337, 379381, 409412, 502503, 505507, 570577580584585, 600601 | |
| Sows | No model fit | 250, 336, 446, 451, 572, 634, 671 |
| Poor model fit | 258, 361, 331337 | |
| Acceptable model fit | 120, 131, 132, 141, 222, 230, 325, 352, 432, 472, 511, 532, 615, 668, 271289, 379381, 409412, 502503, 505507, 570577580584585, 600601 |
Table 6.
Selected codes resulting in lack of estimates due to no model fit (too few positive observations), poor model fit and acceptable model fit for data on cattle.
Table 6.
Selected codes resulting in lack of estimates due to no model fit (too few positive observations), poor model fit and acceptable model fit for data on cattle.
| Animal Group | Model Fit | Codes & Code Combinations |
|---|---|---|
| Calves | No model fit | 120, 131, 291, 336, 361, 432, 446, 509, 572, 600, 603, 668, 807, 472476 |
| Poor model fit | 230, 325, 511, 502503, 505507, 631641 | |
| Acceptable model fit | 141, 412, 532, 271289, 222223352, 374375377379381, 570577580584585, 602604 | |
| Cows | No model fit | 336, 361, 446, 668, 631641 |
| Poor model fit | 120, 131, 141, 230, 432, 511, 600, 603, 807, 472476, 502503 | |
| Acceptable model fit | 291, 325, 412, 509, 532, 572, 271289, 222223352, 374375377379381, 570577580584585, 505507, 602604 |
Table 7.
Summary of random effect coefficient estimates (on the logit scale) modelled for individual meat inspection codes or categories of codes.
Table 7.
Summary of random effect coefficient estimates (on the logit scale) modelled for individual meat inspection codes or categories of codes.
| Animal Group | Abattoir Effect | Individual or Category | Intervals 1 | Number of Codes | Codes |
|---|---|---|---|---|---|
| Pigs | No | None | NA | 0 | |
| Yes | 12 individual | <|1| | 4 | 120; 361; 511; 532 | |
| |1|–|2| | 5 | 131; 132; 141; 336; 352 | |||
| >|2| | 3 | 222; 325; 671 | |||
| 19 codes in 8 categories | <|1| | 11 (4) | 331337; 502503; 600601; 570577580584585 | ||
| |1|–|2| | 4 (2) | 271289; 379381 | |||
| >|2| | 4 (2) | 409412; 505507 | |||
| Sows | No | 2 individual | NA | 2 | 132; 230 |
| 4 codes in 2 categories | NA | 4 (2) | 379381; 600601 | ||
| Yes | 12 individual | <|1| | 8 | 120; 141; 352; 432; 472; 511; 532; 615 | |
| |1|–|2| | 2 | 222; 668 | |||
| >|2| | 2 | 131; 325 | |||
| 13 codes in 5 categories | <|1| | 9 (3) | 271289; 502503; 570577580584585 | ||
| |1|–|2| | 4 (2) | 409412; 505507 | |||
| >|2| | 0 | ||||
| Cattle < 18 months | No | None | NA | 0 | |
| Yes | 4 individual | <|1| | 2 | 141; 532 | |
| |1|–|2| | 1 | 412 | |||
| >|2| | 0 | ||||
| 17 codes in 5 categories | <|1| | 12 (3) | 374375377379381; 570577580584585; 602604 | ||
| |1|–|2| | 5 (2) | 222223352; 271289 | |||
| >|2| | 0 | ||||
| Cattle ≥ 18 months | No | 1 individual | 1 | 532 | |
| Yes | 7 individual | <|1| | 0 | ||
| |1|–|2| | 2 | 325; 412 | |||
| >|2| | 3 | 291; 509; 572 | |||
| 19 codes in 6 categories | <|1| | 17 (5) | 222223352; 505507; 374375377379381; 570577580584585; 602604 | ||
| |1|–|2| | 2 (1) | 271289 | |||
| >|2| | 0 |
1 Intervals are absolute values of the coefficients on the logit scale, e.g., the absolute value of −1.2 is 1.2 and it will be in the interval |1|–|2|. Codes in intervals <|1| indicate that the codes might be useful if they accurately predict animal welfare conditions; interval |1|–|2| indicate that the between slaughterhouse differences are deemed so high that it should be considered if application of correction factors will be appropriate; and >|2| indicates major differences between slaughterhouses and application of correction factors is deemed inappropriate. NA: Not applicable as there was no random effect.
Table 8.
Meat inspection codes deemed potentially useful for welfare related purposes given that they are accurate, while the abattoir effect is significant for most but still within a relatively small range.
Table 8.
Meat inspection codes deemed potentially useful for welfare related purposes given that they are accurate, while the abattoir effect is significant for most but still within a relatively small range.
| Swine Code | Cattle Code | Description | Useful in |
|---|---|---|---|
| 120 | Circulatory system disturbances (poor bleeding); anaemia; dropsy; oedema | pigs; sows | |
| 132 | Skinny | sows | |
| 141 | Pyemia; septicaemia; pyemic lung abscesses; splenitis-septicaemia; nephritis-septicaemia; | sows | |
| 141 | Pyemia; septicaemia; pyemic lung abscesses; splenitis-septicaemia; nephritis-septicaemia; pyemic hepatic abscesses | calves | |
| 222223352 | Chronic pericarditis; Traumatic reticulitis-pericarditis; Chronic peritonitis; peritoneal abscess incl. subphrenic abscesses | cows | |
| 230 | Endocarditis (acute or healed) | sows | |
| 271289 | Chronic pneumonia or pleuritis; aeronic abscesses; serositis | sows | |
| 331337 | Rectal prolapse; rectal stricture | pigs | |
| 352 | Chronic peritonitis; peritoneal abscess; discoloured peritoneum (from splenic torsion) | sows | |
| 361 | Hernia (umbilical; inguinal) | pigs | |
| 374375377379381 | Fatty liver; acute, subacute, chronic hepatic abscesses and non-pyemic abscesses; chronic hepatitis with necrosis; chronic parasitic hepatitis; liver cirrhosis; jaundice | calves; cows | |
| 379381 | Chronic hepatitis; hepatic necrosis; jaundice | sows | |
| 432 | Chronic metritis; retained placenta; incomplete parturition; uterine prolapse | sows | |
| 472 | Chronic mastitis | sows | |
| 502503 | Old fracture; infected fracture; open fracture >6 h old | pigs; sows | |
| 511 | Acute, chronic, local, healed osteomyelitis; abscesses following wound | pigs; sows | |
| 505507 | Tail fracture; rib fracture, healed | cows | |
| 532 | 532 | Chronic arthritis; arthrosis | All |
| 570577580 584585 | Abscesses in front, mid or rear part; in the leg or toe; in the head; blood ear | pigs; sows | |
| 570577580584585 | Abscesses in front, mid or rear part; in the leg or toe; in the head; tongue incl. actinomycosis | calves; cows | |
| 600601 | Tail-bite, local; tail-bite incl. Infection | pigs; sows | |
| 602604 | Hock, hip; chest, thigh, pinbone, ischial abrasions | calves; cows | |
| 615 | Shoulder wounds | sows |
© 2017 by the authors. Licensee MDPI, Basel, Switzerland. This article is an open access article distributed under the terms and conditions of the Creative Commons Attribution (CC BY) license (http://creativecommons.org/licenses/by/4.0/).
Share and Cite
MDPI and ACS Style
Nielsen, S.S.; Denwood, M.J.; Forkman, B.; Houe, H. Selection of Meat Inspection Data for an Animal Welfare Index in Cattle and Pigs in Denmark. Animals 2017, 7, 94. https://doi.org/10.3390/ani7120094
AMA Style
Nielsen SS, Denwood MJ, Forkman B, Houe H. Selection of Meat Inspection Data for an Animal Welfare Index in Cattle and Pigs in Denmark. Animals. 2017; 7(12):94. https://doi.org/10.3390/ani7120094
Chicago/Turabian StyleNielsen, Søren Saxmose, Matthew James Denwood, Björn Forkman, and Hans Houe. 2017. "Selection of Meat Inspection Data for an Animal Welfare Index in Cattle and Pigs in Denmark" Animals 7, no. 12: 94. https://doi.org/10.3390/ani7120094
Note that from the first issue of 2016, this journal uses article numbers instead of page numbers. See further details here.