The Lost South Gobi Microcontinent: Protolith Studies of Metamorphic Tectonites and Implications for the Evolution of Continental Crust in Southeastern Mongolia

Abstract
:1. Introduction


2. Geologic Background
3. Methods
3.1. Microstructural Analysis
3.2. Analytical Methods for U-Pb Zircon Geochronology

| U-Pb geochronologic analyses 07TH10A | Isotope ratios | Apparent ages (Ma) | |||||||||||||||||
|---|---|---|---|---|---|---|---|---|---|---|---|---|---|---|---|---|---|---|---|
| Analysis | U | 206Pb | U/Th | 206Pb | ± | 207Pb | ± | 206Pb | ± | error | 206Pb | ± | 207Pb | ± | 206Pb | ± | Conc. | Pit Diameter | Population Age |
| (ppm) | 204Pb | 207Pb | (%) | 235U | (%) | 238U | (%) | corr. | 238U | (Ma) | 235U | (Ma) | 207Pb | (Ma) | (%) | (μm) | |||
| 07TH10A-2C-A | 97 | 3283 | 1.6 | 18.7427 | 10.0 | 0.3524 | 12.9 | 0.0479 | 8.2 | 0.63 | 301.6 | 24.1 | 306.5 | 34.1 | 343.9 | 226.0 | 87.7 | 10 | |
| 07TH10A-40R-B | 690 | 16382 | 0.9 | 19.1456 | 0.9 | 0.3406 | 7.6 | 0.0473 | 7.6 | 0.99 | 297.9 | 22.1 | 297.6 | 19.7 | 295.6 | 20.0 | 100.8 | 10 | |
| 07TH10A-15R-B | 255 | 23527 | 1.2 | 18.7668 | 1.8 | 0.3487 | 3.3 | 0.0475 | 2.8 | 0.84 | 298.9 | 8.1 | 303.8 | 8.6 | 341.0 | 40.0 | 87.7 | 14 | |
| 07TH10A-16R-B | 791 | 53157 | 1.6 | 18.8917 | 0.6 | 0.3665 | 2.2 | 0.0502 | 2.2 | 0.97 | 315.9 | 6.6 | 317.1 | 6.1 | 325.9 | 13.1 | 96.9 | 14 | |
| 07TH10A-18C-A | 244 | 20813 | 2.4 | 18.6552 | 1.5 | 0.3601 | 4.8 | 0.0487 | 4.5 | 0.95 | 306.6 | 13.5 | 312.3 | 12.8 | 354.5 | 33.7 | 86.5 | 14 | |
| 07TH10A-27C-A | 131 | 8685 | 2.3 | 18.7774 | 2.1 | 0.3576 | 2.5 | 0.0487 | 1.3 | 0.53 | 306.5 | 4.0 | 310.4 | 6.7 | 339.7 | 48.3 | 90.2 | 14 | |
| 07TH10A-36C-A | 108 | 6155 | 2.0 | 18.8296 | 3.6 | 0.3525 | 4.4 | 0.0481 | 2.6 | 0.58 | 303.0 | 7.6 | 306.6 | 11.6 | 333.4 | 81.0 | 90.9 | 14 | 307 ± 6 Ma (2σ) |
| 07TH10A-1C-A | 130 | 4535 | 1.4 | 18.6180 | 5.7 | 0.4057 | 9.2 | 0.0548 | 7.3 | 0.79 | 343.9 | 24.3 | 345.8 | 27.0 | 358.9 | 128.3 | 95.8 | 10 | |
| 07TH10A-1R-B | 201 | 13594 | 1.9 | 18.2333 | 4.7 | 0.4461 | 6.0 | 0.0590 | 3.7 | 0.61 | 369.5 | 13.2 | 374.5 | 18.8 | 405.9 | 106.3 | 91.0 | 10 | |
| 07TH10A-13R-B | 266 | 8491 | 1.9 | 18.8436 | 3.3 | 0.3941 | 11.5 | 0.0539 | 11.0 | 0.96 | 338.2 | 36.4 | 337.4 | 33.1 | 331.7 | 75.7 | 101.9 | 10 | |
| 07TH10A-25C-A | 285 | 10766 | 0.9 | 18.8083 | 2.1 | 0.3644 | 4.4 | 0.0497 | 3.9 | 0.88 | 312.7 | 11.8 | 315.5 | 12.0 | 336.0 | 47.8 | 93.1 | 10 | |
| 07TH10A-30C-A | 185 | 7377 | 1.1 | 18.7801 | 4.5 | 0.3880 | 5.9 | 0.0528 | 3.8 | 0.65 | 332.0 | 12.4 | 332.9 | 16.8 | 339.4 | 102.2 | 97.8 | 10 | |
| 07TH10A-30R-B | 278 | 12192 | 1.6 | 18.8128 | 2.0 | 0.3977 | 4.6 | 0.0543 | 4.1 | 0.90 | 340.7 | 13.7 | 340.0 | 13.3 | 335.4 | 46.1 | 101.6 | 10 | |
| 07TH10A-40C-A | 156 | 5494 | 1.3 | 18.9022 | 3.0 | 0.3946 | 4.7 | 0.0541 | 3.5 | 0.76 | 339.7 | 11.7 | 337.8 | 13.4 | 324.7 | 69.1 | 104.6 | 10 | |
| 07TH10A-41C-A | 189 | 6515 | 1.4 | 18.5462 | 3.3 | 0.3873 | 4.5 | 0.0521 | 3.1 | 0.69 | 327.4 | 10.0 | 332.4 | 12.9 | 367.7 | 73.9 | 89.0 | 10 | |
| 07TH10A-47C-A | 253 | 6888 | 1.1 | 19.0453 | 1.8 | 0.3612 | 4.3 | 0.0499 | 3.9 | 0.91 | 313.9 | 11.9 | 313.1 | 11.6 | 307.5 | 41.5 | 102.1 | 10 | |
| 07TH10A-4C-A | 264 | 18568 | 1.4 | 18.8124 | 1.0 | 0.3952 | 2.3 | 0.0539 | 2.1 | 0.90 | 338.5 | 6.9 | 338.2 | 6.7 | 335.5 | 22.8 | 100.9 | 14 | |
| 07TH10A-12C-A | 262 | 28887 | 2.8 | 18.7075 | 1.1 | 0.4169 | 5.9 | 0.0566 | 5.8 | 0.98 | 354.7 | 19.9 | 353.8 | 17.6 | 348.1 | 25.2 | 101.9 | 14 | |
| 07TH10A-13C-A | 204 | 12090 | 2.4 | 18.8453 | 2.5 | 0.3778 | 3.3 | 0.0516 | 2.1 | 0.64 | 324.6 | 6.7 | 325.4 | 9.2 | 331.5 | 57.1 | 97.9 | 14 | |
| 07TH10A-14C-A | 204 | 14062 | 2.2 | 19.0091 | 1.7 | 0.3632 | 2.9 | 0.0501 | 2.4 | 0.82 | 314.9 | 7.4 | 314.6 | 7.9 | 311.9 | 37.8 | 101.0 | 14 | |
| 07TH10A-15C-A | 162 | 11624 | 1.7 | 18.8436 | 2.6 | 0.3612 | 4.1 | 0.0494 | 3.1 | 0.77 | 310.6 | 9.5 | 313.1 | 11.0 | 331.7 | 59.1 | 93.6 | 14 | |
| 07TH10A-16C-A | 143 | 8955 | 1.8 | 18.7501 | 2.4 | 0.3894 | 3.1 | 0.0530 | 1.9 | 0.62 | 332.6 | 6.2 | 333.9 | 8.8 | 343.0 | 54.8 | 97.0 | 14 | |
| 07TH10A-17R-A | 84 | 416785 | 2.3 | 17.9806 | 2.4 | 0.3975 | 3.7 | 0.0518 | 2.8 | 0.76 | 325.8 | 9.0 | 339.8 | 10.7 | 437.0 | 53.7 | 74.5 | 14 | |
| 07TH10A-20C-A | 118 | 15635 | 3.0 | 18.3582 | 6.2 | 0.3726 | 6.8 | 0.0496 | 2.7 | 0.40 | 312.1 | 8.3 | 321.6 | 18.6 | 390.6 | 139.0 | 79.9 | 14 | |
| 07TH10A-20R-B | 143 | 24260 | 2.6 | 18.5587 | 3.0 | 0.4040 | 4.6 | 0.0544 | 3.5 | 0.76 | 341.3 | 11.7 | 344.5 | 13.5 | 366.1 | 67.8 | 93.2 | 14 | |
| 07TH10A-21C-B | 387 | 32055 | 2.6 | 18.8082 | 0.9 | 0.3996 | 3.6 | 0.0545 | 3.5 | 0.97 | 342.2 | 11.6 | 341.4 | 10.4 | 336.0 | 20.7 | 101.8 | 14 | |
| 07TH10A-22C-A | 231 | 24911 | 1.2 | 18.6840 | 1.3 | 0.3946 | 2.4 | 0.0535 | 2.0 | 0.84 | 335.8 | 6.6 | 337.7 | 6.9 | 351.0 | 29.1 | 95.7 | 14 | |
| 07TH10A-32C-A | 233 | 12763 | 2.6 | 18.7738 | 1.7 | 0.3722 | 5.4 | 0.0507 | 5.1 | 0.95 | 318.7 | 15.9 | 321.3 | 14.9 | 340.1 | 38.3 | 93.7 | 14 | |
| 07TH10A-32R-B | 261 | 14972 | 1.8 | 18.7843 | 1.1 | 0.3891 | 4.6 | 0.0530 | 4.5 | 0.97 | 332.9 | 14.6 | 333.7 | 13.2 | 338.8 | 24.3 | 98.3 | 14 | |
| 07TH10A-33C-A | 148 | 12707 | 1.9 | 18.5337 | 2.0 | 0.4007 | 4.7 | 0.0539 | 4.3 | 0.91 | 338.2 | 14.1 | 342.1 | 13.7 | 369.2 | 44.6 | 91.6 | 14 | |
| 07TH10A-34C-A | 264 | 45693 | 2.0 | 18.1059 | 4.4 | 0.3943 | 6.9 | 0.0518 | 5.3 | 0.77 | 325.4 | 16.9 | 337.5 | 19.8 | 421.5 | 97.7 | 77.2 | 14 | |
| 07TH10A-39C-A | 196 | 27854 | 2.6 | 18.5501 | 2.3 | 0.4211 | 8.6 | 0.0567 | 8.3 | 0.96 | 355.2 | 28.5 | 356.8 | 25.8 | 367.2 | 52.7 | 96.7 | 14 | |
| 07TH10A-42C-A | 153 | 14160 | 1.6 | 18.5197 | 1.7 | 0.4004 | 2.3 | 0.0538 | 1.6 | 0.67 | 337.7 | 5.1 | 341.9 | 6.7 | 370.9 | 38.6 | 91.0 | 14 | |
| 07TH10A-43C-A | 399 | 88725 | 1.5 | 18.6151 | 0.7 | 0.4136 | 4.5 | 0.0558 | 4.4 | 0.99 | 350.3 | 15.0 | 351.5 | 13.2 | 359.3 | 16.3 | 97.5 | 14 | |
| 07TH10A-56C-A | 234 | 41310 | 1.8 | 18.6712 | 0.9 | 0.4264 | 3.8 | 0.0577 | 3.7 | 0.97 | 361.8 | 13.1 | 360.6 | 11.6 | 352.5 | 19.3 | 102.6 | 14 | |
| 07TH10A-1R-C | 497 | 8210 | 1.7 | 18.7978 | 1.5 | 0.4176 | 5.3 | 0.0569 | 5.1 | 0.96 | 357.0 | 17.6 | 354.3 | 15.8 | 337.2 | 33.4 | 105.8 | 10 | |
| 07TH10A-45C-A | 286 | 7836 | 1.2 | 18.8220 | 2.5 | 0.4138 | 11.3 | 0.0565 | 11.0 | 0.97 | 354.2 | 38.1 | 351.6 | 33.7 | 334.3 | 57.4 | 106.0 | 10 | |
| 07TH10A-45R-B | 814 | 19357 | 0.7 | 18.9175 | 1.0 | 0.4096 | 4.1 | 0.0562 | 4.0 | 0.97 | 352.5 | 13.7 | 348.6 | 12.2 | 322.9 | 22.7 | 109.2 | 10 | |
| 07TH10A-50C-A | 134 | 3263 | 2.1 | 19.5736 | 6.4 | 0.3699 | 9.2 | 0.0525 | 6.7 | 0.72 | 329.9 | 21.4 | 319.6 | 25.3 | 244.8 | 146.9 | 134.7 | 10 | 331 ± 5 Ma (2σ) |
| 07TH10A-5C-A | 188 | 9474 | 2.8 | 19.0214 | 1.7 | 0.3924 | 3.0 | 0.0541 | 2.4 | 0.81 | 339.9 | 7.9 | 336.1 | 8.5 | 310.4 | 39.7 | 109.5 | 14 | |
| 07TH10A-6C-A | 439 | 12993 | 2.0 | 19.1043 | 1.6 | 0.4660 | 6.4 | 0.0646 | 6.2 | 0.97 | 403.4 | 24.2 | 388.4 | 20.7 | 300.5 | 37.0 | 134.2 | 14 | |
| 07TH10A-10C-A | 218 | 15288 | 1.3 | 19.0146 | 2.1 | 0.4115 | 7.9 | 0.0567 | 7.6 | 0.97 | 355.8 | 26.4 | 349.9 | 23.4 | 311.2 | 46.7 | 114.3 | 14 | |
| 07TH10A-21C-A | 469 | 29761 | 1.9 | 19.0050 | 0.6 | 0.4626 | 6.9 | 0.0638 | 6.9 | 1.00 | 398.5 | 26.7 | 386.1 | 22.2 | 312.4 | 12.6 | 127.6 | 14 | |
| 07TH10A-35C-A | 76 | 5463 | 1.9 | 19.2034 | 4.5 | 0.3809 | 5.1 | 0.0531 | 2.3 | 0.46 | 333.2 | 7.6 | 327.7 | 14.2 | 288.6 | 102.8 | 115.5 | 14 | |
| 07TH10A-51C-A | 272 | 16145 | 1.8 | 18.7610 | 1.2 | 0.4217 | 3.4 | 0.0574 | 3.2 | 0.94 | 359.6 | 11.1 | 357.2 | 10.2 | 341.7 | 26.1 | 105.3 | 14 | |
| U-Pb geochronologic analyses 07TH12A | Isotope ratios | Apparent ages (Ma) | |||||||||||||||||
|---|---|---|---|---|---|---|---|---|---|---|---|---|---|---|---|---|---|---|---|
| Analysis | U | 206Pb | U/Th | 206Pb | ± | 207Pb | ± | 206Pb | ± | error | 206Pb | ± | 207Pb | ± | 206Pb | ± | Conc. | Pit Diameter | Population Age |
| (ppm) | 204Pb | 207Pb | (%) | 235U | (%) | 238U | (%) | corr. | 238U | (Ma) | 235U | (Ma) | 207Pb | (Ma) | (%) | (μm) | |||
| 07TH12A-30R-B | 862 | 14548 | 1.2 | 19.6391 | 1.5 | 0.2431 | 7.0 | 0.0346 | 6.9 | 0.98 | 219.4 | 14.8 | 220.9 | 13.9 | 237.2 | 34.0 | 92.5 | 10.0 | |
| 07TH12A-2R-B | 266 | 5271 | 2.5 | 19.4957 | 5.7 | 0.2247 | 7.4 | 0.0318 | 4.7 | 0.64 | 201.6 | 9.4 | 205.8 | 13.8 | 254.0 | 131.0 | 79.4 | 10.0 | |
| 07TH12A-4C-A | 71 | 2904 | 2.4 | 19.6888 | 5.9 | 0.2432 | 6.4 | 0.0347 | 2.6 | 0.40 | 220.1 | 5.6 | 221.1 | 12.8 | 231.3 | 135.8 | 95.2 | 14.0 | |
| 07TH12A-6C-A | 86 | 3162 | 1.7 | 19.5426 | 4.8 | 0.2526 | 6.0 | 0.0358 | 3.5 | 0.59 | 226.8 | 7.9 | 228.7 | 12.2 | 248.5 | 110.7 | 91.3 | 14.0 | |
| 07TH12A-7R-B | 98 | 4734 | 2.3 | 19.0180 | 5.3 | 0.2742 | 5.9 | 0.0378 | 2.6 | 0.44 | 239.3 | 6.1 | 246.1 | 12.9 | 310.8 | 120.4 | 77.0 | 14.0 | |
| 07TH12A-12C-A | 79 | 3492 | 1.8 | 19.6414 | 6.2 | 0.2536 | 6.6 | 0.0361 | 2.3 | 0.35 | 228.7 | 5.2 | 229.5 | 13.5 | 236.9 | 142.0 | 96.5 | 14.0 | |
| 07TH12A-12R-B | 119 | 6623 | 2.4 | 19.6235 | 5.3 | 0.2649 | 9.0 | 0.0377 | 7.3 | 0.81 | 238.6 | 17.0 | 238.6 | 19.1 | 239.0 | 121.8 | 99.8 | 14.0 | |
| 07TH12A-13C-A | 87 | 3081 | 2.2 | 19.9777 | 5.7 | 0.2237 | 7.9 | 0.0324 | 5.5 | 0.69 | 205.7 | 11.1 | 205.0 | 14.7 | 197.6 | 132.8 | 104.1 | 14.0 | |
| 07TH12A-15C-A | 98 | 5192 | 1.8 | 19.4746 | 5.0 | 0.2339 | 6.6 | 0.0330 | 4.3 | 0.66 | 209.5 | 9.0 | 213.4 | 12.7 | 256.5 | 114.7 | 81.7 | 14.0 | |
| 07TH12A-18C-A | 150 | 9531 | 1.3 | 19.4390 | 2.7 | 0.2410 | 5.6 | 0.0340 | 5.0 | 0.88 | 215.4 | 10.6 | 219.2 | 11.1 | 260.8 | 61.1 | 82.6 | 14.0 | |
| 07TH12A-22C-A | 131 | 6264 | 1.8 | 19.7964 | 2.7 | 0.2473 | 7.7 | 0.0355 | 7.3 | 0.94 | 224.9 | 16.0 | 224.3 | 15.6 | 218.7 | 63.2 | 102.8 | 14.0 | |
| 07TH12A-26C-A | 128 | 5567 | 1.9 | 19.6399 | 4.3 | 0.2295 | 5.9 | 0.0327 | 4.0 | 0.68 | 207.4 | 8.2 | 209.8 | 11.2 | 237.0 | 100.0 | 87.5 | 14.0 | |
| 07TH12A-29C-A | 126 | 6499 | 2.0 | 19.3420 | 2.9 | 0.2415 | 3.6 | 0.0339 | 2.0 | 0.57 | 214.8 | 4.3 | 219.7 | 7.0 | 272.2 | 67.0 | 78.9 | 14.0 | |
| 07TH12A-30C-A | 141 | 9018 | 1.4 | 19.7237 | 2.8 | 0.2446 | 4.8 | 0.0350 | 4.0 | 0.82 | 221.7 | 8.6 | 222.2 | 9.6 | 227.2 | 63.8 | 97.6 | 14.0 | |
| 07TH12A-32C-A | 199 | 9480 | 2.2 | 19.5070 | 2.0 | 0.2596 | 3.2 | 0.0367 | 2.5 | 0.77 | 232.5 | 5.6 | 234.3 | 6.7 | 252.7 | 47.0 | 92.0 | 14.0 | |
| 07TH12A-44C-A | 129 | 50872 | 1.8 | 18.7181 | 3.7 | 0.2822 | 7.1 | 0.0383 | 6.0 | 0.85 | 242.4 | 14.3 | 252.4 | 15.8 | 346.9 | 84.7 | 69.9 | 14.0 | |
| 07TH12A-50C-A | 138 | 4337 | 2.2 | 19.8491 | 3.7 | 0.2280 | 4.4 | 0.0328 | 2.4 | 0.54 | 208.2 | 4.9 | 208.5 | 8.3 | 212.5 | 85.9 | 97.9 | 14.0 | 220 ± 6 Ma (2σ) |
| 07TH12A-10R-B | 173 | 18910 | 2.5 | 19.1732 | 2.7 | 0.2859 | 3.7 | 0.0398 | 2.5 | 0.68 | 251.3 | 6.2 | 255.3 | 8.2 | 292.3 | 60.9 | 86.0 | 14.0 | |
| 07TH12A-11C-A | 77 | 4366 | 2.0 | 19.2826 | 7.9 | 0.2866 | 11.0 | 0.0401 | 7.6 | 0.69 | 253.4 | 18.9 | 255.9 | 24.8 | 279.3 | 181.3 | 90.7 | 14.0 | |
| 07TH12A-9C-A | 280 | 4198 | 1.3 | 19.9259 | 4.7 | 0.2359 | 10.8 | 0.0341 | 9.7 | 0.90 | 216.1 | 20.5 | 215.1 | 20.9 | 203.6 | 110.3 | 106.2 | 10.0 | |
| 07TH12A-14C-A | 88 | 1328 | 2.2 | 22.1433 | 10.8 | 0.1987 | 12.7 | 0.0319 | 6.7 | 0.53 | 202.5 | 13.4 | 184.1 | 21.4 | -47.0 | 262.5 | -431.2 | 10.0 | |
| 07TH12A-14R-B | 463 | 7551 | 2.7 | 20.1280 | 2.2 | 0.2107 | 7.2 | 0.0308 | 6.8 | 0.95 | 195.2 | 13.1 | 194.1 | 12.7 | 180.1 | 52.4 | 108.4 | 10.0 | |
| 07TH12A-21C-A | 64 | 3439 | 2.4 | 17.1668 | 19.1 | 0.2583 | 20.0 | 0.0322 | 5.8 | 0.29 | 204.1 | 11.7 | 233.3 | 41.6 | 539.2 | 420.9 | 37.8 | 10.0 | |
| 07TH12A-25C-A | 112 | 16835 | 1.9 | 17.2894 | 7.0 | 0.2637 | 8.0 | 0.0331 | 3.8 | 0.48 | 209.7 | 7.9 | 237.6 | 17.0 | 523.6 | 154.3 | 40.0 | 10.0 | |
| 07TH12A-25R-B | 80 | 1899 | 2.4 | 18.7890 | 13.4 | 0.2489 | 17.2 | 0.0339 | 10.8 | 0.63 | 215.0 | 22.9 | 225.6 | 34.8 | 338.3 | 304.0 | 63.6 | 10.0 | |
| 07TH12A-33C-A | 84 | 1936 | 1.7 | 20.2623 | 11.4 | 0.2243 | 13.4 | 0.0330 | 7.0 | 0.52 | 209.1 | 14.3 | 205.5 | 24.9 | 164.6 | 267.8 | 127.0 | 10.0 | |
| 07TH12A-35C-A | 152 | 1929 | 1.9 | 21.1065 | 8.3 | 0.2109 | 9.6 | 0.0323 | 4.7 | 0.50 | 204.8 | 9.6 | 194.3 | 16.9 | 68.4 | 197.5 | 299.6 | 10.0 | |
| 07TH12A-35R-B | 175 | 2785 | 2.4 | 20.1678 | 8.3 | 0.2127 | 8.7 | 0.0311 | 2.9 | 0.33 | 197.5 | 5.5 | 195.8 | 15.6 | 175.5 | 193.1 | 112.5 | 10.0 | |
| 07TH12A-43C-A | 189 | 2383 | 1.5 | 20.5935 | 8.0 | 0.2153 | 8.3 | 0.0322 | 2.2 | 0.27 | 204.0 | 4.4 | 198.0 | 14.9 | 126.6 | 187.9 | 161.1 | 10.0 | |
| 07TH12A-1C-A | 77 | 11595 | 1.7 | 18.2948 | 7.0 | 0.2697 | 9.3 | 0.0358 | 6.0 | 0.65 | 226.7 | 13.5 | 242.5 | 20.0 | 398.3 | 158.0 | 56.9 | 14.0 | |
| 07TH12A-2C-A | 73 | 3036 | 2.1 | 18.8898 | 7.1 | 0.2580 | 8.7 | 0.0353 | 4.9 | 0.57 | 223.9 | 10.9 | 233.0 | 18.1 | 326.2 | 162.1 | 68.6 | 14.0 | |
| 07TH12A-3C-A | 122 | 3647 | 1.6 | 20.3121 | 4.1 | 0.2358 | 6.1 | 0.0347 | 4.5 | 0.74 | 220.2 | 9.7 | 215.0 | 11.8 | 158.9 | 96.6 | 138.6 | 14.0 | |
| 07TH12A-5C-A | 248 | 24160 | 0.9 | 19.1772 | 3.1 | 0.2161 | 3.7 | 0.0301 | 1.9 | 0.52 | 190.9 | 3.6 | 198.6 | 6.6 | 291.8 | 71.8 | 65.4 | 14.0 | |
| 07TH12A-7C-A | 60 | 7503 | 2.1 | 18.3715 | 7.6 | 0.2707 | 9.3 | 0.0361 | 5.4 | 0.58 | 228.4 | 12.1 | 243.2 | 20.2 | 389.0 | 171.1 | 58.7 | 14.0 | |
| 07TH12A-10C-A | 85 | 2911 | 2.5 | 20.0357 | 7.7 | 0.2566 | 8.9 | 0.0373 | 4.5 | 0.50 | 236.0 | 10.4 | 231.9 | 18.4 | 190.9 | 179.1 | 123.6 | 14.0 | |
| 07TH12A-17C-A | 83 | 5019 | 2.0 | 18.9501 | 6.2 | 0.2368 | 6.9 | 0.0326 | 3.0 | 0.44 | 206.5 | 6.1 | 215.8 | 13.5 | 318.9 | 141.7 | 64.8 | 14.0 | |
| 07TH12A-20C-A | 71 | 2867 | 2.1 | 20.0096 | 6.9 | 0.2587 | 7.5 | 0.0375 | 3.0 | 0.40 | 237.6 | 7.1 | 233.6 | 15.7 | 193.9 | 159.6 | 122.5 | 14.0 | |
| U-Pb geochronologic analyses 08OH03A | Isotope ratios | Apparent ages (Ma) | |||||||||||||||||
|---|---|---|---|---|---|---|---|---|---|---|---|---|---|---|---|---|---|---|---|
| Analysis | U | 206Pb | U/Th | 206Pb | ± | 207Pb | ± | 206Pb | ± | error | 206Pb | ± | 207Pb | ± | 206Pb | ± | Conc. | Pit Diameter | Population Age |
| (ppm) | 204Pb | 207Pb | (%) | 235U | (%) | 238U | (%) | corr. | 238U | (Ma) | 235U | (Ma) | 207Pb | (Ma) | (%) | (μm) | |||
| 08OH03A-45C-A | 285 | 4831 | 1.3 | 19.6881 | 4.8 | 0.2441 | 14.9 | 0.0349 | 14.1 | 0.95 | 220.9 | 30.6 | 221.8 | 29.7 | 231.4 | 112.0 | 95.5 | 10.0 | |
| 08OH03A-1C-B | 841 | 83568 | 3.1 | 19.5463 | 1.1 | 0.2747 | 2.7 | 0.0389 | 2.5 | 0.91 | 246.2 | 6.0 | 246.4 | 6.0 | 248.1 | 25.6 | 99.3 | 14 | |
| 08OH03A-1R-A | 1172 | 43232 | 1.8 | 19.5446 | 0.6 | 0.2810 | 4.7 | 0.0398 | 4.6 | 0.99 | 251.8 | 11.4 | 251.5 | 10.4 | 248.3 | 14.8 | 101.4 | 14 | |
| 08OH03A-23C-A | 590 | 21947 | 1.7 | 19.4849 | 0.5 | 0.2984 | 3.8 | 0.0422 | 3.7 | 0.99 | 266.2 | 9.8 | 265.1 | 8.8 | 255.3 | 11.5 | 104.3 | 14 | |
| 08OH03A-25C-A | 1322 | 158423 | 7.0 | 19.4655 | 0.7 | 0.2780 | 2.7 | 0.0392 | 2.6 | 0.97 | 248.2 | 6.3 | 249.1 | 5.9 | 257.6 | 15.3 | 96.3 | 14 | |
| 08OH03A-34C-A | 1486 | 93908 | 4.2 | 19.4470 | 0.5 | 0.2722 | 2.9 | 0.0384 | 2.9 | 0.98 | 242.8 | 6.8 | 244.4 | 6.3 | 259.8 | 11.5 | 93.5 | 14 | 248 ± 6 Ma (2σ) |
| 08OH03A-6R-C | 4159 | 1674 | 3.9 | 7.9610 | 15.6 | 0.5832 | 18.3 | 0.0337 | 9.4 | 0.52 | 213.5 | 19.8 | 466.5 | 68.4 | 2037.4 | 278.5 | 10.5 | 10.0 | |
| 08OH03A-13R-B | 1717 | 4647 | 2.9 | 14.1499 | 4.1 | 0.3528 | 7.4 | 0.0362 | 6.1 | 0.83 | 229.3 | 13.8 | 306.9 | 19.5 | 947.9 | 83.2 | 24.2 | 10.0 | |
| 08OH03A-16C-A | 3149 | 6127 | 0.3 | 15.5025 | 3.1 | 0.2380 | 13.6 | 0.0268 | 13.2 | 0.97 | 170.2 | 22.2 | 216.7 | 26.5 | 758.2 | 65.9 | 22.4 | 10.0 | |
| 08OH03A-16R-B | 5334 | 3535 | 0.5 | 11.8104 | 4.9 | 0.2170 | 6.1 | 0.0186 | 3.6 | 0.59 | 118.7 | 4.3 | 199.4 | 11.1 | 1308.0 | 95.8 | 9.1 | 10.0 | |
| 08OH03A-21R-B | 6729 | 1321 | 3.8 | 6.8464 | 14.8 | 0.5255 | 33.8 | 0.0261 | 30.4 | 0.90 | 166.1 | 49.9 | 428.8 | 118.9 | 2300.3 | 254.9 | 7.2 | 10.0 | |
| 08OH03A-26R-B | 2701 | 13365 | 5.5 | 17.4207 | 3.6 | 0.2863 | 5.9 | 0.0362 | 4.7 | 0.80 | 229.1 | 10.5 | 255.7 | 13.3 | 507.0 | 78.4 | 45.2 | 10.0 | |
| 08OH03A-29C-A | 2312 | 1801 | 0.6 | 8.5065 | 9.9 | 0.4515 | 14.6 | 0.0279 | 10.8 | 0.74 | 177.1 | 18.8 | 378.3 | 46.3 | 1919.4 | 178.4 | 9.2 | 10.0 | |
| 08OH03A-11R-B | 6155 | 1545 | 1.0 | 7.4661 | 3.2 | 0.3222 | 6.6 | 0.0174 | 5.8 | 0.88 | 111.5 | 6.4 | 283.6 | 16.3 | 2150.2 | 55.4 | 5.2 | 14 | |
| 08OH03A-12R-A | 1909 | 11891 | 4.0 | 16.6348 | 4.6 | 0.2954 | 6.6 | 0.0356 | 4.7 | 0.71 | 225.7 | 10.4 | 262.8 | 15.3 | 607.7 | 100.2 | 37.1 | 14 | |
| 08OH03A-13C-A | 2716 | 2860 | 1.0 | 10.3461 | 17.8 | 0.4260 | 19.7 | 0.0320 | 8.5 | 0.43 | 202.8 | 16.9 | 360.3 | 60.0 | 1560.5 | 337.5 | 13.0 | 14 | |
| 08OH03A-19C-A | 3339 | 1564 | 1.2 | 7.5220 | 14.7 | 0.5459 | 16.3 | 0.0298 | 7.2 | 0.44 | 189.2 | 13.4 | 442.3 | 58.6 | 2137.2 | 258.1 | 8.9 | 14 | |
| 08OH03A-19R-B | 3675 | 2275 | 3.7 | 9.2310 | 11.4 | 0.5136 | 14.6 | 0.0344 | 9.1 | 0.63 | 217.9 | 19.5 | 420.9 | 50.2 | 1771.5 | 208.1 | 12.3 | 14 | |
| 08OH03A-26C-A | 1354 | 8154 | 1.8 | 15.4394 | 14.1 | 0.3455 | 14.4 | 0.0387 | 2.6 | 0.18 | 244.7 | 6.2 | 301.4 | 37.5 | 766.8 | 298.9 | 31.9 | 14 | |
| 08OH03A-28C-A | 2628 | 2338 | 1.0 | 9.6214 | 7.0 | 0.4427 | 9.7 | 0.0309 | 6.7 | 0.69 | 196.1 | 13.0 | 372.2 | 30.2 | 1695.5 | 128.8 | 11.6 | 14 | |
| 08OH03A-4C-B | 120 | 4846 | 3.4 | 18.7982 | 8.8 | 0.3306 | 9.8 | 0.0451 | 4.4 | 0.45 | 284.2 | 12.3 | 290.0 | 24.8 | 337.2 | 198.9 | 84.3 | 10.0 | |
| 08OH03A-2C-A | 115 | 6035 | 1.8 | 18.8918 | 2.3 | 0.3602 | 3.8 | 0.0493 | 3.0 | 0.78 | 310.5 | 9.0 | 312.3 | 10.2 | 325.9 | 53.3 | 95.3 | 14 | |
| 08OH03A-3R-B | 306 | 12141 | 2.3 | 19.1568 | 1.2 | 0.3421 | 1.9 | 0.0475 | 1.5 | 0.77 | 299.4 | 4.3 | 298.8 | 4.9 | 294.2 | 27.8 | 101.7 | 14 | |
| 08OH03A-7C-A | 81 | 6494 | 2.2 | 18.4826 | 4.7 | 0.3362 | 5.0 | 0.0451 | 1.8 | 0.36 | 284.2 | 4.9 | 294.3 | 12.8 | 375.4 | 105.2 | 75.7 | 14 | |
| 08OH03A-4R-A | 189 | 2261 | 3.6 | 19.9484 | 7.0 | 0.3017 | 10.3 | 0.0437 | 7.6 | 0.74 | 275.4 | 20.5 | 267.7 | 24.4 | 201.0 | 162.6 | 137.1 | 10.0 | |
| 08OH03A-7R-B | 283 | 4729 | 5.8 | 19.2121 | 7.4 | 0.3683 | 7.8 | 0.0513 | 2.3 | 0.29 | 322.7 | 7.2 | 318.4 | 21.3 | 287.6 | 170.5 | 112.2 | 10.0 | |
| 08OH03A-9C-A | 175 | 3268 | 2.4 | 19.8148 | 5.3 | 0.3014 | 9.7 | 0.0433 | 8.1 | 0.84 | 273.4 | 21.8 | 267.5 | 22.8 | 216.6 | 123.1 | 126.2 | 10.0 | |
| 08OH03A-3C-A | 291 | 32213 | 2.3 | 18.9828 | 1.0 | 0.3907 | 9.1 | 0.0538 | 9.0 | 0.99 | 337.7 | 29.7 | 334.9 | 25.9 | 315.0 | 22.7 | 107.2 | 14 | |
| 08OH03A-5C-A | 51 | 2408 | 2.3 | 19.4584 | 7.4 | 0.3614 | 7.7 | 0.0510 | 2.0 | 0.27 | 320.7 | 6.4 | 313.3 | 20.6 | 258.4 | 169.7 | 124.1 | 14 | |
| 08OH03A-10C-A | 133 | 10272 | 3.3 | 19.1482 | 4.2 | 0.3783 | 5.8 | 0.0525 | 3.9 | 0.68 | 330.1 | 12.6 | 325.8 | 16.0 | 295.3 | 96.3 | 111.8 | 14 | |
| 08OH03A-21R-C | 723 | 11825 | 6.6 | 18.9036 | 2.5 | 0.3591 | 7.8 | 0.0492 | 7.4 | 0.95 | 309.8 | 22.4 | 311.5 | 21 | 324.5 | 57.8 | 95.5 | 10 | |
| 08OH03A-21C-A | 561 | 6322 | 4.3 | 15.1000 | 13.1 | 0.5086 | 21.8 | 0.0557 | 17.4 | 0.80 | 249.5 | 59.1 | 417.5 | 74.6 | 813.5 | 274.6 | 43.0 | 10 | |
| U-Pb geochronologic analyses 08OH04D | Isotope ratios | Apparent ages (Ma) | |||||||||||||||||
|---|---|---|---|---|---|---|---|---|---|---|---|---|---|---|---|---|---|---|---|
| Analysis | U | 206Pb | U/Th | 206Pb | ± | 207Pb | ± | 206Pb | ± | error | 206Pb | ± | 207Pb | ± | 206Pb | ± | Conc. | Pit Diameter | Populations |
| (ppm) | 204Pb | 207Pb | (%) | 235U | (%) | 238U | (%) | corr. | 238U | (Ma) | 235U | (Ma) | 207Pb | (Ma) | (%) | (μm) | |||
| 08OH04D-3C-A | 363 | 15781 | 2.0 | 19.4531 | 2.2 | 0.3026 | 8.9 | 0.0427 | 8.6 | 0.97 | 269.5 | 22.8 | 268.4 | 21.0 | 259.1 | 51.6 | 104.0 | 10 | |
| 04OH04D-13C-A | 582 | 21179 | 1.5 | 17.3138 | 4.4 | 0.5928 | 6.0 | 0.0744 | 4.1 | 0.69 | 462.9 | 18.3 | 472.7 | 22.6 | 520.5 | 95.6 | 88.9 | 10 | CORES |
| 04OH04D-14C-A | 131 | 26847 | 1.2 | 6.0561 | 0.6 | 10.2206 | 5.1 | 0.4489 | 5.1 | 0.99 | 2390.5 | 100.9 | 2454.9 | 47.1 | 2508.8 | 10.2 | 95.3 | 10 | |
| 04OH04D-18C-A | 134 | 4518 | 2.5 | 20.9960 | 6.6 | 0.4237 | 7.1 | 0.0645 | 2.8 | 0.39 | 403.1 | 10.8 | 358.7 | 21.5 | 80.8 | 155.9 | 498.8 | 10 | |
| 08OH04D-26C-A | 180 | 35086 | 6.1 | 12.1657 | 0.4 | 2.2844 | 8.0 | 0.2016 | 8.0 | 1.00 | 1183.7 | 86.3 | 1207.5 | 56.5 | 1250.3 | 8.2 | 94.7 | 10 | |
| 08OH04D-29C-A | 281 | 9528 | 3.2 | 19.2768 | 2.3 | 0.3230 | 15.6 | 0.0452 | 15.5 | 0.99 | 284.8 | 43.1 | 284.2 | 38.8 | 280.0 | 52.1 | 101.7 | 10 | |
| 08OH04D-36R-B | 202 | 19275 | 1.4 | 19.0986 | 4.6 | 0.3118 | 8.2 | 0.0432 | 6.8 | 0.83 | 272.6 | 18.2 | 275.6 | 19.8 | 301.2 | 104.6 | 90.5 | 10 | |
| 08OH04D-46C-A | 126 | 14887 | 6.8 | 17.4322 | 3.4 | 0.5391 | 5.7 | 0.0682 | 4.5 | 0.80 | 425.0 | 18.7 | 437.8 | 20.1 | 505.6 | 73.8 | 84.1 | 10 | |
| 08OH04D-48C-A | 258 | 12375 | 2.9 | 19.2739 | 2.9 | 0.2977 | 8.8 | 0.0416 | 8.3 | 0.94 | 262.8 | 21.3 | 264.6 | 20.4 | 280.3 | 66.6 | 93.8 | 10 | |
| 08OH04D-14R-B | 236 | 364668 | 0.9 | 6.1297 | 0.5 | 9.5279 | 3.0 | 0.4236 | 2.9 | 0.99 | 2276.7 | 56.3 | 2390.2 | 27.3 | 2488.4 | 7.9 | 91.5 | 14 | |
| 08OH04D-1C-A | 138 | 5499 | 3.2 | 19.8996 | 3.7 | 0.3460 | 9.4 | 0.0499 | 8.6 | 0.92 | 314.1 | 26.4 | 301.7 | 24.5 | 206.7 | 86.8 | 152.0 | 10 | |
| 04OH04D-15C-B | 725 | 16355 | 1.4 | 16.6104 | 13.6 | 0.4000 | 15.5 | 0.0482 | 7.6 | 0.49 | 303.4 | 22.4 | 341.7 | 45.1 | 610.9 | 294.9 | 49.7 | 10 | |
| 04OH04D-19C-C | 708 | 16751 | 3.2 | 18.5102 | 8.5 | 0.2662 | 9.1 | 0.0357 | 3.3 | 0.36 | 226.3 | 7.2 | 239.6 | 19.5 | 372.0 | 192.2 | 60.8 | 10 | |
| 04OH04D-22C-A | 218 | 7304 | 2.7 | 19.9497 | 4.9 | 0.3508 | 8.8 | 0.0508 | 7.3 | 0.83 | 319.1 | 22.8 | 305.3 | 23.2 | 200.9 | 113.6 | 158.9 | 10 | |
| 08OH04D-23C-A | 110 | 4643 | 0.5 | 21.5151 | 17.5 | 0.2463 | 19.5 | 0.0384 | 8.7 | 0.44 | 243.1 | 20.7 | 223.6 | 39.2 | 22.5 | 423.0 | 1078.4 | 10 | |
| 08OH04D-25C-A | 171 | 4967 | 1.3 | 23.7226 | 10.1 | 0.2444 | 11.6 | 0.0420 | 5.7 | 0.49 | 265.5 | 14.8 | 222.0 | 23.0 | -217.3 | 253.3 | -122.2 | 10 | |
| 080H04D-31C-A | 350 | 15530 | 1.9 | 19.4714 | 3.2 | 0.3217 | 6.0 | 0.0454 | 5.1 | 0.85 | 286.4 | 14.2 | 283.2 | 14.7 | 256.9 | 72.5 | 111.5 | 10 | |
| 080H04D-32C-A | 145 | 2255 | 2.5 | 16.7595 | 10.1 | 0.3417 | 11.7 | 0.0415 | 5.9 | 0.51 | 262.4 | 15.1 | 298.5 | 30.1 | 591.5 | 218.5 | 44.4 | 10 | |
| 080H04D-32R-B | 208 | 3887 | 3.7 | 20.8932 | 10.8 | 0.2604 | 13.5 | 0.0395 | 8.1 | 0.60 | 249.5 | 19.9 | 235.0 | 28.4 | 92.5 | 256.9 | 269.8 | 10 | |
| 080H04D-33C-A | 234 | 10279 | 6.5 | 19.4506 | 3.8 | 0.4115 | 5.6 | 0.0581 | 4.2 | 0.75 | 363.8 | 14.9 | 350.0 | 16.7 | 259.4 | 86.3 | 140.3 | 10 | |
| 08OH04D-34C-A | 262 | 9718 | 2.0 | 19.4594 | 3.0 | 0.3347 | 7.5 | 0.0472 | 6.9 | 0.92 | 297.5 | 20.1 | 293.1 | 19.2 | 258.3 | 69.9 | 115.2 | 10 | |
| 08OH04D-35C-A | 434 | 19814 | 1.7 | 19.8131 | 2.4 | 0.2995 | 5.5 | 0.0430 | 5.0 | 0.90 | 271.6 | 13.2 | 266.0 | 13.0 | 216.8 | 56.7 | 125.3 | 10 | |
| 08OH04D-36C-A | 230 | 16857 | 1.6 | 19.2635 | 5.6 | 0.3481 | 8.3 | 0.0486 | 6.1 | 0.74 | 306.1 | 18.3 | 303.3 | 21.7 | 281.5 | 127.5 | 108.7 | 10 | |
| 08OH04D-37C-A | 146 | 6873 | 2.9 | 19.4751 | 4.6 | 0.3380 | 8.6 | 0.0477 | 7.3 | 0.84 | 300.6 | 21.4 | 295.6 | 22.1 | 256.5 | 106.5 | 117.2 | 10 | |
| 08OH04D-47C-A | 125 | 3523 | 2.5 | 16.0830 | 4.9 | 0.3980 | 11.5 | 0.0464 | 10.4 | 0.90 | 292.5 | 29.8 | 340.2 | 33.3 | 680.2 | 105.4 | 43.0 | 10 | |
| 08OH04D-50C-A | 201 | 15939 | 2.0 | 18.4558 | 4.8 | 0.5465 | 9.6 | 0.0732 | 8.3 | 0.87 | 455.1 | 36.5 | 442.7 | 34.4 | 378.7 | 107.7 | 120.2 | 10 | |
| 08OH04D-6C-A | 33 | 5379 | 2.2 | 16.7294 | 6.0 | 0.4406 | 6.6 | 0.0535 | 2.7 | 0.41 | 335.8 | 8.8 | 370.7 | 20.4 | 595.4 | 129.8 | 56.4 | 14 | |
| 04OH04D-11C-A | 308 | 14943 | 1.3 | 19.2848 | 3.2 | 0.3205 | 6.8 | 0.0448 | 5.9 | 0.88 | 282.7 | 16.4 | 282.3 | 16.6 | 279.0 | 73.4 | 101.3 | 10 | |
| 08OH04D-24C-A | 165 | 8433 | 0.5 | 19.4201 | 6.7 | 0.2843 | 9.5 | 0.0400 | 6.7 | 0.70 | 253.1 | 16.6 | 254.1 | 21.3 | 263.0 | 155.1 | 96.3 | 10 | |
| 08OH04D-45C-A | 155 | 9680 | 1.5 | 18.8424 | 4.4 | 0.3368 | 6.2 | 0.0460 | 4.4 | 0.71 | 290.1 | 12.5 | 294.8 | 15.9 | 331.8 | 98.9 | 87.4 | 10 | Needle-shaped |
| 08OH04D-45R-B | 630 | 18693 | 2.1 | 19.0879 | 1.4 | 0.3157 | 6.5 | 0.0437 | 6.4 | 0.98 | 275.8 | 17.2 | 278.6 | 15.9 | 302.4 | 31.0 | 91.2 | 10 | Grains |
| 08OH04D-17C-A | 492 | 63260 | 3.4 | 19.2048 | 1.5 | 0.3014 | 4.0 | 0.0420 | 3.7 | 0.93 | 265.1 | 9.5 | 267.5 | 9.3 | 288.5 | 34.2 | 91.9 | 14 | |
| 08OH04D-48C-A | 258 | 12375 | 2.9 | 19.2739 | 2.9 | 0.2977 | 8.8 | 0.0416 | 8.3 | 0.94 | 262.8 | 21.3 | 264.6 | 20.4 | 280.3 | 66.6 | 93.8 | 10 | 272 ± 12 |
| 04OH04D-19C-C | 708 | 16751 | 3.2 | 18.5102 | 8.5 | 0.2662 | 9.1 | 0.0357 | 3.3 | 0.36 | 226.3 | 7.2 | 239.6 | 19.5 | 372.0 | 192.2 | 60.8 | 10 | Ma (2σ) |
| 04OH04D-22C-A | 218 | 7304 | 2.7 | 19.9497 | 4.9 | 0.3508 | 8.8 | 0.0508 | 7.3 | 0.83 | 319.1 | 22.8 | 305.3 | 23.2 | 200.9 | 113.6 | 158.9 | 10 | |
| 080H04D-33C-A | 234 | 10279 | 6.5 | 19.4506 | 3.8 | 0.4115 | 5.6 | 0.0581 | 4.2 | 0.75 | 363.8 | 14.9 | 350.0 | 16.7 | 259.4 | 86.3 | 140.3 | 10 | |
| 08OH04D-34C-A | 262 | 9718 | 2.0 | 19.4594 | 3.0 | 0.3347 | 7.5 | 0.0472 | 6.9 | 0.92 | 297.5 | 20.1 | 293.1 | 19.2 | 258.3 | 69.9 | 115.2 | 10 | |
| 08OH04D-10R-A | 1945 | 28383 | 4.6 | 18.1474 | 2.6 | 0.3649 | 6.0 | 0.0480 | 5.4 | 0.90 | 302.4 | 15.9 | 315.9 | 16.2 | 416.4 | 58.0 | 72.6 | 10 | |
| 04OH04D-16C-A | 173 | 11161 | 0.6 | 16.7562 | 1.9 | 0.3791 | 15.3 | 0.0461 | 15.2 | 0.99 | 290.3 | 43.0 | 326.4 | 42.6 | 592.0 | 40.2 | 49.0 | 10 | |
| 04OH04D-20C-A | 421 | 14869 | 8.9 | 17.3914 | 1.5 | 0.3646 | 3.5 | 0.0460 | 3.2 | 0.90 | 289.9 | 9.0 | 315.7 | 9.5 | 510.8 | 32.8 | 56.8 | 10 | |
| 08OH04D-27C-A | 209 | 8432 | 1.0 | 20.2453 | 4.3 | 0.3523 | 5.7 | 0.0517 | 3.7 | 0.65 | 325.1 | 11.6 | 306.4 | 15.0 | 166.6 | 101.1 | 195.2 | 10 | |
| 08OH04D-28C-A | 137 | 30784 | 2.0 | 20.4665 | 3.6 | 0.2764 | 10.3 | 0.0410 | 9.6 | 0.94 | 259.2 | 24.4 | 247.8 | 22.5 | 141.1 | 84.4 | 183.7 | 10 | |
| 08OH04D-52C-A | 950 | 7446 | 1.8 | 14.9439 | 22.0 | 0.3657 | 25.2 | 0.0396 | 12.4 | 0.49 | 250.6 | 30.5 | 316.5 | 68.7 | 835.2 | 462.7 | 30.0 | 10 | |
| 08OH04D-52R-B | 1429 | 10582 | 1.3 | 15.3698 | 18.4 | 0.4035 | 29.4 | 0.0450 | 22.9 | 0.78 | 283.6 | 63.6 | 344.2 | 86.1 | 776.3 | 390.4 | 36.5 | 10 | |
| 08OH04D-1R-B | 2829 | 1606 | 38.8 | 9.6970 | 9.2 | 0.2792 | 12.5 | 0.0196 | 8.5 | 0.68 | 125.4 | 10.5 | 250.0 | 27.7 | 1681.1 | 170.9 | 7.5 | 10 | |
| 08OH04D-4C-A | 3376 | 2450 | 33.0 | 10.7637 | 6.9 | 0.2620 | 15.0 | 0.0204 | 13.3 | 0.89 | 130.5 | 17.1 | 236.2 | 31.6 | 1485.9 | 131.7 | 8.8 | 10 | RIMS |
| 04OH04D-15R-A | 232 | 6259 | 11.6 | 23.7688 | 15.4 | 0.2807 | 17.7 | 0.0484 | 8.7 | 0.49 | 304.6 | 25.8 | 251.2 | 39.4 | -222.2 | 389.7 | -137.1 | 10 | |
| 04OH04D-19R-A | 2474 | 2395 | 29.1 | 10.6793 | 4.2 | 0.2383 | 15.6 | 0.0185 | 15.0 | 0.96 | 117.9 | 17.6 | 217.0 | 30.5 | 1500.8 | 78.6 | 7.9 | 10 | |
| 04OH04D-19R-B | 3031 | 7778 | 58.2 | 15.9313 | 29.2 | 0.1677 | 29.3 | 0.0194 | 3.1 | 0.11 | 123.7 | 3.8 | 157.5 | 42.8 | 700.4 | 633.5 | 17.7 | 10 | |
| 08OH04D-26R-B | 1534 | 6668 | 47.5 | 13.6850 | 8.2 | 0.2284 | 19.6 | 0.0227 | 17.8 | 0.91 | 144.5 | 25.4 | 208.8 | 37.0 | 1015.9 | 167.3 | 14.2 | 10 | |
| 08OH04D-2C-A | 242 | 12485 | 1.5 | 19.3532 | 4.0 | 0.3675 | 9.5 | 0.0516 | 8.6 | 0.91 | 324.3 | 27.3 | 317.8 | 26.0 | 270.9 | 91.4 | 119.7 | 10 | Unclassified |
| 08OH04D-2R-B | 448 | 13958 | 1.9 | 19.2725 | 3.9 | 0.3783 | 9.1 | 0.0529 | 8.2 | 0.90 | 332.1 | 26.6 | 325.8 | 25.4 | 280.5 | 89.5 | 118.4 | 10 | ages |
| 08OH04D-7C-A | 367 | 10506 | 2.7 | 19.7755 | 2.0 | 0.3218 | 3.4 | 0.0462 | 2.8 | 0.81 | 290.9 | 7.8 | 283.3 | 8.4 | 221.1 | 45.8 | 131.5 | 10 | |
| 08OH04D-9R-A | 688 | 32327 | 7.6 | 18.2551 | 0.7 | 0.5027 | 3.0 | 0.0666 | 2.9 | 0.97 | 415.4 | 11.6 | 413.5 | 10.1 | 403.2 | 15.9 | 103.0 | 10 | |
| 08OH04D-9C-B | 442 | 29528 | 22.1 | 18.5279 | 1.7 | 0.4411 | 4.6 | 0.0593 | 4.3 | 0.93 | 371.2 | 15.5 | 371.0 | 14.3 | 369.9 | 38.3 | 100.4 | 10 | |
| 04OH04D-12C-A | 189 | 8491 | 1.8 | 17.9023 | 2.8 | 0.3632 | 5.6 | 0.0472 | 4.8 | 0.87 | 297.1 | 14.1 | 314.6 | 15.1 | 446.7 | 61.4 | 66.5 | 10 | |
| 04OH04D-12R-B | 227 | 9776 | 2.8 | 19.8198 | 3.8 | 0.3275 | 5.8 | 0.0471 | 4.3 | 0.74 | 296.5 | 12.4 | 287.6 | 14.4 | 216.0 | 88.9 | 137.3 | 10 | |
| 080H04D-30C-A | 642 | 27262 | 1.0 | 18.7514 | 1.6 | 0.3519 | 2.0 | 0.0479 | 1.2 | 0.61 | 301.4 | 3.5 | 306.2 | 5.2 | 342.8 | 35.3 | 87.9 | 10 | |
| 08OH04D-38C-A | 613 | 162246 | 1.0 | 18.3598 | 1.9 | 0.3847 | 3.1 | 0.0512 | 2.4 | 0.78 | 322.1 | 7.5 | 330.5 | 8.6 | 390.4 | 43.0 | 82.5 | 10 | |
| 08OH04D-40C-B | 294 | 10576 | 1.4 | 19.4161 | 3.0 | 0.3725 | 24.6 | 0.0525 | 24.5 | 0.99 | 329.6 | 78.6 | 321.5 | 68.0 | 263.4 | 67.9 | 125.1 | 10 | |
| 08OH04D-40R-C | 267 | 7849 | 1.8 | 18.8021 | 3.8 | 0.3097 | 7.7 | 0.0422 | 6.7 | 0.87 | 266.6 | 17.5 | 273.9 | 18.4 | 336.7 | 85.4 | 79.2 | 10 | |
| 08OH04D-43C-A | 523 | 28901 | 1.7 | 19.1478 | 0.8 | 0.3967 | 4.3 | 0.0551 | 4.2 | 0.98 | 345.7 | 14.0 | 339.2 | 12.3 | 295.3 | 18.8 | 117.1 | 10 | |
| 08OH04D-43R-B | 292 | 8367 | 2.2 | 19.3851 | 2.6 | 0.4353 | 6.7 | 0.0612 | 6.2 | 0.92 | 382.9 | 23.1 | 366.9 | 20.7 | 267.1 | 59.0 | 143.4 | 10 | |
| 08OH04D-51C-A | 271 | 7005 | 2.3 | 19.0057 | 2.2 | 0.3407 | 6.3 | 0.0470 | 5.9 | 0.94 | 295.9 | 17.0 | 297.7 | 16.2 | 312.3 | 49.9 | 94.7 | 10 | |
| 08OH04D-10C-B | 991 | 8369 | 3.0 | 15.5210 | 15.0 | 0.3852 | 17.4 | 0.0434 | 8.9 | 0.51 | 273.7 | 23.8 | 330.9 | 49.2 | 755.7 | 317.9 | 36.2 | 14 | |
| 08OH04D-1C-A | 196 | 19691 | 1.4 | 17.9265 | 0.8 | 0.5740 | 1.9 | 0.0746 | 1.8 | 0.91 | 464.0 | 7.8 | 460.6 | 7.1 | 443.7 | 17.2 | 104.6 | 18 | No CL image |
| 08OH04D-2C-A | 384 | 76305 | 5.2 | 5.8742 | 0.8 | 9.5768 | 6.3 | 0.4080 | 6.3 | 0.99 | 2205.8 | 117.2 | 2394.9 | 58.1 | 2560.0 | 12.6 | 86.2 | 18 | No CL image |
| 08OH04D-3C-A | 112 | 7113 | 1.8 | 19.0911 | 2.8 | 0.3860 | 3.3 | 0.0535 | 1.7 | 0.52 | 335.7 | 5.6 | 331.5 | 9.3 | 302.1 | 64.0 | 111.1 | 18 | No CL image |
| 08OH04D-4C-A | 339 | 22490 | 0.1 | 19.1067 | 1.3 | 0.3325 | 3.2 | 0.0461 | 2.9 | 0.91 | 290.4 | 8.2 | 291.4 | 8.0 | 300.2 | 29.4 | 96.7 | 18 | No CL image |
| 08OH04D-5C-A | 157 | 9095 | 2.2 | 19.2323 | 1.9 | 0.3484 | 2.2 | 0.0486 | 1.1 | 0.51 | 305.9 | 3.3 | 303.5 | 5.8 | 285.2 | 43.6 | 107.2 | 18 | No CL image |
| 08OH04D-6C-A | 3153 | 3304 | 4.0 | 11.5389 | 2.2 | 0.3124 | 2.8 | 0.0261 | 1.8 | 0.62 | 166.4 | 2.9 | 276.0 | 6.9 | 1353.0 | 43.2 | 12.3 | 18 | No CL image |
| 08OH04D-7C-A | 463 | 6160 | 5.5 | 15.0577 | 12.8 | 0.2248 | 13.5 | 0.0246 | 4.2 | 0.31 | 156.4 | 6.5 | 205.9 | 25.1 | 819.4 | 267.9 | 19.1 | 18 | No CL image |
| 08OH04D-8C-A | 883 | 67203 | 1.6 | 17.7948 | 0.4 | 0.5729 | 1.9 | 0.0739 | 1.8 | 0.97 | 459.9 | 8.0 | 459.9 | 6.9 | 460.1 | 9.3 | 99.9 | 18 | No CL image |
| 08OH04D-9C-A | 878 | 91423 | 1.0 | 18.9206 | 0.5 | 0.3360 | 1.4 | 0.0461 | 1.3 | 0.94 | 290.6 | 3.6 | 294.1 | 3.5 | 322.5 | 10.7 | 90.1 | 18 | No CL image |
| 08OH04D-10C-A | 474 | 52934 | 10.5 | 17.2854 | 3.5 | 0.5937 | 10.4 | 0.0744 | 9.8 | 0.94 | 462.8 | 43.8 | 473.2 | 39.3 | 524.2 | 76.0 | 88.3 | 18 | No CL image |
| 08OH04D-11C-A | 334 | 33768 | 1.6 | 18.5644 | 1.1 | 0.4104 | 2.5 | 0.0553 | 2.2 | 0.90 | 346.7 | 7.5 | 349.1 | 7.3 | 365.5 | 24.2 | 94.9 | 18 | No CL image |
| 08OH04D-12C-A | 296 | 11731 | 2.2 | 17.1476 | 3.2 | 0.5373 | 5.0 | 0.0668 | 3.9 | 0.77 | 416.9 | 15.7 | 436.6 | 17.9 | 541.7 | 69.8 | 77.0 | 18 | No CL image |
| 08OH04D-14C-A | 105 | 7977 | 2.3 | 19.4891 | 3.0 | 0.3077 | 3.2 | 0.0435 | 1.0 | 0.30 | 274.4 | 2.6 | 272.4 | 7.6 | 254.8 | 69.9 | 107.7 | 18 | No CL image |
| 08OH04D-15C-A | 252 | 19497 | 1.0 | 19.0408 | 1.2 | 0.3401 | 1.7 | 0.0470 | 1.2 | 0.72 | 295.9 | 3.5 | 297.2 | 4.4 | 308.0 | 26.7 | 96.0 | 18 | No CL image |
| U-Pb geochronologic analyses 06OH1-2 | Isotope ratios | Apparent ages (Ma) | |||||||||||||||||
|---|---|---|---|---|---|---|---|---|---|---|---|---|---|---|---|---|---|---|---|
| Analysis | U | 206Pb | U/Th | 206Pb | ± | 207Pb | ± | 206Pb | ± | error | 206Pb | ± | 207Pb | ± | 206Pb | ± | Conc. | Pit Diameter | Population Age |
| (ppm) | 204Pb | 207Pb | (%) | 235U | (%) | 238U | (%) | corr. | 238U | (Ma) | 235U | (Ma) | 207Pb | (Ma) | (%) | (μm) | |||
| 06OH12-3C-A | 281 | 16026 | 2.6 | 17.5988 | 1.7 | 0.4480 | 6.7 | 0.0572 | 6.5 | 0.97 | 358.5 | 22.7 | 375.9 | 21.2 | 484.7 | 38.6 | 74.0 | 10.0 | |
| 06OH12-10C-A | 152 | 5927 | 4.3 | 17.4435 | 4.6 | 0.4508 | 8.8 | 0.0570 | 7.5 | 0.85 | 357.6 | 26.0 | 377.9 | 27.7 | 504.2 | 101.1 | 70.9 | 10.0 | |
| 06OH12-11C-A | 289 | 17575 | 3.1 | 17.4615 | 2.5 | 0.4705 | 10.0 | 0.0596 | 9.6 | 0.97 | 373.1 | 35.0 | 391.5 | 32.4 | 501.9 | 55.0 | 74.3 | 10.0 | |
| 06OH12-13C-A | 357 | 28357 | 2.6 | 18.4788 | 3.0 | 0.4226 | 9.9 | 0.0566 | 9.4 | 0.95 | 355.1 | 32.6 | 357.9 | 29.9 | 375.9 | 66.7 | 94.5 | 10.0 | |
| 06OH12-17C-A | 297 | 17862 | 2.5 | 18.1970 | 2.6 | 0.4338 | 6.0 | 0.0572 | 5.3 | 0.90 | 358.9 | 18.7 | 365.8 | 18.3 | 410.3 | 59.1 | 87.5 | 10.0 | |
| 06OH12-18C-A | 309 | 25101 | 2.2 | 17.3205 | 1.5 | 0.4788 | 2.6 | 0.0601 | 2.1 | 0.82 | 376.5 | 7.7 | 397.2 | 8.5 | 519.7 | 32.4 | 72.4 | 10.0 | |
| 06OH12-23C-A | 301 | 15015 | 2.1 | 18.1116 | 3.1 | 0.4418 | 15.5 | 0.0580 | 15.2 | 0.98 | 363.6 | 53.9 | 371.5 | 48.4 | 420.8 | 68.7 | 86.4 | 10.0 | |
| 06OH12-26C-A | 545 | 33388 | 2.9 | 18.1857 | 1.4 | 0.4122 | 9.7 | 0.0544 | 9.6 | 0.99 | 341.3 | 31.9 | 350.5 | 28.8 | 411.7 | 30.7 | 82.9 | 10.0 | |
| 06OH12-27C-A | 346 | 26676 | 2.1 | 17.9476 | 0.7 | 0.4500 | 5.9 | 0.0586 | 5.9 | 0.99 | 366.9 | 20.9 | 377.3 | 18.6 | 441.1 | 14.7 | 83.2 | 10.0 | |
| 06OH12-30C-A | 293 | 12778 | 2.7 | 18.2670 | 3.3 | 0.4479 | 9.2 | 0.0593 | 8.6 | 0.93 | 371.6 | 31.1 | 375.8 | 29.0 | 401.7 | 74.0 | 92.5 | 10.0 | |
| 06OH12-37C-A | 161 | 6680 | 2.4 | 18.2991 | 2.4 | 0.4557 | 7.3 | 0.0605 | 6.9 | 0.94 | 378.5 | 25.3 | 381.3 | 23.2 | 397.8 | 53.7 | 95.2 | 10.0 | |
| 06OH12-55C-A | 354 | 11842 | 2.4 | 17.4789 | 1.9 | 0.4703 | 5.3 | 0.0596 | 4.9 | 0.93 | 373.3 | 17.8 | 391.4 | 17.1 | 499.7 | 41.6 | 74.7 | 10.0 | |
| 06OH12-67C-A | 339 | 17323 | 2.0 | 18.3952 | 1.6 | 0.4368 | 7.5 | 0.0583 | 7.3 | 0.98 | 365.2 | 25.9 | 368.0 | 23.1 | 386.1 | 36.8 | 94.6 | 10.0 | |
| 06OH12-1C-A | 201 | 27527 | 2.8 | 18.2801 | 1.2 | 0.4345 | 2.2 | 0.0576 | 1.8 | 0.84 | 361.1 | 6.5 | 366.4 | 6.7 | 400.1 | 26.5 | 90.2 | 14.0 | |
| 06OH12-2C-A | 287 | 33783 | 2.6 | 18.4466 | 2.0 | 0.4495 | 4.4 | 0.0601 | 3.9 | 0.89 | 376.5 | 14.3 | 376.9 | 13.9 | 379.8 | 45.6 | 99.1 | 14.0 | |
| 06OH12-12C-A | 226 | 20389 | 2.3 | 18.5202 | 1.4 | 0.4483 | 4.9 | 0.0602 | 4.7 | 0.96 | 376.9 | 17.1 | 376.1 | 15.3 | 370.8 | 31.3 | 101.7 | 14.0 | |
| 06OH12-14C-A | 202 | 122235 | 2.4 | 18.5405 | 2.2 | 0.4481 | 4.5 | 0.0603 | 3.9 | 0.87 | 377.2 | 14.4 | 375.9 | 14.2 | 368.4 | 50.2 | 102.4 | 14.0 | |
| 06OH12-15C-A | 344 | 45526 | 2.0 | 18.4726 | 1.0 | 0.4345 | 1.7 | 0.0582 | 1.5 | 0.83 | 364.7 | 5.2 | 366.3 | 5.4 | 376.6 | 21.6 | 96.8 | 14.0 | 367 ± 9 Ma (2σ) |
| 06OH12-2R-B | 258 | 10511 | 2.6 | 18.7933 | 2.7 | 0.4205 | 6.8 | 0.0573 | 6.2 | 0.92 | 359.3 | 21.8 | 356.4 | 20.4 | 337.8 | 60.3 | 106.4 | 10.0 | |
| 06OH12-4C-A | 301 | 45948 | 2.0 | 18.7615 | 1.9 | 0.4437 | 4.0 | 0.0604 | 3.5 | 0.87 | 377.9 | 12.8 | 372.8 | 12.4 | 341.6 | 43.7 | 110.6 | 14.0 | |
| U-Pb geochronologic analyses 06OH1-1 | Isotope ratios | Apparent ages (Ma) | |||||||||||||||||
|---|---|---|---|---|---|---|---|---|---|---|---|---|---|---|---|---|---|---|---|
| Analysis | U | 206Pb | U/Th | 206Pb | ± | 207Pb | ± | 206Pb | ± | error | 206Pb | ± | 207Pb | ± | 206Pb | ± | Conc. | Pit Diameter | Population Age |
| (ppm) | 204Pb | 207Pb | (%) | 235U | (%) | 238U | (%) | corr. | 238U | (Ma) | 235U | (Ma) | 207Pb | (Ma) | (%) | (μm) | |||
| 06OH11-34C-A | 208 | 10133 | 1.8 | 18.8983 | 3.4 | 0.3936 | 7.1 | 0.0540 | 6.2 | 0.88 | 338.8 | 20.4 | 337.0 | 20.2 | 325.2 | 76.5 | 104.2 | 10 | |
| 06OH11-34C-B | 232 | 17180 | 1.8 | 18.2213 | 2.5 | 0.4459 | 6.6 | 0.0589 | 6.1 | 0.92 | 369.1 | 21.9 | 374.4 | 20.7 | 407.4 | 56.3 | 90.6 | 10 | |
| 06OH11-45C-A | 273 | 12787 | 1.7 | 18.2597 | 2.6 | 0.4438 | 6.3 | 0.0588 | 5.7 | 0.91 | 368.1 | 20.6 | 372.9 | 19.7 | 402.6 | 58.8 | 91.4 | 10 | |
| 06OH11-2C-A | 318 | 73181 | 2.3 | 18.5117 | 1.1 | 0.4464 | 4.1 | 0.0599 | 3.9 | 0.96 | 375.3 | 14.3 | 374.8 | 12.8 | 371.9 | 25.7 | 100.9 | 14 | |
| 06OH11-3C-A | 243 | 63889 | 2.0 | 18.2797 | 0.9 | 0.4389 | 2.0 | 0.0582 | 1.8 | 0.91 | 364.6 | 6.4 | 369.4 | 6.2 | 400.2 | 19.1 | 91.1 | 14 | |
| 06OH11-8C-A | 218 | 56817 | 2.3 | 18.3886 | 1.4 | 0.4504 | 2.8 | 0.0601 | 2.4 | 0.87 | 376.0 | 8.8 | 377.5 | 8.7 | 386.9 | 31.0 | 97.2 | 14 | |
| 06OH11-9C-A | 223 | 26251 | 1.8 | 18.5631 | 1.0 | 0.4505 | 3.7 | 0.0606 | 3.6 | 0.96 | 379.6 | 13.2 | 377.6 | 11.7 | 365.6 | 23.0 | 103.8 | 14 | |
| 06OH11-12C-A | 321 | 66194 | 1.9 | 18.2201 | 0.9 | 0.4424 | 2.0 | 0.0585 | 1.7 | 0.89 | 366.3 | 6.2 | 372.0 | 6.1 | 407.5 | 19.8 | 89.9 | 14 | |
| 06OH11-13C-A | 167 | 18951 | 2.5 | 18.5778 | 2.4 | 0.4404 | 3.3 | 0.0593 | 2.2 | 0.69 | 371.6 | 8.1 | 370.6 | 10.1 | 363.8 | 53.2 | 102.1 | 14 | |
| 06OH11-13R-B | 310 | 71278 | 2.1 | 18.2881 | 0.8 | 0.4519 | 3.0 | 0.0599 | 2.9 | 0.96 | 375.2 | 10.5 | 378.6 | 9.4 | 399.1 | 17.9 | 94.0 | 14 | |
| 06OH11-17C-A | 347 | 357144 | 1.9 | 18.3388 | 1.2 | 0.4385 | 4.1 | 0.0583 | 3.9 | 0.95 | 365.4 | 13.9 | 369.2 | 12.7 | 392.9 | 27.8 | 93.0 | 14 | |
| 06OH11-18C-A | 2183 | 108416 | 2.5 | 18.1517 | 0.5 | 0.4751 | 2.1 | 0.0626 | 2.1 | 0.98 | 391.1 | 7.8 | 394.7 | 6.9 | 415.9 | 10.4 | 94.0 | 14 | |
| 06OH11-19C-A | 256 | 256939 | 2.0 | 18.2377 | 1.5 | 0.4526 | 3.2 | 0.0599 | 2.8 | 0.88 | 374.8 | 10.3 | 379.1 | 10.2 | 405.3 | 34.5 | 92.5 | 14 | |
| 06OH11-20C-A | 181 | 83057 | 2.3 | 18.0970 | 1.2 | 0.4618 | 6.4 | 0.0606 | 6.3 | 0.98 | 379.4 | 23.2 | 385.5 | 20.6 | 422.6 | 27.0 | 89.8 | 14 | |
| 06OH11-24C-A | 345 | 93346 | 2.0 | 18.3518 | 0.8 | 0.4720 | 6.4 | 0.0628 | 6.3 | 0.99 | 392.8 | 24.0 | 392.6 | 20.7 | 391.4 | 17.2 | 100.4 | 14 | |
| 06OH11-62C-A | 207 | 34838 | 2.2 | 18.3751 | 1.1 | 0.4583 | 2.8 | 0.0611 | 2.5 | 0.91 | 382.2 | 9.3 | 383.1 | 8.8 | 388.5 | 24.9 | 98.4 | 14 | 373 ± 8 Ma (2σ) |
| 06OH11-7R-B | 147 | 6621 | 7.5 | 17.0224 | 3.9 | 0.4583 | 6.6 | 0.0566 | 5.3 | 0.81 | 354.8 | 18.3 | 383.1 | 21.0 | 557.7 | 85.3 | 63.6 | 10 | |
| 06OH11-14R-A | 212 | 10521 | 3.0 | 19.0848 | 3.5 | 0.4150 | 10.0 | 0.0574 | 9.4 | 0.94 | 360.0 | 32.8 | 352.4 | 29.7 | 302.8 | 78.7 | 118.9 | 10 | |
| 06OH11-1C-A | 429 | 5215 | 1.2 | 12.9663 | 22.9 | 0.6644 | 28.0 | 0.0625 | 16.0 | 0.57 | 390.7 | 60.8 | 517.3 | 113.9 | 1124.4 | 463.0 | 34.7 | 14 | |
| 06OH11-10C-A | 261 | 25994 | 2.2 | 18.5016 | 1.1 | 0.4726 | 7.1 | 0.0634 | 7.1 | 0.99 | 396.4 | 27.1 | 393.0 | 23.3 | 373.1 | 24.7 | 106.2 | 14 | |
| 06OH11-7C-A | 539 | 30288 | 21.8 | 17.5502 | 0.6 | 0.5389 | 6.6 | 0.0686 | 6.5 | 1.00 | 427.7 | 27.0 | 437.7 | 23.3 | 490.8 | 13.3 | 87.1 | 10 | |
| 06OH11-7C-C | 127 | 19294 | 87.2 | 17.5937 | 2.7 | 0.6419 | 6.7 | 0.0819 | 6.1 | 0.91 | 507.5 | 29.6 | 503.5 | 26.4 | 485.3 | 60.6 | 104.6 | 14 | |
| U-Pb geochronologic analyses 06OH2-7 | Isotope ratios | Apparent ages (Ma) | |||||||||||||||||
|---|---|---|---|---|---|---|---|---|---|---|---|---|---|---|---|---|---|---|---|
| Analysis | U | 206Pb | U/Th | 206Pb | ± | 207Pb | ± | 206Pb | ± | error | 206Pb | ± | 207Pb | ± | 206Pb | ± | Conc. | Pit Diameter | Population Age |
| (ppm) | 204Pb | 207Pb | (%) | 235U | (%) | 238U | (%) | corr. | 238U | (Ma) | 235U | (Ma) | 207Pb | (Ma) | (%) | (μm) | |||
| 06OH27-1C-A | 241 | 17314 | 2.2 | 18.2638 | 1.2 | 0.4689 | 4.3 | 0.0621 | 4.1 | 0.96 | 388.4 | 15.6 | 390.4 | 14.0 | 402.1 | 26.9 | 96.6 | 10 | |
| 06OH27-2C-A | 233 | 27488 | 2.1 | 18.5555 | 1.3 | 0.4282 | 5.0 | 0.0576 | 4.8 | 0.97 | 361.2 | 16.8 | 361.9 | 15.1 | 366.5 | 28.3 | 98.5 | 10 | |
| 06OH27-7R-B | 273 | 25043 | 2.6 | 18.5036 | 2.2 | 0.4107 | 6.9 | 0.0551 | 6.5 | 0.95 | 345.8 | 21.9 | 349.4 | 20.3 | 372.8 | 49.5 | 92.8 | 10 | |
| 06OH27-11C-A | 190 | 16866 | 1.4 | 18.0268 | 2.3 | 0.4477 | 4.8 | 0.0585 | 4.3 | 0.88 | 366.7 | 15.2 | 375.7 | 15.2 | 431.3 | 51.5 | 85.0 | 10 | |
| 06OH27-11R-B | 142 | 19778 | 2.1 | 18.6371 | 4.4 | 0.4354 | 7.2 | 0.0588 | 5.7 | 0.79 | 368.6 | 20.4 | 367.0 | 22.2 | 356.6 | 99.6 | 103.4 | 10 | |
| 06OH27-5C-A | 175 | 22571 | 2.6 | 18.6416 | 2.8 | 0.4345 | 5.8 | 0.0587 | 5.1 | 0.88 | 368.0 | 18.2 | 366.3 | 17.8 | 356.1 | 62.3 | 103.3 | 14 | 368 ± 14 Ma (2σ) |
| 06OH27-1C-B | 198 | 11490 | 2.3 | 18.9481 | 3.0 | 0.4474 | 7.0 | 0.0615 | 6.3 | 0.90 | 384.6 | 23.4 | 375.4 | 21.9 | 319.1 | 69.2 | 120.5 | 10 | |
| 06OH27-2R-B | 322 | 17191 | 3.1 | 18.9658 | 2.0 | 0.4184 | 9.8 | 0.0576 | 9.6 | 0.98 | 360.8 | 33.8 | 354.9 | 29.5 | 317.0 | 46.1 | 113.8 | 10 | |
| 06OH27-7C-A | 123 | 3530 | 3.7 | 16.8762 | 5.1 | 0.5088 | 6.3 | 0.0623 | 3.7 | 0.58 | 389.4 | 13.8 | 417.6 | 21.6 | 576.5 | 111.4 | 67.6 | 10 | |
| 06OH27-31C-A | 217 | 17674 | 2.7 | 18.6811 | 2.1 | 0.4573 | 4.3 | 0.0620 | 3.7 | 0.87 | 387.5 | 14.0 | 382.4 | 13.6 | 351.3 | 46.8 | 110.3 | 14 | |
| 06OH27-2R-B | 119 | 10101 | 2.8 | 18.6636 | 1.2 | 0.4432 | 2.6 | 0.0600 | 2.3 | 0.88 | 375.6 | 8.2 | 372.5 | 8.0 | 353.5 | 27.1 | 106.3 | 18 | |
| 06OH27-3C-A | 276 | 20619 | 2.1 | 18.1336 | 2.3 | 0.4615 | 4.4 | 0.0607 | 3.8 | 0.86 | 379.9 | 13.9 | 385.3 | 14.1 | 418.1 | 50.6 | 90.9 | 10 | |
| 06OH27-4C-A | 461 | 22128 | 2.1 | 17.6588 | 2.0 | 0.5066 | 3.0 | 0.0649 | 2.2 | 0.73 | 405.2 | 8.5 | 416.2 | 10.1 | 477.1 | 45.0 | 84.9 | 10 | |
| 06OH27-6C-A | 199 | 18183 | 2.1 | 18.3500 | 2.7 | 0.4535 | 5.9 | 0.0603 | 5.3 | 0.89 | 377.7 | 19.4 | 379.7 | 18.7 | 391.6 | 59.7 | 96.5 | 10 | |
| 06OH27-8C-A | 117 | 23266 | 2.4 | 17.8405 | 2.3 | 0.4968 | 4.6 | 0.0643 | 4.0 | 0.87 | 401.6 | 15.7 | 409.5 | 15.6 | 454.4 | 51.1 | 88.4 | 14 | |
| 06OH27-10C-B | 1703 | 172865 | 1.5 | 18.3618 | 0.4 | 0.4571 | 3.3 | 0.0609 | 3.3 | 0.99 | 381.0 | 12.1 | 382.3 | 10.5 | 390.1 | 9.1 | 97.6 | 14 | |
| 06OH27-23C-A | 1602 | 160095 | 1.4 | 18.3480 | 0.4 | 0.4769 | 2.6 | 0.0635 | 2.5 | 0.99 | 396.6 | 9.8 | 395.9 | 8.4 | 391.8 | 8.6 | 101.2 | 14 | |
| 06OH27-24C-A | 169 | 10231 | 2.4 | 17.9866 | 2.7 | 0.4793 | 4.2 | 0.0625 | 3.2 | 0.76 | 391.0 | 12.2 | 397.6 | 13.9 | 436.3 | 60.9 | 89.6 | 14 | |
| 06OH27-42C-A | 320 | 23579 | 2.2 | 18.2069 | 0.8 | 0.4526 | 5.2 | 0.0598 | 5.1 | 0.99 | 374.2 | 18.5 | 379.1 | 16.3 | 409.1 | 18.5 | 91.5 | 14 | 393 ± 9 Ma (2σ) |
| 06OH27-6C-B | 250 | 22096 | 1.9 | 18.8614 | 3.1 | 0.4521 | 8.5 | 0.0618 | 8.0 | 0.93 | 386.8 | 29.9 | 378.7 | 27.0 | 329.6 | 70.2 | 117.4 | 10 | |
| 06OH27-8R-B | 129 | 23680 | 3.4 | 18.4147 | 2.7 | 0.5187 | 4.0 | 0.0693 | 3.0 | 0.75 | 431.8 | 12.6 | 424.3 | 14.0 | 383.7 | 60.0 | 112.5 | 14 | |
| 06OH27-10C-A | 1501 | 187198 | 1.4 | 18.4976 | 0.4 | 0.4732 | 2.7 | 0.0635 | 2.7 | 0.99 | 396.7 | 10.3 | 393.4 | 8.8 | 373.6 | 8.0 | 106.2 | 14 | |
| 06OH27-14C-A | 1219 | 201214 | 1.6 | 18.4124 | 0.3 | 0.4981 | 2.5 | 0.0665 | 2.5 | 0.99 | 415.1 | 9.9 | 410.4 | 8.4 | 384.0 | 6.3 | 108.1 | 14 | |
| 06OH27-15C-A | 221 | 8480 | 2.5 | 18.8255 | 1.5 | 0.4734 | 6.3 | 0.0646 | 6.1 | 0.97 | 403.7 | 24.0 | 393.5 | 20.6 | 333.9 | 34.0 | 120.9 | 14 | |
| 06OH27-27C-A | 228 | 23109 | 2.2 | 18.7839 | 3.1 | 0.4761 | 5.6 | 0.0649 | 4.6 | 0.83 | 405.1 | 18.2 | 395.4 | 18.4 | 338.9 | 71.2 | 119.5 | 14 | |
| 06OH27-32C-A | 225 | 87293 | 2.1 | 18.4138 | 1.7 | 0.5012 | 3.5 | 0.0669 | 3.1 | 0.88 | 417.7 | 12.4 | 412.5 | 11.8 | 383.8 | 37.1 | 108.8 | 14 | |
| 06OH27-34C-A | 1449 | 126676 | 1.6 | 18.3386 | 0.4 | 0.5135 | 8.7 | 0.0683 | 8.7 | 1.00 | 425.9 | 35.7 | 420.8 | 29.9 | 393.0 | 8.8 | 108.4 | 14 | |
| 06OH27-13C-A | 1893 | 115437 | 110.5 | 19.5422 | 0.3 | 0.2681 | 6.4 | 0.0380 | 6.4 | 1.00 | 240.4 | 15.0 | 241.2 | 13.7 | 248.6 | 6.4 | 96.7 | 14 | 252 ± 22 Ma (2σ) |
| 06OH27-13C-B | 1760 | 144303 | 72.1 | 19.3618 | 0.4 | 0.3003 | 6.5 | 0.0422 | 6.4 | 1.00 | 266.3 | 16.8 | 266.6 | 15.1 | 269.8 | 9.7 | 98.7 | 14 | Metamorphic |
| 06OH27-1-A | 877 | 63928 | 2.0 | 18.4257 | 0.3 | 0.4401 | 1.1 | 0.0588 | 1.1 | 0.97 | 368.4 | 3.8 | 370.3 | 3.4 | 382.3 | 5.9 | 96.4 | 18 | No CL image |
| 06OH27-2-A | 260 | 30283 | 2.6 | 18.3666 | 1.0 | 0.4308 | 2.0 | 0.0574 | 1.8 | 0.88 | 359.7 | 6.2 | 363.7 | 6.2 | 389.5 | 21.5 | 92.3 | 18 | No CL image |
| 06OH27-3-A | 405 | 22008 | 2.0 | 18.5604 | 1.0 | 0.4223 | 4.2 | 0.0569 | 4.1 | 0.97 | 356.4 | 14.1 | 357.7 | 12.6 | 365.9 | 21.9 | 97.4 | 18 | No CL image |
| 06OH27-4-A | 2054 | 2965 | 3.3 | 10.9991 | 3.7 | 0.4119 | 5.3 | 0.0329 | 3.7 | 0.71 | 208.4 | 7.7 | 350.3 | 15.7 | 1444.8 | 71.2 | 14.4 | 18 | No CL image |
4. Results
4.1. Tavan Har Block
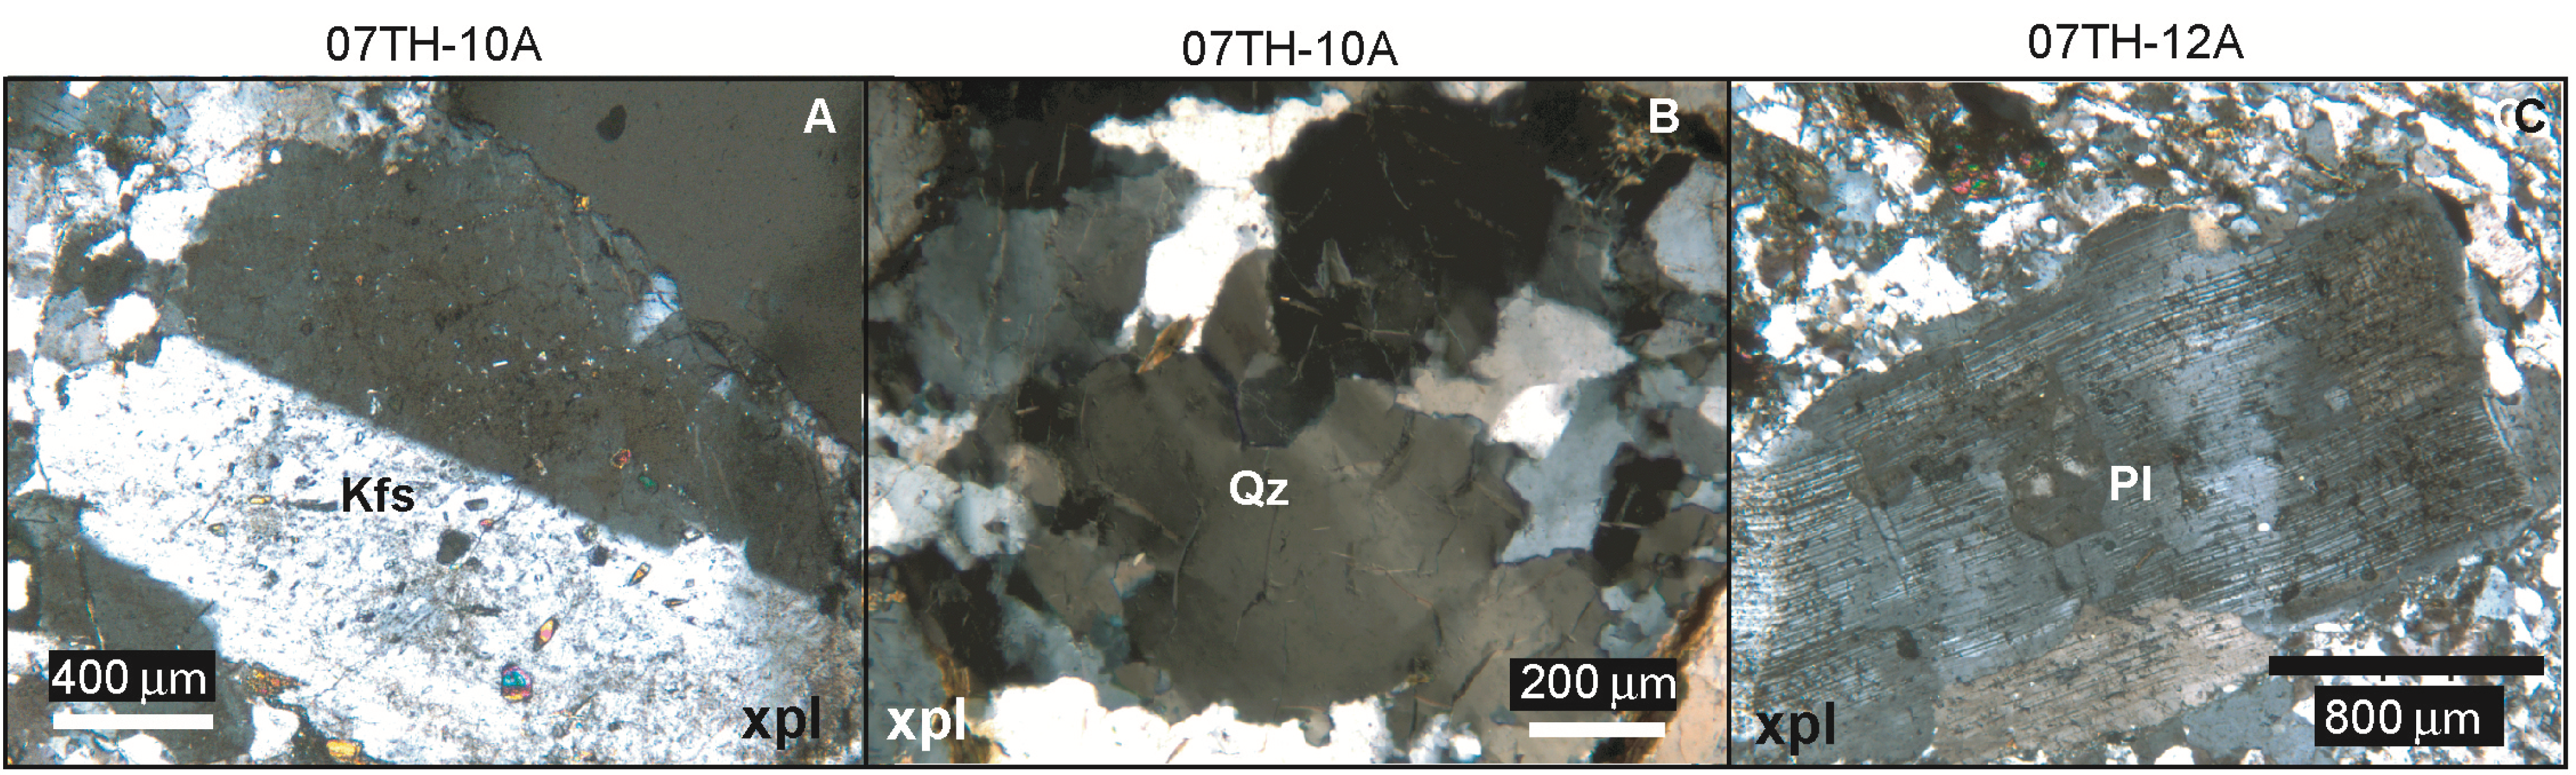
4.1.1. Sample 07TH-10A
4.1.1.1. Microstructural Analysis

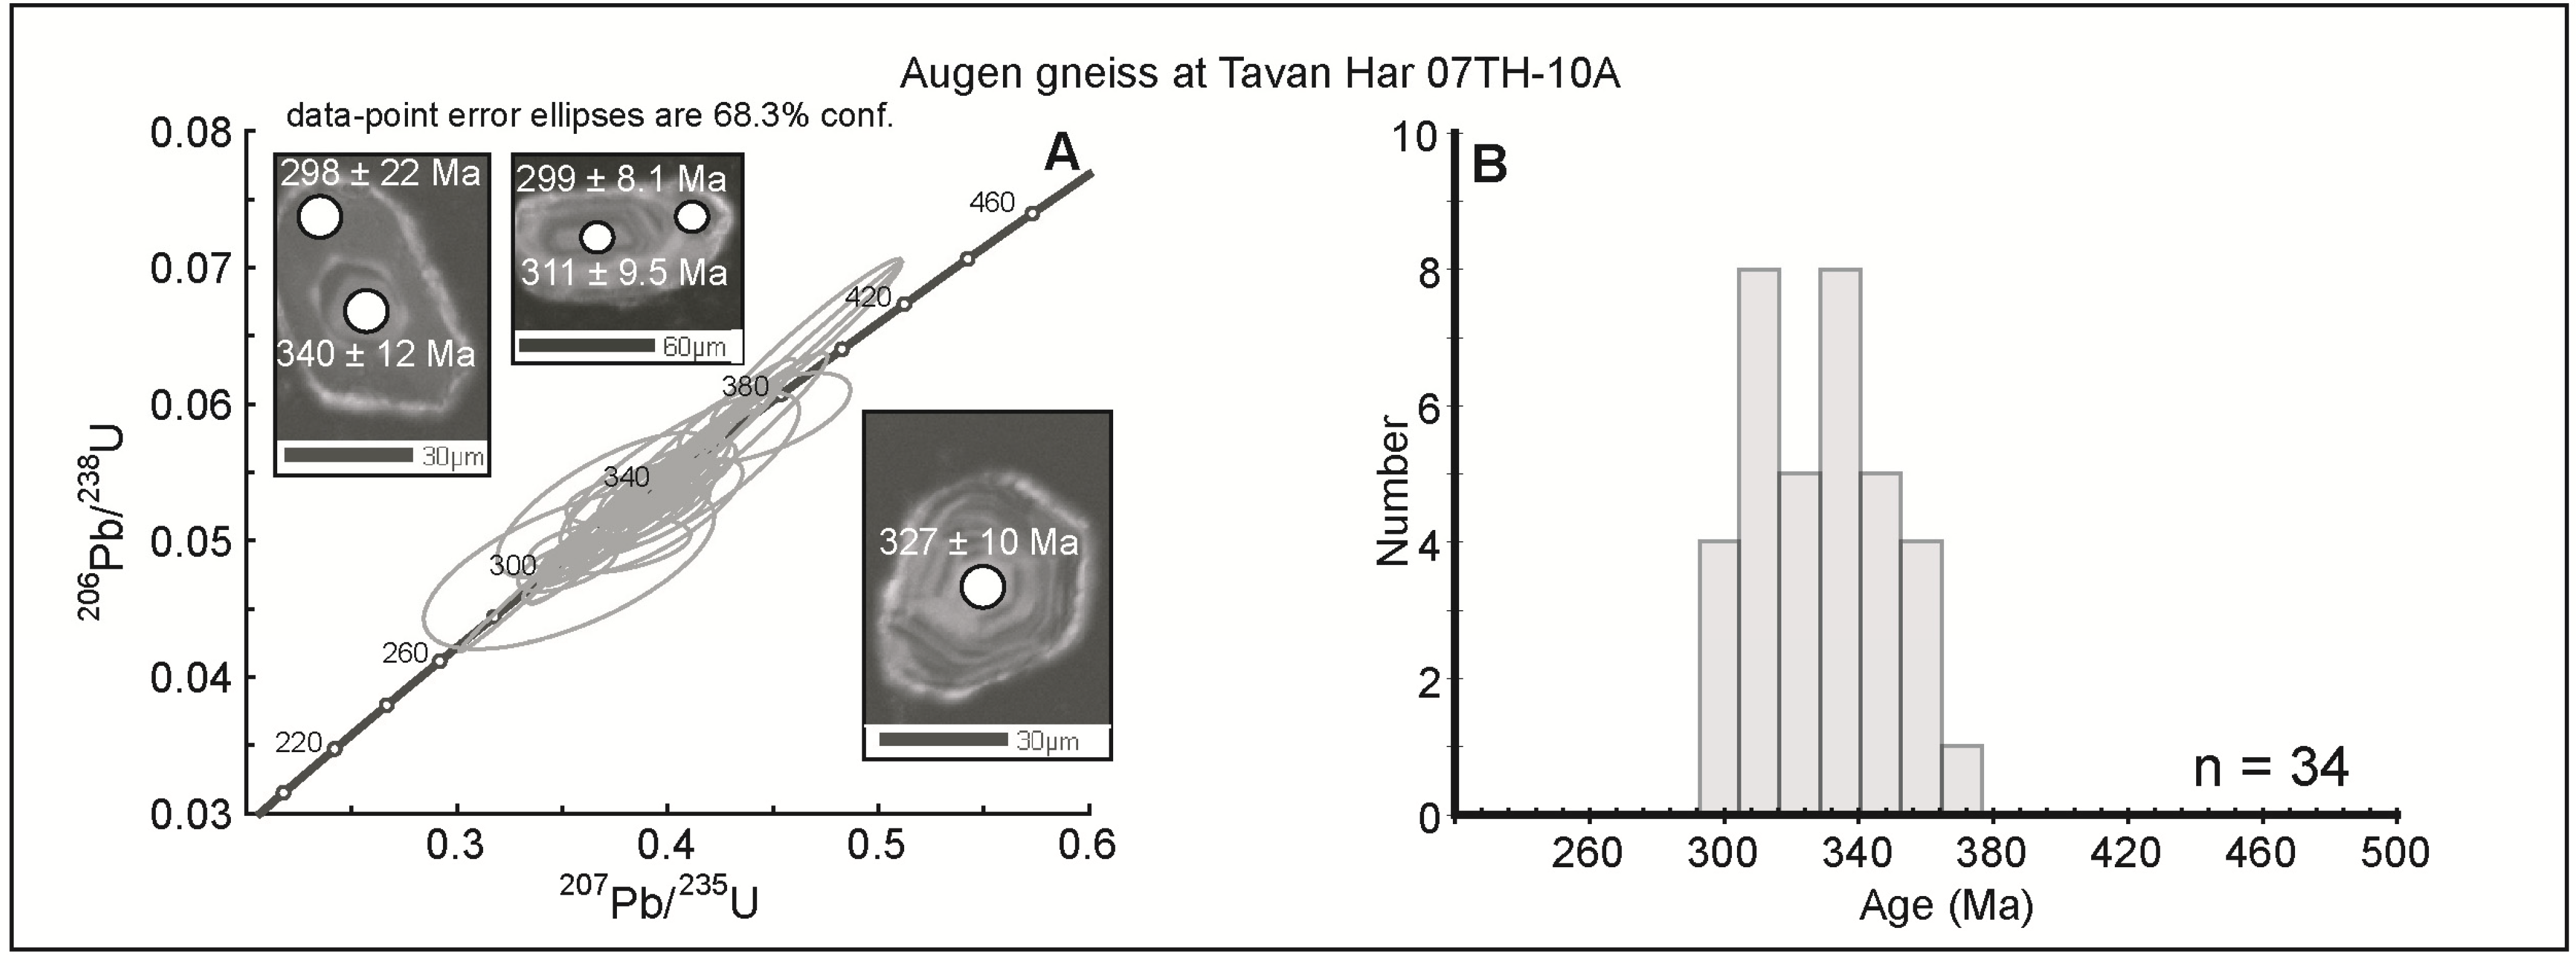
4.1.1.2. U-Pb Geochronology
4.1.1.3. Interpretation

4.1.2. Sample 07TH-12A
4.1.2.1. Microstructural Analysis
4.1.2.2. U-Pb Geochronology
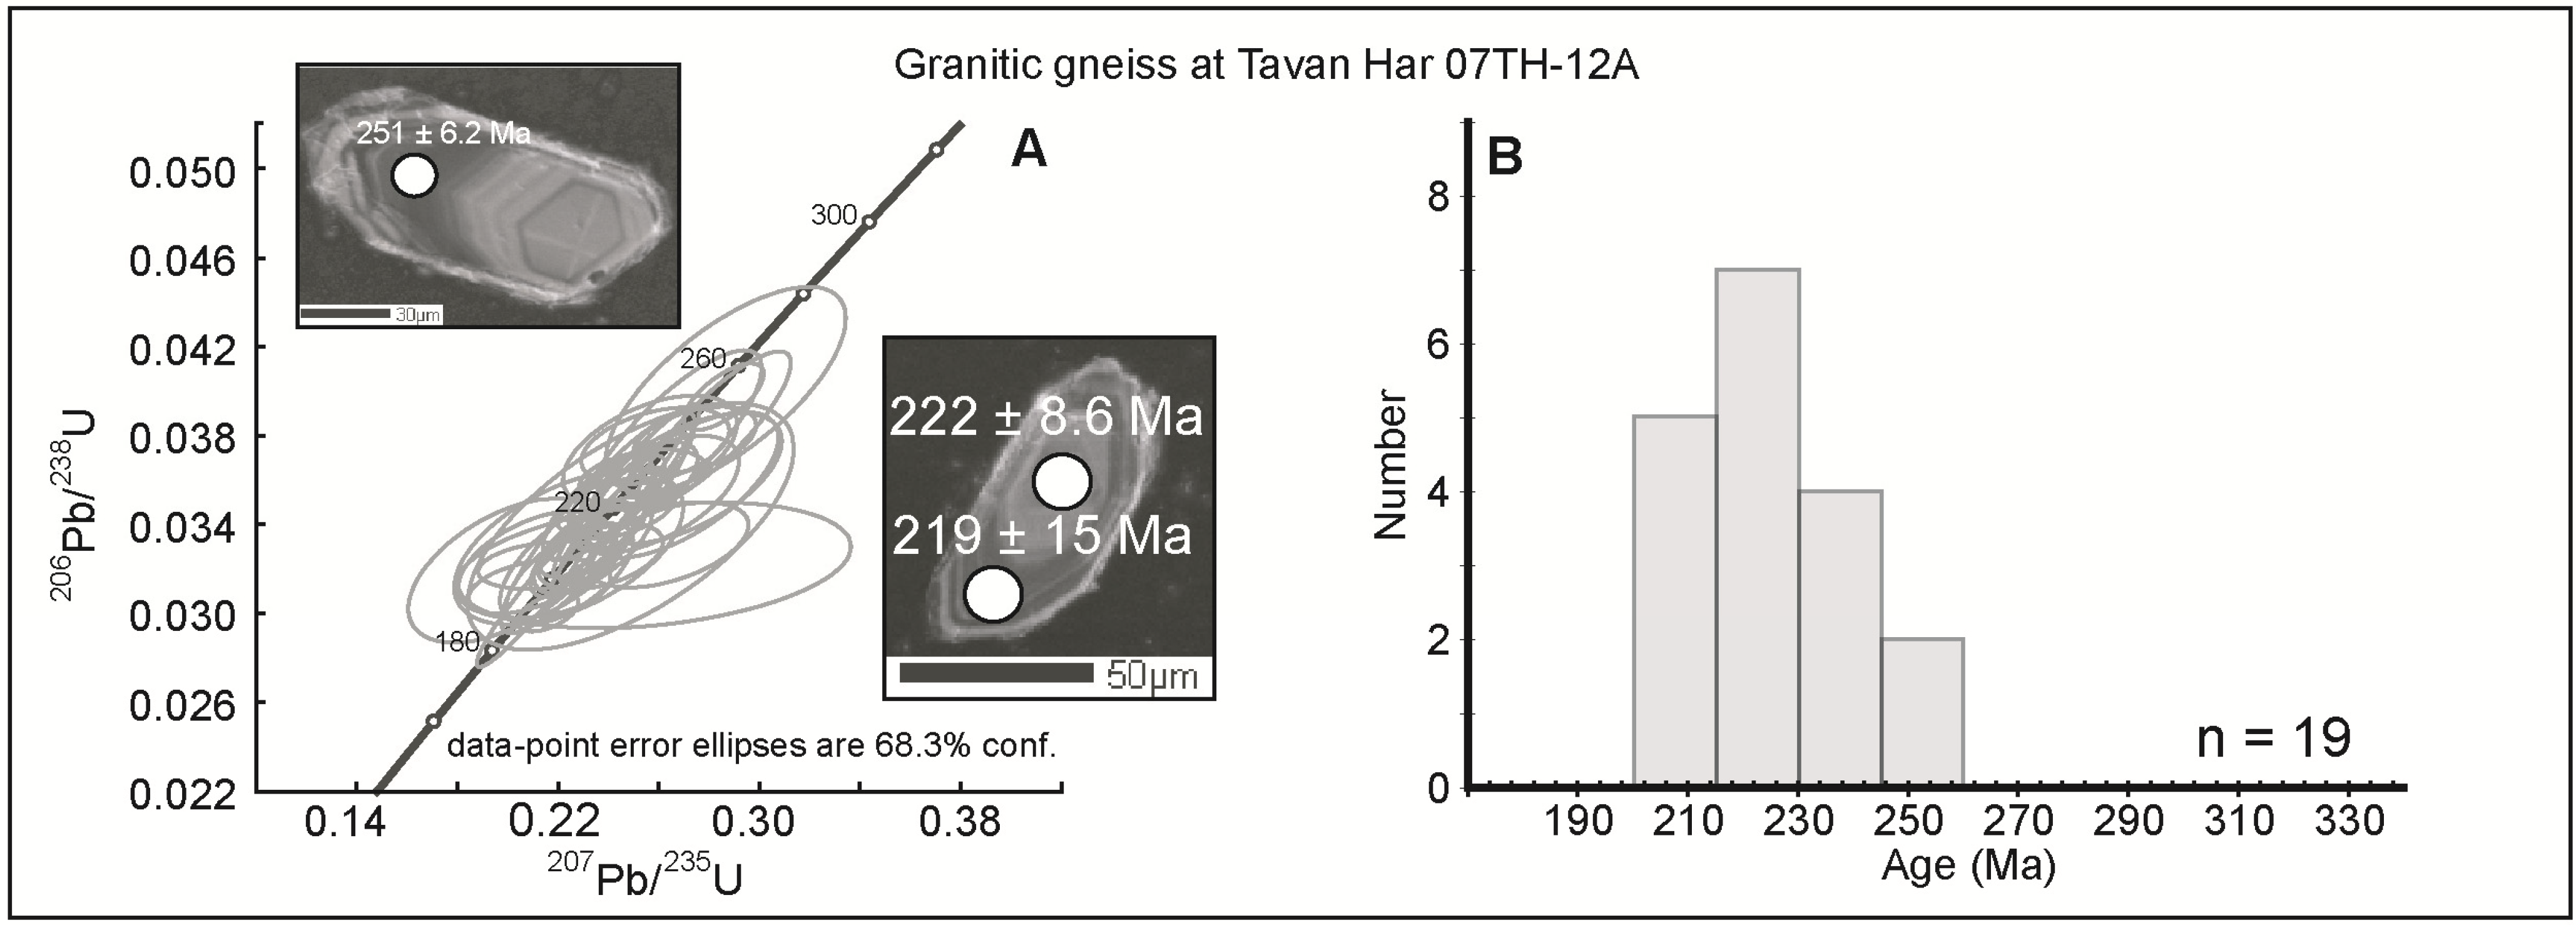
4.1.2.3. Interpretation
4.2. Yagan-Onch Hayrhan
4.2.1. Yagan-Onch Hayrhan Sample 08OH-03A
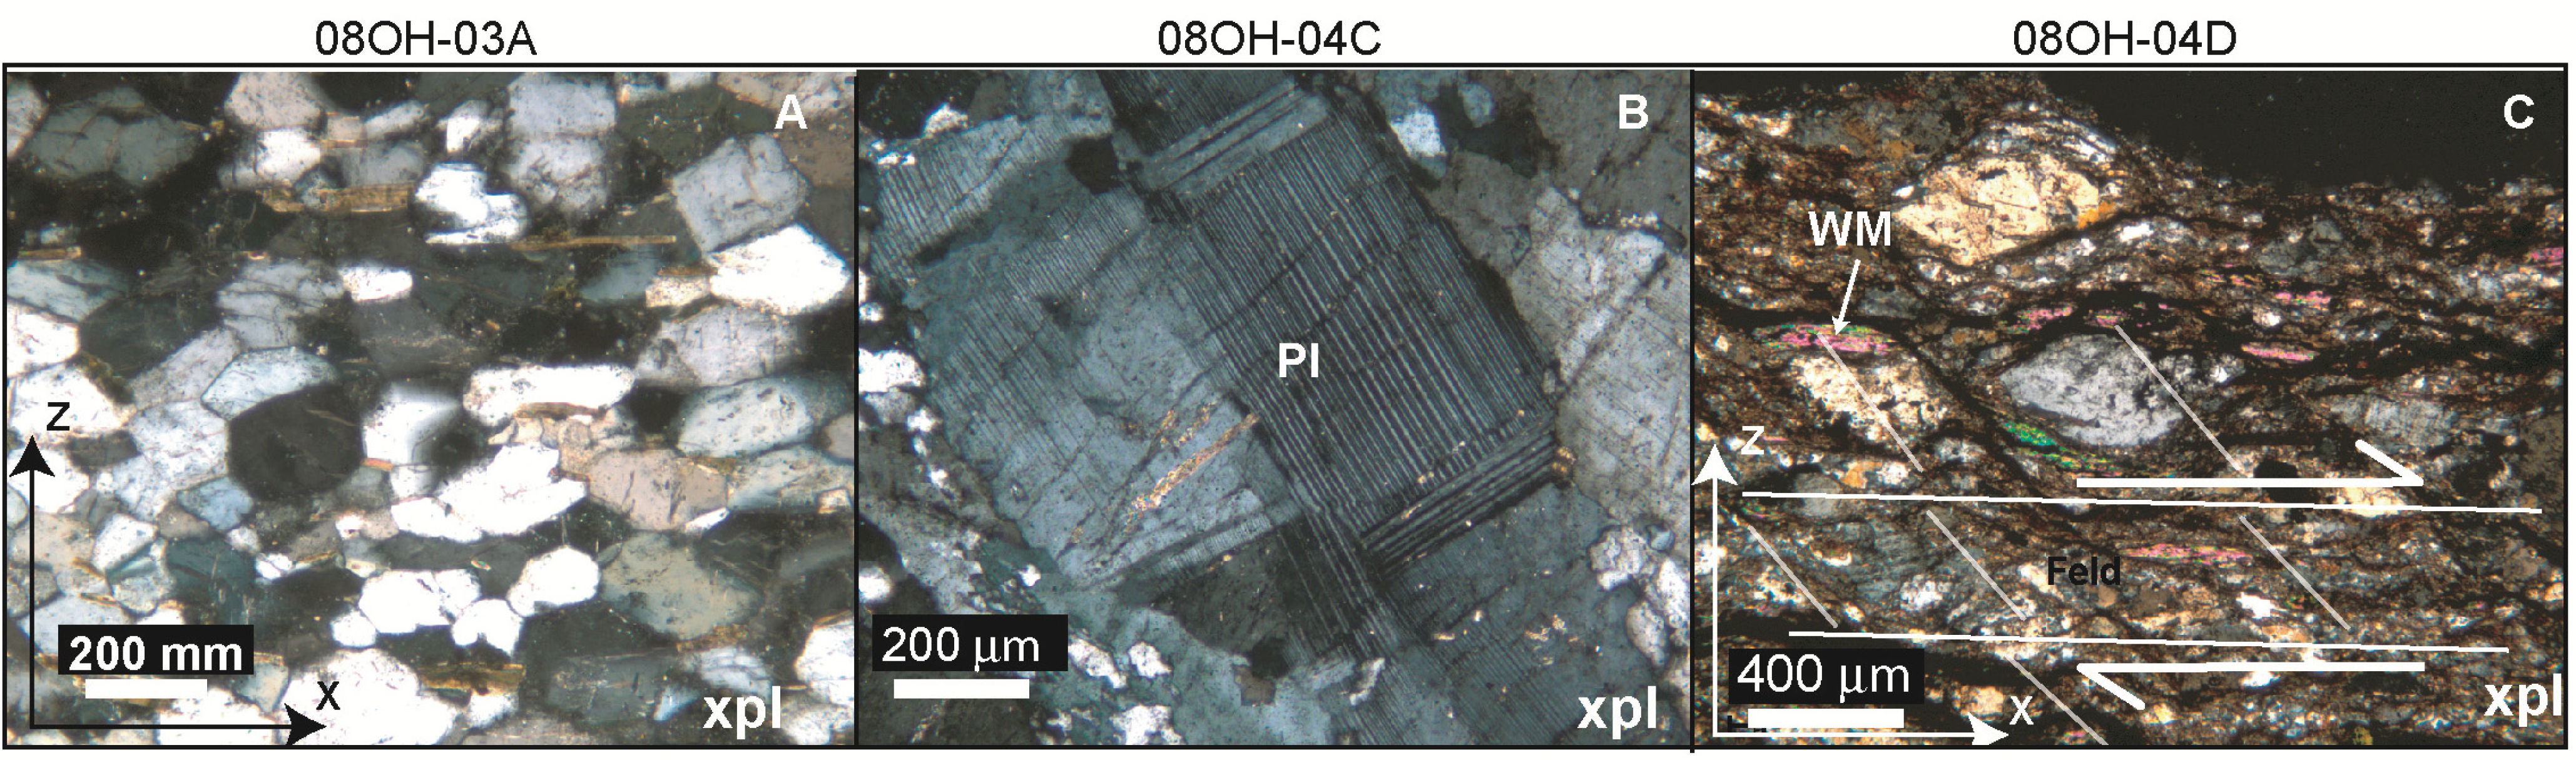
4.2.1.1. Microstructural Analysis
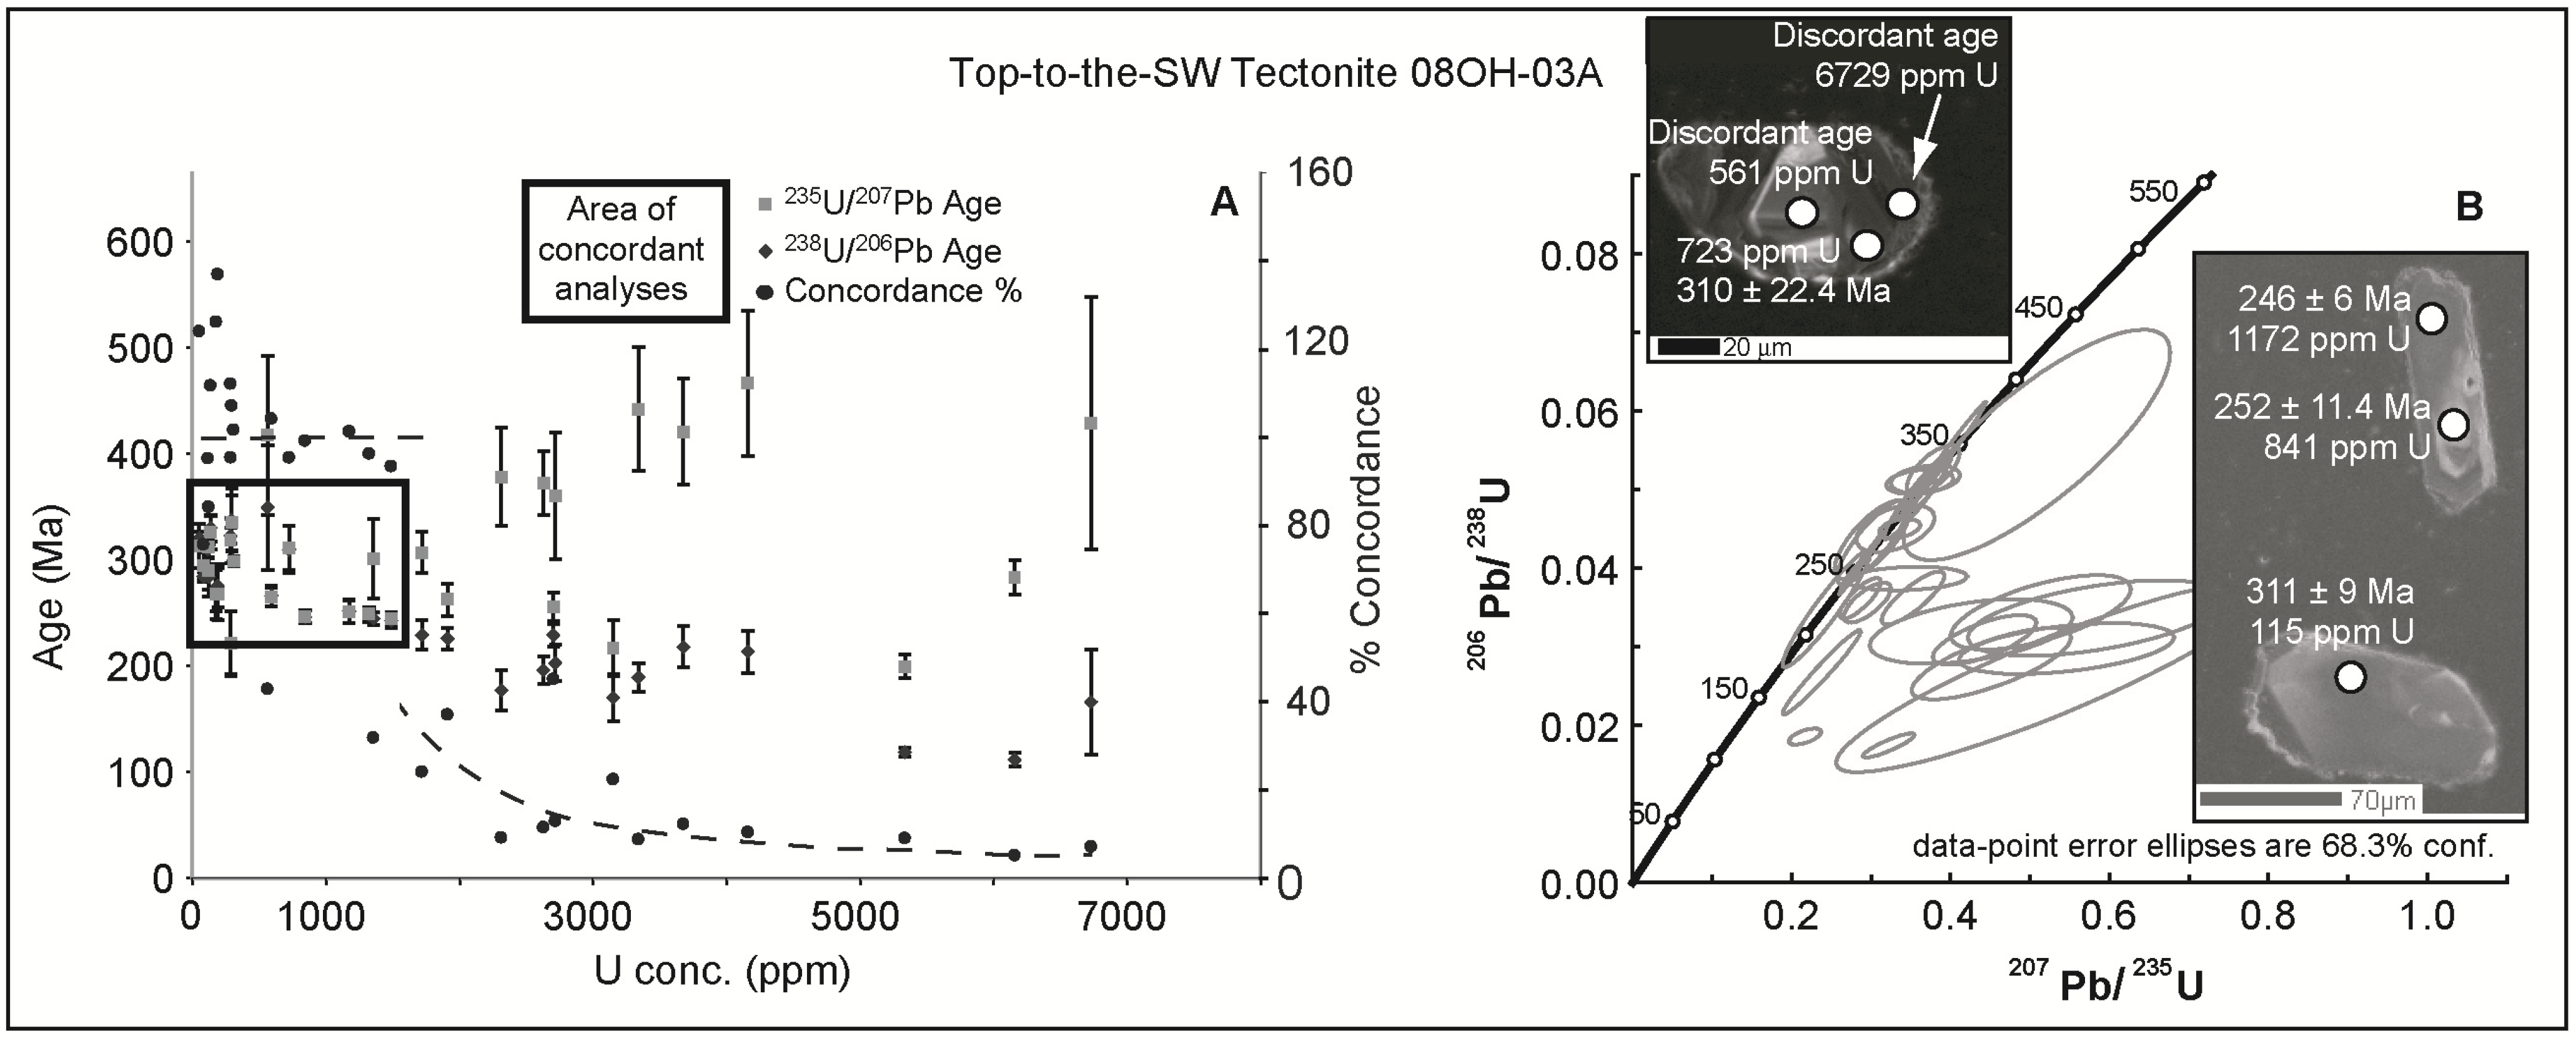
4.2.1.2. U-Pb Geochronology


4.2.1.3. Interpretation
4.2.2. Yagan-Onch Hayrhan Migmatite, Sample 08OH-04
4.2.2.1. Microstructural Analysis
4.2.2.2. U-Pb Geochronology
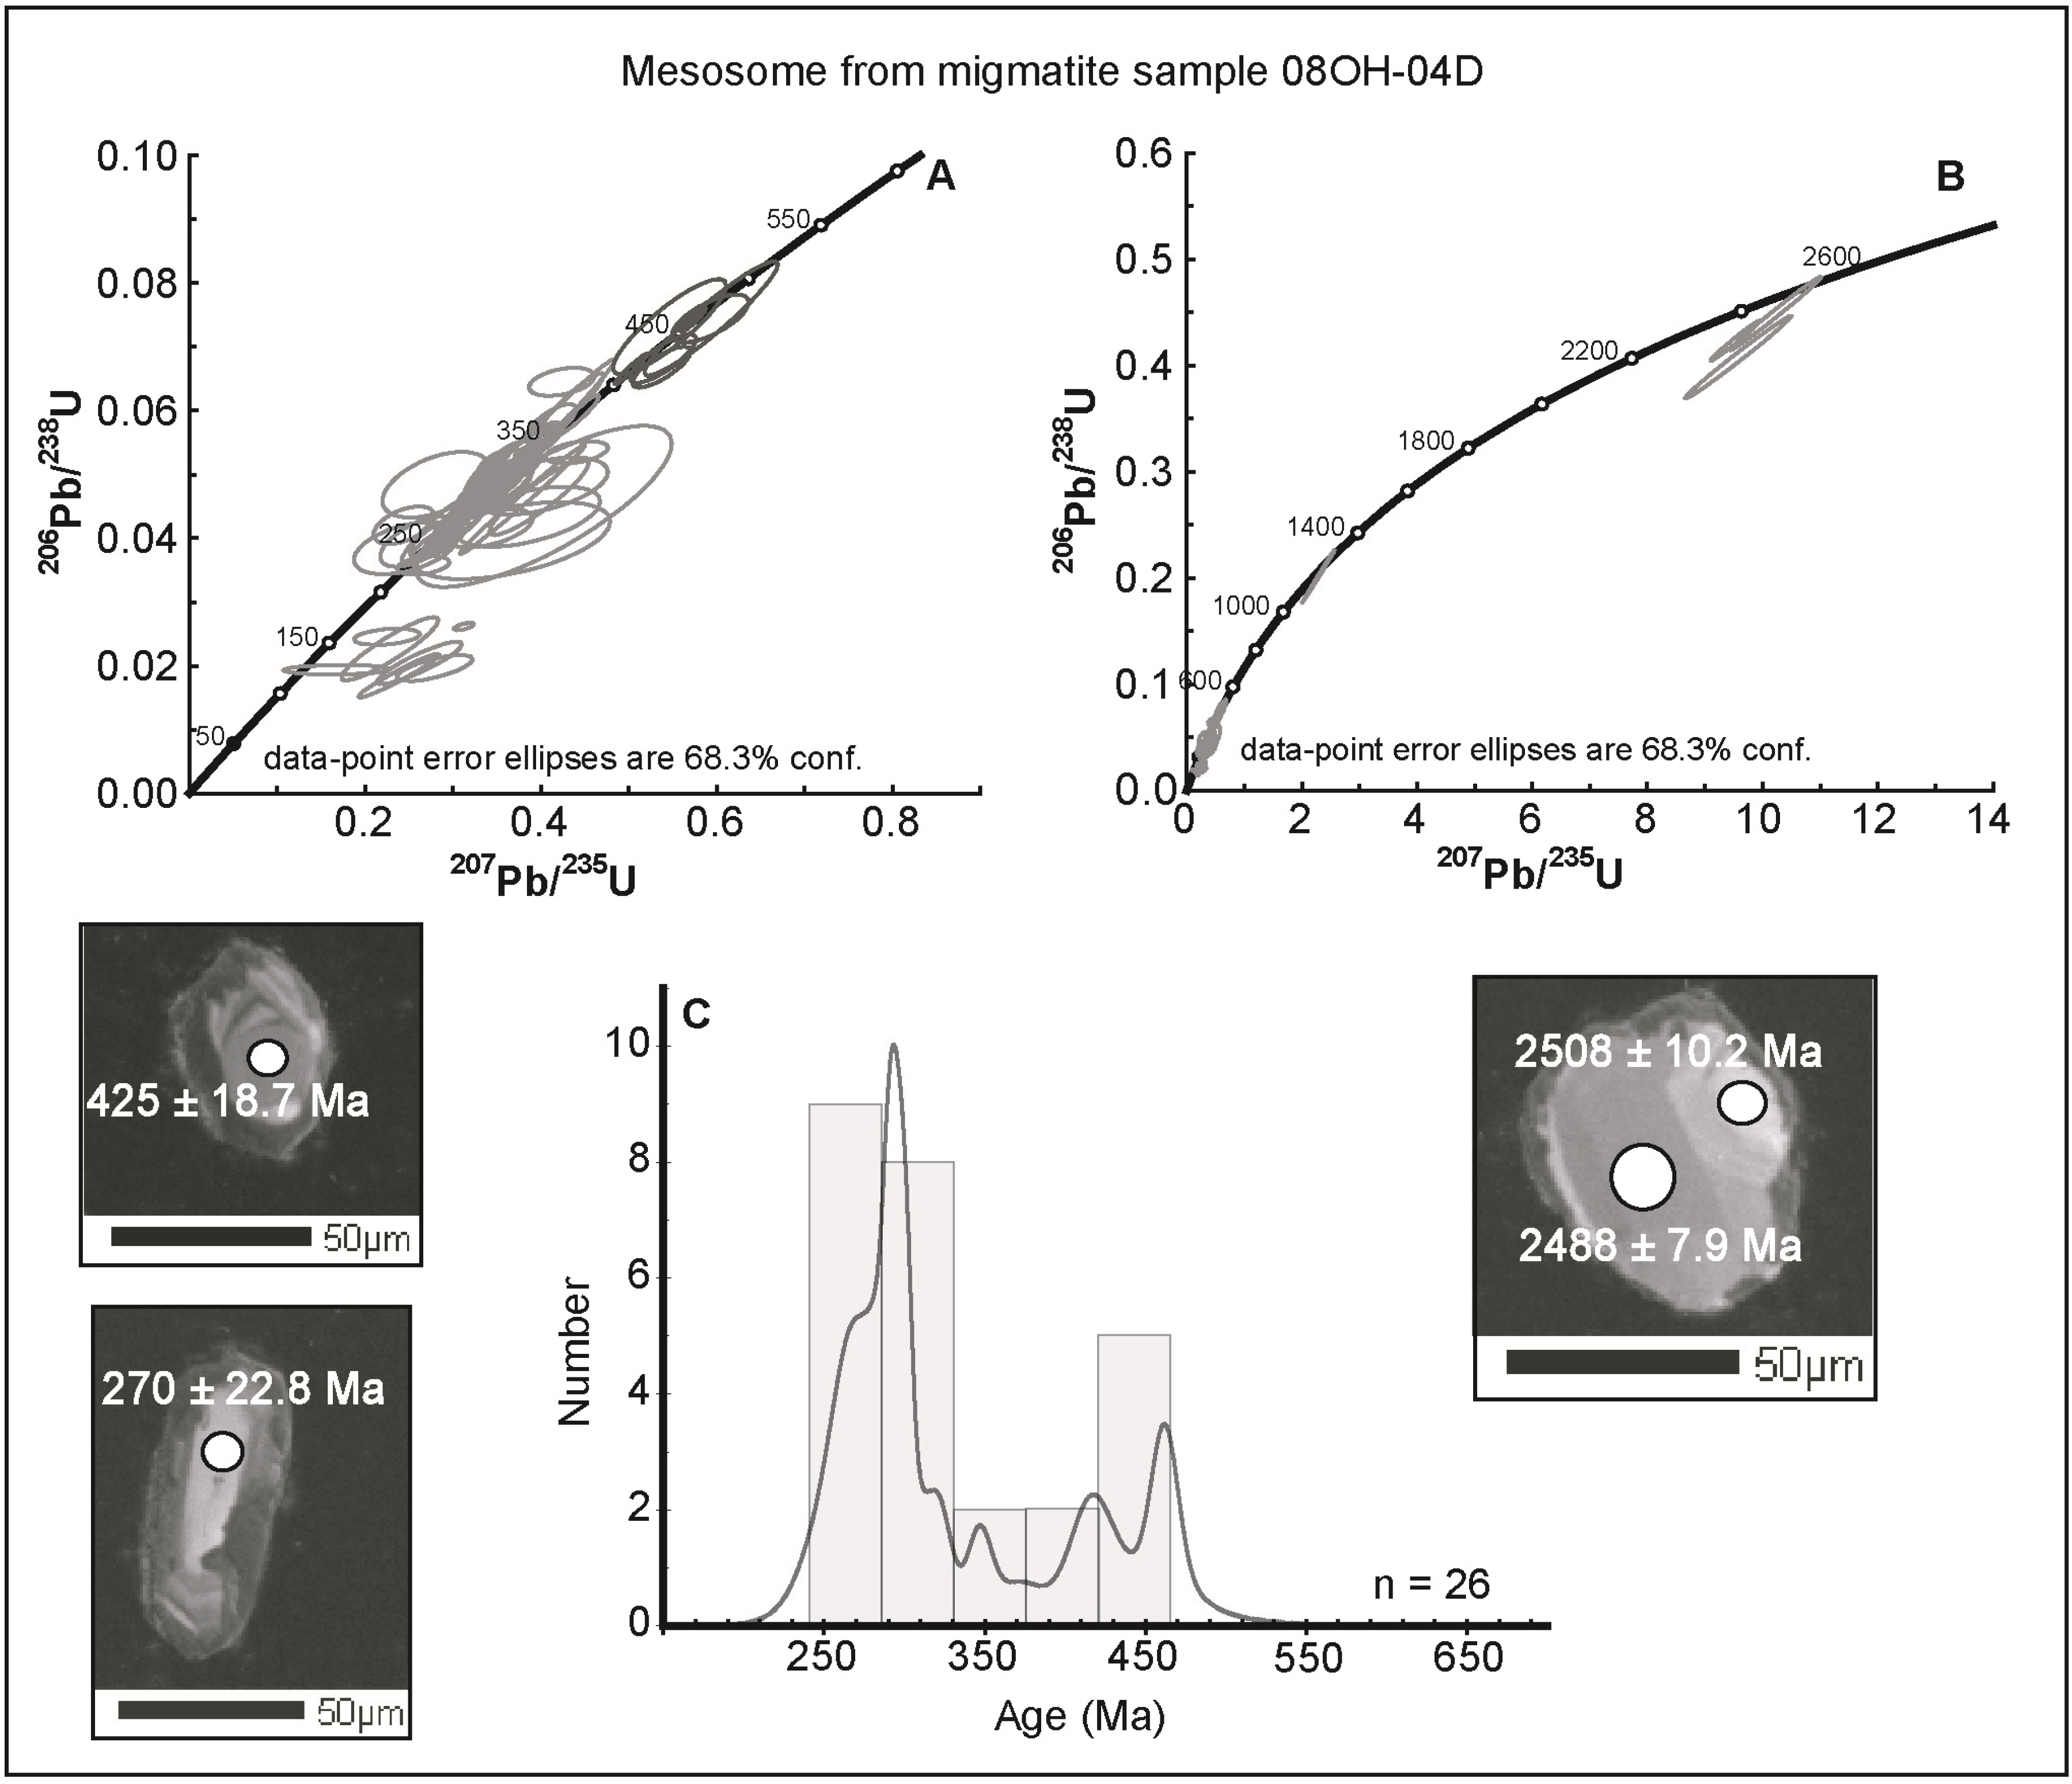
4.2.2.3. Interpretation
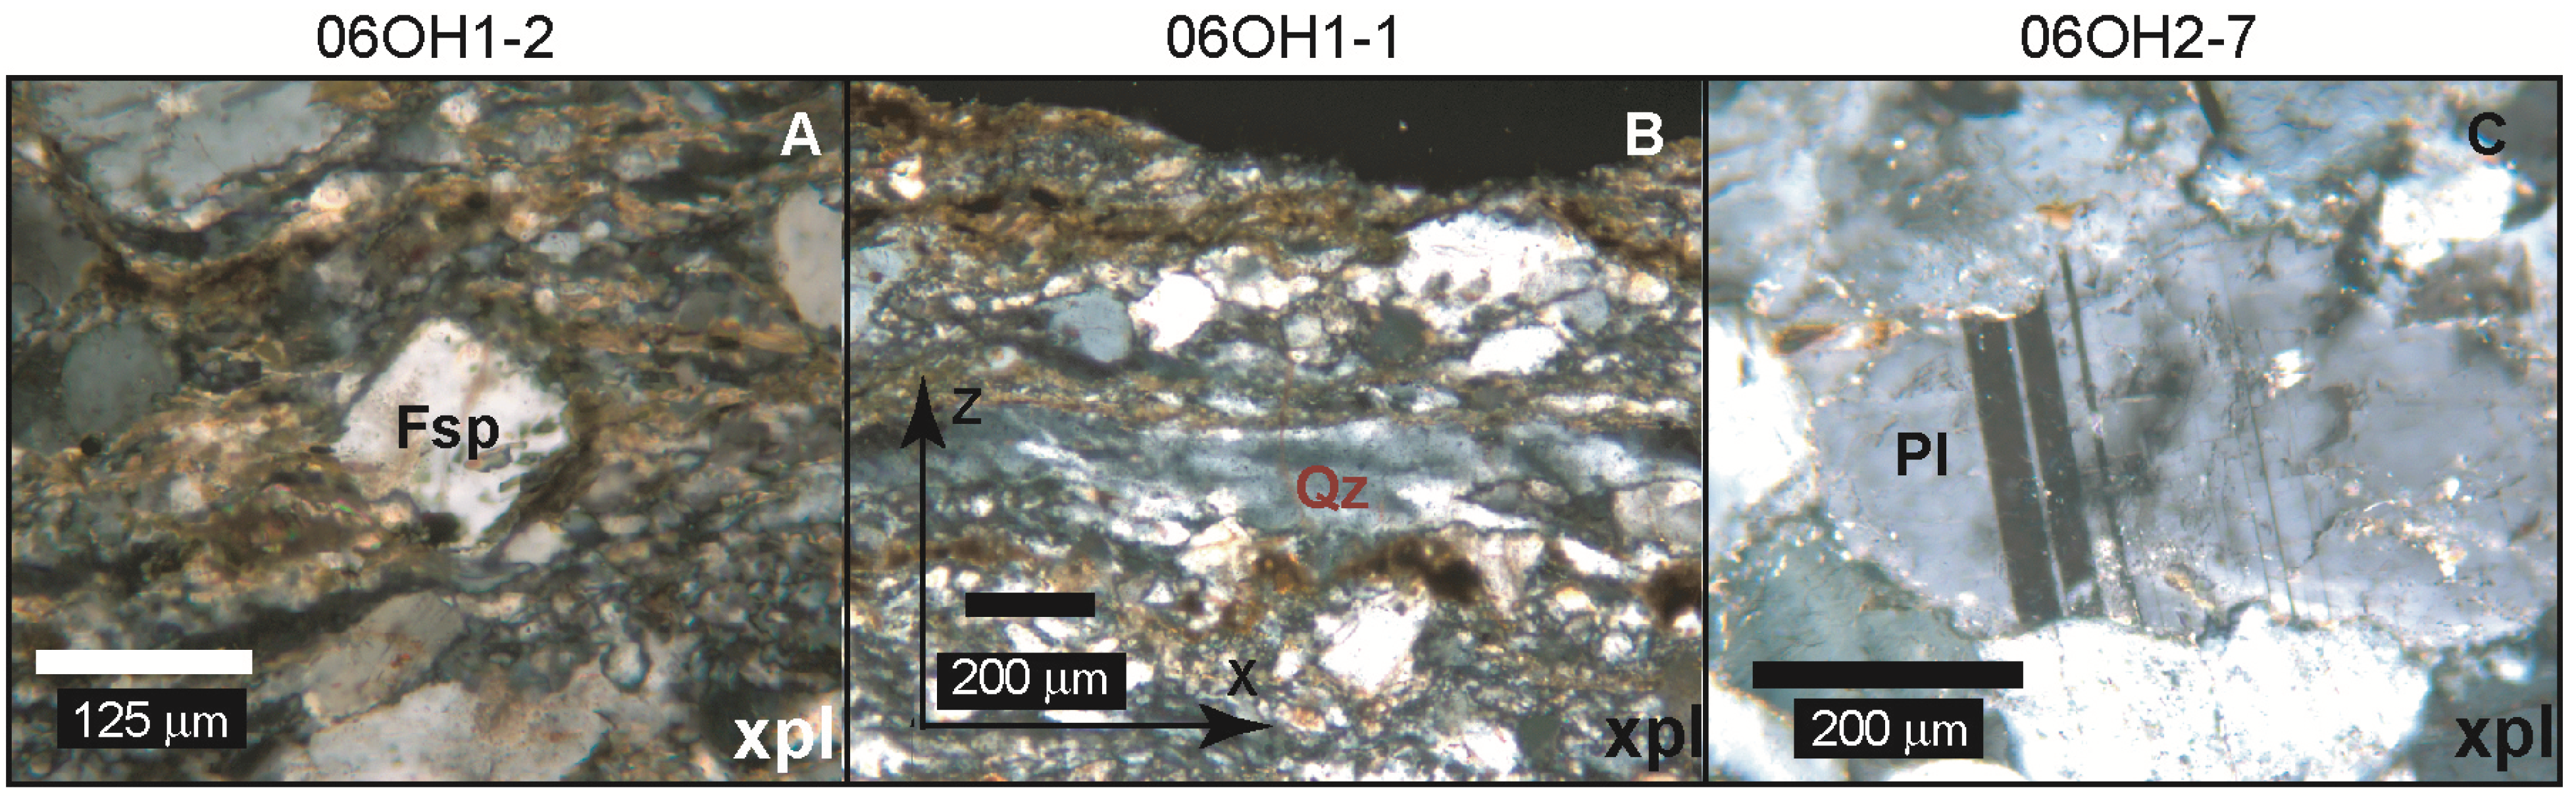
4.2.3. Sample 06OH1-2
4.2.3.1. Microstructural Analysis

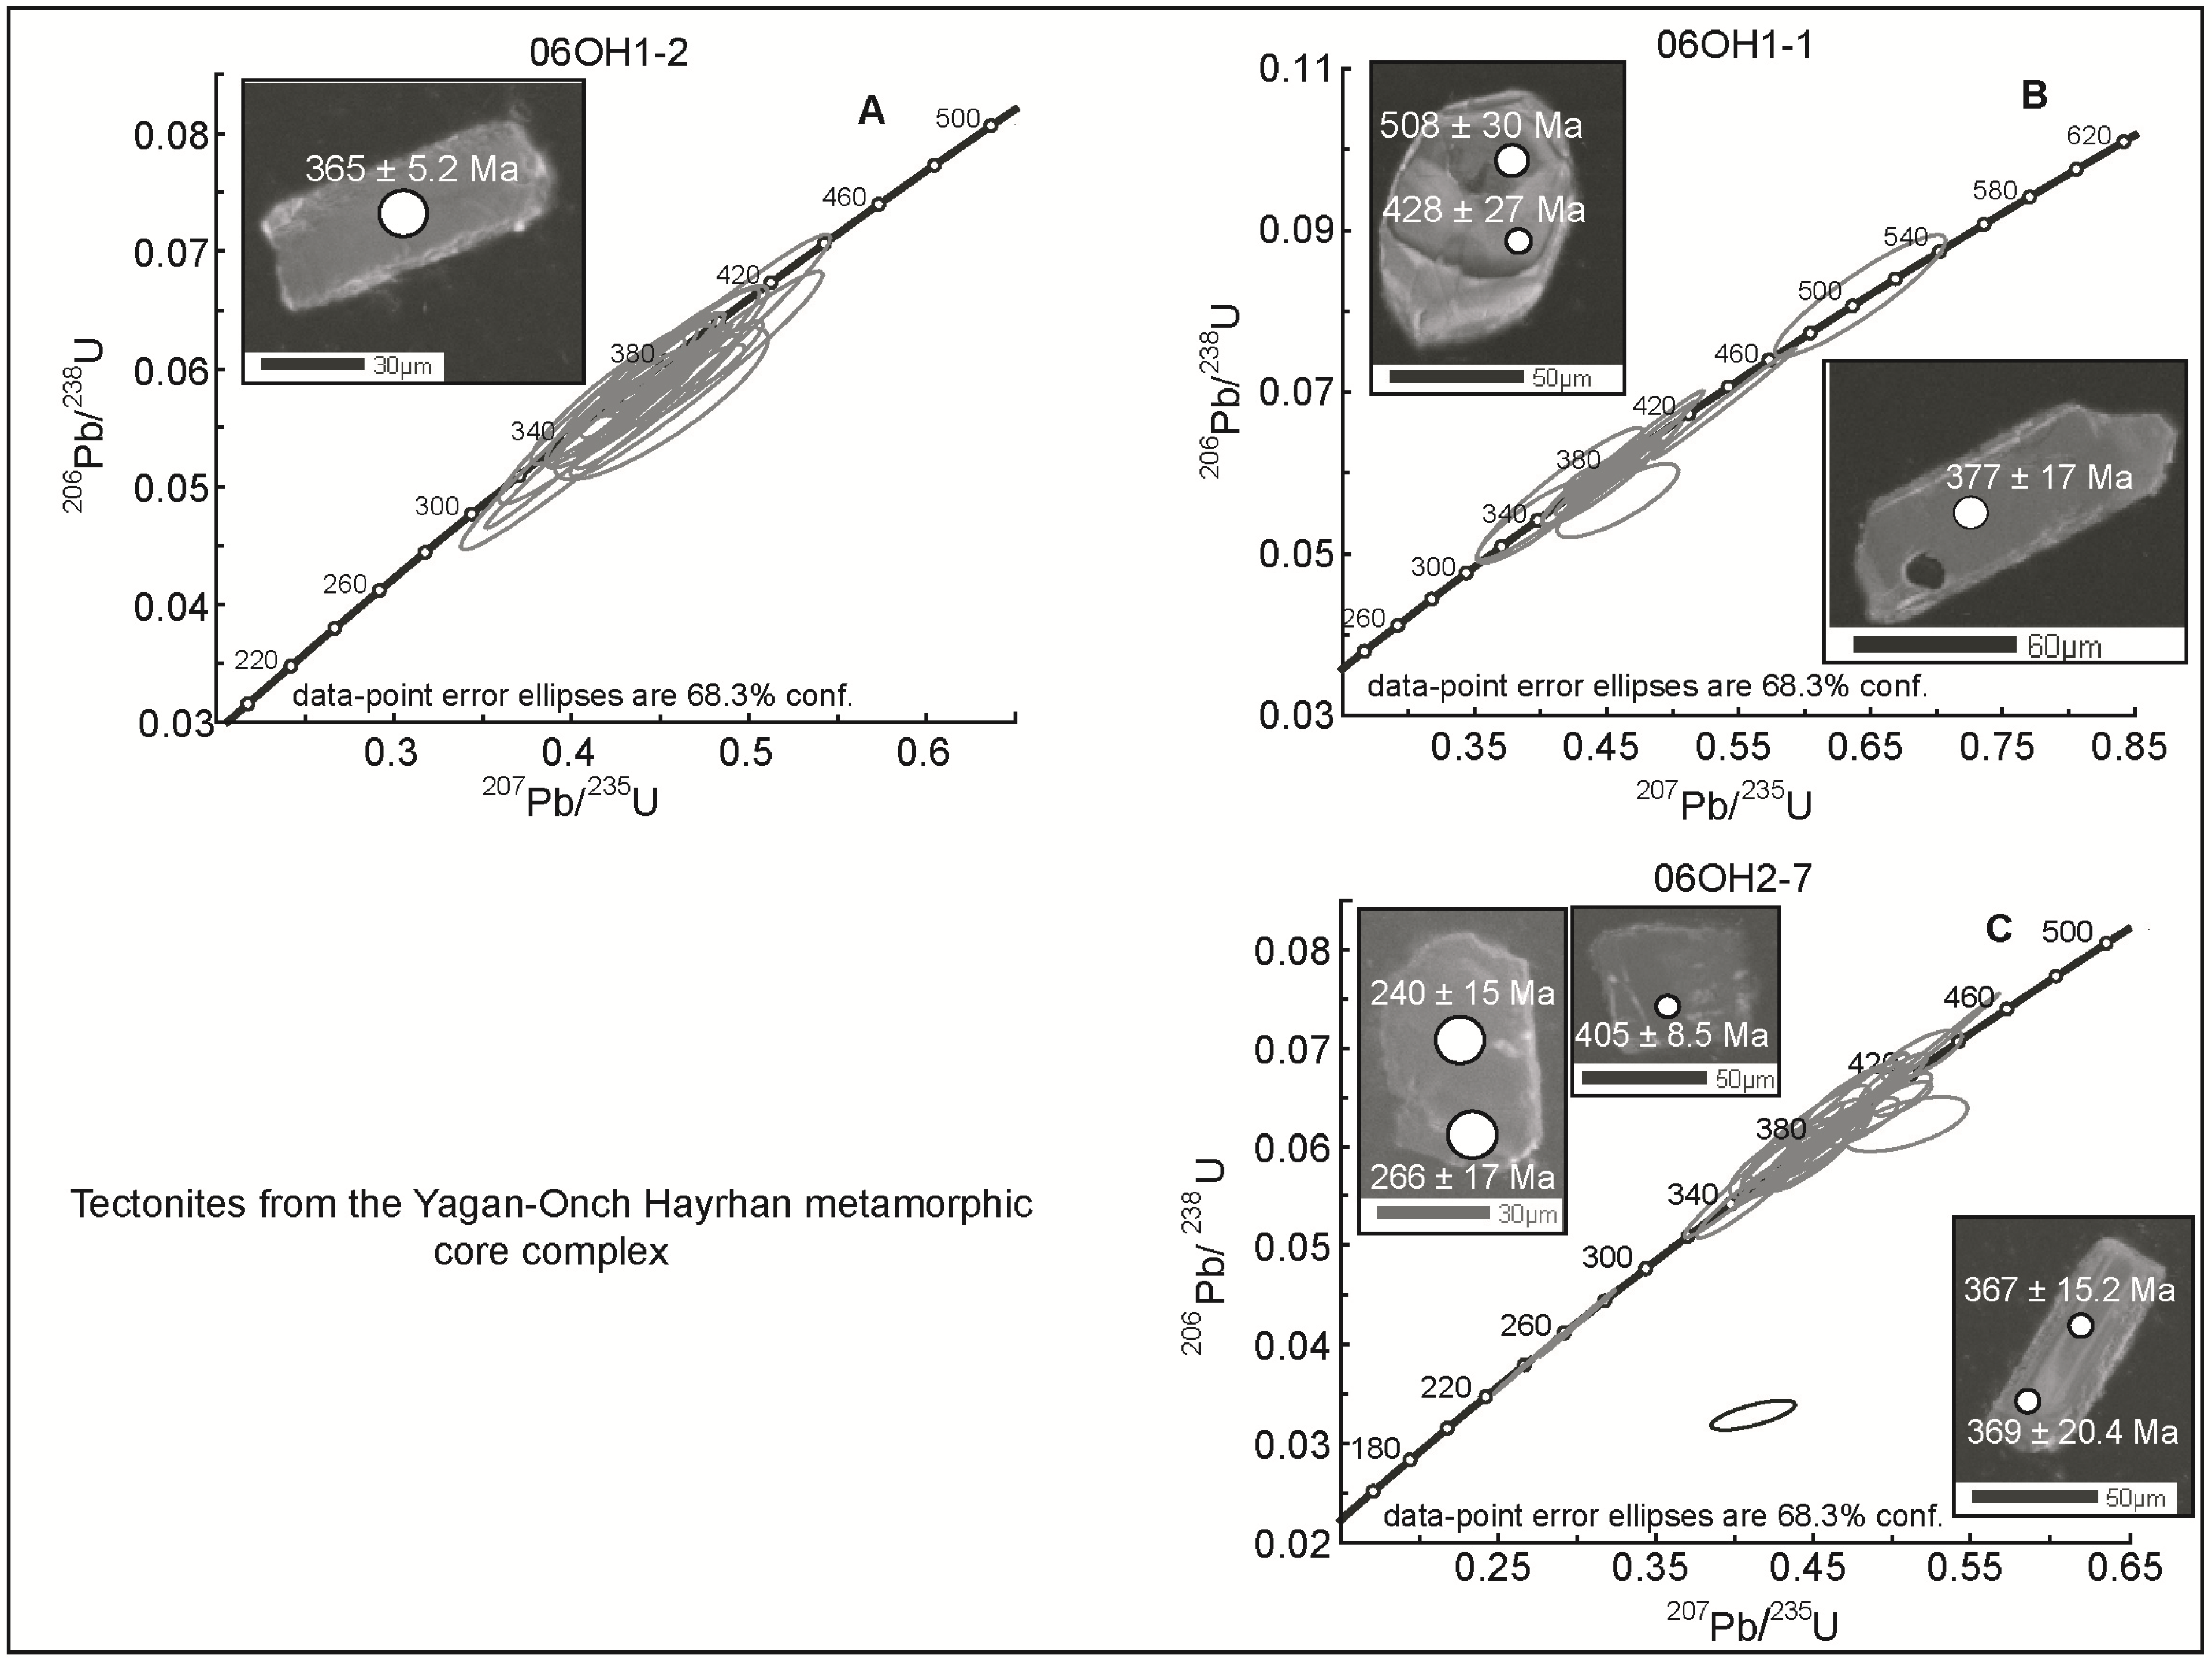
4.2.3.2. U-Pb Geochronology
4.2.3.3. Interpretation

4.2.4. Sample 06OH1-1
4.2.4.1. Microstructural Analysis
4.2.4.2. U-Pb Geochronology
4.2.4.3. Interpretation
4.2.5. Sample 06OH2-7
4.2.5.1. Microstructural Analysis
4.2.5.2. U-Pb Geochronology
4.2.5.3. Interpretation
5. Tectonic Significance and Implications for the Existence of Precambrian Basement
5.1. Devonian Protoliths
5.2. Carboniferous Protolith
5.3. Permian–Triassic Protoliths

6. Tectonic Implications and Summary
Acknowledgments
Conflicts of Interest
References
- Xiao, W.; Windley, B.; Hao, J.; Zhai, M. Accretion leading to collision and the Permian Solonker suture, Inner Mongolia, China: Termination of the central Asian orogenic belt. Tectonics 2003, 22, 1069:1–1069:20. [Google Scholar]
- Windley, B.; Alexeiev, D.; Xiao, W.; Kröner, A.; Badarch, G. Tectonic models for accretion of the Central Asian Orogenic Belt. J. Geol. Soc. 2007, 164, 31–47. [Google Scholar] [CrossRef]
- Şengör, A.; Natal’in, B.; Burtman, V. Evolution of the Altaid tectonic collage and Paleozoic crustal growth in Eurasia. Nature 1993, 264, 299–307. [Google Scholar]
- Şengör, A.; Natal’in, B. Paleotectonics of Asia: Fragments of a Synthesis. In The Tectonic Evolution of Asia; Cambridge Universty Press: Cambridge, UK, 1996; pp. 486–640. [Google Scholar]
- Helo, C.; Hegner, E.; Kröner, A.; Badarch, G.; Tomurtogoo, O.; Windley, B.; Dulski, P. Geochemical signature of Paleozoic accretionary complexes of the Central Asian Orogenic Belt in South Mongolia: Constraints on arc environments and crustal growth. Chem. Geol. 2006, 227, 236–257. [Google Scholar] [CrossRef]
- Badarch, G.; Cunningham, W.; Windley, B. A new terrane subdivision for Mongolia: Implications for the Phanerozoic crustal growth of Central Asia. J. Asian Earth Sci. 2002, 21, 87–110. [Google Scholar] [CrossRef]
- Demoux, A.; Kröner, A.; Liu, D.; Badarch, G. Precambrian crystalline basement in southern Mongolia as revealed by SHRIMP zircon dating. Int. J. Earth Sci. 2009, 98, 1365–1380. [Google Scholar]
- Salnikova, E.; Kozakov, I.; Kotov, A.; Kröner, A.; Todt, W.; Bibikova, E.; Nutman, A.; Yakovleva, S.; Kovack, V. Age of Palaeozoic granites and metamorphism in the Tuvino-Mongolian Massif of the Central Asian Mobile Belt: Loss of a Precambrian microcontinent. Precambrian Res. 2001, 110, 143–154. [Google Scholar] [CrossRef]
- Wang, T.; Zheng, Y.; Gehrels, G.; Mu, Z. Geochronological evidence for existence of South Mongolian microcontinent—A zircon U-Pb age of granitoid gneisses from the Yagan-Onch Hayrhan metamorphic core complex. Chin. Sci. Bull. 2001, 46, 2005–2008. [Google Scholar] [CrossRef]
- Yarmolyuk, V.; Kovalenko, V.; Sal’nikova, E.; Kozakov, I.; Kotov, A.; Kovach, V.; Vladykin, N.; Yakovleva, S. U-Pb age of syn- and post-metamorphic granitoids of South Mongolia: Evidence for the presence of Grenvillides in the Central Asia Fold belt. Dokl. Earth Sci. 2005, 404, 986–990. [Google Scholar]
- Peltzer, G.; Tapponnier, P. Formation and evolution of strike-slip faults, rifts, and basins during the India–Asia collision: An experimental approach. J. Geophys. Res. 1988, 93, 15085–15117. [Google Scholar] [CrossRef]
- Houseman, G.; England, P. Crustal Thickening versus Lateral Expulsion in the Indian–Asian Continental Collision; Yin, A., Harrison, M., Eds.; Cambridge Universty Press: Cambridge, UK, 1996; pp. 3–17. [Google Scholar]
- Yin, A.; Harrison, M. Geologic evolution of the Himalayan-Tibetan Orogen. Annu. Rev. Earth Planet. Sci. 2000, 28, 211–279. [Google Scholar] [CrossRef]
- Cunningham, W. Active intracontinental transpressional mountain building in the Mongolian Altai: Defining a new class of orogen. Earth Planet. Sci. Lett. 2005, 240, 436–444. [Google Scholar] [CrossRef]
- De Grave, J.; Buslov, M.; van den Haute, P. Distant effects of India–Eurasia convergence and Mesozoic intracontinental deformation in Central Asia: Constraints from apatite fission-track thermochronology. J. Asian Earth Sci. 2007, 29, 188–204. [Google Scholar] [CrossRef]
- Cunningham, W.D. Tectonic Setting and Structural Evolution of the Late Cenozoic Gobi Altai Orogen. In The Evolving Continents: Understanding Processes of Continental Growth; Special Publication 338; Kusky, T.M., Zhai, M.G., Xiao, W., Eds.; The Geological Society of London: London, UK, 2010; pp. 361–387. [Google Scholar]
- Demoux, A.; Kröner, A.; Badarch, G.; Jian, P.; Tomurhuu, D.; Wingate, T. Zircon ages from the Baydrag Block and the Bayankhongor ophiolite zone: Time constraints on Late Neoproterozoic to Cambrian subduction- and accretion-related magmatism in Central Mongolia. J. Geol. 2009, 117, 377–397. [Google Scholar] [CrossRef]
- Yanshin, A. Map of Geological Formations of the Mongolian People’s Republic; Academia Nauka: Moscow, USSR, 1989; Scale 1:1,500,000. [Google Scholar]
- Tomurtogoo, O. General Map of Mongolia; General Directorate of Mineral Research and Exploration: Ankara, Turkey, 1999; Scale 1:1,500,000. [Google Scholar]
- Dorjnamjaa, D.; Badarch, G.; Orolmaa, D. The Geodynamic Evolution of the Mobile Fold Belts of the Territory of Mongolia. In Reconstruction of the Paleo-Asian Ocean, Proceedings of the 29th International Geological Congress, Kyoto, Japan, 24 August–3 September 2012; Part B. pp. 71–84.
- Kovalenko, V.; Yarmolyuk, V.; Kovack, V.; Kotov, A.; Kozakov, I.; Salnikoval, E.; Larin, A. Isotope provinces, mechanisms of generation and sources of the continental crust in the Central Asian mobile belt: Geological and isotopic evidence. J. Asian Earth Sci. 2004, 23, 605–627. [Google Scholar] [CrossRef]
- Yarmolyuk, V.; Kovach, V.; Kovalenko, V.; Terent’eva, L.; Kozakov, I.; Kotov, A.; Eenjin, G. Isotopic composition of the Hercynian crust of southern Mongolia: Substrantiation of the Hercynian Juvenile crust-forming event. Dokl. Earth Sci. 2007, 417, 1178–1182. [Google Scholar] [CrossRef]
- Yarmolyuk, V.; Kovalenko, V.; Sal’nikova, E.; Kovach, V.; Kozlovsky, A.; Kotov, A.; Lebedev, V. Geochronology of igneous rocks and formation of the Late Paleozoic South Mongolian active margin of the Siberian Continent. Stratigr. Geol. Correl. 2008, 16, 162–181. [Google Scholar] [CrossRef]
- Lamb, M.; Hanson, A.; Graham, S.; Badarch, G.; Webb, L. Left-lateral sense of offset of Upper Proterozoic to Paleozoic features across the Gobi Onon, Tost, and Suunbayan faults in southern Mongolia and implications for other central Asian faults. Earth Planet. Sci. Lett. 1999, 173, 183–194. [Google Scholar] [CrossRef]
- Webb, L.; Graham, S.; Johnson, C.; Badarch, M. Occurrence, age, and implications of the Yagan-Onch Hayrhan metamorphic core complex, southern Mongolia. Geology 1999, 27, 143–146. [Google Scholar] [CrossRef]
- Webb, L.E.; Johnson, C.L.; Minjin, C. Late Triassic sinistral shear in the East Gobi Fault Zone, Mongolia. Tectonophysics 2010, 495, 246–255. [Google Scholar] [CrossRef]
- Zheng, Y.; Zhang, Q.; Wang, Y.; Lui, R.; Wang, S.; Zuo, G.; Wang, S.; Lkaasuren, B.; Badarch, G.; Badamgarav, Z. Great Jurassic thrust sheets in Beishan (North Mountains)—Gobi areas of China and southern Mongolia. J. Struct. Geol. 1996, 18, 1111–1126. [Google Scholar] [CrossRef]
- Webb, L.; Johnson, C. Tertiary strike-slip faulting in southeastern Mongolia and implications for Asian tectonics. Earth Planet. Sci. Lett. 2006, 241, 323–363. [Google Scholar] [CrossRef]
- Johnson, C.L.; Webb, L.; Graham, S.; Hendrix, M.; Badarch, G. Sedimentary and structural records of late Mesozoic high-strain extension and strain partitioning, East Gobi basin, southern Mongolia. GSA Mem. 2001, 194, 413–433. [Google Scholar]
- Heumann, M.; Johnson, C.; Webb, L.; Taylor, J. Mesozoic-Cenozoic reconstruction of the East Gobi Fault Zone, Southeastern Mongolia. In Proceedings of 2009 American Geophysical Union Fall Meeting, San Francisco, CA, USA, 14–18 December 2009. abstract #T41E-05.
- Heumann, M. Paleozoic-Cenozoic Evolution of the East Gobi Fault Zone, Southern Mongolia: A Protracted Record of Intracontinental Deformation and Basin Evolution, with Implications for Tectonics in Eurasia. Ph.D. Thesis, University of Utah, Salt Lake City, UT, USA, 8 October 2010. [Google Scholar]
- Johnson, C. Polyphase evolution of the East Gobi basin: Sedimentary and structural records of Mesozoic-Cenozoic intraplate deformation in Mongolia. Basin Res. 2004, 16, 79–99. [Google Scholar] [CrossRef]
- Prost, G. Tectonics and hydrocarbon systems of the East Gobi basin, Mongolia. AAPG Bull. 2004, 88, 483–513. [Google Scholar] [CrossRef]
- Johnson, C.; Ritts, B. Plate Interior Polyphase Basins. In Recent Advances in Tectonics of Sedimentary Basins; Blackwell Science: West Sussex, UK, 2012; pp. 567–582. [Google Scholar]
- Zheng, Y.; Wang, S.; Wang, Y. An enormous thrust nappe and extensional metamorphic core complex discovered in Sino-Mongolian boundary area. Sci. China 1991, 34, 1145–1154. [Google Scholar]
- Zheng, Y.; Zhang, Q. The Yagan metamorphic core complex and extensional detachment fault in Inner Mongolia, China. Acta Geol. Sin. 1994, 7, 125–137. [Google Scholar]
- Johnson, C.; Amory, J.; Zinniker, D.; Lamb, M.; Graham, S.; Affolter, M.; Badarch, G. Sedimentary response to arc-continent collision, Permian, southern Mongolia. GSA Spec. Pap. 2008, 436, 363–390. [Google Scholar]
- Lamb, M.; Badarch, G. Paleozoic sedimentary basins and volcanic arc systems of southern Mongolia: New geochemical and petrographic constraints. GSA Mem. 2001, 194, 117–150. [Google Scholar]
- Blight, J.; Crowley, Q.; Petterson, M.; Cunningham, D. Granites of the Southern Mongolia Carboniferous Arc: New geochronological and geochemical constraints. Lithos 2010, 116, 35–52. [Google Scholar] [CrossRef] [Green Version]
- Lamb, M.; Cox, D. New 40Ar/39Ar age data and implications for porphyry copper deposits of Mongolia. Econ. Geol. 1998, 93, 524–529. [Google Scholar] [CrossRef]
- Watanabe, Y.; Stein, H. Re-Os ages for the Erdenet and Tsagaan Suvarga porphyry Cu-Mo deposits, Mongolia, and tectonic implications. Econ. Geol. 2000, 95, 1537–1542. [Google Scholar]
- Perelló, P.; Cox, D.; Garamjav, D.; Diakov, S.; Schissel, D.; Munkhbat, T.; Oyun, G. Oyu Tolgoi, Mongolia: Siluro-Devonian porphyry Cu-Au-(Mo) and high-sulfidation Cu mineralization with a Cretaceous chalcocite blanket. Econ. Geol. 2001, 96, 1407–1428. [Google Scholar] [CrossRef]
- Heumann, M.; Johnson, C.; Webb, L.; Taylor, J.; Jalball, U.; Minjin, C. Paleogeographic reconstruction of a late Paleozoic arc collision zone, southern Mongolia. GSA Bull. 2012, 124, 1514–1534. [Google Scholar] [CrossRef]
- Graham, S.; Hendrix, M.; Johnson, C.B.D.; Badarch, G.; Amory, J.; Porter, J.; Barsbold, R.; Webb, L.; Hacker, B. Sedimentary record and tectonic implications of Mesozoic rifting in southeast Mongolia. GSA Bull. 2001, 113, 1560–1579. [Google Scholar]
- Meng, Q.; Hu, J.; Jin, J.; Zhang, Y.; Xu, D. Tectonics of the late Mesozoic wide extensional basin system in the China-Mongolia border region. Basin Res. 2003, 15, 297–415. [Google Scholar]
- Passchier, C.; Trouw, R. Microtectonics, 2nd ed.; Springer-Verlag: Berlin, Germany, 2005. [Google Scholar]
- Gehrels, G.; Valencia, V.; Pullen, A. Detrital zircon geochronology by Laser Ablation Multicollector ICPMS at the Arizona LaserChron Center. Paleontol. Soc. Pap. 2006, 12, 67–76. [Google Scholar]
- Gehrels, G.; Valencia, V.; Ruiz, J. Enhanced precision, accuracy, efficiency, and spatial resolution of U-Pb ages by laser ablation–multicollector–inductively coupled plasma–mass spectrometry. Geochem. Geophys. Geosyst. 2008, 9, Q03017:1–Q03017:13. [Google Scholar]
- Johnston, S.; Gehrels, S.; Valencia, V.; Ruiz, J. Small-volume U–Pb zircon geochronology by laser ablation-multicollector-ICP-MS. Chem. Geol. 2009, 259, 218–229. [Google Scholar] [CrossRef]
- Stacey, J.; Kramers, J. Approximation of terrestrial lead isotope evolution by a twostage model. Earth Planet. Sci. Lett. 1975, 26, 207–221. [Google Scholar] [CrossRef]
- The Age Pick Macro Add-On for Microsoft Excel. Available online: https://docs.google.com/file/d/0B9ezu34P5h8eNWRkMGZkNTgtZDdhOC00OGZkLTkxNjUtYzY5M2UzYjU1ZmVi/edit?hl=en_US&pli=1 (accessed on 12 August 2013).
- Ludwig, K. Isoplot 3.60; Berkeley Geochronology Center: Berkeley, CA, USA, 2008. Available online: https://www.bgc.org/isoplot_etc/isoplot.html (accessed on 12 August 2013).
- Whitney, D.; Evans, B. Abbreviations for names of rock-forming minerals. Am. Mineral. 2010, 95, 185–187. [Google Scholar] [CrossRef]
- Hoskin, P.; Schaltegger, U. The composition of zircon and igneous and metamorphic petrogenesis. Rev. Mineral. Geochem. 2003, 53, 27–62. [Google Scholar] [CrossRef]
- Vernon, R. A Practical Guide to Rock Microstructure; Cambridge University Press: Cambridge, UK, 2004. [Google Scholar]
- Geisler, T.; Pidgeon, R.; van Broswijk, W.; Kurtz, R. Transport of uranium, thorium, and lead in metamict zircon under low-temperature hydrothermal conditions. Chem. Geol. 2002, 191, 141–154. [Google Scholar] [CrossRef]
- Ruzhentsev, S.; Pospelov, I.; Badarch, G. Tectonics of the Mongolian Indosinides. Geotectonics 1989, 23, 476–487. [Google Scholar]
- Ruzhentsev, S.; Pospelov, I. The South Mongolian Variscan fold system. Geotectonics 1992, 26, 383–395. [Google Scholar]
- Zorin, Y.; Belichenko, V.; Turitanov, E.; Kozhenvnikov, V.; Ruzhentsev, S.; Dergunov, A.; Filippova, I.; Tomurtogoo, O.; Arvisbaatar, N.; et al. The South-Siberia-Central Mongolia transect. Tectonophysics 1993, 225, 361–378. [Google Scholar] [CrossRef]
- Lamb, M.; Badarch, G. Paleozoic sedimentary basins and volcanic-arc systems of southern Mongolia; new stratigraphic and sedimentologic constraints. Int. Geol. Rev. 1997, 39, 542–576. [Google Scholar] [CrossRef]
- Kovalenko, V.; Yarmolyuk, V.; Sal’nikova, E.; Kozlovsky, A.; Kotov, A.; Kovack, V.; Savatenkov, V.; Vladykin, N.; Ponomarchuk, V. Geology, geochronology, and geodynamics of the Khan Bogd alkali granite pluton of Southern Mongolia. Geotectonics 2006, 40, 450–466. [Google Scholar] [CrossRef]
- Chen, B.; Jahn, B.; Wilde, S.; Xu, B. Two contrasting Paleozoic magmatic belts in northern Inner Mongolia, China: Petrogenesis and tectonic implications. Tectonophysics 2000, 328, 157–182. [Google Scholar] [CrossRef]
- Chen, B.; Jahn, B.; Tian, W. Evolution of the Solonker suture zone: Constraints from zircon U-Pb ages, Hf isotopic rations and whole-rock Nd-Sr isotope compositions of subduction- and collision-related magmas and forearc sediments. J. Asian Earth Sci. 2009, 34, 245–257. [Google Scholar] [CrossRef]
- Wu, F.; Sun, D.; Li, H.; Jahn, B.; Wilde, S. A-type granites in northeastern China: Age and geochemical constraints on their petrogenesis. Chem. Geol. 2002, 187, 143–173. [Google Scholar] [CrossRef]
- Wang, T.; Zheng, Y.; Li, T.; Gao, Y. Mesozoic granitic magmatism in extensional tectonics near the Mongolian border with China and its implications for crustal growth. J. Asian Earth Sci. 2004, 23, 715–729. [Google Scholar] [CrossRef]
- Zhang, S.; Zhao, Y.; Song, B.; Hu, J.; Liu, S.; Yang, Y.; Chen, F.; Liu, X.; Liu, J. Contrasting Late Carboniferous and Late Permian–Middle Triassic intrusive suites from the northern margin of the North China craton: Geochronology, petrogenesis, and tectonic implications. Geol. Soc. Am. Bull. 2009, 121, 191–200. [Google Scholar]
- Davis, G.; Xu, B.; Zheng, Y.; Zhang, W. Indosinian extension in the Solonker suture zone: The Sonid Zuopi metamorphic core complex, Inner Mongolia, China. Earth Sci. Front. 2004, 11, 135–144. [Google Scholar]
- Yin, A. Cenozoic tectonic evolution of Asia: A preliminary synthesis. Tectonophysics 2010, 488, 293–325. [Google Scholar] [CrossRef]
- Zhao, G.; Wilde, S.; Cawood, P.; Sun, M. Archean blocks and their boundaries in the North China Craton: Lithological, geochemical, structural and P-T path constraints and tectonic evolution. Precambrian Res. 2001, 107, 45–73. [Google Scholar] [CrossRef]
- Zhai, M.; Shao, J.; Hao, J.; Peng, P. Geological signature and possible position of the North China Block in the supercontinent Rodinia. Gondwana Res. 2003, 6, 171–183. [Google Scholar] [CrossRef]
- Cope, T.; Ritts, B.; Darby, B.; Fildani, A.; Graham, S. Late Paleozoic sedimentation on the northern margin of the North China Block; Implications for regional tectonics and climate change. Int. Geol. Rev. 2005, 47, 270–296. [Google Scholar] [CrossRef]
- Darby, B.; Gehrels, G. Detrital zircon reference for the North China Block. J. Asian Earth Sci. 2006, 26, 637–648. [Google Scholar] [CrossRef]
- Jian, P.; Liu, D.; Kroner, A.; Windley, B.; Shi, Y.; Zhang, F.; Shi, G.; Miao, L.; Zhang, W.; Zhang, Q.; et al. Time scale of an early to mid-Paleozoic orogenic cycle of the long-lived Central Asian Orogenic Belt, Inner Mongolia of China: Implications for continental growth. Lithos 2008, 101, 233–259. [Google Scholar] [CrossRef]
- Zhang, J.; Mattinson, C.; Meng, F.; Wan, Y.; Tung, K. Polyphase tectonothermal history recorded in granulitized gneisses from the north Qaidam HP/UHP metamorphic terrane, western China: Evidence from zircon U-Pb gechronology. GSA Bull. 2010, 120, 732–749. [Google Scholar]
- Zhao, G.; Wilde, S.; Sun, M.; Guo, J.; Kroner, A.; Li, S.; Li, X.; Zhang, J. SHRIMP U-Pb geochronology of the Haui’an complex: Constraints on Late Archean to Paleoproterozoic magmatic and metamorphic events in the Trans-North China Orogen. Am. J. Sci. 2008, 308, 270–303. [Google Scholar] [CrossRef]
- Li, Q.; Chen, F.; Guo, J.; Li, X.; Yang, Y.; Siebel, W. Zircon ages and Nd-Hf isotopic composition of the Zhaertai Group (Inner Mongolia): Evidence for early Proterozic evolution of the northern North China Craton. J. Asian Earth Sci. 2007, 30, 573–590. [Google Scholar] [CrossRef]
- Lu, S.; Li, H.; Zhang, C.; Niu, G. Geological and geochronological evidence for the Precambrian evolution of the Tarim Craton and surrounding continental fragments. Precambrian Res. 2008, 160, 94–107. [Google Scholar] [CrossRef]
- Gehrels, G.; Wang, X. Magmatic history of the northeastern Tibetan Plateau. J. Geophys. Res. 2003, 108, 2423:1–2423:14. [Google Scholar]
- Rojas-Agramonte, Y.; Kroner, A.; Demoux, A.; Xia, X.; Wang, W.; Donskaya, T.; Liu, D.; Sun, M. Detrital and xenocrystic zircon ages from Neoproterozoic and Palaeozoic arc terranes of Mongolia: Significance for the origin of crustal fragments in the Central Asian Orogenic Belt. Gondwana Res. 2011, 19, 751–763. [Google Scholar] [CrossRef]
- Hendrix, M.; Graham, S.; Carroll, A.; Sobel, E.; McKnight, C.; Schulein, B.; Wang, Z. Sedimentary record and climatic implications of recurrent deformation in the Tian Shan: Evidence from Mesozoic strata of the north Tarim, south Junggar, and Turpan basins, northwest China. GSA Bull. 1992, 104, 53–79. [Google Scholar]
- Hendrix, M.; Beck, M.; Badarch, G.; Graham, S. Triassic synorogenic sedimentation in southern Mongolia: Early effects of intracontinental deformation. GSA Mem. 2001, 194, 389–412. [Google Scholar]
- Traynor, J.; Sladen, C. Tectonic and stratigraphic evolution of the Mongolian People’s Republic and its influence on hydrocarbon geology and potential. Mar. Petrol. Geol. 1995, 12, 35–52. [Google Scholar] [CrossRef]
- Taylor, J.; Webb, L.; Johnson, C.; Heumann, M. Constraints on Mesozoic and Tertiary Brittle Faulting in the Southern East Gobi Fault Zone, Southeastern Mongolia. In Proceedings of 2007 American Geophysical Union Fall Meeting, San Francisco, CA, USA, 10–14 December 2007. Abstract #V23C-1558.
- Taylor, J.P. Tectonic History of the East Gobi Fault Zone, Southeastern Mongolia: An Integrated Study Using Structural Geology, Geochronology, and Thermochronology. Ph.D. Thesis, Syracuse Universty, Syracuse, NY, USA, 13 December 2010. [Google Scholar]
- Taylor, J.; Webb, L.; Johnson, C.; Heumann, M. Strike-Slip and Exhumation History of the East Gobi Fault Zone, Southeastern Mongolia, with Emphasis of the Cenozoic Era. In Proceedings of 2009 Portland GSA Annual Meeting, Portland, OR, USA, 18–21 October 2009. Paper No. 254-3.
© 2013 by the authors; licensee MDPI, Basel, Switzerland. This article is an open access article distributed under the terms and conditions of the Creative Commons Attribution license (http://creativecommons.org/licenses/by/3.0/).
Share and Cite
Taylor, J.P.; Webb, L.E.; Johnson, C.L.; Heumann, M.J. The Lost South Gobi Microcontinent: Protolith Studies of Metamorphic Tectonites and Implications for the Evolution of Continental Crust in Southeastern Mongolia. Geosciences 2013, 3, 543-584. https://doi.org/10.3390/geosciences3030543
Taylor JP, Webb LE, Johnson CL, Heumann MJ. The Lost South Gobi Microcontinent: Protolith Studies of Metamorphic Tectonites and Implications for the Evolution of Continental Crust in Southeastern Mongolia. Geosciences. 2013; 3(3):543-584. https://doi.org/10.3390/geosciences3030543
Chicago/Turabian StyleTaylor, Joshua P., Laura E. Webb, Cari L. Johnson, and Matthew J. Heumann. 2013. "The Lost South Gobi Microcontinent: Protolith Studies of Metamorphic Tectonites and Implications for the Evolution of Continental Crust in Southeastern Mongolia" Geosciences 3, no. 3: 543-584. https://doi.org/10.3390/geosciences3030543