1. Introduction
Ongoing climate change strongly affects the water resources of countries depending on snow and glacier melt [
1,
2,
3,
4,
5,
6,
7,
8,
9]). Regions that are subjected to a summer-dry climate are particularly vulnerable to shifts in the timing of melting at high altitudes (e.g., [
10]). Water supply from snow or ice melt represents a major contribution to discharge during the summer months. Consequently, a shortage of snow and ice in mountain regions might have far-reaching economic, ecological and societal implications.
Armenia is a mountainous country in the Lesser Caucasus that heavily depends on agriculture (e.g., [
11]). As Armenia’s climate is characterized by relatively wet winters and warm and dry summers, irrigation plays a major role in sustaining economic stability (e.g., [
12]). Currently, there are no more permanent snow fields in Armenia, although Davoyan [
13] reports on some small glaciers in the crater of the volcano, Mount Aragats. This indicates that the regional firn line is at around 4000 m a.s.l. (above sea level), which agrees with the observation that sub-permanent snow fields persist until late summer at the flanks of Mount Aragats. These snow deposits sticking to sharp edges in topography can reach a considerable thickness and are formed by steadily strong winds (e.g., [
14]).
The snow cover is able to store large quantities of water over periods from a few days to several months (e.g., [
1]). In summer-dry countries, such as Armenia, runoff from snow melt from the mountains is highly important for a sustained water supply for the densely populated regions where water is urgently needed for irrigation (see also [
15]). During summer, snow fields on Mount Aragats provide vital amounts of melt water to the rivers. However, there is a general lack of water in the dry months of August and September after the complete disappearance of the snow coverage [
16,
17]. This summer drought is expected to become even more pronounced with the ongoing climate change. For the summer months (June–August) CMIP5 (Coupled Model Intercomparison Project) climate projections [
18], consisting of 13 global circulation models and using three different emission scenarios, calculate a decrease in precipitation by −17% (±21%) for the region of Mount Aragats by 2100 compared to the period 1980–2000. Temperatures are predicted to increase by +4.0 °C (±2.4 °C).
Water retention is crucial for providing sustained runoff in the streams that secure water supply for the lowlands adjacent to mountainous regions [
19]. Natural water retention in the form of snow and ice is highly efficient and stores water without significant ecological impacts. Melt water stored in snow and ice is released in the warmest periods coinciding with maximum evapotranspiration in the adjacent lowlands in which water is then most urgently needed (e.g., [
4,
20]). Artificially managing water retention is often achieved by large reservoir dams. However, financial investments into such constructions would be large and are difficult to raise in developing countries, like Armenia. Furthermore, reservoir dams have high ecological impacts [
21,
22], represent a threat to downstream settlements (e.g., [
23]) and might be affected by seepage [
24].
The artificial management of natural snow accumulations with geotextiles covering surfaces and their melting in high-mountain areas might represent a promising new alternative, offering sustainable and feasible storage of water in summer-dry countries, like Armenia. Several materials and techniques were investigated with regard to their snow and ice preserving capacities. The materials tested included ice fragments, saw dust [
25], wood chips [
26] and several different tarps and textiles [
27], which were laid on top of the snow surface. Further experiments by Olefs and Fischer [
27] involved injections of water into the snow pack and snow compaction. Most of these attempts were shown to have minor effects on the melting of snow. Only geotextiles, applied on top of the spring snow surface, proved to be highly efficient in reducing the speed of the melting process [
27]. This is explained by various factors influencing the surface energy balance. This was investigated both at a theoretical level using different modeling approaches and at an experimental level on Schneeferner in the Austrian Alps [
28,
29,
30]. Geotextiles have a high albedo and exert a radiation effect by reflecting more incoming shortwave radiation than natural old snow surfaces, which are typically found during the melting season. They thus significantly reduce the overall energy available for melting. Moreover, geotextiles have favorable thermal properties and, therefore, reduce melt due to sensible and latent heat fluxes. The semi-permeable properties of geotextiles, on the one hand, inhibit the formation of air puddles that may warm up and, on the other hand, protect the snow from seeping rain water [
27].
Beyond the determination of the effectiveness of geotextiles, this study addresses the hydrological potential of the techniques of artificial snow management on Mount Aragats, Armenia. The dynamics of snow accumulations and their melting are assessed by extensive field measurements over three consecutive years combined with numerical modeling. Over the course of two melt seasons geotextiles were applied on snow fields and the melt dynamics of covered and uncovered snow surfaces were compared in order to assess the melt-reducing effect of geotextiles. We use a modified version of the glacio-hydrological model, GERM (glacier evolution runoff model) [
31], and calculate melt both with a distributed temperature-index model [
32] and a parameterized energy-balance model [
33]. This allows us to quantify the effect of artificial snow melt protection on the hydrological regime and transient water storage and, by extrapolating results beyond the measurement period and to different conditions, provides a management tool for the planning of related activities.
2. Study Site and Field Data
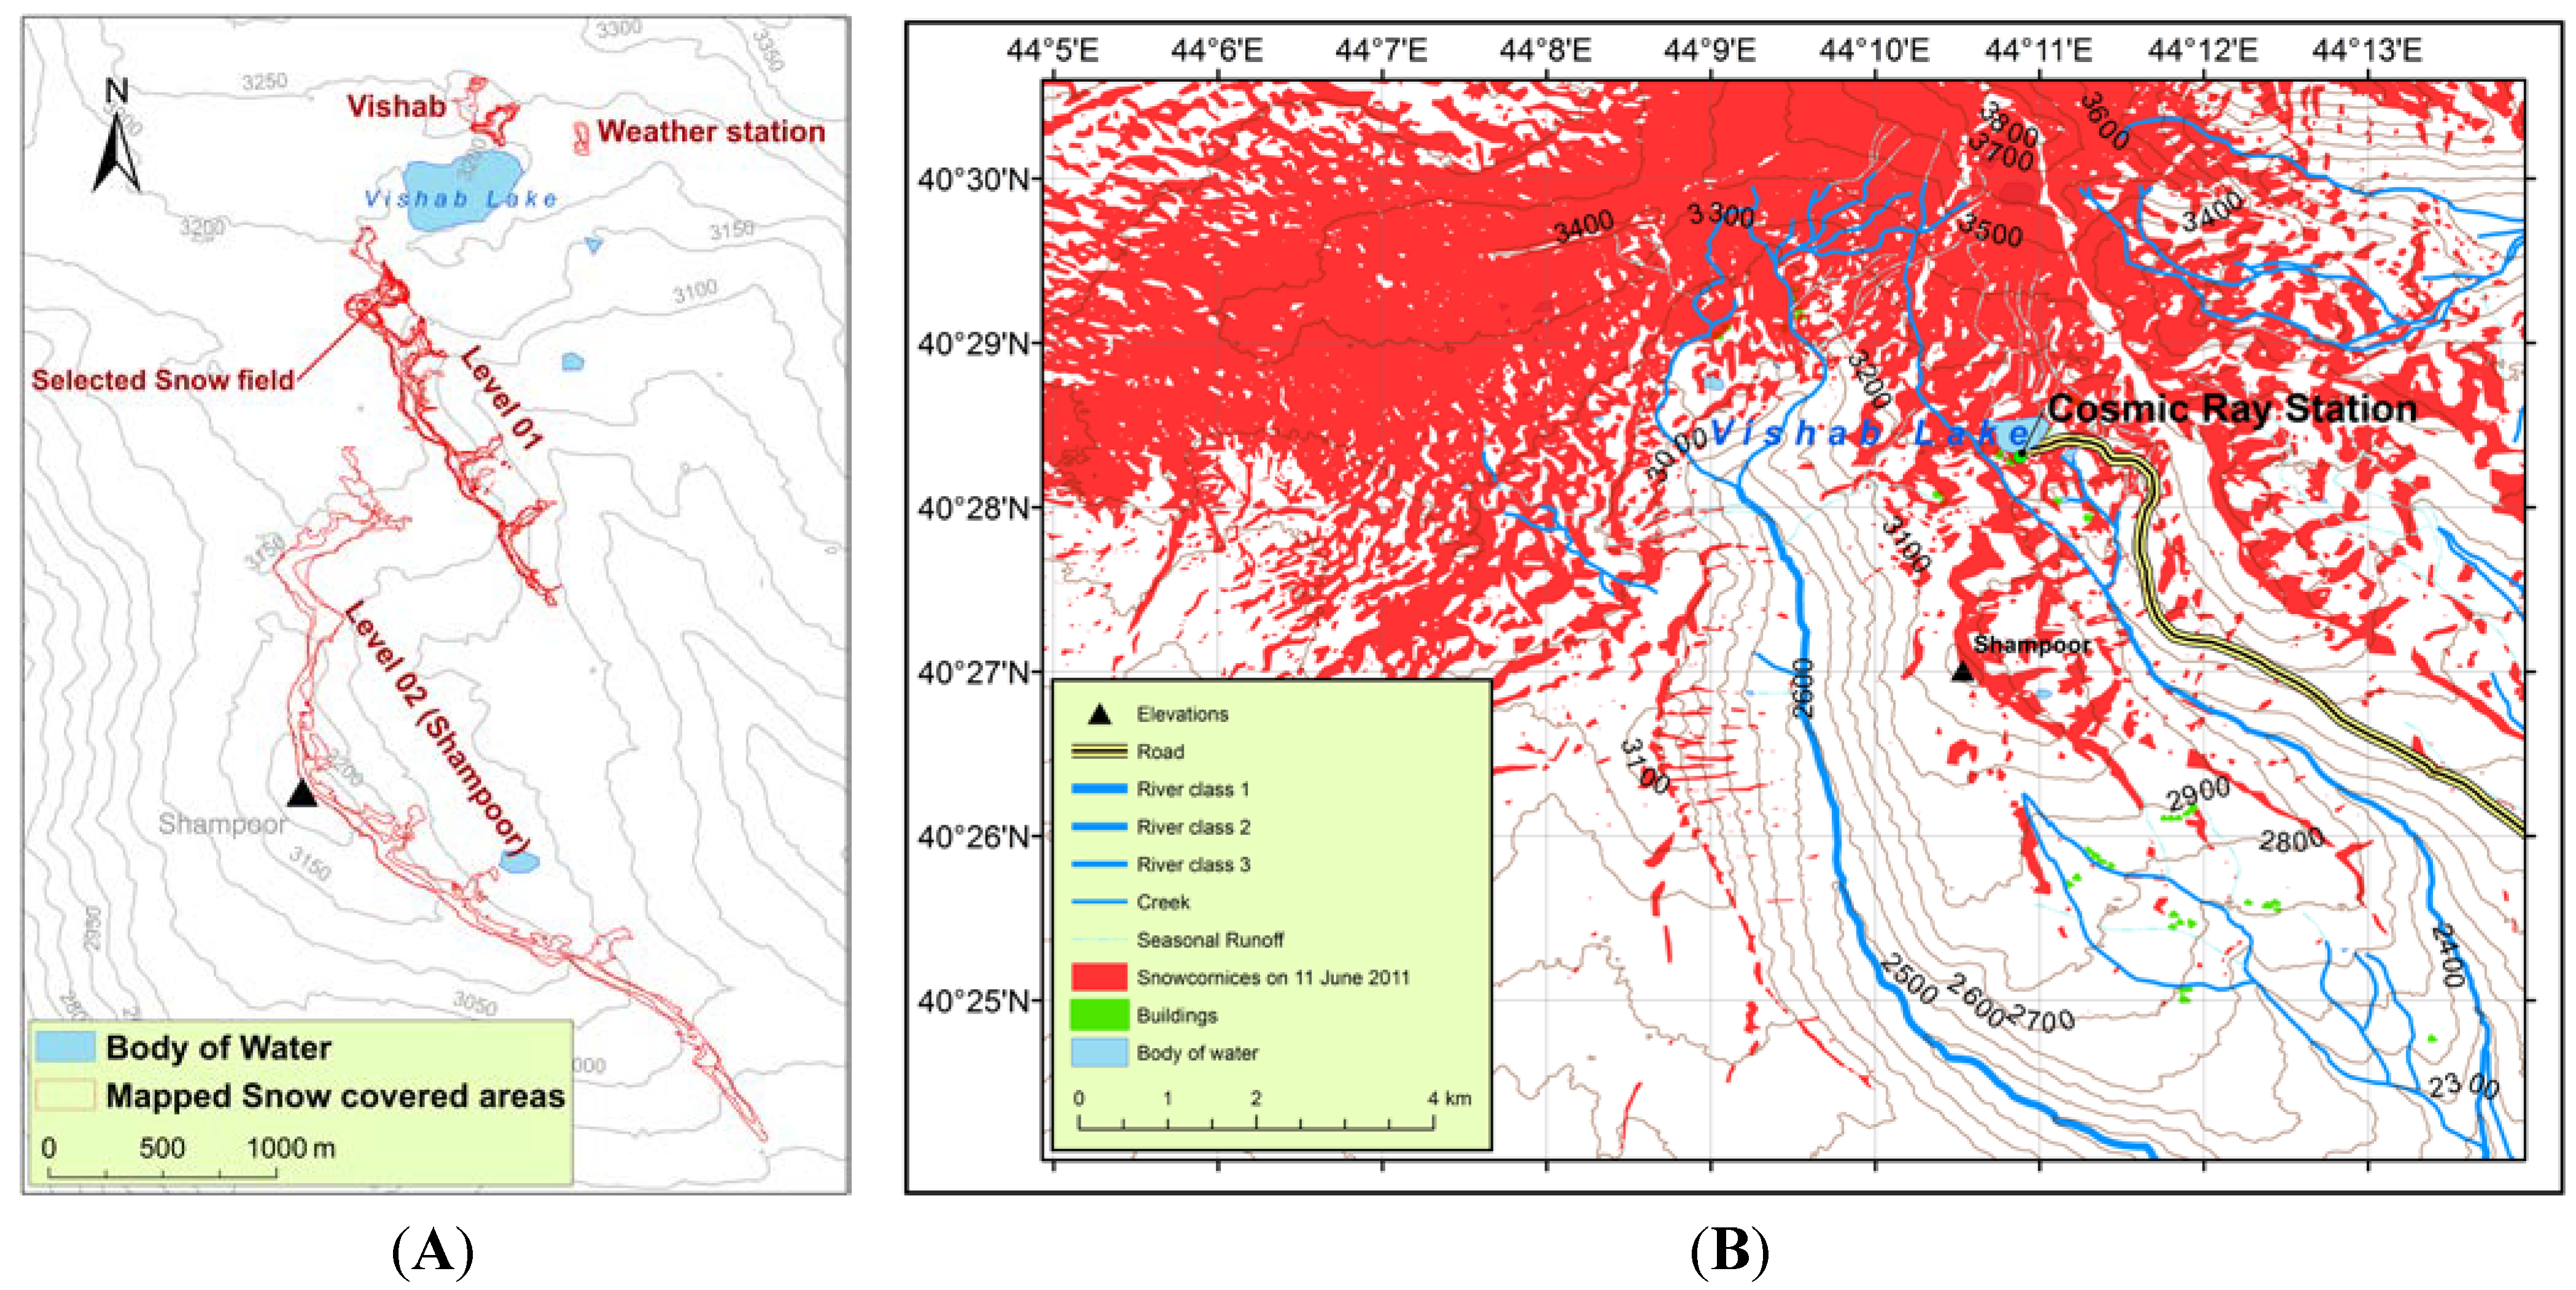
This study focuses on sub-permanent snow fields appearing each year on Armenia’s highest mountain, Mount Aragats (4089 m a.s.l.) (
Figure 1), located at a distance of about 50 km from the capital, Yerevan. Aragats is an inactive, cone-shaped volcano with a diameter of about 40 km at its base. Its slopes are characterized by radial valleys that are deeply carved into the permeable volcanic rock. The Cosmic Ray Station, a renowned observatory that is used for studying physical processes in outer space (e.g., [
34]), is located at an elevation of 3200 m a.s.l. at the shore of Lake Vishab and is accessible by car (
Figure 2).
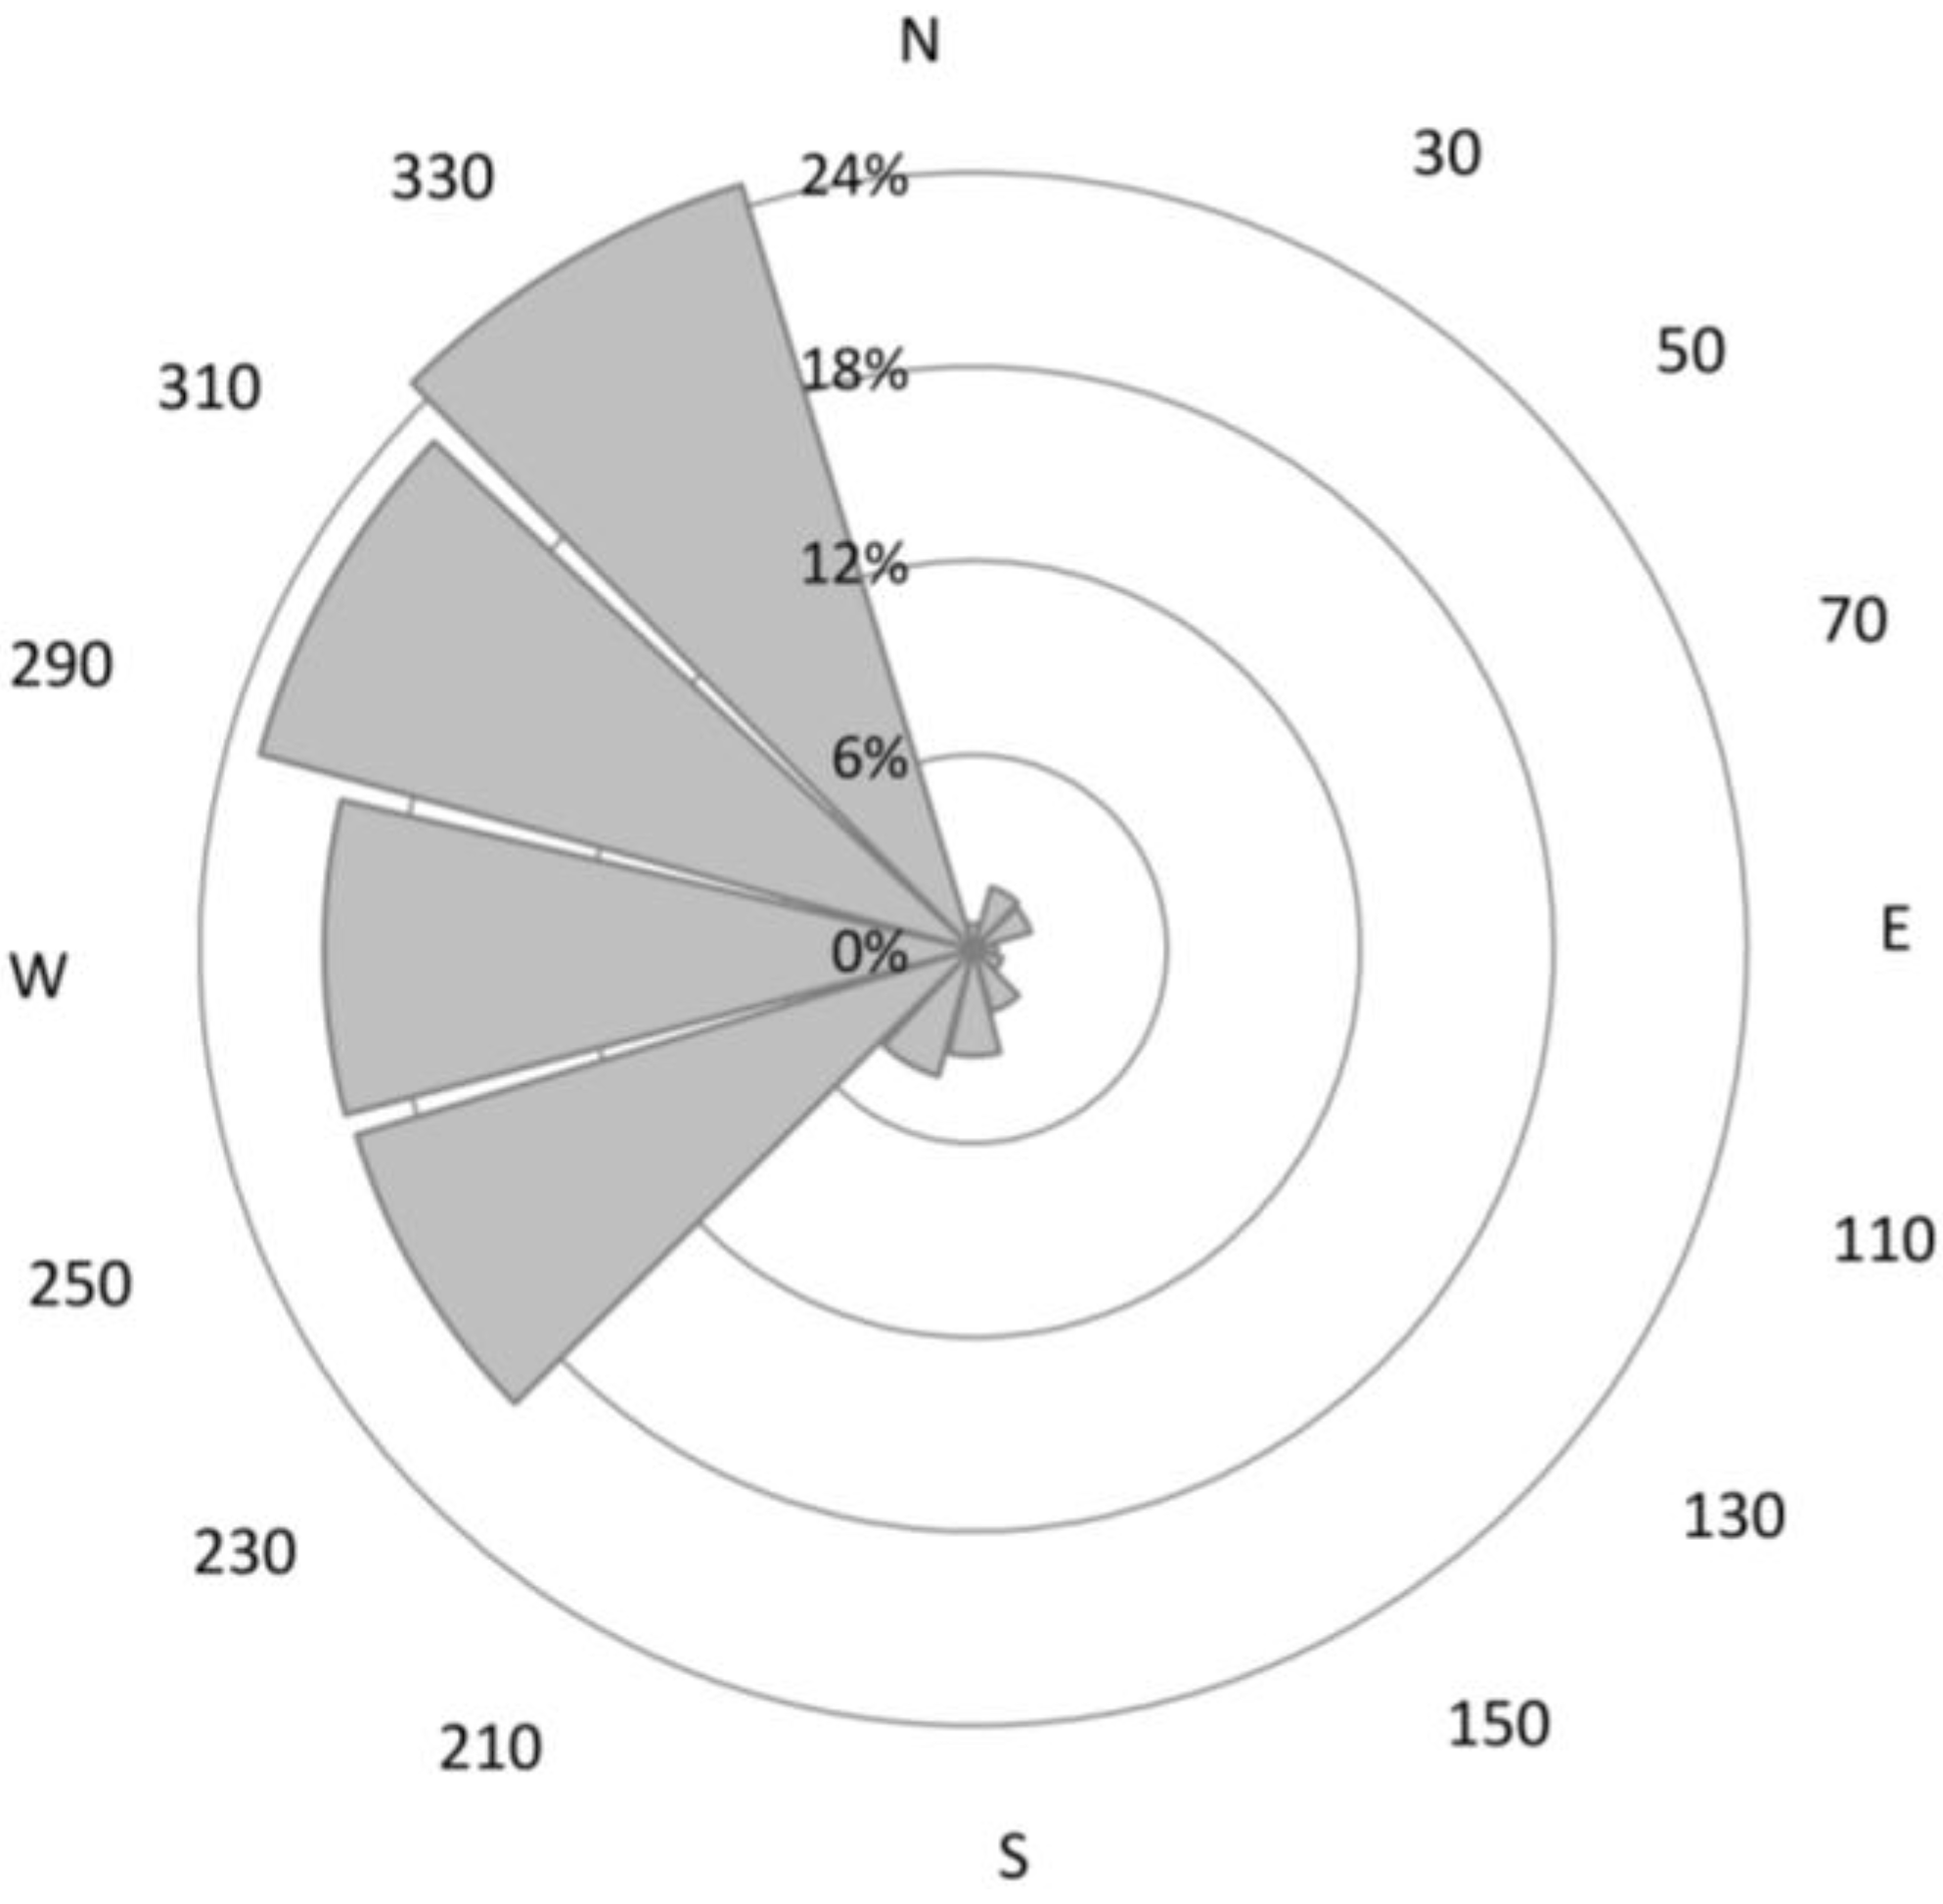
Strong winds, predominantly from west to northwest (
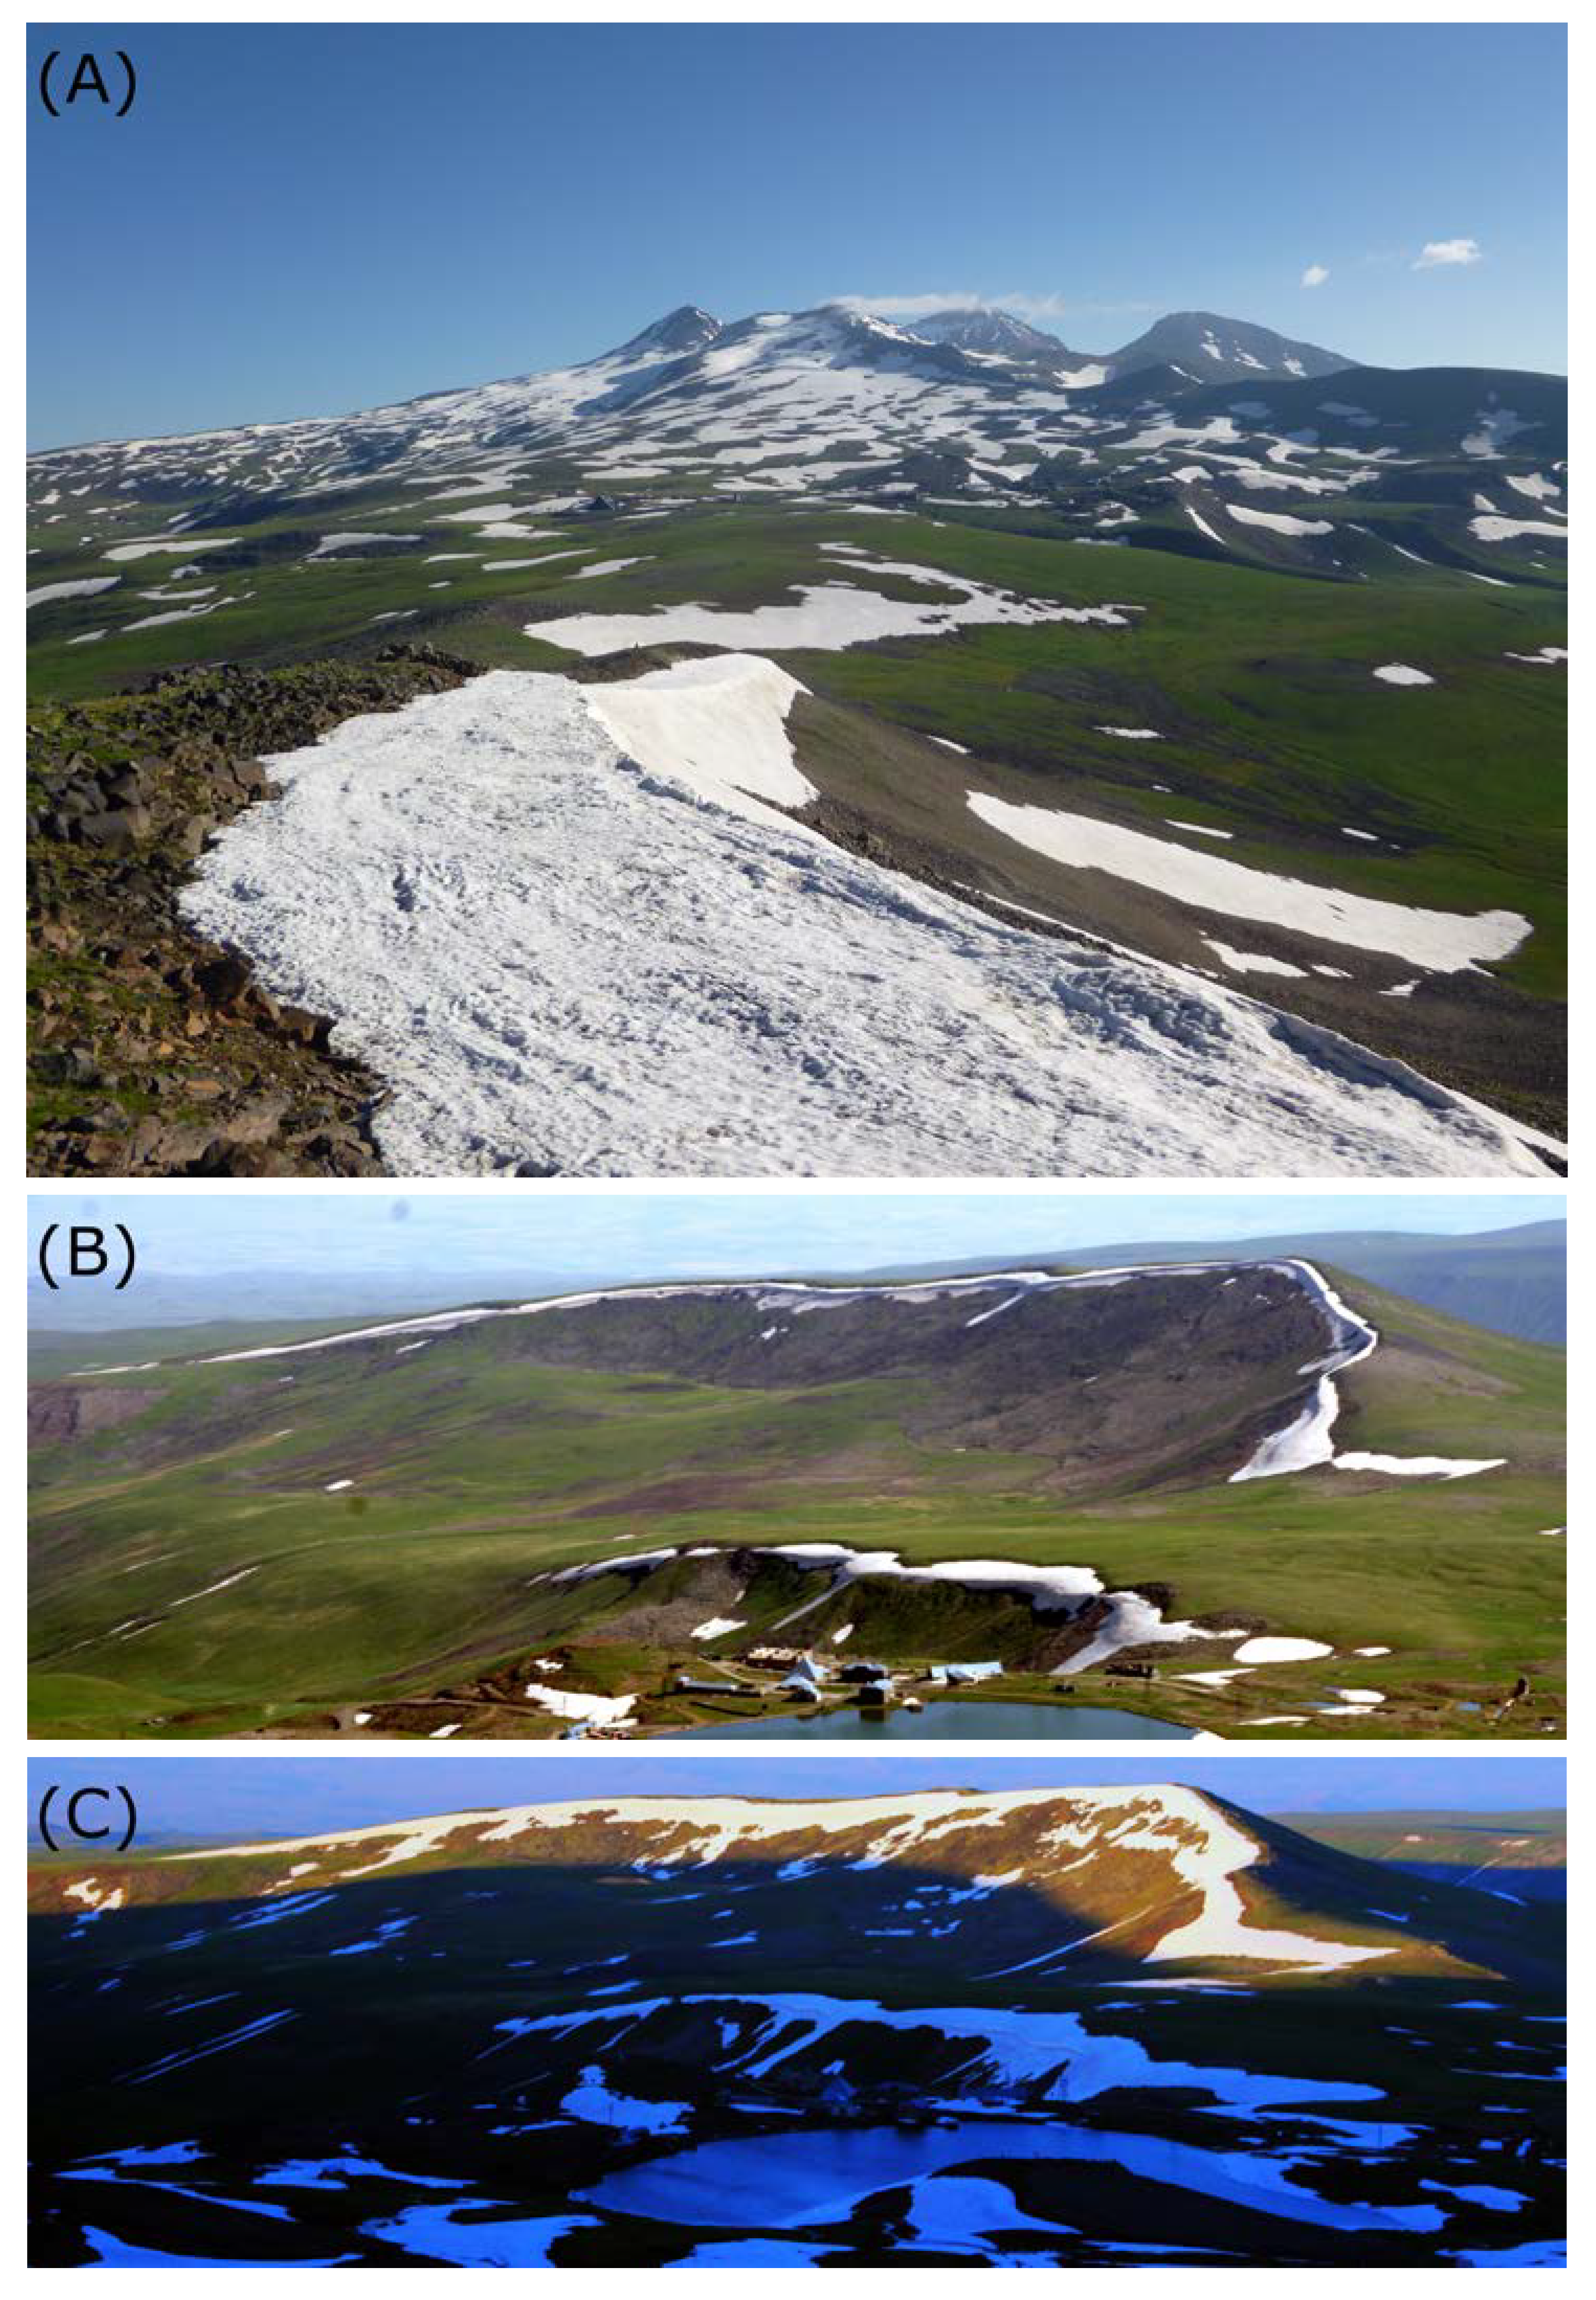
Figure 3), relocate large amounts of unconsolidated winter snow to the lee side of sharp edges in the terrain, where snow is deposited in cornices that may reach up to 10 m in thickness. These massive accumulations form every winter and show highly regular and annually recurring patterns (
Figure 1). The biggest snow deposits in the most favorable topographic locations above 3000 m a.s.l. last until mid-July, but at higher elevations, a few snow fields have been observed to persist as long as the following winter season sets in, which then transforms the snow into firn.
Natural wind redistribution of snow at the slopes of Mount Aragats is the principal process allowing the proposed techniques investigated in this project to be effective: although general amounts of precipitation are not excessive, their wind-driven accumulation in small, confined topographic locations leads to a locally very thick snow cover, which is able to survive far into the summer season. Our project aims at prolonging the survival of these natural accumulations and to use them as natural water reservoirs.
Figure 1.
Snow fields on Mount Aragats: (A) June 2013; (B) June 2011; and (C) June 2013.
Figure 1.
Snow fields on Mount Aragats: (A) June 2013; (B) June 2011; and (C) June 2013.
Figure 2.
Mapped outlines of snow fields on Mount Aragats (A) based on repeated GPS mapping and (B) classified from a Landsat-scene taken on 6 June 2011.
Figure 2.
Mapped outlines of snow fields on Mount Aragats (A) based on repeated GPS mapping and (B) classified from a Landsat-scene taken on 6 June 2011.
Figure 3.
The observed distribution of wind directions on Mount Aragats during wintertime (November 2012–April 2013).
Figure 3.
The observed distribution of wind directions on Mount Aragats during wintertime (November 2012–April 2013).
At an elevation of about 3200 m a.s.l., protective measures were applied in the first experimental studies by the members of the Freezwater project on a snow cornice next to Lake Vishab in 2012 and 2013. Geotextiles provided by Fritz Landolt AG, Switzerland (IceProtector 500), were placed on the snow surface at the onset of the melting season. Each roll of textile was transported with a trailer to within 200 m of the snow cornice and carried by six workers to the site. The placement was achieved by fixing the upper end with stones and letting the textile unroll itself downhill. The newest generation of geotextiles (TOP TEX GLS) can be purchased at 2.- to 3.- CHF per m² [
35].
Extensive measurements of various variables were gathered during field visits in June 2011, June to July 2012, and June 2013.
By means of repeated GPS-mappings using hand-held devices (horizontal precision ±6 m), annually recurring patterns of snow distribution could be identified. The investigated sites include: Vishab, Weather Station, Level 01 (including Selected Snow Field) and Level 02 (Shampoor) (
Figure 2A). Between three and six mappings of each snow field with time intervals from a few days to two weeks were carried out each season providing a time series of the melting dynamics and the geometry changes of the snow deposits (
Table 1). Furthermore, a Landsat satellite scene, downloaded from [
36], provided an overview of the total snow covered area in the entire mountain area (
Figure 2B).
Table 1.
Dates of snow field perimeter mappings.
Table 1.
Dates of snow field perimeter mappings.
| Level 01 | Level 02 | Vishab | Weather station |
|---|
| 4 July 2011 | 21 June 2011 | 20 June 2012 | 19 June 2012 |
| 12 July 2011 | 5 July 2012 | 30 June 2012 | 8 July 2012 |
| 20 June 2012 | 24 June 2013 | 8 July 2012 | - |
| 23 July 2012 | - | 22 June 2013 | - |
| 22 June 2013 | - | 24 June 2013 | - |
| 25 June 2013 | - | 26 June 2013 | - |
The speed of the melting process was determined by repeated readings of several ablation stakes (precision ±1–2 cm) positioned in various topographic locations, both on uncovered snow and geotextile-covered surfaces. The snow ablation measurements were conducted on the snow fields of Level 01 and Vishab in 2012 and 2013 (
Figure 4). Furthermore, snow depths were measured between 2011 and 2013 by means of soundings using modular metal poles, which were spaced 10 to 20 m. The rough underground consisting of volcanic boulders and ice lenses affected the sounding precision significantly, which is estimated to be ±0.5 m. Snow density and snow water equivalent was determined in a snow pit (
Figure 4) using a standard cylinder with a defined volume. Snow density was 590 ± 30 kg∙m
−3 in 2012 and 630 ± 30 kg∙m
−3 in 2013. Snow soundings were spatially interpolated using kriging over the entire snow field to obtain the snow volume and, by assuming the measured density to be representative, the water volume stored as snow.
An automated weather station close to the Cosmic Ray Station (
Figure 2B) at the same elevation and at a horizontal distance of a few hundred meters from the study sites has been providing hourly air temperature, precipitation, wind direction and speed data since 2011. Information about surface elevation is based on the Advanced Spaceborne Thermal Emission and Reflection Radiometer (ASTER) digital elevation model (DEM) with a nominal horizontal resolution of 1" per pixel corresponding to roughly 27 m for the investigated area.
The materials to cover the snow surface used in this project are similar to those applied by Olefs and Fischer [
27] and Olefs and Lehning [
29].
The geotextile used consists of a 3.8 mm-thick, two-layer composite of polypropylene and polyester fibers. It features certain properties that make it an efficient tool to slow snow melt. First and foremost, the white UV-stabilized surface efficiently reflects shortwave radiation. Measurements by Olefs and Lehning [
29] yielded a mean albedo of 0.69 for a textile used during the first season and an albedo of 0.65 for textiles that have already been used one season before. These albedo readings were determined for a range of wavelengths between 350 and 950 nm [
27]. The material’s albedo is claimed to be responsible for 47% of its performance. A further important property is the geotextile’s permeability. On the one hand, the materials used are breathable, allowing for an exchange of latent heat,
i.e., it does not block evaporation or sublimation. On the other hand, it keeps a great portion of rain water from seeping through the geotextile down to the snow surface. Rainwater evaporating from the textile’s surface is responsible for 10% of the protective effect. The remaining 43% of its performance can be attributed to the insulation effect caused by the textile itself and air pockets beneath the geotextile [
29].
Figure 4.
An overview of glaciological measurements on two snow fields in 2012 and 2013 (see
Figure 2 and the red square in the overview map for the location). Ablation measurements, snow soundings, density measurements and the areas covered with geotextiles are indicated. The snow cover extents refer to 20 June 2012, and 22 June 2013.
4. Results
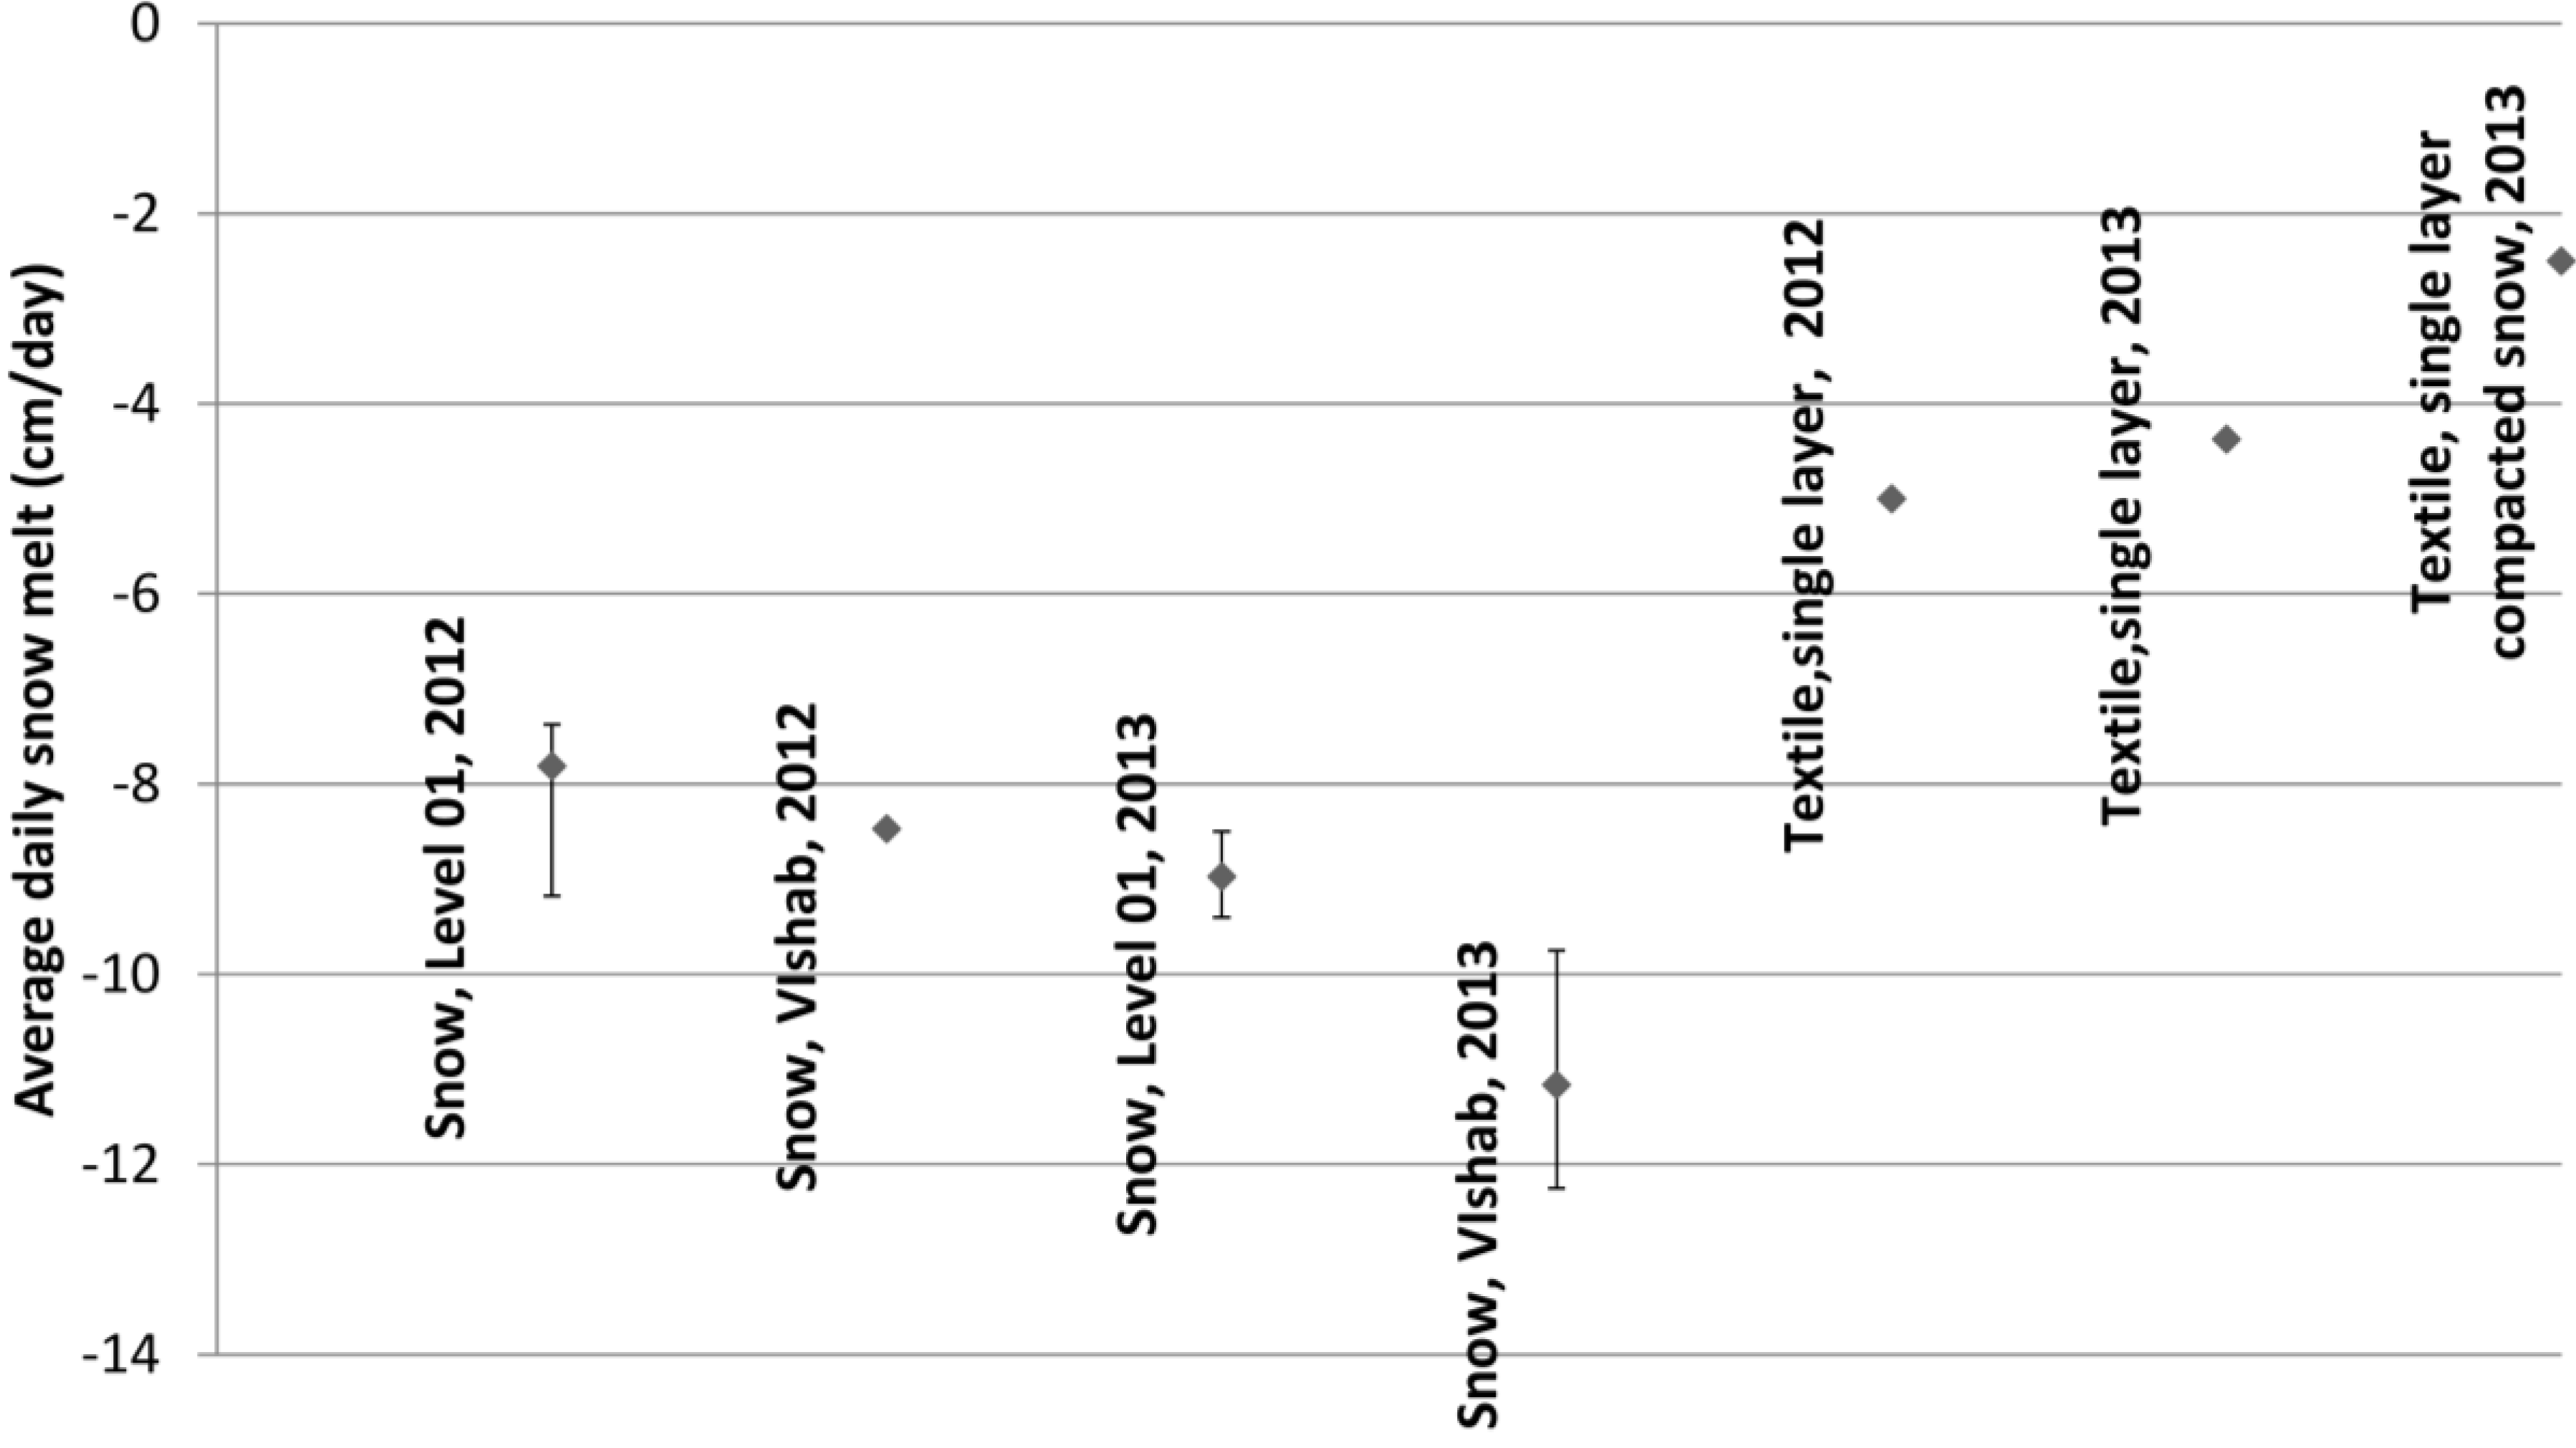
Both experiments with geotextiles in 2012 and 2013 proved to delay snow melt considerably. While unprotected snow deposits disappeared by the end of July, protected snow accumulations were observed to persist until September.
Observed daily average ablation shows significant differences between the measurement sites (
Figure 6). Generally, ablation rates over surfaces not covered with geotextiles turn out to be somewhat lower in 2012 than in 2013. This might be explained by the longer observation period extending into July when incoming solar radiation has already notably decreased. On the snow field Level 01, ablation rates were lower than on the Vishab snow field (
Figure 6). The measurements clearly reveal a significant melt reduction, due to geotextile coverage (
Figure 6). Whereas in 2012, snow melt over surfaces covered with geotextiles was reduced by about 42%, the average reduction was 57% in 2013. These results are within the range found in similar experiments on glaciers in the European Alps [
27]. In June 2013, we observed a maximum melt reduction of 75% at one geotextile-covered location (
Figure 6). This strongly reduced snow ablation (decrease in snow depth) can partly be attributed to the higher compaction of snow,
i.e., higher snow density and, thus, water equivalent, at this location. Based on our observations, a melt reduction factor
fcovered = 0.43 was chosen for snow surfaces covered with geotextiles (see Equation (4)). This factor is used in the modeling.
Figure 6.
Average daily snow ablation rates in cm between 17 June and 24 July 2012 and between 22 June and 27 June 2013. If more than one measurement site was available, the range is indicated by bars.
Figure 6.
Average daily snow ablation rates in cm between 17 June and 24 July 2012 and between 22 June and 27 June 2013. If more than one measurement site was available, the range is indicated by bars.
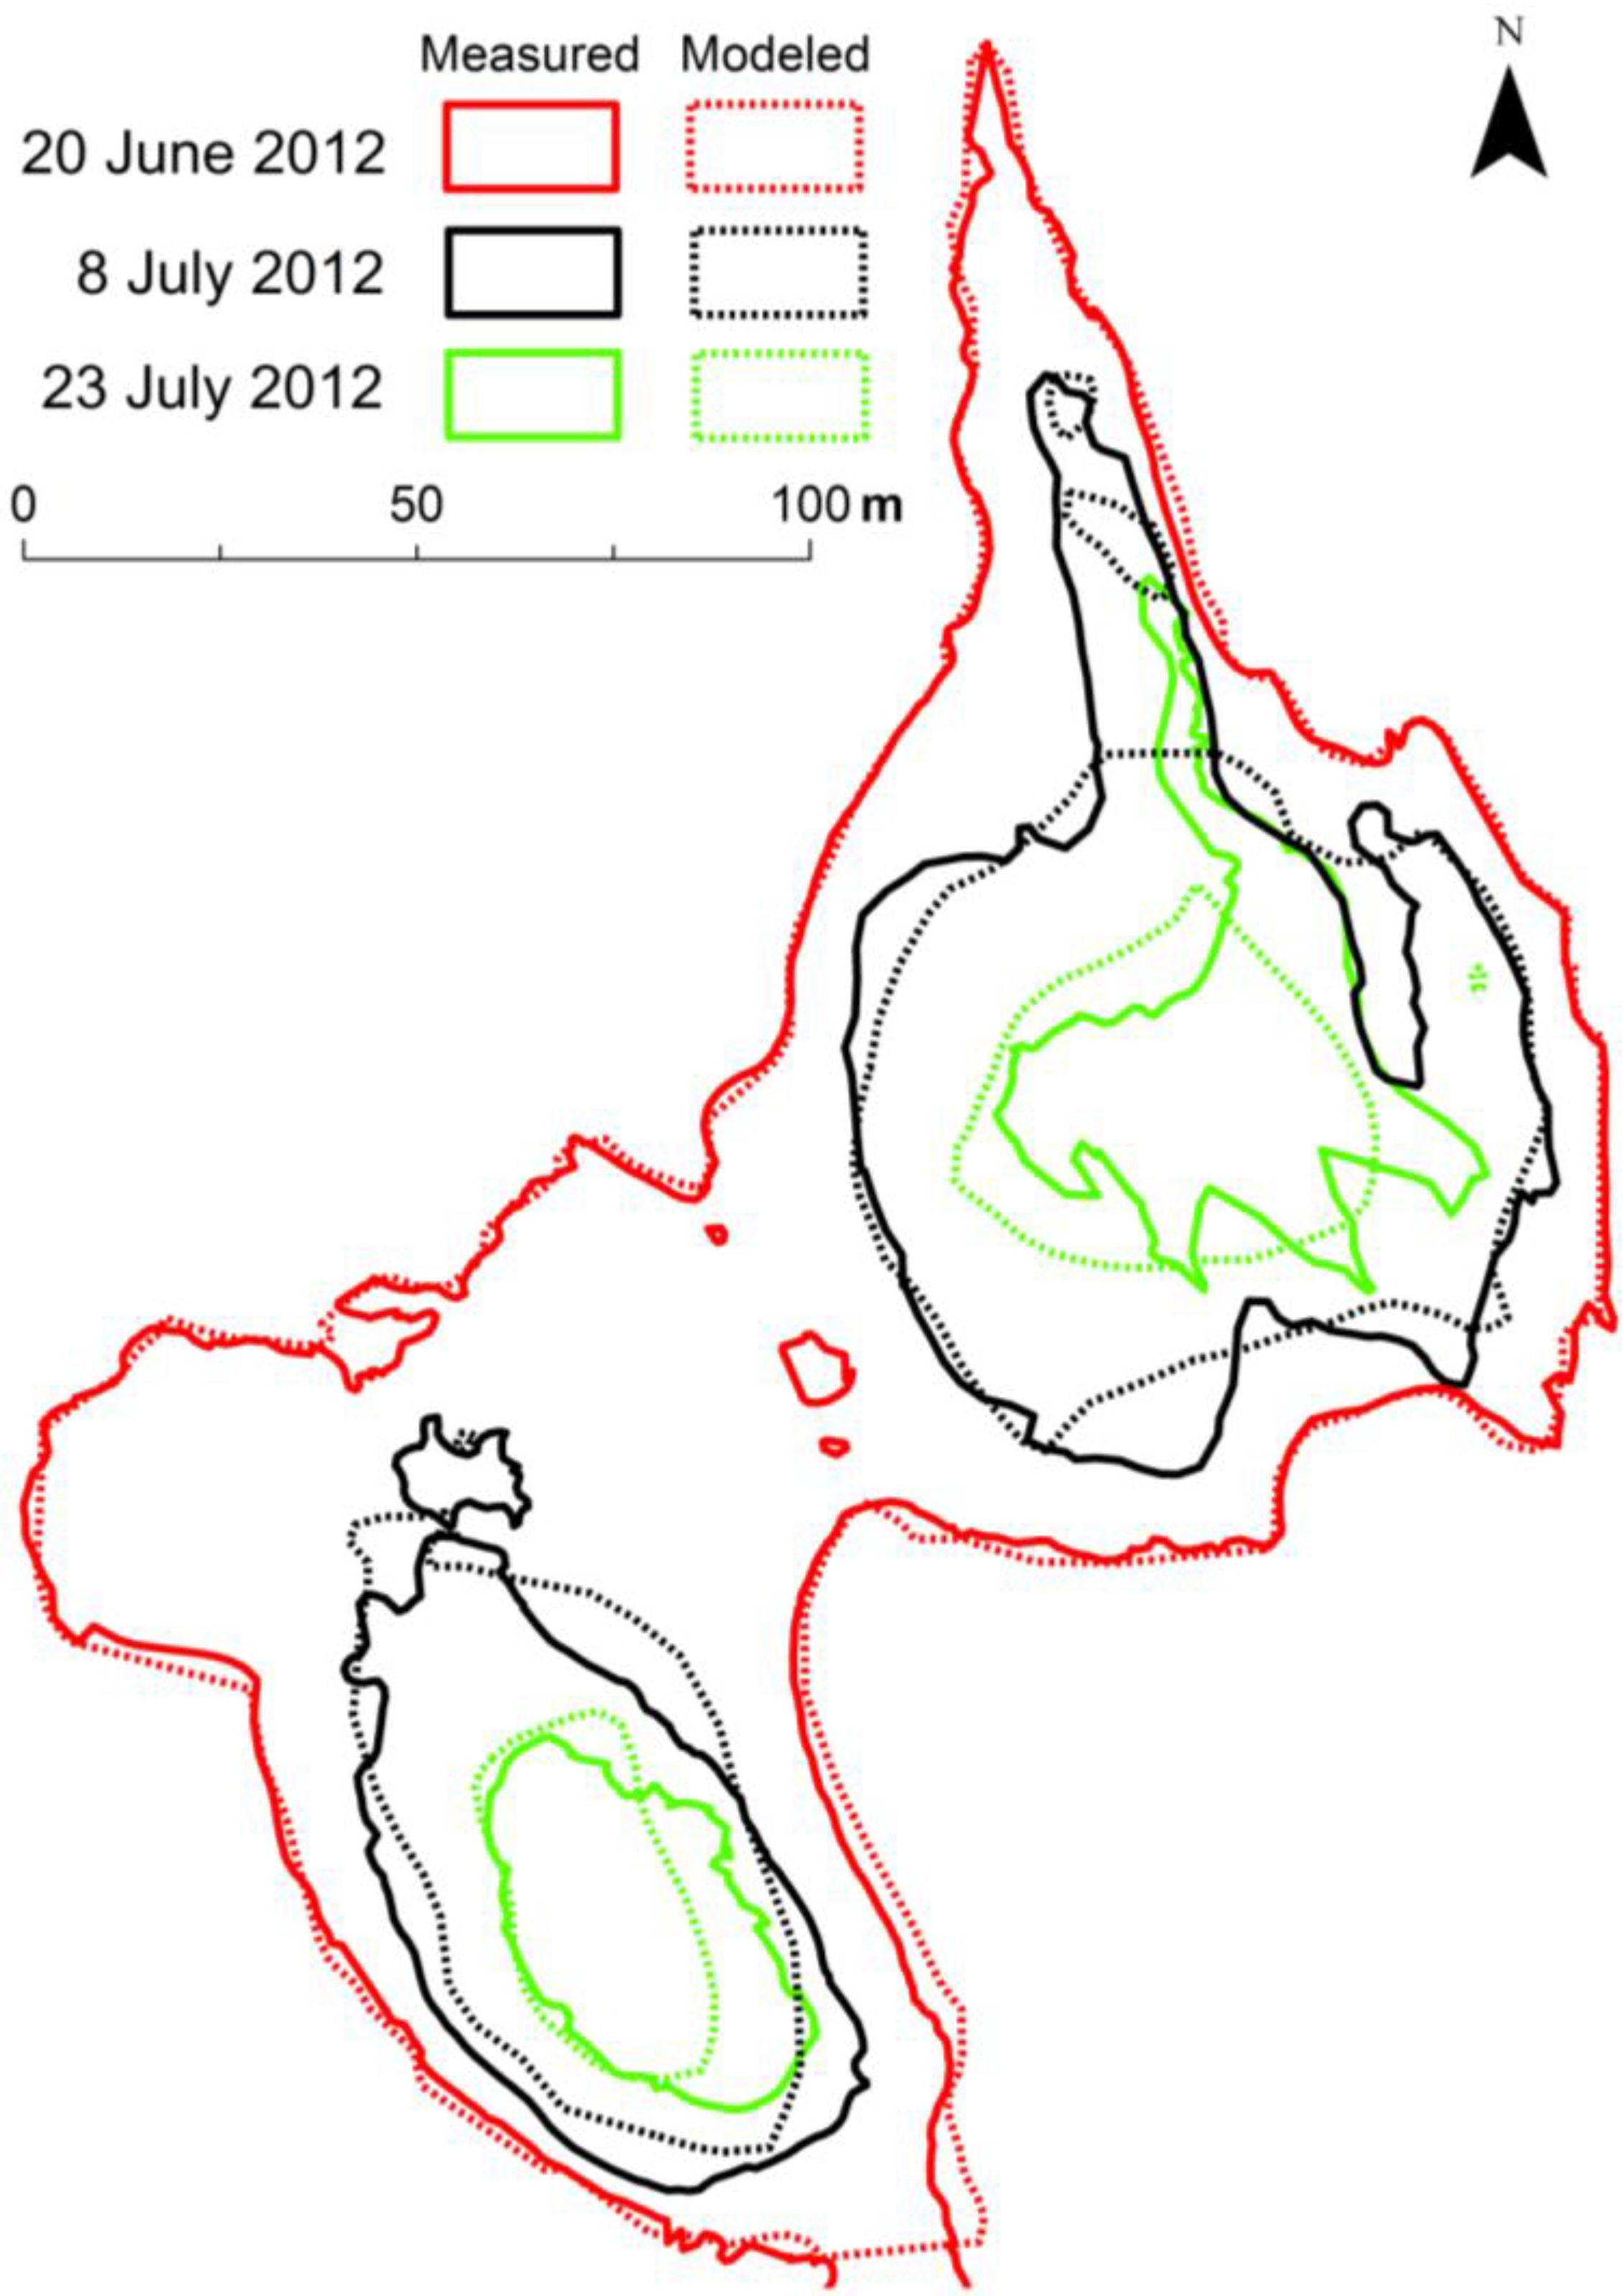
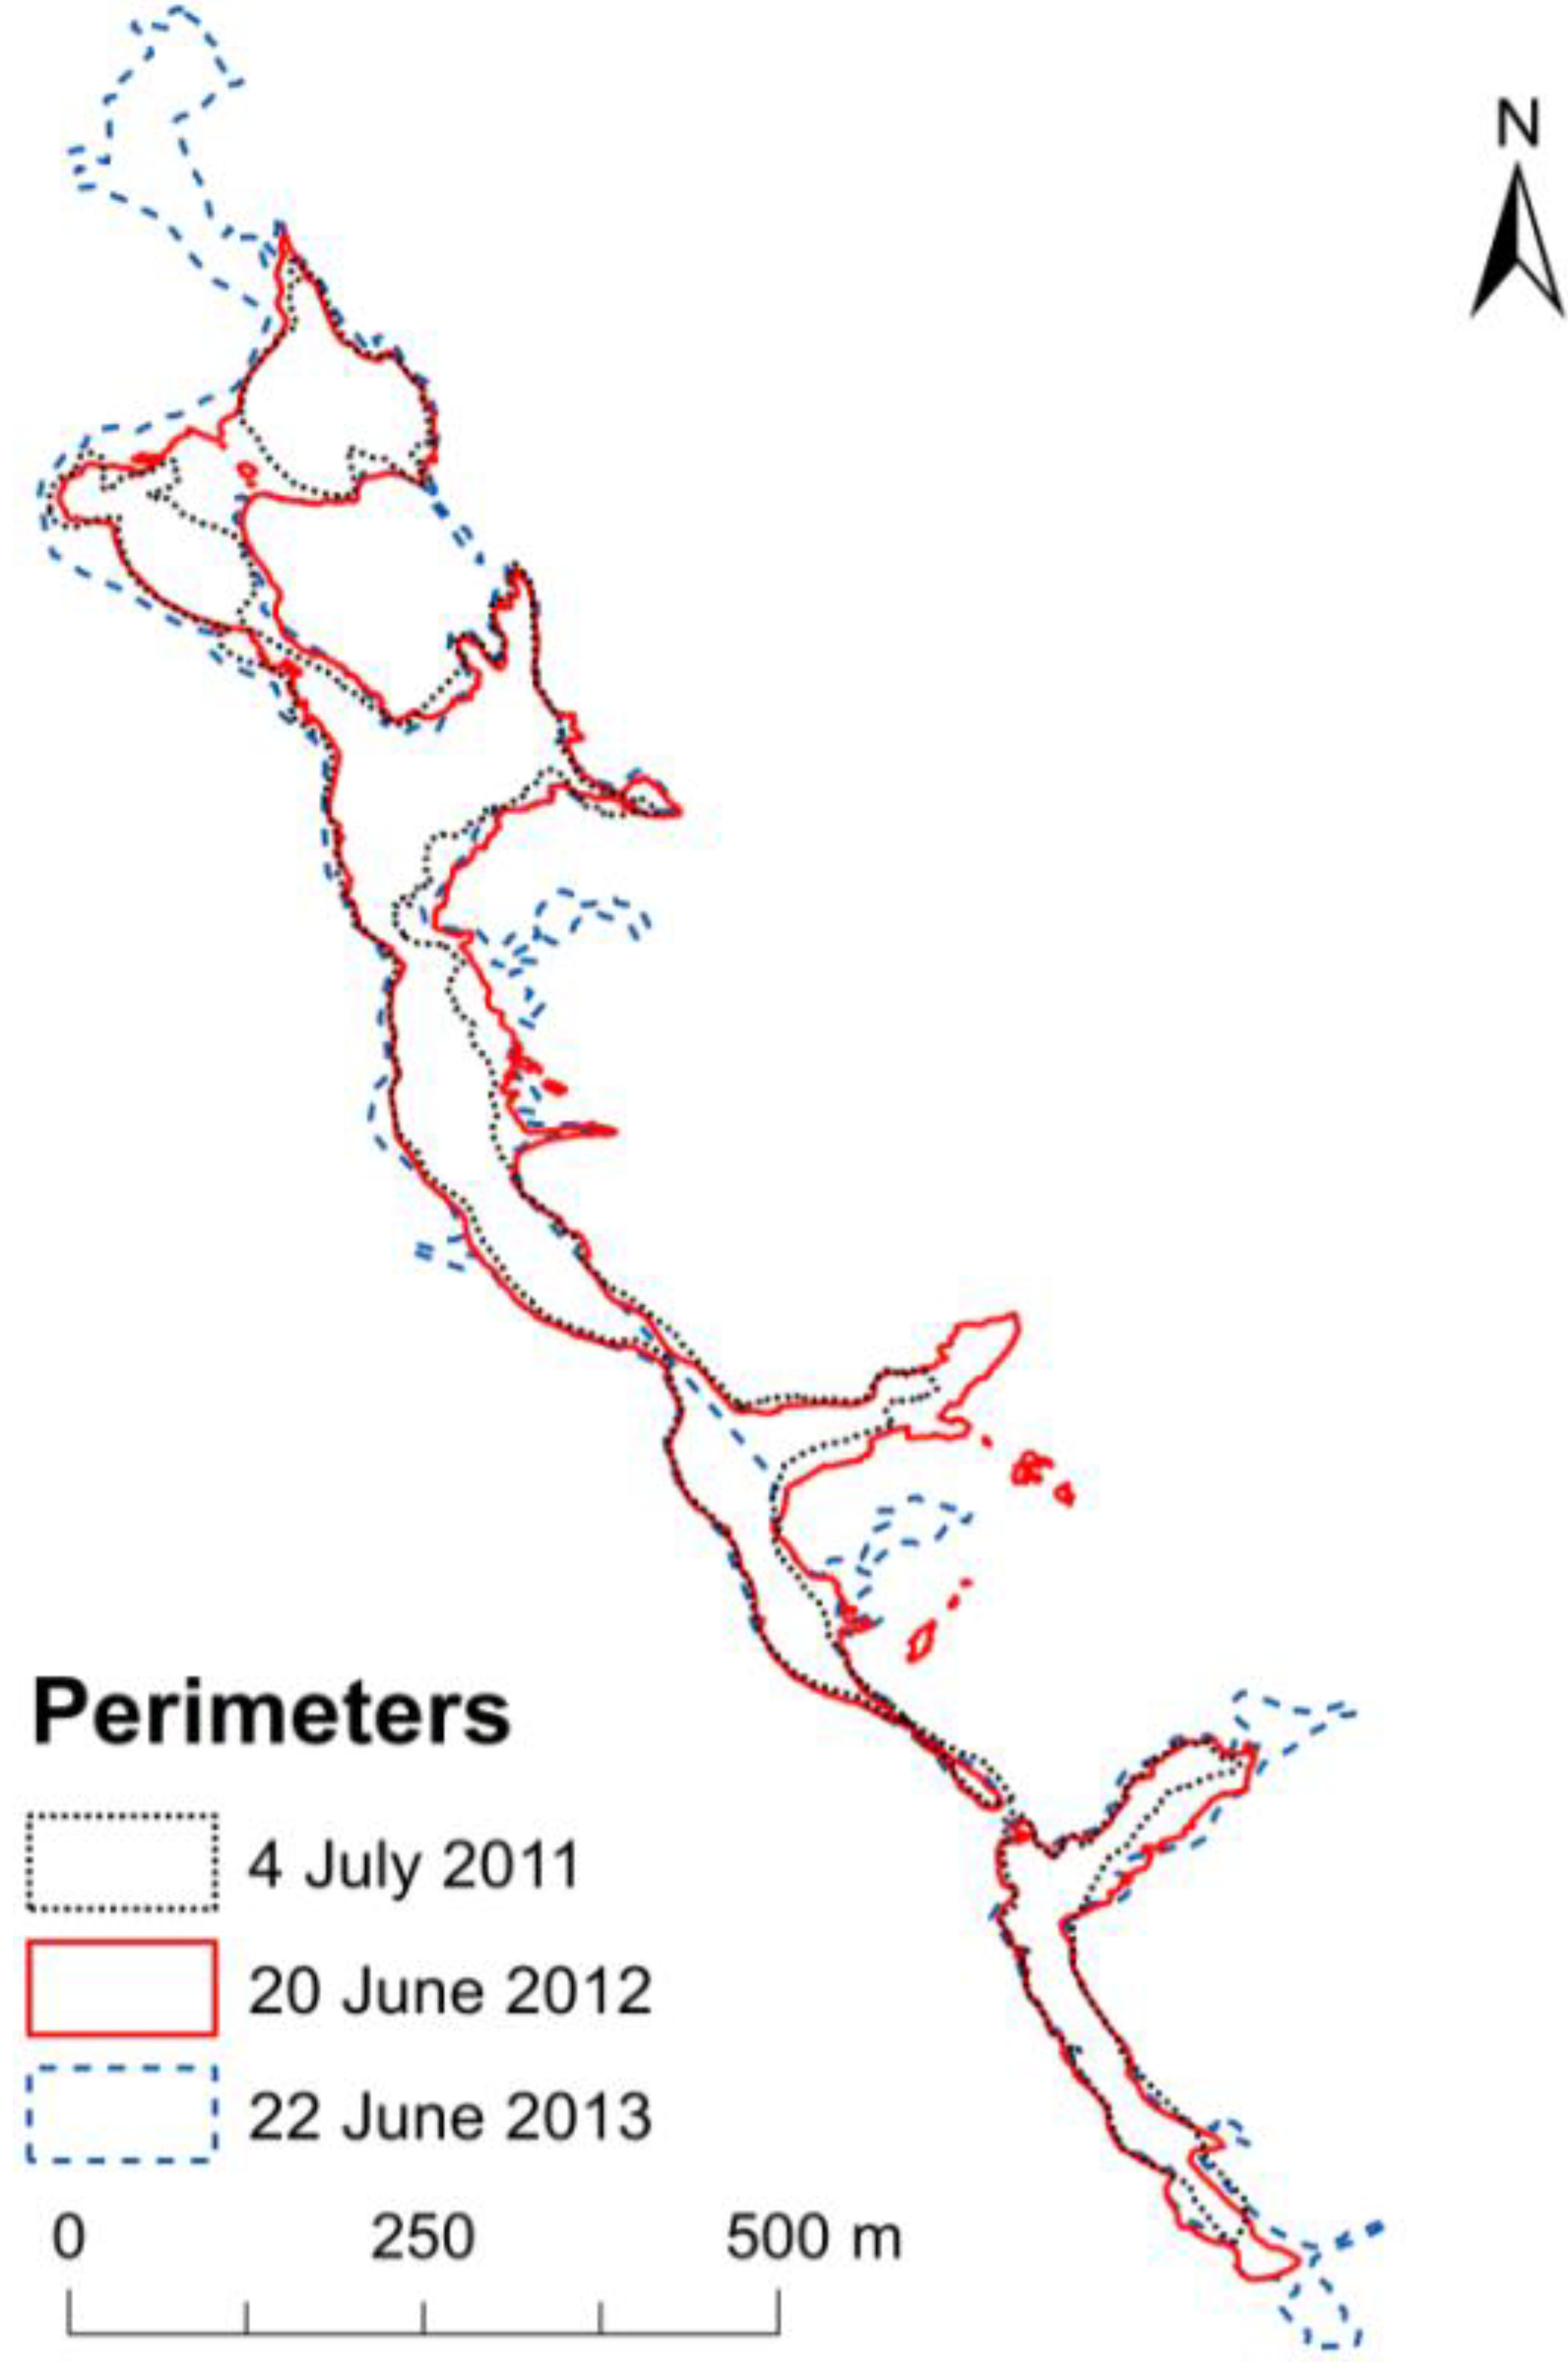
Figure 7 shows the extent of the snow field Level 01 around the end of June in 2011, 2012 and 2013. The repeated GPS-perimeter mappings clearly reveal the annually recurring patterns of snow accumulation on Mount Aragats. This indicates that the processes of snow accumulation during wintertime remain highly similar over the years and that the quantity of snow at a given point in the terrain is primarily determined by its topography defining the amount of snow deposited by wind redistribution. These observations are highly valuable for predicting the distribution of snow accumulation, for planning measures to artificially increase snow depth and for reducing the speed of snow melting.
Figure 7.
A comparison of the perimeters of snow field Level 01 mapped in 2011, 2012 and 2013.
Figure 7.
A comparison of the perimeters of snow field Level 01 mapped in 2011, 2012 and 2013.
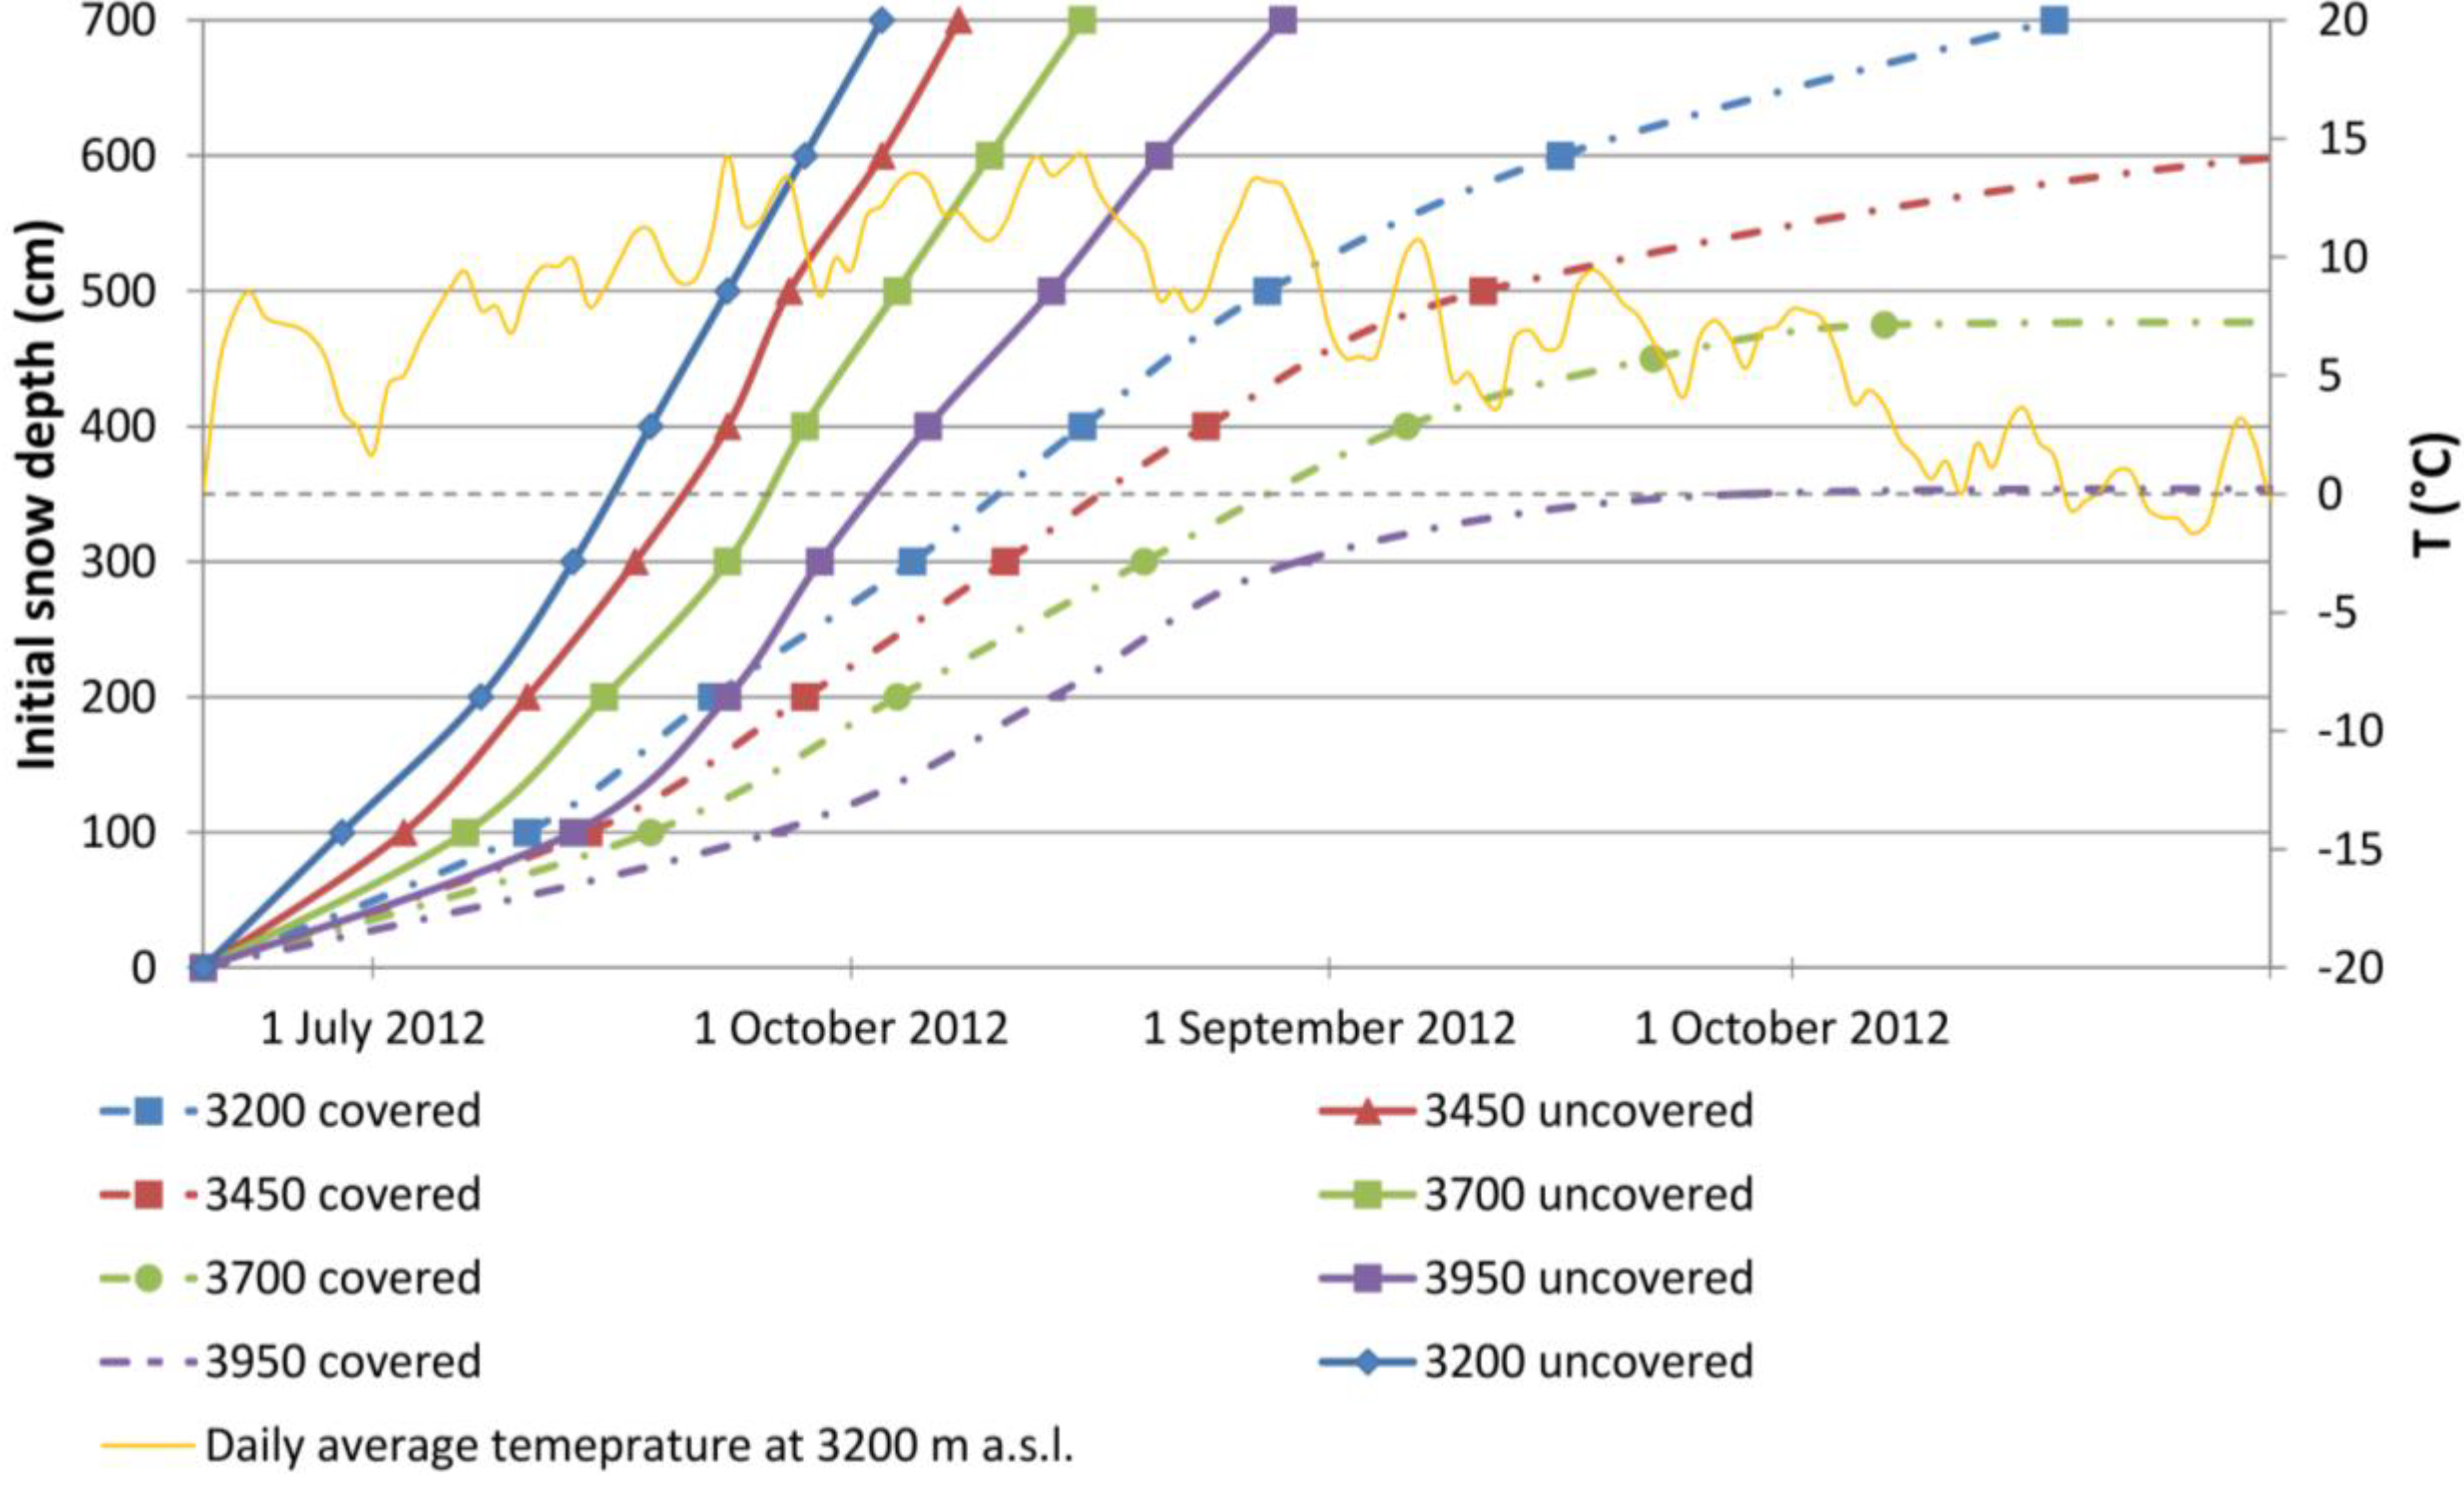
With the aim of quantifying the initial amount of snow required in mid-June to survive the hot summer season in different climatological settings on Mount Aragats, a series of model experiments for a hypothetical snow field are performed. Using observed meteorological data from the year 2012, the model is initialized with a snow depth of [100,200,…,700] cm. This synthetic snow field is placed at an elevation of 3200 m a.s.l. (corresponding to Lake Vishab), at 3450, at 3700 and at 3950 m a.s.l. (corresponding to the summit of Mount Aragats). Snow melt and the date of the ultimate disappearance of the snow was calculated by assuming a natural snow surface exposed to the atmosphere and by applying geotextiles, resulting in reduced melt rates.
Some of the uncertainties introduced by the simplifications in the modeling framework are addressed by calculating snow ablation by using two different approaches to calculate melt (see Methods). Both the temperature-index and the energy balance approach use air temperature as the primary driving parameter, but calculate melt based on different formulas (Equations (1) and (2)).
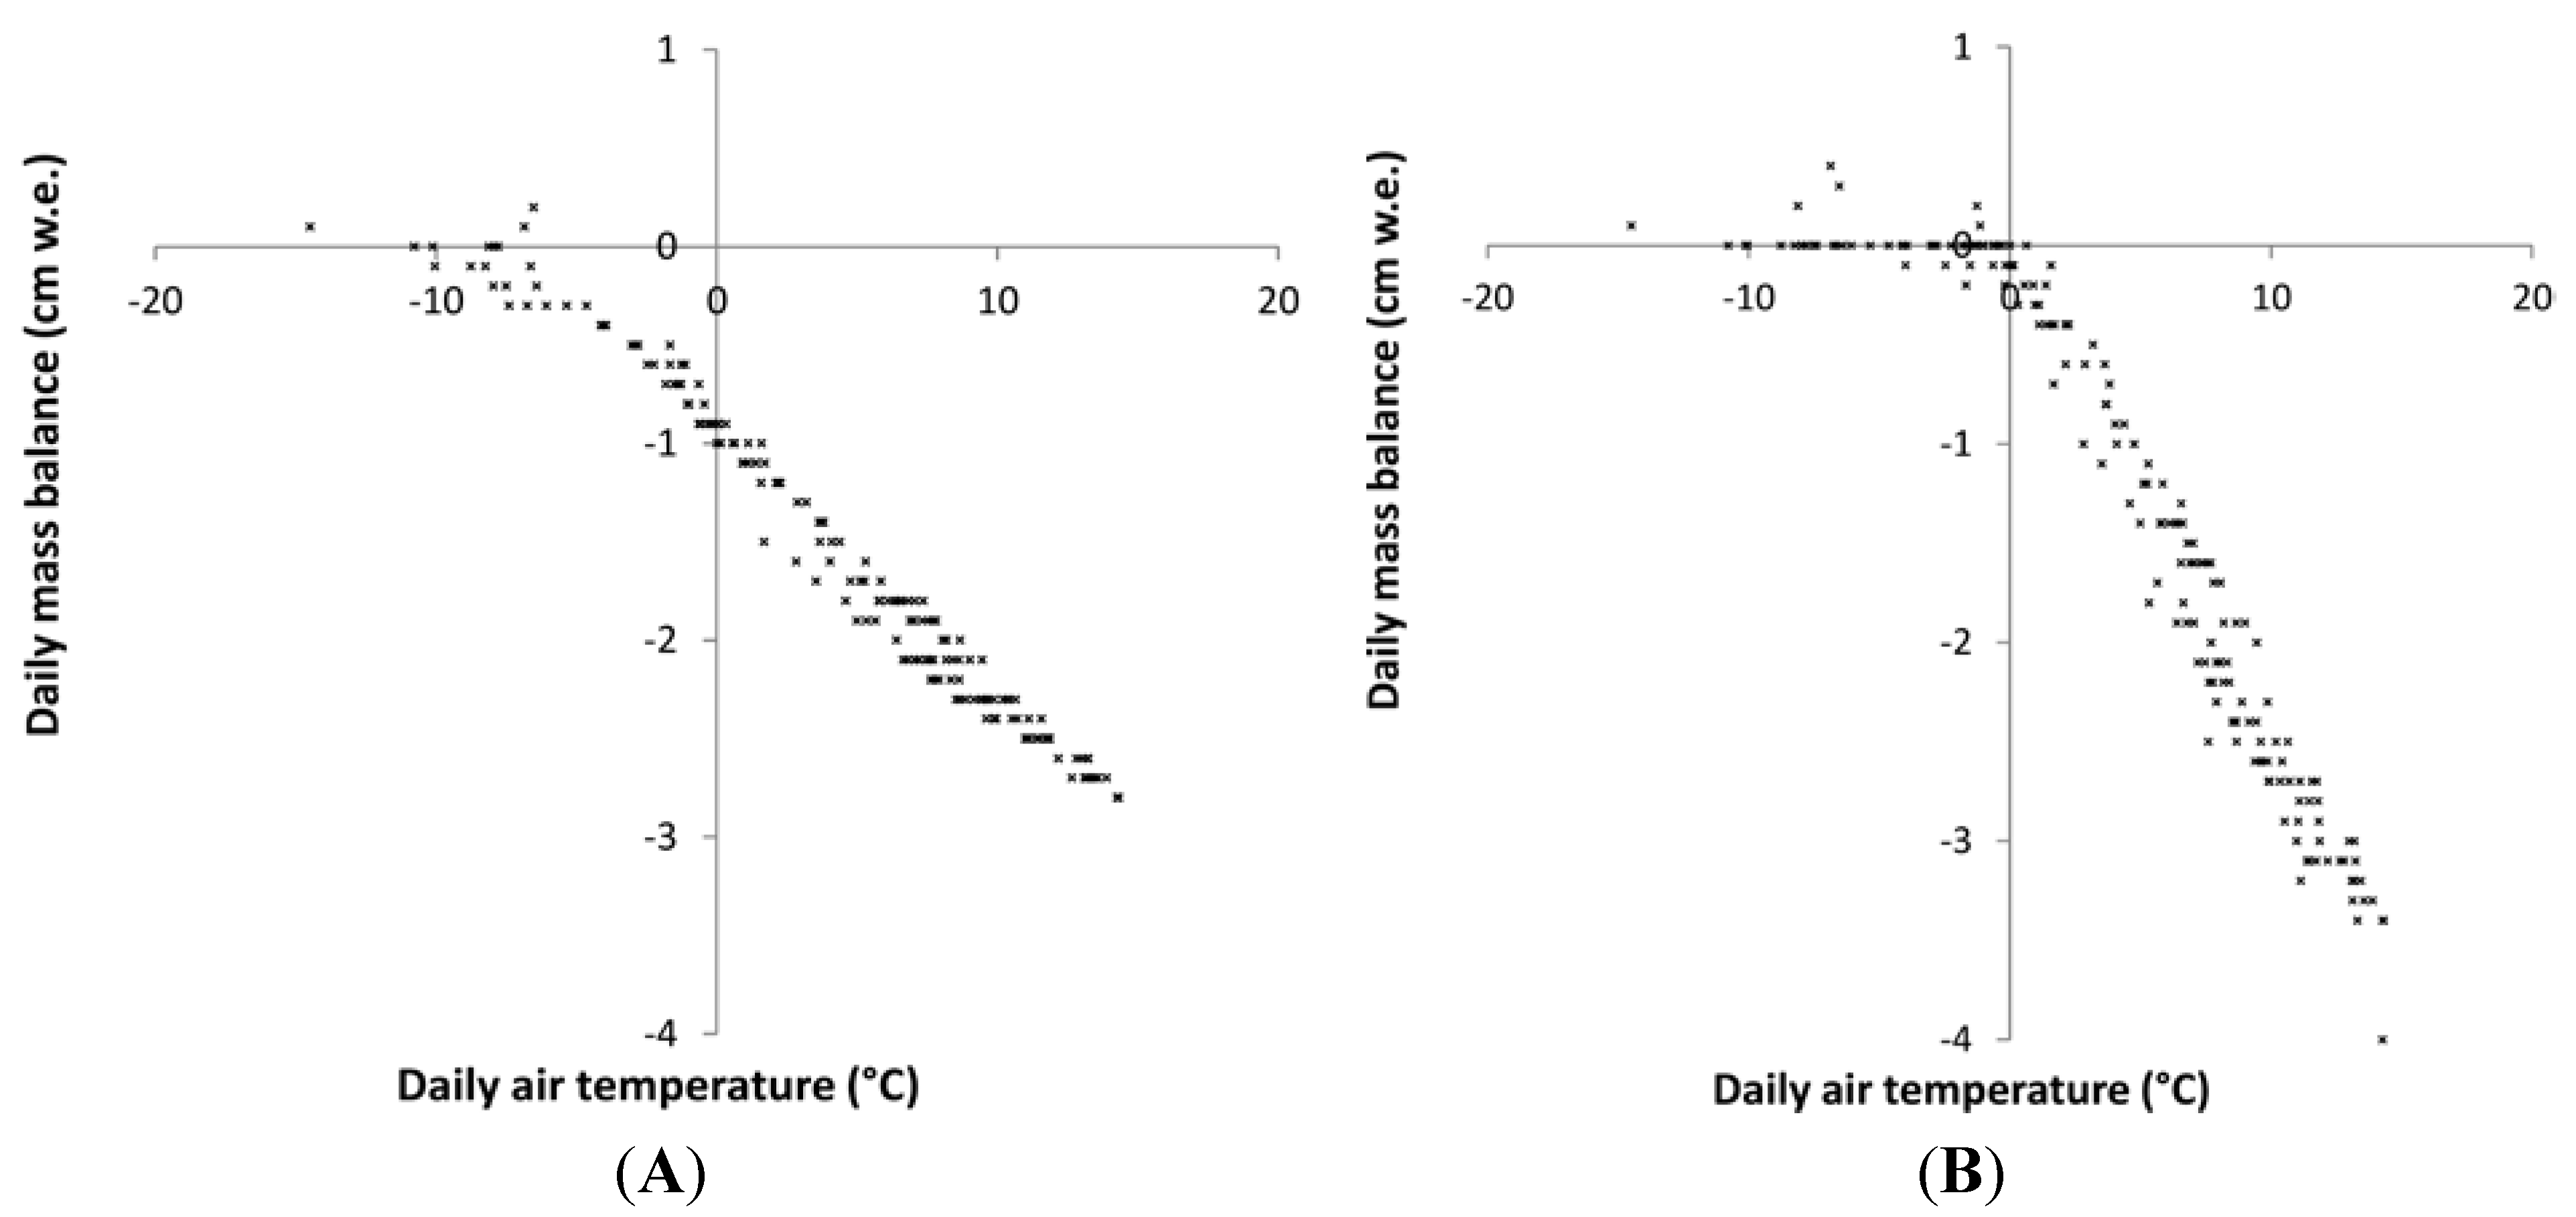
Figure 8 exemplifies the difference between the melt rates simulated by the two models. Whereas the distributed temperature-index model produces no melt below the freezing point, the energy balance model still computes a certain amount of melt with temperatures of <0 °C, due to the high importance of radiative fluxes (Equation (2)). The results of these experiments are shown in
Figure 9 for the temperature-index model and in
Figure 10 for the energy balance model.
At 3200 m a.s.l., snow deposits of a depth of 7 m simulated with the energy balance model last until 6 August,
i.e., they completely disappear after 47 days. If a 7 m-deep snow deposit at 3200 m a.s.l. is covered with geotextiles, it is expected to have completely melted by 16 October (energy-balance model) or by 18 October (temperature-index model). At an elevation of 3950 m a.s.l., snow fields of an initial depth of 7 m are predicted to survive until 27 August with no protection (
Figure 9). Simulations with the temperature-index approach suggest that geotextile-covered snow of a thickness of 3.5 m at 3950 m a.s.l. might persist over the entire summer season, whereas a larger snow depth is required according to the energy balance model (
Figure 10).
Figure 8.
Daily air temperatures and mass balance at 3200 m a.s.l. calculated by (A) the energy-balance model and (B) the distributed temperature-index model.
Figure 8.
Daily air temperatures and mass balance at 3200 m a.s.l. calculated by (A) the energy-balance model and (B) the distributed temperature-index model.
Figure 9.
The survival date (symbols) of snow deposits depending on the initial snow depth on four elevation levels integrating the effects of geotextile coverage modeled with the temperature-index model.
Figure 9.
The survival date (symbols) of snow deposits depending on the initial snow depth on four elevation levels integrating the effects of geotextile coverage modeled with the temperature-index model.
Figure 10.
The survival date (symbols) of snow deposits depending on initial snow depth on four elevation levels integrating the effects of geotextile coverage modeled with the energy-balance model.
Figure 10.
The survival date (symbols) of snow deposits depending on initial snow depth on four elevation levels integrating the effects of geotextile coverage modeled with the energy-balance model.
In the second model experiment, the hydrological impact of geotextile coverage on one specific snow field on Mount Aragats is assessed, for which a variety of field data is available. A part of the snow field Level 01 is selected (
Figure 2A), which has an initial area of 20,000 m² (17 June 2012). The simulation is run assuming a complete coverage of the entire snow field corresponding to 40 times the area actually covered in the field experiments on Vishab in the summers of 2012 and 2013 (see
Figure 4). Consequently, the impact on the hydrological regime is smaller by this factor in the already realized field experiments.
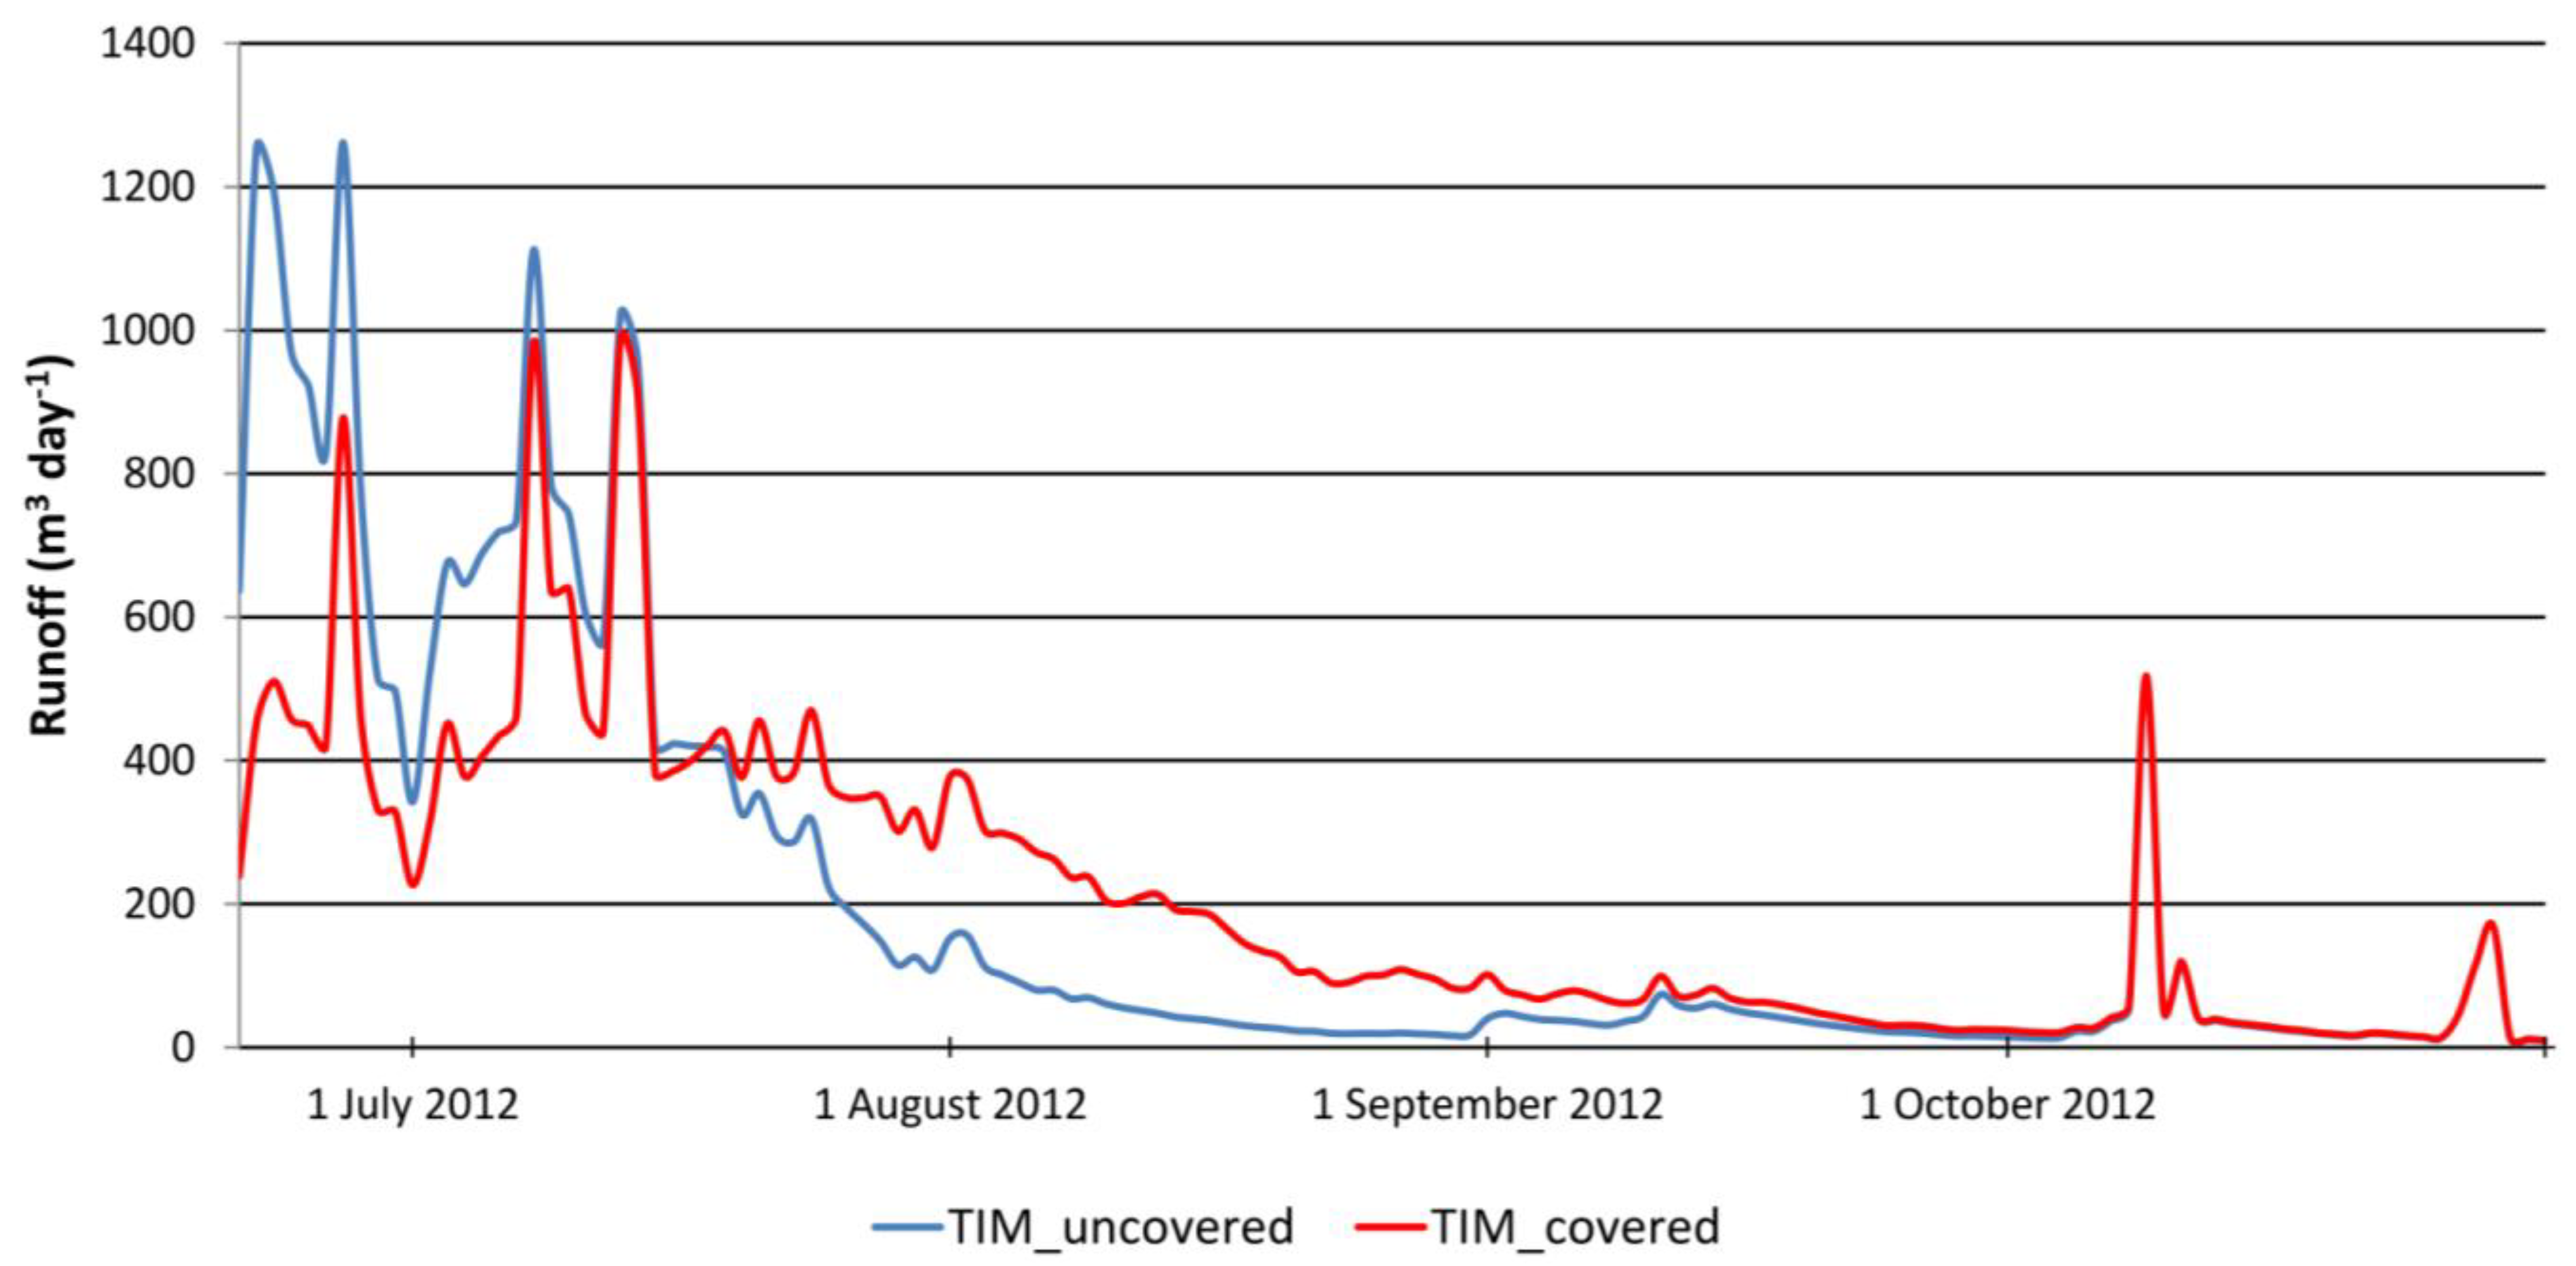
The runoff from the entire area of the snow field is first simulated using GERM driven by the meteorological conditions observed in summer, 2012, without geotextile coverage and is calculated assuming complete coverage in the second model run. The transient changes in surface melt rates, the snow volume and the decrease in the extent of the snow field defining the area susceptible to melting is computed by the model in an hourly time resolution. Differences in calculated runoff between the model runs with and without geotextile coverage can then be directly attributed to water storage and release processes due to artificial intervention.
The differences in runoff due to geotextile coverage are significant indicating the high potential of this method to temporally store and delay snow melt runoff from a few weeks to several months (
Figure 11). At first, the natural runoff from the unprotected snow field is 2–3-times higher than runoff from the protected snow field. After about one month, the uncovered snow field has strongly decreased in size and can no longer provide a significant amount of melt water, whereas the covered snow deposit is still releasing the melt water retained in the form of snow, which has been protected against melting during the warmest period of the summer.
Figure 11.
Daily runoff at 3200 m a.s.l. simulated for covered and uncovered snow surfaces with the temperature-index model (TIM) between 17 June 2012 and 20 October 2012.
Figure 11.
Daily runoff at 3200 m a.s.l. simulated for covered and uncovered snow surfaces with the temperature-index model (TIM) between 17 June 2012 and 20 October 2012.
5. Discussion
The difference between melt calculated on the basis of the temperature-index and the energy balance model at temperatures below 0 °C (
Figure 8) does not seem to have a significant influence on the simulation of uncovered snow deposits, as they are not long-lived enough to be exposed to freezing temperatures before their complete disappearance (
Figure 9 and
Figure 10). Nevertheless, the model results indicate, especially when extrapolated to higher elevations, that the uncertainties introduced by the choice of the model are considerable (
Figure 9 and
Figure 10). The reasons for these uncertainties are due to the simplifications of the model using temperature as the input. None of the actual energy fluxes are measured or physically modeled. However, a reliable basis for validation is lacking for these cases.
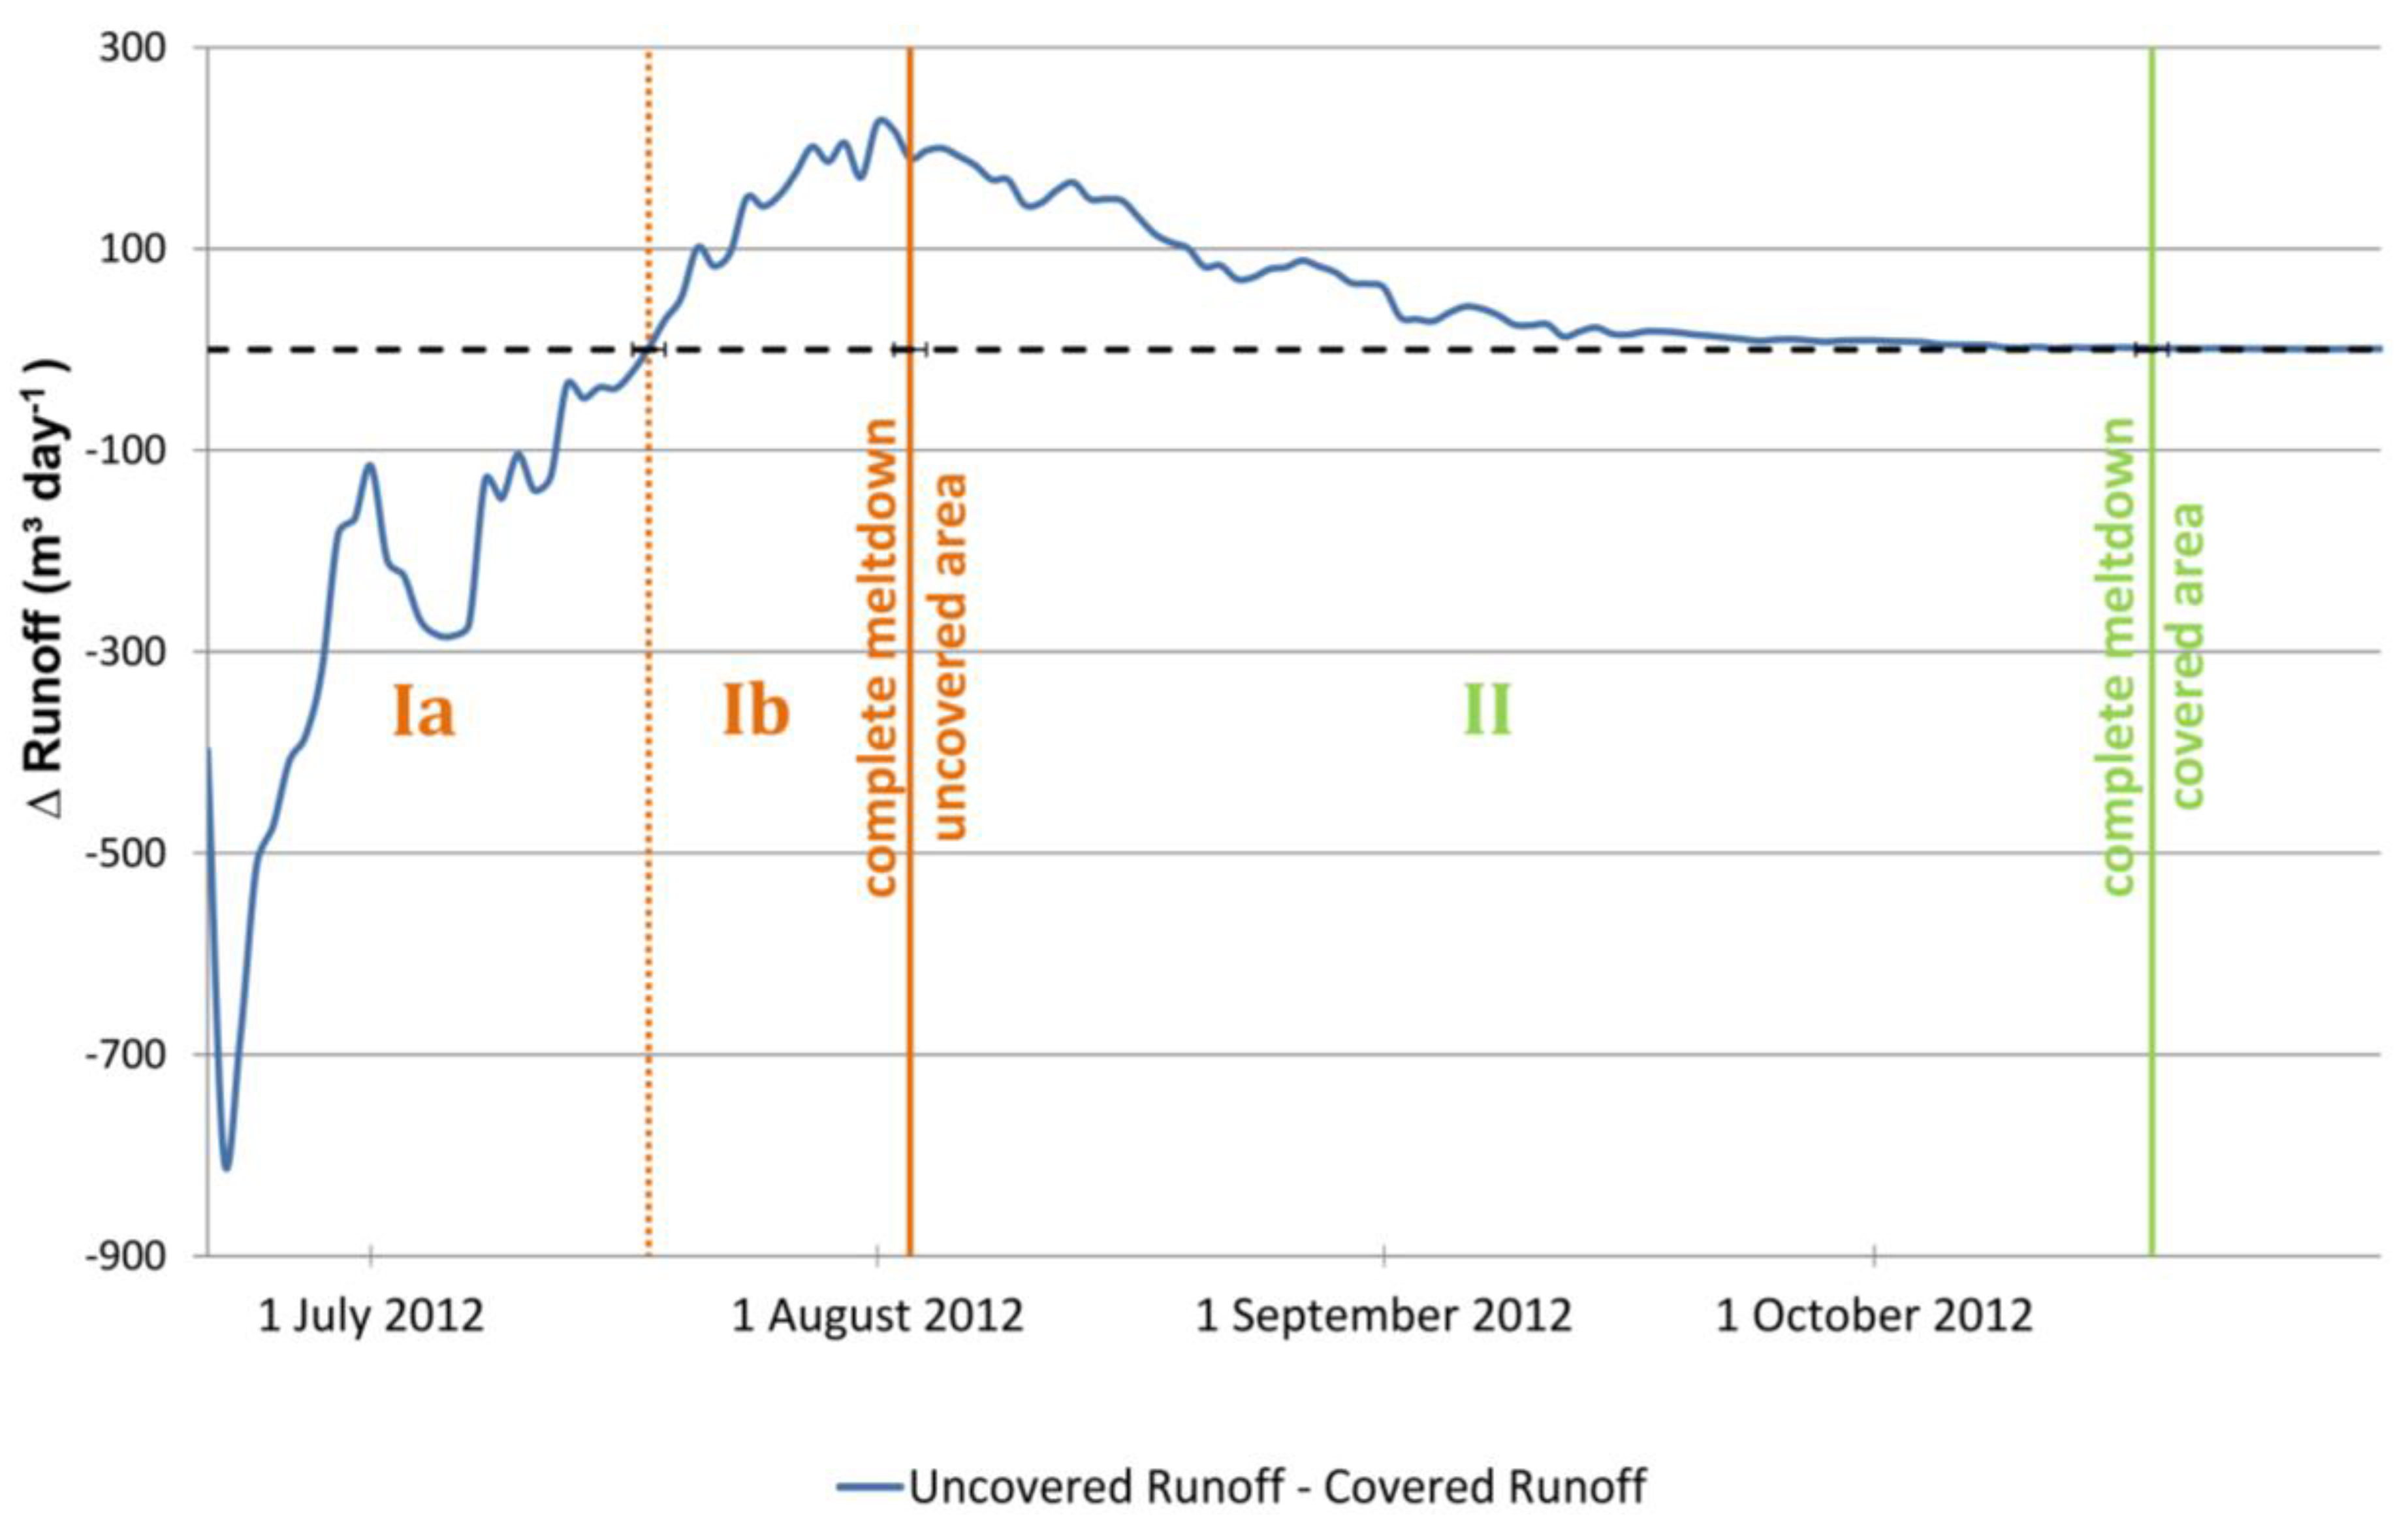
In order to illustrate the magnitude of the direct impact on runoff caused by the application of geotextiles, the difference between simulated discharge from the covered and the uncovered snow field Level 01 is visualized in
Figure 12. Three phases are discernible that characterize the runoff effect of geotextiles: during the first phase (Ia), runoff from the unprotected snow surface is up to 800 m³∙day
−1 larger than that from geotextile-covered snow. This rate corresponds to the quantity of water stored due to the application of measures protecting the snow against melting. Assuming a melt reduction of 57% based on direct measurements (
Figure 6) and an average snow density of 600 kg∙m
−3, one square meter of geotextile is capable of saving up to 0.04 m³ of water per day. The runoff surplus, however, rapidly decreases as a result of the, in relative terms, faster shrinkage of the unprotected snow field until, at one point, more runoff is generated from snow melt of the geotextile-covered area, which is significantly larger, but shows smaller specific melt rates. The surplus of melt water from the covered snow surface grows (Phase Ib) until uncovered snow accumulations have completely disappeared. This corresponds to the point at which geotextiles show their maximum effect. In this case the model still predicts a maximum runoff of about 200 m³∙day
−1 from an area of 20,000 m². During the continuous decay of the snow fields, runoff rates decrease (Phase II) until all snow has disappeared.
Figure 12.
Difference between runoff from a covered and an uncovered snow field on 3200 m a.s.l. simulated with the distributed temperature-index model.
Figure 12.
Difference between runoff from a covered and an uncovered snow field on 3200 m a.s.l. simulated with the distributed temperature-index model.
The parameters defining the geotextile’s effectiveness do not remain constant in time. Especially the surface albedo of the textile may change considerably due to contaminations with soot or dust after being used one or two seasons [
27]. As the albedo is the most important feature of a geotextile in terms of melt reduction, a decrease in albedo would diminish the protective properties significantly. Assuming a substantial contamination of the geotextile, an additional model experiment was performed by calculating runoff beneath a 50% less effective geotextile (
i.e.,
fcovered = 0.71). This leads to a considerably reduced water saving capacity and yields a water storage of about 100 m³ per day from an area of 20,000 m² at the point of the maximum effect of the geotextile. Although multi-seasonal measurements are not available, it can be assumed that the geotextile’s reflectivity would suffer from being used for further seasons. Thus, a regular cleansing of the textile’s surface is advised.
The artificial management of snow melt with the help of the application of geotextiles represents an efficient way to temporally store water in the form of snow, delay snow melting during the hottest part of the year and release the melt water in late summer when water is often most urgently needed in the lowlands. Compared to the present numerical model experiment, the snow surface covered during the field experiments in 2012 and 2013 was, however, significantly smaller, and a maximum runoff effect of 5–7 m³∙day−1 in late July is estimated.
6. Conclusions
In the course of three consecutive field visits in 2011, 2012 and 2013, glaciological data were gathered by evaluating snow preservation activities performed in the context of the Swiss-Armenian joint venture project, Freezwater. Ablation measurements showed a melt-reducing capacity of geotextiles of more than 50%. The evolution of snow deposits, the efficiency of snow preserving methods and the resulting impact on runoff generation were simulated using the glacio-hydrological model, GERM. Calculations were performed based both on an energy-balance approach and a distributed temperature-index approach.
Both models agree in their statement that snow fields on Mount Aragats are unlikely to survive the hot summer without protective measures, regardless of their topographical location or elevation. Snow deposits of a depth of 7 m, at 3200 m a.s.l., covered in mid-June, are expected to persist until October. It is shown that a noteworthy change in the hydrological regime can be achieved by artificially covering the snow surface with geotextiles. Whereas less melt water runoff occurs during June and July, significantly higher runoff is generated in late summer when uncovered snow accumulations have already completely disappeared. However, coverage at a large scale is necessary to achieve an effect relevant for water supply, irrigation or hydropower production.
The artificial management of snow accumulation and snow melt supports and increases the natural storage capacities of winter snow deposits at high elevations and, therefore, might represent a valuable, non-invasive technique for efficiently delaying water runoff from one to a few months, so that it occurs during the driest period of the year. Related to ongoing climate change, we anticipate an increasing interest in snow management techniques in Armenia and worldwide, as strong shifts in the runoff regime of snow and ice-fed streams are expected.


