Article

Identifying Sources and Assessing Potential Risk of Exposure to Heavy Metals and Hazardous Materials in Mining Areas: The Case Study of Panasqueira Mine (Central Portugal) as an Example

by
Carla Candeias
1,*,
Eduardo Ferreira Da Silva
1,
Paula F. Ávila
2 and
João Paulo Teixeira
3
1
GeoBioTec—Geobiosciences, Geotechnologies e Geoengineering Research Center, Geosciences Department, University of Aveiro, Campus de Santiago, Aveiro 3810-193, Portugal
2
LNEG—National Laboratory of Energy and Geology, Rua da Amieira, Apartado 1089, S. Mamede de Infesta 4466-901, Portugal
3
Environmental Health Department, National Institute of Health, Rua Alexandre Herculano, 321, Porto 4000-055, Portugal
*
Author to whom correspondence should be addressed.
Geosciences 2014, 4(4), 240-268; https://doi.org/10.3390/geosciences4040240
Submission received: 10 June 2014 / Revised: 15 September 2014 / Accepted: 17 September 2014 / Published: 26 September 2014
(This article belongs to the Special Issue Medical Geology: Impacts of the Natural Environment on Public Health)

Abstract

:
The Sn-W Panasqueira mine, in activity since the mid-1890s, is one of the most important economic deposits in the world. Arsenopyrite is the main mineral present as well as rejected waste sulphide. The long history is testified by the presence of a huge amount of tailings, which release considerable quantities of heavy metal(loid)s into the environment. This work assesses soil contamination and evaluates the ecological and human health risks due to exposure to hazardous materials. The metal assemblage identified in soil (Ag-As-Bi-Cd-Cu-W-Zn; potentially toxic elements (PTEs)) reflects the influence of the tailings, due to several agents including aerial dispersion. PTEs and pH display a positive correlation confirming that heavy metal mobility is directly related to pH and, therefore, affects their availability. The estimated contamination factor classified 92.6% of soil samples as moderately to ultra-highly polluted. The spatial distribution of the potential ecological risk index classified the topsoil as being of a very high ecological risk, consistent with wind direction. Non-carcinogenic hazard of topsoil, for children (1–6 years), showed that for As the non-carcinogenic hazard represents a high health risk. The carcinogenic risks, both for children and adult alike, reveal a very high cancer risk mostly due to As ingestion.

1. Introduction

Mine tailings, with considerable amounts of sulfides, left in the vicinity of environmentally sensitive locations, constitute one of the greatest threats to the surrounding environment. These materials when exposed to air and water are oxidized through chemical, electrochemical, and biological reactions, forming ferric hydroxides and sulfuric acid, leading to the generation of acid mine drainage with high contents of metals and sulfates, related to the alteration of sulfides, the equilibrium of which depends on their solubility [1,2,3,4,5].
Soil is prone to contamination both from hydrological and atmospheric sources. When soil is the receptor of tailings drainage, originating from metal mining and smelting, this waste disposal causes a major impact, and poses serious environmental concerns [6]. As a direct result of the mining activities, soil is generally, affected over a considerable area. The soil fine fraction is usually enriched in metals, due to the relative large surface area of fine particles that facilitate adsorption and metal binding to iron and manganese oxides and to organic matter [7,8]. Wind-blown dust originating from polluted soil is responsible for the aerial dispersion of trace metals [7]. Exposure to these hazardous elements may have different pathways, e.g., through the direct ingestion of soils and dust, ingestion of vegetables grown on contaminated soil or dust adhering to plants or dust inhalation. According to several authors [9,10,11,12,13,14] the studies dealing with the bioavailability and bioaccessibility of metal(loid) contaminants in highly-polluted soil are extremely useful to understand the possible effect on biota, and particularly on human health due to the exposure to these contaminants [12,15].
Among the purposes of environmental analysis are the determination of the geochemical background and natural concentrations of the chemical constituents in environment-background monitoring, as well as to determine the concentration of harmful pollutants in environment-pollution monitoring [16]. The sorption-desorption soil characteristics generally control the mobility and availability of heavy metals [17]. Heavy metal availability in soil depends on a number of factors, including Soil Organic Matter (SOM) and pH [18]. Soil pH plays the most important role in determining metal speciation, solubility from mineral surfaces, movement and bioavailability of metals [19,20,21]. Several laboratory experiments have shown that heavy metal mobility and availability have a negative correlation with pH [22]. Further, [23,24,25] documented that metal mobility and availability increases with the decrease of soil pH, thus enhancing the uptake of heavy metals by plants and, thereby, posing a threat to human health [26].
Exposure to increasing amounts of metal(loid)s in environmental and occupational settings is a reality worldwide, affecting a significant number of individuals. Most metal(loid)s are very toxic to living organisms and even those considered as essential can be toxic when in excess. They can disturb important biochemical processes, constituting an important threat for human health. Major health effects include development retardation, endocrine disruption, kidney damage, immunological and neurological effects, and several types of cancer [27]. The identification of potential threats to human health and natural ecosystems is useful information [16]. The quantification of all the types of risks and the determination of the total risk of metal(loid)s to the exposed population through oral intake, inhalation and dermal contact [28] is also very important. Risk assessment is typically a multistep process of identifying, defining, and characterizing potentially adverse consequences of exposure to hazardous materials [28]. According to the Toxic Substances Portal [29], Ag, As, Cd, Cu, W and Zn are known to be toxic to humans, while arsenic and cadmium are classified as human carcinogens. Some studies also consider that Bi causes acute toxicity, and large doses can be fatal [30,31]. However, as Bi is considered to be one of the less toxic heavy metals, it is not included in this analysis.
In a previous paper from the same authors [32], several variables (Ag, As, Bi, Cd, Cu, W and Zn) showed moderate to strong correlation in the Panasqueira topsoil. This indicates an anthropogenic origin, especially linked to aerial transportation and deposition and/or to a geogenic origin. The main goals of the present study are: (a) establishment of the relationship between Potentially Toxic Elements (PTEs) with depth and soil pH; (b) assessment of soil contamination using a contamination factor for each pollutant; and (c) determination and evaluation of the ecological and human health risks due to exposure to hazardous materials.

2. Materials and Methods

2.1. Study Area

The active Panasqueira mine, exploited since the last decade of the 19th century, is located in Central Portugal (UTM (Universal Transverse Mercator) 29N, P 4445620.79, M 606697.31; Figure 1). It is considered to have the largest Sn-W deposit of Western Europe [33]. The geology has been extensively studied by many researchers [34,35,36,37,38,39,40,41,42,43,44]. Briefly, the Panasqueira deposit is a classic example of postmagmatic hydrothermal ore deposit, which is associated with Hercynian plutonism [36,41]. The paragenesis is complex with four stages of mineral formation identified: 1st stage, the oxide silicate phase (quartz, wolframite; cassiterite); 2nd phase, the main sulphide phase (pyrite, arsenopyrite, pyrrhotite, sphalerite, chalcopyrite); 3rd stage, the pyrrhotite alteration phase (marcasite, siderite, galena, Pb-Bi-Ag sulphosalts); and 4th stage, the late carbonate phase (dolomite, calcite) [38,39,40,41,42,43,44,45,46,47,48,49]. The Panasqueira deposit contains significant amounts of wolframite, arsenopyrite, chalcopyrite and cassiterite [34].
The long history of exploitation is testified by the presence of a huge amount of tailings and other debris (Figure 1b). The piles (Rio ~1.2 million m3; Barroca Grande ~7.0 million m3) and the mud dams (Rio ~0.7 million m3; Barroca Grande ~1.2 million m3) are exposed to atmospheric conditions, and are being altered by chemical, physical and geotechnical activities. On the top of the Rio tailings, an arsenopyrite stockpile (~9400 m3) was deposited and remained exposed until 2006 [41].
Topography ranges in altitude from 350 to 1080 m [47], with deep valleys of about 9%–25% inclination, constraining the soil into a very thin layer. Climate is severe, with dry and hot summers and very cold, rainy and windy winters. The annual precipitation ranges between 1200 and 1400 mm with frequent snow falls, particularly above 700 m altitude. The mean annual temperature is 12 °C, ranging from 0 °C during the winter to 30 °C in the summer. The streams are generally dry in the summer and flooded in the winter. The prevailing wind in the area is NW-SE, with mean wind speeds of 4.22 m/s (h = 10 m), 5.55 m/s (h = 40 m) and 6.21 m/s (h = 80 m) (Figure 1c) [48,49,50]. The small villages around the mine have a historical dependence on soil and water use drinking water, agriculture, cattle rearing, fishing and forestry.
Figure 1. (a) Synthetic map of Portugal showing the location of Panasqueira mining area; (b) details of the study area, main geological units and soil samples grid - geological map adapted from [34,41,45]; (c) wind rose of the prevailing winds on the top of the mine (Barroca Grande tailing); and (d) on the top of a mountain 800 m north of the mine [46].
Geosciences 04 00240 g001

2.2. Field Sampling and Sample Preparation

Soil samples were collected according to a predefined grid (spaced ~400 m—Figure 1b). Two types of soil samples were collected at each sampling site: 122 topsoil (0–15 cm) samples and 116 subsoil samples collected below 15 cm depth. The difference in the total number of samples of each soil type is due to the presence at six sites of incipient and thin lithic soil derived from a substrate of metasediments. Topsoil samples were collected for the characterization of superficial contamination derived from the tailings, and subsoil samples to assess the extent of contamination at depth and simultaneously to identify geogenic markers. Approximately 50% of all samples were collected in duplicate. To establish the local geochemical background, 47 unaffected soil samples (Bk) were also collected outside the contaminated area (Casegas area located NE, out of the influence of the Barroca Grande prevailing winds). The coordinates of each sample were determined by GPS and georeferenced with UTM (Universal Transverse Mercator) coordinates. All soil samples were collected after clearing the soil surface of superficial debris and vegetation, and placed in polyethylene bags. Samples were dried in a thermostatically controlled oven at 40 °C, disaggregated in a porcelain mortar, sieved (<2 mm), homogenized, split into aliquots and the analytical aliquot pulverized to <170 µm in a pre-cleaned mechanical agate mill for chemical analysis.

2.3. Chemical Analysis

Soil samples were submitted for multi-element analysis at the ACME Analytical Laboratories, which is an ISO 9002 Accredited Lab (Vancouver, Canada). A sample weight of 0.5 g was leached in hot (95 °C) aqua regia (HCl-HNO3-H2O), and concentrations were determined by Inductively Coupled Plasma Mass Spectrometry (ICP-MS) for Ag, As, Bi, Cd, Cu, W and Zn (detection limits of Ag, Bi, Cd, Cu, W < 0.1 mg·kg−1; As < 0.5 mg·kg−1; Zn < 1 mg·kg−1).
Accuracy and analytical precision were determined using analytical results of certified reference materials (standards C3 and G-2) and duplicate samples in each analytical batch. The results were within the 95% confidence limits of the recommended values given for the certified materials. The Relative Standard Deviation (RSD) was between 5% and 10%.
Soil pH: numerous studies have verified that soil pH has a great effect on metal bioavailability [16,51,52]. The pH gives an indication of the acidity and alkalinity of soil. Many chemical reactions are pH dependent, and knowledge of the pH enables the prediction of the extent and speed of chemical reactions [53]. The procedure adopted for the determination of pH was modified from [54]. A suspension of soil was made up in five times its volume of a 0.01 mol/L solution of calcium chloride (CaCl2) in water. The pH was measured using a calibrated pH-meter.
SOM: plays an important role in determining the fate of inorganic, as well as organic compounds in natural soil [55,56,57,58]. SOM can be roughly determined by measuring weight loss before and after ashing at 430 °C. Results are typically accurate to 1%–2% for soil with over 10% organic matter [53]. The procedure adopted was modified from [53]. Approximately 5 g of each sieved sample (<2 mm) was placed in a crucible and dried at 105 °C for 24 h. After cooling in a glass desiccator its weight was determined in a mass balance (resolution 0.001 g). The difference in weight gives the water content of each soil sample. The crucibles were then placed in a muffle furnace at 430 °C for 20 h. After cooling in a glass desiccator, the weight was measured on the same mass balance. The difference from the dry state gives the soil organic content (%).

2.4. Data Treatment of Data

Pearson’s product-moment linear correlation coefficient matrix (r) was estimated in order to determine the extent of the relationship between the PTEs, pH and SOM [53]. The normality of statistical distribution of all data was verified by the Kolmogorov-Smirnov test (α = 0.05) and Q-Q plots. The non-normal data were subjected to a non-parametric test or converted logarithmically to ensure the validity of the results. The statistical analysis was performed using Six Sigma Statistica® (Stat Software Inc, Tulsa, OK, USA) and IBM® SPSS® Statistics software (IBM, New York, NY, USA).
Analysis of Variance (ANOVA) was carried out in order to assess the relationship between the Potentially Toxic Elements and the independent variables (depth, pH and SOM), by a two-way ANOVA test, according to the following expression:
Z ijk = µ + i + β j + γ ij + ε ijk
where, Z = the kth observation of the PTE taken at jth depth (j = 1 or 2) and ith soil property (i = 1 or 2), µ = the overall mean estimated, α = the depth effect, β = the soil property (pH or SOM), γ = the interaction between depth and the soil property, and ε = the residual error [59,60,61].
Log10 transformation was applied to PTEs in order to convert the data to a normal or near-normal distribution and homogeneity of variances (Levene’s test, p < 0.05). For the two-way analysis of variance, samples were classified according to pH values (very acid (3.0, 4.0), acid (4.0, 6.0) and neutral (6.0, 7.0)) and SOM ((3.6, 10.0) and (10.0, 39.0) in %). It should be noted that the SOM classes established, were only defined for statistical purposes. In the cases where there were only two samples with neutral pH, this particular class was not considered further.
Contamination Factor and Modified Degree of Contamination was estimated using the method proposed by [62] in sediment pollution studies, but is also applied to soil studies [63,64]. It is based on the calculation, for each pollutant, of a contamination factor (CFi) which is the ratio obtained by dividing the mean concentration of each metal in soil (Ci) by its corresponding baseline or background value (estimated from samples collected outside the area influenced by the mining activities) according to [65], and as explained in [6], i.e., the background value, Cb (mg kg−1), for the studied elements is as follows: Ag = 0.05; As = 22; Bi = 0.3; Cd = 0.01; Cu = 28; W = 0.35; Zn = 58) [64] ( Table 1):
C F i = C i / C b
Table 1. Classification and description of the Contamination factor (CF) [62] and the Modified contamination degree (mCd) [66].
CF ValueLevel of the Contamination FactormCd ValueModified Contamination Degree Gradations
0 ≤ CF < 1Low0 ≤ mCd < 1.5None to very low
1.5 ≤ mCd < 2Low
1 ≤ CF < 3Moderate2 ≤ mCd < 4Moderate
3 ≤ CF < 6High4 ≤ mCd < 8High
6 ≤ CFVery high8 ≤ mCd < 16Very high
16 ≤ mCd < 32Extremely high
32 ≤ mCdUltra high
In [66] is presented a modified and generalized form of the [62] equation for the calculation of the overall degree of contamination (mCd) for each sample as below:
m C d = ( i = 1 7 C F i ) / 7
where CFi is the contamination factor computed for each of the seven pollutants (Ag, As, Bi, Cd, Cu, W, Zn) considered in this study. In [66] is defined seven mCd degrees as shown in Table 1.
Potential ecological risk factor and risk index (PERI): is defined as the sum of the risk factors, which quantitatively defines the potential ecological risk of a contaminant in a sample, i.e.:
P E R I i =   i = 1 7 E F i =   i = 1 7 C F i · T F
where PERIi is the Potential Ecological Risk Index for each sample (i); EFi is the monomial potential ecological risk factor; CFi is the single contamination factor (Equation (2)); and TF is the heavy metal toxic-response factor for each element. Soil toxic-response factors were computed for the seven selected elements according to the toxic factor requirements proposed by [62]. For this estimation there were used reference guide values of igneous rock types, soil, freshwater and land plants proposed by [67], and the land animals reference values proposed by [68]. The TF values obtained were: Zn = 1 < Cu = 2 < As = 5 < W = 15 < Bi = 20 < Cd = 30 < Ag = 35. In [62] are defined five EF classes and four PERI degrees, as shown in Table 2.
Table 2. Monomial potential ecological risk factor (EF) and Potential ecological risk index (PERI) classification levels [62].
EFEcological Potential Risk for Single SubstancePERIEcological Risk
0 ≤ EF < 40LowPERI < 150Low
40 ≤ EF < 80Moderate150 ≤ PERI < 300Moderate
80 ≤ EF < 160Considerable300 ≤ PERI < 600Considerable
160 ≤ EF < 320High600 ≤ PERIVery high
320 ≤ EFVery high
Human health risk assessment calculations were based on the assumption that residents, both children and adults, are directly exposed to soil through three main pathways (a) ingestion; (b) dermal absorption and (c) inhalation of soil particles present in the air [69,70,71,72]. Ingestion of soil (i) occurs by eating soil particles and/or licking contact surfaces (e.g., hands). It is assumed that children present a higher ingestion rate, due to hand-to-mouth intake. Dermal absorption (ii) occurs through exposed skin, while soil is inhaled (iii) both by mouth and nose during breathing. Particles <10 µm (PM10) are the more relevant in this process, although larger fractions of inhaled soil are, probably, decomposed in the gastrointestinal track. It is assumed that all contaminants are absorbed, both by the gastrointestinal tract or the lung [72]. Equations (5)–(7) were used to estimate the chronic daily intake of each exposure route considered [28,69,70,73], supplemented by specific quantitative information (Table 3):
C D I ing = C soil × Ing R × E F × E D B W × A T × 10 6
C D I drm = C soil × S A × S A F × D A × E F × E D B W × A T × 10 6
C D I inh = C soil × Inh R × E F × E D P E F × B W × A T
Table 3. Variables for estimation of soil residential risk in the Panasqueira mining area.
ParametersMeaningValuesReference
ChildAdult
ABSgifraction of contaminant absorbed in gastrointestinal tractAg 0.04; As 1.00; Cd 0.025; Cu 1.00; W 1.00; Zn 1.00[28]
ABSdrmfraction of contaminant absorbed dermally from soilAs 0.03; Cd 0.001[28]
ATc (d)averaging time for carcinogenic effectsLT × 365[73]
ATnc (d)averaging time for non-carcinogenic effectsED × 365[73]
BW (kg)average body weight1570[69,72]
Csoil (mg·kg−1)concentration of the element in soil-
DAdermal absorption factor0.03 for As; 0.001 for other[28]
CDIing (mg·kg−1·d−1)chronic daily intake dose through ingestion-Equation (5)
CDIdrm (mg·kg−1·d−1)chronic daily intake through dermal contact-Equation (6)
CDIinh (mg·m−3) (nc), (µg·m−3) (c)chronic daily intake through inhalation-Equation (7)
CSFing ((mg·kg−1·d−1)−1)chronic oral slope factorAs 1.50[28]
CSFdrmchronic dermal slope factorCSFing/ABSgi[28]
ED (yr)exposure duration624[73]
EF (d·yr−1)exposure frequency350 residents[73]
ET (h·d−1)exposure time24 residents[73]
IngR (mg·d−1)soil ingestion rate200100[73]
InhR (m3·d −1)inhalation rate7.620[72]
IUR ((µg·m−3)−1)chronic inhalation slope factorAs 4.3 × 10⁻³; Cd 1.8 × 10⁻³[74]
LT (yr)lifetime expected at birth78 national[75]
PEF (m3·kg−1)particle emission factor1.36 × 109[73]
SA (cm2)exposed skin area28005700[73]
SAF (mg·cm−2)skin adherence factor0.20.07[73]
RfDing (mg·kg−1·d−1)chronic oral reference doseAg 5 × 10⁻³; As 3 × 10⁻⁴; Cd 1 × 10⁻³; Cu 4 × 10⁻²; Zn 0.3[74]
RfDdrmchronic dermal reference doseRfDing × ABSgi[28]
RfDinh (mg·m−3)chronic inhalation reference doseAs 1.5 × 10⁻⁵; Cd 1 × 10⁻⁵[28]
The carcinogenic and non-carcinogenic side effects for each PTE were computed individually, as toxicity calculation uses different computational methods [76]. For each element and pathway, the non-cancer toxic risk was estimated by computing the Hazard Quotient (HQ, also known as non-cancer risk-Equation (8)) for systemic toxicity [73]. If HQ exceeds unity, it indicates that non-carcinogenic effects might occur. To estimate the overall developing hazard of non-carcinogenic effects, it is assumed that toxic risks have additive effects. Therefore, it is possible to calculate the cumulative non-carcinogenic hazard index (HI), which corresponds to the sum of HQ for each pathway (Equation (9)) [69,77]. Values of HI < 1 indicate that there is no significant risk of non-carcinogenic effects. While, values of HI > 1 imply that there is a probability of occurrence of non-carcinogenic effects, and are enhanced with increasing HI values [73]. The toxicity levels for each element were taken from The Risk Assessment Information System (RAIS) [28]. The probability of an individual developing any type of cancer over a lifetime, as a result of exposure to the carcinogenic hazards, was computed for each pathway according to Equation (10) [78]. The carcinogenic risk was estimated by the sum of total cancer risk (Equation (11)). A cancer risk below 1 × 10⁻⁶ is considered insignificant. The result of 1 × 10⁻⁶ is classified as the carcinogenic target risk. If the cancer risk is above 1 × 10⁻⁴ it is qualified as unacceptable [69,79,80]:
H Q = C D I pathway R f D
H I = H Q = H Q ing + H Q drm + H Q ihn
Risk pathway = C D I pathway × C S F pathway
Risk  =   Risk pathway =  Risk ing + Risk drm + Risk ihn       =   C D I ing × C F S ing + C D I inh × I U R + C D I drm × C S F ing A B S gi
Reference toxicity values were estimated as given in RAIS [28].
Spatial Estimation of extrapolated concentration values of chemical elements and contamination factors for the plotting of maps was based on geostatistics by extracting the necessary parameters for Ordinary Kriging from the variograms of each variable. Variograms were constructed and modelled with Surfer® (v. 8, Golden Software Inc, Golden, CO, USA), and the kriged estimations by Ordinary Kriging were also performed with Surfer®.

3. Results and Discussion

3.1. Distribution of Ag, As, Bi, Cd, Cu, W and Zn in Soil Samples

Previous studies carried out in the Panasqueira area [6,43,
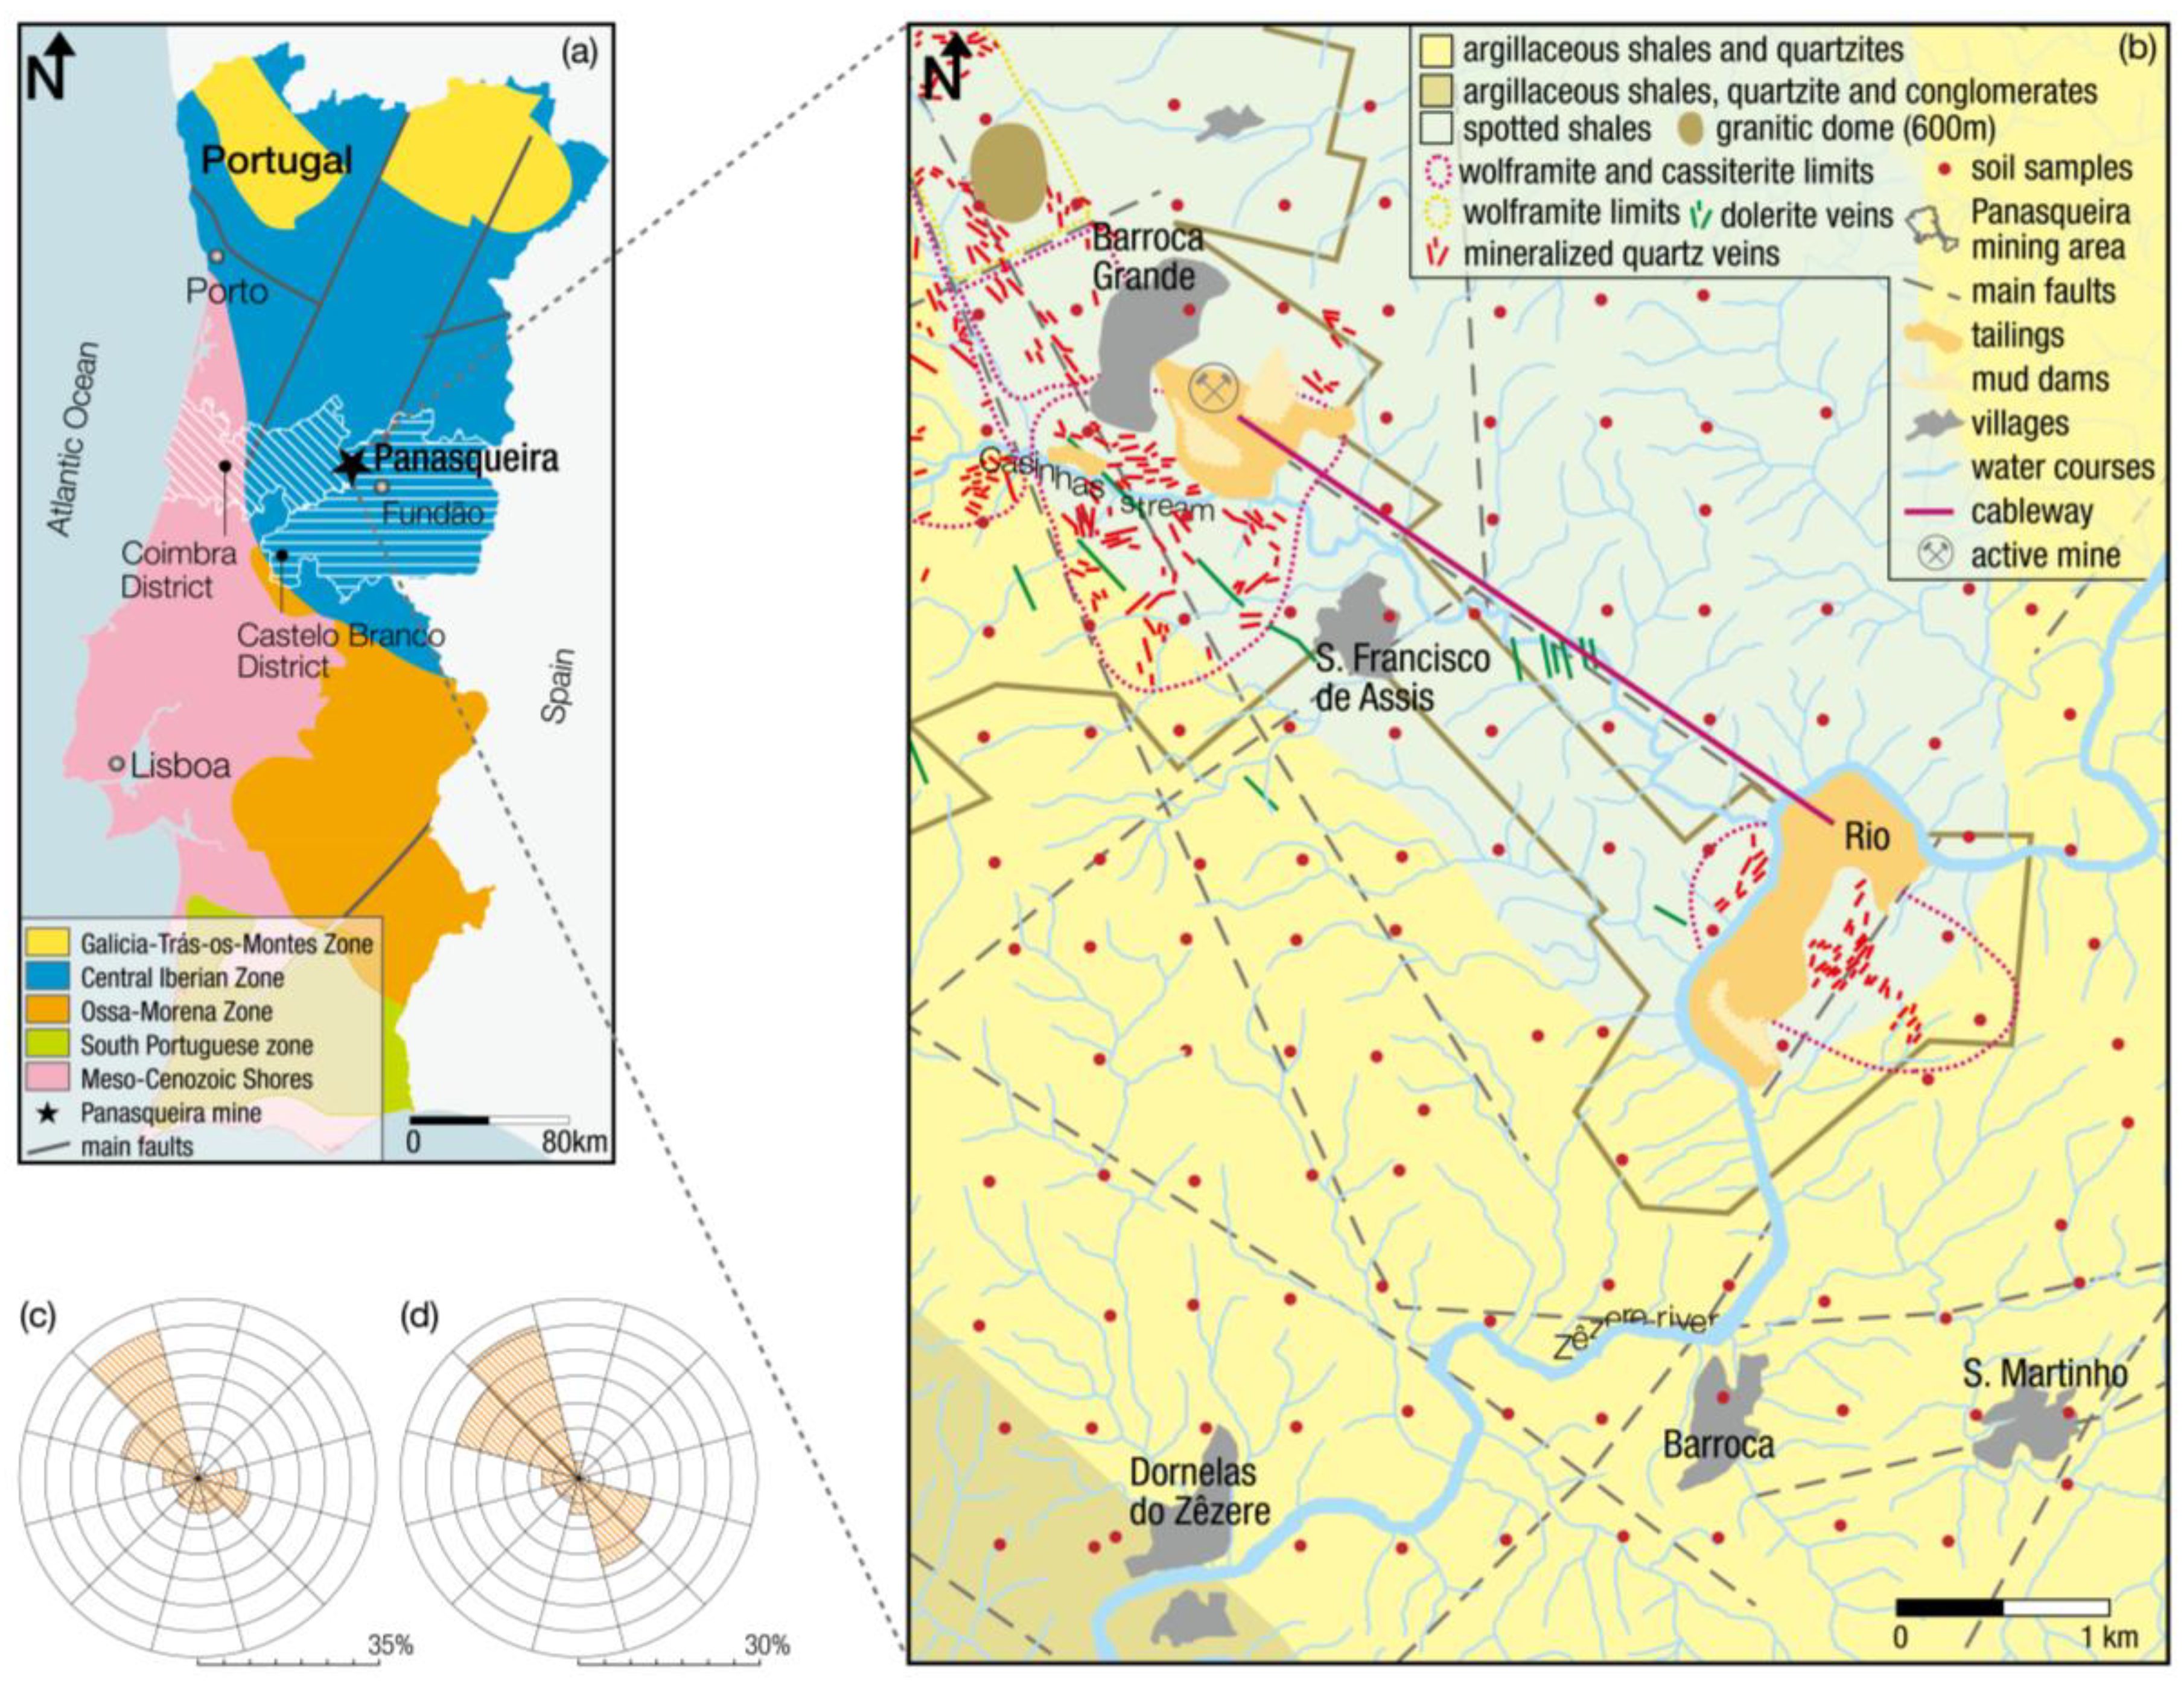
44], allowed, through the topsoil concentrations, the characterization of the anthropogenic soil contamination due to the presence of tailings and open air impoundments.
Descriptive statistical parameters (median and range) for pH, SOM, Ag, As, Bi, Cd, Cu, W and Zn are summarized in Table 4. The individual element values are compared with the corresponding local geochemical background levels, and also with reference values from the literature.
All samples, both topsoil and subsoil, have a pH lower than 7. In particular, topsoil pH values range from 3.2 to 6.6; 35.9% of topsoil samples have pH values between 3.0 and 4.0; 59.2% are between 4.0 and 5.0; 4.2% from 5.0 to 6.0, and 1.7% from 6.0 to 7.0, i.e., generally very acid to acid according to the United States Department of Agriculture classification [81]. As shown in 
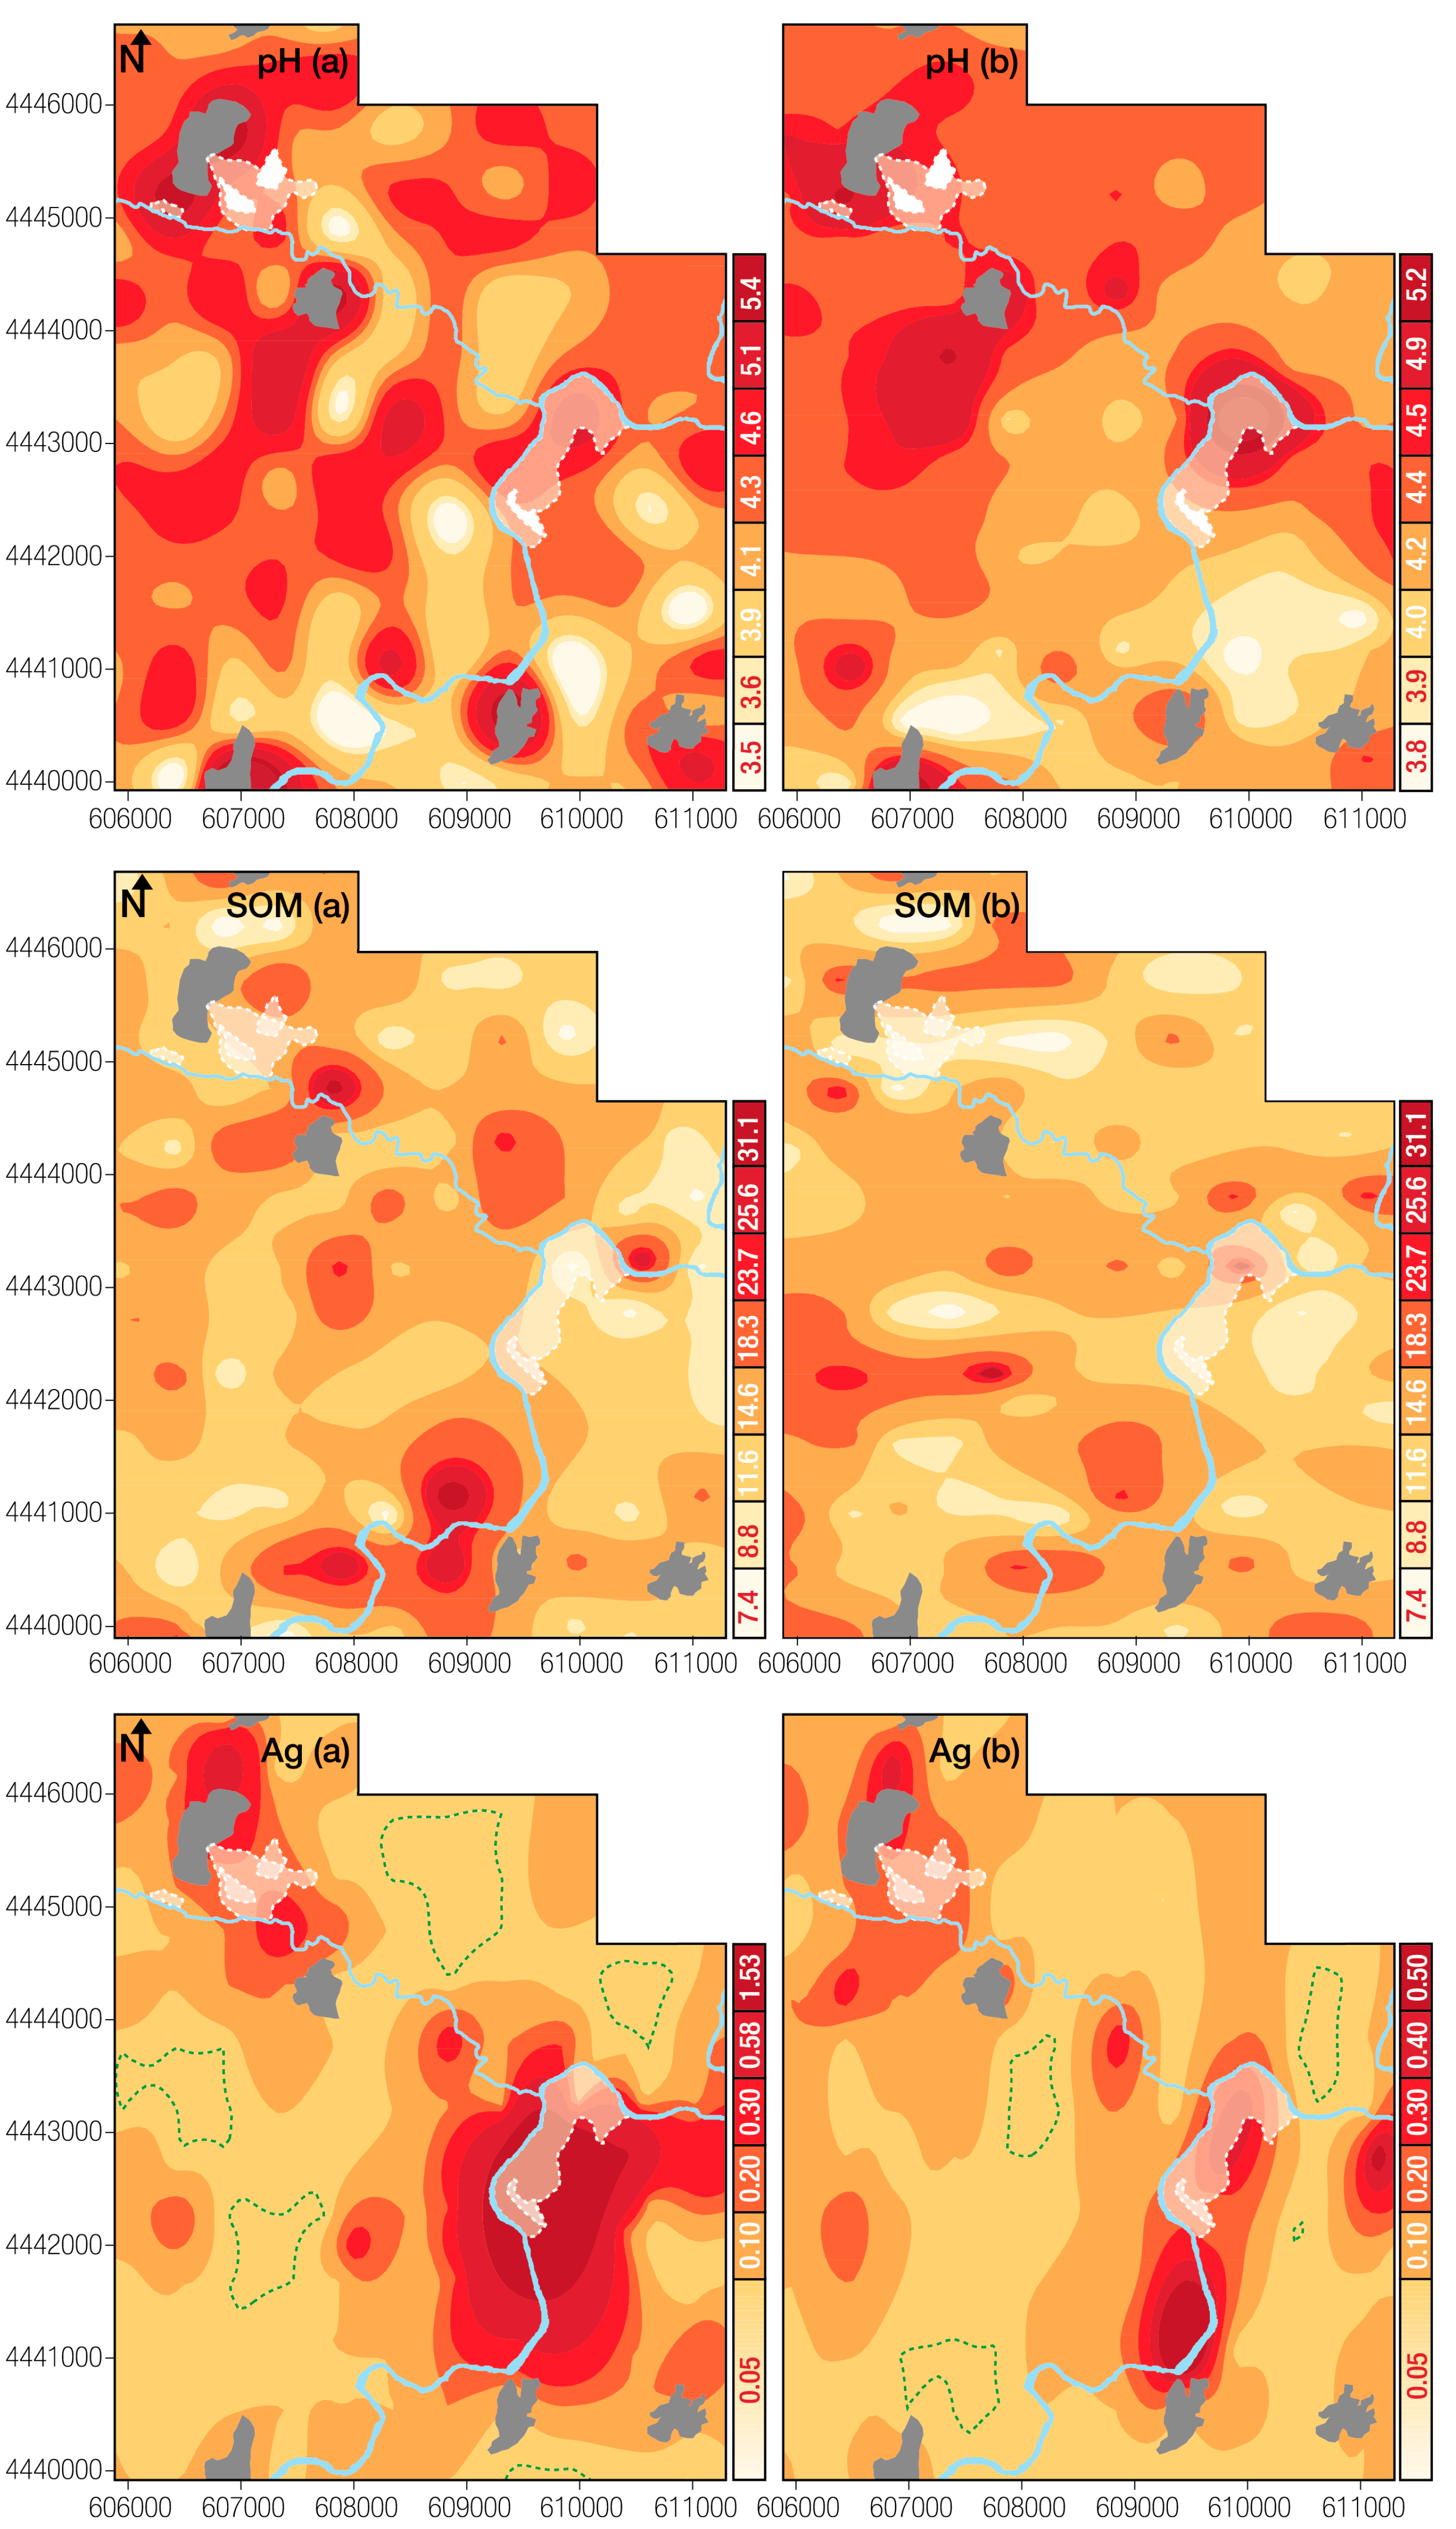
Figure 2 (pH (a)), it is possible to identify that the areas with higher values are located around the villages Barroca Grande, S. Francisco de Assis, Rio, Barroca, Dornelas do Zêzere and S. Martinho. Around Rio and Barroca Grande tailings, the soil pH is above the 75th percentile (<4.1). The subsoil pH ranges from 3.6 to 6.2: 23.0% of the subsoil samples have pH values between 3.0 and 4.0; 73.5% are between 4.0 and 5.0; 2.7% from 5.0 to 6.0, and 0.9% from 6.0 to 7.0, i.e., also generally very acid to acid. The highest pH value found in subsoil samples was located in Rio village (Figure 2 pH (b)) on the north section of the Rio tailings. In the surroundings of S. Francisco de Assis, Barroca Grande and Dornelas do Zêzere villages, it is possible to identify some agricultural soil with pH > 4.6. Possibly these slightly higher pH values are due to land agricultural beneficiation techniques. Nevertheless, the soil of the present study area is overall classified as very acid to acid.
Figure 2. Spatial distribution of pH and soil organic matter (SOM, %) and Ag (mg kg−1) for topsoil (a) and subsoil (b). Percentile class limits at P5, P10, P25, P50, P75, P90, P95 and P97.5. In blue are represented the main water courses, in grey the villages and in white the main tailings and dams. The green dashed lines represent the Ag background levels.
Geosciences 04 00240 g002
Table 4. Median, minimum and maximum concentrations values of topsoil and subsoil samples from Panasqueira mine and surrounding environment compared with international data. Casegas area, considered as representative of geochemical background (Bk).
UnitspHSOMAgAsBiCdCuWZn
%mg·kg−1mg·kg−1mg·kg−1mg·kg−1mg·kg−1mg·kg−1mg·kg−1
Topsoil (n = 122)Median4.114.60.1650.90.235670
Min–Max3.2–6.65.7–39.00.05–1.717–15030.3–650.1–310–2920.2–20022–199
Sk1.591.24.726.989.213.774.805.401.38
Subsoil (n = 116)Median4.210.20.1520.60.133370
Min–Max3.6–6.23.6–19.50.1–0.68–3500.2–150.1–1.512–1460.1–2916–192
Sk2.090.231.982.055.513.652.862.511.08
Geochemical backgroundTopsoil4.214.50.1630.80.20344.468
Subsoil4.310.00.1490.60.10312.568
Bk3.9810.50.05220.30.01280.458
Data from literature6.0–8.0 a1–20 b0.07 c11 d0.3 c0.1 d16 d1 d55 d
Notes: SOM, soil organic matter; Sk, Skewness; Bk, background values, calculated according the [65] paradigm and confirmed by the [82] methods; a Ontario reference values [83]; b Normal Ranges in Soils [16,84,85]; c Mean World Soil [67,86]; d Median values for Portuguese Soil [87].
The topsoil SOM values range from 5.7% to 39.0% (see Table 4 and Figure 2 SOM (a)), while the subsoil SOM values vary from 3.6% to 19.5% (see Table 4 and Figure 2 SOM (b)). Comparing the topsoil and subsoil pH and SOM maps (Figure 2 and Table 4) is possible to observe that areas with the highest SOM values are related to areas with the lowest pH values.
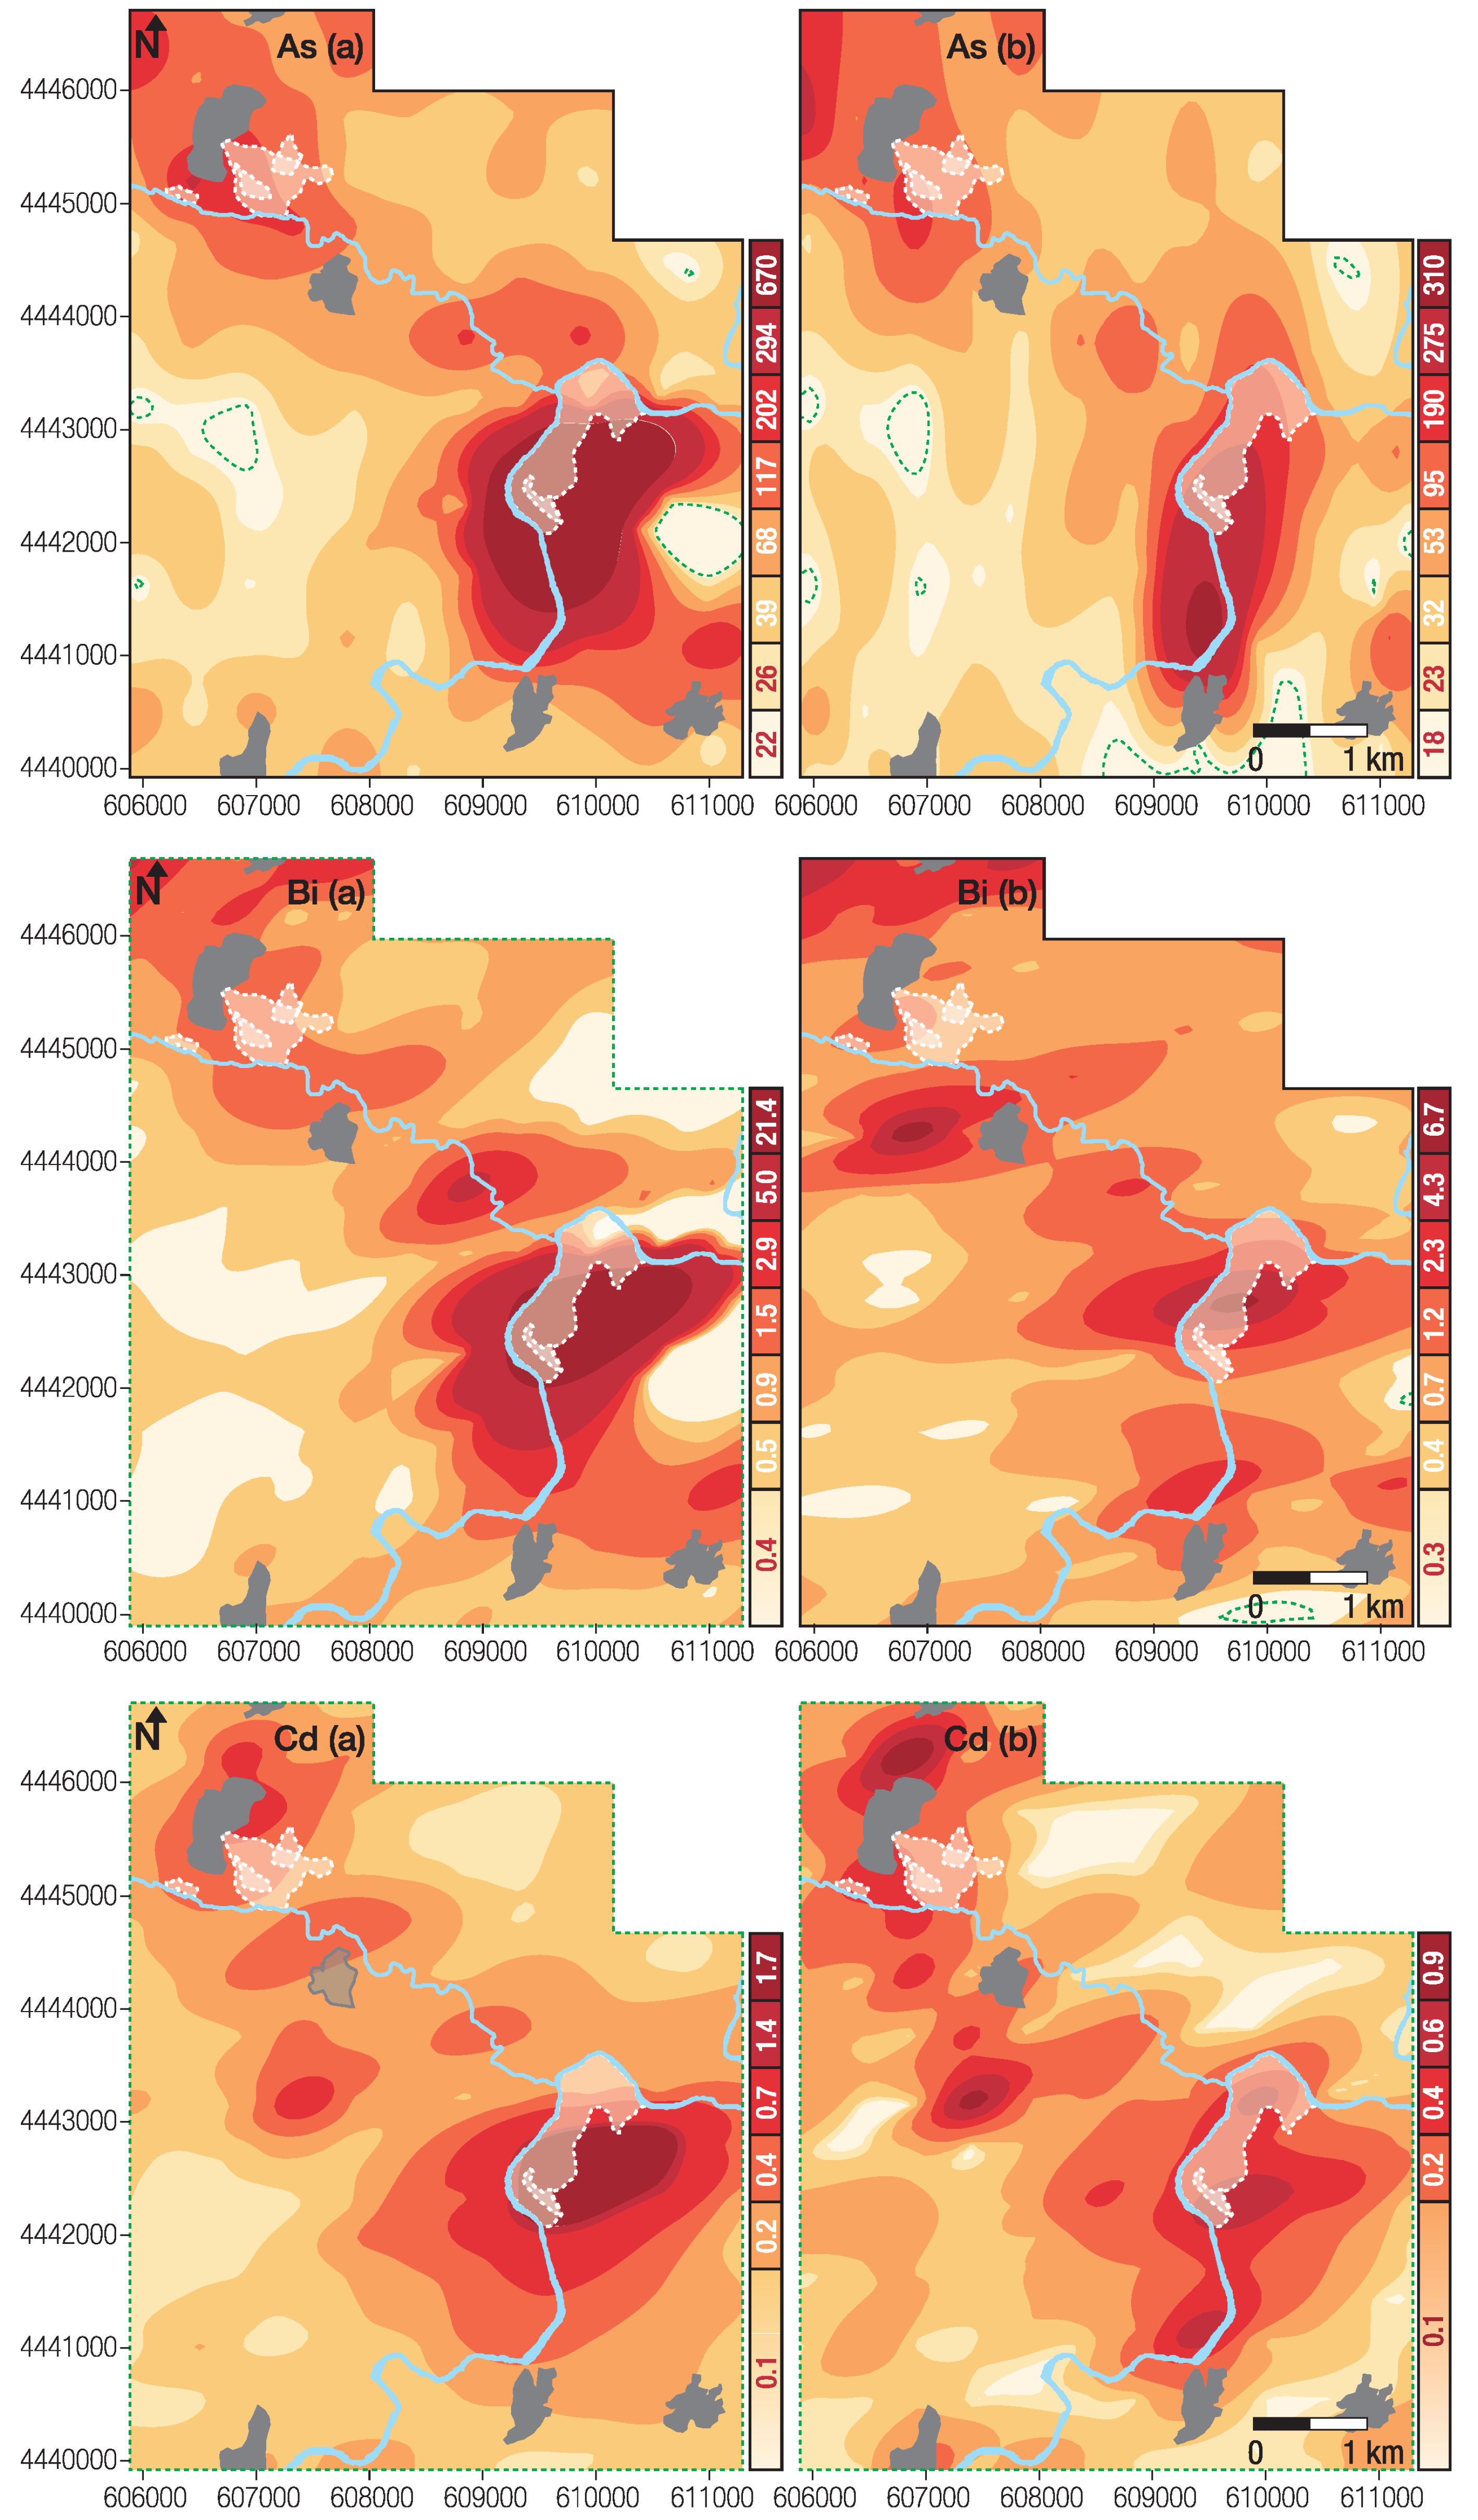
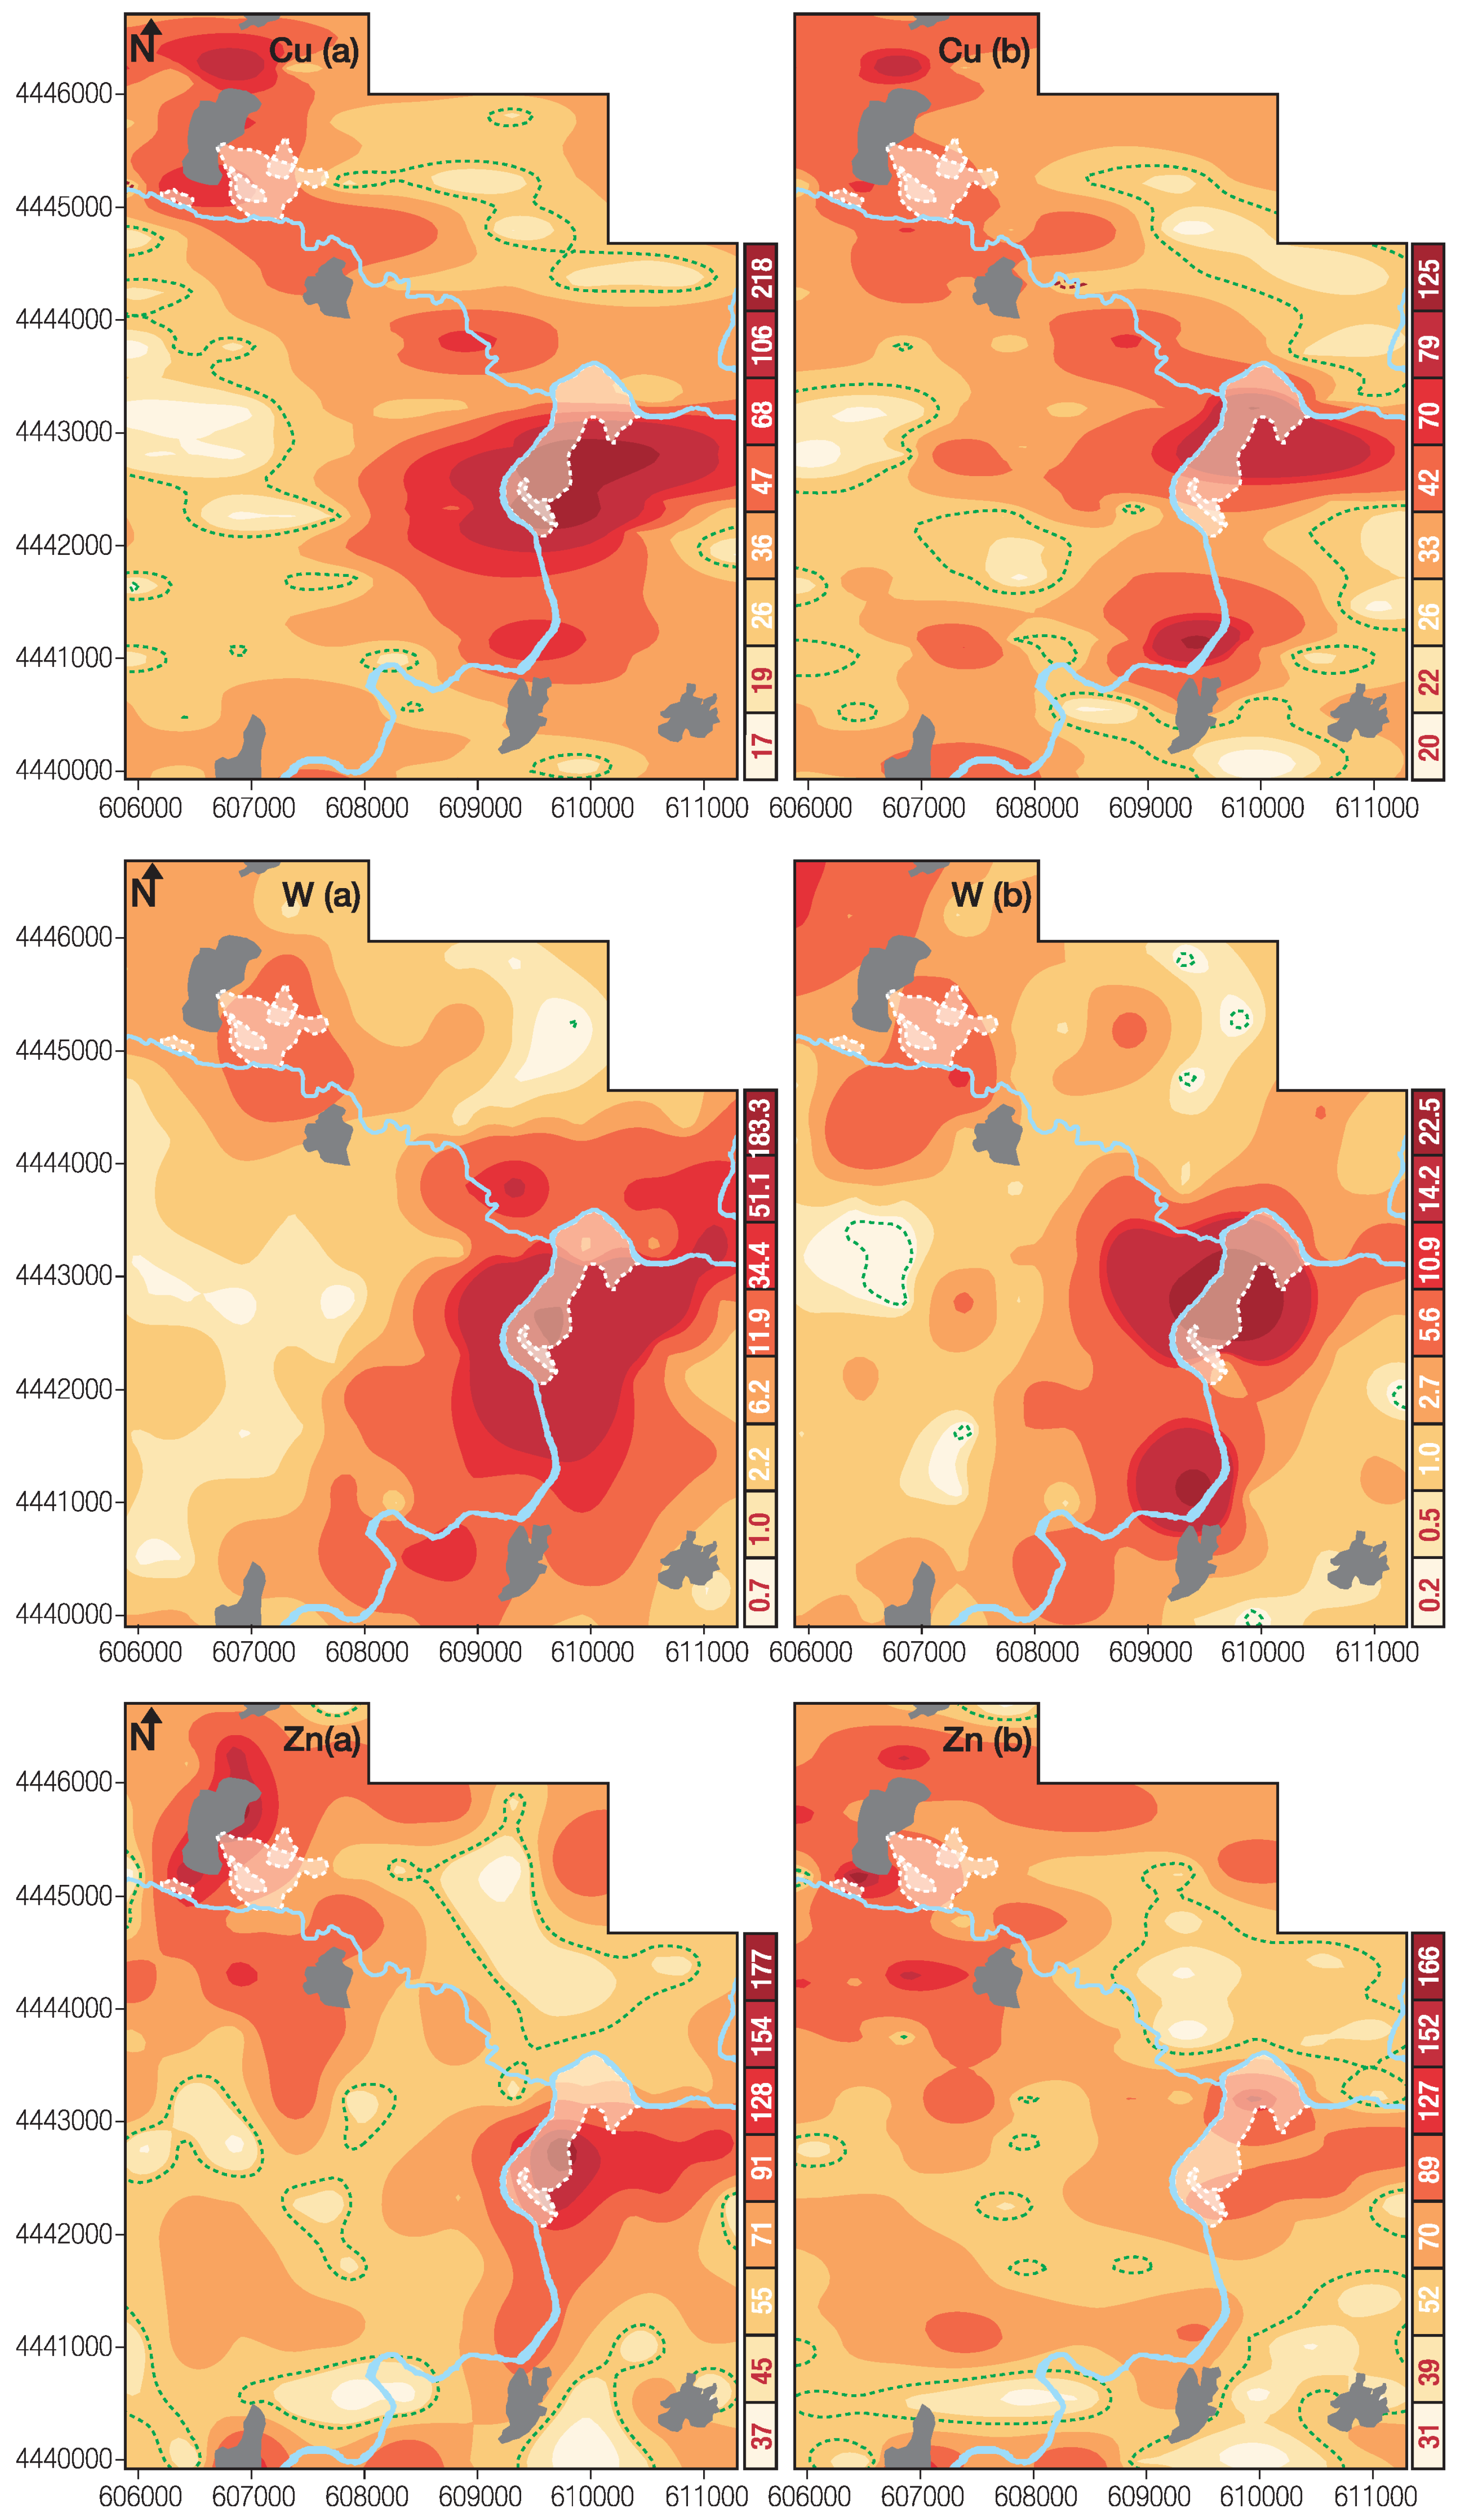
To evaluate the presence of possible local anomalies the Ag (Figure 2), As, Bi, Cd (Figure 3), Cu, W, Zn (Figure 4) median and maximum values, observed in topsoil, were compared with the corresponding results in subsoil samples. Although the results tabulated in Table 4 show that Ag, As, Bi, Cu, W, and Zn present highest median and maximum values for topsoil when compared with subsoil, the paired samples t-test indicates that there are significant differences between soil samples at both depths for the elements As, Bi and W. Additionally, the results clearly show that there are higher contents in soil samples at both depths, when compared with the local geochemical background. The behavior of the topsoil element concentrations may reflect the influence of the Barroca Grande and Rio tailings and open air impoundments, possibly caused by aerial transport and deposition.
Topsoil samples, as shown in Table 5, have many strong to very strong correlation coefficients, i.e., As/Ag, As/Bi, As, Cd, As/Cu, As/W, Ag/Bi, Ag/Cu, As/W, Bi/Cd, Bi/Cu, Bi/W, Cd/Cu, Cd/W, Cd/Zn, Cu/W. The strongest correlations are between Ag/Cu (0.94), As/Ag (0.90) and Bi/W (0.90). There is also a positive intermediate correlation (r = 0.31 to 0.70) between PTEs and pH. Several authors claim that heavy metal mobility holds a positive correlation with pH [18,88,89]. It is well known that pH affects heavy metal availability, since it is the major factor in controlling the ability of soil to retain heavy metals in an exchangeable form [21]. With low SOM the pH values may become relatively more important for the partitioning of metals. Most elements exhibit a weak negative correlation with SOM. For subsoil samples the PTEs correlation also presents some strong correlation coefficients (Table 5), but they are overall lower than in topsoil. The stronger correlations are between As/Bi (r = 0.75) and Bi/Cu (r = 0.69). At this depth, pH is also the most significant soil property, presenting weak to intermediate positive correlations with the PTEs, except W.
Figure 3. Spatial distribution of As, Bi, Cd (mg·kg−1) values for topsoil (a) and subsoil (b). Percentile class limits at P5, P10, P25, P50, P75, P90, P95 and P97.5. The green dashed lines represent the elements background levels. In blue are represented the main water courses, in grey the villages and in white the main tailings and dams.
Geosciences 04 00240 g003
Figure 4. Spatial distribution of Cu, W, Zn (mg·kg−1) values for topsoil (a) and subsoil (b). Percentile class limits at P5, P10, P25, P50, P75, P90, P95 and P97.5. The green dashed lines represent the elements background levels. In blue are represented the main water courses, in grey the villages and in white the main tailings and dams.
Geosciences 04 00240 g004
Table 5. Pearson’s linear product-moment correlation coefficients for Ag, As, Bi, Cd, Cu, W, Zn, pH and SOM in topsoil (n = 122) and subsoil (n = 116) samples.
Var AgAsBiCdCuWZnpHSOM
TopsoilAg1.000.90 **0.84 **0.79 **0.94 **0.83 **0.51 **0.70 **−0.1
As 1.000.84 **0.77 **0.89 **0.81 **0.44 **0.37 **−0.09
Bi 1.000.82 **0.87 **0.90 **0.44 **0.54 **−0.14
Cd 1.000.86 **0.79 **0.68 **0.42 **−0.07
Cu 1.000.80 **0.60 **0.61 **−0.14
W 1.000.38 **0.46 **0.01
Zn 1.000.31 **−0.15
pH 1.00−0.40 **
SOM 1.00
SubsoilAg1.000.43 **0.34 **0.45 **0.42 **0.36 **0.43 **0.30 **0.15
As 1.000.75 **0.43 **0.59 **0.49 **0.30 **0.09−0.01
Bi 1.000.50 **0.69 **0.56 **0.35 **0.04−0.01
Cd 1.000.53 **0.43 **0.57 **0.17−0.09
Cu 1.000.44 **0.56 **0.11−0.17
W 1.000.14−0.21 *0.16
Zn 1.000.45 **−0.23 *
pH 1.00−0.35 *
SOM 1.00
Notes: ** Correlation is significant at the 0.01 level (2-tailed); * Correlation is significant at the 0.05 level (2-tailed).
In order to identify the most important factor controlling the different PTEs spatial differences concentrations, a two-way ANOVA was performed [90]. In this study, two models were selected to group the variables, (a) depth-SOM and (b) depth-pH. The results of the test between dependent (PTEs) and independent (depth and SOM) variables (Table 6) showed that soil depth accounts for significant variations between the group means: Bi (p = 0.035), Cd (p = 0.015) and W (p = 0.009). The independent variable SOM shows significant variations in the concentration of As (p = 0.021), Bi (p = 0.068), W (p = 0.013) and Zn (p = 0.021). There is no significant interaction between depth and SOM. While the independent variable pH (Table 7) shows that there are significant variations with depth for most PTEs (Ag p = 0.071; As p = 0.027; Bi p = 0.001; Cd p <0.000; W p <0.000), except for Cu (p =0.371). pH presents a significant variation for Ag (p = 0.031), W (p = 0.001) and Zn (p <0.001). The interaction between pH*depth shows no significant variations (p >0.050), except on the concentration of Cu (p = 0.038).

3.2. Quantitative Assessment of Soil Contamination

In this study, a simplified approach to assess soil contamination based on comparing the measured concentrations in the Panasqueira soil with the geochemical background values for Casegas was adopted. Table 8 shows the results of contamination factors (CF) and the modified degree of contamination (mCd) for the selected elements in topsoil and subsoil, and also in Casegas soil.
Table 6. Two-way ANOVA results between the dependent (PTEs) and independent (depth, SOM) variables. PTEs were subjected to log-normal transformation (As, As, Cd, Cu, W and Zn with α = 0.050; Bi with α = 0.075).
Source of VariationDependent VariablesdfMean SquareFp-Value
DepthAg10.2231.6240.204
As10.1271.6520.200
Bi10.3334.4840.035
Cd10.9265.9510.015
Cu10.0120.4830.488
W11.4866.9280.009
Zn10.0621.9330.166
SOMAg10.0100.0760.783
As10.4175.4220.021
Bi10.2513.3710.068
Cd10.1601.0290.311
Cu10.0070.2750.601
W11.7638.2190.005
Zn10.1735.3720.021
Depth*SOMAg10.0510.3730.542
As10.0070.0930.760
Bi10.0010.0080.928
Cd10.0010.0060.940
Cu10.0371.520.219
W10.0950.440.506
Zn10.0020.060.811
ErrorAg2380.137--
As2150.077--
Bi2250.074--
Cd2330.156--
Cu2180.024--
W2150.215--
Zn2350.032--
According the topsoil median values of the contamination factor, Bi, Cd and W present an extremely high degree of contamination, while Ag and As a high contamination factor. The results demonstrated that mCd values vary from the minimum 1.2 in both topsoil and subsoil to the maximum of 150 in topsoil, with median values varying from 4 in subsoil to 6 in topsoil. The cumulative frequency distribution indicates that only 7.4% of the soil samples were classified as no to low degree of pollution, with mCd values < 2.0, and the remaining soil samples (92.6%) registered moderate to ultra-high degree of pollution, with mCd values equal or greater than 2.0 (27.9% between 2 ≤ mCd < 4; 27.1% between 4 ≤ mCd < 8; 19.7% between 8 ≤ mCd < 16; 15.6% between 16 ≤ mCd < 32 and 2.5% between 32 ≤ mCd). The enrichment is more pronounced in topsoil (subsoil mCd values ranged 1.2–26.4).
Table 7. Two-way ANOVA results between the dependent (PTEs) and independent (depth, pH) variables. PTEs were subjected to log-normal transformation (As, Bi, Cd, Cu, W, Zn with α = 0.050; Ag with α = 0.075).
Source of VariationDependent VariablesdfMean SquareFp-Value
DepthAg10.3533.2960.071
As10.5124.9300.027
Bi10.83210.6050.001
Cd11.81013.4490.000
Cu10.0190.8050.371
W13.05514.5600.000
Zn10.0070.2660.607
pHAg10.5064.7260.031
As10.0310.3010.584
Bi10.0170.2220.638
Cd10.0200.1460.703
Cu10.0000.0010.971
W12.31511.0330.001
Zn20.60521.7770.000
Depth*pHAg10.1161.0850.299
As10.0530.5100.476
Bi10.0821.0400.309
Cd10.1791.3320.250
Cu10.1044.3510.038
W10.3211.5320.217
Zn20.0772.7690.065
ErrorAg2330.107--
As2300.104--
Bi2250.078--
Cd2260.135--
Cu2170.024--
W2130.210--
Zn2330.028--
Table 8. Contamination Factors (CF) and Modified Degree of Contamination (mCd) using geochemical background values. Casegas area is considered as representative of geochemical background.
VarAgCFAsCFBiCFCdCFCuCFWCFZnCFmCd
BkMin1.00.40.71.00.60.10.30.7
Med1.01.01.01.01.01.11.01.4
Max85930626213
TopsoilMin1.00.81.05.00.40.60.41.2
Med233201.2171.26
Max3468215300105713150
SubsoilMin1.00.40.75.00.40.10.31.2
Med222101.181.24
Max121651150584326
Casegas is considered as an uncontaminated site, since it is outside the mine area and the influence of airborne polluted dust. The maximum mCd value of 13.1, represents a very high contamination degree, which is mostly due to the Cd and W contamination factors. In this case, however, the high mCd value is most likely due to geogenic sources, as this is a naturally enriched and mineralized zone.
The calculated mCd values make possible the assessment of the spatial distribution of the modified degree of contamination. The first step is the determination of the spatial structure of the new variables, and the experimental variograms were used to model the data using exponential models, the extracted parameters are for topsoil: main direction = 90°; Nugget effect (C0) = 30; Sill-Nugget effect (C1) = 330; range of influence (length) = 1200 m; anisotropy ratio = 1.81; and for subsoil: main direction = 90°; C0 = 0; 
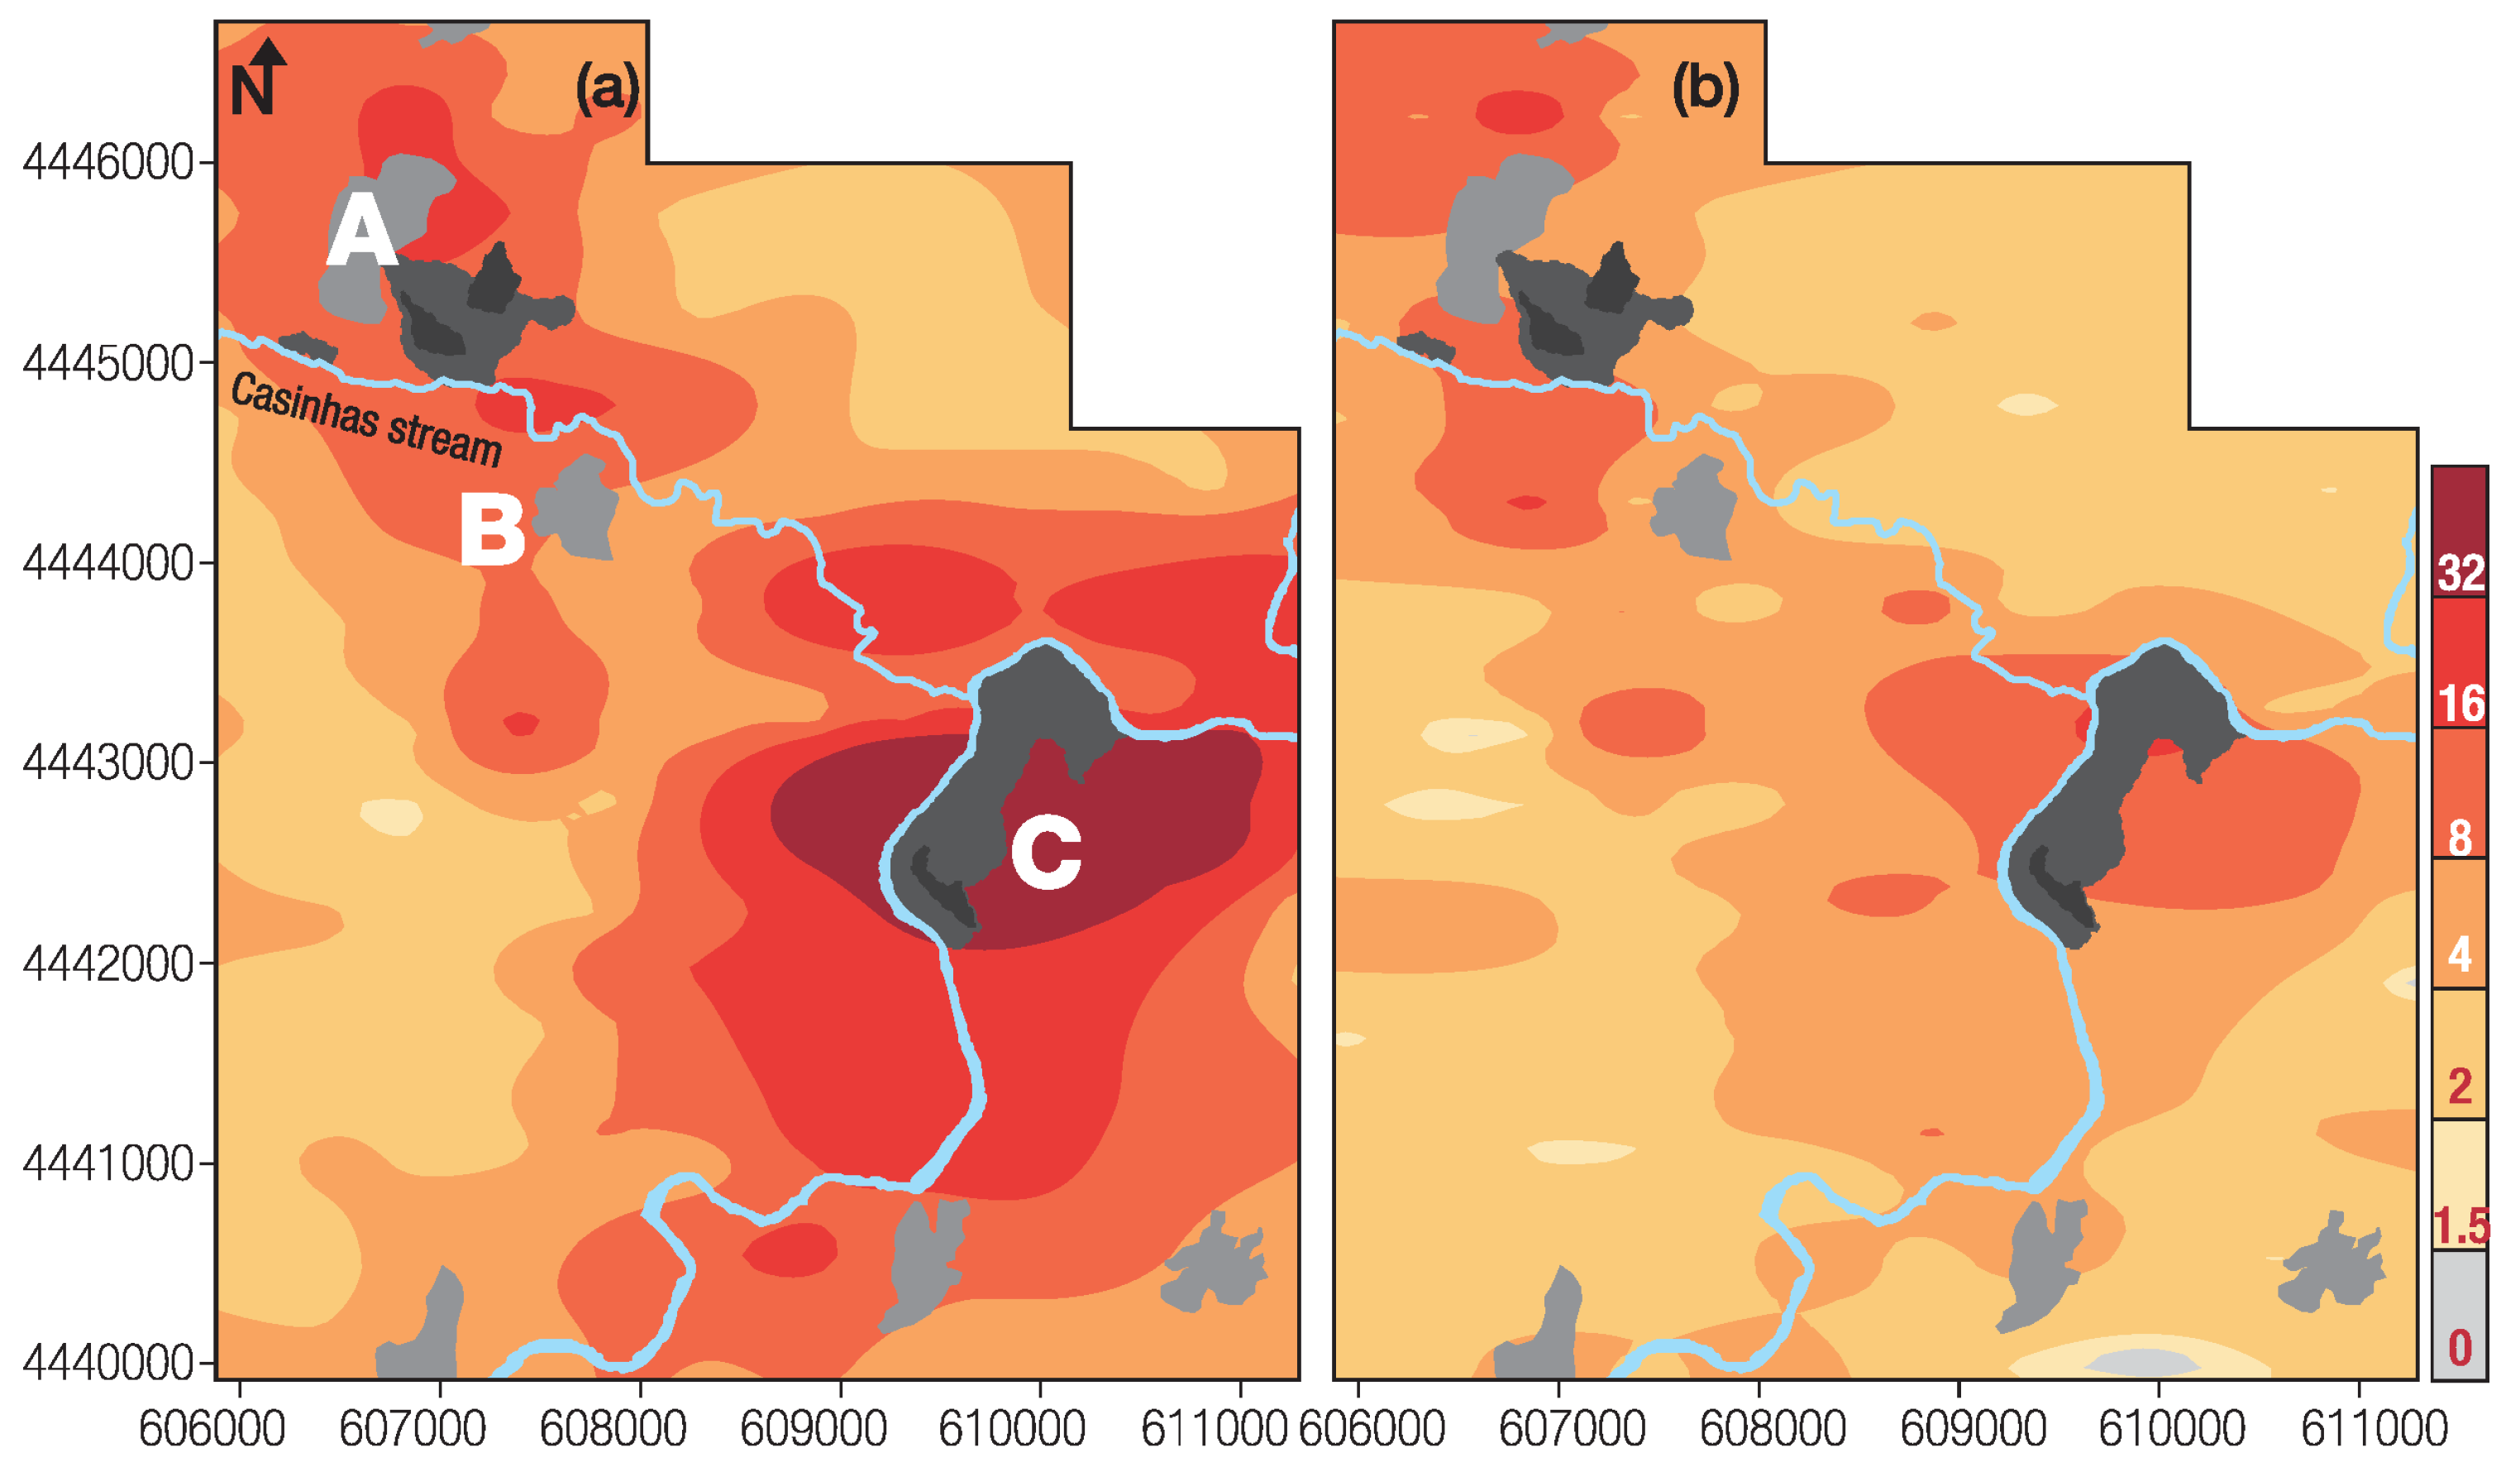
C1 = 19; length = 900 m; anisotropy ratio = 2.90. Estimation of the spatial distribution was then achieved by Ordinary Kriging and the respective map plotted. In Figure 5 it is possible to observe the mCd spatial distribution revealing areas with very high values.
Figure 5 shows that soil samples collected near the Barroca Grande tailings (A), Rio tailings (C) and the mud impoundments stand out clearly, because the soil is enriched in Ag, As, Bi, Cd, Cu, W and Zn; all soil samples from both depths taken from Barroca Grande exceed the As, Bi, Cd and W baseline values for Portugal, while at Rio only Zn in some samples (25%) has concentrations that are lower than the guide value. According to [42], the Barroca Grande tailings and open impoundments have high As, Cd, Cu, Pb, W, and Zn concentrations (mean content in the more coarse tailings material As = 7142 mg·kg−1 ; Cd = 56 mg·kg−1 ; Cu = 2501 mg·kg−1; Pb = 172 mg·kg−1; Sn = 679 mg·kg−1; W = 5400 mg·kg−1 and Zn = 1689 mg·kg−1 and mean content in the impoundment material (rejected from the mill operations) As = 44,252 mg·kg−1 ; Cd = 491 mg·kg−1; Cu = 4029 mg·kg−1; Pb = 166 mg·kg−1; Sn = 454 mg·kg−1; W = 3380 mg·kg−1 and Zn = 3738 mg·kg−1). The mineralogy of these tailings consists of mainly quartz, muscovite, kaolinite, illite-montmorillonite, montmorillonite-vermiculite, and chlorite, and also arsenopyrite, wolframite, and natrojarosite.
Figure 5. Spatial distribution of the modified degree of Contamination (mCd) for topsoil (a) and subsoil (b). Values were estimated on the basis of the concentration factors of Ag, As, Bi, Cd, Cu, W and Zn (A, Barroca Grande; B, S. Francisco de Assis; C, Rio).
Geosciences 04 00240 g005
The dams at Barroca Grande may pose a significant potential threat, due to the fine-grained nature of the materials, and their location with respect to the Casinhas stream that cross S. Francisco de Assis village. The X-Ray Diffraction (XRD) analysis of the impoundment material revealed the presence of scorodite, arsenopyrite, quartz, sphalerite, hematite, and muscovite. These tailings and impoundment material are metal-enriched at such a level, likely to be toxic to the ecosystem [42]. The concentrations exceed the values defined for the 90th percentile of the South Portuguese Zone (As 157 mg·kg−1; Cu 108 mg·kg−1; Ni 62 mg·kg−1; Pb 117 mg·kg−1; Zn 134 mg·kg−1), which is indicative of enrichment in trace metals. This Ag-As-Bi-Cd-Cu-W-Zn association is quite logical and is linked to the Panasqueira ore-paragenetic association. The highest mCd values identified near Barroca Grande (A), São Francisco de Assis (B) and Rio (C) confirms that mechanical and chemical dispersion from Barroca Grande and Rio tailings and mud impoundments occurs. Most of the samples (90% or higher of total samples) collected from Barroca Grande (A), São Francisco de Assis (B) and Rio (C) villages, exhibit mCd values >8.0, clearly indicting a very high degree of contamination.
The Panasqueira tailings impoundments have been and are affected by surface water flows (from heavy rainfall events) that have eroded the tailings from their original location and transported the materials downstream to residential areas (namely to S. Francisco de Assis). However, the superficial flat of the tailings have dried and are susceptible to wind erosion. The relative rates of water and wind erosion and transport, in Barroca Grande, São Francisco de Assis and Rio, suggest that wind processes have similar, and in many cases greater, impact on loss and local redistribution of soil in ecosystems than an eventual erosional soil enrichment.

3.3. Potential Ecological Risk Factor and Risk Index

The topsoil and subsoil samples results for individual element potential pollution factor (EF) and potential ecological risk (PERI) are presented in Table 9. For both soil sample depths, As, Cu and Zn show a low potential ecological risk, with median values <40 (see Table 2). Tungsten also exhibits a low risk in subsoil, but a high risk in topsoil, while Bi and Ag show a moderate risk at both depths. Cadmium presents a very high ecological risk in topsoil and a high risk on subsoil. Using the median values, the topsoil risk factor is ranked as: Cd > W > Ag > Bi > As >> Cu > Zn, while for subsoil the ranking is: Cd > Ag > Bi > As > Cu = W > Zn. These results suggest a very high environmental risk, especially for Cd.
In order to estimate the global potential ecological risk in the study area, the PERI was computed. The median values classify soil samples at both depths with a very high risk (Table 9). The cumulative analysis shows that the soil samples at both depths do not display a low risk index (<150), and only 7.4% of topsoil present a moderate risk index. PERI classified 92.6% of topsoil samples as high to very high ecological risk. The same occurs for 61.2% of subsoil samples, which should be considered as an extensive hazard. 
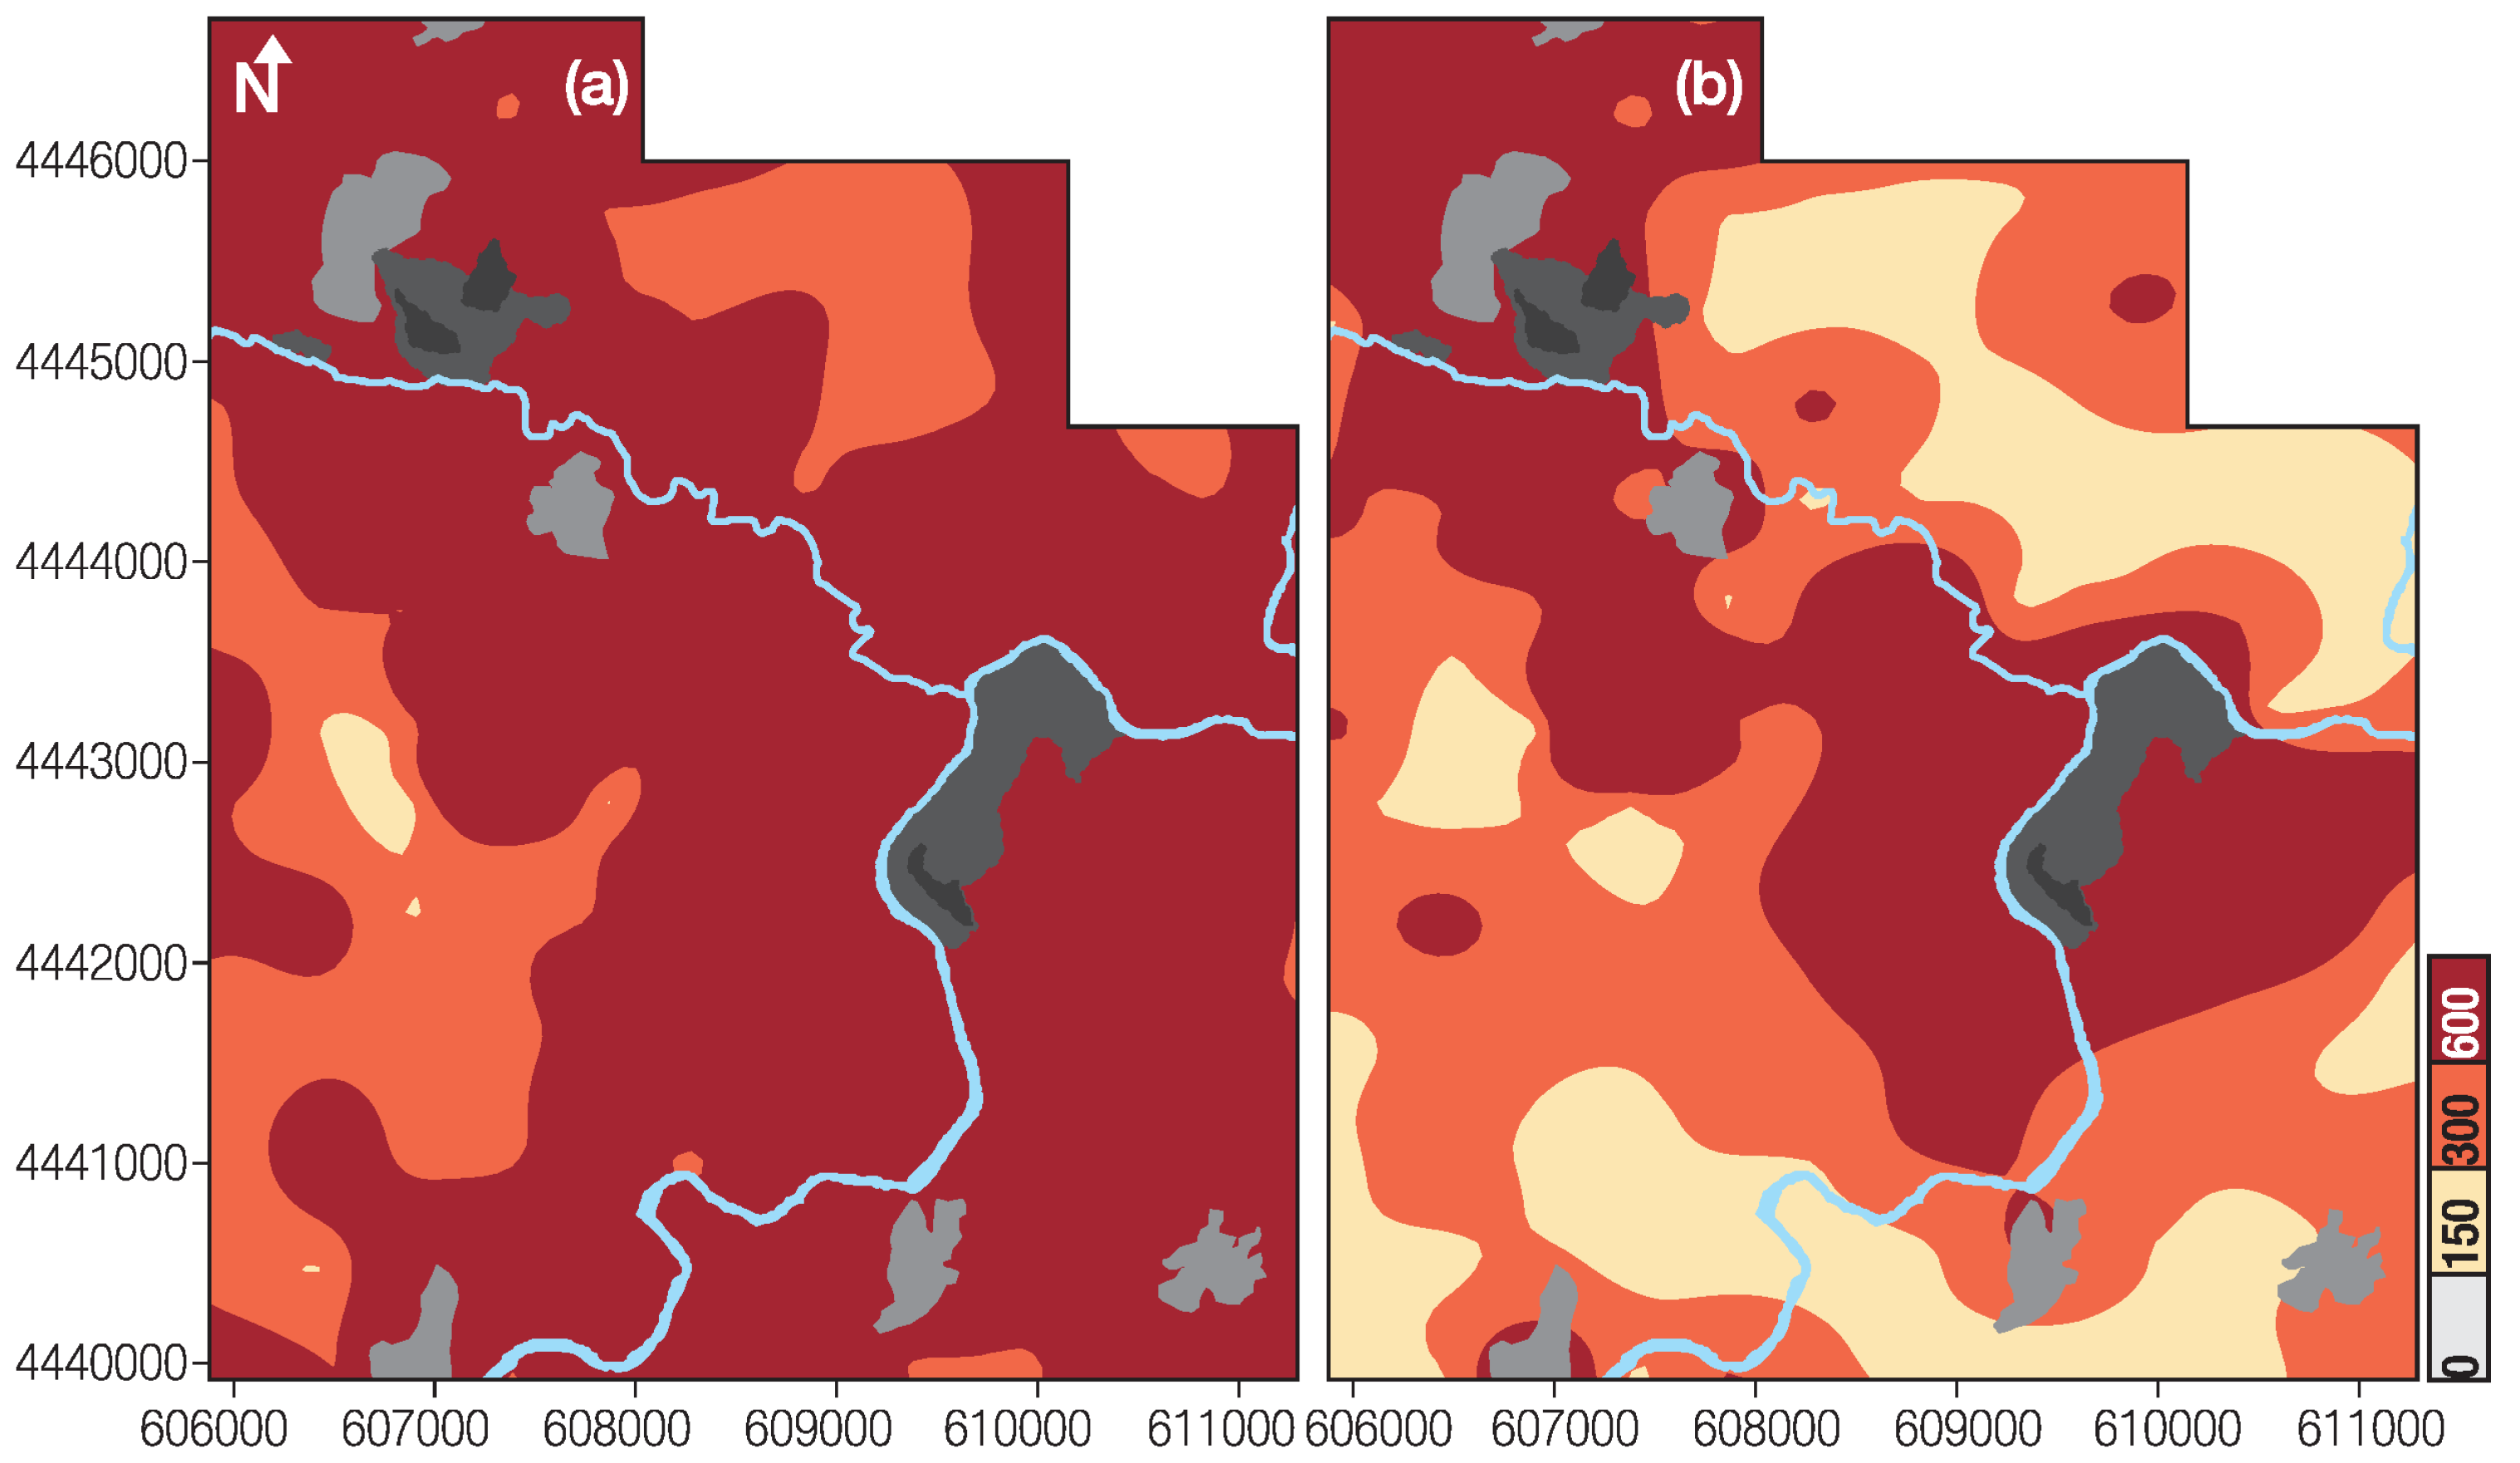
Figure 6 displays the PERI spatial distribution. Topsoil has a wide area classified with a very high ecological risk, which is consistent with the wind direction, the water courses and the actual and previous exploration and beneficiation locations (Figure 6a). Subsoil also presents a very high risk index in the same topsoil areas, but with smaller area expression. These results are consistent with those mapped by the individual elements, Ag, As, Bi, Cd, Cu, W and Zn (Figure 2, Figure 3 and Figure 4), and the modified degree of contamination (mCd; Figure 5), with the same affected areas.
Table 9. Statistical results of the single element potential pollution factor (EF) and potential ecological risk (PERI) for topsoil and subsoil samples.
VarAgEFAsEFBiEFCdEFCuEFWEFZnEFPERI
TopsoilMin120420150190224
Mean12023127893357311,740
Med701560600225511,020
Max1,1903384,3009,000218,571323,353
SubsoilMin30410125220173
Mean763356418781600
Med602330250661350
Max3601587703,7502620334,369
Figure 6. Spatial distribution of Potential Ecological Risk Index (PERI) for topsoil (a) and subsoil (b) in the study area.
Geosciences 04 00240 g006

3.4. Human Health Risk Assessment

Both non-carcinogenic hazard (HQ) and carcinogenic risk (Riskpathway) of topsoil in the Panasqueira mine and surrounding area, through the different pathways (ingestion, dermal and inhalation), were estimated according to the human health risk assessment model [28]. The cumulative hazard index (HI) and total risk (Risktotal) were also characterized for multi-pathway routes in resident population.
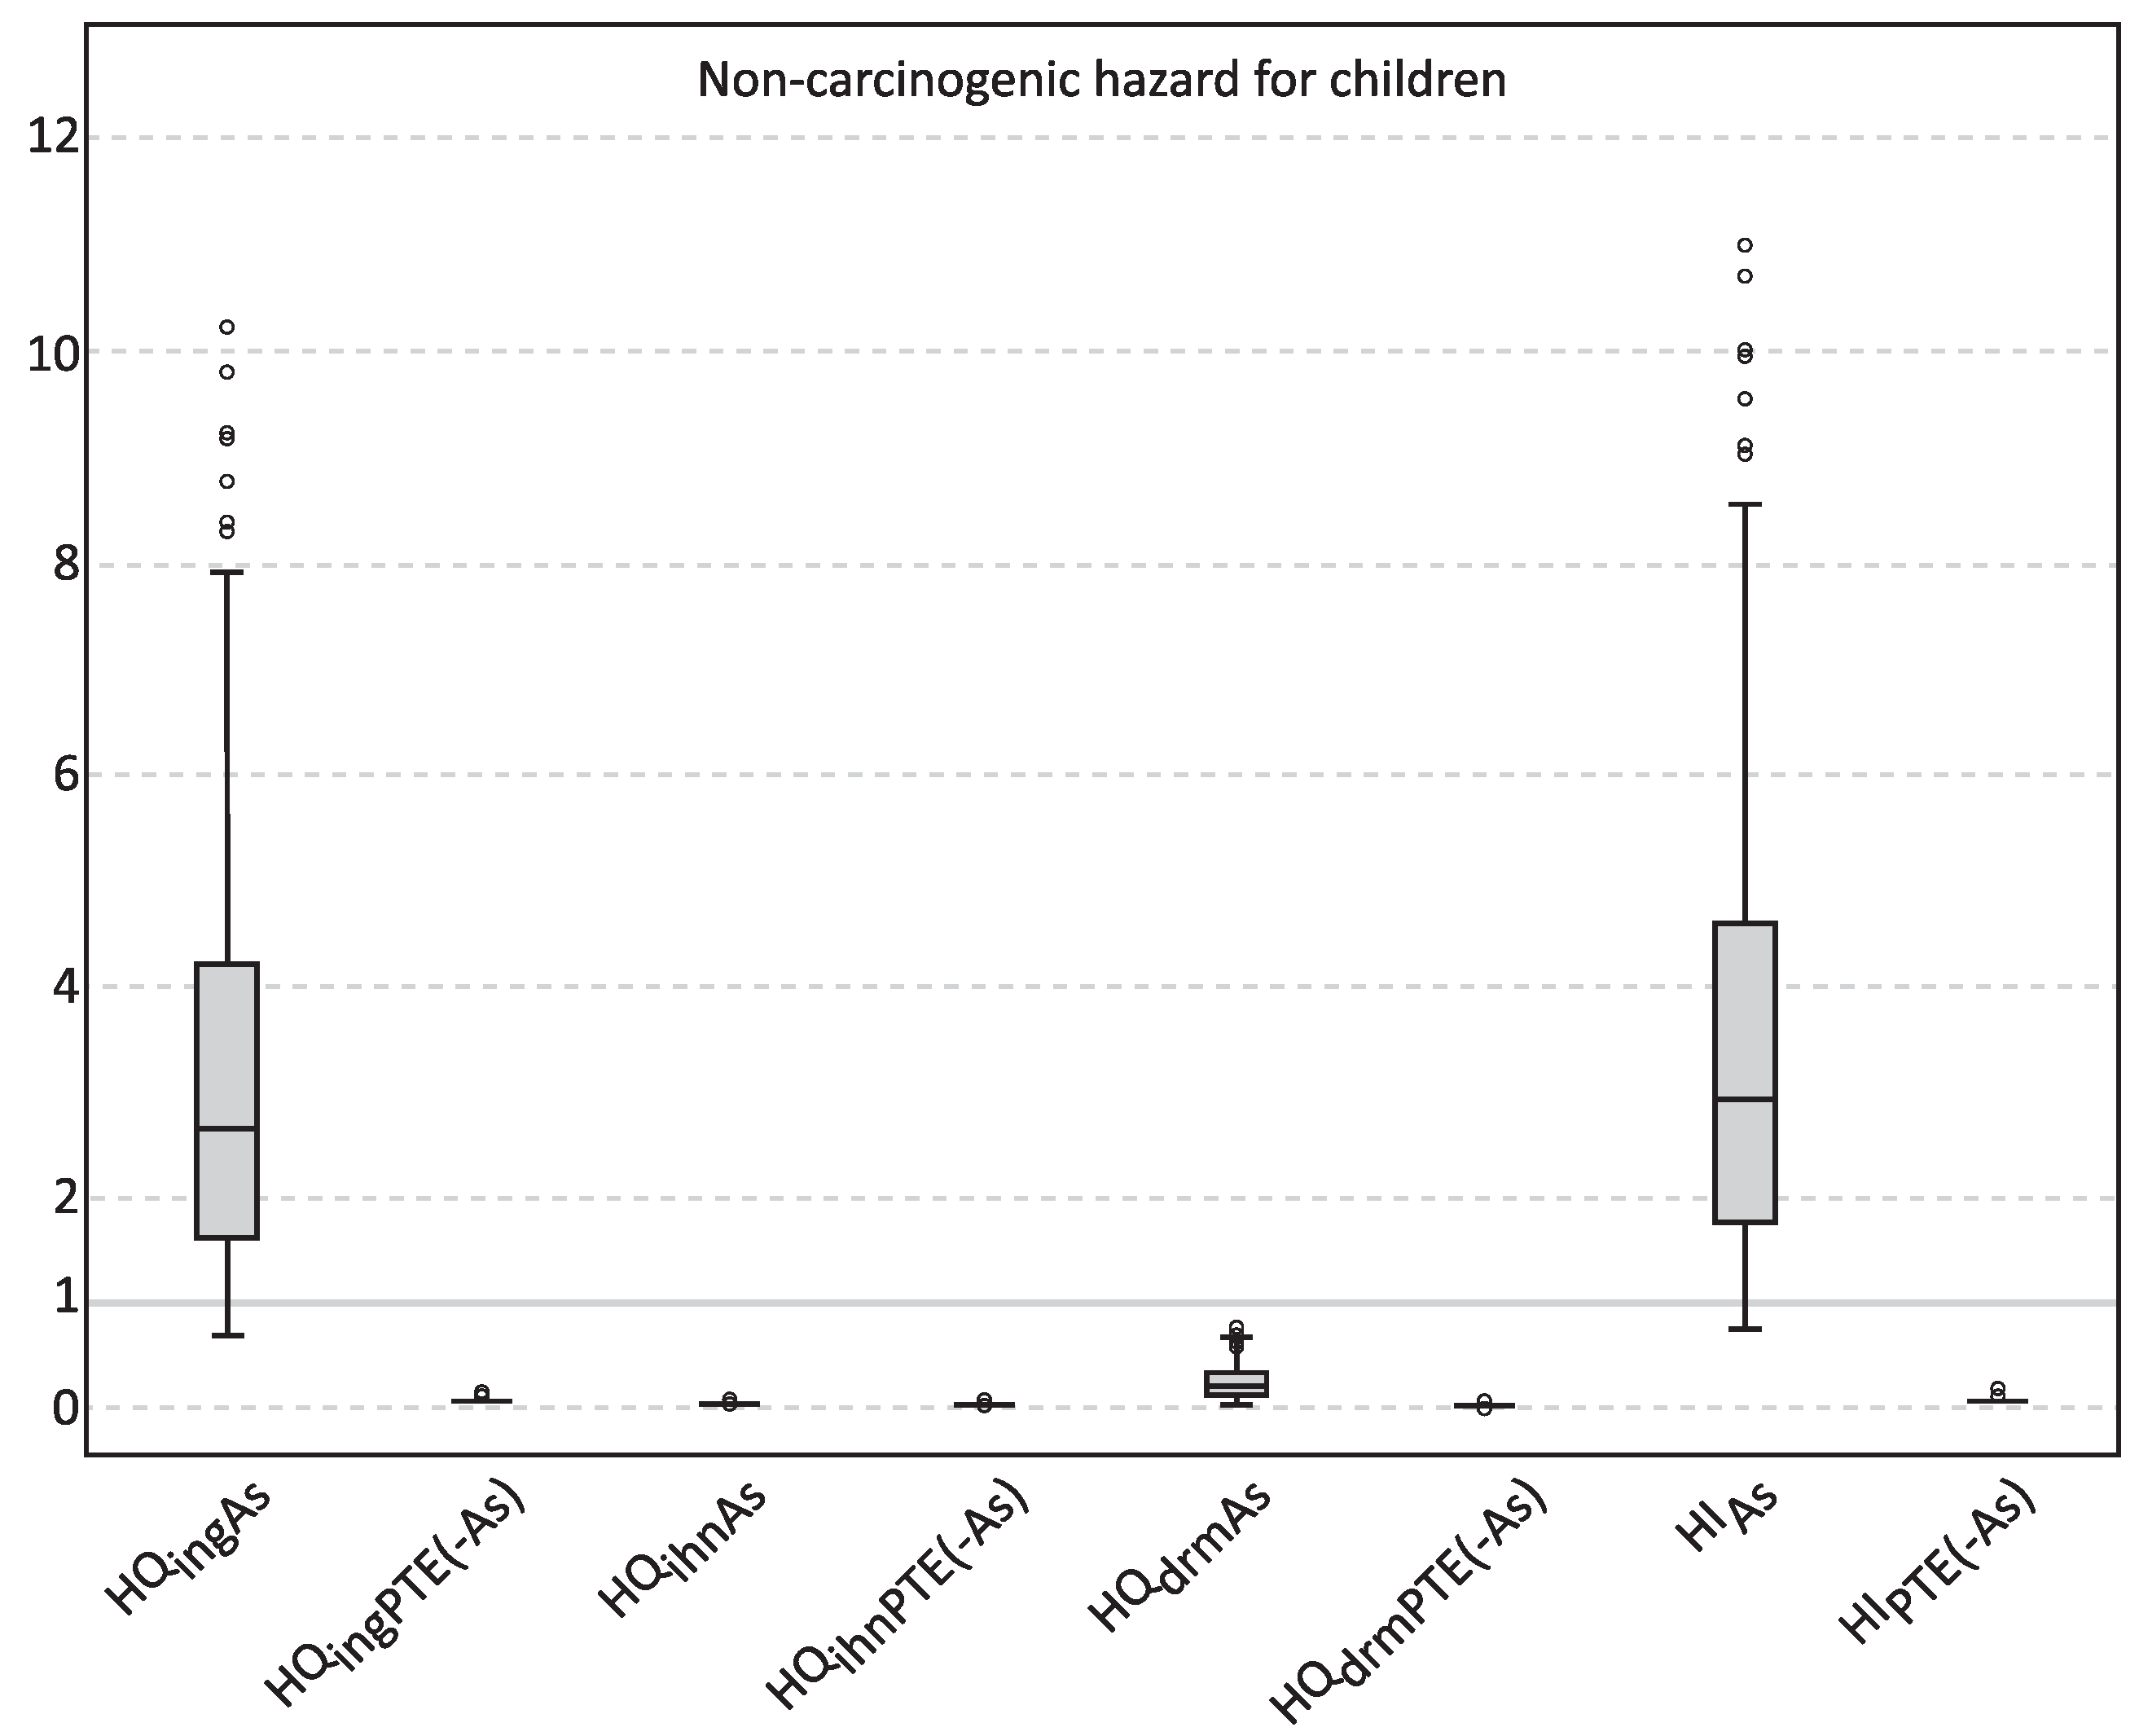
The non-carcinogenic effects considered the most conservative exposure condition—children (1–6 years old). The potentially toxic elements defined in this study (Ag, Cd, Cu, W and Zn), apart from As, do not present a non-carcinogenic hazard for children in the Panasqueira area (maximum HIchild-Ag,Cd,Cu,W,Zn ≤ 0.37). The As non-carcinogenic hazard median values, estimated for the different exposure routes were HQing-As (2.75) >> HQdrm-As (0.23) >> HQinh-As (0.00). HIchild-As values ranged between 0.78 and 69.50, with a median value of 2.98 ≈ HQing-As (2.70), due to the ingestion hazard quotient ranging between 0.72 and 64.10. These results (<1—safe level) indicate that there is a cause for concern for the non-cancer health effects for children living in the Panasqueira study area, mainly due to As oral ingestion, with HQing-As showing median values above one (Figure 7).
Figure 7. Comparative boxplot distribution of the Non-carcinogenic Hazard Quotient for children of As for Ingestion (HQingAs), Inhalation (HQihnAs), Dermal contact (HQdrmAs) routes, the Cumulative Hazard Index (HIAs) and the sum of the Non-carcinogenic Hazard Quotient of the other defined PTEs (Ag, Cd, Cu, W and Zn) for Ingestion (HQingPTE(-As)), Inhalation (HQihnPTE(-As)), Dermal contact (HQdrmPTE(-As)) routes and the Cumulative Hazard Index (HIPTE(-As)) for topsoil samples (tailing samples were removed) in the Panasqueira area. The extremes and outliers were removed.
Geosciences 04 00240 g007
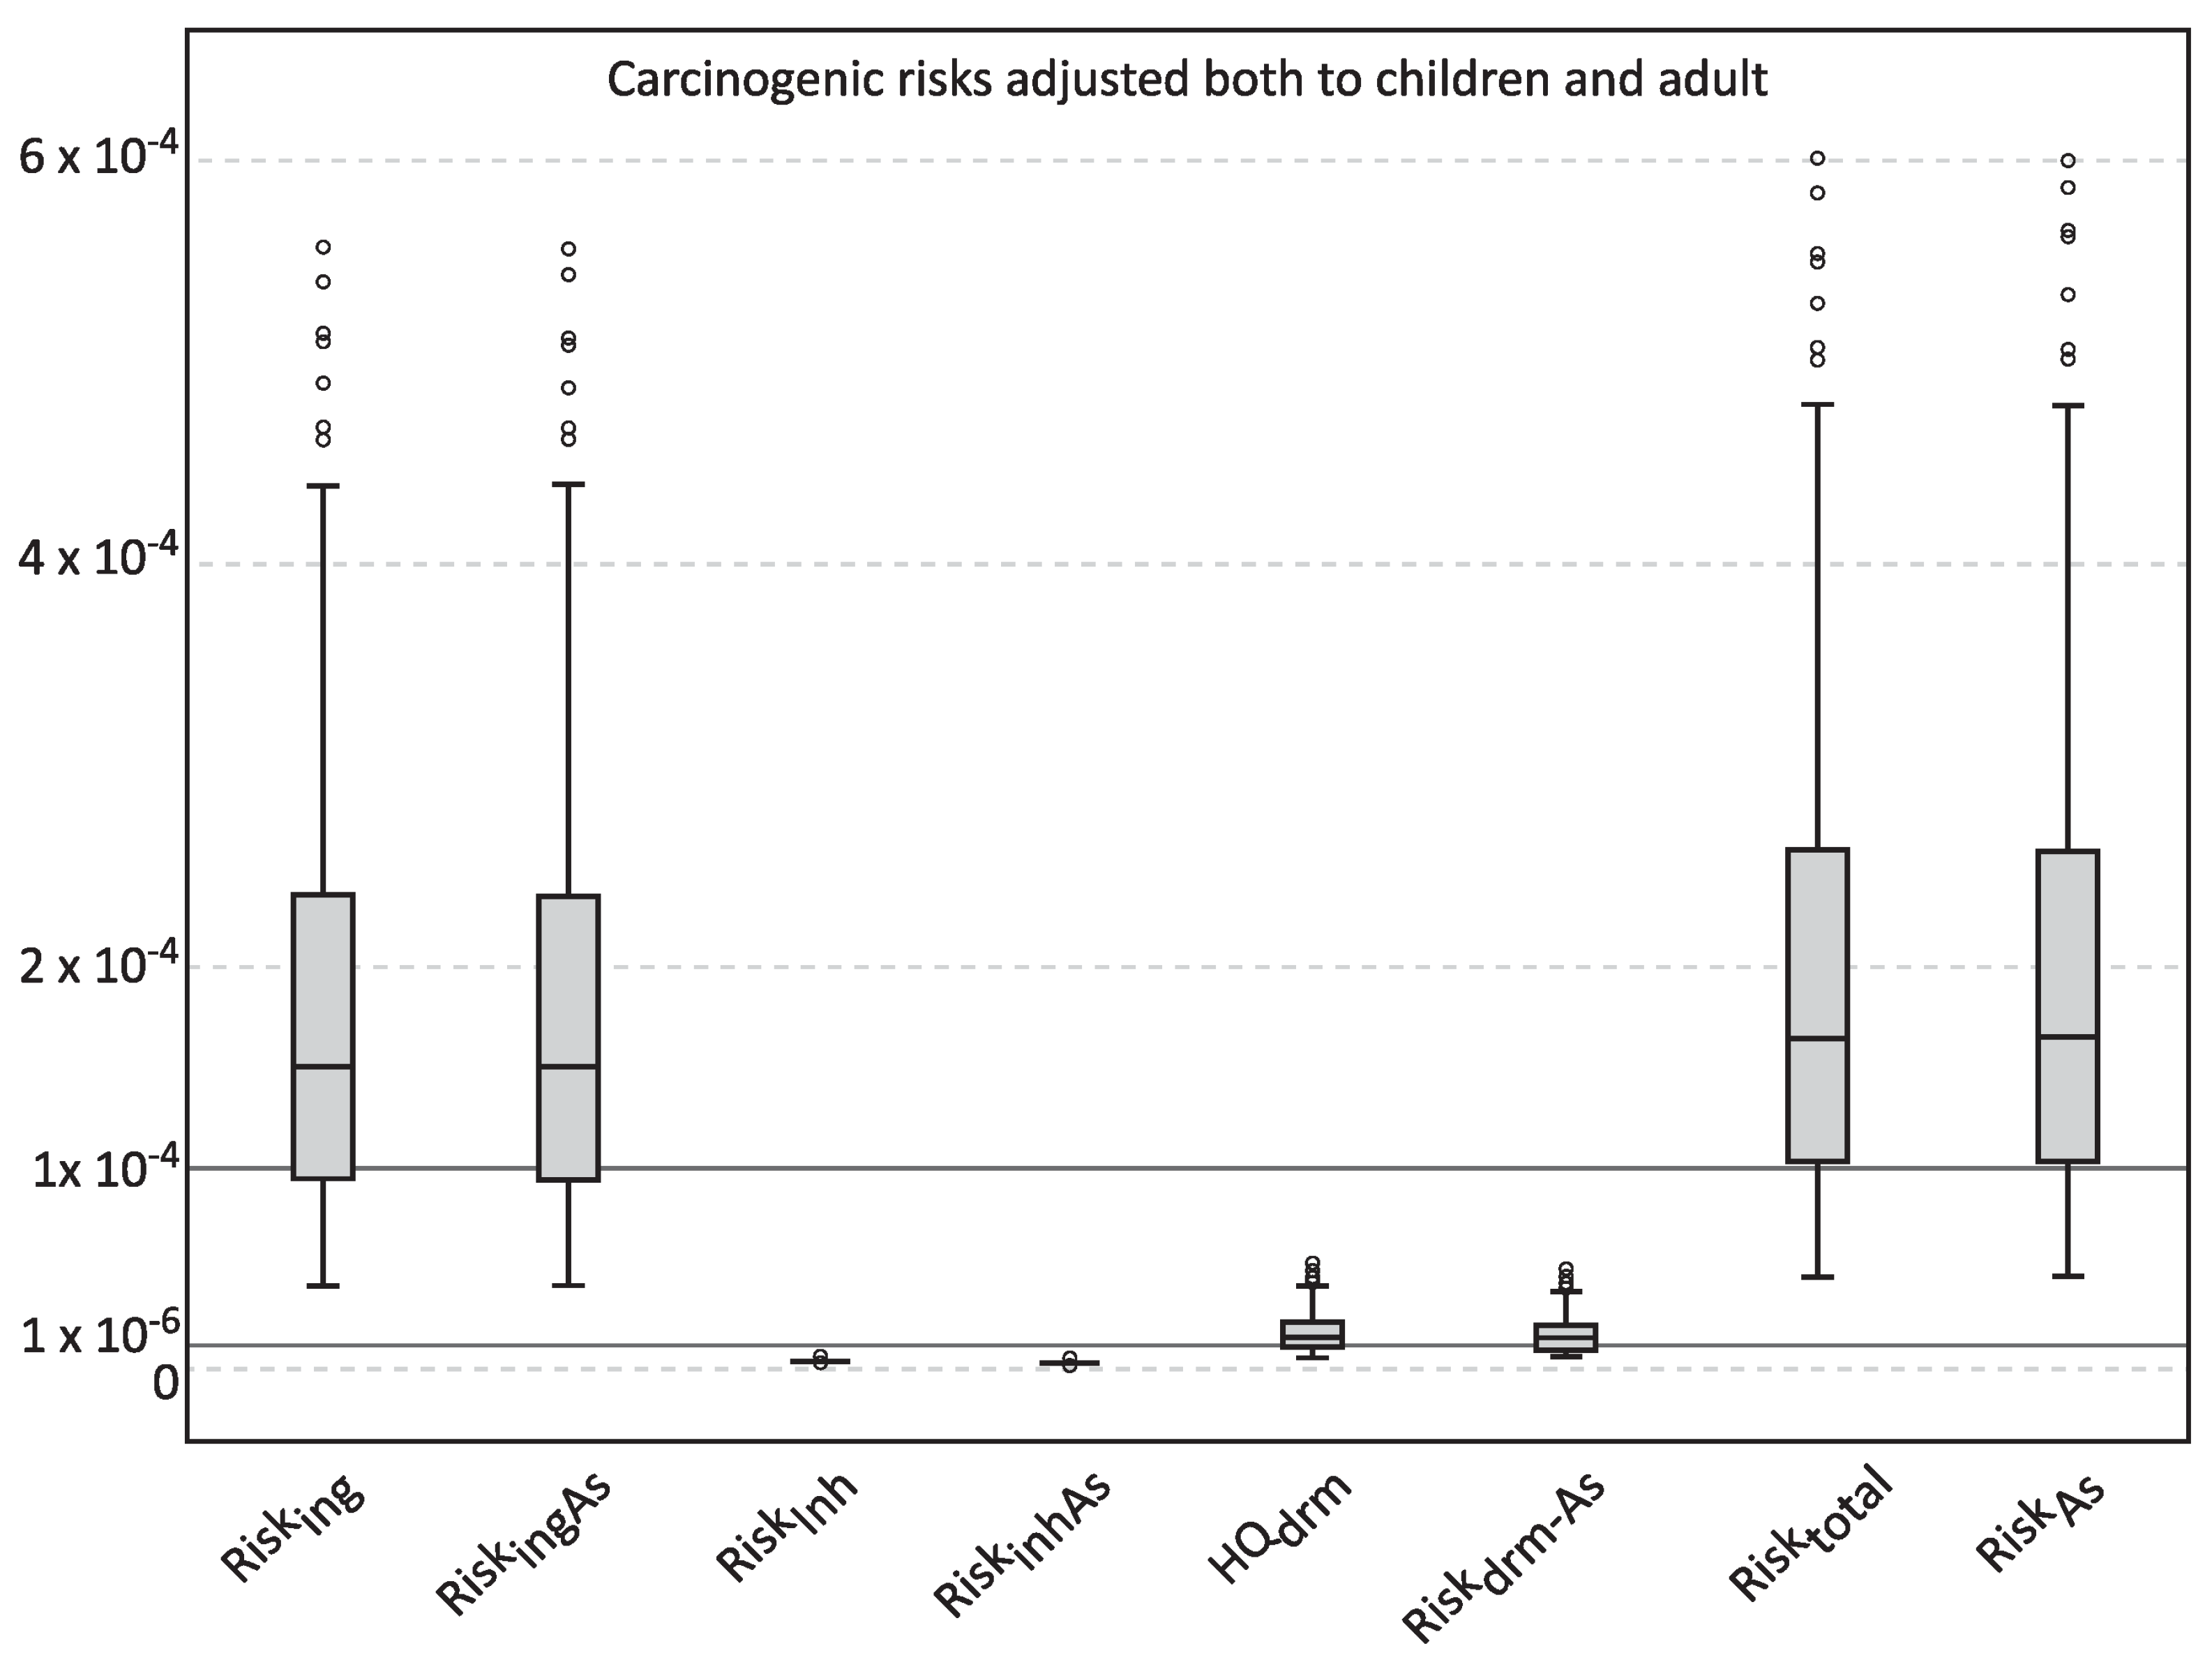
The carcinogenic risks adjusted both to children and adult were studied for the identified PTEs in this study. The median values of the different exposure routes and total risk were estimated. Their mean distribution were Risktotal (2.62 × 10⁻⁴) ≈ RiskAs (2.62 × 10⁻⁴) ≈ Risking (2.39 × 10⁻⁴) ≈ RiskingAs (2.39 × 10⁻⁴) >> Riskdrm (2.26 × 10⁻⁵) ≈ RiskdrmAs (2.26 × 10⁻⁵) >> Riskinh (1.32 × 10⁻⁷) ≈ RiskinhAs (1.32 × 10⁻⁷) (Figure 8). The high significance of As to cumulative carcinogenic elements risk is due to the very low risk displayed by the other elements. Furthermore, the representation of the exposure routes are distributed as: (a) Risking ≈ RiskingAs ranged 3.97 × 10⁻⁵–3.53 × 10⁻³, with a median value of 1.52 × 10⁻⁴; (b) Riskdrm ≈ RiskdrmAs ranged 3.76 × 10⁻⁶–3.34 × 10⁻⁴, with median value of 1.44 × 10⁻⁵; and (c) Riskinh ≈ RiskinhAs ranged 2.21 × 10⁻⁸–1.96 × 10⁻⁶, with median value of 8.38 × 10⁻⁸. The cumulative pathway Risktotal ≈ RiskAs ranged 4.35 × 10⁻⁵–3.87 × 10⁻³, with a median Risktotal of 1.66 × 10⁻⁴ mostly due to RiskingAs. Intake of As may cause cancer in several human organs through ingestion, and lung and skin cancer through inhalation [28]. Moreover, the Risking represents 91.29% of cumulative risk from exposure routes, while Riskdrm (8.69%) and Riskinh (0.05%) have less significance. Similar results were obtained in other studies [77,91,92,93,94]. The cumulative median Riskdrm is > 1 × 10⁻⁶ for all samples, of which 69.67% > 1 × 10⁻⁵, and the cumulative exposure route median Risking is > 1 × 10⁻⁵ for all samples, being 72.13% > 1 × 10
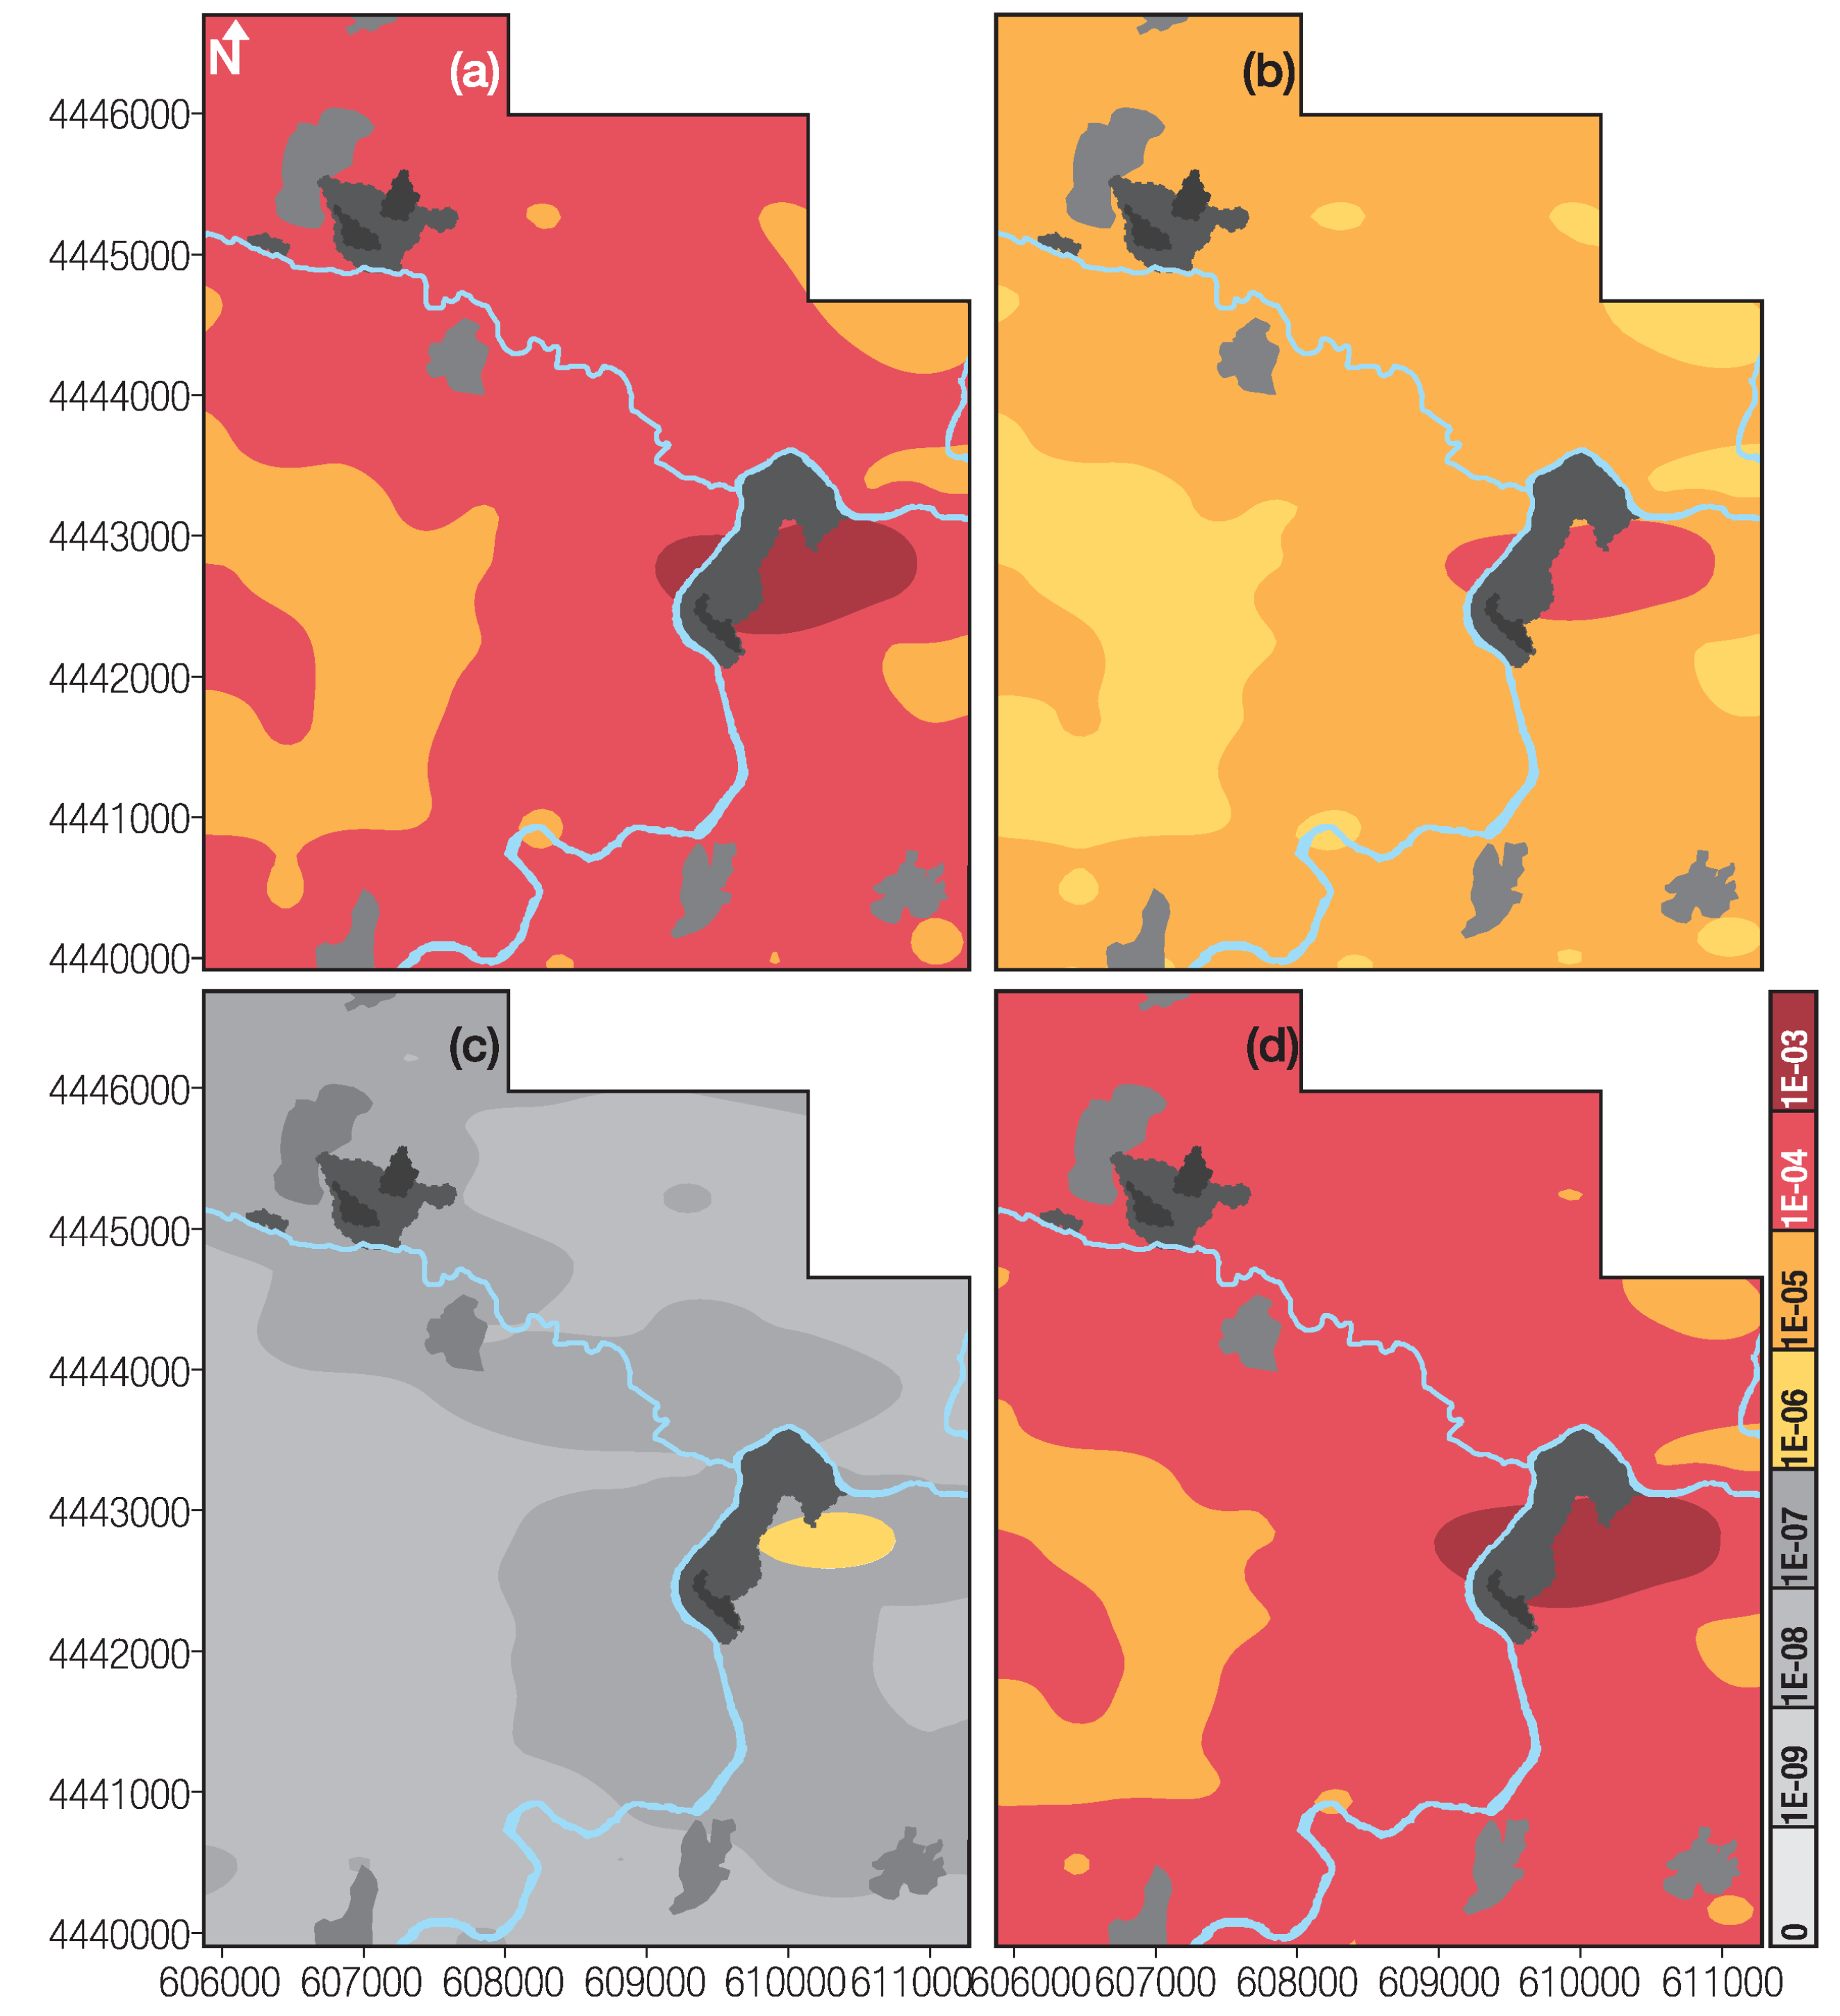
⁻⁴. These results show that there is a very high As ingestion cancer risk. The samples with higher hazard are located in and around the villages of the study area, being the more representative results found nearby the large tailing piles and open air impoundments (Figure 9). Although the median Riskdrm value is lower and between 1 × 10⁻⁶ and 1 × 10⁻⁴, and is considered as acceptable, it cannot, however, be negligible in the Panasqueira mining area, once all samples exceed the target value (1 × 10⁻⁶). While the sum of exposure pathways is RiskCd = 1.09 × 10⁻¹⁰ (<1 × 10⁻⁶), it should be noted that it is the cumulative toxic metal and kidney index that is the main target for Cd toxicity [26,95].
Figure 8. Comparative boxplot distribution of the Carcinogenic Risk adjusted to both children and adult for total PTEs (Ag, As, Cd, Cu, W and Zn) for Ingestion (Risking), Inhalation (Riskinh), Dermal contact (Riskdrm) routes, the Cumulative Risk (Risktotal) and the Carcinogenic Risk of As for Ingestion (RiskingAs), Inhalation (RiskinhAs), Dermal (RiskdrmAs) routes and the Cumulative Risk (RiskAs) for topsoil samples (tailing samples were removed) of the Panasqueira area. The extremes and outliers were removed.
Geosciences 04 00240 g008
As the risk analyses showed that ingestion is the most important pathway, further studies should be carried out in order to estimate the metal bioaccessibility in human receptors, such as a simplified in vitro physiologically based extraction test (PBET), allowing the estimation of the percentage of the bioaccessible orally ingested fraction of each metal from soil samples [77,80,96]. Additional investigations must be made on different sample media, such as vegetables, rhizosphere, irrigation and drinking water and street dust in the local villages under influence of mining activities (such as S. Francisco de Assis and Barroca) and also in non-exposed villages considered as reference areas (such as Casegas and Unhais-o-Velho). These studies will provide the necessary data and information for the determination of the influence of the Panasqueira mine activities, through more than 110 years, on the surrounding population, and should be complemented by biological studies [97].
Figure 9. Spatial distribution of the Carcinogenic risk adjusted for both children and adult considering (a) ingestion; (b) dermal contact; (c) inhalation routes; and (d) the cumulative Risk.
Geosciences 04 00240 g009

4. Conclusions

The mining and beneficiation process generates huge quantities of waste materials from the ore extraction and milling operations, which accumulate in tailings and open impoundments and are largely responsible for the high levels of metals(loid)s released into the surrounding environment. At the Panasqueira mine, the mining activities have produced sulphide-rich mine wastes that are responsible for the high levels of metals at Barroca Grande and Rio tailings. The oxidation of these sulphides may give rise to the mobilization and migration of trace metals from the mining wastes into the soil. Heavy metal soil contamination is an outstanding example of environmental risk. Metal(loid)s, such as As, Cd or Pb, for example, are toxic for humans, as well as for animals, and can even lead to death if ingested in large doses, or over large periods of time. Exposure to hazardous elements may have different pathways, such as ingestion, dermal absorption and inhalation of soil particles present in the air.
Collection of surface soil permits the characterization of anthropogenic contamination, caused by the presence of tailings and open air impoundments. Such soil, classified globally as very acid to acid, occurs in areas with very low soil pH values, which are related to areas with the highest SOM values. The metal assemblage identified in these soil types (Ag, As, Bi, Cd, Cu, W and Zn) show highest values in topsoil samples (0–15 cm), when compared with the values of the corresponding subsoil samples below 15 cm depth. Soil samples from both depths have higher contents when compared to the estimated local geochemical background. These results show the influence of the metal-rich mine wastes, stored in Barroca Grande and Rio tailings and in the open impoundments, as the main source of pollution of the surrounding environment, possibly due to aerial transport and deposition.
Very strong correlations were estimated between the PTEs and between PTEs and pH. The strongest correlations were Ag/Cu, As/Ag and Bi/W. The PTEs and pH positive correlation, confirm the findings of other studies that heavy metal mobility holds a positive correlation with pH, affecting their availability.
The ANOVA results, showed significant variations with depth, and the majority of the PTEs (Ag, As, Bi, Cd and W) and pH exhibit a significant variation for Ag, W and Zn.
According to the calculated contamination factor (CF) and the modified degree of contamination (mCd), 7.4% of the soil samples were classified as having no to low degree of pollution with mCd < 2.0 and 92.6% registered moderate to ultra-high degree of pollution with mCd ≥ 2.0. The spatial distribution of the mCd reveals areas with a very high degree of contamination. The highest mCd values were identified near Barroca Grande, São Francisco de Assis and Rio, and confirm the mechanical and chemical dispersion from tailings.
The risk factor estimated for individual element potential pollution factor and potential ecological risk, revealed at both soil sample depths that As, Cu and Zn have a low potential ecological risk, W low risk in subsoil, but a very high risk in topsoil samples; Ag moderate to considerable ecological risk and Cd is the worst element, exhibiting a very high environmental risk. The estimated potential ecological risk (PERI) classifies samples from both depths with a very high risk. In the PERI spatial distribution, topsoil has a wide area classified with a very high ecological risk, consistent with wind direction, water courses and current and previous exploration and beneficiation locations.
The non-carcinogenic hazard effects, determined for children (1–6 years old), indicated that the PTEs (Ag, Cd, Cu, W and Zn) do not present a non-carcinogenic hazard for children, while the As value is high, representing a risk for the non-cancer health effects for children in the Panasqueira area. The carcinogenic risk for both children and adults, revealed a very high cancer risk due to As ingestion, which may cause cancer to several human organs cancer through ingestion, and lung and skin cancer through inhalation.
Further studies should be carried out in order to estimate the metal bioaccessibility in human receptors.

Acknowledgments

This research is financially supported by FCT—Fundação para a Ciência e a Tecnologia (grants SFRH/BD/63349/2009).

Author Contributions

The original idea of the study was designed on a brainstorm meeting by all authors. E. Ferreira da Silva and J. P. Teixeira were responsible for recruitment and follow-up of study participants. All authors participated on the field work. C. Candeias and P. F. Ávila were responsible for data cleaning and analyses. C. Candeias drafted the manuscript with collaboration of all authors and it was revised by all. All authors read and approved the final manuscript.

Conflicts of Interest

The authors declare no conflict of interests.

References

  1. Cohen, R.R.H.; Gorman, J. Mining-related nonpoint-source pollution. Water Environ. Technol. 1991, 3, 55–59. [Google Scholar]
  2. Merson, J. Mining with microbes. N. Sci. 1992, 133, 9–17. [Google Scholar]
  3. Evangelou, V.P.B.; Zhang, Y.L. A review: Pyrite oxidation mechanisms and acid mine drainage prevention. Crit. Rev. Environ. Sci. Technol. 1995, 25, 141–199. [Google Scholar] [CrossRef]
  4. Larocque, A.C.L.; Rasmussen, P.E. An overview of trace metals in the environment, from mobilization to remediation. Environ. Geol. 1998, 33, 85–91. [Google Scholar] [CrossRef]
  5. Soucek, D.J.; Cherry, D.S.; Currie, R.J. Laboratory to field validation in an integrative assessment of an acid mine drainage-impacted watershed. Environ. Toxicol. Chem. 2000, 19, 1036–1043. [Google Scholar]
  6. Candeias, C. Modelling the Impact of Panasqueira Mine in the Ecosystems and Human Health: A Multidisciplinar Approach. Ph.D. Thesis, Aveiro University/Porto University, Aveiro, Portugal, 2013. [Google Scholar]
  7. Rasmussen, P.E. Long-range atmospheric transport of trace metals: The need for geosciences perspectives. Environ. Geol. 1998, 33, 96–108. [Google Scholar] [CrossRef]
  8. Yukselen, M.A.; Alpaslan, B. Leaching of metals from soil contaminated by mining activities. J. Hazard Mater. 2001, 87, 289–300. [Google Scholar] [CrossRef]
  9. Chen, X.; Wright, J.V.; Conca, J.L.; Peurrung, L.M. Evaluation of heavy metal remediation using mineral apatite. Water Air Soil Pollut. 1997, 98, 57–78. [Google Scholar]
  10. Bosso, S.T.; Enzweiler, J. Bioaccessible lead in soils, slag, and mine wastes from an abandoned mining district in Brazil. Environ. Geochem. Health 2008, 30, 219–229. [Google Scholar] [CrossRef] [PubMed]
  11. Douay, F.; Pruvot, C.; Roussel, H.; Ciesielski, H.; Fourrier, H.; Proix, N.; Waterlot, C. Contamination of urban soils in an area of Northern France polluted by dust emissions of two smelters. Water Air Soil Pollut. 2008, 188, 247–260. [Google Scholar] [CrossRef]
  12. Roussel, H.; Waterlot, C.; Pelfrêne, A.; Pruvot, C.; Mazzuca, M.; Douay, F. Cd, Pb and Zn Oral Bioaccessibility of urban soils contaminated in the past by atmospheric emissions from two lead and zinc smelters. Arch. Environ. Contam. Toxicol. 2010, 58, 945–954. [Google Scholar] [CrossRef] [PubMed]
  13. Juhasz, A.L.; Weber, J.; Smith, E. Impact of soil particle size and bioaccessibility on children and adult lead. J. Hazard Mater. 2011, 186, 1870–1879. [Google Scholar] [CrossRef] [PubMed]
  14. Ettler, V.; Kribek, B.; Majer, V.; Knesl, I.; Mihaljevic, I. Differences in the bioaccessibility of metals/metalloids in soils from mining smelting areas (Copperbelt, Zambia). J. Geochem. Explor. 2012, 113, 68–75. [Google Scholar] [CrossRef]
  15. Banza, C.L.N.; Nawrot, T.S.; Haufroid, V.; Decre, S.; de Putter, T.; Smolders, E.; Kabyla, B.I.; Luboya, O.N.; Ilunga, A.N.; Mutombo, A.M.; et al. High human exposure to cobalt and other metals in Katanga, a mining area of the Democratic Republic of Congo. Environ. Res. 2009, 109, 745–752. [Google Scholar] [CrossRef] [PubMed]
  16. Radojevic, M.; Bashki, V.N. Practical Environmental Analysis; The Royal Society of Chemistry: Cambridge, UK, 2006. [Google Scholar]
  17. Krishnamurti, G.S.R.; Huang, P.M.; Kozak, L.M. Sorption and desorption kinetics of cadmium from soils: Influence of phosphate. Soil Sci. 1999, 164, 888–898. [Google Scholar] [CrossRef]
  18. Antoniadis, V.; Robinson, J.S.; Alloway, B.J. Effects of short-term pH fluctuations on cadmium, nickel, lead, and zinc availability to ryegrass in a sewage sludge-amended field. Chemosphere 2008, 71, 759–764. [Google Scholar] [CrossRef] [PubMed]
  19. Mühlbachová, G.; Simon, T.; Pechová, M. The availability of Cd, Pb and Zn and their relationships with soil pH and microbial biomass in soils amended by natural clinoptilolite. Plant Soil Environ. 2005, 51, 26–33. [Google Scholar]
  20. Zhao, K.L.; Liu, X.M.; Xu, J.M.; Selim, H.M. Heavy metal contaminations in a soil-rice system: Identification of spatial dependence in relation to soil properties of paddy fields. J. Hazard Mater. 2010, 181, 778–787. [Google Scholar] [CrossRef] [PubMed]
  21. Zeng, F.; Ali, S.; Zhang, H.; Ouyang, Y.; Qiu, B.; Wu, F.; Zhang, G. The influence of pH and organic matter content in paddy soil on heavy metal availability and their uptake by rice plants. Environ. Pollut. 2011, 159, 84–91. [Google Scholar] [CrossRef] [PubMed]
  22. Sukreeyapongse, O.; Holme, P.E.; Strobel, B.W.; Panichsakpatana, S.; Magid, J.; Hansen, H.C.B. pH-dependent release of cadmium, copper, and lead from natural and sludge-amended soils. J. Environ. Qual. 2002, 31, 1901–1909. [Google Scholar] [CrossRef] [PubMed]
  23. Oliver, D.P.; Tiller, K.G.; Connyers, M.K.; Sattery, W.J.; Alston, A.M.; Merry, R.H. Effectiveness of liming to minimise uptake of cadmium by wheat and barley grain grown in the field. Aust. J. Agric. Res. 1996, 47, 1181–1193. [Google Scholar] [CrossRef]
  24. Braillier, S.; Harrison, R.B.; Hennry, C.L.; Dogsen, X. Liming effects on availability of Cd, Cu, Ni and Zn in a soil amended with sewage sludge 16 years previously. Water Air Soil Pollut. 2006, 86, 195–206. [Google Scholar] [CrossRef]
  25. Du Laing, G.; Vanthuyne, D.R.J.; Vandecasteele, B.; Tack, F.M.G.; Verloo, M.G. Influence of hydrological regime on pore water metal concentrations in a contaminated sediment-derived soil. Environ. Pollut. 2007, 147, 615–625. [Google Scholar]
  26. Zheng, N.; Liu, J.; Wang, Q.; Liang, Z. Health risk assessment of heavy metal exposure to street dust in the zinc smelting district, Northeast of China. Sci. Total Environ. 2010, 408, 726–733. [Google Scholar] [CrossRef] [PubMed]
  27. Mudgal, V.; Madaan, N.; Mudgal, A.; Singh, R.B.; Mishra, S. Effect of toxic metals on human health. Open Nutraceuticals J. 2010, 3, 94–99. [Google Scholar]
  28. U.S. Department of Energy. The Risk Assessment Information System (RAIS); U.S. Department of Energy’s Oak Ridge Operations Office (ORO): Oak Ridge, TN, USA, 2013. [Google Scholar]
  29. Agency for Toxic Substances and Disease Registry. Available online: http://www.atsdr.cdc.gov/ (accessed on 23 September 2014).
  30. World Health Organization (WHO). Monographs-Analytical and Toxicological Data. In Basic Analytical Toxicology; World Health Organization: Geneva, Switzerland, 2013. [Google Scholar]
  31. National Drug Formulary of Ethiopia; Drug Administration and Control Authority of Ethiopia (DACAE): Addis Ababa, Ethiopia, 2007.
  32. Candeias, C.; Ferreira da Silva, E.; Ávila, P.F.; Salgueiro, A.R.; Teixeira, J.P. Integrated approach to assess the environmental impact of mining activities: Multivariate statistical analysis to estimate the spatial distribution of soil contamination in the Panasqueira mining area (Central Portugal). Environ. Monit. Assess. 2014, in press. [Google Scholar]
  33. Smith, M. Panasqueira the tungsten giant at 100+. Oper. Focus. Int. Min. 2006, 33, 10–14. [Google Scholar]
  34. Thadeu, D. Geologia do couto mineiro da Panasqueira. Comunicações dos Serviços Geológicos de Portugal 1951, 32, 5–64. (In Portuguese) [Google Scholar]
  35. Bloot, C.; de Wolf, L.C.M. Geological features of the Panasqueira tin-tungsten ore occurrence (Portugal). Bol. Soc. Geol. Port. 1953, 11, 1–58. [Google Scholar]
  36. Kelly, W.C.; Rye, R.O. Geologic, fluid inclusion and stable isotope studies of the tin-tungsten deposits of Panasqueira, Portugal. Econ. Geol. 1979, 74, 1721–1822. [Google Scholar] [CrossRef]
  37. Polya, D.A. Chemistry of the main stage ore-forming fluids of the Panasqueira W-Cu(Ag)-Sn deposit, Portugal: Implications for models of ore genesis. Econ. Geol. 1989, 84, 1134–1152. [Google Scholar] [CrossRef]
  38. Noronha, F.; Dória, A.; Dubessy, J.; Charoy, B. Characterisation and timing of the different types of fluids present in the barren and ore-veins of the W-Sn deposit of Panasqueira, Central Portugal. Miner. Deposita 1992, 27, 72–79. [Google Scholar] [CrossRef]
  39. Correia, A.; Naique, R.A. Minas Panasqueira, 100 Years of Mining History. In Proceedings of the International Tungsten Industrial Association (ITIA) Conference, Salzburg, Austria, 20–22 October 1998.
  40. Corrêa de Sá, A.; Naique, R.A.; Nobre, E. Minas da Panasqueira: 100 anos de História. Bol. Minas 1999, 36, 3–22. (In Portuguese) [Google Scholar]
  41. e-Ecorisk, A Regional Enterprise Network Decision-Support System for Environmental Risk and Disaster Management of Large-Scale Industrial Soils, Contract n.° EGV1-CT-2002-00068; WP3–Case Study Site Characterization, Project Management Report for the Reporting Period, Deliverable 3.1; Joanneum Research Forschungsgeselfschaft—GMBH: Frohnleiten, Austria, 2007; not published.
  42. Ávila, P.; Ferreira da Silva, E.; Salgueiro, A.; Farinha, J.A. Geochemistry and Mineralogy of Mill Tailings Impoundments from the Panasqueira Mine (Portugal): Implications for the Surrounding Environment. Mine Water Environ. 2008, 27, 210–224. [Google Scholar] [CrossRef]
  43. Ferreira da Silva, E.; Ávila, P.F.; Salgueiro, A.R.; Candeias, C.; Pereira, H.G. Quantitative–spatial assessment of soil contamination in S. Francisco de Assis due to mining activity of the Panasqueira mine (Portugal). Environ. Sci. Pollut. Res. 2013, 20, 7534–7549. [Google Scholar]
  44. Candeias, C.; Melo, R.; Ávila, P.F.; Ferreira da Silva, E.; Salgueiro, A.R.; Teixeira, J.P. Heavy metal pollution in mine–soil–plant system in S. Francisco de Assis–Panasqueira mine (Portugal). Appl. Geochem. 2014, 44, 12–26. [Google Scholar]
  45. Jaques Ribeiro, L.M.; Gonçalves, A.C.R. Contributo para o conhecimento geológico e geomorfológico da área envolvente do Couto Mineiro da Panasqueira. Centro de Estudos de Geografia e Ordenamento do Território. Revista de Geografia e Ordenamento do Território 2013, 3, 93–116. (In Portuguese) [Google Scholar]
  46. Atlas do Potencial Eólico para Portugal Continental; Version 1.0 [CD-ROM]; ISBN 972-676-196-4; Instituto Nacional de Engenharia, Tecnologia e Inovação I.P. (INETI): Lisboa, Portugal, 2004. (In Portuguese)
  47. Reis, A.C. As Minas da Panasqueira. Bol. Minas 1971, 8, 3–34. (In Portuguese) [Google Scholar]
  48. Costa, P.; Estanqueiro, A. Development and Validation of the Portuguese Wind Atlas. In Proceedings of the European Wind Energy Conference, Athens, Greece, 27 February–2 March 2006.
  49. Costa, P.; Estanqueiro, A. Building a Wind Atlas for Mainland Portugal Using a Weather Type Classification. In Proceedings of the European Wind Energy Conference, Athens, Greece, 27 February–2 March 2006.
  50. Costa, P.A.S. Atlas do Potencial eólico para Portugal Continental. Master’s Thesis, University of Lisbon, Lisboa, Portugal, 2004. [Google Scholar]
  51. Turner, A.P. The responses of plants to heavy metals. In Toxic Metals in Soil-Plant Systems; Sheila, M.R., Ed.; John Wiley & Sons: Hoboken, NJ, USA, 1994. [Google Scholar]
  52. Mcbride, M.B.; Richards, B.; Steenhuis, T.; Russo, J.J.; Sauvé, S. Mobility and solubility of toxic metals and nutrients in soil fifteen years after sludge application. Soil Sci. 1997, 162, 487–500. [Google Scholar] [CrossRef]
  53. Van Reeuwijk, L.P. Procedures for Soil Analysis, 6th ed.; International Soil Reference and Information Centre: Wageningen, The Netherlands, 2002. [Google Scholar]
  54. ISO 10390:1994 Soil. In Soil Quality—Determination of pH; International Organization for Standardization: Geneva, Switzerland, 1995.
  55. Schnitzer, M.; Khan, S.U. Substances in the Environment; Marcel Dekker: New York, NY, USA, 1972. [Google Scholar]
  56. Stevenson, F.J. Humus Chemistry; Wiley: New York, NY, USA, 1982. [Google Scholar]
  57. Yin, Y.; Allen, H.E.; Huang, C.P.; Sparks, D.L.; Sanders, P.F. Kinetics of mercury (II): Adsorption and desorption on soil. Environ. Sci. Technol. 1997, 31, 496–503. [Google Scholar] [CrossRef]
  58. You, S.J.; Yin, Y.; Allen, H.E. Partitioning of organic matter in soils: Effects of pH and water soil ratio. Sci. Total Environ. 1999, 227, 155–160. [Google Scholar] [CrossRef]
  59. Zar, J.H. Biostatistical Analysis; Prentice Hall: New York, NY, USA, 1996. [Google Scholar]
  60. Johnson, R.A.; Wichern, D.W. Applied Multivariate Statistical Analysis; Prentice-Hall: New York, NY, USA, 1998. [Google Scholar]
  61. Corwin, D.L.; Lesh, S.M.; Oster, J.D.; Kaffka, S.R. Monitoring management-induced spatio-temporal changes in soil quality through soil sampling direct by apparent electrical conductivity. Geoderma 2006, 131, 369–387. [Google Scholar] [CrossRef]
  62. Hakanson, L. Ecological risk index for aquatic pollution control, a sedimentological approach. Water Res. 1980, 14, 975–1001. [Google Scholar] [CrossRef]
  63. Loska, K.; Wiechula, D.; Korus, I. Metal contamination of farming soils affected by industry. Environ. Int. 2004, 30, 159–165. [Google Scholar] [CrossRef] [PubMed]
  64. Liu, W.H.; Zhao, J.Z.; Ouyang, Z.Y.; Solderland, L.; Liu, G.H. Impacts of sewage irrigation on heavy metal distribution and contamination in Beijing, China. Environ. Int. 2005, 32, 805–812. [Google Scholar] [CrossRef]
  65. Tuckey, J.W. Exploratory Data Analysis; Addison Wesley: Boston, MA, USA, 1977. [Google Scholar]
  66. Abrahim, G.M.S.; Parker, R.J. Assessment of heavy metal enrichment factors and the degree of contamination in marine sediments from Tamaki Estuary, Auckland, New Zealand. Environ. Monit. Assess. 2008, 136, 227–238. [Google Scholar] [CrossRef] [PubMed]
  67. Reimann, C.; Caritat, P. Chemical Elements in the Environment: Factsheets for the Geochemist and Environmental Scientist; Springer: Berlin, Germany, 1998. [Google Scholar]
  68. Bowen, H.J.M. Trace Elements in Biochemistry; Academic Press: London, UK, 1966. [Google Scholar]
  69. U.S. Environmental Protection Agency (USEPA). Risk Assessment Guidance for Superfund, Volume I: Human Health Evaluation Manual; EPA 540-1-89-002; U.S. Environmental Protection Agency: Washington, DC, USA, 1989. [Google Scholar]
  70. U.S. Environmental Protection Agency (USEPA). Soil Screening Guidance: Technical Background Document; EPA 540-R-95-128; U.S. Environmental Protection Agency: Washington, DC, USA, 1996. [Google Scholar]
  71. Linders, J.B.H.J. Risicobeoordelino voor de mens bij blootstelling aan stoffen: Uitgangspunten en veronderstellingen. In Rapport/Rijksinstituut voor Volksgezondheid en Milieuhygiene (nr. 725201003); RIVM: Bilthoven, The Netherlands, 1990. (In Dutch) [Google Scholar]
  72. Berg, R.V.D. Human Exposure to Soil Contamination: A Qualitative and Quantitative Analysis towards Proposals for Human Toxicological Intervention Values (Partly Revised Edition); Report No. 725201011; National Institute for Public Health and the Environment: Bilthoven, The Netherlands, 1994. [Google Scholar]
  73. U.S. Environmental Protection Agency (USEPA). Risk Assessment Guidance for Superfund: Volume III–Part A, Process for Conducting Probabilistic Risk Assessment; EPA 540-R-02-002; U.S. Environmental Protection Agency: Washington, DC, USA, 2001. [Google Scholar]
  74. U.S. Environmental Protection Agency (USEPA). Integrated Risk Information System (IRIS); U.S. Environmental Protection Agency: Washington, DC, USA, 2013. [Google Scholar]
  75. INE. Portal do Instituto Nacional de Estatística—Statistics Portugal. Available online: http://www.ine.pt/ (accessed on 23 September 2014). (In Portuguese)
  76. U.S. Environmental Protection Agency (USEPA). Guidance for Evaluating the Oral Bioavailability of Metals in Soils for Use in Human Health Risk Assessment; OSWER 9285.7-80; U.S. Environmental Protection Agency: Washington, DC, USA, 2007. [Google Scholar]
  77. Luo, X.S.; Ding, J.; Xu, B.; Wang, Y.J.; Li, H.B.; Yu, S. Incorporating bioaccessibility into human health risk assessments of heavy metals in urban park soils. Sci. Total Environ. 2012, 424, 88–96. [Google Scholar] [CrossRef] [PubMed]
  78. Hu, X.; Zhang, Y.; Luo, J.; Wang, T.; Lian, H.; Ding, Z. Bioaccessibility and health risk of arsenic, mercury and other metals in urban street dusts from a mega-city, Nanjing, China. Environ. Pollut. 2011, 159, 1215–1221. [Google Scholar] [CrossRef] [PubMed]
  79. U.S. Environmental Protection Agency (USEPA). Screening Levels (RSL) for Chemical Contaminants at Superfund Sites; U.S. Environmental Protection Agency: Washington, DC, USA, 2013. [Google Scholar]
  80. Luo, X.S.; Yu, S.; Li, X.D. The mobility, bioavailability, and human bioaccessibility of trace metals in urban soils of Hong Kong. Appl. Geochem. 2012, 27, 995–1004. [Google Scholar] [CrossRef]
  81. U.S. Department of Agriculture. Available online: http://www.nrcs.usda.gov (accessed on 23 September 2014).
  82. Tidball, R.R.; Ebens, R.J. Regional geochemical baselines in soils of the Powder River Basin, Montana–Wyoming. In Geology and Energy Resources of the Powder River; 28th Annual Field Conference Guidebook; American Association of Petroleum Geologists (AAPG): Tulsa, OK, USA, 1976. [Google Scholar]
  83. Ministry of the Environment. Soil, Ground Water and Sediment Standards for the Use under Part XV.1 of the Environmental Protection Act; Ministry of the Environment: Ottawa, Canada, 2011. [Google Scholar]
  84. Fiedler, H.J.; Rösler, H.J. Spurenelemente in der Umwelt; Gustav Fischer Verlag: Jena, Germany, 2013. (In German) [Google Scholar]
  85. Mench, M. Notions sur les éléments en traces pour une qualité des sols et des produits végétaux. Purpan 1993, 166, 118–127. (In French) [Google Scholar]
  86. Deschamps, E.; Ciminelli, V.S.T.; Lange, F.T.; Matschullat, J.; Raue, B.; Schmidt, H. Soil and sediment geochemistry of the iron quadrangle, Brazil: The case of arsenic. J. Soils Sediment. 2002, 2, 216–222. [Google Scholar] [CrossRef]
  87. Ferreira, M.M.S.I. Dados Geoquímicos de Base de Solos de Portugal Continental, Utilizando Amostragem de Baixa Densidade. Ph.D. Thesis, University of Aveiro, Aveiro, Portugal, 2004. [Google Scholar]
  88. Yuan, G.; Lavkulich, L.M. Sorption behavior of copper, zinc, and cadmium in response to simulated changes in soil properties. Commun. Soil Sci. Plant Anal. 1997, 28, 571–587. [Google Scholar] [CrossRef]
  89. Hettiarachchi, G.M.; Ryan, J.A.; Chaney, R.L.; La Fleur, C.M. Sorption and desorption of cadmium by different fractions of biosolids-amended soils. J. Environ. Qual. 2003, 32, 1684–1693. [Google Scholar] [CrossRef] [PubMed]
  90. Qishlaqi, A.; Moore, F. Statistical analysis of accumulation and sources of heavy metals occurrence in agricultural soils of Khoshk River Banks, Shiraz, Iran. J. Agric. Environ. Sci. 2007, 2, 565–573. [Google Scholar]
  91. Chabukdhara, M.; Nema, A.K. Heavy metals assessment in urban soil around insutrial clusters in Ghaziabad, India: Probabilistic health risk approach. Ecotoxicol. Environ. Saf. 2013, 87, 57–64. [Google Scholar] [CrossRef] [PubMed]
  92. De Miguel, E.; Iribarren, I.; Chacón, E.; Ordoñez, A.; Charlesworth, S. Risk-based evaluation of the exposure of children to trace elements in playgrounds in Madrid (Spain). Chemosphere 2007, 66, 505–513. [Google Scholar]
  93. Ferreira-Baptista, L.; de Miguel, E. Geochemistry and risk assessment of street dust in Luanda, Angola: A tropical urban environment. Atmos. Environ. 2005, 39, 4501–4512. [Google Scholar] [CrossRef] [Green Version]
  94. Dudka, S.; Miller, W.P. Permissible concentrations of arsenic and lead in soils based on risk assessment. Water Air Soil Pollut. 1999, 113, 127–132. [Google Scholar] [CrossRef]
  95. De Burbure, C.; Buchet, J.P.; Bernard, A.; Leroyer, A.; Nisse, C.; Haguenoer, J.M.; Bergamaschi, E.; Mutti, A. Biomarkers of renal effects in children and adults with low environmental exposure to heavy metals. J. Toxicol. Environ. Health 2003, 66, 783–798. [Google Scholar] [CrossRef]
  96. Drexler, J.W.; Brattin, W.J. An in vitro procedure for estimation of lead relative bioavailability: With validation. Hum. Ecol. Risk Assess. 2007, 13, 383–401. [Google Scholar] [CrossRef]
  97. Coelho, P.; Costa, S.; Costa, C.; Silva, S.; Walter, A.; Ranville, J.; Pastorinho, R.; Harrington, C.; Taylor, A.; Dall’Armi, V.; et al. Biomonitoring of several toxic metal(loid)s in different biological matrices from environmentally and occupationally exposed populations from Panasqueira mine area, Portugal. Environ. Geochem. Health 2013, 36, 255–269. [Google Scholar] [CrossRef] [PubMed]

