
Measuring Beach Profiles along a Low-Wave Energy Microtidal Coast, West-Central Florida, USA

Abstract
:
1. Introduction
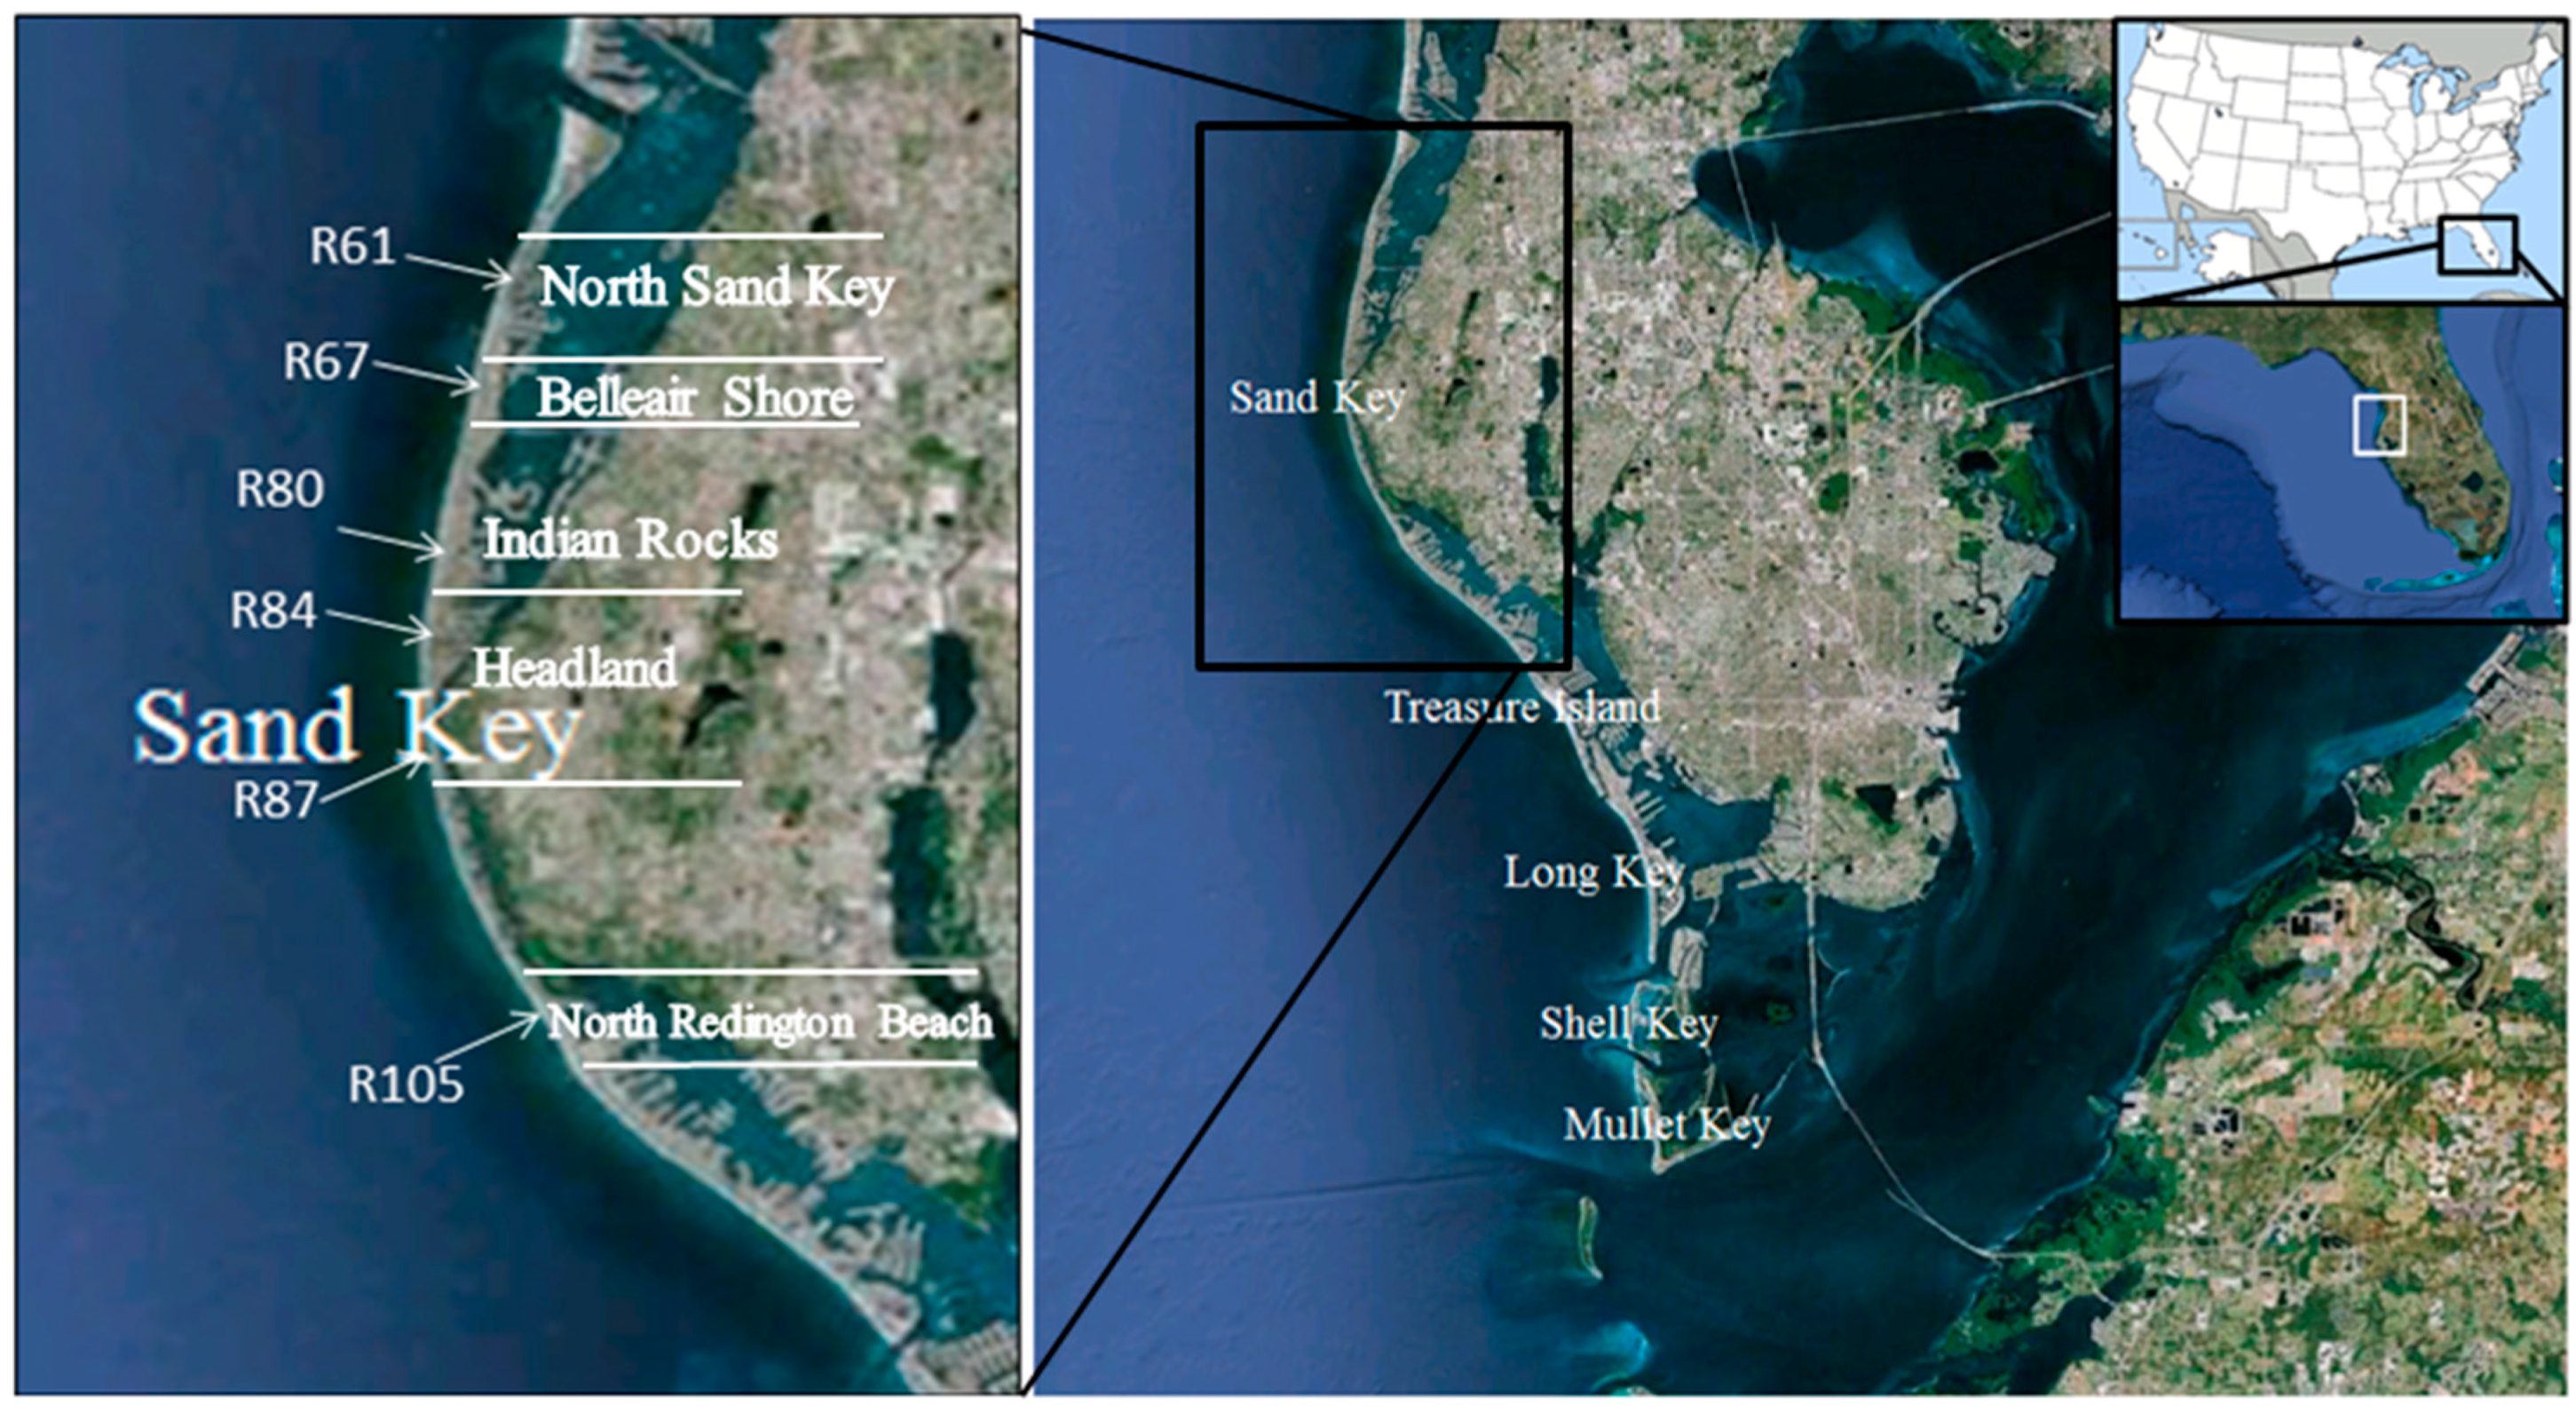
2. Study Area
3. Methodology
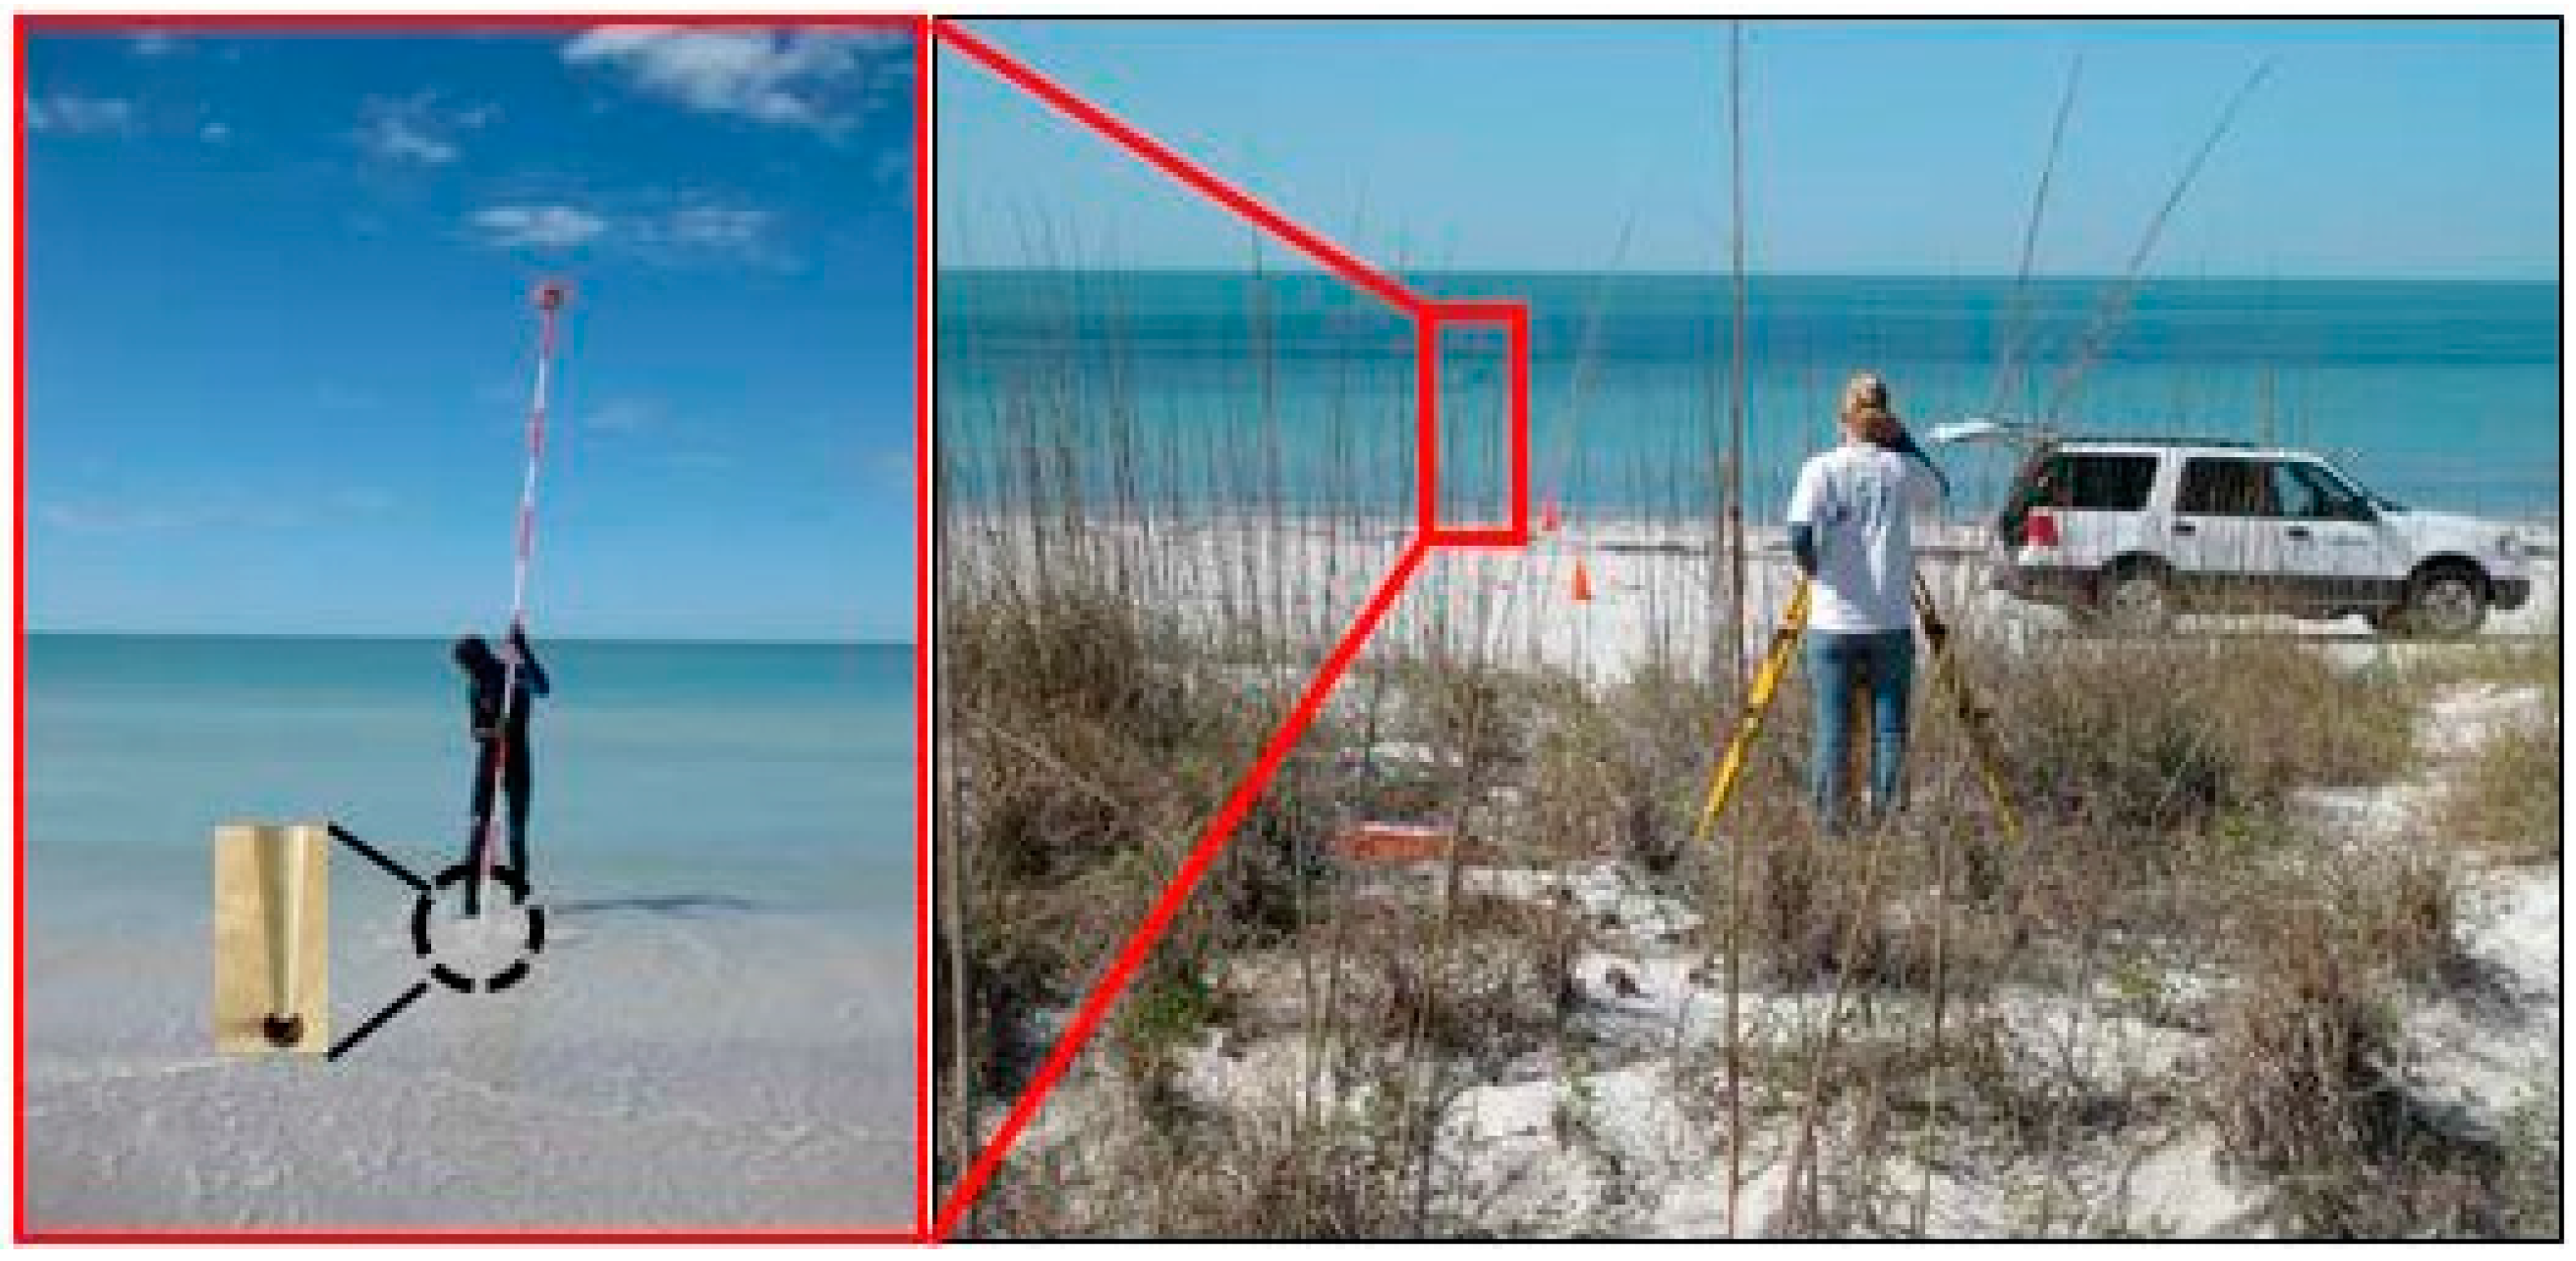
3.1. Measurement under Regular Conditions
3.2. Measurement under Special Conditions
4. Results and Discussion
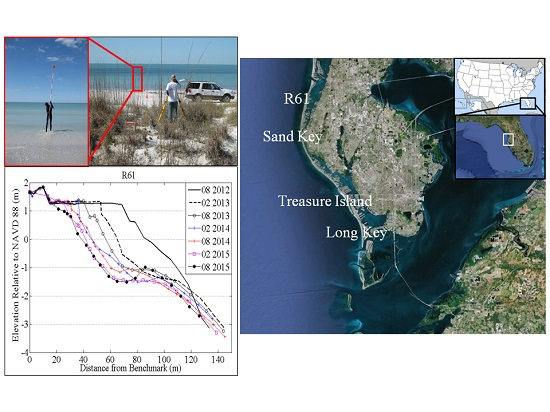
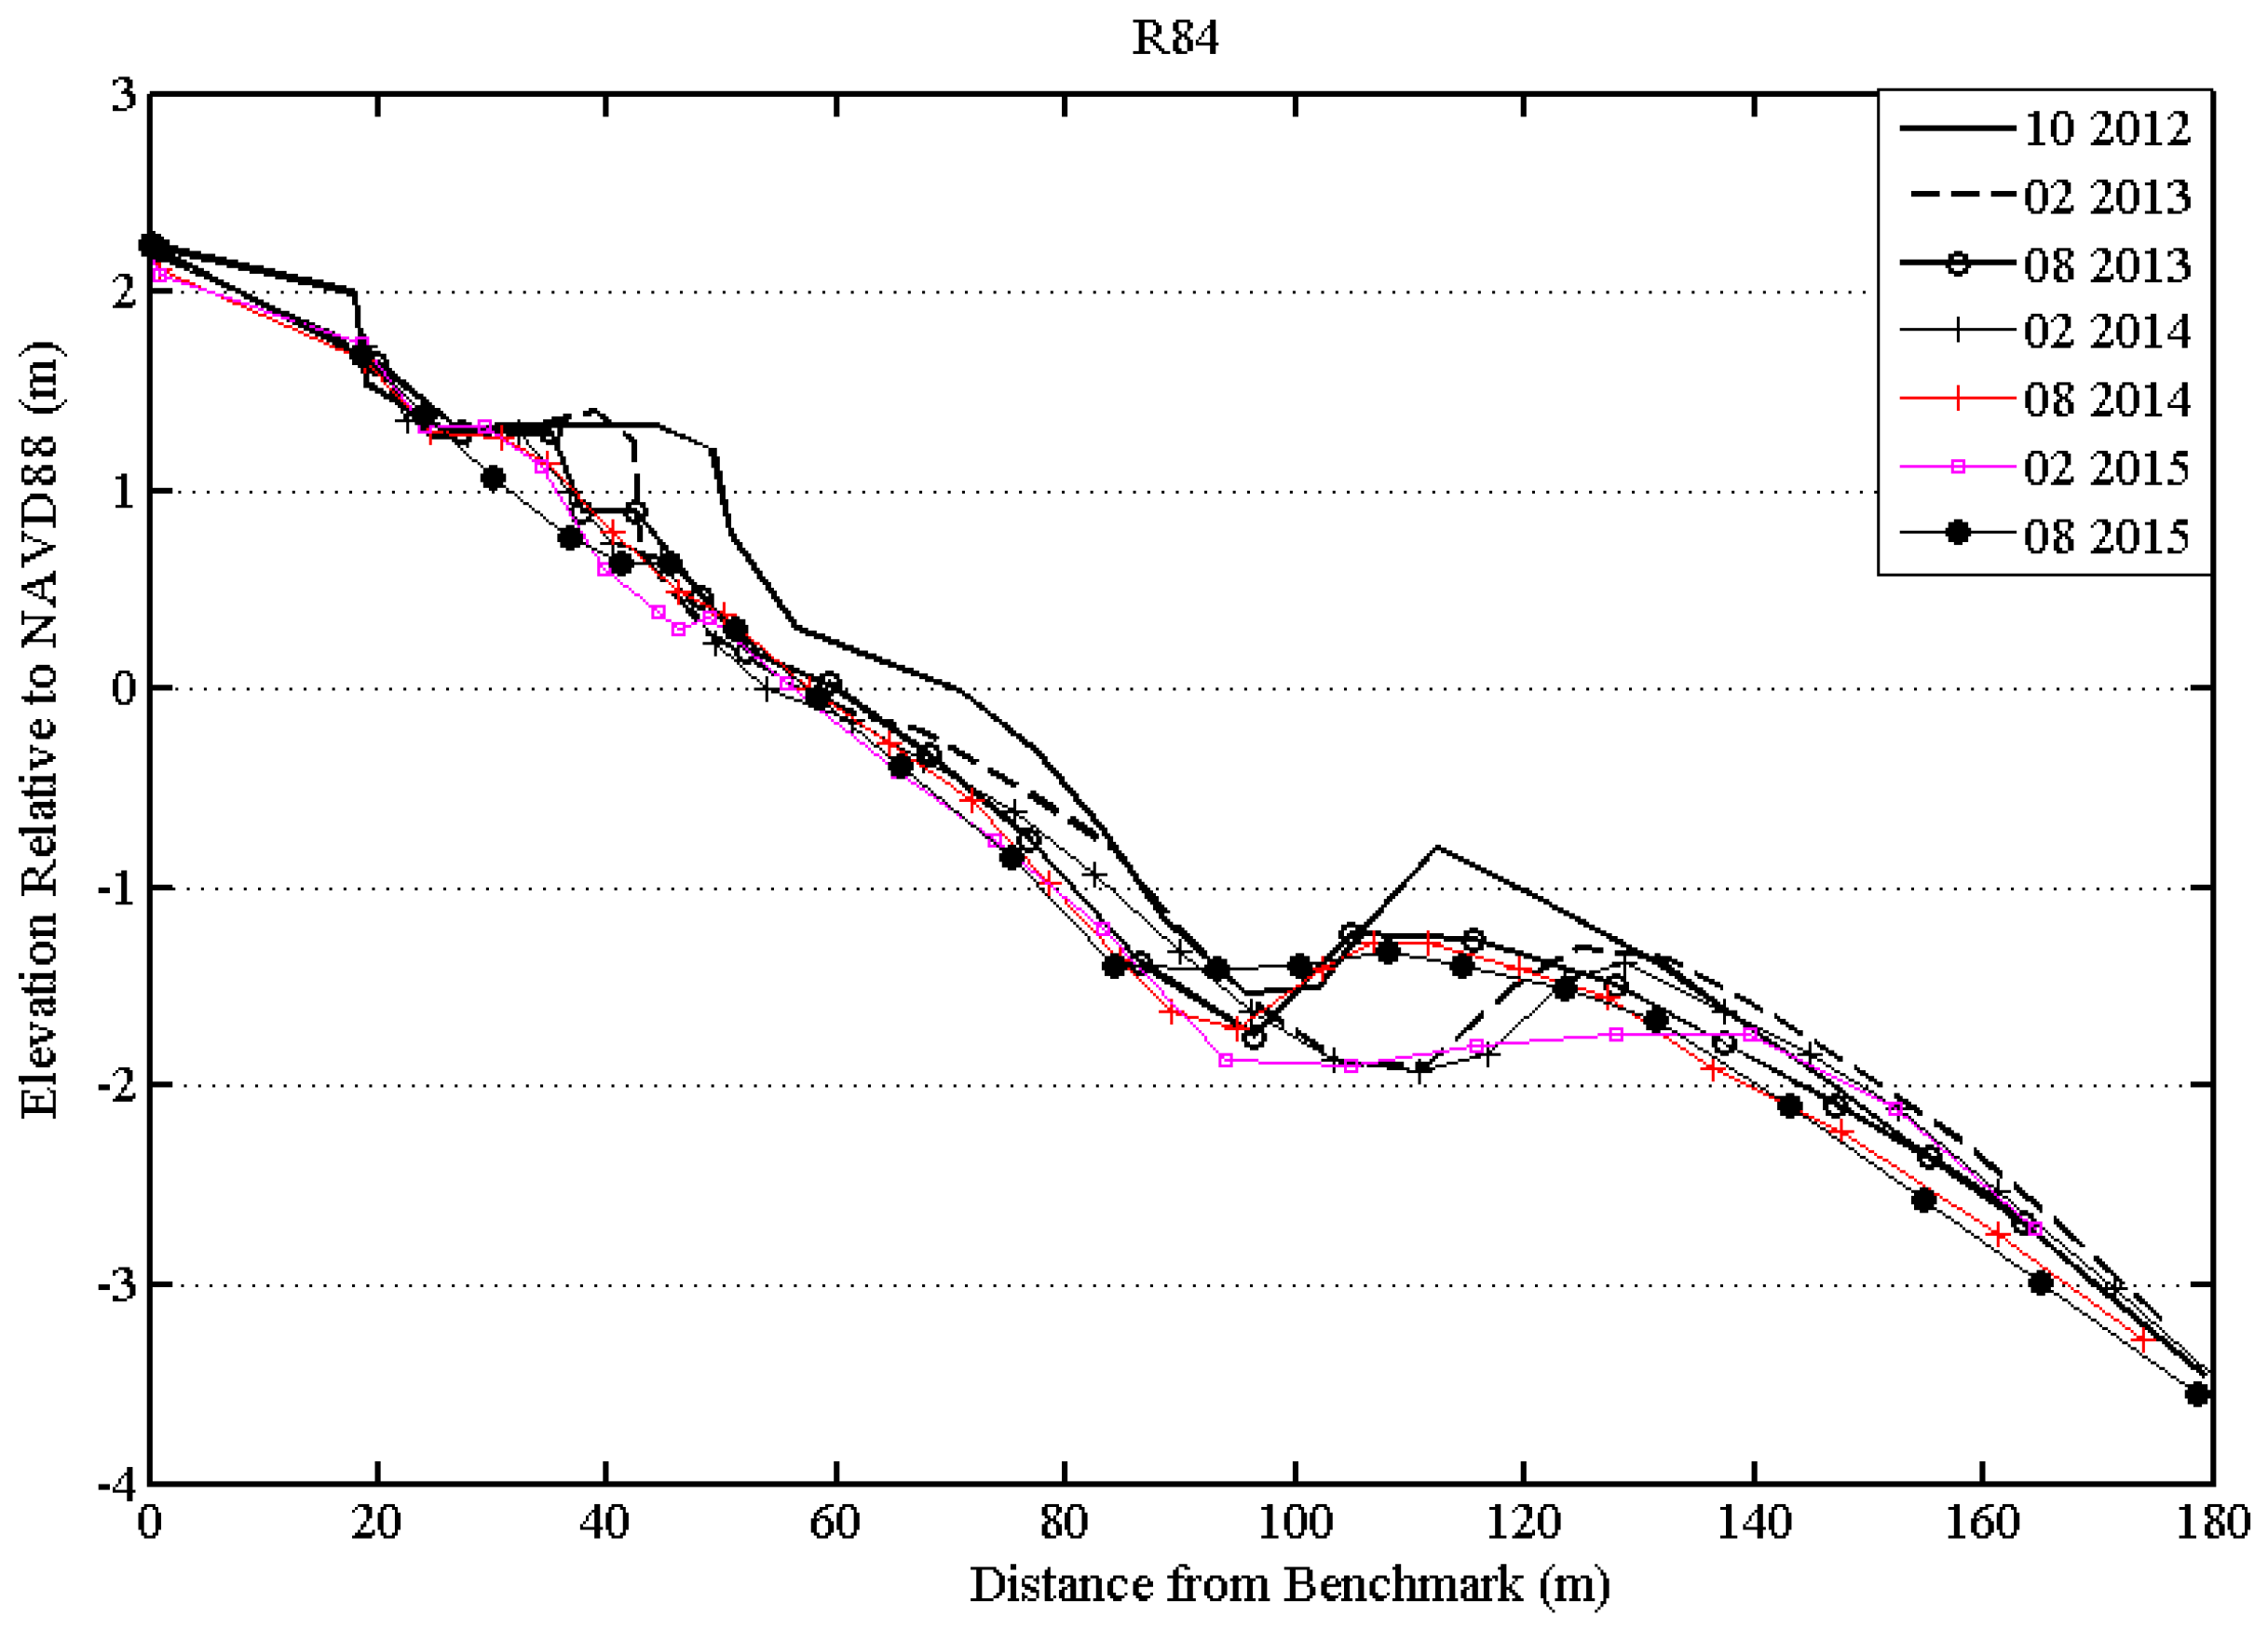
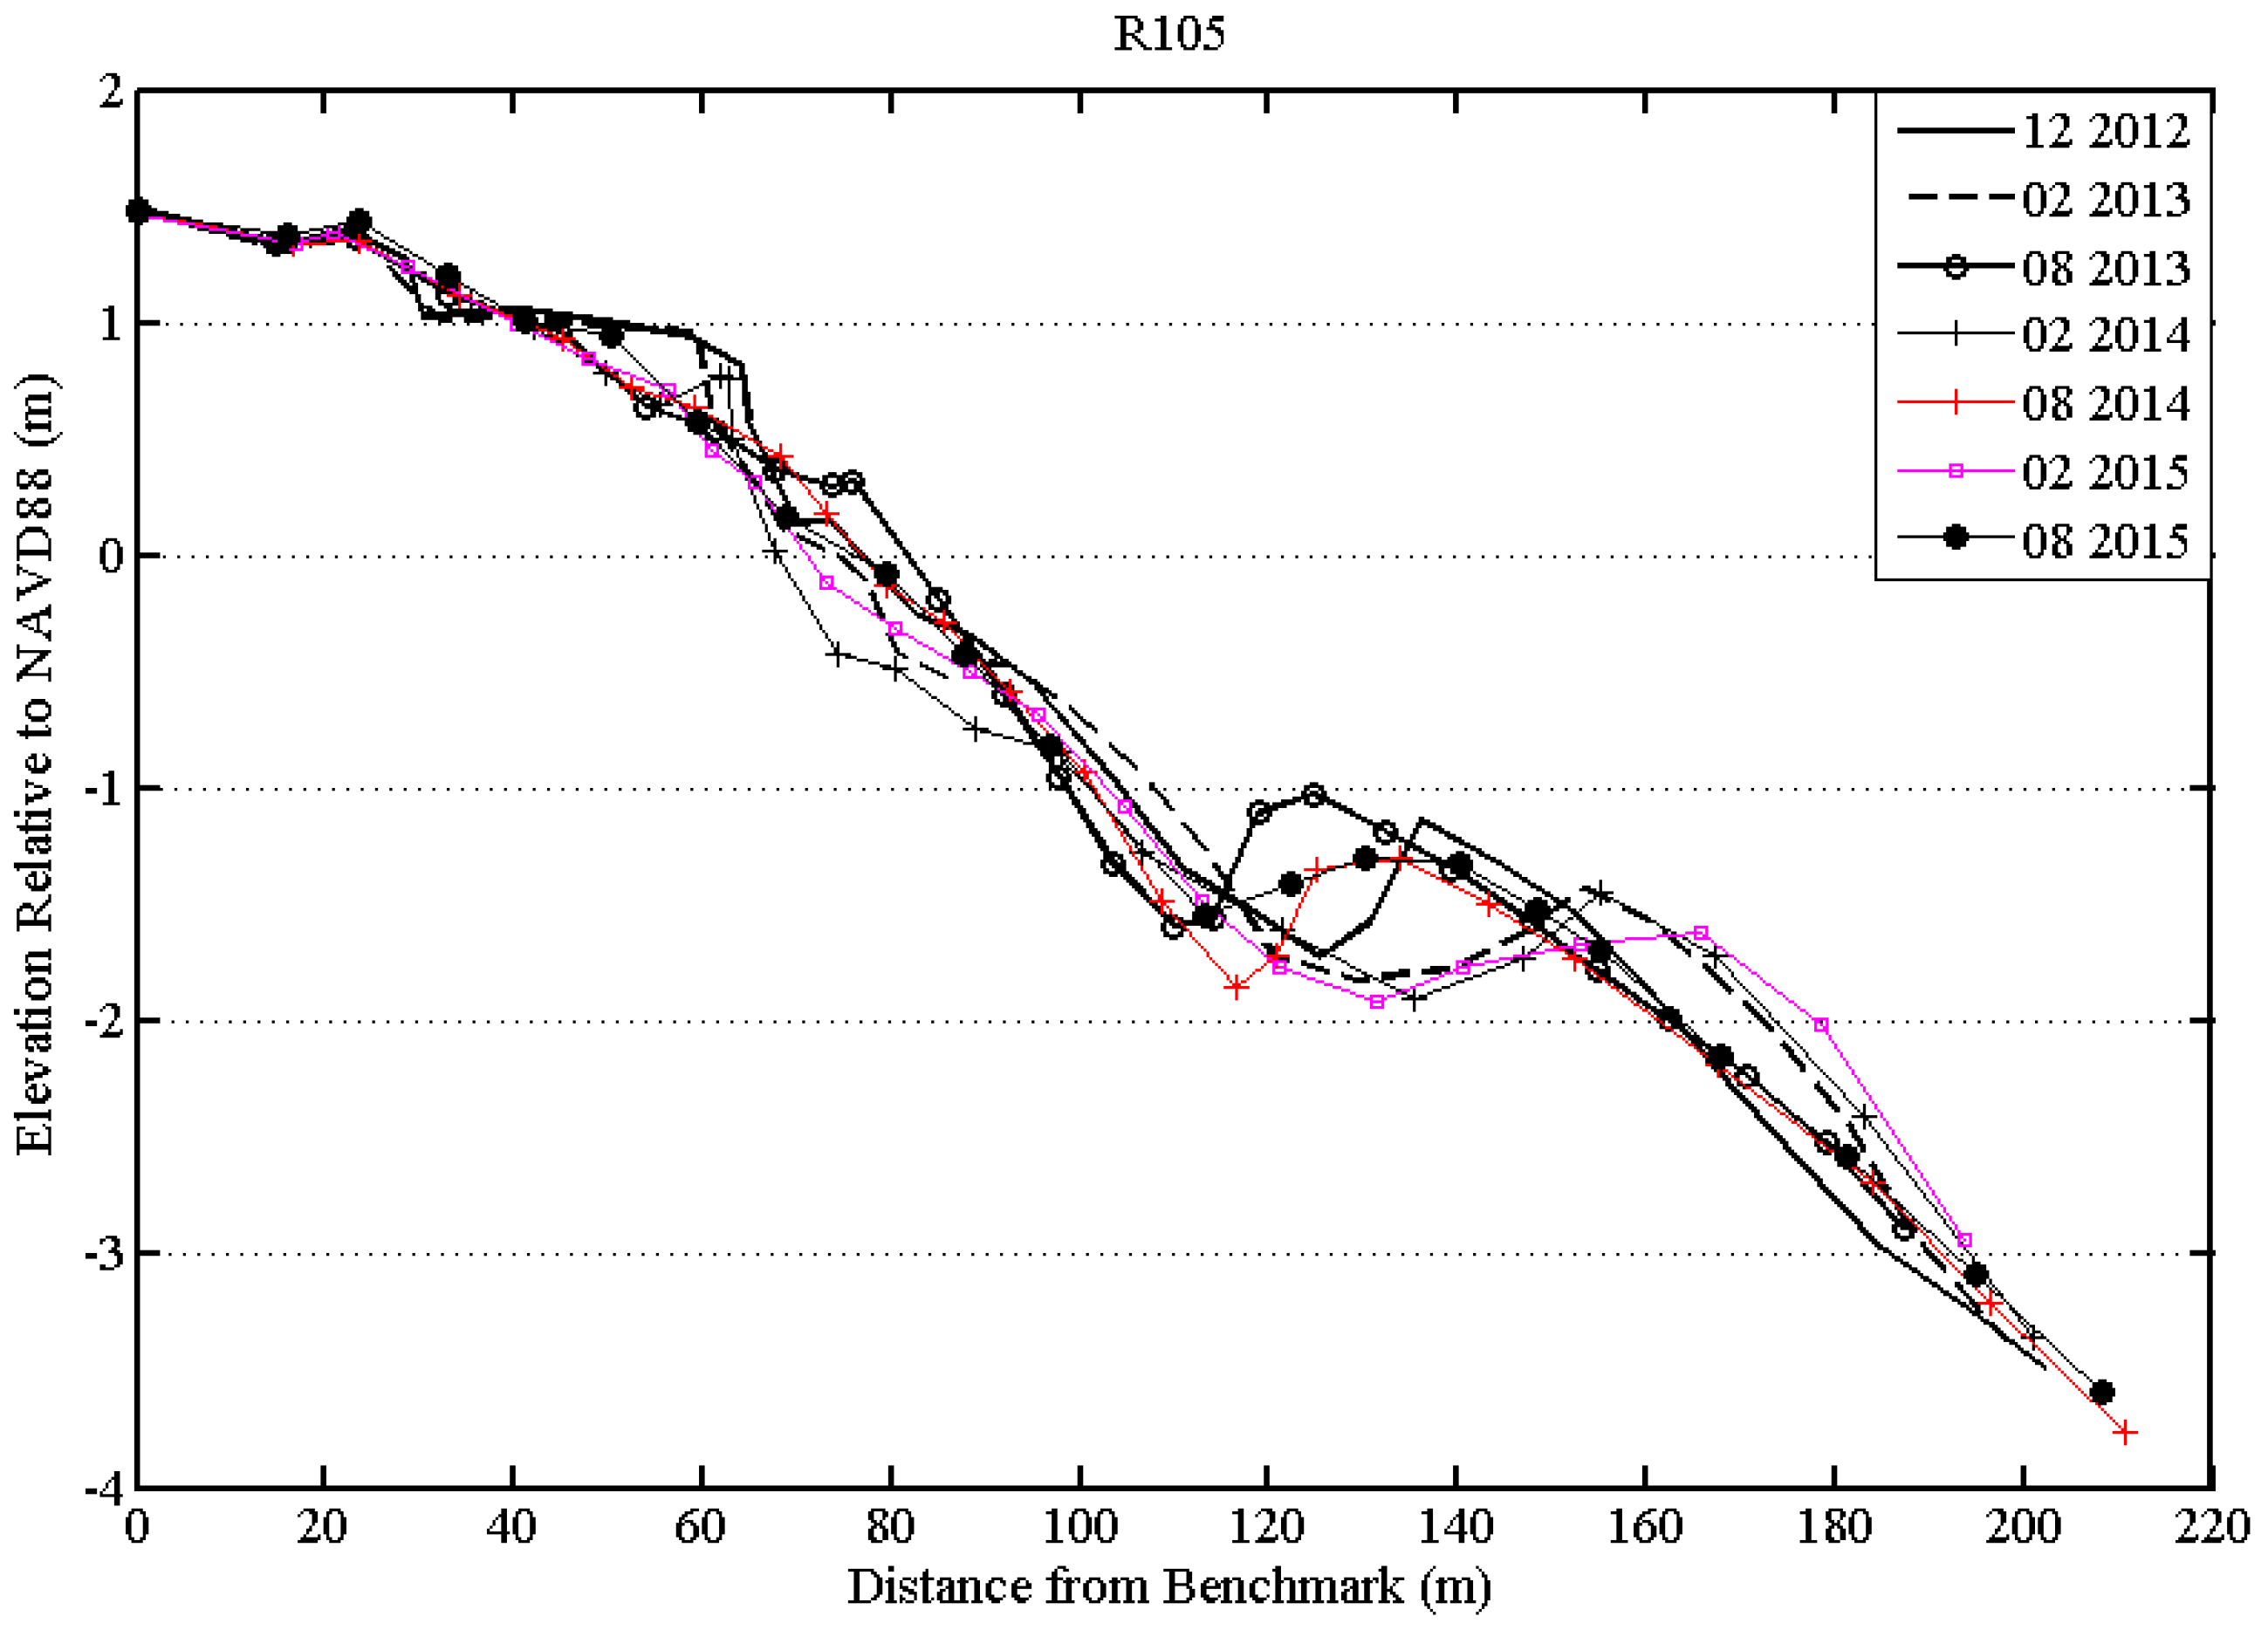
4.1. Beach-Profile Changes in Seasonal-Annual Scale
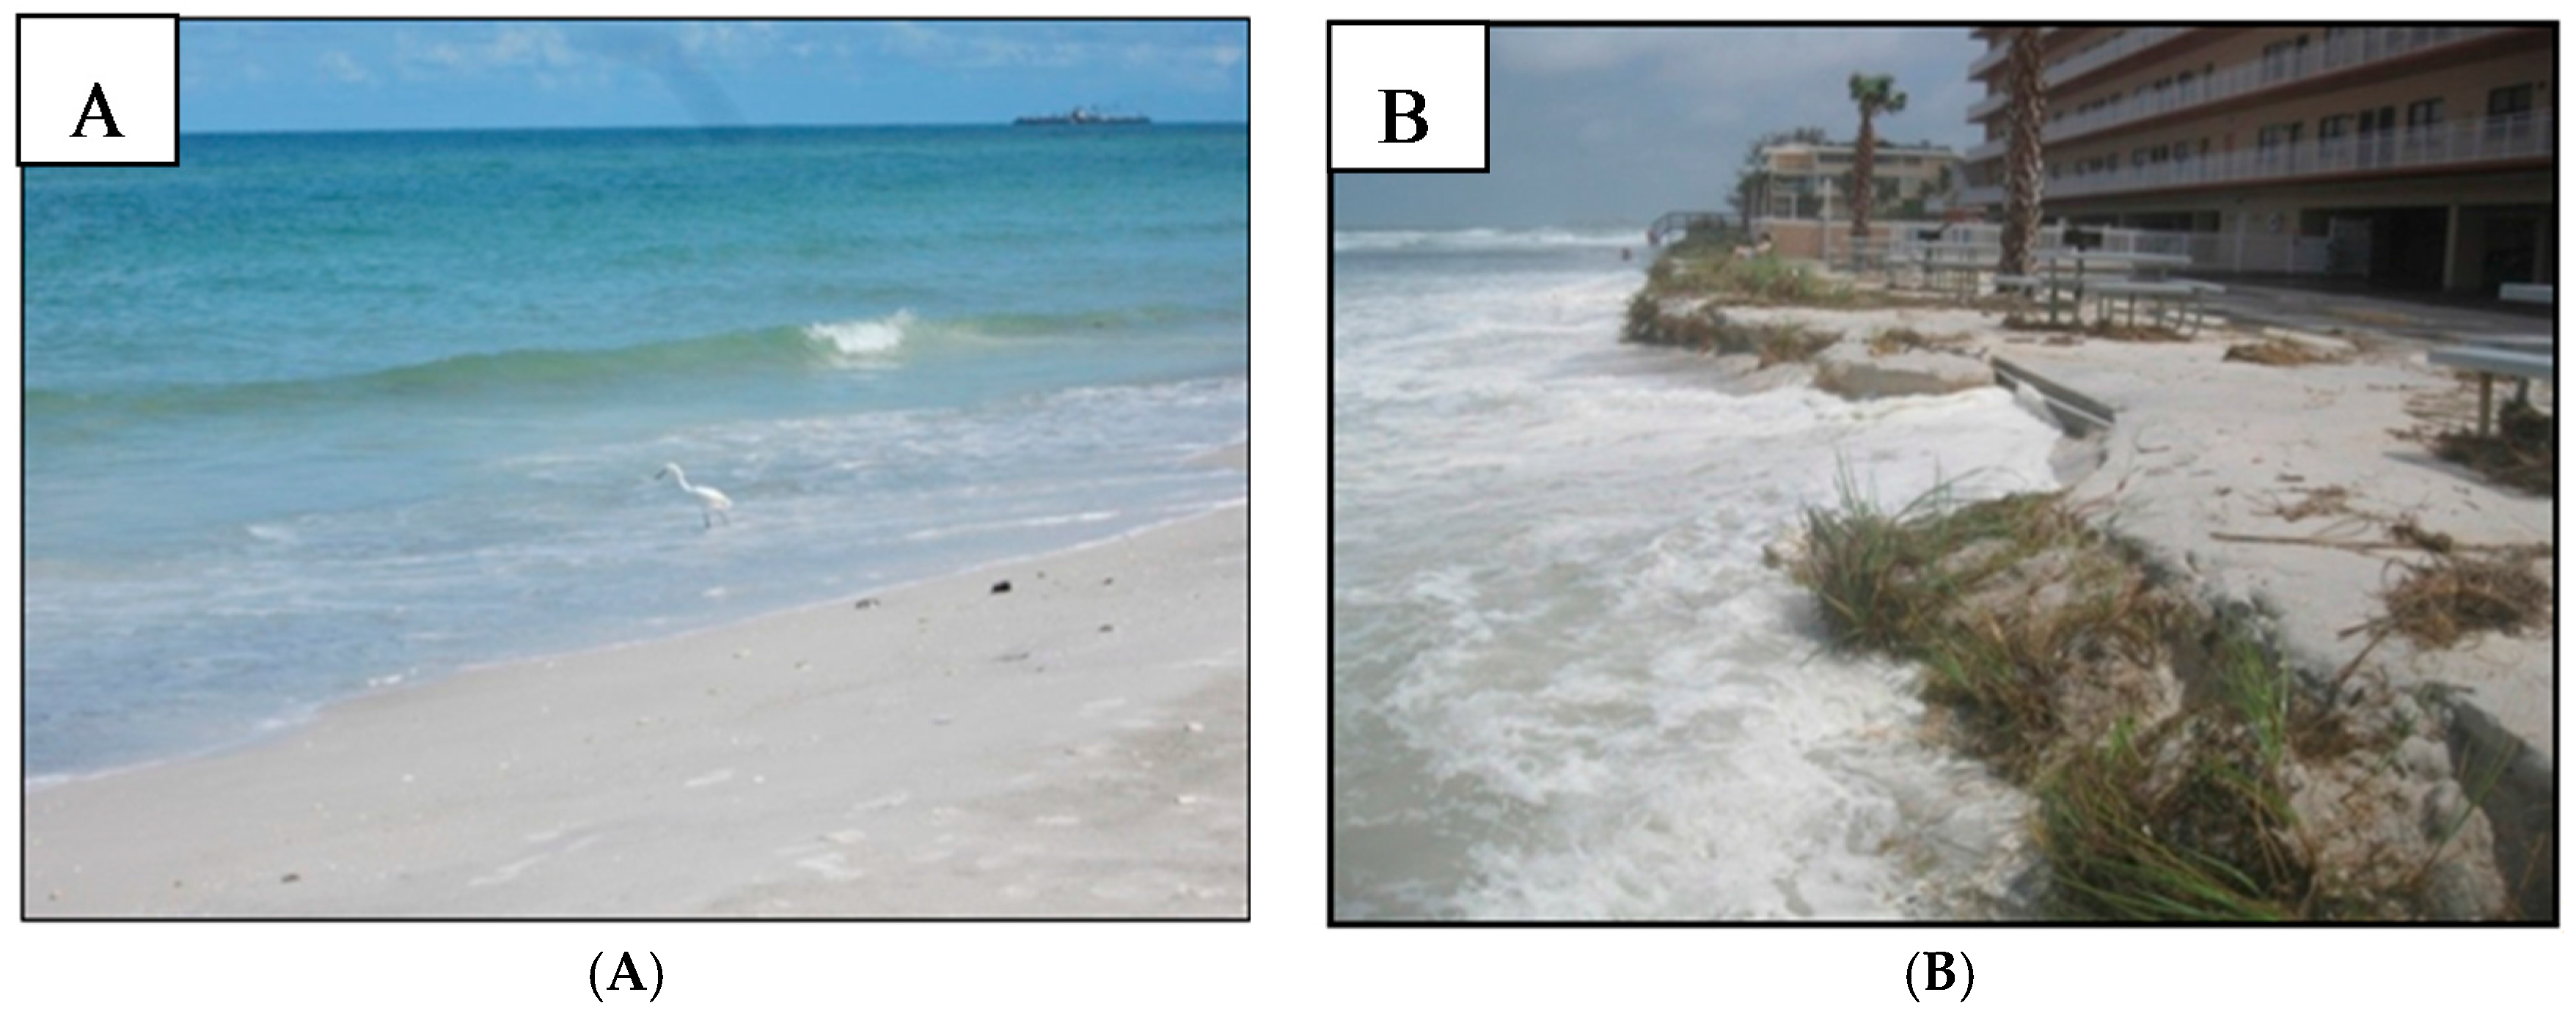
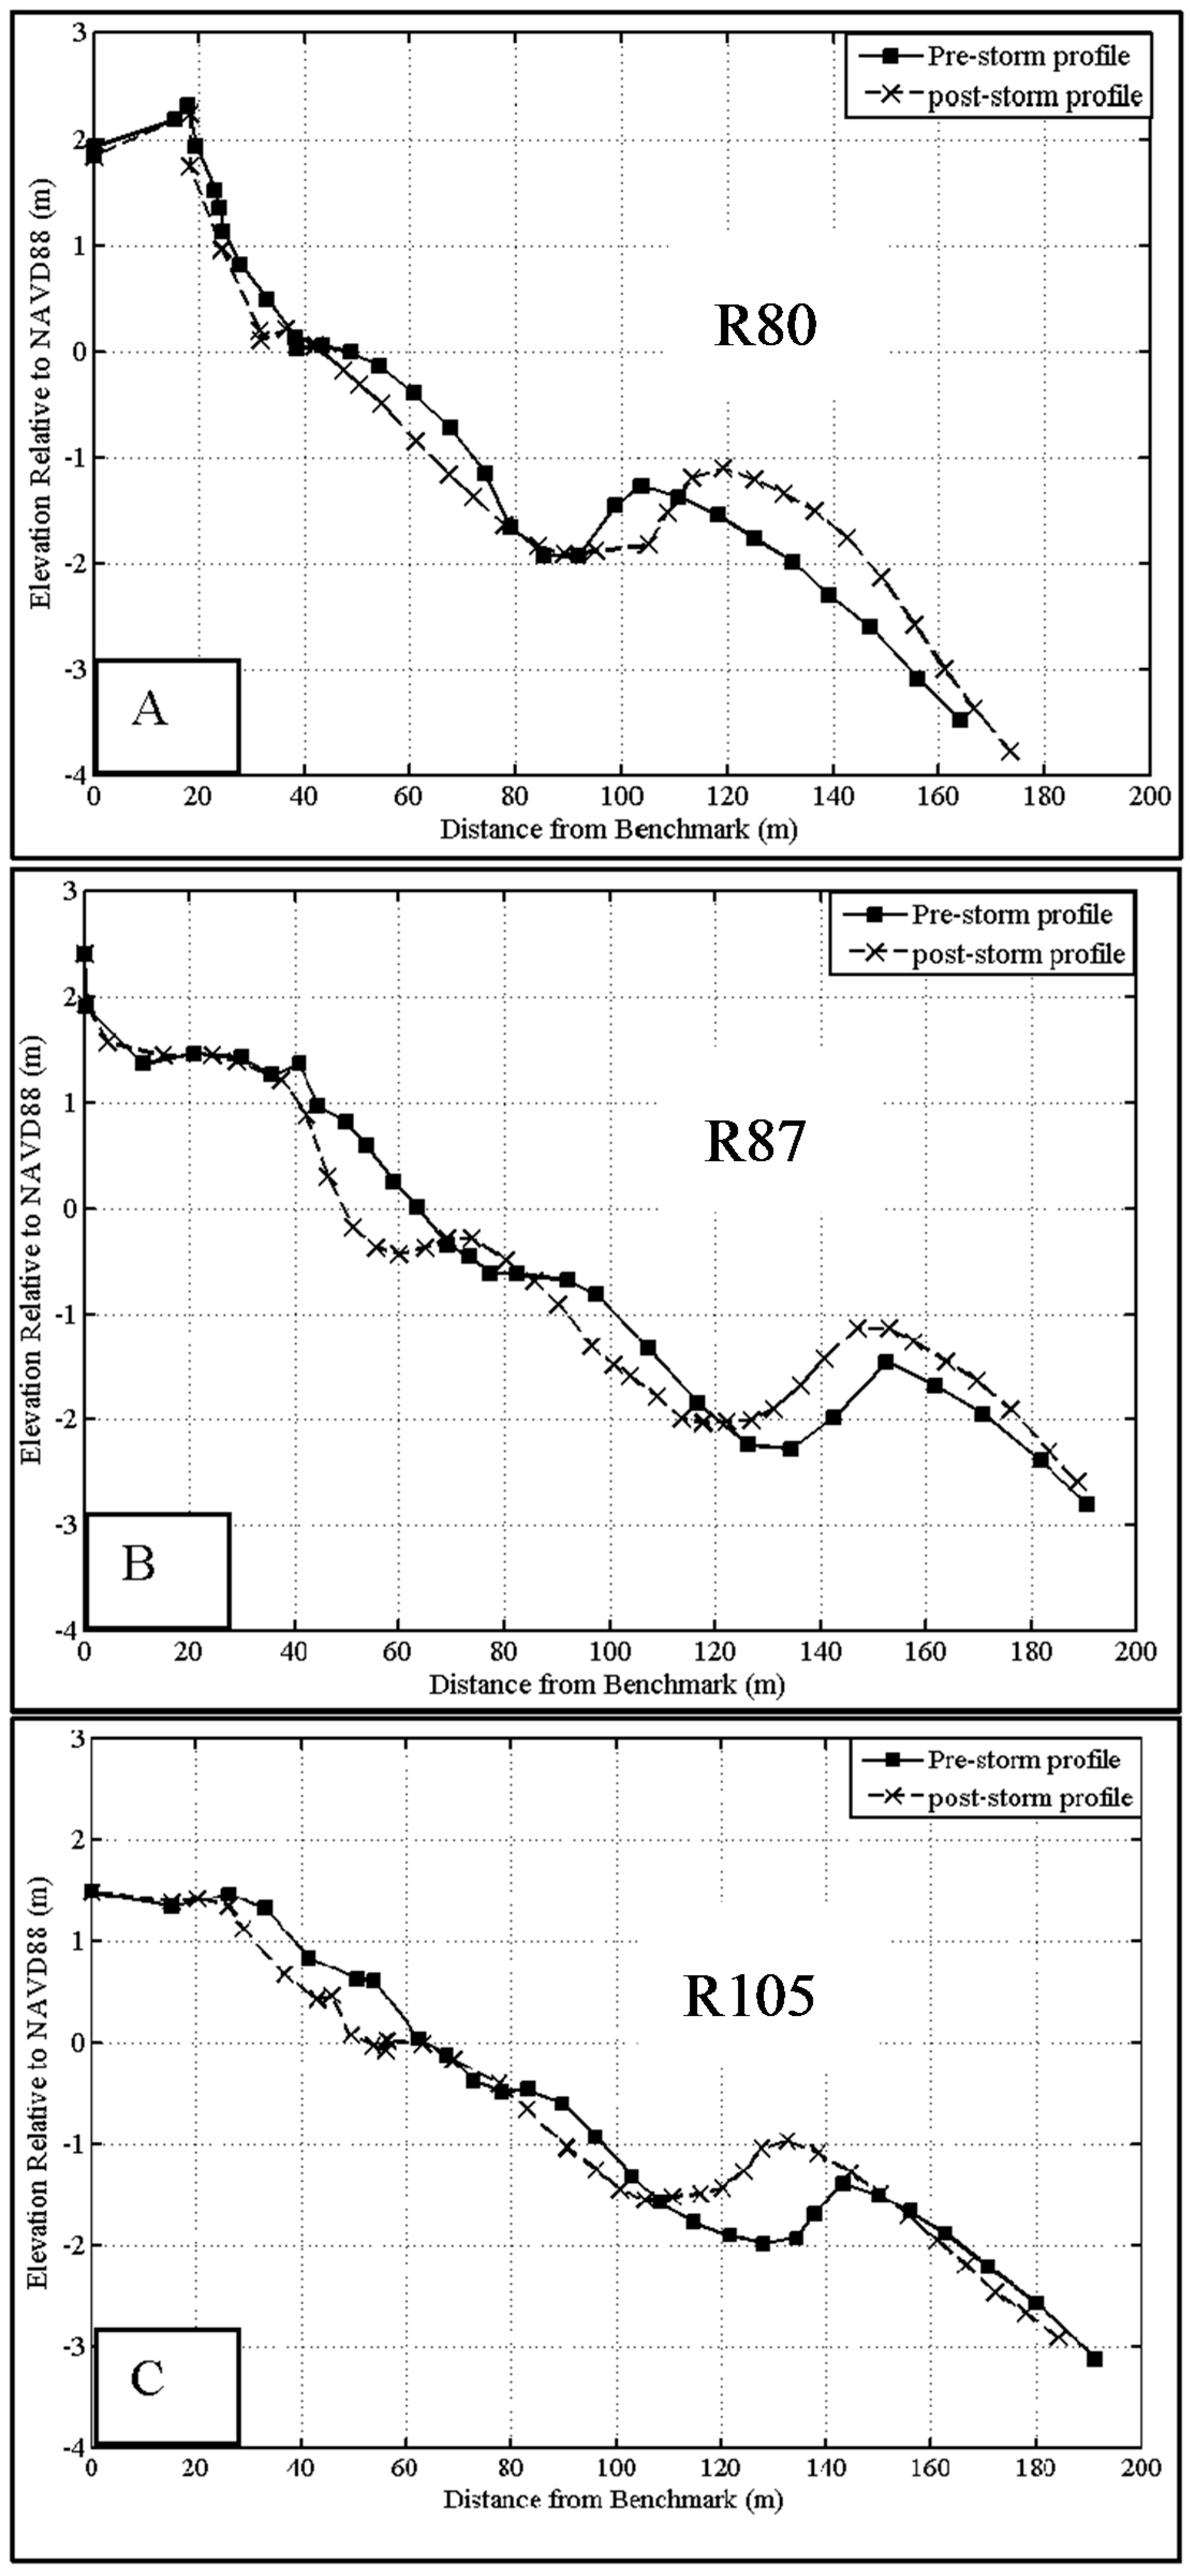
4.2. Beach-Profile Change in Storm Scale
5. Conclusions
Acknowledgments
Author Contributions
Conflicts of Interest
References
- Leatherman, S.P.; Zhang, K.; Douglas, B.C. Sea level rise shown to drive coastal erosion. Eos Trans. Am. Geophys. Union 2000, 81, 55–57. [Google Scholar] [CrossRef]
- Zhang, K.Q.; Douglas, B.C.; Leatherman, S.P. Global warming and coastal Erosion. Clim. Chang. 2004, 64, 41–58. [Google Scholar] [CrossRef]
- Van Rijn, L.C. Coastal erosion and control. Ocean Coast. Manag. 2011, 54, 867–887. [Google Scholar] [CrossRef]
- Dean, R.G. Beach Nourishment, Theory and Practice; World Scientific: Singapore, 2002. [Google Scholar]
- NRC (National Research Council: Committee on Beach Nourishment, Protection). Beach Nourishment and Protection, Marine Board, Commission on Engineering and Technical Systems; National Academy Press: Washington, DC, USA, 1995. [Google Scholar]
- Ruggiero, P.; Walstra, D.J.R.; Gelfenbaum, G.; Van Ormondt, M. Seasonal-scale nearshore morphological evolution: Field observations and numerical modeling. Coast. Eng. 2009, 56, 1153–1172. [Google Scholar] [CrossRef]
- Lee, J.M.; Park, J.Y.; Choi, J.Y. Evaluation of sub-aerial topographic surveying techniques using Total Station and RTK-GPS for applications in macrotidal sand beach environment. J. Coast. Res. 2013, 65, 535–540. [Google Scholar] [CrossRef]
- Holman, R.A.; Stanley, J. The history and technical capabilities of Argus. Coast. Eng. 2007, 54, 477–491. [Google Scholar] [CrossRef]
- Saye, S.; van der Wal, D.; Pye, K. Beach-dune morphological relationships and erosion/accretion: An investigation at five sites in England and Wales using lidar data. Geomorphology 2005, 72, 128–155. [Google Scholar] [CrossRef]
- Turner, I.L.; Harley, M.D.; Drummond, C.D. UAVs for coastal surveying. Coast. Eng. 2016, 114, 19–24. [Google Scholar] [CrossRef]
- Stockdon, H.F.; Holman, R.A. Estimation of wave phase speed and nearshore bathymetry from video imagery. J. Geophys. Res. 2000, 105, 22015–22033. [Google Scholar] [CrossRef]
- Lippmann, T.C.; Holman, R.A. The spatial and temporal variability of sand bar morphology. J. Geophys. Res. 1990, 95, 11575–11590. [Google Scholar] [CrossRef]
- Cheng, J.; Wang, P. Extracting Turbulence under Breaking Waves in the Surf Zone. J. Waterw. Port Coast. Ocean Eng. 2015, 141, 06015003. [Google Scholar] [CrossRef]
- Kingston, K.; Ruessink, B.G.; Van Enckevort, I.M.J.; Davidson, M.A. Artificial neural network correction of remotely sensed sandbar location. Mar. Geol. 2000, 169, 137–160. [Google Scholar] [CrossRef]
- Stockdon, H.F.; Sallenger, A.H.; List, J.H.; Holman, R.A. Estimation of shoreline position and change using airborne topographic lidar data. J. Coast. Res. 2002, 18, 502–513. [Google Scholar]
- James, M.R.; Ilic, S.; Ruzic, I. Measuring 3D coastal change with a digital camera. In Proceedings of the 7th International Conference on Coastal Dynamics 2013, Arcachon, France, 24–28 June 2013; Bonneton, P., Garlan, T., Sottolichio, A., Castelle, B., Eds.; Bordeaux University: Bordeaux, France, 2013; pp. 893–904. [Google Scholar]
- Delacourt, C.; Allemand, P.; Jaud, M.; Grandjean, P.; Deschamps, A.; Ammann, J.; Cuq, V. DRELIO: An unmanned helicopter for imaging coastal areas. J. Coast. Res. 2009, 56, 1489–1493. [Google Scholar]
- Elko, N.A.; Wang, P. Immediate profile and planform evolution of a beach nourishment project with hurricane influences. Coast. Eng. 2007, 54, 49–66. [Google Scholar] [CrossRef]
- Roberts, T.M.; Wang, P. Four-year performance and associated controlling factors of several beach nourishment projects along three adjacent barrier island, west-central Florida, USA. Coast. Eng. 2012, 70, 21–39. [Google Scholar] [CrossRef]
- Brutsche, K.E.; Wang, P.; Beck, T.M.; Rosati, J.D.; Legault, K.R. Morphological evolution of a submerged artificial nearshore berm along a low-wave microtidal coast, Fort Myers Beach, west-central Florida, USA. Coast. Eng. 2014, 91, 29–44. [Google Scholar] [CrossRef]
- Cheng, J.; Wang, P. Measuring and modeling beach-profile response to tropical storm Debby, west central Florida. In Proceedings of the Coastal Sediments 2015, San Diego, CA, USA, 11–15 May 2015.
- Hanson, H.; Brampton, A.; Capobianco, M.; Dette, H.H.; Hamm, L.; Laustrup, C.; Lechuga, A.; Spanhoff, R. Beach nourishment projects, practices, and objectives—A European overview. Coast. Eng. 2002, 47, 81–111. [Google Scholar] [CrossRef]
- Work, P.; Dean, R.G. Assessment and prediction of beach-nourishment evolution. J. Waterw. Port Coast. Ocean Eng. 1995, 121, 182–189. [Google Scholar] [CrossRef]
- Wang, P.; Kirby, J.H.; Haber, J.D.; Horwitz, M.H.; Knorr, P.O.; Krock, J.R. Morphological and Sedimentological Impacts of Hurricane Ivan and Immediate Poststorm Beach Recovery along the Northwestern Florida Barrier-Island Coasts. J. Coast. Res. 2006, 22, 1382–1402. [Google Scholar] [CrossRef]
- Wang, P.; Roberts, T.M. Volume and Shoreline Changes along Pinellas County Beaches during Tropical Storm Debby; Tropical Strom Debby-Impact Report; Pinellas County, FL, USA, 2012. [Google Scholar]
- Davis, R.A.; Barnard, P. Morphodynamics of the barrier-inlet system, west-central Florida. Mar. Geol. 2003, 200, 77–101. [Google Scholar] [CrossRef]
- Gibeaut, J.C.; Davis, R.A. Statistical Geomorphic classification of ebb-tidal deltas along the west-central Florida coast. J. Coast. Res. 1993, 18, 165–184. [Google Scholar]
- Wang, P.; Beck, T.M. Morphodynamics of an anthropogenically altered dual-inlet system: John’s Pass and Blind Pass, west–central Florida, USA. Mar. Geol. 2012, 291, 162–175. [Google Scholar] [CrossRef]
- Walton, T.L. Littoral Drift Estimates along the Coastline of Florida; Florida Sea Grant Report No. 13; University of Florida: Gainesville, FL, USA, 1976. [Google Scholar]
- Wang, P.; Davis, R.A. Depth of closure and the equilibrium beach profile—A case study from Sand key, west-central Florida. Shore Beach 1999, 67, 33–42. [Google Scholar]
- Komar, P.D. Beach Processes and Sedimentation, 2nd ed.; Prentice Hall: Upper Saddle River, NJ, USA, 1998. [Google Scholar]
- Roberts, T.M.; Wang, P.; Puleo, J.A. Storm-driven cyclic beach morphodynamics of a mixed sand and gravel beach along the Mid-Atlantic Coast, USA. Mar. Geol. 2013, 346, 403–421. [Google Scholar] [CrossRef]
- Cheng, J.; Wang, P.; Smith, R.E. Hydrodynamic conditions associated with an onshore migrating and stable sandbar. J. Coast. Res. 2016, 32, 153–163. [Google Scholar] [CrossRef]
- Cheng, J.; Wang, P. Event to seasonal scale sandbar variability and equilibrium along a low-wave energy microtidal Coast, west-central Florida, USA. Cont. Shelf Res. 2016. in review. [Google Scholar]

© 2016 by the authors; licensee MDPI, Basel, Switzerland. This article is an open access article distributed under the terms and conditions of the Creative Commons Attribution (CC-BY) license (http://creativecommons.org/licenses/by/4.0/).
Share and Cite
Cheng, J.; Wang, P.; Guo, Q. Measuring Beach Profiles along a Low-Wave Energy Microtidal Coast, West-Central Florida, USA. Geosciences 2016, 6, 44. https://doi.org/10.3390/geosciences6040044
Cheng J, Wang P, Guo Q. Measuring Beach Profiles along a Low-Wave Energy Microtidal Coast, West-Central Florida, USA. Geosciences. 2016; 6(4):44. https://doi.org/10.3390/geosciences6040044
Chicago/Turabian StyleCheng, Jun, Ping Wang, and Qiandong Guo. 2016. "Measuring Beach Profiles along a Low-Wave Energy Microtidal Coast, West-Central Florida, USA" Geosciences 6, no. 4: 44. https://doi.org/10.3390/geosciences6040044