Article

Bentonite Permeability at Elevated Temperature

by
Katherine A. Daniels
1,*,
Jon F. Harrington
1,
Stephanie G. Zihms
1,2 and
Andrew C. Wiseall
1
1
British Geological Survey, Nicker Hill, Keyworth, Nottinghamshire NG12 5GG, UK
2
Energy Academy, Heriot-Watt University, Edinburgh EH14 4AS, UK
*
Author to whom correspondence should be addressed.
Geosciences 2017, 7(1), 3; https://doi.org/10.3390/geosciences7010003
Submission received: 19 October 2016 / Revised: 13 December 2016 / Accepted: 19 December 2016 / Published: 11 January 2017

Abstract

:
Repository designs frequently favour geological disposal of radioactive waste with a backfill material occupying void space around the waste. The backfill material must tolerate the high temperatures produced by decaying radioactive waste to prevent its failure or degradation, leading to increased hydraulic conductivity and reduced sealing performance. The results of four experiments investigating the effect of temperature on the permeability of a bentonite backfill are presented. Bentonite is a clay commonly proposed as the backfill in repository designs because of its high swelling capacity and very low permeability. The experiments were conducted in two sets of purpose-built, temperature controlled apparatus, designed to simulate isotropic pressure and constant volume conditions within the testing range of 4–6 MPa average effective stress. The response of bentonite during thermal loading at temperatures up to 200 °C was investigated, extending the previously considered temperature range. The results provide details of bentonite’s intrinsic permeability, total stress, swelling pressure and porewater pressure during thermal cycles. We find that bentonite’s hydraulic properties are sensitive to thermal loading and the type of imposed boundary condition. However, the permeability change is not large and can mostly be accounted for by water viscosity changes. Thus, under 150 °C, temperature has a minimal impact on bentonite’s hydraulic permeability.

1. Introduction

The production of energy from nuclear fuels inherently generates radioactive waste as a by-product, and thus the requirement for long-term disposal of this waste is an inevitable consequence. Geological disposal of radioactive waste is universally favoured with many nations choosing either clay-based host formations [1,2] with an additional clay backfill material occupying the void space around the waste, salt formations or crystalline host rocks, for example the Forsmark Spent Fuel Repository which has a granodiorite host rock with a clay backfill material [3,4]. Clay formations are favoured by a number of European countries for the disposal facility, with research laboratories in France, Switzerland and Belgium studying the Callovo-Oxfordian Claystone [5], the Opalinus clay [6,7] and the Boom clay [8,9,10] respectively [11,12]. Currently, the only operational geological disposal facility for intermediate- to high-level waste is the Waste Isolation Pilot Plant (WIPP) in a salt formation in Carlsbad, New Mexico; many other proposed sites globally are in the conceptual, planning or approval stage [1,3,4,13]. The waste is either placed in large boreholes in the floor of deposition boreholes (“in-floor”) or the waste is stacked in the tunnels themselves (“in-tunnel”), with a clay backfill material occupying the void space [14]. Bentonite is commonly proposed for use in the engineered barrier system (EBS) and as a backfill material in many proposed facilities [15,16,17] because of its high swelling capacity, very low permeability, low diffusion rate, high sorption capacity and self-sealing characteristics [12,18].
Radioactive wastes produce and emit heat as they decay, and the amount generated, by high-level wastes especially, can be significant. Depending on the form of the radioactive waste and the amount of time that has passed before the waste is placed in the disposal facility, each canister of high-level waste (HLW) could emit around 800 W of heat, assuming a vitrified HLW package with a volume of 2.04 m3, a 1.6 kg mass of uranium and a total activity content of 6.3 × 10³ TBq [19]. Self-heating due to radioactive decay can produce significant amounts of energy. This heat can have an adverse effect, with thermal loading leading to mechanical failure or chemical degradation of the barrier or host rock [20,21]. Additionally, the thermal gradient through the host-rock could lead to alterations in groundwater pressure gradients and flow, or could have an effect on the near-field mass transport mechanisms and chemical evolution [14]. Chemical alteration of bentonite can take place through ion exchange reactions and mineral dissolution-precipitation, both of which could modify the chemical and physical properties of the clay barrier or host rock permeability [22,23].
The hydraulic conductivity of bentonite has been found to increase with increasing temperature up to 80 °C [24,25]. This has been attributed to the reduction in water viscosity with increasing temperature [25]. However, Zihms and Harrington [26] found that the sensitivity of bentonite permeability to temperature could not entirely be explained by changes in water viscosity. Repository designs will need to address possible variations in the surrounding temperature of the disposal site and ensure that the maximum design temperature is not exceeded [27,28]. Studies have found that at temperatures below 100 °C, the sealing performance of clays is not significantly affected [26,29,30]. However above this temperature, illitisation and mechanical degradation of the clay could lead to a reduced performance [12]. In addition, the permeability of the clay has been observed to increase with increasing temperature [29]. The maximum operational temperature for an EBS, therefore, is an important design consideration [28]. However, this must be balanced with the reality that the maximum operational temperature will have a bearing on the repository footprint (and cost) in terms of the spacing between waste packages, the distance between the disposal galleries and the overall volume of material stored [14]. Radioactive waste must spend a minimum time at the ground surface before permanent disposal can take place, so that the waste can cool and the risk of wider distribution of migrating radioactive particles is lowered. Repository design must take account of the need to quickly achieve safe and permanent geological disposal, and reduce the time spent by the waste at ground surface, without increasing risk. The UK surface storage period for vitrified HLW is 50 years [28]. Minimising the repository footprint is also an important economic consideration, with cooler waste allowing smaller spacing between canisters. Gaining an improved understanding of the response of the engineered barrier system to higher temperatures may allow the radioactive waste to be disposed of more quickly. In addition, studying bentonite under an increased thermal load will provide further insight into the upper limit of acceptable temperatures for waste disposal.
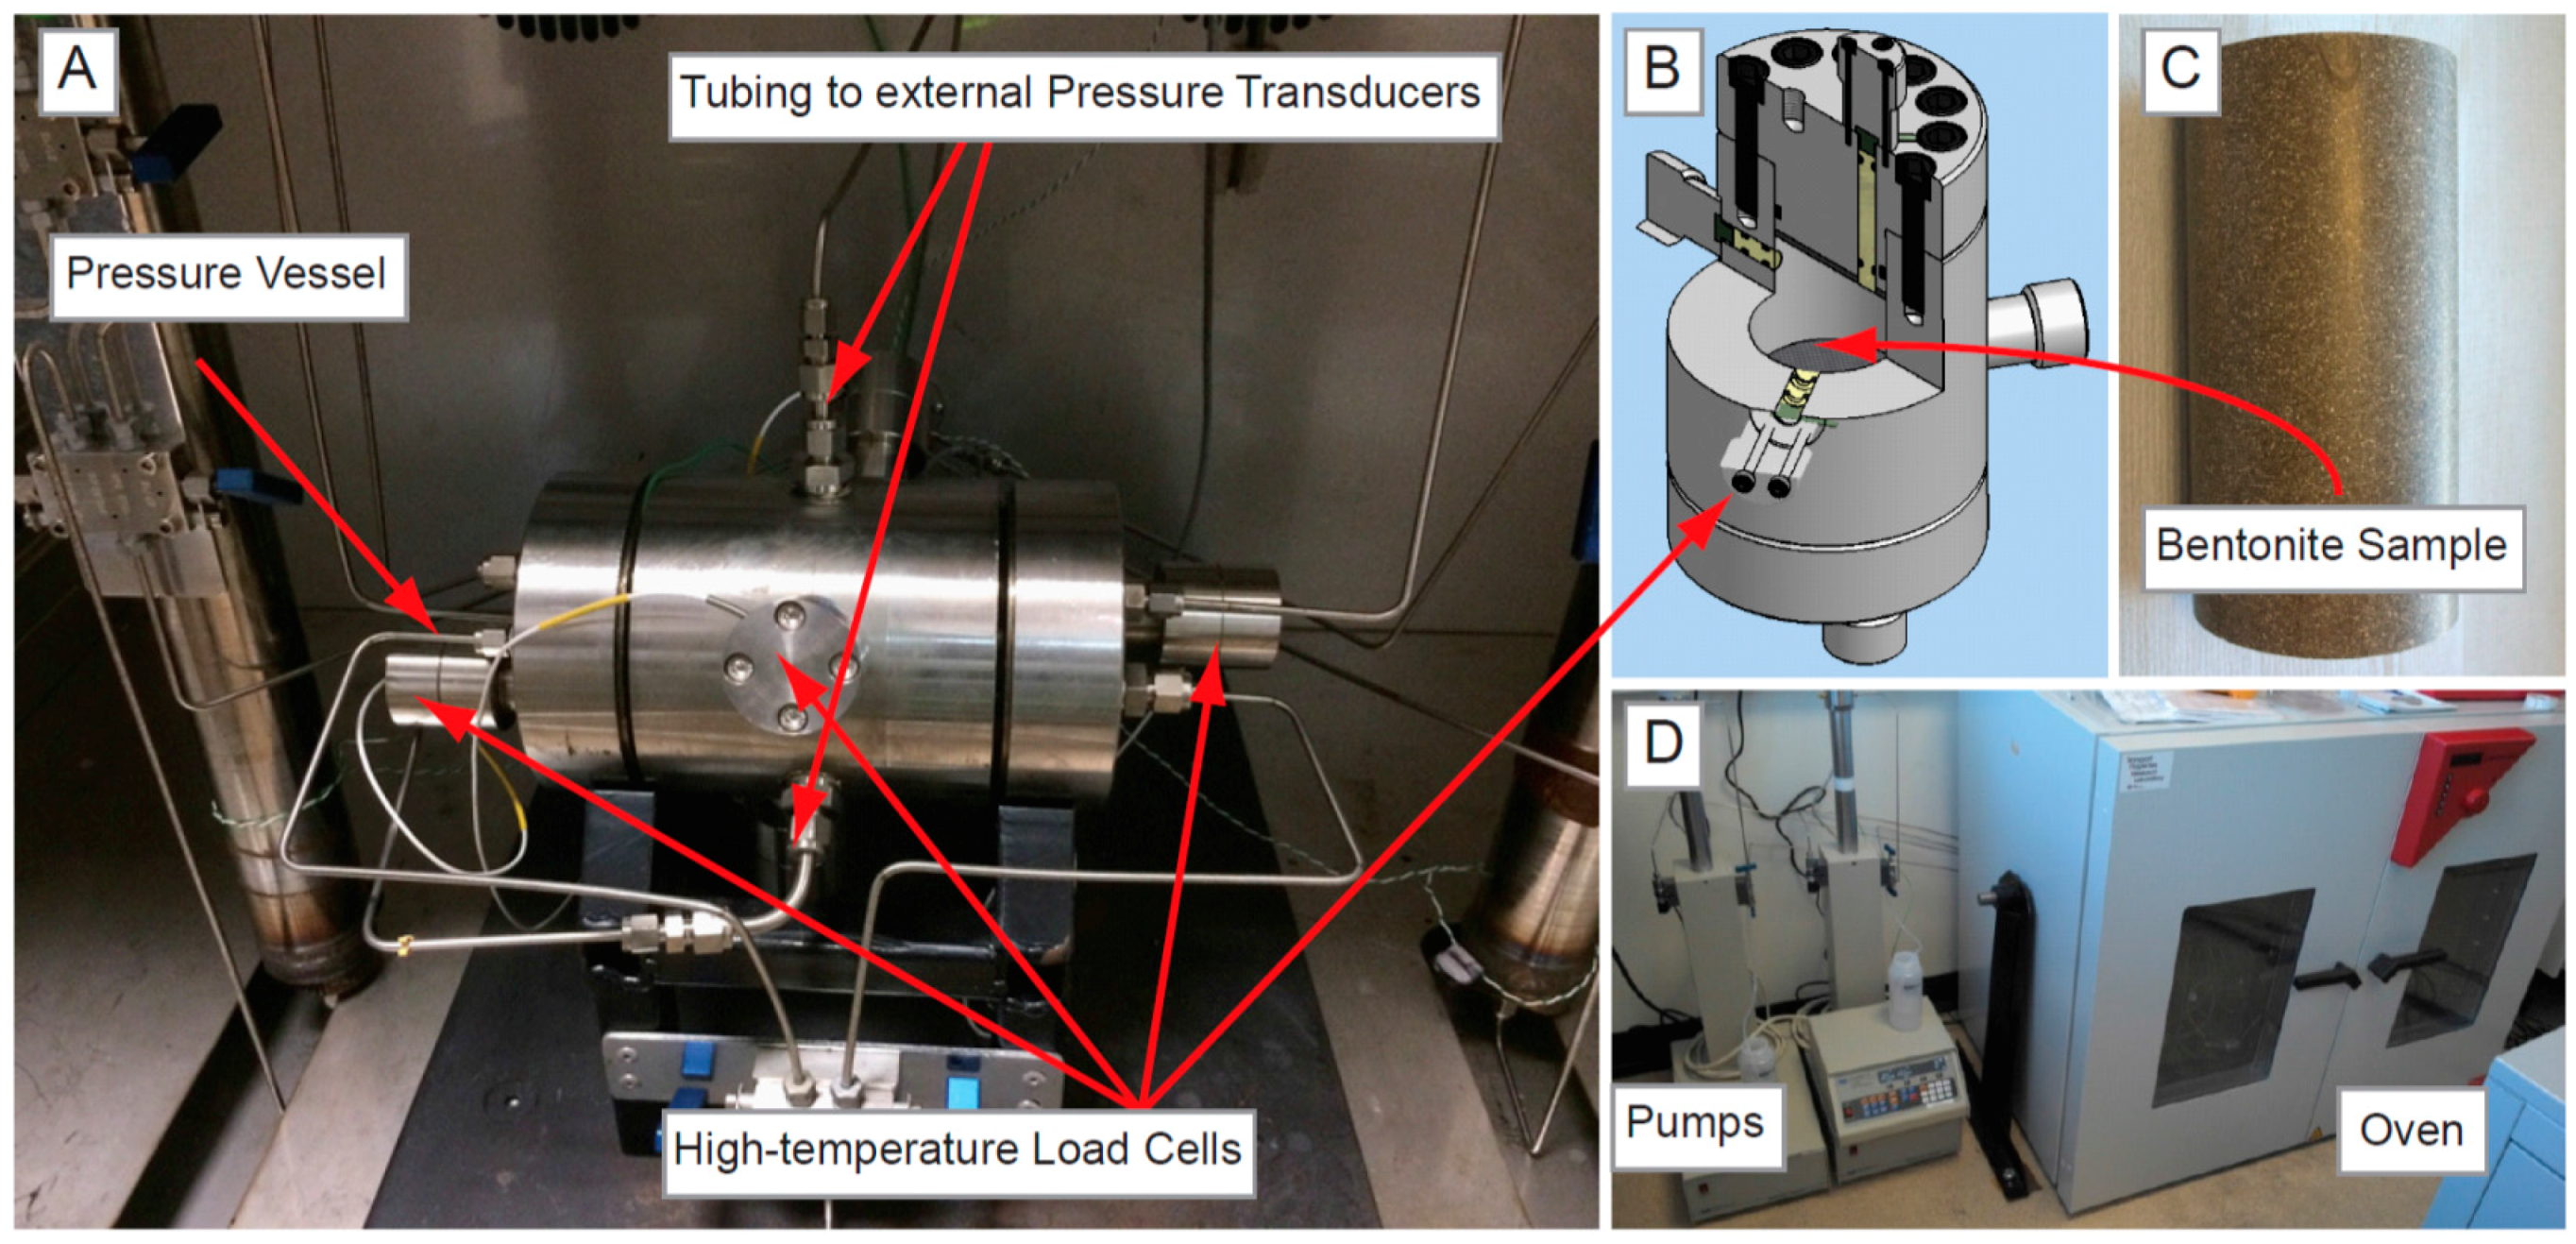
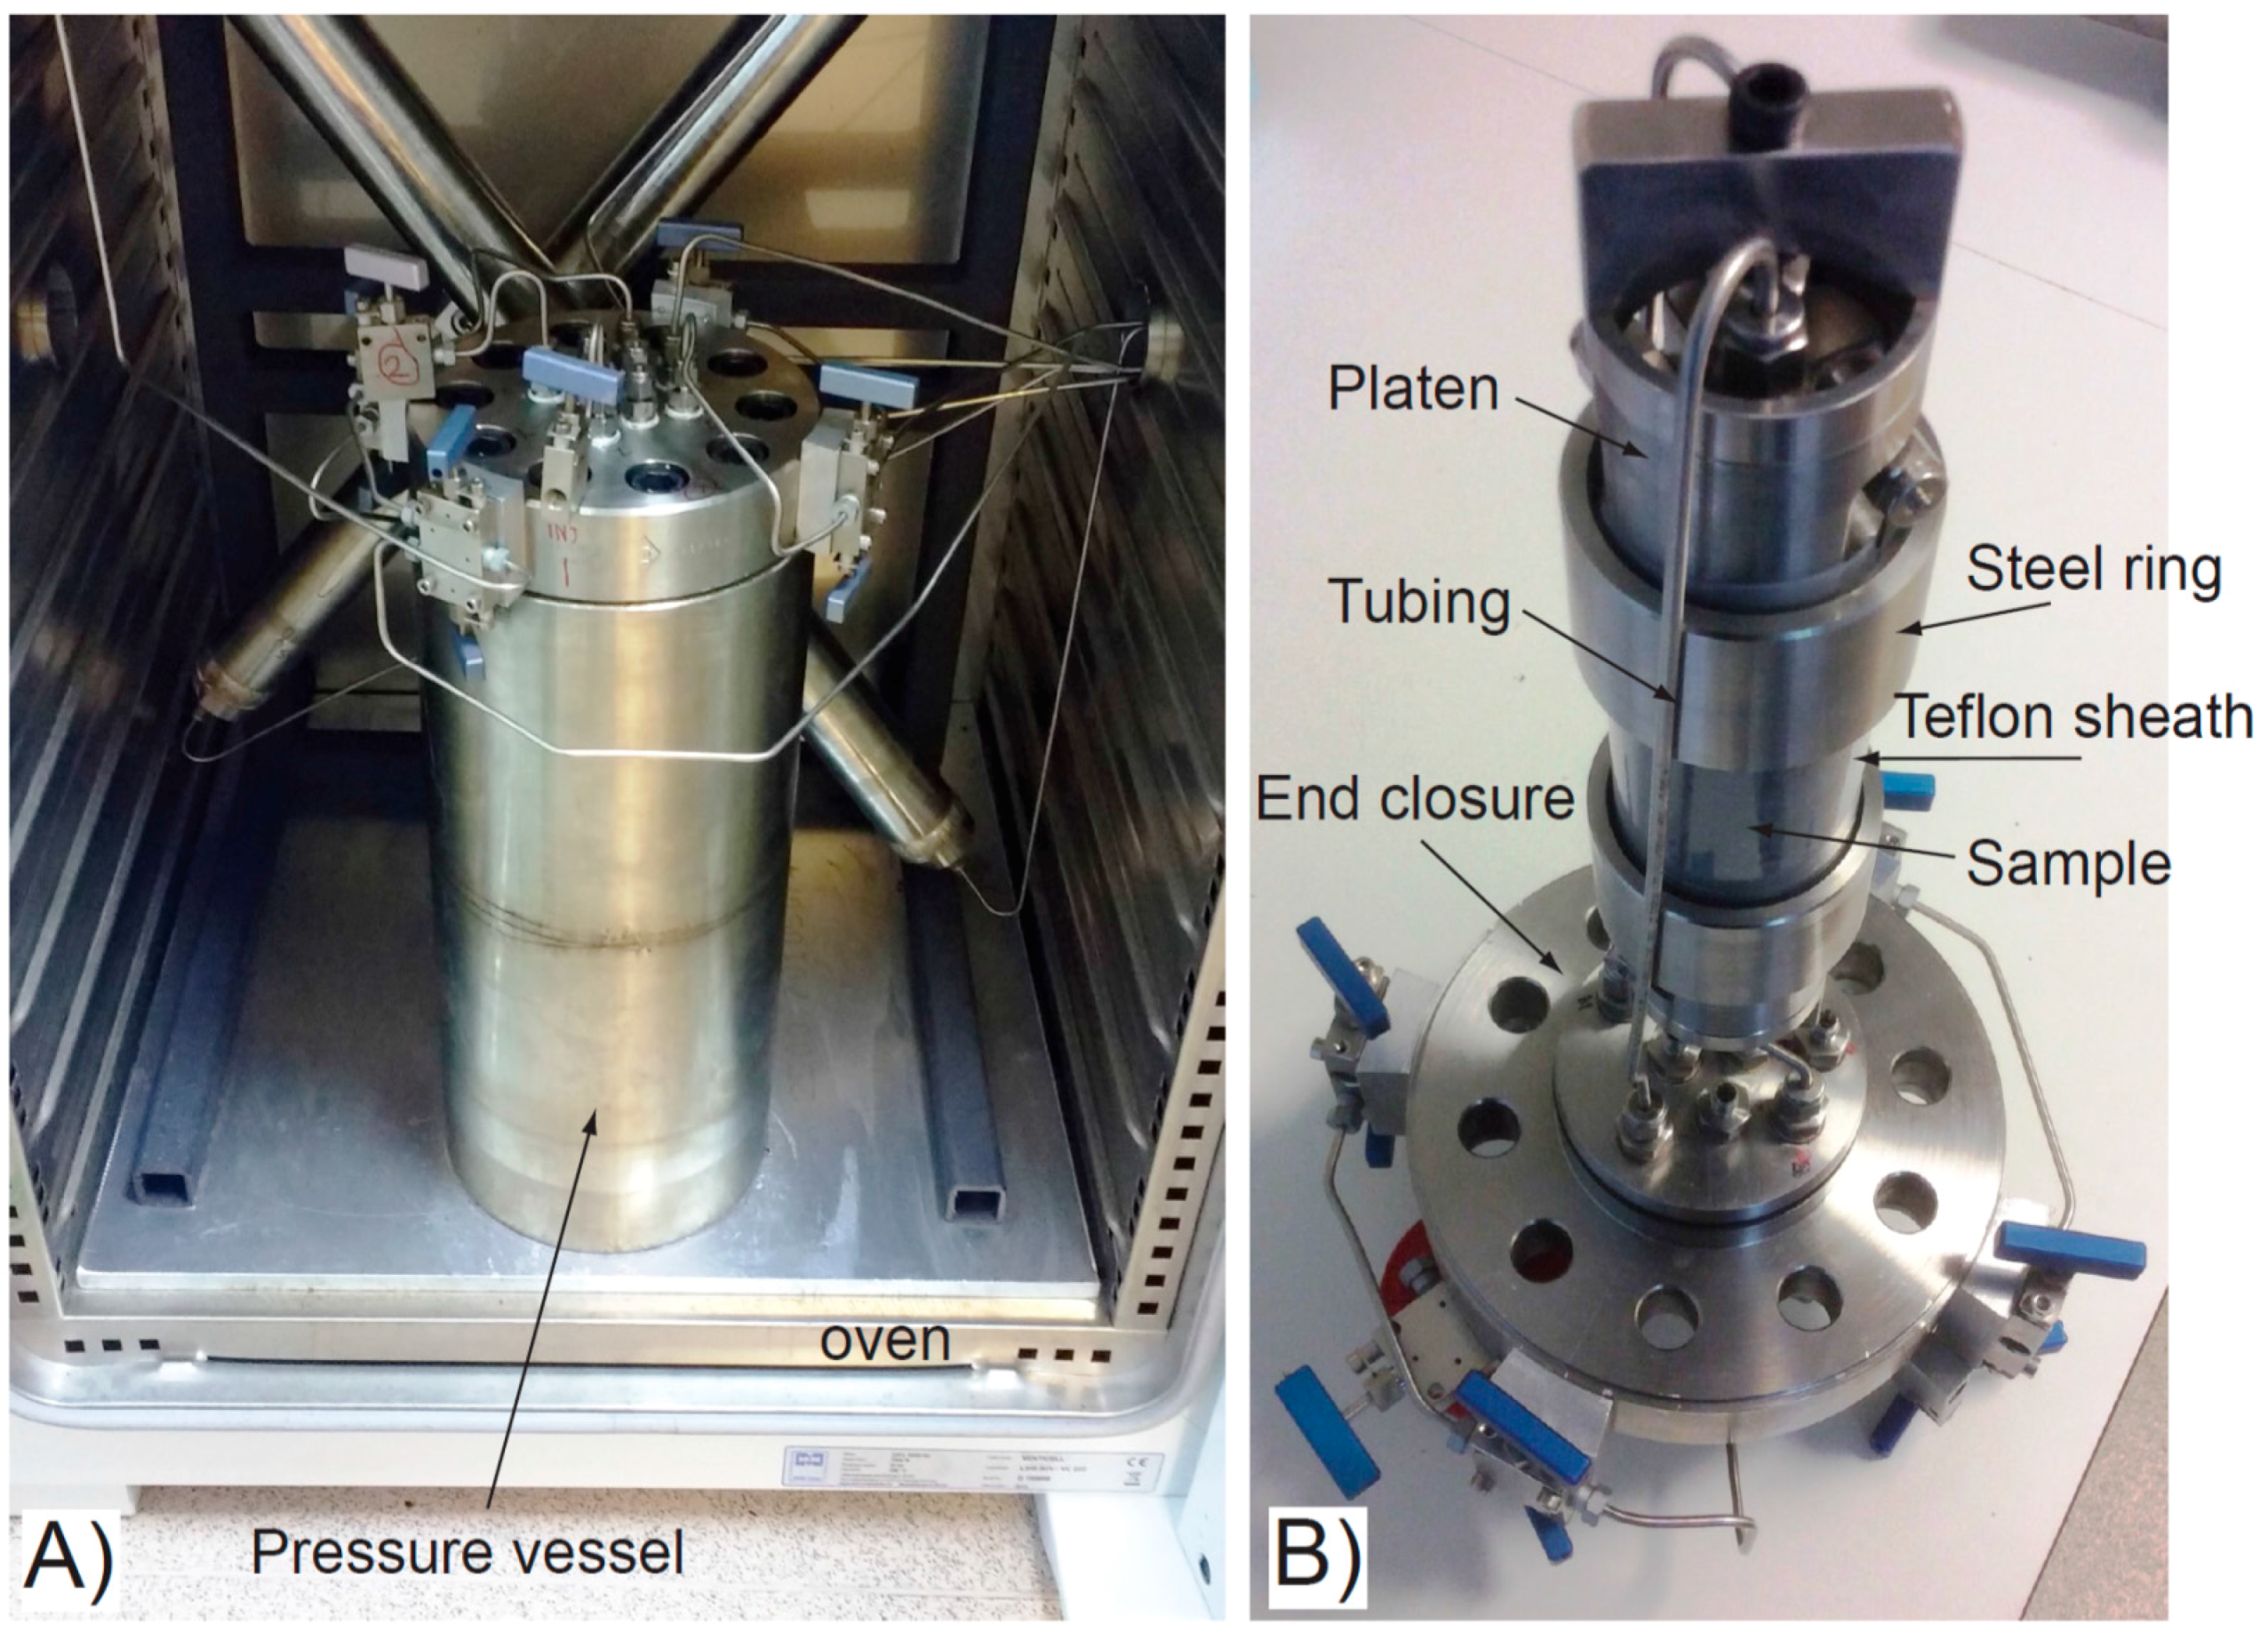
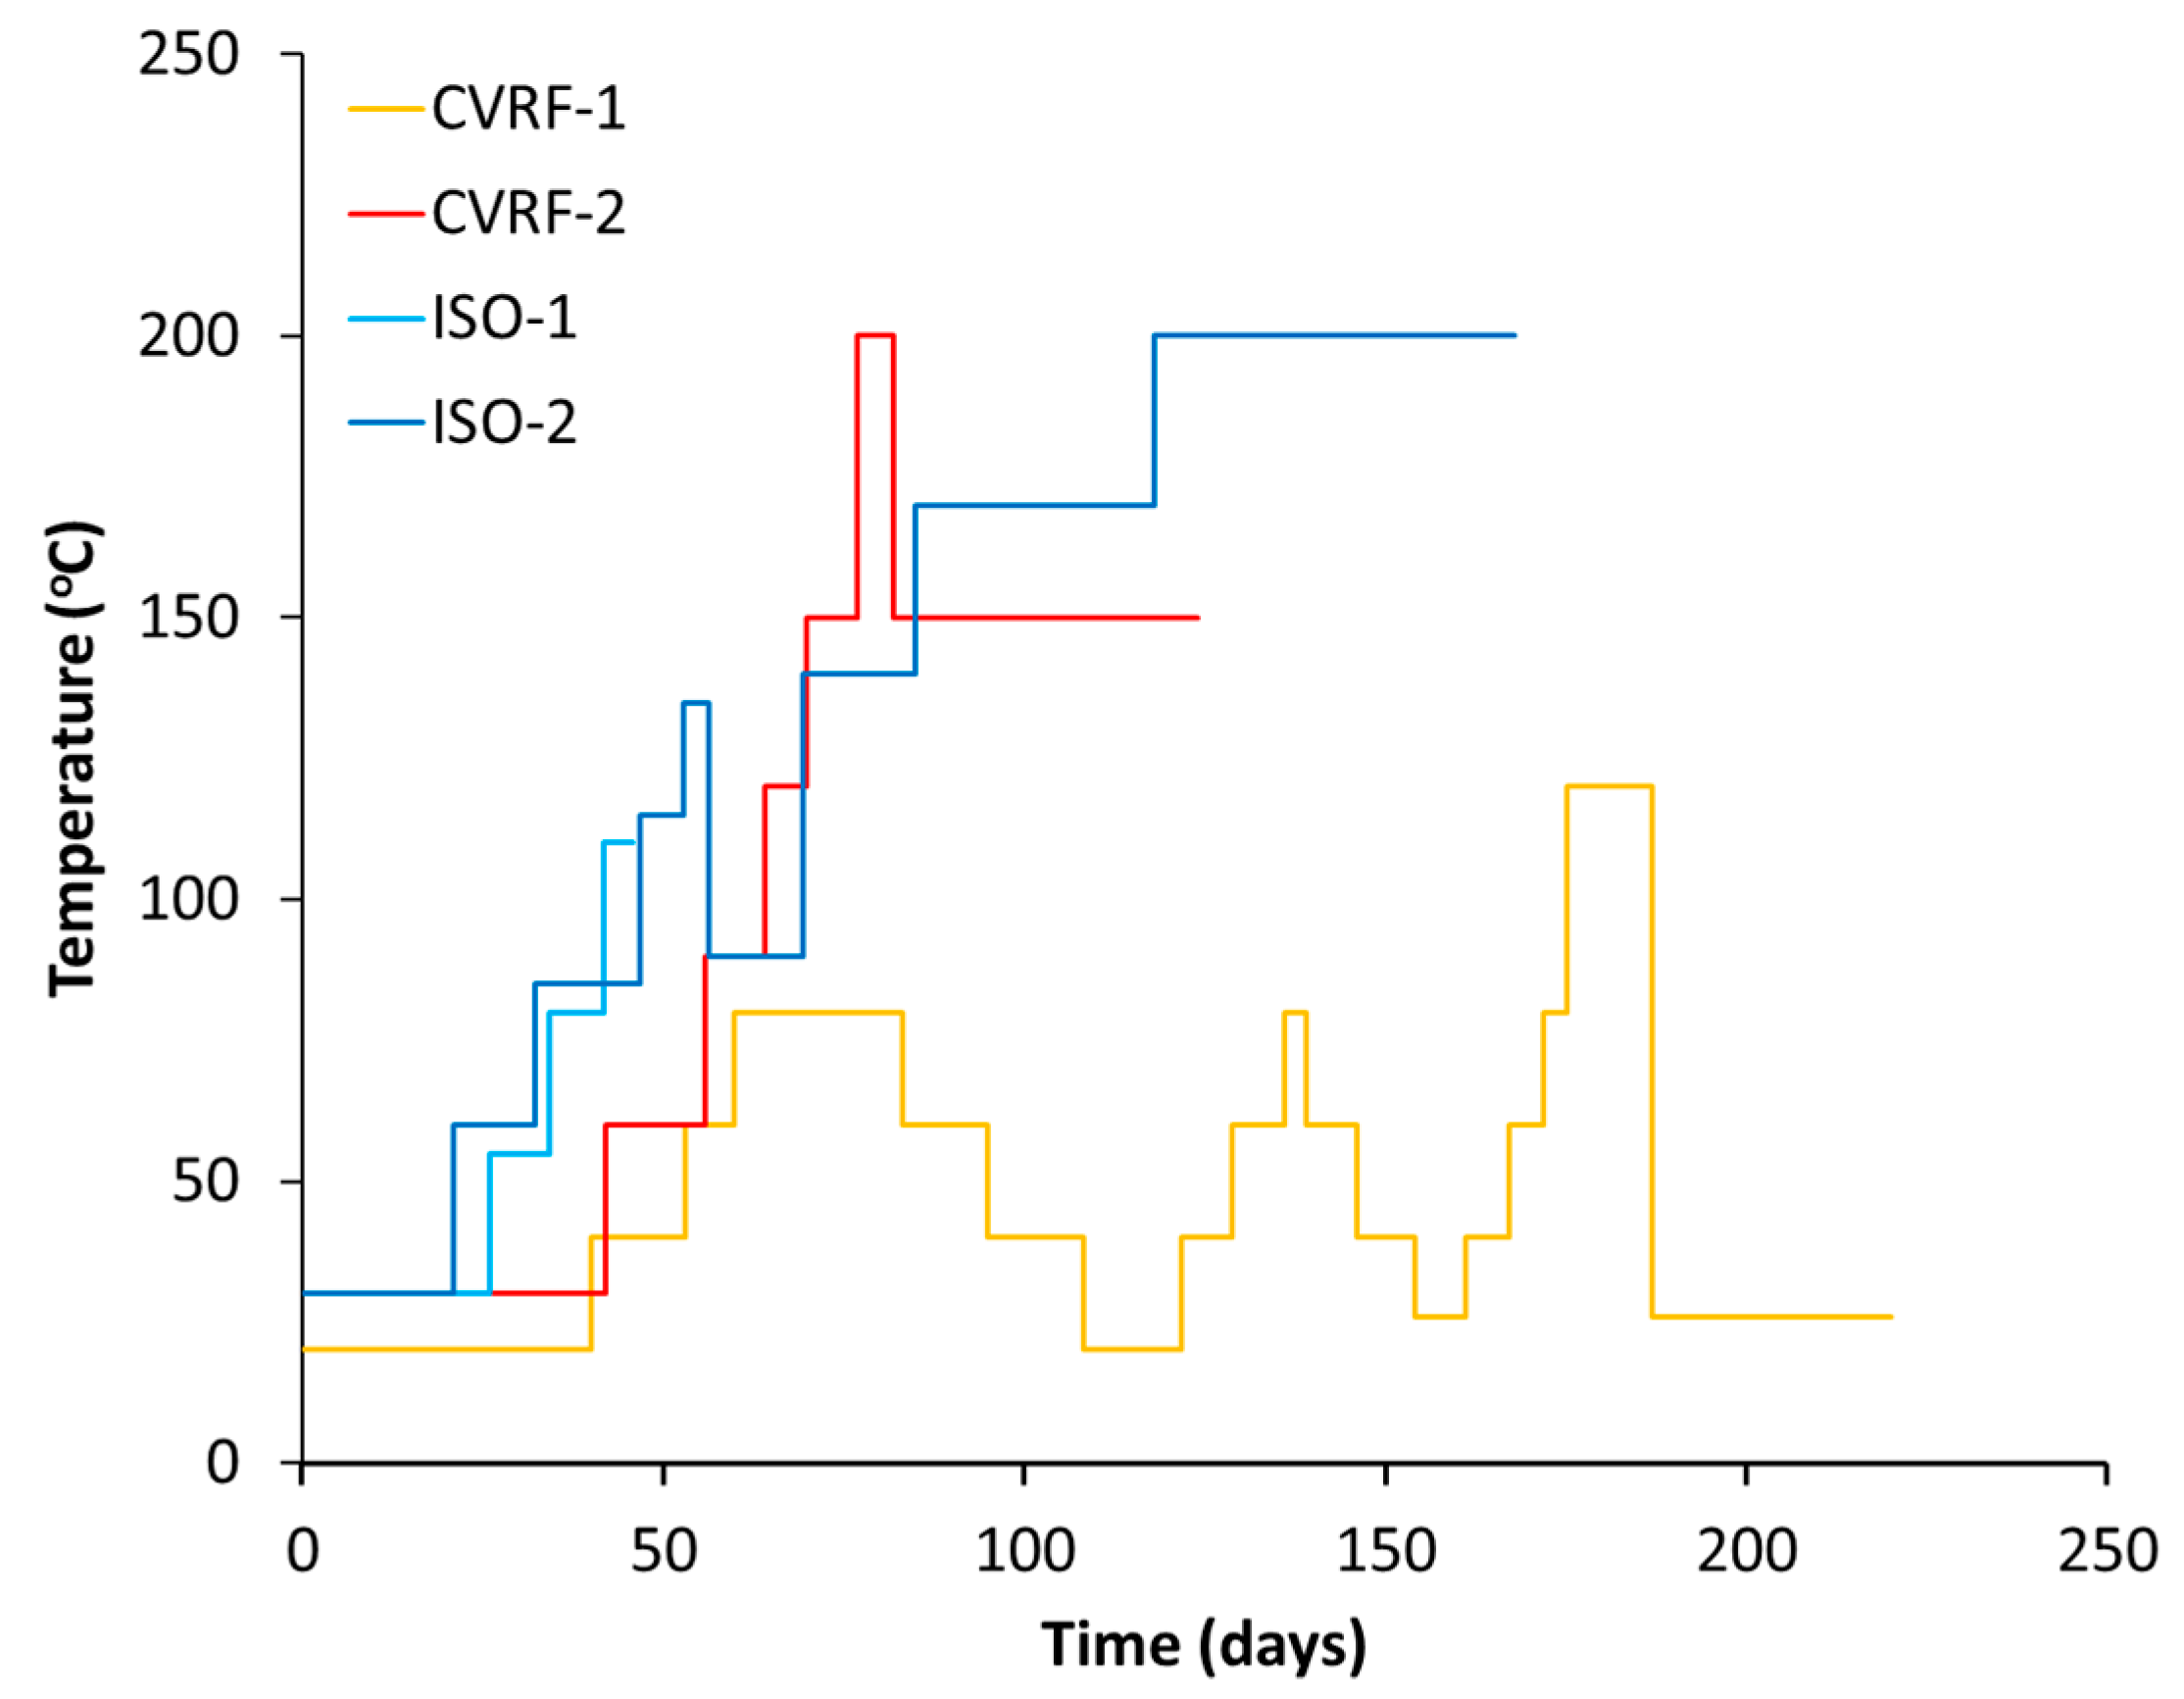
The aim of this study is to experimentally investigate the response of compact MX80 bentonite during a thermal loading cycle up to 200 °C, extending the temperature range that has previously been considered (e.g., [25,26]). While repeated thermal cycling is highly unlikely to occur in-situ, it has been examined as part of this study to assess permanent changes to the bentonite thereby gaining a broader understanding of its response to thermal loading. Two complementary experimental configurations were used: the first configuration had a constant volume boundary condition (simulating the deposition hole characteristics in a hard-rock geological setting) and the second used an isotropic confining pressure that allowed volume change (reflecting disposal in a soft-rock geology). The two configurations offered different advantages. The constant volume boundary configuration was instrumented with up to 3 porewater pressure transducers and 5 load cells measuring the porewater pressure and swelling pressure of the clay respectively. However, due to the nature of the boundary condition within a constant volume test, the development of even a very small gap between the clay and the side of the vessel could lead to the production of a high permeability pathway around the outside of the clay. To address this issue a second apparatus was constructed in which the sample was isotropically stressed, allowing volume change while preventing fluid migration around its periphery. The disadvantage of the isotropic system was that the surface of the clay could not be instrumented. In this paper, we combine new measurements on the sensitivity of permeability to temperature with a reanalysis of previous data (constant volume radial flow (CVRF) experiment CVRF-1) originally presented by Zihms and Harrington [26]. The results of four experiments presented here provide details of the intrinsic permeability, the total stress, the swelling pressure and the porewater pressure during thermal loading of compact bentonite. Comparisons between the experimental results from the different experimental configurations are made and the observations provide an important insight into EBS behaviour under a range of temperature conditions.

2. Materials and Methods

2.1. Sample Preparation

The samples were prepared from blocks of pre-compacted MX80 bentonite with a dry density of 1.56 kg/m3 and a bulk density of 1.99 kg/m3, obtained from Clay Technology AB (Lund, Sweden) (Table 1). This type of bentonite is currently being considered for use as the EBS in the Swedish KBS-3V concept for a spent fuel repository (e.g., [31,32]). The bentonite was manufactured by rapidly compressing VOLCLAY MX80 bentonite powder in a mould under a one-dimensionally applied stress [33]. VOLCLAY MX80 is a trademark name of Amcol International Corporation (Hoffman Estates, IL, USA), now a subsidiary of Minerals Technologies Inc. (New York, NY, USA). The material is fine-grained sodium bentonite from Wyoming containing around 90% montmorillonite, part of the (dioctahedral) smectite group. It is a hydrous aluminium silicate with the chemical formula (Na,Ca)0.33(Al1.67Mg0.33)Si4O10(OH)2.nH2O [34]. After compaction, the resulting bentonite had an average water content of 27.4%. The bentonite was delivered as large pre-compacted blocks that were then cut into cylinders to precisely fit the apparatus. The cylinders were cut so that their length was parallel to the direction of compaction during formation. Because of the small tolerance for sample size in one of the test apparatuses, it was crucial for the sample diameter to be as close as possible to the internal diameter of the pressure vessel. Also, for all of the samples, it was necessary for the end faces to be perpendicular to the sides of the cylinder. The end faces and circumference of the bentonite cylinder were both produced using a machine lathe. The machining was done in dry conditions to prevent unwanted swelling of the sample before the experiments began. Consequently some moisture loss will have occurred during sample preparation, though care was taken to minimise this effect. The preparation was achieved as quickly as possible; only one sample was produced at a time and the bentonite was kept in vacuum-sealed packaging whenever possible. The sample dimensions and weight were recorded and X-ray radiography was used to image the fabric of the bentonite, both pre- and post-test (Table 1). The post-test samples were then dried in an oven at 105 °C for more than 48 h. This allowed the calculation of the geotechnical properties from the wet and dry weights as well as the sample volume, based on a grain density of 2770 kg/m3 [26].

2.2. Method

2.2.1. Constant Volume Radial Flow Experiments

The prepared MX80 bentonite sample was placed inside a custom-built 316 stainless steel, constant volume vessel with two end closures and a pressure rating (the maximum safe working pressure) of 70 MPa (Figure 1). A system of stainless steel tubes connected the ends of the vessel to the injection and back pressure pumps. All tubing was flooded with de-ionised water prior to installing the sample, to remove any air from the system. To allow thermal cycling, the vessel itself was placed in an oven (BINDER GmbH, Tuttlingen, Germany, Series FED 400) with a temperature range of 5 °C above room temperature to 300 °C. A variation in temperature of ±3.8 °C at 150 °C was observed depending on the location of the thermocouple, with a fluctuation in actual temperature of ±0.7 °C at 150 °C. Tubing exiting the oven allowed connection to a pair of Teledyne ISCO D-Series 260D syringe pumps (Teledyne Technologies Inc., Thousand Oaks, CA, USA), which had to remain at room temperature in order to function correctly. One thermocouple was used to monitor the ambient temperature in the laboratory, whilst 6 thermocouples were positioned inside the oven; these thermocouples continuously measured the temperature of the pressure vessel and 5 other points within the oven. The thermocouples were also used to ensure the temperature of the oven was correct and that the temperature distribution was homogenous within the tolerances specified above.
The experiments were instrumented with 5 load cells and 5 porewater pressure transducers. Three of the porewater pressure transducers were used to measure the porewater pressure around the mid-plane of the sample, and two were used to monitor the pressure generated by the injection and backpressure pumps. In the CVRF-1 experiment, these instruments were not temperature-compensated and thus the experiment was limited to 120 °C. In the CVRF-2 experiment, the pressure vessel was instrumented with 5 temperature-compensated 2 kN XF2041 load cells manufactured by Measurement Specialties to measure the radial and axial stress. The load cells were rated to above 200 °C to accommodate the temperature range of the experiment. To prevent damage, the porewater pressure transducers in this experiment were situated outside the oven and connected to the experiment via stainless steel tubing. However, this lead to compliance errors and the data was discarded. Using FieldPointTM and cRIO logging hardware (National Instruments Corporation, Austin, TX, USA) and a bespoke programme written in LabViewTM (National Instruments Corporation, Austin, TX, USA), pressure, volume and flow-rate data from each pump were recorded at a log rate of 160 s. The data from the 7 thermocouples, 5 load cells and the 5 porewater pressures were simultaneously logged for the duration of the test. This software allowed alarms to be raised should the logged values fall outside of specified limits.

Calibration

The raw voltage measurements from the load cells and pressure transducers used during the constant volume experiments had to be converted to calibrated output values using a calibration conducted prior to the beginning of each test. Each piece of apparatus was calibrated before every experiment; a steel dummy was used to occupy the volume of the pressure vessel during the calibration. The calibration of the CVRF rig and all sensors was conducted between 0 and 23 MPa in increments of 1, 2 and 5 MPa and at 30 °C, 70 °C, 110 °C and 150 °C. The equation for a surface describing the relationship between the voltage measured by the load cell, the temperature and the calibration pressure was used to find the calibrated value for each instrument with time. Here, for each load cell, the stress was described by the particular bivariate polynomial
p ( T , σ ) =   i = 0 n i = 0 m p i j T i σ j
where n = m = 2 and T is the temperature and σ the load cell stress. The nine coefficients (dimensionless fitting parameters) were determined by a least squares fitting of the experimental data (see Appendix A for the coefficient values).

2.2.2. Isotropic Confining Pressure Experiments

Two isotropic confining pressure experiments were conducted using the apparatus shown in Figure 2, following the approach of Harrington and Horseman [35], but with thermal loading enabled. The sample was placed in a custom-built single closure pressure vessel and positioned between two circular filters and two steel platens. A Teflon sheath was fitted over the outside of the sample, the filters and the platens (Figure 2B), and was heated with an air gun to shrink it tightly into place. Two o-rings at the end of both platens formed the seal against two steel rings and prevented the confining fluid outside of the Teflon sheath from invading the sample. With the sample sealed between the Teflon sheath and the steel platens, tubing was used to connect the two ends of the sample unit to the base of the vessel’s end closure. The pressure vessel was filled with deionised water and the whole sample assembly was then lowered into the vessel and the lid fastened. As with the CVRF experiments, the pressure vessel for these two experiments was housed in an oven with steel tubing connecting it to the rest of the apparatus stationed in the laboratory outside (Figure 2A). The air was removed from the tubing before it was connected to the lid of the vessel. The pump pressure and volume, and the temperature of the oven air, pressure vessel, each of the pumps and the ambient laboratory temperature were recorded at a logging rate of 160 s for the duration of the experiment.

3. Results

For all four experiments presented, the testing can be categorised into phases that described the testing conditions. The first phase in CVRF-1, CVRF-2 and ISO-1 test was the hydration phase with equal up and downstream pressures applied by the injection and backpressure pumps. The ISO-2 test was hydrated under a hydraulic gradient and therefore did not include hydration as a separate experimental phase. The second phase was a constant head phase where a hydraulic gradient was applied across the sample. During this phase, the experimental temperature was incrementally increased and decreased. For clarity and ease of description, fluids flowing from the injection pump and entering the sample are termed positive flow-rates. Positive flow-rates at the backpressure pump describe fluid flowing from the sample and entering the pump; positive flow-rates at the confining pump describe fluid flowing from the pump to the apparatus. The net flow is the flow into the sample minus the outflow from the sample. For the majority of the pressure range used in these experiments, the boiling point of water is higher than the maximum experimental temperature (200 °C). However, at the backpressure end of the experiments where the pressure is 1 MPa, the boiling point of water is at 180 °C and just below the maximum experimental temperature (Figure 3A). Thus for the highest temperature increments, the fluid at the backpressure end of the sample may have undergone a phase change to steam.

3.1. Constant Volume Radial Flow Experiments

In the CVRF-1 experiment, the bentonite sample was inserted into the apparatus and hydrated with de-ionised water at a constant temperature of 30 °C (Phase 1A, Table 2). The injection pressure and backpressure were set to 1 MPa for the sample hydration. After 14 days, the injection pressure was raised to 3 MPa and the hydraulic transients were given the opportunity to equilibrate for 5 days (Phase 1A) before the injection pressure was raised again to 5 MPa. The sample equilibrated for a further 21 days (Phase 1B) before the temperature was increased (thermal loading phase, Phase 2). The temperature was cycled between 20 and 80 °C, in 20 °C increments for the next 120 days (Figure 4). A minimum time of 5 days was allowed between each increment, except for the second and third 80 °C increment, to give the stress and the hydraulic transients an opportunity to equilibrate. It is acknowledged that the time allowed for equilibration is unlikely to be sufficient for the system to achieve full equilibrium. However, given the constraints imposed by the need for short experimental timescales, it is not practical to wait for very long periods of time between increments. The guideline of 5 days was chosen as an equilibration timescale because at this point the majority of the transient had occurred. The final temperature increment was to 120 °C. After this temperature step, the temperature was reduced to 27 °C before the test was terminated (Figure 4).
Once the sample was installed, the total stress within the CVRF-1 experiment rose quickly and reached an asymptote at a constant value (Phases 1A and 1B, Figure 5). A difference in axial and radial stress was observed and may relate to a number of factors such as friction between the clay and the walls of the pressure vessel, homogenisation and small-scale heterogeneities within the sample. This response has been observed in similar tests [45] and in field-scale studies [46]. After each incremental increase in temperature, there was a spike in the total stress which quickly dropped off to a steady value. This spike in stress was generated primarily by the expansion of the porewater with each increase in temperature. For step increases in the temperature, the steady value of total stress very slightly decreased, whilst for step decreases in the temperature, the steady value of total stress seemed to very slightly increase.
The porewater pressure also showed a spike in the value after a temperature step-change which then decayed to a steady value (Figure 6). For step increases in temperature, this spike was positive, whilst for step decreases in temperature, the porewater pressure spikes were negative. In addition, the steady value of porewater pressure was slightly increased after each temperature increase, and slightly decreased after each decrease in temperature, showing the opposite trend to the total stress. However, in both cases the change in steady value was very small.
In the CVRF-2 experiment, once the sample was inserted into the apparatus, the bentonite was hydrated with de-ionised water at a constant temperature of 30 °C (Phase 1A, Table 2). To hydrate the sample, the injection pressure and backpressure were set to 1 MPa; the total stress, recorded by the load cells, rose sharply in response. After 26 days, the injection pressure was raised to 5 MPa and the hydraulic transients were allowed to equilibrate for 15 days before the temperature was increased (loading phase, Phase 1B). The temperature was increased in 30 °C increments between 30 °C and 150 °C over a period of 40 days (Phase 2). A minimum time of 5 days was allowed between each increment to allow equilibration of the stress and the hydraulic transients. The final temperature increment was to 200 °C. At this point a sudden increase in the flow-rate through the sample was observed and the temperature was reduced to 150 °C before the test was terminated.
For the CVRF-2 experiment, the data recorded by the load cells show that once the sample is installed, the total stress rises quickly and then asymptotes at a constant value, consistent with the sample hydrating, swelling and approaching equilibrium (Phase 1A, Figure 7). The lower total stress value seen in this test compared with the CVRF-1 test could reflect the lower dry density of the CVRF-2 sample (Table 1). As with the CVRF-1 experiment, after each incremental increase in temperature (Figure 4), there is a spike in the total stress which quickly drops off to a steady value. In the CVRF-2 case, for the axial measurement this steady value is higher than for the previous temperature step over the first three temperature steps (Phase 2, Figure 7). For the 150 °C step, the steady-state average total stress value recorded after the temperature increase is lower than the average total stress value for the previous temperature step (120 °C) and did not asymptote by the end of the test stage. For the radial measurement, for the first three temperature steps, the steady value is almost the same before and after the temperature increase. Like the axial measurement, the radial steady value after the 150 °C temperature step is lower. After the final temperature step (200 °C), the total stress values both drop again, but are unable to reach a steady-state value because after 3.8 days at 200 °C, the total stress values dropped sharply and remained low until the temperature was reduced again and the test terminated. The radial porewater pressure transducers on CVRF-2 were unable to provide any reliable data.
The injection and backpressure pump flow-rates (Figure 8) showed a trend for increased flow-rate with increased temperature. After each temperature change there was an initial spike in the flow-rate followed by a decay to a steady flow. As the sample was hydrating, the flow-rate from the injection pump was positive, whilst the backpressure pump flow-rate was initially negative (both pumps providing fluid to the sample). Subsequently, as the temperature was increased, the backpressure flow-rates became positive as fluid was expelled from the sample due to the imposed hydraulic gradient. The injection flow-rate increased as the pressure was increased from 1 MPa to 5 MPa, and then again for the first two temperature steps (60 and 90 °C). For the 120 and 150 °C increments, the injection flow-rate was slightly reduced. The discrepancy between in- and outflow at steady-state indicate a leakage from the test system. The backpressure flow-rate marginally increased with each temperature step suggesting that with increased temperature, slightly more fluid was being drained out of the sample. The presence of a hydraulic gradient will result in some outflow from the sample, but the difference between the volumes of fluid entering and leaving the sample (net flow) will indicate whether the sample is absorbing water, swelling or draining. During phase 1, the net flow shows a step increase for each pressure increment (at the start of phase 1A and phase 1B) followed by a gradual flattening of the net flow (red line, Figure 8). In phase 2, after each temperature increment there is a step decrease in the net flow followed by a linear increase. It should be noted that the net flow data does not plateau at the end of each step. This may be caused by a small scale leakage in either the injection or backpressure systems which also explain the difference in apparent steady-state flow-rates observed at the end of each stage. The relatively high inflow rates, combined with unexpected flow response for test stages 120 and 150 °C, indicate the leak is likely to originate from the injection system. As such, this data should be treated with caution and changes in permeability should be based primarily on the downstream flux data. At 77 days with the final temperature increment (200 °C), the backpressure flow-rate increased very sharply in the negative direction, accompanied by an increase in the injection flow-rate size and additional and significant noise in the injection pump flow-rate data. This noise in the flow-rate data could be the result of the fluid at the backpressure end of the sample reaching boiling point. Here, the pressure imposed on the sample was 1 MPa, and the boiling point of water at this pressure is 180 °C.

3.2. Isotropic Confining Pressure Experiments

In experiment ISO-1, the sample was hydrated with de-ionised water at 30 °C for 13.7 days under a confining pressure of 7 MPa and an injection pressure and backpressure of 1 MPa. These values were selected based on previous measurements of the swelling pressure for this batch of bentonite to minimise potential swelling. After this time the injection pressure was increased to 5 MPa and the confining pressure was increased to 9 MPa in order to maintain a constant effective stress (Table 3). At day 26, the temperature of the oven was raised to 55 °C, at day 34 it was raised to 80 °C and at day 41 it was raised to 110 °C (Figure 4). At day 45 confining fluid entered the back pressure pump and the experiment was terminated; upon disassembly there was no obvious sign of disintegration of any of the sample assembly.
In experiment ISO-2, the bentonite was hydrated with deionised water under a hydraulic pressure difference of 4 MPa. At the start of the test, the confining pressure was set to 9 MPa, the injection pressure to 5 MPa and the backpressure to 1 MPa (Table 3). After almost 21 days, once the hydraulic transients had reached a quasi-equilibrium state, the temperature was then increased in increments up to 135 °C, reduced to 90 °C and then increased again in increments to 200 °C (Figure 4) over a time period of 53 days. At this point, the Teflon sheath separating the sample from the confining fluid split and the experiment was terminated. As with the CVRF-2 and ISO-1 experiments, a minimum time of 5 days was allowed between each increment ensuring that the stress and hydraulic transients had equilibrated.
The flow-rates recorded in each of the ISO experiments showed the same general trend; given a constant hydraulic gradient, there appears to be a greater rate of fluid flow through the sample at higher temperatures. In ISO-1 there was an initial positive spike in the flow-rate data at 15 days on all pumps, corresponding to the increase in injection pressure from 1 MPa to 5 MPa (Figure 9). The confining pump showed a negative spike in flow-rate after each temperature increment consistent with the thermal compliance of the test system (Figure 9). The backpressure pump showed a positive spike in the flow-rate at each temperature increase that decayed to a steady flow. The backpressure flow-rate was increasingly positive after each increment until the final increment (110 °C) (Figure 4) where the flow-rate was unable to achieve a steady output and remained large. Despite this large output, there was no obvious sign of jacket rupture or any other damage to the apparatus upon removal of the sample. This is inconsistent with the observation that at the 80 °C temperature increment, the flow from the confining pump into the apparatus matched the fluid flow into the backpressure pump, indicative of a leak in the apparatus. At the end of the hydration phase, the net flow in ISO-1 showed a step increase in flow coincident with the increase in injection pressure (Figure 9). After the first temperature increase, there was a step decrease in the net flow. The next temperature increase caused another step decrease in net flow, but after this point the large outflow of fluid to the backpressure pump caused the net flow to drop below 0, indicating that more fluid was leaving the sample than was going into it; this additional fluid came from the confining system.
The sample in the ISO-2 experiment was hydrated at 30 °C whilst also experiencing an immediate hydraulic gradient of 4 MPa; the injection flow-rate during this time started high and decreased to a steady, positive value (Figure 10). The injection flow-rate showed a sharp negative spike after each temperature increase, decaying to a steady value. After the 4th temperature increment (135 °C) the temperature was reduced to 90 °C. This was accompanied by a positive spike in the injection flow-rate. As the temperature was increased again, the spikes in flow-rate returned to negative values. The backpressure flow-rates showed the opposite trend with positive spikes in flow-rate decaying to increasingly large positive flow-rate values indicating that the dominant flow direction was out of the sample. The net flow showed a sharp decrease after each temperature increase, decaying to an almost constant positive net flow value. However, the presence of a very small gradient on the net flow curve suggests that either there was a very small leak in the system or the system hadn’t fully reached steady-state. At the third temperature increase to ~120 °C, the net flow became negative. When the temperature was reduced from 135 to 90 °C, the net flow showed a sharp increase, again decaying to an almost constant value. At the penultimate temperature step to 170 °C, the net flow clearly didn’t reach a constant value, possibly indicating the onset of the leak in the apparatus. At the final temperature step to 200 °C, the net flow showed a sharp and sustained decrease confirming the point of failure of the Teflon sheath.

3.3. Permeability

The permeability was calculated using Darcy’s Law:
κ =   Q   μ   L A   Δ P
where Q is the observed inflow or outflow rate, μ is the fluid viscosity, L is the sample length, A is the sample cross-sectional area and ΔP is the hydraulic pressure gradient across the sample driving the flow. The intrinsic permeability showed a dependence on temperature for both experiment configurations (Table 4 and Table 5, Figure 7 and Figure 11). However, there were some differences between the results from the four experiments conducted. The permeability data presented in Zihms and Harrington [26] (CVRF-1) were reprocessed to provide better constraints on the estimates of permeability and all of the permeabilities were calculated using the outflow data which is less likely to leak due to its lower pressure and therefore can be considered as a minimum estimate on the permeability. Small-scale leakage of fluid does not affect the experimental sample but it causes the reported values of flow rate from the leaking pump to be higher than they would otherwise be (this is why inflow and outflow from the sample are independently measured). By comparing these flows it is possible to quantify the influence of leakage, something that is difficult to do using other methods of permeability measurement. Three of the experiments (CVRF-2, ISO-1 and ISO-2) showed a slight decrease in intrinsic permeability with increasing temperature, especially at higher temperatures (Figure 11). The results from CVRF-1 showed a very slight increase in intrinsic permeability with increasing temperature. Two of the experiments (CVRF-2 and ISO-2) produced permeabilities at 200 °C that were at least an order of magnitude higher than any of the other values. However, during this phase of testing the sheath in the ISO-2 experiment ruptured allowing fluid from the confining system into the injection and backpressure circuits. Data from this stage must therefore be treated with caution and used for guidance only. Close inspection of the data for ISO-2 also suggests a small inflow of confining fluid may have occurred prior to failure of the sheath (Figure 10). For this reason, a correction to the outflow data was made by subtracting the confining flow-rate from the backpressure flow-rate, resulting in a good mass balance between flow in and out of the sample. The ISO-1 test also shows a suspected leak from the backpressure pump for the last two temperature stages. The difference between the backpressure flow-rate and the confining flow-rate for these points of this experiment gives a similar value to the inflow flow-rate, but with significantly more noise. The third and fourth ISO-1 points are therefore calculated from the inflow data alone. The permeability measurement at 200 °C from the CVRF-2 experiment is also dramatically higher than for the previous testing temperatures, however, unlike the ISO-2 test, this is not due to a failure of the experimental apparatus at high temperature and represents a true experimental response. At 200 °C, at the outflow end of the sample a phase change will have occurred where the boiling point was exceeded; however because the inflow permeability for this temperature step, where a phase change could not have occurred, is similar to the outflow permeability, a phase change cannot completely explain the observed permeability increase.

4. Discussion

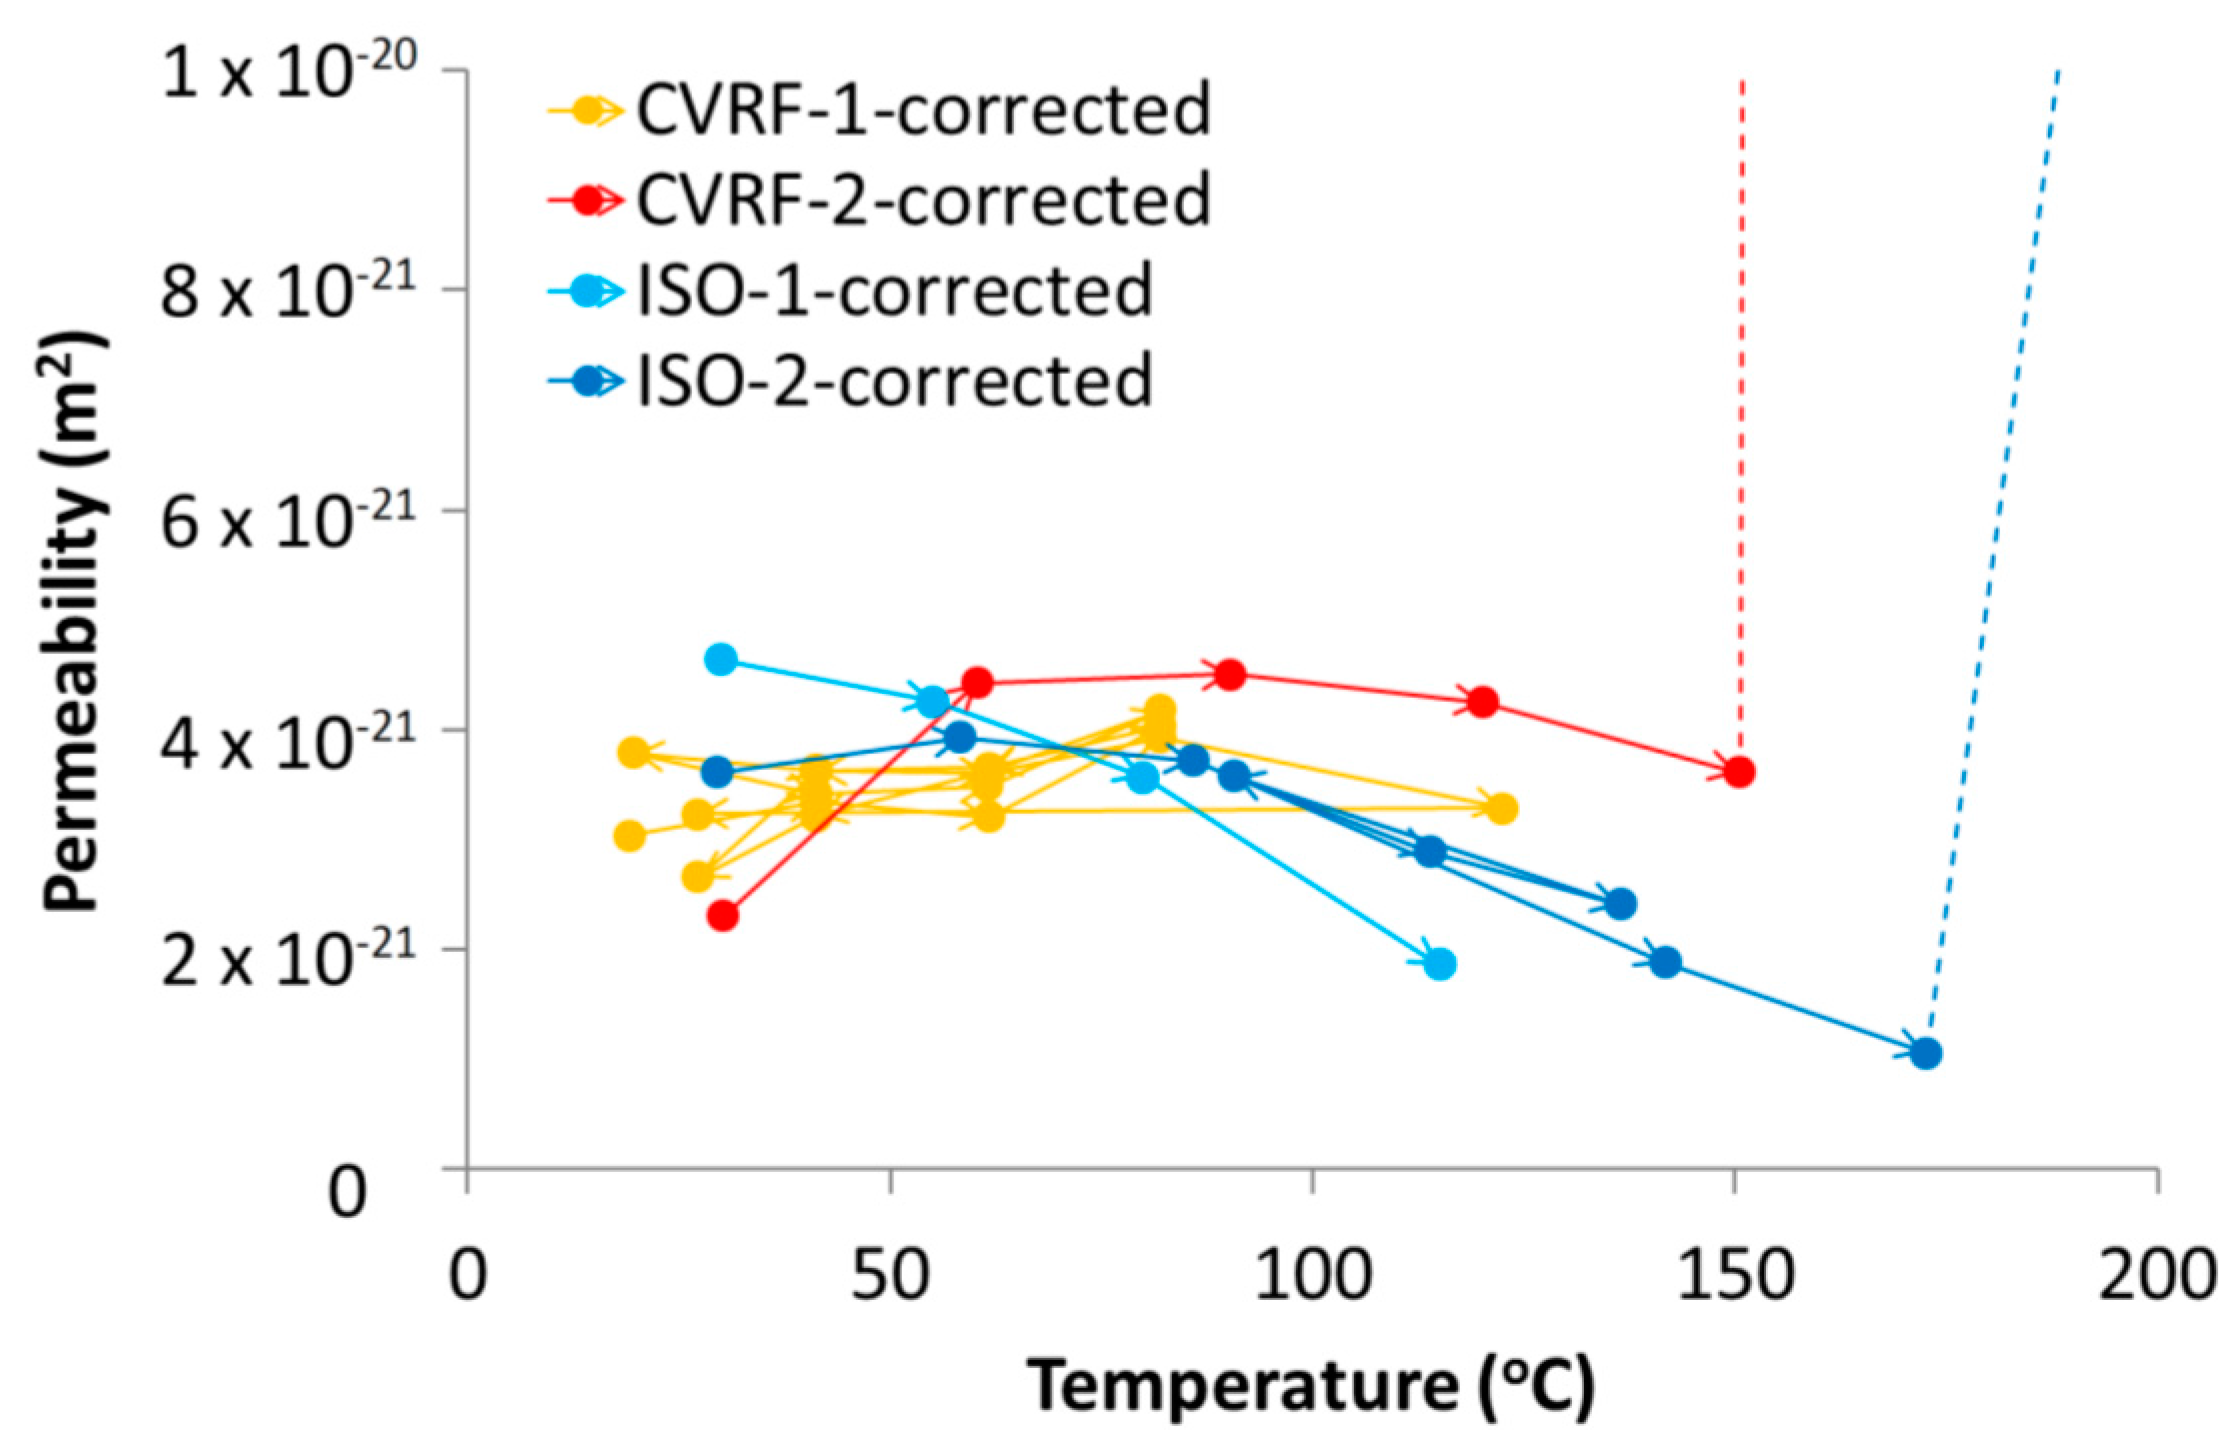
The data from the four experiments showed that the processes occurring within the apparatus over time are complicated and need to be carefully deconvolved. The intrinsic permeability of the bentonite measured in the four tests showed a general trend for decreasing permeability with increasing temperature (Figure 11); the ISO-1 data showed this trend most clearly. The CVRF-1 data did not show a clear trend of either increasing or decreasing permeability with increasing temperature, although the data from CVRF-1 were capped at temperatures below 120 °C, which could have limited the extent of the trend seen in the data. Above approximately 60 °C, the CVRF-2 and ISO-2 experiments showed the general trend for permeability decrease with temperature increase, suggesting a reduction in the porosity of the clay. Although in the CVRF tests, the sample volume could not increase beyond the limits imposed by the pressure vessel, it was possible for the sample volume to alter slightly within the vessel. It can be inferred therefore that the pore volume within the bentonite changed after each increase in temperature, which would have had the effect of altering the fluid pathways in the clay, shown by the increase and decrease in the permeability measured.
The degree of consolidation of the starting material is likely to have a significant control on the thermal behaviour of the bentonite. Temperature controlled triaxial testing on Kaolin between 22 and 90 °C has shown that the stress history affects whether contraction or dilation are observed on heating; normally consolidated samples contract with increasing temperature, whilst over-consolidated samples dilate [47]. Cekerevac and Laloui [
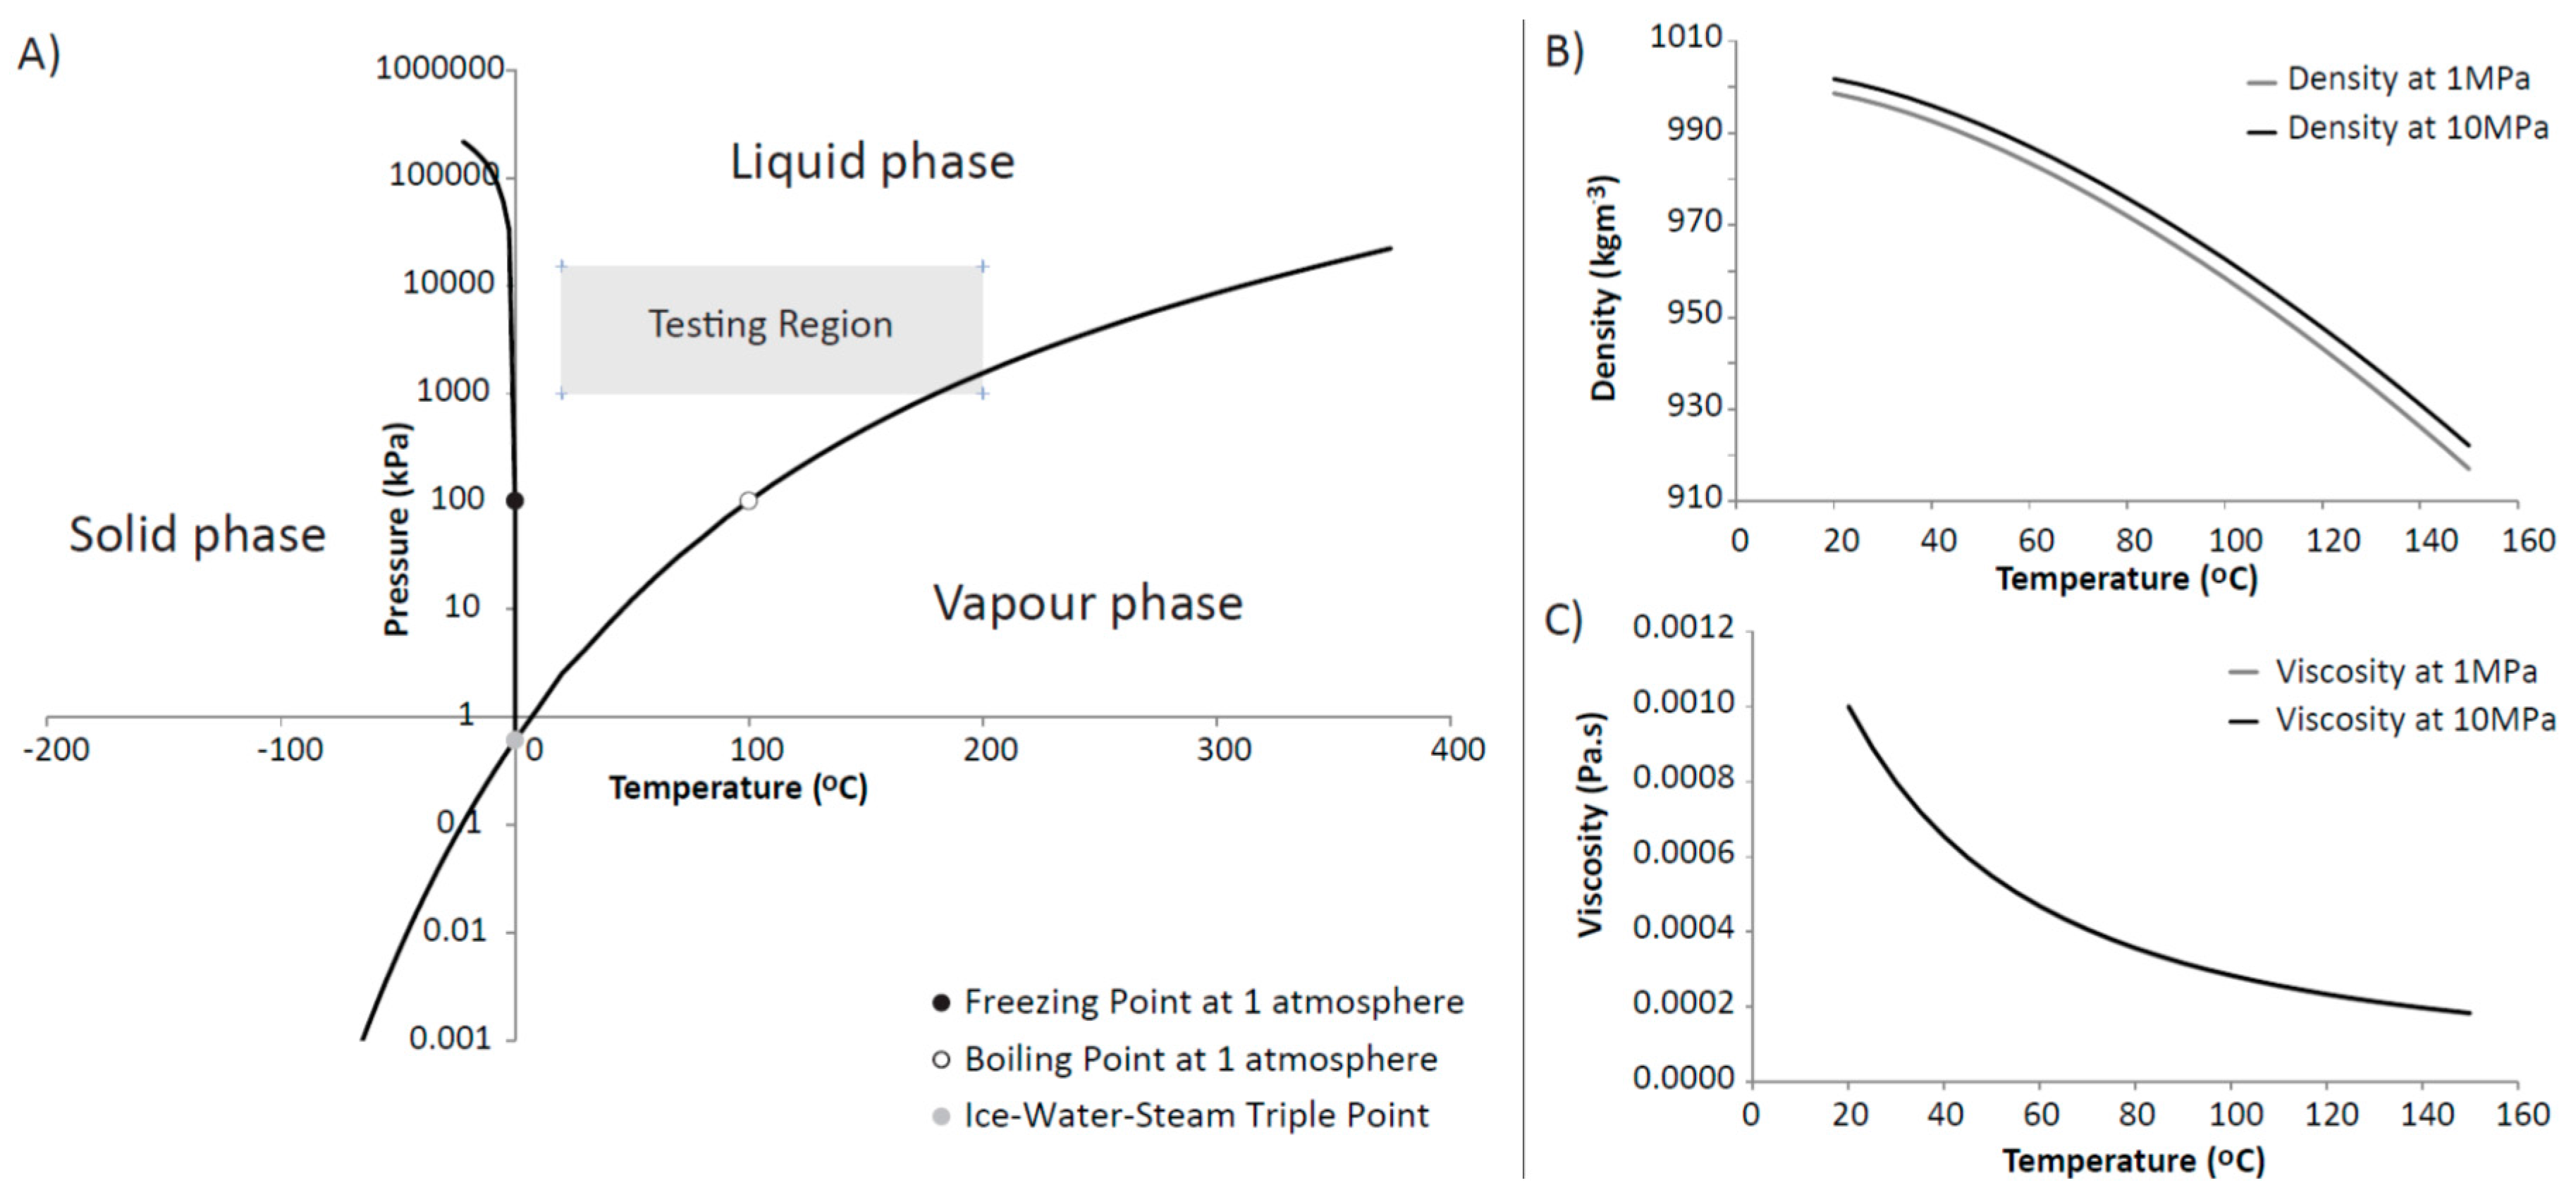
47] also showed that the amount of contraction observed increases with increasing temperature, and this effect was more pronounced above 60 °C. The samples used in this study were close to the pre-consolidation stress and are therefore more likely to exhibit contractional rather than expansional behaviour under a thermal load. In the context of this study, the preconsolidation stress is assumed to be equivalent to the compaction force necessary to achieve the required swelling pressure. Given that three of the four test samples were taken from the same bentonite block, it is difficult to envisage significant variation between the properties in the block and it seems unlikely that this is the primary cause for any discrepancy in the data from the different tests. As such, further work is required to map permeability as a function of temperature, compaction and dry density, especially at higher temperatures. However, the variation in permeability, once corrected for viscosity and density (Figure 3B,C), remains well within 1 order of magnitude and is therefore not of primary concern from the perspective of disposal of radioactive waste material with temperatures up to 150 °C.
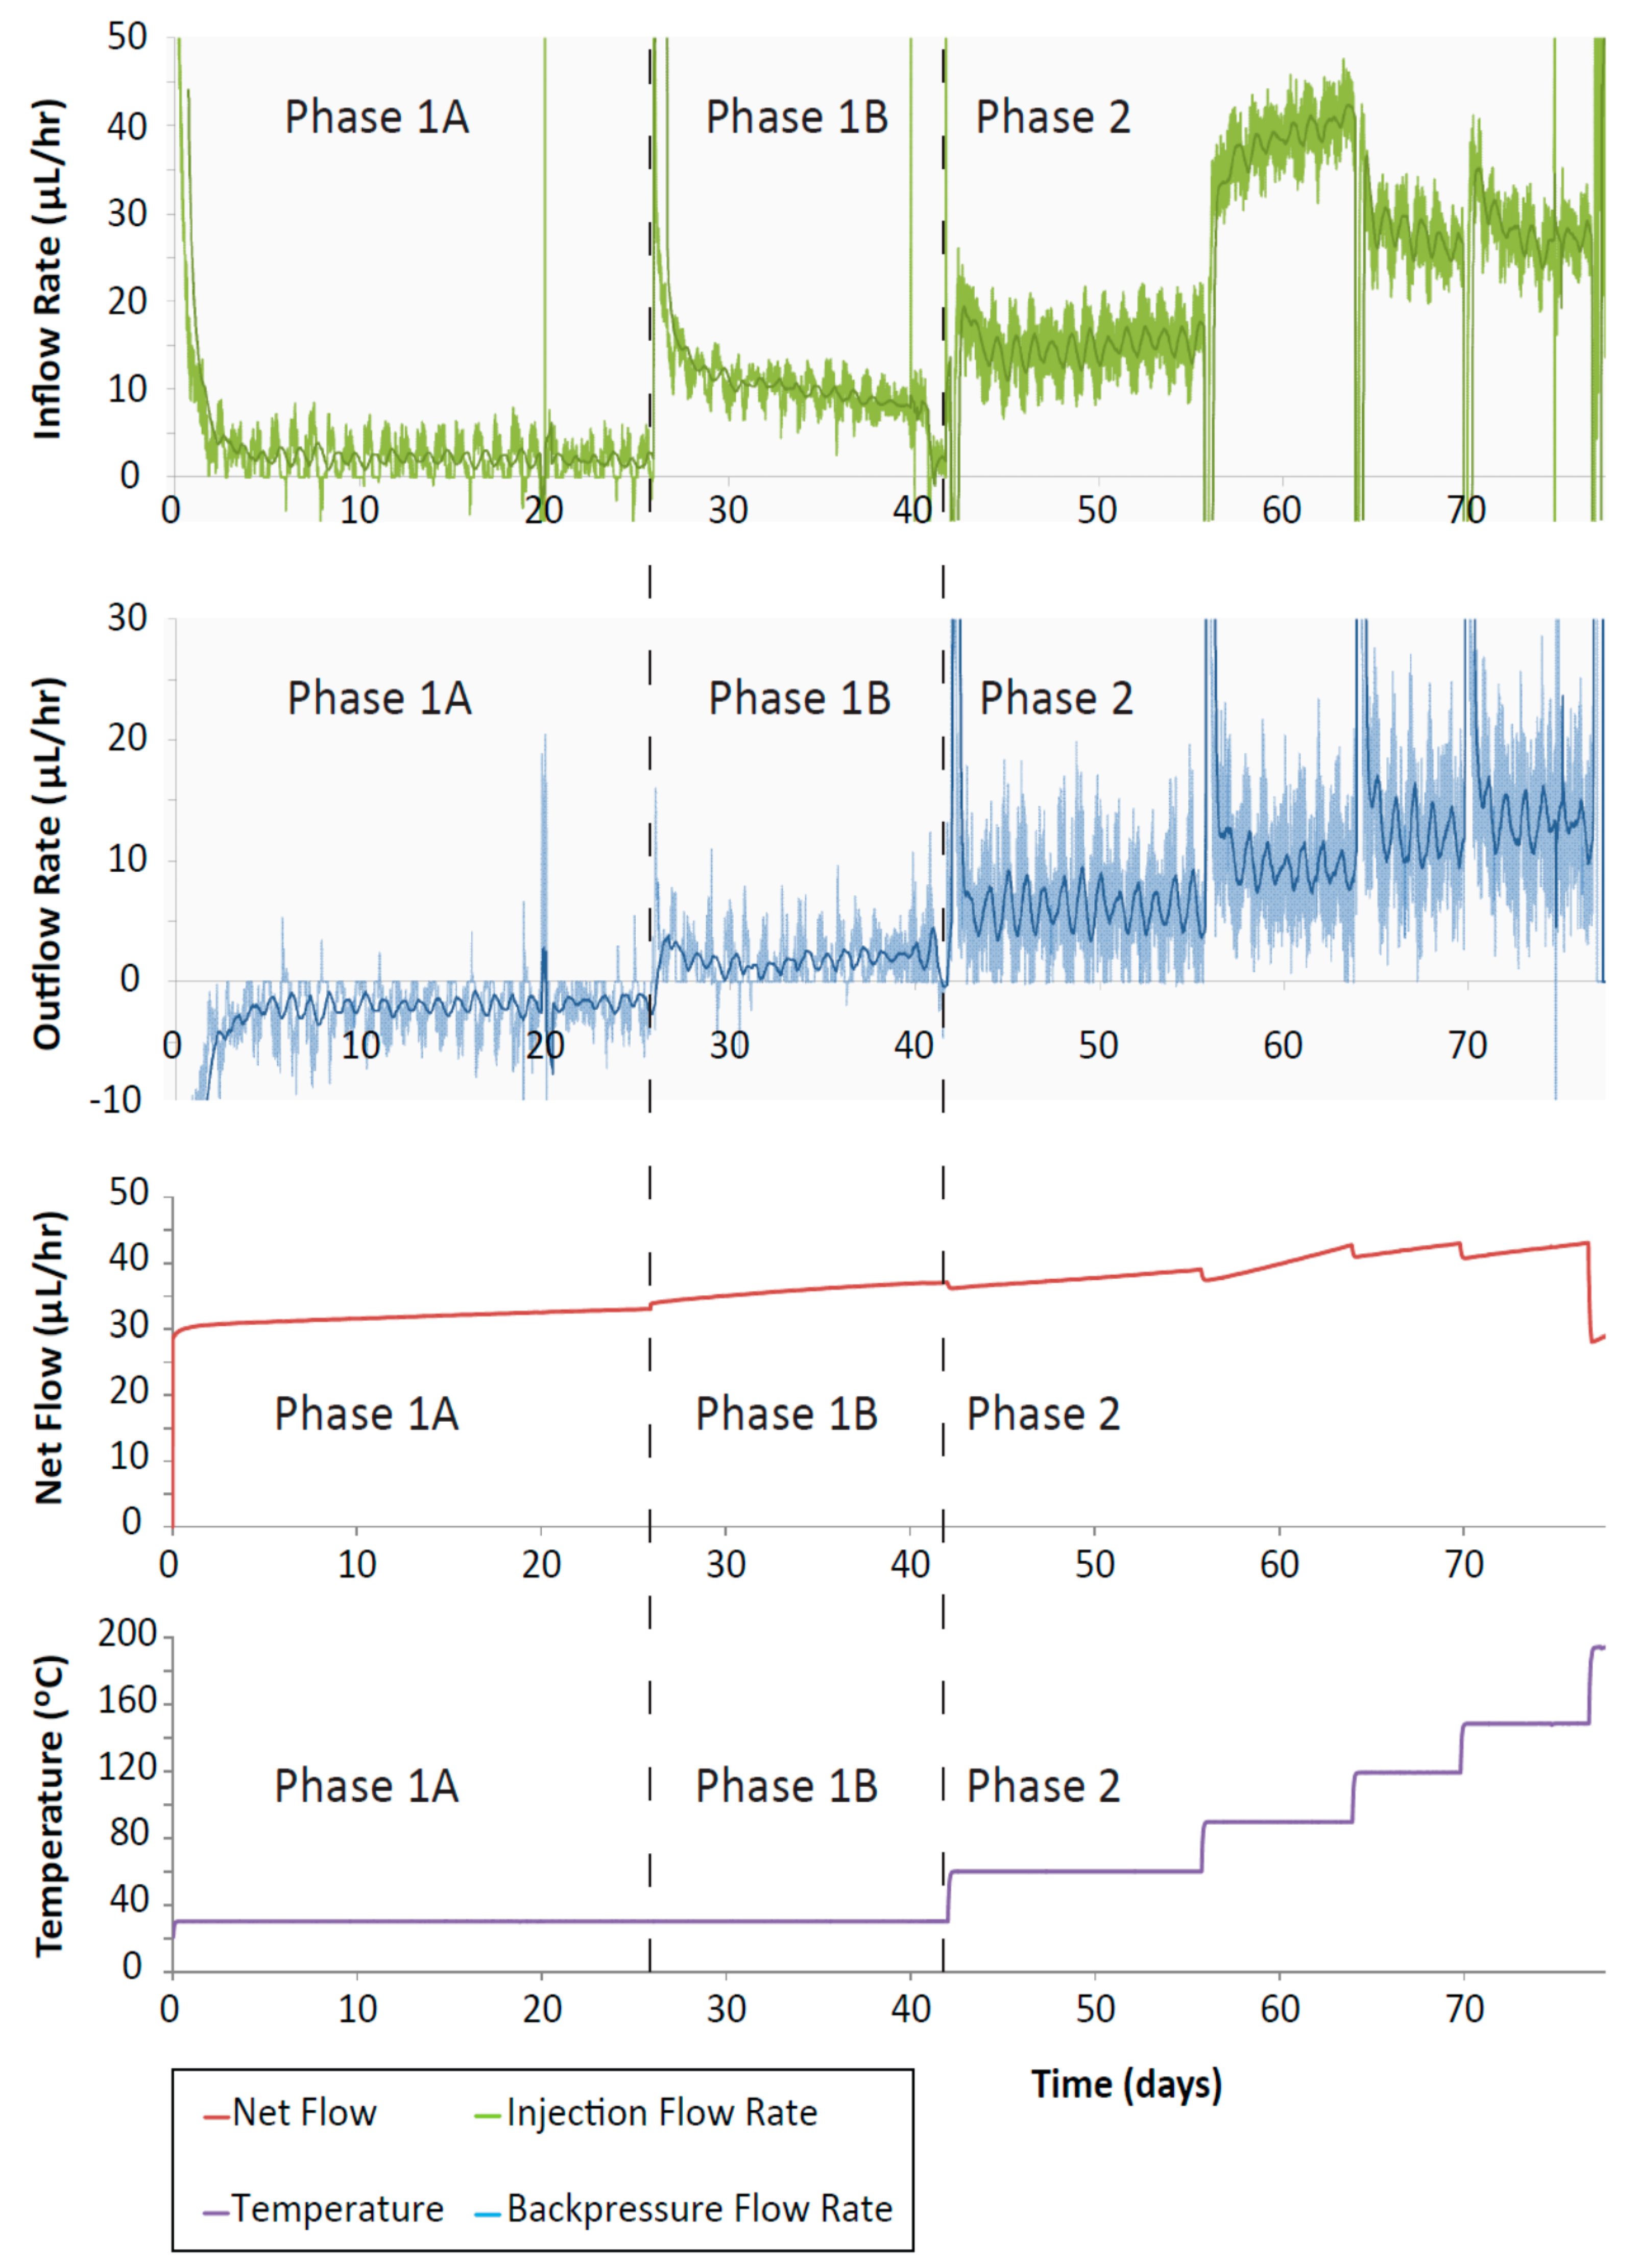
The CVRF-2 and ISO-2 tests produced a high permeability measurement at 200 °C; whilst for the ISO-2 test this is an experimental artefact, for the CVRF-2 test, this is a true response of the experiment. At 200 °C with the backpressure at 1 MPa and assuming a linear pressure gradient, the fluid present in the last 1/5th of the sample length (1.2 cm), closest to the outflow end, may have experienced a phase change to steam. This may have contributed to the higher permeability values recorded at this temperature. However, because the inflow permeability is also much higher and fluid entering the sample at 200 °C would have remained a liquid, the phase change alone cannot explain the increase in permeability at this temperature. Conservatively, if we assume that the phase change affected only the second half (lengthways) of the sample, this would have only resulted in a factor 2 increase in permeability. More likely, the sample will have undergone thermal contraction (as discussed above e.g., [47]) sufficient to generate one or more high conductivity pathways. Once high flow-rates had been observed at 200 °C in the CVRF-2 test, the experimental temperature was reduced to 150 °C to see if the sample would recover before the test was terminated; the flow-rates quickly returned to those prior to the final temperature increment, suggesting that the majority of the observed behaviour at this high temperature was recoverable (Figure 10). However, the sample in this test only experienced the 200 °C temperature for 5 days, which would not have been long enough to induce any thermally derived alteration in the bentonite, such as remineralisation changes to the structure and fabric of the sample [48]. In addition, our tests used de-ionised water as the injection fluid and the amount of mineral alteration, and consequent changes in thermo-hydro-mechanical (THM) behaviour, may change with the composition of the permeant.
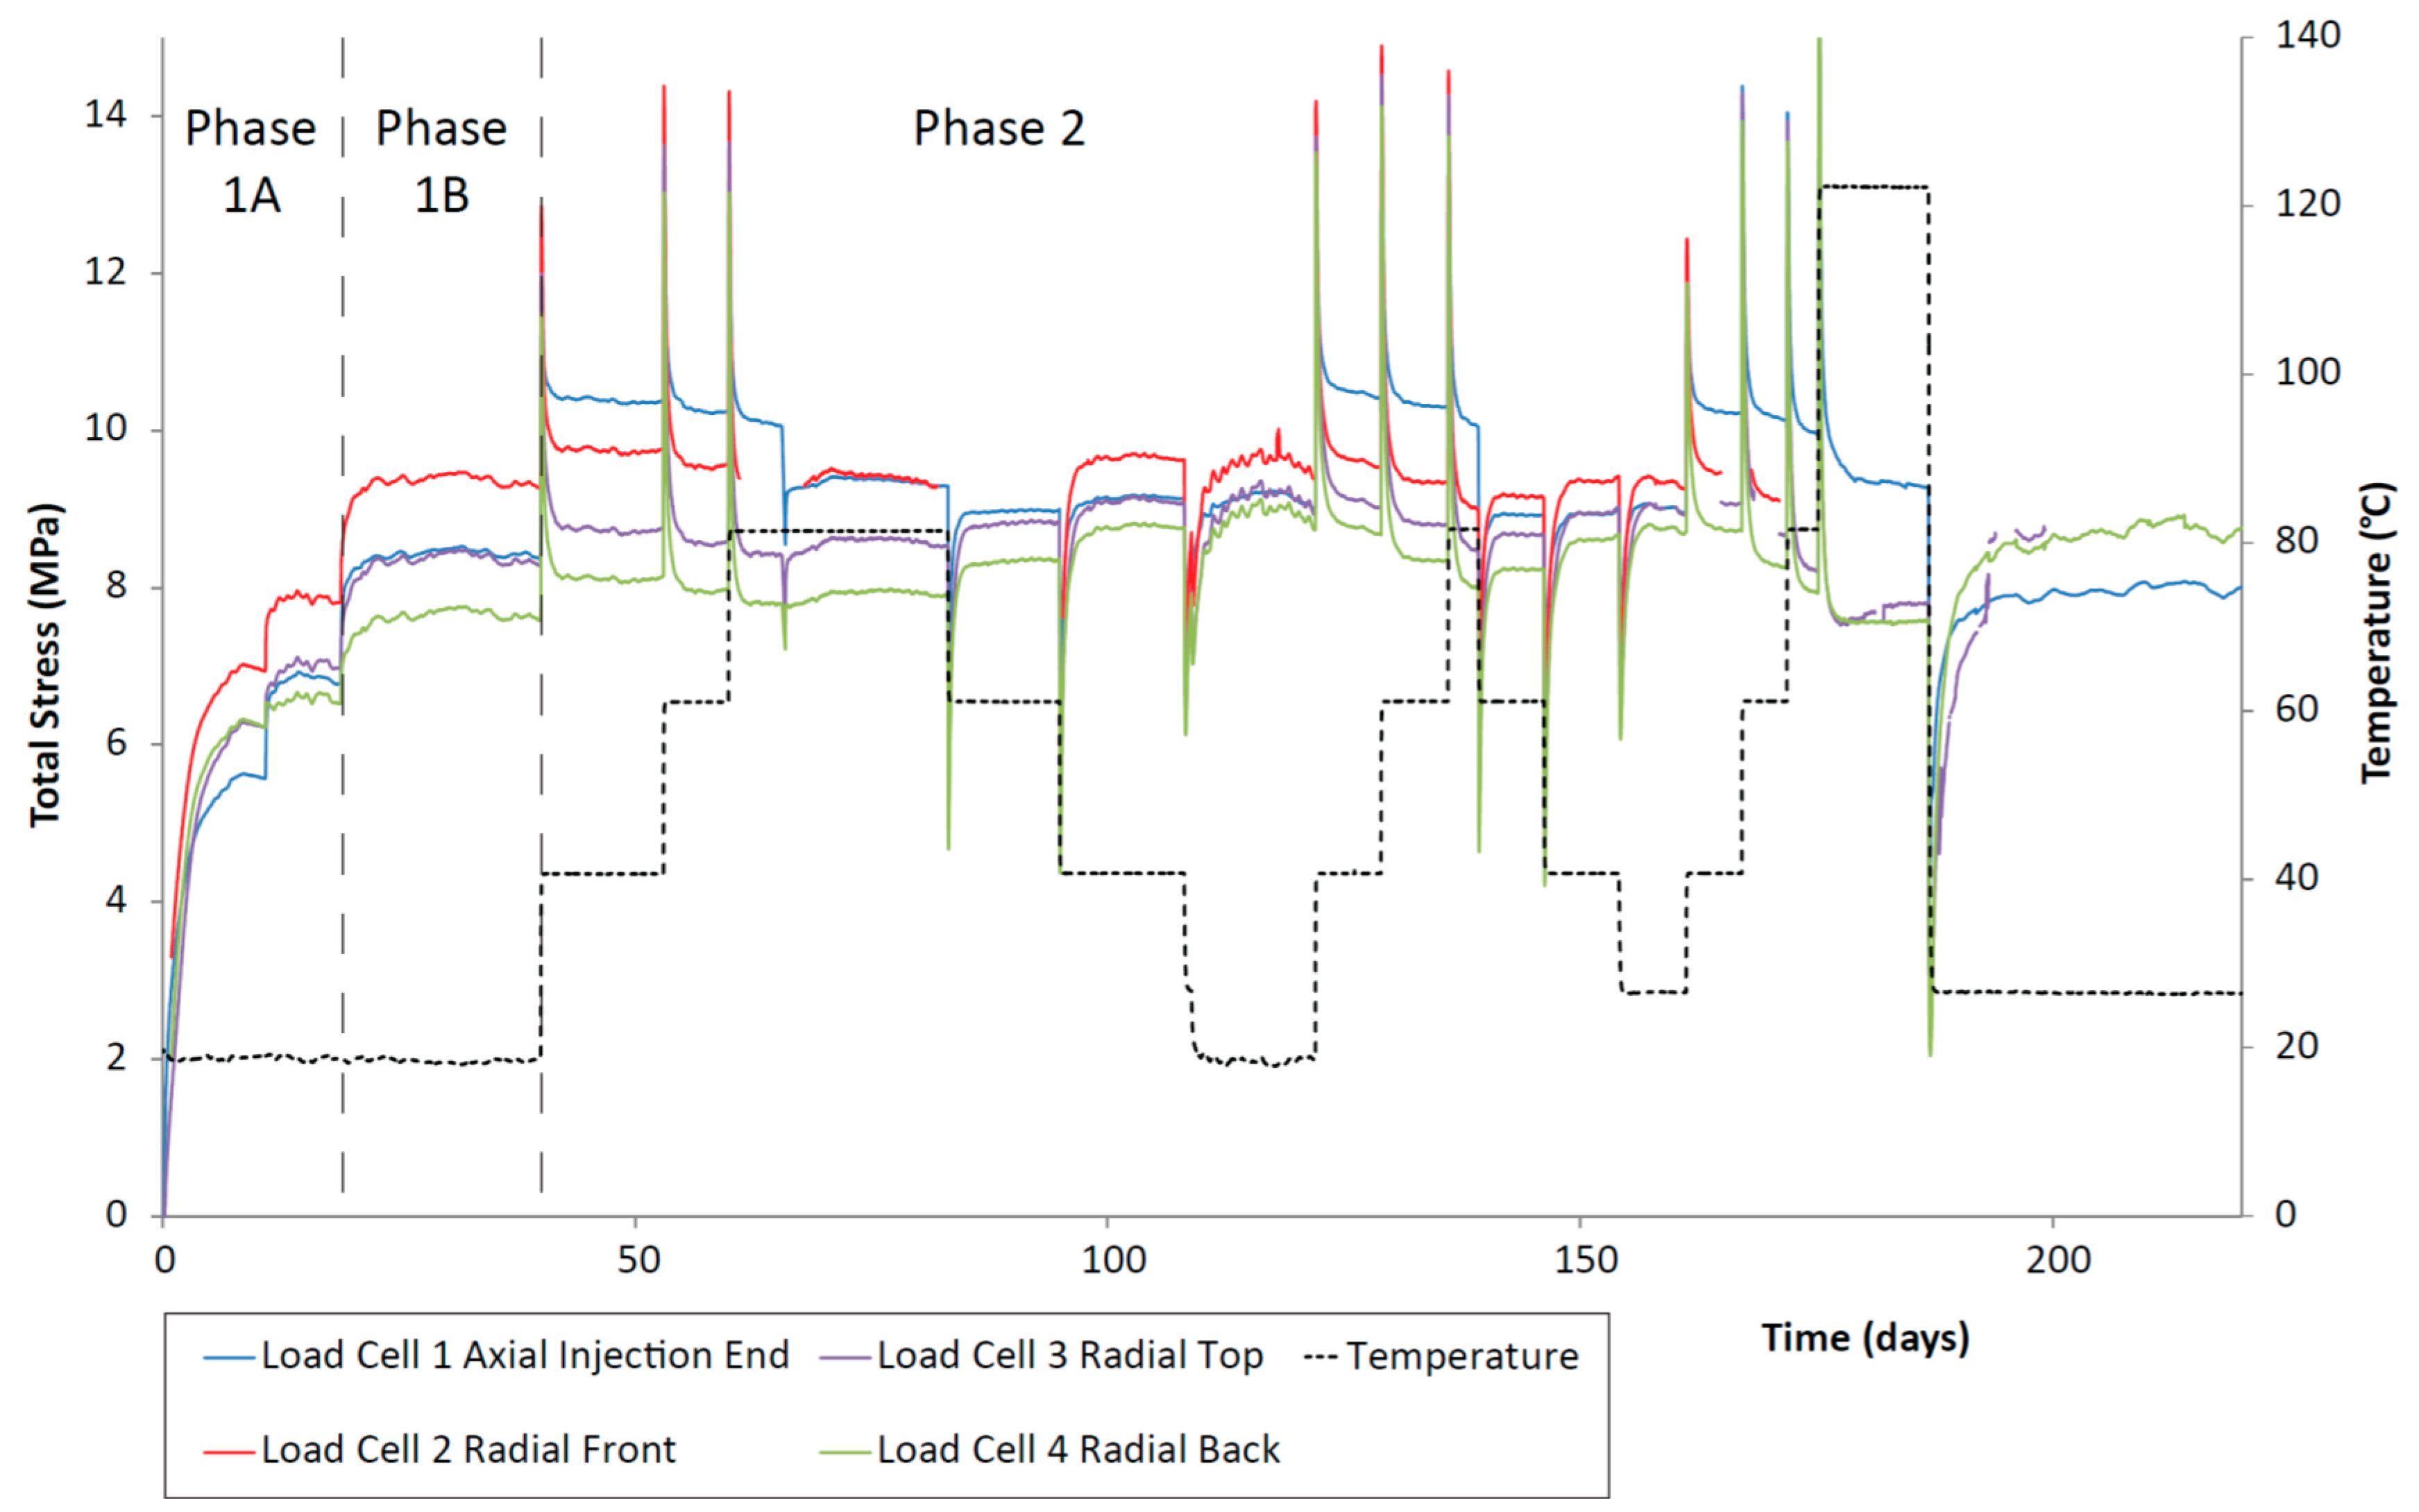
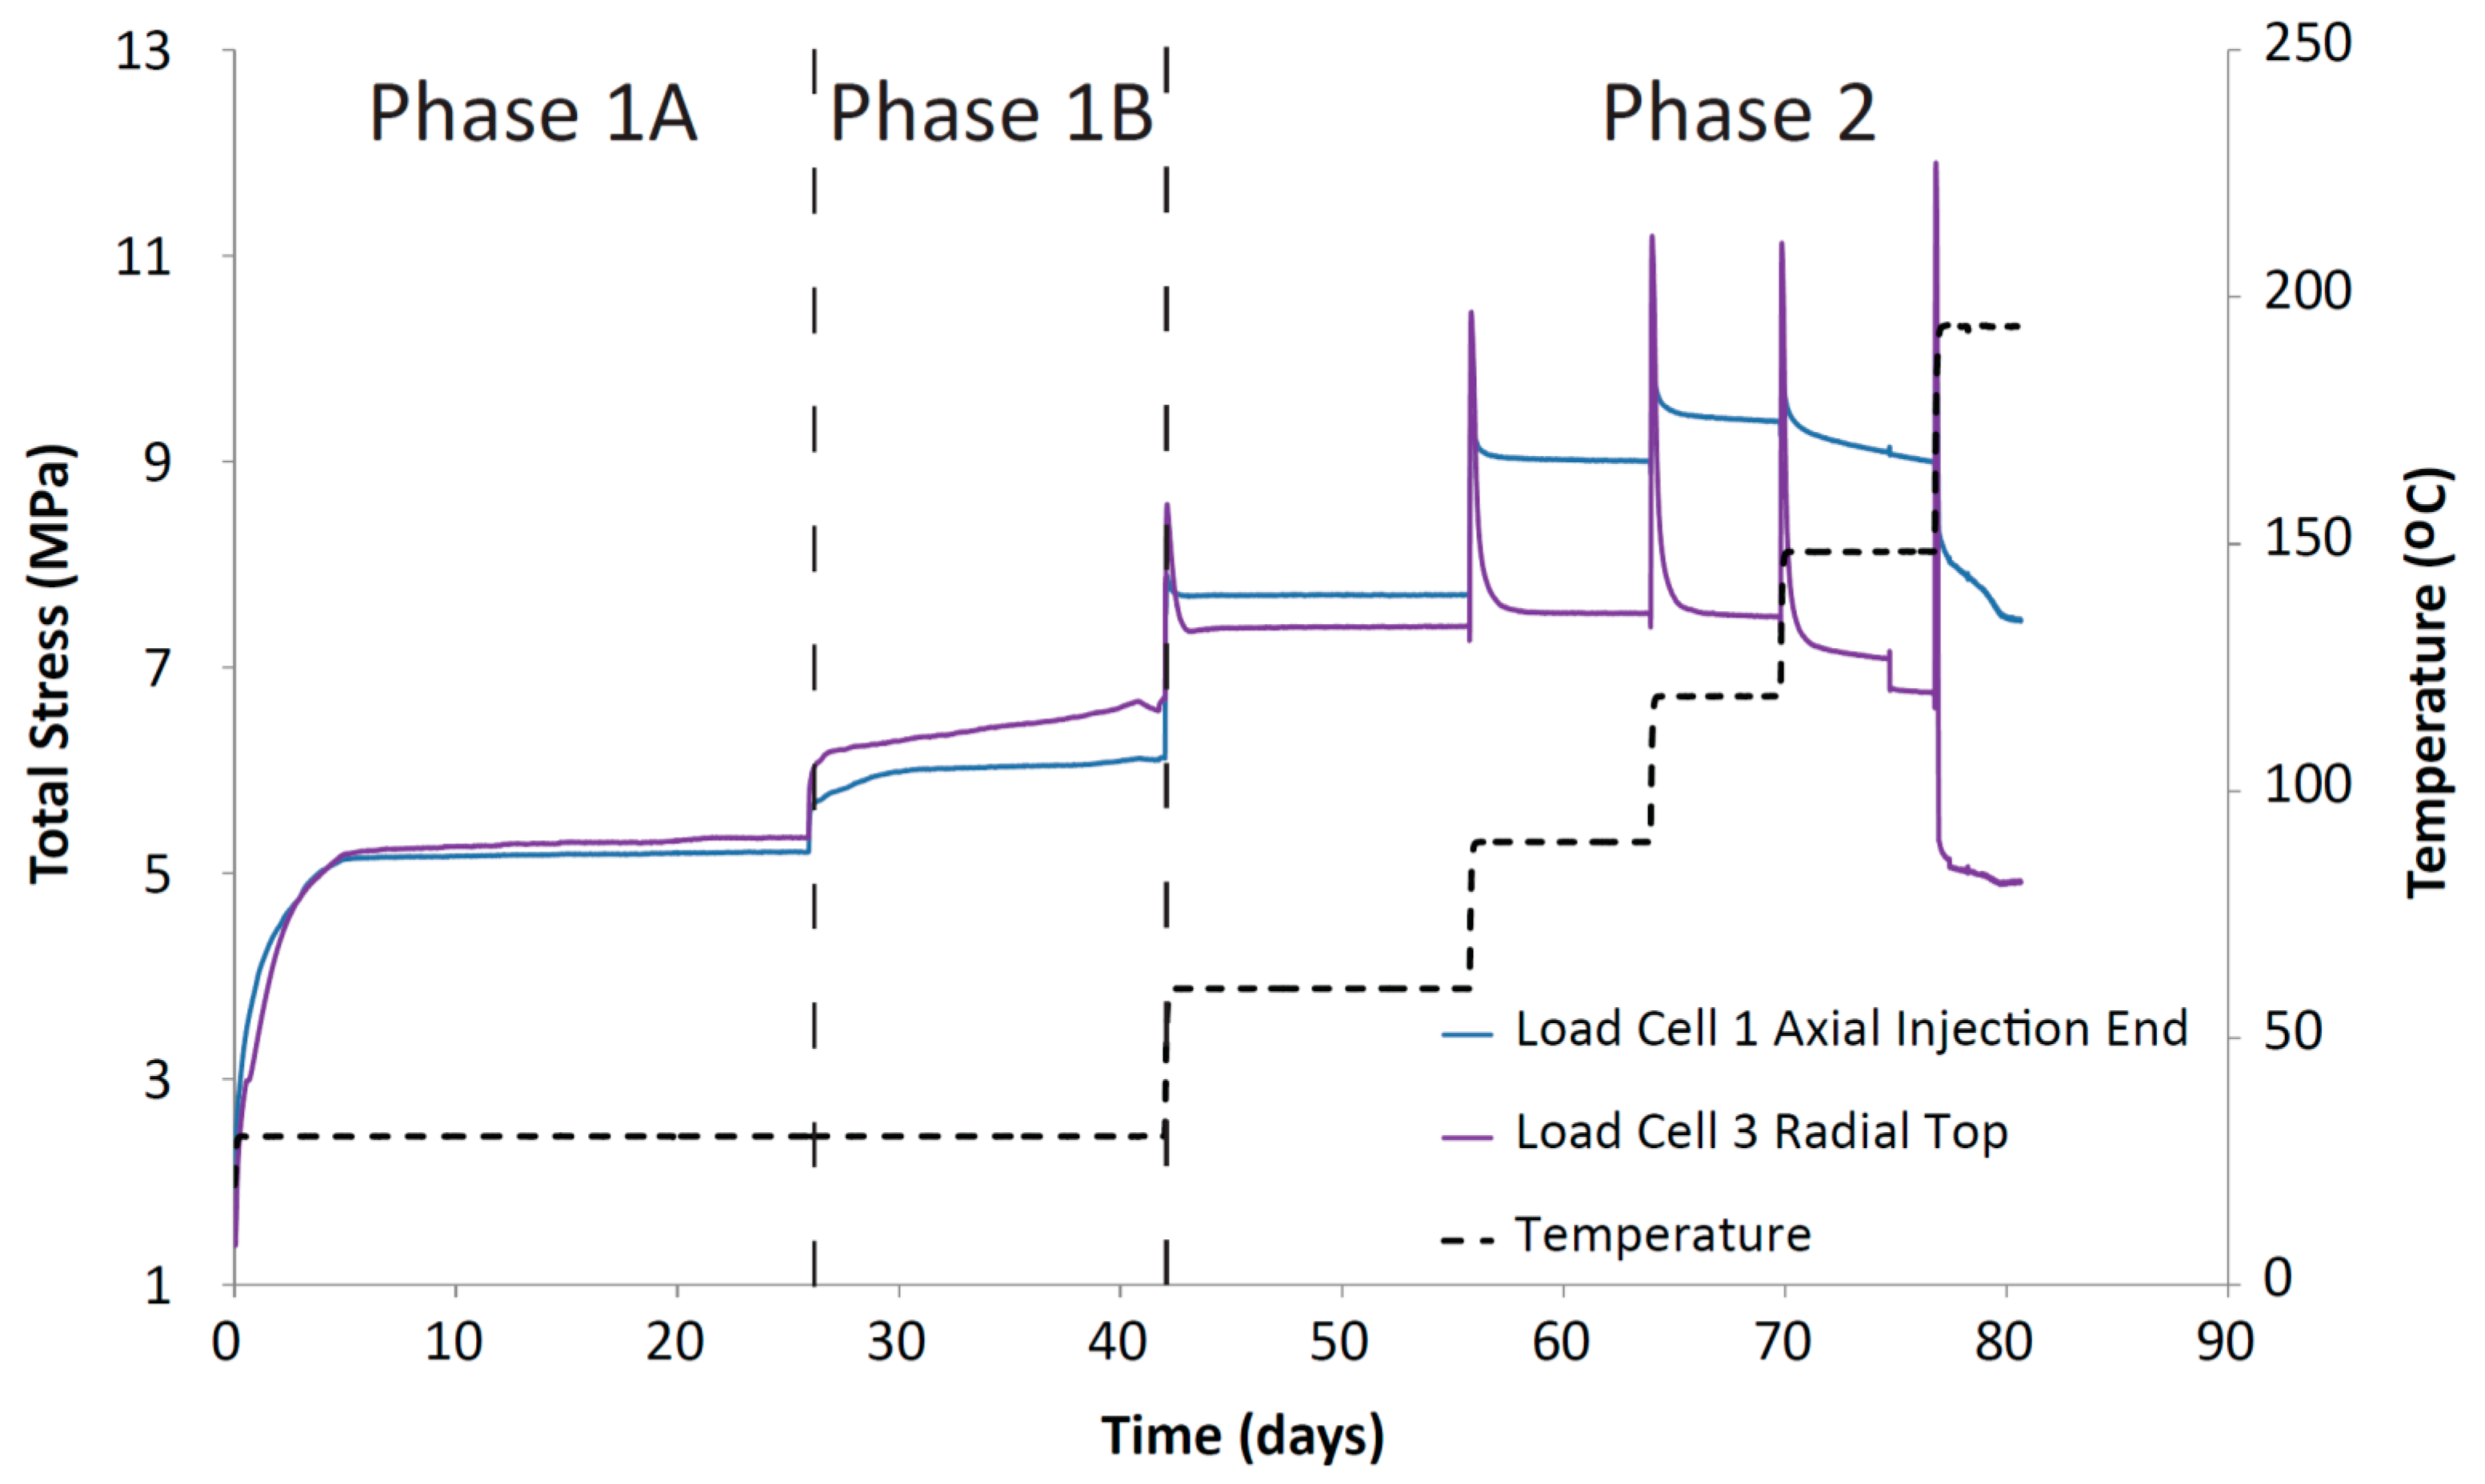
The stress changes shown in the load cell data from the CVRF experiments (Figure 5 and Figure 7) suggest that the bentonite experiences a thermally induced consolidation, reducing the ease with which fluid can migrate through the sample. During Phase 2 of both CVRF tests after each increment in temperature, the load cells recorded a sharp increase in total stress that gradually relaxed to a well-defined asymptote. Up to around 120 °C, there was a general positive correlation between the maximum value of the spike in total stress and the temperature step, thereafter the relationship between these parameters becomes unclear, possibly in part due to the thermal compliance of the apparatus (Figure 5, Figure 6 and Figure 7). In addition, the load cell data showed a thermal dependency for total stress, whereby the axial total stress value, once it reached an asymptote, increased after each temperature increase up to 150 °C (Figure 7). The asymptotic value of radial stress showed very little change after each temperature increment until the 150 °C increment where both load cells showed a decrease in value. The two isotropic experiments showed different behaviours. For ISO-1, as the temperature increased the permeability decreased, indicating the occurrence of thermal consolidation as with the CVRF-2 test. For ISO-2, below 60 °C, increasing temperature resulted in greater permeability; above 60 °C and below 170 °C there was a decrease in permeability before the apparatus failed. A caveat should be added that it is unlikely that the tests were conducted at true hydraulic equilibrium. Although the stress data reach an asymptote after a few weeks (Figure 7), the low permeability nature of this material along with the high swelling capacity means that it could take months, or even years for these samples to reach hydraulic equilibrium [49] which should be acknowledged when interpreting thermo-hydro-mechanical-chemical (THMC) data.
The asymptotic values after each temperature increment recorded by each load cell were not the same indicating that the clay was not exerting a homogeneous swelling pressure on the vessel in all directions. In both tests, during the hydration phase the axial load cells recorded a lower value than the radial cells (except radial 4 in CVRF-1) but during Phase 2 where the temperature increased, the axial load cells recorded larger values than the radial load cells. The primary contribution to the spike in stress is caused by thermal expansion of the porewater, the thermal expansion coefficient of which is much larger than the thermal expansion of the apparatus, indicating that the interface between the clay and the apparatus should remain competent. However, the slight increase in apparatus volume may help to explain why the negative trend in permeability is less obvious in the data in the CVRF tests.
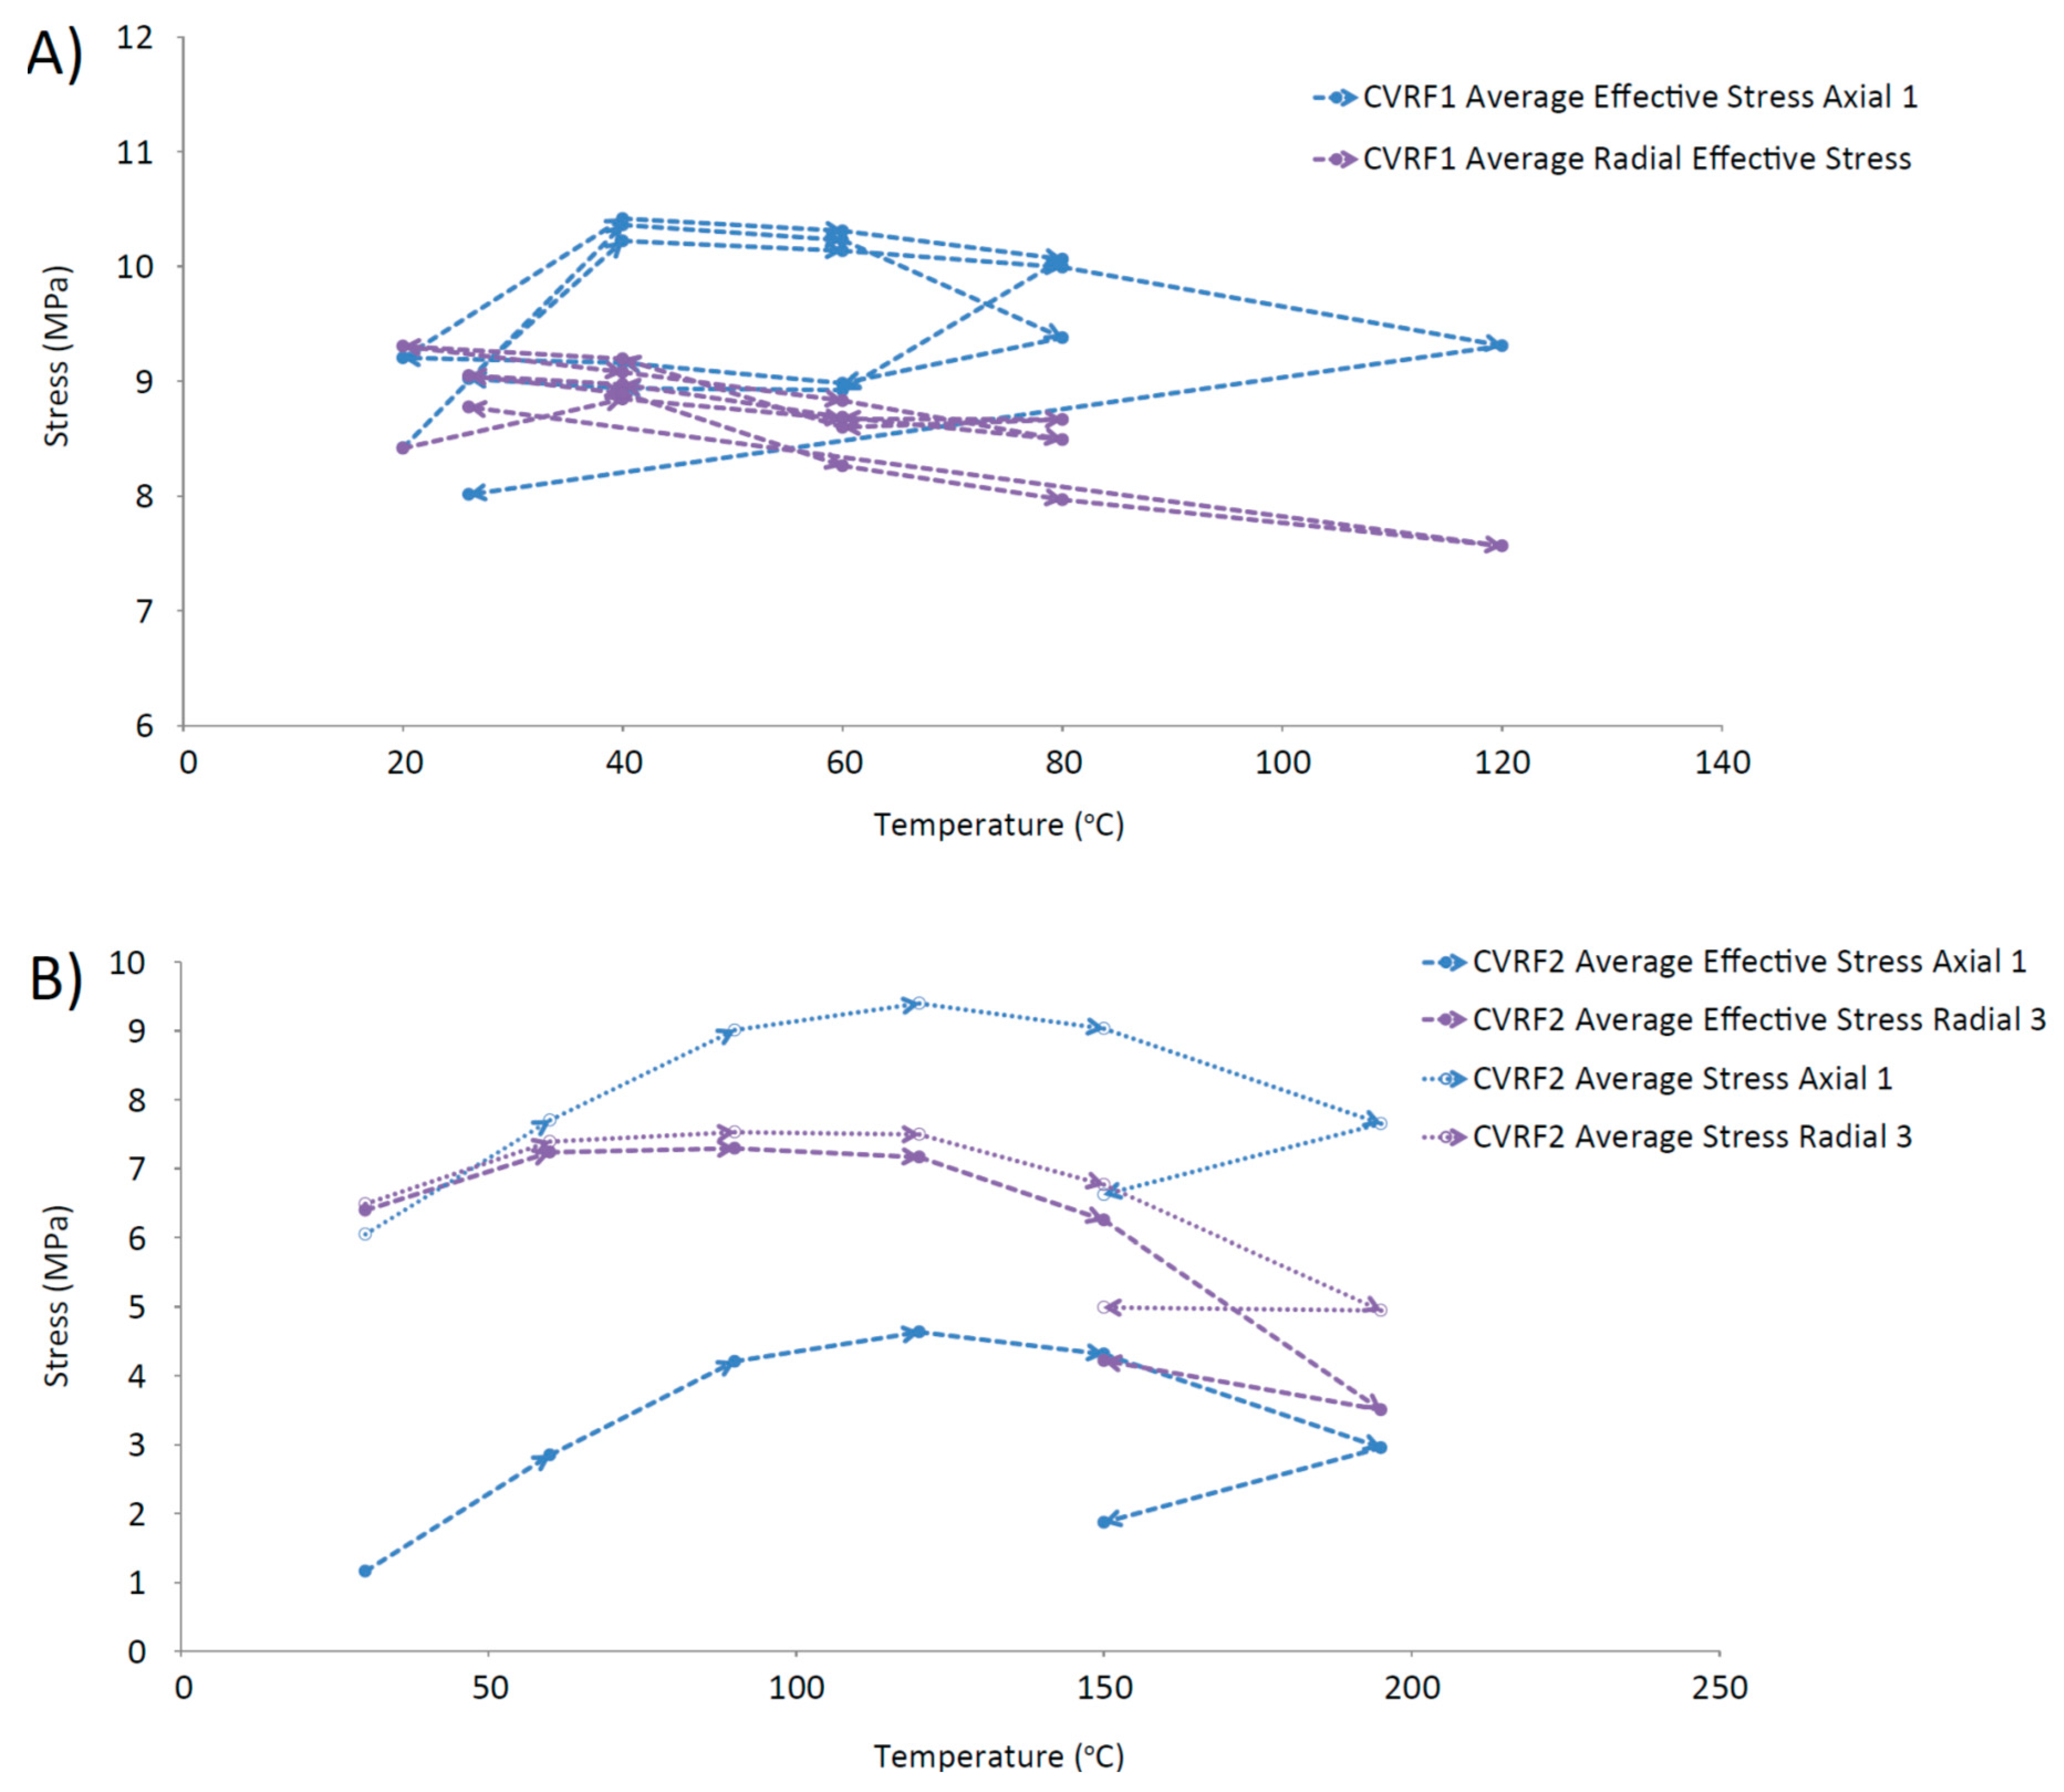
Further evidence for the thermal contraction of the clay is provided by Figure 12, which shows a trend for decreasing average effective stress with increasing temperature, measured by the load cells in the CVRF tests. These data (Figure 12) complement the permeability data (Figure 11) and suggest that a general contraction of the bentonite may be occurring. Other studies have investigated the effect of consolidation on saturated soils, finding that low over-consolidation causes contraction whilst high over-consolidation causes expansion up to a specific temperature, followed by contraction for temperatures above this point (fractionated illitic material and glacial lake clay, normally consolidated [50]; low porosity clay [51], MC clay (similar to Kaolin) and bentonite [52]; Boom Clay, Pasquasia Clay and Spanish Clay [53]; Boom Clay [54]; Kaolin [55]). The thermal history of the bentonite in a repository could therefore have an important effect on its operational performance. This is demonstrated by the lowering of the average effective radial stress value for the same temperature over repeated thermal cycles (Figure 12A), which could indicate that thermal hardening of the CVRF-1 sample may have occurred. Thermal loading can lead to both elastic and plastic changes in the clay; the irreversible alteration is seen as hysteresis in Figure 12 and is equivalent to the clay’s thermal memory. Thermal hardening is a phenomenon that has been observed as a result of thermal cycling in unsaturated bentonite [56], illite [33] and saturated Boom clay [54], and increases the yield stress of the material [56,57]. The 150 °C measurement of the CVRF-2 sample (Figure 12B) suggests that the same phenomenon may have been observed if the thermal cycle of the CVRF-2 sample had been continued. However, the lack of any obvious hysteresis in the axial effective stress measured in the CVRF-1 sample (Figure 12A) or in the permeability measurements (Figure 11) suggests that the majority of the deformation experienced by the clay was reversible. A study on the effect of very low temperatures on the performance of bentonite found that above 0 °C the clay swelling pressure decreased as the temperature increased, with the effect more pronounced for higher clay densities [58]; this was attributed to two different components contributing to the swelling: entropy due to mixing and hydration of the interlayer space. However, the temperature range for these results was 0 to 20 °C and it is unclear whether this trend would continue at higher temperatures. Additional data is required to explain this discrepancy; however, the salient result is that the permeability change is relatively small over the range of temperatures of interest.
In addition to the thermal contraction of the clay, the steel pressure vessel may thermally expand by as much as 0.9% of its volume (see Appendix B), causing a corresponding decrease in the density of the bentonite as its volume expands by an equal amount. In the isotropic tests, where boundary stress is actively applied to the sample, expansion of the water with increasing temperature leads to drainage of water from the sample. This in turn leads to consolidation of the clay as the confining fluid presses on the sample, explaining the more marked decrease in permeability with increasing temperature shown by the isotropic tests. It is not possible to decouple the contribution of thermal contraction of the clay, the density decrease of the clay and thermal expansion of the steel and water without using an alternative material to construct the apparatus. However, by conducting experiments using an isotropic confining pressure apparatus where clay contraction does not impact interface sealing, we provide additional evidence for the thermal response of the clay at the higher temperatures. Further experimentation is required and development of an apparatus constructed from INVAR steel, which has a lower thermal expansion coefficient than 316 stainless steel, would significantly reduce experimental complications due to thermal compliance of the apparatus.
These experiments have shown that the permeability of compact MX80 bentonite is sensitive to both the thermal loading and the nature of the boundary condition imposed. Zihms and Harrington [26] showed that MX80 bentonite has a thermal memory that affects the response of the clay to imposed stress; this has also been demonstrated by the results from the CVRF-2 test. The data from CVRF-2, ISO-1 and ISO-2 all showed a general trend for decreasing permeability with increasing temperature; this effect was more marked in the isotropic tests where the volume of the sample was free to change. Thermal expansion of the water within the bentonite will drive fluid from the sample at higher temperatures; in the isotropic tests, the sample was then forced to contract by the confining pressure, leading to the lower permeability values recorded than in the CVRF tests. However, the hydraulic properties were not greatly affected by temperature changes below 150 °C, with changes primarily attributed to the thermal dependence of viscosity.

5. Conclusions

These experiments show that there is a complex response of bentonite to changes in temperature, with the coeval operation of multiple processes. However, these experiments show that whilst there is sensitivity of the permeability to temperature, the permeability change once corrected for viscosity is not large. Whilst changes in permeability are relatively small, the fluid fluxes increase significantly on heating. However, for temperatures up to 150 °C there is minimal impact on the hydraulic properties of the bentonite. Above 150 °C, there is a greater change in permeability, but these higher temperature results should be interpreted with caution owing to the difficulty of experimentation in the apparatus at this temperature. The thermal expansion of the steel of the pressure vessel in constant volume experiments provides an additional complexity to the interpretation of the data. The swelling and consolidation capacity of the clay material, along with the difficulty of experimentation, including achieving the required pressures, temperatures and timescales to induce a steady hydraulic flow through the sample, yields non-trivial results to these experiments. We find that the void space within the sample is sensitive to both the thermal loading and the nature of the boundary condition imposed. This in turn affects the permeability, the porewater pressure and the total stress of the sample; although the coupling of these responses is not fully understood and additional high temperature experiments, using bespoke apparatus with minimal thermal compliance, are therefore required.

Acknowledgments

This study has been funded by the Engineering and Physical Sciences Research Council (EPSRC) as part of the Systems Approach for Engineered (SAFE) Barriers project. Funds to cover the costs of green route open access publishing were provided. The authors thank Robert Cuss and Caroline Graham of the British Geological Survey for their insightful discussion. Simon Holyoake is thanked for his assistance with instrumentation and data acquisition. Humphrey Wallis and Wayne Leman are thanked for the design and manufacture of the experimental apparatus and Neil Stacey is thanked for the careful preparation of the samples. Three anonymous reviewers provided comments that improved the clarity of presentation of this research. This paper is published with the permission of the Director of the British Geological Survey (NERC).

Author Contributions

Jon Harrington conceived and designed the experiments; Katherine Daniels, Jon Harrington, Andrew Wiseall and Stephanie Zihms performed the experiments; Katherine Daniels, Jon Harrington and Stephanie Zihms analyzed the data; Andrew Wiseall and Stephanie Zihms produced the test samples; Katherine Daniels wrote the paper.

Conflicts of Interest

The authors declare no conflict of interest.

Appendix A

Table A1. Calibration coefficients for the relationship between the temperature, the load cell voltage and the calibrated stress.
Test NameLoad Cell Number and Locationx2y2x2yxy2x2y2xyxyConstant
CVRF-1Load Cell 1 Axial−0.030.123.390.011044.96−19.81−1.2914,945366
Load Cell 2 Radial0.010.01−1.600.01112.45−8.314.7017,315−9435
Load Cell 3 Radial−0.010.031.340..08−122.89−11.46−5.5917,659−5468
Load Cell 4 Radial0.010.020.840.09−874.66−13.44−8.5118,858525
Load Cell 5 Axial−0.761.1361.100.04−12,195.2−120.5612.8963,64415,373
CVRF-2Load Cell 1 Axial−0.20−0.1054.120.104143.2537.39−22.24−14,7772253
Load Cell 2 Radial−0.38−0.58116.31−0.082338.34159.8823.98−18,41849
Load Cell 3 Radial0.380.49−71.090.116400.05−93.6919.35−11,1131437
Load Cell 4 Radial11.9111.41−2412.842.56159,874−2309.49−516.24133,10132,834
Load Cell 5 Axial0.030.01−1.930.03430.393.39−7.38−18,043832

Appendix B

Thermal Expansion of the Apparatus at Temperature

The pressure vessels used in the CVRF and ISO tests were custom built using 316 stainless steel and fitted with steel connectors and steel tubing. Steel expands when subjected to an increase in temperature; the volume change in the centre of a steel pressure vessel over the temperature range of testing can therefore be estimated. The linear thermal expansion coefficient (α) of stainless steel is 16 × 10−6 K−1 [59] at 20 °C linearly increasing to 17 × 10−6 K−1 at 200 °C. Taking the thermal expansion coefficient to be a constant 16.5 × 10⁻⁶ K−1 over the experimental temperature range (T) of 20–200 °C and assuming that the steel vessel is an isotropic cylinder, the internal volume change is estimated.
The internal circumferential increase (ΔC) of the vessel is calculated from
C = π   d     α     Δ T ,
where d is the original diameter, α is the thermal expansion coefficient and ΔT is the temperature change in °K. The original diameter is 0.06 m. The vessel length increase (ΔL) is calculated from
L = L     α     Δ T ,
where L is the original length. The original volume is given by the product of the original length and the cross-sectional area of the internal void in the pressure vessel. The original internal length of the vessel is 0.12 m, giving a value of 3.393 × 10⁻⁴ m3. Using the circumferential change and the length change, an estimate on the volume change (ΔV) can be made
V = ( ( C + π d ) 2 π ) 2 π   ( L + L ) ,
giving a value of 2.938 × 10⁻⁶ m3 and a percentage increase of 0.9%. Although this is a simplification and a closer estimate could be made by integrating the equation for the thermal expansion over the temperature range and by taking account of the expansion of the end closures at each end of the vessel. However, this simple calculation illustrates the order of magnitude of volume change possible and highlights the need to move thermal testing into apparatus constructed of steel with a lower thermal expansion coefficient (INVAR steel).

References

  1. Chapman, N.A. Geological disposal of radioactive wastes. J. Iber. Geol. 2006, 32, 7–14. [Google Scholar]
  2. Chapman, N.; Hooper, A. The disposal of radioactive wastes underground. Proc. Geol. Assoc. 2012, 123, 46–63. [Google Scholar] [CrossRef]
  3. Hedin, A. Long-Term Safety for KBS-3 Repositories at Forsmark and Laxemar—A First Evaluation. Main Report of the SR-Can Project; Technical Report TR-06-09; Svensk Kärnbränslehantering AB (SKB): Stockholm, Sweden, 2006. [Google Scholar]
  4. Sellin, P.; Leupin, O.X. The use of clay as an engineered barrier in radioactive waste management—A review. Clays Clay Miner. 2013, 61, 477–498. [Google Scholar] [CrossRef]
  5. Armand, G.; Noiret, A.; Zghondi, J.; Seyedi, D.M. Short- and long-term behaviours of drifts in the Callovo-Oxfordian claystone at the Meuse/Haute-Marne underground research laboratory. J. Rock Mech. Geotech. Eng. 2013, 5, 221–230. [Google Scholar] [CrossRef]
  6. Bossart, P.; Meier, P.M.; Moeri, A.; Trick, T.; Mayor, J.-C. Geological and hydraulic characterisation of the excavation disturbed zone in the opalinus clay of the Mont Terri rock laboratory. Eng. Geol. 2002, 66, 19–38. [Google Scholar] [CrossRef]
  7. Marschall, P.; Horseman, S.T.; Gimmi, T. Characterisation of gas transport properties of the Opalinus clay, a potential host rock formation for radioactive waste disposal. Oil Gas Sci. Technol. Rev. IFP 2005, 60, 121–139. [Google Scholar] [CrossRef] [Green Version]
  8. Horseman, S.T.; Winter, M.G.; Entwhistle, D.C. Geotechnical Characterization of Boom Clay in Relation to the Disposal of Radioactive Waste; Commission for the European Communities Report EUR-10987; European Communities: Luxembourg, 1987; p. 95. [Google Scholar]
  9. Barnichon, J.D.; Volckaert, G. Observations and predictions of hydromechanical coupling effects in the boom clay, Mol underground research laboratory, Belgium. Hydrogeol. J. 2003, 11, 193–202. [Google Scholar] [CrossRef]
  10. Bernier, F.; Li, X.L.; Bastiaens, W. Twenty-five years’ geotechnical observation and testing in the Tertiary Boom Clay formation. Geotechnique 2007, 57, 229–237. [Google Scholar] [CrossRef]
  11. Delage, P.; Cui, Y.-J.; Tang, A.M. Clays in radioactive waste disposal. J. Rock Mech. Geotech. Eng. 2010, 2, 111–123. [Google Scholar] [CrossRef]
  12. Zheng, L.; Rutqvist, J.; Birkholzer, J.T.; Liu, H.-H. On the impact of temperatures up to 200 °C in clay repositories with bentonite engineer barrier systems: A study with coupled thermal, hydrological, chemical, and mechanical modelling. Eng. Geol. 2015, 197, 278–295. [Google Scholar] [CrossRef]
  13. Nuclear Decommissioning Authority (NDA). Geological Disposal: An Overview of the Generic Disposal System Safety Case; NDA Report No. NDA/RWMD/010; NDA: Cumbria, UK, 2010.
  14. Horseman, S.T.; McEwen, T.J. Thermal constraints on disposal of heat-emitting waste in argillaceous rocks. Eng. Geol. 1996, 41, 5–16. [Google Scholar] [CrossRef]
  15. Gens, A.; Valleján, B.; Zandarín, M.T.; Sánchez, M. Homogenization in clay barriers and seals: Two case studies. J. Rock Mech. Geotech. Eng. 2013, 5, 191–199. [Google Scholar] [CrossRef]
  16. Wersin, P.; Johnson, L.H.; McKinley, I.G. Performance of the bentonite barrier at temperatures beyond 100 °C: A critical review. Phys. Chem. Earth Parts A/B/C 2007, 32, 780–788. [Google Scholar] [CrossRef]
  17. Pusch, R. The Buffer and Backfill Handbook, Part 1: Definitions, Basic Relationships, and Laboratory Methods; Technical Report TR-02-20; Svensk Kärnbränslehantering AB (SKB): Stockholm, Sweden, 2002. [Google Scholar]
  18. Deniau, I.; Devol-Brown, I.; Derenne, S.; Behar, F.; Largeau, C. Comparison of the bulk geochemical features and thermal reactivity of kerogens from Mol (Boom Clay), Bure (Callovo-Oxfordian argillite) and Tournemire (Toarcian shales) underground research laboratories. Sci. Total Environ. 2008, 389, 475–485. [Google Scholar] [CrossRef] [PubMed]
  19. Nirex. Nirex Report N/124 Specification for Waste Packages Containing Vitrified High Level Waste and Spent Nuclear Fuel; Nirex: Harwell, UK, 2005. [Google Scholar]
  20. Ewing, R.C.; Weber, W.J.; Clinard, F.W., Jr. Radiation effects in nuclear waste forms for high-level radioactive waste. Prog. Nucl. Energy 1995, 29, 63–121. [Google Scholar] [CrossRef]
  21. Goblet, P.; de Marsily, G. Evaluation of the Thermal Effect in a KBS-3 Type Repository: A Literary Survey; SKI Report 00:18; Swedish Nuclear Power Inspectorate (SKI): Stockholm, Sweden, 2000. [Google Scholar]
  22. Steefel, C.I.; Lichtner, P.C. Diffusion and reaction in rock matrix bordering a hyperalkaline fluid-filled fracture. Geochim. Cosmochim. Acta 1994, 58, 3595–3612. [Google Scholar] [CrossRef]
  23. Savage, D.; Noy, D.; Mihara, M. Modelling the interaction of bentonite with hyperalkaline fluids. Appl. Geochem. 2002, 17, 207–223. [Google Scholar] [CrossRef]
  24. Pusch, R. Permeability of Highly Compacted Bentonite; Technical Report TR-80-16; Svensk Kärnbränslehantering AB (SKB): Stockholm, Sweden, 1980. [Google Scholar]
  25. Cho, W.J.; Lee, J.O.; Chun, K.S. The temperature effects on hydraulic conductivity of compacted bentonite. Appl. Clay Sci. 1999, 14, 47–58. [Google Scholar] [CrossRef]
  26. Zihms, S.G.; Harrington, J.F. Thermal cycling: impact on bentonite permeability. Mineral. Mag. 2015, 79, 1543–1550. [Google Scholar] [CrossRef] [Green Version]
  27. International Atomic Energy Agency (IAEA). Storage of Radioactive Waste: Safety Guide; IAEA Safety Standards Series No. WS-G-6.1; IAEA: Vienna, Austria, 2006. [Google Scholar]
  28. Nuclear Decommissioning Authority (NDA). The UK Radioactive Waste Inventory; NDA Report No. NDA/ST/STY(11)0004; NDA: Cumbria, UK, 2010.
  29. Cho, W.J.; Lee, J.O.; Chun, K.S. Influence of temperature elevation on the sealing performance of a potential buffer material for a high-level radioactive waste repository. Ann. Nucl. Energy 2000, 27, 1271–1284. [Google Scholar] [CrossRef]
  30. Jacinto, A.; Gomez-Espina, R.; Villar, M.V.; Ledesma, A. Effect of temperature on the retention capacity of compacted bentonite: An experimental and numerical investigation. In Proceedings of the International Meeting on Clays in Natural & Engineered Barriers for Radioactive Waste Confinement, Lille, France, 17–20 September 2007.
  31. Idiart, A.; Pekala, M. Models for Diffusion in Compacted Bentonite; Technical Report TR-15-06; Svensk Kärnbränslehantering AB (SKB): Stockholm, Sweden, 2016. [Google Scholar]
  32. Svemar, C.; Johannesson, L.-E.; Grahm, P.; Svensson, D. Prototype Repository: Opening and Retrieval of Outer Section of Prototype Repository at Äspö Hard Rock Laboratory; Technical Report TR-13-22; Svensk Kärnbränslehantering AB (SKB): Stockholm, Sweden, 2016. [Google Scholar]
  33. Johannesson, L.E.; Börgesson, L.; Sandén, T. Compaction of Bentonite Blocks: Development of Technique for Industrial Production of Blocks Which Are Manageable by Man; Technical Report 95-19; Swedish Nuclear Fuel and Waste Management Co.: Stockholm, Sweden, 1995. [Google Scholar]
  34. American Colloid Company. Industrial Specialties Technical Data, VOLCLAY SPV 200; American Colloid Company: Hoffman Estates, IL, USA, 2001. [Google Scholar]
  35. Harrington, J.F.; Horseman, S.T. Gas transport properties of clays and mudrocks. Geol. Soc. Lond. Spec. Publ. 1999, 158, 107–124. [Google Scholar] [CrossRef]
  36. Sonntag, D.; Heinze, D. Saturation Vapour Pressure and Saturation Density Tables for Water and Ice; Deutscher Verlag fur Grundstoffindustrie: Leipzig, Germany, 1982. [Google Scholar]
  37. Guildner, L.A.; Johnson, D.P.; Jones, F.E. Vapor Pressure of Water at Its Triple Point: Highly Accurate Value. Science 1976, 191. [Google Scholar] [CrossRef] [PubMed]
  38. Scheffler, K. Water Vapor Tables: Thermodynamic Characteristics of Water and Water Vapor to 800 °C and 800 Bar; Springer: Berlin, Gemrany, 1981. [Google Scholar]
  39. Grigull, U.; Staub, J.; Schiebener, P. Steam Tables in SI-Units, 3rd ed.; Springer: Berlin, Germany, 1990. [Google Scholar]
  40. Andersen, G.; Probst, A.; Murray, L.; Butler, S. An accurate PVT model for geothermal fluids as represented by H2O-NaCl-CO2-NaCl Mixtures. In Proceedings of the 17th Workshop on Geothermal Reservoir Engineering, Stanford, CA, USA, 29–31 January 1992.
  41. Battistelli, A.; Calore, C.; Pruess, K. The simulator TOUGH2/EWASG for modelling geothermal reservoirs with brines and non-condensible gas. Geothermics 1997, 26, 437–464. [Google Scholar] [CrossRef]
  42. United Kingdom Committee on the Properties of Steam. UK Steam Tables in SI Units; Hodder Arnold: London, UK, 1970. [Google Scholar]
  43. Phillips, S.L.; Igbene, A.; Fair, J.A.; Ozbek, H.; Tavana, M. A Technical Data Book for Geothermal Energy Utilization; Technical Report 12810; Lawrence Berkeley Laboratory: Berkeley, CA, USA, 1981.
  44. Meyer, C.A.; McClintock, R.B.; Silvestri, G.J.; Spencer, R.C., Jr. ASME Steam Tables: Thermodynamic and Transport Properties of Steam, 6th ed.; American Society of Mechanical Engineers: New York, NY, USA, 1993. [Google Scholar]
  45. Harrington, J.F.; Horseman, S.T. Gas Migration in KBS-3 Buffer Bentonite. Sensitivity of Test Parameters to Experimental Boundary Conditions; No. SKB-TR-03-02; Swedish Nuclear Fuel and Waste Management Co.: Stockholm, Sweden, 2003. [Google Scholar]
  46. Cuss, R.J.; Harrington, J.F.; Noy, D.J.; Graham, C.C.; Sellin, P. Evidence of localised gas propagation pathways in a field-scale bentonite engineered barrier system; results from three gas injection tests in the Large scale gas injection test (Lasgit). Appl. Clay Sci. 2014, 102, 81–92. [Google Scholar] [CrossRef]
  47. Cekerevac, C.; Laloui, L. Experimental study of thermal effects on the mechanical behaviour of a clay. Int. J. Numer. Anal. Methods Geomech. 2004, 28, 209–228. [Google Scholar] [CrossRef]
  48. Pusch, R. Permanent crystal lattice contraction, a primary mechanism in thermally induced alteration of Na bentonite. MRS Proc. 1986, 84. [Google Scholar] [CrossRef]
  49. Harrington, J.F.; Tamayo-Mas, E. Observational Evidence for the Differential Development of Porewater Pressure within Compact Bentonite and Its Impact on Permeability and Swelling Pressure; British Geological Survey (Commercial-in Confidence) CR/16/160; British Geological Survey: England, UK, 2016. [Google Scholar]
  50. Plum, R.L.; Esrig, M.I. Some temperature effects on soil compressibility and pore water pressure. In Effects of Temperature and Heat on Engineering Behavior of Soils; Special Report; Highway Research Board: Washington, DC, USA, 1969; Volume 103, pp. 231–242. [Google Scholar]
  51. Baldi, G.; Hueckel, T.; Pellegrini, R. Thermal volume change of the mineral-water system in low-porosity clay soils. Can. Geotech. J. 1988, 25, 807–825. [Google Scholar] [CrossRef]
  52. Towhata, I.; Kuntiwattanakul, P.; Seko, I.; Ohishi, K. Volume change of clays induced by heating as observed in consolidation tests. Soils Found. 1993, 33, 170–183. [Google Scholar] [CrossRef]
  53. Del Olmo, C.; Fioravante, V.; Gera, F.; Hueckel, T.; Mayor, J.C.; Pellegrini, R. Thermomechanical properties of deep argillaceous formations. Eng. Geol. 1996, 41, 87–101. [Google Scholar] [CrossRef]
  54. Sultan, N.; Delage, P.; Cui, Y.-J. Temperature effects on the volume change behaviour of Boom clay. Eng. Geol. 2002, 64, 135–145. [Google Scholar] [CrossRef]
  55. Cekerevac, C.; Laloui, L.; Vulliet, L. A new temperature controlled triaxial apparatus. In Proceedings of the 3rd International Symposium on Deformation Characteristics of Geomaterials, Lyon, France, 22–24 September 2003; pp. 133–137.
  56. Tang, A.-M.; Cui, Y.-J.; Barnel, N. Thermo-mechanical behaviour of a compacted swelling clay. Geotechnique 2008, 58, 45–54. [Google Scholar] [CrossRef] [Green Version]
  57. Laloui, L.; Cekerevac, C. Thermo-plasticity of clays: An isotropic yield mechanism. Comput. Geotech. 2003, 30, 649–660. [Google Scholar] [CrossRef]
  58. Birgersson, M.; Karnland, O.; Nilsson, U. Freezing of Bentonite. Experimental Studies and Theoretical Considerations; Technical Report TR-10-40; Svensk Kärnbränslehantering AB (SKB): Stockholm, Sweden, 2010. [Google Scholar]
  59. Tennent, R.M. Science Data Book; Oliver & Boyd: Edinburgh, UK, 1976. [Google Scholar]
Figure 1. (A) Experimental apparatus for the second constant volume radial flow (CVRF-2) test; (B) Cross section through the pressure vessel; (C) Bentonite sample; (D) Injection and backpressure pumps and the oven containing the experiment.
Geosciences 07 00003 g001
Figure 2. Experimental apparatus for ISO-1 and ISO-2 tests. (A) Pressure vessel with end closure and connecting tubing, housed in the test oven; (B) Sample assembly. The tubing attaches to the underside of the end closure and connects to the two ends of the sample through stainless steel platens. Sample, inside a Teflon sheath, hangs suspended from the underside of the vessel lid.
Geosciences 07 00003 g002
Figure 3. (A) Phase diagram of water (created using data from [36,37,38,39]); (B) Density of water at 1 and 10 MPa versus temperature; (C) Viscosity of water versus temperature for 1 and 10 MPa pressure. The two curves plot on top of one another; (B) is obtained by using the expression for the volume of a compressed solution given by Andersen et al. [40], the correlation of Battistelli et al. [41] and the UK Steam Tables [42] whereas the viscosity of the compressed solution (C) is obtained by using the correlation developed by Phillips et al. [43] and the ASME Tables [44].
Geosciences 07 00003 g003
Figure 4. Temperature increments throughout the four experiments. During each experiment, the temperature of the pressure vessel fluctuated by ±3 degrees of the given value.
Geosciences 07 00003 g004
Figure 5. Total stress against time for the duration of the CVRF-1 experiment measured using the load cell stress sensors. Temperature (black dotted line) and testing phases are highlighted. Load cell 5 was inoperative during testing and has been removed from the analysis.
Geosciences 07 00003 g005
Figure 6. CVRF-1 test porewater pressure, recorded by the one porewater pressure transducer in the experimental oven located at the lengthways midplane of the sample. Temperature (black dotted line) and average radial stress (pink line) are shown. Testing phases are denoted by the vertical dashed lines. Increases in radial porewater pressure correlate with the increases in temperature.
Geosciences 07 00003 g006
Figure 7. Total stress against time for the CVRF-2 experiment measured using the load cell stress sensors. Temperature (black dotted line) is shown. Load cells 2, 4 and 5 were inoperative at different points in the test and have been omitted from this graph. (Phase 1A) Hydration at 1 MPa (injection and backpressure); (Phase 1B) Injection pressure was equilibrated at 5 MPa for 15 days; (Phase 2) Temperature was incrementally increased to 200 °C.
Geosciences 07 00003 g007
Figure 8. CVRF-2 test inflow and outflow rates and net flow against time. There is a small increase in inflow with increasing temperature increments up to 119 °C after which it decreases. Outflow rate during the initial hydration (phase 1A) is negative because the clay is absorbing fluid from the pump. Positive outflow rates represent fluid migrating into the pump from the apparatus.
Geosciences 07 00003 g008
Figure 9. ISO-1 inflow (green line), outflow (blue line) and confining pump (orange line) flow-rates. Data are subsampled once every 30 min and a 20 point moving average filter (representing a 10 h window) has been applied. Bold lines (green and blue) show an additional 50 point moving average filter (every 25 h). Net flow (red line) shows a decrease with each temperature increase. The confining pressure (pink line) and vessel temperature (purple line) are shown.
Geosciences 07 00003 g009
Figure 10. ISO-2 inflow (green line), outflow (blue line) and confining pump (orange line) flow-rates and vessel temperature (purple line). Data are subsampled once every 30 min and a 20 point moving average filter (representing a 10 h window) has been applied. Bold lines (green and blue) show an additional 50 point moving average filter (every 25 h). Net flow (red line) shows a decrease after each temperature increase and an increase after each temperature decrease.
Geosciences 07 00003 g010
Figure 11. Intrinsic permeability from the four tests (CVRF-1, CVRF-2, ISO-1, ISO-2) corrected for water viscosity and density changes with temperature (Figure 3B,C). CVRF-1 and CVRF-2 data represent outflow permeabilities. The first two ISO-1 points represent outflow data whilst the second two points represent inflow data. The ISO-2 permeabilities derive from the difference between backpressure outflow and average confining flow-rate over the same timeframe.
Geosciences 07 00003 g011
Figure 12. Average effective stress vs. temperature. (A) CVRF-1 experiment; (B) CVRF-2 experiment; here average stress vs. temperature is also plotted because the porewater pressure transducer data is regarded as unreliable. A general trend for decreasing average effective stress with increasing temperature is observed.
Geosciences 07 00003 g012
Table 1. Sample parameters and geotechnical properties of the bentonite used in each of the experiments presented in this study; before and after the testing phase. Post-test measurements could not be obtained for the second isotropic (ISO-2) sample because the apparatus failed during the 200 °C test stage, contaminating the sample with confining fluid.
PropertiesConstant Volume Sample 1 [26]Constant Volume Sample 2Isotropic Sample 1Isotropic Sample 2
Sample Starting Material MX80Block 19Block 21Block 21Block 21
Sample Length (mm)Pre-Test60.3460.0649.9949.87
Post-Test60.1960.0451.16-
Sample Diameter (mm)Pre-Test59.8959.7949.9349.87
Post-Test59.9460.1650.26-
Sample Volume ChangeAbsolute (cm3)−0.142.043.62-
% Change−0.081.213.70-
Saturation (%)Pre-Test97.0≥10098.896.3
Post-Test≥100≥100≥100-
Moisture Content (%)Pre-Test27.131.527.427.4
Post-Test29.130.129.7-
Bulk Density (kg/m3)Pre-Test1985199519972003
Post-Test201619752033-
Dry Density (kg/m3)Pre-Test1561151815681559
Post-Test1561151815681559
Porosity (%)Pre-Test43.645.244.144.4
Post-Test43.645.244.144.4
Void RatioPre-Test0.7740.8250.7670.777
Post-Test0.7740.8250.7670.777
Table 2. Injection pressure and backpressure for the CVRF-1 and CVRF-2 experiments during the different testing phases.
TestPhaseInjection PressureBackpressure
Constant Volume Radial Flow CVRF-11A1 MPa1 MPa
1B3 MPa1 MPa
25 MPa1 MPa
Constant Volume Radial Flow CVRF-21A1 MPa1 MPa
1B5 MPa1 MPa
25 MPa1 MPa
Table 3. Injection, backpressure and confining pressures for the two isotropic experiments during the hydration and testing phases.
TestPhaseInjection PressureBackpressureConfining PressureAverage Effective Stress
Isotropic ISO-111 MPa1 MPa7 MPa6 MPa
Isotropic ISO-125 MPa1 MPa9 MPa6 Mpa
Isotropic ISO-215 MPa1 MPa9 MPa6 MPa
Table 4. Temperature and permeability data from CVRF-1 and CVRF-2 experiments.
Temperature (°C)CVRF-1 (κ in m2)Temperature (°C)CVRF-2 (κ in m2)
InflowOutflowAverageInflowOutflowAverage
205.37 × 10−213.04 × 10−214.20 × 10−21301.07 × 10−202.30 × 10−216.52 × 10⁻²¹
406.05 × 10−213.34 × 10−214.69 × 10−21601.08 × 10−204.42 × 10−217.62 × 10⁻²¹
606.49 × 10−213.20 × 10−214.85 × 10−21901.87 × 10−204.51 × 10−211.16 × 10⁻²⁰
805.77 × 10−214.03 × 10−214.90 × 10−211209.78 × 10−214.25 × 10−217.01 × 10⁻²¹
604.29 × 10−213.66 × 10−213.97 × 10−211507.43 × 10−213.61 × 10−215.52 × 10⁻²¹
403.39 × 10−213.63 × 10−213.51 × 10−212001.31 × 10−181.32 × 10−181.31 × 10⁻¹⁸
202.53 × 10−213.79 × 10−213.16 × 10⁻²¹
403.50 × 10−213.42 × 10−213.46 × 10⁻²¹
603.83 × 10−213.49 × 10−213.66 × 10⁻²¹
803.44 × 10−214.17 × 10−213.81 × 10⁻²¹
603.58 × 10−213.63 × 10−213.60 × 10⁻²¹
403.55 × 10−213.22 × 10−213.38 × 10⁻²¹
253.89 × 10−212.66 × 10−213.28 × 10⁻²¹
403.23 × 10−213.63 × 10−213.43 × 10⁻²¹
603.53 × 10−213.60 × 10−213.56 × 10⁻²¹
803.92 × 10−213.93 × 10−213.92 × 10⁻²¹
1204.25 × 10−213.28 × 10−213.77 × 10⁻²¹
253.21 × 10−213.23 × 10−213.22 × 10⁻²¹
Table 5. Temperature and permeability data from ISO-1 and ISO-2 experiments.
Temperature (°C)ISO-1 (κ in m2)Temperature (°C)ISO-2 (κ in m2)
InflowOutflowAverageInflowOutflowAverage
304.57 × 10−214.63 × 10−214.60 × 10−21304.43 × 10−213.62 × 10−214.03 × 10⁻²¹
553.82 × 10−214.26 × 10−214.04 × 10−21604.00 × 10−213.93 × 10−213.96 × 10⁻²¹
803.57 × 10⁻²¹-3.57 × 10−21853.92 × 10−213.73 × 10−213.99 × 10⁻²¹
1151.86 × 10−21-1.86 × 10−211153.59 × 10−212.89 × 10−214.04 × 10⁻²¹
1353.04 × 10−212.42 × 10−214.18 × 10⁻²¹
903.90 × 10−213.58 × 10−213.74 × 10⁻²¹
1402.55 × 10−211.88 × 10−213.74 × 10⁻²¹
1701.71 × 10−211.06 × 10−212.99 × 10⁻²¹
200---

