Next Issue
Volume 7, September
Previous Issue
Volume 7, March


Geosciences, Volume 7, Issue 2 (June 2017) – 26 articles

Cover Story (view full-size image): 
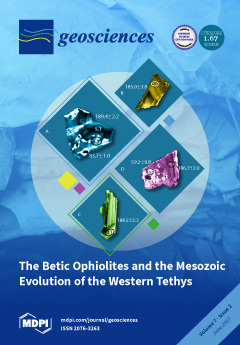
The Betic Ophiolites originated along an ultra-slow mid-ocean ridge located at the westernmost end of the Tethys Ocean. This oceanic floor was developed, according to SHRIMP dating of their igneous zircons, from the Lower Jurassic, just at the beginning of the Pangaea break-up between the Iberia–European and the Africa–Adrian plates. Subsequently, the oceanic spreading migrated northeastward, to form the Ligurian and Alpine Tethys oceans, from Middle Jurassic times according to the same dating method (Figures 6–9). In the cover, CL images of zircons, from representative outcrops of eclogitized Betic Ophiolites, show their igneous ages and some of their eoalpine metamorphic ones. View this paper
  • Issues are regarded as officially published after their release is announced to the table of contents alert mailing list.
  • You may sign up for e-mail alerts to receive table of contents of newly released issues.
  • PDF is the official format for papers published in both, html and pdf forms. To view the papers in pdf format, click on the "PDF Full-text" link, and use the free Adobe Reader to open them.
Order results
Result details
Section
Select all
Export citation of selected articles as:
9041 KiB  
Article
Stable Isotope Systematics of Coalbed Gas during Desorption and Production
by Martin Niemann and Michael J. Whiticar
Geosciences 2017, 7(2), 43; https://doi.org/10.3390/geosciences7020043 - 14 Jun 2017
Cited by 30 | Viewed by 7080
Abstract
The stable carbon isotope ratios of coalbed methane (CBM) demonstrate diagnostic changes that systematically vary with production and desorption times. These shifts can provide decisive, predictive information on the behaviour and potential performance of CBM operations. Samples from producing CBM wells show a [...] Read more.
The stable carbon isotope ratios of coalbed methane (CBM) demonstrate diagnostic changes that systematically vary with production and desorption times. These shifts can provide decisive, predictive information on the behaviour and potential performance of CBM operations. Samples from producing CBM wells show a general depletion in 13C-methane with increasing production times and corresponding shifts in δ13C-CH4 up to 35.8‰. Samples from canister desorption experiments show mostly enrichment in 13C for methane with increasing desorption time and isotope shifts of up to 43.4‰. Also, 13C-depletion was observed in some samples with isotope shifts of up to 32.1‰. Overall, the magnitudes of the observed isotope shifts vary considerably between different sample sets, but also within samples from the same source. The δ13C-CH4 values do not have the anticipated signature of methane generated from coal. This indicates that secondary processes, including desorption and diffusion, can influence the values. It is also challenging to deconvolute these various secondary processes because their molecular and isotope effects can have similar directions and/or magnitudes. In some instances, significant alteration of CBM gases has to be considered as a combination of secondary alteration effects. Full article
(This article belongs to the Special Issue Natural Gas Origin, Migration, Alteration and Seepage)
Show Figures

Figure 1

1134 KiB  
Article
The Role of Temperature in the Safety Case for High-Level Radioactive Waste Disposal: A Comparison of Design Concepts
by Joachim Heierli and Oliver Genoni
Geosciences 2017, 7(2), 42; https://doi.org/10.3390/geosciences7020042 - 13 Jun 2017
Cited by 6 | Viewed by 4524
Abstract
The disposal of heat-generating radioactive waste in deep underground facilities requires a sparing use of spatial resources on the one side and favorable temperature conditions over the project lifetime on the other side. Under heat-sensitive conditions, these goals run in opposite directions and [...] Read more.
The disposal of heat-generating radioactive waste in deep underground facilities requires a sparing use of spatial resources on the one side and favorable temperature conditions over the project lifetime on the other side. Under heat-sensitive conditions, these goals run in opposite directions and therefore a balance of some kind must be found. Often the elected strategy is to determine the size of the repository by capping the temperatures in the near-field, thus setting an upper limit to the deterioration of barrier materials. Alternatively, the spatial resources available in the siting area can be used to further reduce temperatures as long as supplementary benefits are returned from doing so. Using analytical modeling of the heat flow in the circumambient rock of a repository for high-level waste and spent fuel, this contribution examines possible obstacles in substantiating the safety case, namely the retrievability of waste during the operational lifetime of the facility, the representativeness of pilot disposal areas for monitoring, and the effect of thermal anomalies underground. The results indicate that there are, amongst the visited criteria, several benefits to the temperature-optimizing strategy over the prevailing space-optimizing concepts. The right balance between saving spatial resources and obtaining optimal temperature conditions is yet to be found. Full article
Show Figures

Figure 1

5252 KiB  
Article
Magnetotelluric-Geochemistry Investigations of Blawan Geothermal Field, East Java, Indonesia
by Sukir Maryanto, Cinantya N. Dewi, Vanisa Syahra, Arief Rachmansyah, James Foster, Ahmad Nadhir and Didik R. Santoso
Geosciences 2017, 7(2), 41; https://doi.org/10.3390/geosciences7020041 - 10 Jun 2017
Cited by 12 | Viewed by 6498
Abstract
An integrated magnetotelluric (MT) and geochemical study of the Blawan geothermal field has been performed. The character of the hot springs, the reservoir temperature, and geothermal reserve potential of Blawan geothermal field are assessed. MT measurements, with 250 m up to 1200 m [...] Read more.
An integrated magnetotelluric (MT) and geochemical study of the Blawan geothermal field has been performed. The character of the hot springs, the reservoir temperature, and geothermal reserve potential of Blawan geothermal field are assessed. MT measurements, with 250 m up to 1200 m spacings, were made at 19 sites, and 6 locations at the Blawan hot springs have been sampled for geochemical survey. The results of 2D modelling indicated that the geothermal system in the research area consisted of a cap rock zone (≤32 Ω•m), reservoir zone (>32 – ≤512 Ω•m), and heat source zone (>512 Ω•m), and also identified faults. The characteristics of the hot spring water were identified through analyzing the major and minor elements. A ternary diagram (Cl-SO4-HCO3) showed that the Blawan hot springs consist of bicarbonate water (at locations of AP-01, AP-02, AP-03) and chloride water (at locations of AP-04, AP-05, and AP-06), with a reservoir temperature of approximately 90 °C based on the Na–K–Ca geothermometer results. An estimate of the geothermal energy using the volumetric method, gave a total geothermal reserve potential of 1.823 MWe. Full article
Show Figures

Figure 1

19354 KiB  
Article
Fusion of Satellite Multispectral Images Based on Ground-Penetrating Radar (GPR) Data for the Investigation of Buried Concealed Archaeological Remains
by Athos Agapiou, Vasiliki Lysandrou, Apostolos Sarris, Nikos Papadopoulos and Diofantos G. Hadjimitsis
Geosciences 2017, 7(2), 40; https://doi.org/10.3390/geosciences7020040 - 06 Jun 2017
Cited by 27 | Viewed by 17224
Abstract
The paper investigates the superficial layers of an archaeological landscape based on the integration of various remote sensing techniques. It is well known in the literature that shallow depths may be rich in archeological remains, which generate different signal responses depending on the [...] Read more.
The paper investigates the superficial layers of an archaeological landscape based on the integration of various remote sensing techniques. It is well known in the literature that shallow depths may be rich in archeological remains, which generate different signal responses depending on the applied technique. In this study three main technologies are examined, namely ground-penetrating radar (GPR), ground spectroscopy, and multispectral satellite imagery. The study aims to propose a methodology to enhance optical remote sensing satellite images, intended for archaeological research, based on the integration of ground based and satellite datasets. For this task, a regression model between the ground spectroradiometer and GPR is established which is then projected to a high resolution sub-meter optical image. The overall methodology consists of nine steps. Beyond the acquirement of the in-situ measurements and their calibration (Steps 1–3), various regression models are examined for more than 70 different vegetation indices (Steps 4–5). The specific data analysis indicated that the red-edge position (REP) hyperspectral index was the most appropriate for developing a local fusion model between ground spectroscopy data and GPR datasets (Step 6), providing comparable results with the in situ GPR measurements (Step 7). Other vegetation indices, such as the normalized difference vegetation index (NDVI), have also been examined, providing significant correlation between the two datasets (R = 0.50). The model is then projected to a high-resolution image over the area of interest (Step 8). The proposed methodology was evaluated with a series of field data collected from the Vésztő-Mágor Tell in the eastern part of Hungary. The results were compared with in situ magnetic gradiometry measurements, indicating common interpretation results. The results were also compatible with the preliminary archaeological investigations of the area (Step 9). The overall outcomes document that fusion models between various types of remote sensing datasets frequently used to support archaeological research can further expand the current capabilities and applications for the detection of buried archaeological remains. Full article
(This article belongs to the Special Issue Remote Sensing and Geosciences for Archaeology)
Show Figures

Graphical abstract

26088 KiB  
Article
Inventory of Onshore Hydrocarbon Seeps in Romania (HYSED-RO Database)
by Artur Ionescu, Pierfrancesco Burrato, Calin Baciu, Giuseppe Etiope and Boglarka-Mercedesz Kis
Geosciences 2017, 7(2), 39; https://doi.org/10.3390/geosciences7020039 - 01 Jun 2017
Cited by 4 | Viewed by 7989
Abstract
Seeps are the expression of the migration of hydrocarbons from subsurface accumulations to the surface in sedimentary basins. They may represent an important indication of the presence of petroleum (gas and oil) reservoirs and faults, and are a natural source of greenhouse gas [...] Read more.
Seeps are the expression of the migration of hydrocarbons from subsurface accumulations to the surface in sedimentary basins. They may represent an important indication of the presence of petroleum (gas and oil) reservoirs and faults, and are a natural source of greenhouse gas (methane) and atmospheric pollutants (ethane, propane) to the atmosphere. Romania is one of the countries with the largest number of seeps in the world, due to the high petroleum potential and active tectonics. Based on a review of the available literature, and on the field surveys performed by the authors during the last 17 years, we report the first comprehensive GIS-based inventory of 470 seeps in Romania (HYSED-RO), including gas seeps (10.4% of the total), oil seeps (11.7%), mud volcanoes (50.4%), gas-rich springs (12.6%), asphalt (solid) seeps (4.3%), unclassified manifestations (4.0%), and uncertain seeps (6.6%). Seeps are typically located in correspondence with major faults and vertical and fractured stratigraphic contacts associated to petroleum reservoirs (anticlines) in low heat flow areas, and their gas-geochemistry reflects that of the subsurface reservoirs. The largest and most active seeps occur in the Carpathian Foredeep, where they release thermogenic gas, and subordinately in the Transylvanian Basin, where gas is mainly microbial. HYSED-RO may represent a key reference for baseline characterization prior to subsurface petroleum extraction, for environmental studies, and atmospheric greenhouse gas emission estimates in Romania. Full article
(This article belongs to the Special Issue Natural Gas Origin, Migration, Alteration and Seepage)
Show Figures

Figure 1

3404 KiB  
Article
Laboratory Testing of a MEMS Sensor System for In-Situ Monitoring of the Engineered Barrier in a Geological Disposal Facility
by Wenbin Yang, Rebecca J. Lunn, Alessandro Tarantino and Gráinne El Mountassir
Geosciences 2017, 7(2), 38; https://doi.org/10.3390/geosciences7020038 - 20 May 2017
Viewed by 4198
Abstract
Geological disposal facilities for radioactive waste pose significant challenges for robust monitoring of environmental conditions within the engineered barriers that surround the waste canister. Temperatures are elevated, due to the presence of heat generating waste, relative humidity varies from 20% to 100%, and [...] Read more.
Geological disposal facilities for radioactive waste pose significant challenges for robust monitoring of environmental conditions within the engineered barriers that surround the waste canister. Temperatures are elevated, due to the presence of heat generating waste, relative humidity varies from 20% to 100%, and swelling pressures within the bentonite barrier can typically be 2–10 MPa. Here, we test the robustness of a bespoke design MEMS sensor-based monitoring system, which we encapsulate in polyurethane resin. We place the sensor within an oedometer cell and show that despite a rise in swelling pressure to 2 MPa, our relative humidity (RH) measurements are unaffected. We then test the sensing system against a traditional RH sensor, using saturated bentonite with a range of RH values between 50% and 100%. Measurements differ, on average, by 2.87% RH, and are particularly far apart for values of RH greater than 98%. However, bespoke calibration of the MEMS sensing system using saturated solutions of known RH, reduces the measurement difference to an average of 1.97% RH, greatly increasing the accuracy for RH values close to 100%. Full article
Show Figures

Figure 1

21658 KiB  
Article
Comparing Manual and Semi-Automated Landslide Mapping Based on Optical Satellite Images from Different Sensors
by Daniel Hölbling, Clemens Eisank, Florian Albrecht, Filippo Vecchiotti, Barbara Friedl, Elisabeth Weinke and Arben Kociu
Geosciences 2017, 7(2), 37; https://doi.org/10.3390/geosciences7020037 - 19 May 2017
Cited by 49 | Viewed by 8198
Abstract
Object-based image analysis (OBIA) has been increasingly used to map geohazards such as landslides on optical satellite images. OBIA shows various advantages over traditional image analysis methods due to its potential for considering various properties of segmentation-derived image objects (spectral, spatial, contextual, and [...] Read more.
Object-based image analysis (OBIA) has been increasingly used to map geohazards such as landslides on optical satellite images. OBIA shows various advantages over traditional image analysis methods due to its potential for considering various properties of segmentation-derived image objects (spectral, spatial, contextual, and textural) for classification. For accurately identifying and mapping landslides, however, visual image interpretation is still the most widely used method. The major question therefore is if semi-automated methods such as OBIA can achieve results of comparable quality in contrast to visual image interpretation. In this paper we apply OBIA for detecting and delineating landslides in five selected study areas in Austria and Italy using optical Earth Observation (EO) data from different sensors (Landsat 7, SPOT-5, WorldView-2/3, and Sentinel-2) and compare the OBIA mapping results to outcomes from visual image interpretation. A detailed evaluation of the mapping results per study area and sensor is performed by a number of spatial accuracy metrics, and the advantages and disadvantages of the two approaches for landslide mapping on optical EO data are discussed. The analyses show that both methods produce similar results, whereby the achieved accuracy values vary between the study areas. Full article
(This article belongs to the Special Issue Observing Geohazards from Space)
Show Figures

Figure 1

2497 KiB  
Article
Assessment of Landslide Pre-Failure Monitoring and Forecasting Using Satellite SAR Interferometry
by Serena Moretto, Francesca Bozzano, Carlo Esposito, Paolo Mazzanti and Alfredo Rocca
Geosciences 2017, 7(2), 36; https://doi.org/10.3390/geosciences7020036 - 12 May 2017
Cited by 46 | Viewed by 6261
Abstract
In this work, the ability of advanced satellite interferometry to monitor pre-failure landslide behaviours and the potential application of this technique to Failure Forecasting Methods (FFMs) are analysed. Several limits affect the ability of the technique to monitor a landslide process, especially during [...] Read more.
In this work, the ability of advanced satellite interferometry to monitor pre-failure landslide behaviours and the potential application of this technique to Failure Forecasting Methods (FFMs) are analysed. Several limits affect the ability of the technique to monitor a landslide process, especially during the pre-failure phase (tertiary creep). In this study, two of the major limitations affecting the technique have been explored: (1) the low data sampling frequency and (2) the phase ambiguity constraints. We explored the time series of displacements for 56 monitored landslides inferred from the scientific literature and from different in situ and remote monitoring instruments (i.e., extensometers, inclinometers, distometers, Ground Base InSAR, and total station). Furthermore, four different forecasting techniques have been applied to the monitoring data of the selected landslides. To analyse the reliability of the FFMs based on the InSAR satellite data, the 56 time series have been sampled based on different satellite features, simulating the satellite revisit time and the phase ambiguity constraints. Our analysis shows that the satellite InSAR technique could be successful in monitoring the landslide’s tertiary creep phase and, in some cases, for forecasting the corresponding time of failure using FFMs. However, the low data sampling frequency of the present satellite systems do not capture the necessary detail for the application of FFMs in actual risk management problems or for early warning purposes. Full article
(This article belongs to the Special Issue Observing Geohazards from Space)
Show Figures

Figure 1

1925 KiB  
Article
Geochemistry of Petroleum Gases and Liquids from the Inhassoro, Pande and Temane Fields Onshore Mozambique
by Markus J. Loegering and Alexei V. Milkov
Geosciences 2017, 7(2), 33; https://doi.org/10.3390/geosciences7020033 - 05 May 2017
Cited by 14 | Viewed by 7771
Abstract
Although the first petroleum fields in the Mozambique basin were discovered more than 60 years ago, the composition and origin of petroleum fluids in this basin are largely unknown. We studied the geochemical composition of petroleum gases and liquids from the Inhassoro, Pande [...] Read more.
Although the first petroleum fields in the Mozambique basin were discovered more than 60 years ago, the composition and origin of petroleum fluids in this basin are largely unknown. We studied the geochemical composition of petroleum gases and liquids from the Inhassoro, Pande and Temane fields located onshore Mozambique. The gases are relatively dry (methane-dominated, average C1/(C1–C5) ratio is ~0.96), have pure thermogenic origin, originate predominantly from marine shale source organofacies and show no evidence of primary microbial gas or biodegradation. Most condensates have relatively high API gravity up to 76 degrees, are very mature and contain only traces of biomarkers, likely from migration contamination. However, biomarkers in the light oil from the Inhassoro field indicate that the oil derived from sub-oxic marine shales of the Late Cretaceous age. We suggest that the Aptian-Coniacian Domo Shale is the likely source rock for petroleum gases and liquids in the studied fields. Our geochemical data, including gas isotopes, as well as source-specific and age-specific biomarkers, exclude coals in the Late Carboniferous—Early Jurassic Karoo Supergroup as effective source rocks for the studied fields. Full article
(This article belongs to the Special Issue Natural Gas Origin, Migration, Alteration and Seepage)
Show Figures

Figure 1

3867 KiB  
Review
Evaluation of Near-Surface Gases in Marine Sediments to Assess Subsurface Petroleum Gas Generation and Entrapment
by Michael A. Abrams
Geosciences 2017, 7(2), 35; https://doi.org/10.3390/geosciences7020035 - 04 May 2017
Cited by 35 | Viewed by 5669
Abstract
Gases contained within near-surface marine sediments can be derived from multiple sources: shallow microbial activity, thermal cracking of organic matter and inorganic materials, or magmatic-mantle degassing. Each origin will display a distinctive hydrocarbon and non-hydrocarbon composition as well as compound-specific isotope signature and [...] Read more.
Gases contained within near-surface marine sediments can be derived from multiple sources: shallow microbial activity, thermal cracking of organic matter and inorganic materials, or magmatic-mantle degassing. Each origin will display a distinctive hydrocarbon and non-hydrocarbon composition as well as compound-specific isotope signature and thus the interpretation of origin should be relatively straightforward. Unfortunately, this is not always the case due to in situ microbial alteration, non-equilibrium phase partitioning, mixing, and fractionation related to the gas extraction method. Sediment gases can reside in the interstitial spaces, bound to mineral or organic surfaces and/or entrapped in carbonate inclusions. The interstitial sediment gases are contained within the sediment pore space, either dissolved in the pore waters (solute) or as free (vapour) gas. The bound gases are believed to be attached to organic and/or mineral surfaces, entrapped in structured water or entrapped in authigenic carbonate inclusions. The purpose of this paper is to provide a review of the gas types found within shallow marine sediments and examine issues related to gas sampling and extraction. In addition, the paper will discuss how to recognise mixing, alteration and fractionation issues to best interpret the seabed geochemical results and determine gas origin to assess subsurface petroleum gas generation and entrapment. Full article
(This article belongs to the Special Issue Natural Gas Origin, Migration, Alteration and Seepage)
Show Figures

Figure 1

4485 KiB  
Article
Land Cover Classification in an Ecuadorian Mountain Geosystem Using a Random Forest Classifier, Spectral Vegetation Indices, and Ancillary Geographic Data
by Johanna E. Ayala-Izurieta, Carmen O. Márquez, Víctor J. García, Celso G. Recalde-Moreno, Marcos V. Rodríguez-Llerena and Diego A. Damián-Carrión
Geosciences 2017, 7(2), 34; https://doi.org/10.3390/geosciences7020034 - 03 May 2017
Cited by 34 | Viewed by 6053
Abstract
We presented a methodology to accurately classify mountainous regions in the tropics. These landscapes are complex in terms of their geology, ecosystems, climate and land use. Obtaining accurate maps to assess land cover change is essential. The objectives of this study were to [...] Read more.
We presented a methodology to accurately classify mountainous regions in the tropics. These landscapes are complex in terms of their geology, ecosystems, climate and land use. Obtaining accurate maps to assess land cover change is essential. The objectives of this study were to (1) map vegetation using the Random Forest Classifier (RFC), spectral vegetation index (SVI), and ancillar geographic data (2) identify important variables that help differentiate vegetation cover, and (3) assess the accuracy of the vegetation cover classification in hard-to-reach Ecuadorian mountain region. We used Landsat 7 ETM+ satellite images of the entire scene, a RFC algorithm, and stratified random sampling. The altitude and the two band enhanced vegetation index (EVI2) provide more information on vegetation cover than the traditional and often use normalized difference vegetation index (NDVI) in other settings. We classified the vegetation cover of mountainous areas within the 1016 km2 area of study, at 30 m spatial resolution, using RFC that yielded a land cover map with an overall accuracy of 95%. The user´s accuracy and the half-width of the confidence interval for 95% of the basic map units, forest (FOR), páramo (PAR), crop (CRO) and pasture (PAS) were 95.85% ± 2.86%, 97.64% ± 1.24%, 91.53% ± 3.35% and 82.82% ± 7.74%, respectively. The overall disagreement was 4.47%, which results from adding 0.43% of quantity disagreement and 4.04% of allocation disagreement. The methodological framework presented in this paper and the combined use of SVIs, ancillary geographic data, and the RFC allowed the accurate mapping of hard-to-reach mountain landscapes as well as uncovering the underlying factors that help differentiate vegetation cover in the Ecuadorian mountain geosystem. Full article
Show Figures

Figure 1

17251 KiB  
Article
Assessment of the Evolution of a Landslide Using Digital Photogrammetry and LiDAR Techniques in the Alpujarras Region (Granada, Southeastern Spain)
by Tomás Fernández, José Luis Pérez, Carlos Colomo, Javier Cardenal, Jorge Delgado, José Antonio Palenzuela, Clemente Irigaray and José Chacón
Geosciences 2017, 7(2), 32; https://doi.org/10.3390/geosciences7020032 - 27 Apr 2017
Cited by 21 | Viewed by 5843
Abstract
In this work a detailed analysis of the temporal evolution of the Almegíjar landslide is presented. It is a rock slide located in the Alpujarras region (Granada, Spain) that has developed over the last 30 years. Six datasets and photogrammetric flights corresponding to [...] Read more.
In this work a detailed analysis of the temporal evolution of the Almegíjar landslide is presented. It is a rock slide located in the Alpujarras region (Granada, Spain) that has developed over the last 30 years. Six datasets and photogrammetric flights corresponding to the years 1956, 1984, 1992, 2001, 2008, and 2010 were surveyed. The more recent flight of 2010 combined an aerial digital camera and a LiDAR sensor and was oriented by means of in-flight data and tie points. This 2010 flight allowed for the generation of a reliable and high-precision Digital Terrain Model (DTM). The other flights were oriented using second-order ground control points transferred from the 2010 flight, and the corresponding DTMs were prepared by automatic matching and subsequent editing from the stereoscopic models. After comparing the DTMs of different dates, it has been observed that the landslide was triggered after 1984 and since then has evolved in an irregular pattern with periods of variable activity. On average, the ground surface dropped more than 8 m in depleted zones and rose nearly 4 m in the accumulation zones, with a velocity catalogued as very slow (about 15–30 cm/year) over a time span corresponding to a degree VIII of diachroneity. The total volume of the mobilized mass of this large contemporary slide was about 300 × 103 m3. Full article
(This article belongs to the Special Issue Observing Geohazards from Space)
Show Figures

Graphical abstract

9260 KiB  
Review
The Betic Ophiolites and the Mesozoic Evolution of the Western Tethys
by Encarnación Puga, Antonio Díaz de Federico, Mark Fanning, José Miguel Nieto, José Ángel Rodríguez Martínez-Conde, Miguel Ángel Díaz Puga, José Antonio Lozano, Gianluca Bianchini, Claudio Natali and Luigi Beccaluva
Geosciences 2017, 7(2), 31; https://doi.org/10.3390/geosciences7020031 - 20 Apr 2017
Cited by 33 | Viewed by 7197
Abstract
The Betic Ophiolites consist of numerous tectonic slices, metric to kilometric in size, of eclogitized mafic and ultramafic rocks associated to oceanic metasediments, deriving from the Betic oceanic domain. The outcrop of these ophiolites is aligned along 250 km in the Mulhacén Complex [...] Read more.
The Betic Ophiolites consist of numerous tectonic slices, metric to kilometric in size, of eclogitized mafic and ultramafic rocks associated to oceanic metasediments, deriving from the Betic oceanic domain. The outcrop of these ophiolites is aligned along 250 km in the Mulhacén Complex of the Nevado-Filábride Domain, located at the center-eastern zone of the Betic Cordillera (SE Spain). According to petrological/geochemical inferences and SHRIMP (Sensitive High Resolution Ion Micro-Probe) dating of igneous zircons, the Betic oceanic lithosphere originated along an ultra-slow mid-ocean ridge, after rifting, thinning and breakup of the preexisting continental crust. The Betic oceanic sector, located at the westernmost end of the Tethys Ocean, developed from the Lower to Middle Jurassic (185–170 Ma), just at the beginning of the Pangaea break-up between the Iberia-European and the Africa-Adrian plates. Subsequently, the oceanic spreading migrated northeastward to form the Ligurian and Alpine Tethys oceans, from 165 to 140 Ma. Breakup and oceanization isolated continental remnants, known as the Mesomediterranean Terrane, which were deformed and affected by the Upper Cretaceous-Paleocene Eo-Alpine high-pressure metamorphic event, due to the intra-oceanic subduction of the Jurassic oceanic lithosphere and the related continental margins. This process was followed by the partial exhumation of the subducted oceanic rocks onto their continental margins, forming the Betic and Alpine Ophiolites. Subsequently, along the Upper Oligocene and Miocene, the deformed and metamorphosed Mesomediterranean Terrane was dismembered into different continental blocks collectively known as AlKaPeCa microplate (Alboran, Kabylian, Peloritan and Calabrian). In particular, the Alboran block was displaced toward the SW to occupy its current setting between the Iberian and African plates, due to the Neogene opening of the Algero-Provençal Basin. During this translation, the different domains of the Alboran microplate, forming the Internal Zones of the Betic and Rifean Cordilleras, collided with the External Zones representing the Iberian and African margins and, together with them, underwent the later alpine deformation and metamorphism, characterized by local differences of P-T (Pressure-Temperature) conditions. These Neogene metamorphic processes, known as Meso-Alpine and Neo-Alpine events, developed in the Nevado-Filábride Domain under Ab-Ep amphibolite and greenschists facies conditions, respectively, causing retrogradation and intensive deformation of the Eo-Alpine eclogites. Full article
(This article belongs to the Special Issue Petrogenesis of Ophiolites)
Show Figures

Figure 1

14232 KiB  
Article
Analysis of Costantino Landslide Dam Evolution (Southern Italy) by Means of Satellite Images, Aerial Photos, and Climate Data
by Corrado Cencetti, Lucio Di Matteo and Saverio Romeo
Geosciences 2017, 7(2), 30; https://doi.org/10.3390/geosciences7020030 - 19 Apr 2017
Cited by 8 | Viewed by 5135
Abstract
Large landslides, triggered by earthquakes or heavy rainfall, often obstruct the river’s flow to form landslide dams, causing upstream inundations, and downstream flooding. In Italy, landslide dams are rather widespread along in Alps and Apennines: although the identification of past events is a [...] Read more.
Large landslides, triggered by earthquakes or heavy rainfall, often obstruct the river’s flow to form landslide dams, causing upstream inundations, and downstream flooding. In Italy, landslide dams are rather widespread along in Alps and Apennines: although the identification of past events is a complex task, some hundreds of landslide dams are identified in the literature. In order to assess the formation and evolution of landslide dams, several studies suggested the employment of geomorphological indexes. In this framework, the knowledge of site-specific time-space evolution can be useful in the understanding of the landslide dams phenomena. The present work focuses on a landslide dam that occurred in January 1973, which totally dammed the Bonamico River Valley (Southern Italy): the lake reached an area of about 175,000 m2, a volume of about 3.6 × 10⁶ m3 and a maximum depth of 40 m. During 1973–2008, the lake surface gradually decreased and nowadays it is completely extinct by filling. By using satellite and aerial images, the paper discusses the evolution of the lake surface and the causes of the lake extinction. The use of a climate index (i.e., standardized precipitation index at different time scale) indicates that in recent decades the alternance of drought and heavy rainfall periods affected the inflow/outflow dynamics, the filling of lake due to the solid transport of the Bonamico River, and the failure of the landslide dam. Full article
(This article belongs to the Special Issue Observing Geohazards from Space)
Show Figures

Graphical abstract

2818 KiB  
Article
Developing a Cloud-Reduced MODIS Surface Reflectance Product for Snow Cover Mapping in Mountainous Regions
by Amin Khoramian and Alireza B. Dariane
Geosciences 2017, 7(2), 29; https://doi.org/10.3390/geosciences7020029 - 17 Apr 2017
Cited by 3 | Viewed by 3989
Abstract
Cloud obscuration is a major problem for using Moderate Resolution Imaging Spectroradiometer (MODIS) images in different applications. This issue poses serious difficulties in monitoring the snow cover in mountainous regions due to high cloudiness in such areas. To overcome this, different cloud removal [...] Read more.
Cloud obscuration is a major problem for using Moderate Resolution Imaging Spectroradiometer (MODIS) images in different applications. This issue poses serious difficulties in monitoring the snow cover in mountainous regions due to high cloudiness in such areas. To overcome this, different cloud removal methods have been developed in the past where most of them use MODIS snow cover products and spatiotemporal dependencies of snow to estimate the undercloud coverage. In this study, a new approach is adopted that uses surface reflectance data in the cloud-free pixels and estimates the surface reflectance of a cloudy pixel as if there were no cloud. This estimation is obtained by subsequently applying the k-nearest neighbor and dynamic time compositing methods. The modified surface reflectance data are then utilized as inputs of a Normalized Difference Snow Index (NDSI)-based algorithm to map snow cover in the study area. The results indicate that the suggested approach is able to appropriately estimate undercloud surface reflectance in bands 2, 4 and 6, and can map the snow cover with 97% accuracy, which is a substantial improvement over the conventional method with an accuracy of 86%. Finally, although a clear underestimation of snow cover (about 15%) is observed by applying the proposed approach, still, it is much better than the 30% underestimation obtained by the conventional method. Full article
(This article belongs to the Special Issue Cryosphere)
Show Figures

Figure 1

16995 KiB  
Article
Role of Faults in Hydrocarbon Leakage in the Hammerfest Basin, SW Barents Sea: Insights from Seismic Data and Numerical Modelling
by Ilya Ostanin, Zahie Anka and Rolando Di Primio
Geosciences 2017, 7(2), 28; https://doi.org/10.3390/geosciences7020028 - 15 Apr 2017
Cited by 22 | Viewed by 9373
Abstract
Hydrocarbon prospectivity in the Greater Barents Sea remains enigmatic as gas discoveries have dominated over oil in the past three decades. Numerous hydrocarbon-related fluid flow anomalies in the area indicate leakage and redistribution of petroleum in the subsurface. Many questions remain unanswered regarding [...] Read more.
Hydrocarbon prospectivity in the Greater Barents Sea remains enigmatic as gas discoveries have dominated over oil in the past three decades. Numerous hydrocarbon-related fluid flow anomalies in the area indicate leakage and redistribution of petroleum in the subsurface. Many questions remain unanswered regarding the geological driving factors for leakage from the reservoirs and the response of deep petroleum reservoirs to the Cenozoic exhumation and the Pliocene-Pleistocene glaciations. Based on 2D and 3D seismic data interpretation, we constructed a basin-scale regional 3D petroleum systems model for the Hammerfest Basin (1 km × 1 km grid spacing). A higher resolution model (200 m × 200 m grid spacing) for the Snøhvit and Albatross fields was then nested in the regional model to further our understanding of the subsurface development over geological time. We tested the sensitivity of the modeled petroleum leakage by including and varying fault properties as a function of burial and erosion, namely fault capillary entry pressures and permeability during glacial cycles. In this study, we find that the greatest mass lost from the Jurassic reservoirs occurs during ice unloading, which accounts for a 60%–80% reduction of initial accumulated mass in the reservoirs. Subsequent leakage events show a stepwise decrease of 7%–25% of the remaining mass from the reservoirs. The latest episode of hydrocarbon leakage occurred following the Last Glacial Maximum (LGM) when differential loading of Quaternary strata resulted in reservoir tilt and spill. The first modeled hydrocarbon leakage event coincides with a major fluid venting episode at the time of a major Upper Regional angular Unconformity (URU, ~0.8 Ma), evidenced by an abundance of pockmarks at this stratigraphic interval. Our modelling results show that leakage along the faults bounding the reservoir is the dominant mechanism for hydrocarbon leakage and is in agreement with observed shallow gas leakage indicators of gas chimneys, pockmarks and fluid escape pipes. We propose a conceptual model where leaked thermogenic gases from the reservoir were also locked in gas hydrate deposits beneath the base of the glacier during glaciations of the Hammerfest Basin and decomposed rapidly during subsequent deglaciation, forming pockmarks and fluid escape pipes. This is the first study to our knowledge to integrate petroleum systems modelling with seismic mapping of hydrocarbon leakage indicators for a holistic numerical model of the subsurface geology, thus closing the gap between the seismic mapping of fluid flow events and the geological history of the area. Full article
(This article belongs to the Special Issue Natural Gas Origin, Migration, Alteration and Seepage)
Show Figures

Figure 1

6418 KiB  
Article
Changes of High Altitude Glaciers in the Trans-Himalaya of Ladakh over the Past Five Decades (1969–2016)
by Susanne Schmidt and Marcus Nüsser
Geosciences 2017, 7(2), 27; https://doi.org/10.3390/geosciences7020027 - 14 Apr 2017
Cited by 79 | Viewed by 11072
Abstract
Climatic differences between monsoonal and cold-arid parts of the South Asian mountain arc account for the uncertainty regarding regional variations in glacier retreat. In this context, the upper Indus Basin of Ladakh, sandwiched between the Himalayan and Karakoram ranges, is of particular interest. [...] Read more.
Climatic differences between monsoonal and cold-arid parts of the South Asian mountain arc account for the uncertainty regarding regional variations in glacier retreat. In this context, the upper Indus Basin of Ladakh, sandwiched between the Himalayan and Karakoram ranges, is of particular interest. The aims of the present study are threefold: to map the glaciers of central and eastern Ladakh, to describe their regional distribution and characteristics in relation to size and topography, and to analyze glacier changes in the selected ranges over the past five decades. The study is based on multi-temporal remote sensing data (Corona and Landsat), supported and validated by several field campaigns carried out between 2007 and 2016. A glacier inventory was carried out for the complete study area, which was subdivided into nine sub-regions for comparison. In general, the glaciers of Ladakh are characterized by their high altitude, as 91% terminate above 5200 m, and by their relatively small size, as 79% of them are smaller than 0.75 km2 and only 4% are larger than 2 km2. The glaciated area of central Ladakh totaled 997 km2 with more than 1800 glaciers in 2002. Full article
(This article belongs to the Special Issue Cryosphere)
Show Figures

Figure 1

6954 KiB  
Article
Characteristics of Microbial Coalbed Gas during Production; Example from Pennsylvanian Coals in Indiana, USA
by Maria Mastalerz, Agnieszka Drobniak and Arndt Schimmelmann
Geosciences 2017, 7(2), 26; https://doi.org/10.3390/geosciences7020026 - 13 Apr 2017
Cited by 6 | Viewed by 4121
Abstract
Coalbed gases from 11 wells producing from the Springfield and Seelyville Coal Members (Pennsylvanian) were analyzed for composition and carbon and hydrogen stable isotope ratios in four sampling events to investigate short-term variation trends. Nine wells in the Seelyville Coal Member produce coalbed [...] Read more.
Coalbed gases from 11 wells producing from the Springfield and Seelyville Coal Members (Pennsylvanian) were analyzed for composition and carbon and hydrogen stable isotope ratios in four sampling events to investigate short-term variation trends. Nine wells in the Seelyville Coal Member produce coalbed gases from the virgin seam, whereas two wells in the Springfield Coal Member produce gas from mine voids. Methane dominates gas composition in all wells, and its content ranges from ~94% to almost 98%, with ethane typically accounting for less than 0.01%. Carbon dioxide content in most samples is below 1%, whereas N2 content ranges from less than 2% to 4.8%. Methane δ13C values range from −55.3‰ to −61.1‰, and δ2H values range from −201‰ to −219‰. Isotopic values of methane and C1/(C2 + C3) ratios indicate a biogenic origin along the CO2-reduction pathway, consistent with previous studies in this area. Our results demonstrate that gas properties may change significantly during a period of one year of production history. Compositional trends (e.g., C1/(C2 + C3), CH4/CO2 ratios) are specific for each well and often irregular. These changes result from a combined influence of numerous factors and, therefore, are difficult to predict. Full article
(This article belongs to the Special Issue Natural Gas Origin, Migration, Alteration and Seepage)
Show Figures

Figure 1

21042 KiB  
Article
Exploitation of Satellite A-DInSAR Time Series for Detection, Characterization and Modelling of Land Subsidence
by Roberta Bonì, Claudia Meisina, Francesca Cigna, Gerardo Herrera, Davide Notti, Stephanie Bricker, Harry McCormack, Roberto Tomás, Marta Béjar-Pizarro, Joaquín Mulas and Pablo Ezquerro
Geosciences 2017, 7(2), 25; https://doi.org/10.3390/geosciences7020025 - 11 Apr 2017
Cited by 26 | Viewed by 6037
Abstract
In the last two decades, advanced differential interferometric synthetic aperture radar (A-DInSAR) techniques have experienced significant developments, which are mainly related to (i) the progress of satellite SAR data acquired by new missions, such as COSMO-SkyMed and ESA’s Sentinel-1 constellations; and (ii) the [...] Read more.
In the last two decades, advanced differential interferometric synthetic aperture radar (A-DInSAR) techniques have experienced significant developments, which are mainly related to (i) the progress of satellite SAR data acquired by new missions, such as COSMO-SkyMed and ESA’s Sentinel-1 constellations; and (ii) the development of novel processing algorithms. The improvements in A-DInSAR ground deformation time series need appropriate methodologies to analyse extremely large datasets which consist of huge amounts of measuring points and associated deformation histories with high temporal resolution. This work demonstrates A-DInSAR time series exploitation as valuable tool to support different problems in engineering geology such as detection, characterization and modelling of land subsidence mechanisms. The capabilities and suitability of A-DInSAR time series from an end-user point of view are presented and discussed through the analysis carried out for three test sites in Europe: the Oltrepo Pavese (Po Plain in Italy), the Alto Guadalentín (Spain) and the London Basin (United Kingdom). Principal component analysis has been performed for the datasets available for the three case histories, in order to extract the great potential contained in the A-DInSAR time series. Full article
(This article belongs to the Special Issue Observing Geohazards from Space)
Show Figures

Figure 1

3396 KiB  
Article
The Influence of Cryogenic Mass Exchange on the Composition and Stabilization Rate of Soil Organic Matter in Cryosols of the Kolyma Lowland (North Yakutia, Russia)
by Alexey Lupachev, Evgeny Abakumov and Stanislav Gubin
Geosciences 2017, 7(2), 24; https://doi.org/10.3390/geosciences7020024 - 11 Apr 2017
Cited by 19 | Viewed by 4902
Abstract
Soil organic matter (SOM) was studied in different types of organo-mineral material (from surface horizons and partially isolated materials—cryoturbated or buried horizons) sampled from the surface horizons, the central parts of the Cryosol profiles, and the lower active layer. We found that the [...] Read more.
Soil organic matter (SOM) was studied in different types of organo-mineral material (from surface horizons and partially isolated materials—cryoturbated or buried horizons) sampled from the surface horizons, the central parts of the Cryosol profiles, and the lower active layer. We found that the humic acids (HAs) of the cryoturbated and buried horizons showed an increased degree of oxidation and an increment of alkylaromatic and protonized aromatic fraction content. In contrast, the HAs of the surface horizons showed increased values of alkylic carbon components. The content of free radicals was essentially higher in the surface layers than in the cryoturbated and buried layers. While the bulk soil organic matter composition (total organic carbon, total nitrogen, and aromatic/aliphatic values) was not essentially different between surface, cryoturbated, and buried horizons, there were essential differences in elemental composition, carbon species, and free radical content. This indicates that the degree of humification in cryoturbated and buried organo-mineral material is higher than in surface horizons and that partial isolation results in relative stabilization of such material in soil profiles. Full article
(This article belongs to the Special Issue Cryosphere)
Show Figures

Figure 1

20518 KiB  
Article
Mineralogy of Paleocene Petrified Wood from Cherokee Ranch Fossil Forest, Central Colorado, USA
by George E. Mustoe and Mike Viney
Geosciences 2017, 7(2), 23; https://doi.org/10.3390/geosciences7020023 - 10 Apr 2017
Cited by 10 | Viewed by 8547
Abstract
An extensive fossil forest discovered in 2010 on private property in central Colorado, USA, has not previously been described in scientific literature. Horizontal partial logs originated as fluvially transported driftwood. A preliminary study of petrified wood specimens reveals evidence of a complex mineralization [...] Read more.
An extensive fossil forest discovered in 2010 on private property in central Colorado, USA, has not previously been described in scientific literature. Horizontal partial logs originated as fluvially transported driftwood. A preliminary study of petrified wood specimens reveals evidence of a complex mineralization sequence that involved multiple episodes of mineral deposition, combined with diagenetic transformation of silica minerals. Specimens from two logs have opalized cell walls. However, minerals filling the cell interiors of these specimens vary. Vessel lumina are filled with chalcedony or crystalline quartz; tracheid lumina may contain opal or chalcedony. Specimens from 5 other logs contain quartz/chalcedony, but relict textures suggest cell walls were originally mineralized with opal that was later converted to microcrystalline silica. Pyrite, calcite, and iron oxides were observed as minor constituents in some specimens, providing additional evidence that fossilization occurred in multiple stages, with temporal and spatial variations in physical and chemical conditions causing episodic precipitation of various minerals within the buried wood. Trace element analyses suggest that Fe is the main source of fossil wood color. Full article
Show Figures

Figure 1

3359 KiB  
Article
A Web GIS Framework for Participatory Sensing Service: An Open Source-Based Implementation
by Yu Nakayama, Kazuhiko Nakamura, Hitoshi Saito and Rui Fukumoto
Geosciences 2017, 7(2), 22; https://doi.org/10.3390/geosciences7020022 - 10 Apr 2017
Cited by 11 | Viewed by 6971
Abstract
Participatory sensing is the process in which individuals or communities collect and analyze systematic data using mobile phones and cloud services. To efficiently develop participatory sensing services, some server-side technologies have been proposed. Although they provide a good platform for participatory sensing, they [...] Read more.
Participatory sensing is the process in which individuals or communities collect and analyze systematic data using mobile phones and cloud services. To efficiently develop participatory sensing services, some server-side technologies have been proposed. Although they provide a good platform for participatory sensing, they are not optimized for spatial data management and processing. For the purpose of spatial data collection and management, many web GIS approaches have been studied. However, they still have not focused on the optimal framework for participatory sensing services. This paper presents a web GIS framework for participatory sensing service (FPSS). The proposed FPSS enables an integrated deployment of spatial data capture, storage, and data management functions. In various types of participatory sensing experiments, users can collect and manage spatial data in a unified manner. This feature is realized by the optimized system architecture and use case based on the general requirements for participatory sensing. We developed an open source GIS-based implementation of the proposed framework, which can overcome financial difficulties that are one of the major problems of deploying sensing experiments. We confirmed with the prototype that participatory sensing experiments can be performed efficiently with the proposed FPSS. Full article
Show Figures

Figure 1

11019 KiB  
Article
Combined Use of C- and X-Band SAR Data for Subsidence Monitoring in an Urban Area
by Lorenzo Solari, Andrea Ciampalini, Federico Raspini, Silvia Bianchini, Ivana Zinno, Manuela Bonano, Michele Manunta, Sandro Moretti and Nicola Casagli
Geosciences 2017, 7(2), 21; https://doi.org/10.3390/geosciences7020021 - 01 Apr 2017
Cited by 35 | Viewed by 6511
Abstract
In this study, we present the detection and characterization of ground displacements in the urban area of Pisa (Central Italy) using Interferometric Synthetic Aperture Radar (InSAR) products. Thirty RADARSAT-2 and twenty-nine COSMO-SkyMed images have been analyzed with the Small BAseline Subset (SBAS) algorithm, [...] Read more.
In this study, we present the detection and characterization of ground displacements in the urban area of Pisa (Central Italy) using Interferometric Synthetic Aperture Radar (InSAR) products. Thirty RADARSAT-2 and twenty-nine COSMO-SkyMed images have been analyzed with the Small BAseline Subset (SBAS) algorithm, in order to quantify the ground subsidence and its temporal evolution in the three-year time interval from 2011 to 2014. A borehole database was reclassified in stratigraphical and geotechnical homogeneous units, providing the geological background needed for the local scale analysis of the recorded displacements. Moreover, the interferometric outputs were compared with the last 30 years’ urban evolution of selected parts of the city. Two deformation patterns were recorded by the InSAR data: very slow vertical movements within the defined stability threshold (±2.5 mm/yr) and areas with subsidence rates down to −5 to −7 mm/yr, associated with high peak velocities (−15 to −20 mm/yr) registered by single buildings or small groups of buildings. Some of these structures are used to demonstrate that the high subsidence rates are related to the recent urbanization, which is the trigger for the accelerated consolidation process of highly compressible layers. Finally, this urban area was a valuable test site for demonstrating the different results of the C- and X-band data processing, in terms of the density of points and the quality of the time series of deformation. Full article
(This article belongs to the Special Issue Observing Geohazards from Space)
Show Figures

Graphical abstract

13044 KiB  
Article
Assessment of Groundwater Vulnerability to Nitrate Based on the Optimised DRASTIC Models in the GIS Environment (Case of Sidi Rached Basin, Algeria)
by Sbargoud Saida, Hartani Tarik, Aidaoui Abdellah, Herda Farid and Bachir Hakim
Geosciences 2017, 7(2), 20; https://doi.org/10.3390/geosciences7020020 - 31 Mar 2017
Cited by 33 | Viewed by 6598
Abstract
The DRASTIC model was tested on the Mitidja aquifer to assess vulnerability to nitrate pollution. Vulnerability indexes were obtained from classic DRASTIC (MDC) and pesticide DRASTIC (MDP) coupled with a geographic information system in which the weights of the model’s parameters were calculated [...] Read more.
The DRASTIC model was tested on the Mitidja aquifer to assess vulnerability to nitrate pollution. Vulnerability indexes were obtained from classic DRASTIC (MDC) and pesticide DRASTIC (MDP) coupled with a geographic information system in which the weights of the model’s parameters were calculated using two weighting techniques: analytic hierarchy process (AHP) and single parameter sensitivity analysis (SPSA). The correlations between vulnerability indexes produced by both models and actual nitrate concentration values—measured from 34 system aquifers—show that the best combination is obtained from MDP–AHP (R = 0.72) followed by MDP–SPSA (R = 0.68), MDC–AHP (R = 0.67), MDC–SPSA (R =0.65), MDP (R = 0.64) and lastly MDC (R = 0.60). Pesticide DRASTIC/Analytic hierarchy Process (MDP–AHP) may be recommended as the best model for this case study. This result is important for the spatial analysis of nitrate pollution and will contribute to better management of intensive agricultural plans. Full article
Show Figures

Figure 1

38689 KiB  
Article
Assessing the Feasibility of a National InSAR Ground Deformation Map of Great Britain with Sentinel-1
by Alessandro Novellino, Francesca Cigna, Mouna Brahmi, Andrew Sowter, Luke Bateson and Stuart Marsh
Geosciences 2017, 7(2), 19; https://doi.org/10.3390/geosciences7020019 - 30 Mar 2017
Cited by 56 | Viewed by 10731
Abstract
This work assesses the feasibility of national ground deformation monitoring of Great Britain using synthetic aperture radar (SAR) imagery acquired by Copernicus’ Sentinel-1 constellation and interferometric SAR (InSAR) analyses. As of December 2016, the assessment reveals that, since May 2015, more than 250 [...] Read more.
This work assesses the feasibility of national ground deformation monitoring of Great Britain using synthetic aperture radar (SAR) imagery acquired by Copernicus’ Sentinel-1 constellation and interferometric SAR (InSAR) analyses. As of December 2016, the assessment reveals that, since May 2015, more than 250 interferometric wide (IW) swath products have been acquired on average every month by the constellation at regular revisit cycles for the entirety of Great Britain. A simulation of radar distortions (layover, foreshortening, and shadow) confirms that topographic constraints have a limited effect on SAR visibility of the landmass and, despite the predominance of rural land cover types, there is potential for over 22,000,000 intermittent small baseline subset (ISBAS) monitoring targets for each acquisition geometry (ascending and descending) using a set of IW image frames covering the entire landmass. Finally, InSAR results derived through ISBAS processing of the Doncaster area with an increasing amount of Sentinel-1 IW scenes reveal a consistent decrease of standard deviation of InSAR velocities from 6 mm/year to ≤2 mm/year. Such results can be integrated with geological and geohazard susceptibility data and provide key information to inform the government, other institutions and the public on the stability of the landmass. Full article
(This article belongs to the Special Issue Observing Geohazards from Space)
Show Figures

Graphical abstract

3544 KiB  
Article
Geochemical Features of the Weathered Materials Developed on Gabbro in a Semi-Arid Zone, Northern Cameroon
by Désiré Tsozué and Paul-Désiré Ndjigui
Geosciences 2017, 7(2), 16; https://doi.org/10.3390/geosciences7020016 - 27 Mar 2017
Cited by 4 | Viewed by 5630
Abstract
Investigation on the mobilization and the redistribution of major, trace and rare-earth elements (REE) was performed along a soil profile developed on gabbro in the semi-arid zone (Northern Cameroon), using mineralogical and geochemical analyses. The gabbro has high contents in Ba, Cr, V, [...] Read more.
Investigation on the mobilization and the redistribution of major, trace and rare-earth elements (REE) was performed along a soil profile developed on gabbro in the semi-arid zone (Northern Cameroon), using mineralogical and geochemical analyses. The gabbro has high contents in Ba, Cr, V, Sr, Ni, Zn, Zr, Cu, Co and Sc. The total REE content is 49 mg/kg with strong light rare-earth elements (LREE) abundance. The Ce/Ce* and Eu/Eu* ratios are very close to 1 (0.98 and 1.02 respectively) and the (La/Yb)N ratio is very low (1.48). The weathering of the bedrock leads to the differentiation of coarse saprolite, fine saprolite, loamy clayey horizon and humiferous horizon. Among trace elements, Cr and Zr concentrations range between 50 and 150 mg/kg; Ga, Y, Co, Cu, Ni and Sc concentrations vary between 50 and 150 mg/kg while those of Cs, Hf, Nb, Rb, Sn, Ta, Th, U and Pb are below 5 mg/kg. The total REE contents vary from 62.52 to 78.81 mg/kg, with strong LREE abundance. The values of the (La/Yb)N ratio (~1.04–1.59) is low and indicate the low REE fractionation. Negative Ce anomaly (Ce/Ce* ~ 0.86) and positive Eu anomalies (Eu/Eu* ~ 1.22) are observed respectively in the middle part and the whole soil profile. Mass balance calculation reveals the leaching of Ca, Mg, K, Ba, Cr, Rb, Co, Cu, Ni, Al, Cs, Sr, U and V, and accumulation of Si, Fe, Ti, Mn, Na, P, Ga, Hf, Nb, Sn, Ta, Y, Zr, Sc, Zn and REE during the weathering. Full article
Show Figures

Figure 1

Previous Issue
Next Issue
Back to TopTop