
Characteristics of Microbial Coalbed Gas during Production; Example from Pennsylvanian Coals in Indiana, USA

1
Indiana Geological Survey, Indiana University, 611 N. Walnut Grove Avenue, Bloomington, IN 47405, USA
2
Department of Earth and Atmospheric Sciences, Indiana University, 1001 E. 10th Street, Bloomington, IN 47405, USA
*
Author to whom correspondence should be addressed.
Geosciences 2017, 7(2), 26; https://doi.org/10.3390/geosciences7020026
Submission received: 21 February 2017
/
Revised: 31 March 2017
/
Accepted: 10 April 2017
/
Published: 13 April 2017
(This article belongs to the Special Issue Natural Gas Origin, Migration, Alteration and Seepage)
Abstract
:Coalbed gases from 11 wells producing from the Springfield and Seelyville Coal Members (Pennsylvanian) were analyzed for composition and carbon and hydrogen stable isotope ratios in four sampling events to investigate short-term variation trends. Nine wells in the Seelyville Coal Member produce coalbed gases from the virgin seam, whereas two wells in the Springfield Coal Member produce gas from mine voids. Methane dominates gas composition in all wells, and its content ranges from ~94% to almost 98%, with ethane typically accounting for less than 0.01%. Carbon dioxide content in most samples is below 1%, whereas N2 content ranges from less than 2% to 4.8%. Methane δ13C values range from −55.3‰ to −61.1‰, and δ2H values range from −201‰ to −219‰. Isotopic values of methane and C1/(C2 + C3) ratios indicate a biogenic origin along the CO2-reduction pathway, consistent with previous studies in this area. Our results demonstrate that gas properties may change significantly during a period of one year of production history. Compositional trends (e.g., C1/(C2 + C3), CH4/CO2 ratios) are specific for each well and often irregular. These changes result from a combined influence of numerous factors and, therefore, are difficult to predict.
1. Introduction
The Illinois Basin contains Pennsylvanian coals (Figure 1) that are of economic importance mostly because they are used to generate electricity. The coals are of high-volatile C to B bituminous rank [1,2], with higher rank (high-volatile A bituminous) present only in the southeastern part of the basin in western Kentucky. The latter is related to intense tectonic activity and a higher geothermal gradient along the Rough Creek and Pennyrile fault systems [3]. With this relatively low rank, the coal has never reached the window of significant thermogenic gas generation. Indeed, our previous studies of coalbed methane (CBM) in the Illinois Basin have demonstrated that the majority of the gas is microbial in origin, except in the southeastern part of the basin in western Kentucky [4,5,6]. Inoculation of coalbeds with microbial consortia and the onset of biodegradation and methanogenesis likely occurred during Pleistocene recharge with postglacial waters that (a) introduced microbes into coalbeds; and (b) diluted existing brines making coalbeds more habitable for microbial consortia [4,7]. Since that time, shallow and highly permeable coalbeds have served as a niche for methanogenic microbes, as evidenced by their presence in co-produced water from CBM wells in Indiana [6]. The gas content in these coals is within 2.5 to 3.5 m3/ton (80–112 scf/t) and shows variations both laterally and vertically within coalbeds [5,8,9]. Although CBM production from coals in the Illinois Basin is small, CBM wells have been producing gas in Indiana and Illinois for more than 30 years, with Indiana’s Sullivan County being the main CBM producing area in the basin [2,10]. A particularly useful diagnostic tool for the origin and possible microbial degradation of methane in natural gas are compound-specific hydrogen and carbon stable isotope ratios [11,12] that have also been employed in our study area [4,6].
This study discusses variations in gas composition and isotopic signatures in two Pennsylvanian coalbeds in the Illinois Basin—the Springfield Coal Member of the Petersburg Formation and the Seelyville Coal Member of the Linton Formation—based on several wells in Sullivan County, Indiana (Figure 2). Although many studies looked into the effects of coal composition and reservoir conditions on CBM well performance (e.g., [13,14,15]), limited information is available about production-related shifts in gas composition and about the factors that control such shifts. It is generally expected that during CBM production (and the following decrease of reservoir pressure), the ratio of CH4 to CO2 and the ratio of methane to ethane decrease with time, because ethane and CO2 are sorbed stronger than methane to coal [16,17]. Canister desorption experiments can provide data on production-related changes of gas properties and typically last several months. Such canister desorption experiments provide, however, rather contrasting results. When studying the Springfield and Seelyville Coal Members in Sullivan County, Indiana, Strąpoć et al. [18] observed an increase in CO2 relative to CH4 and explained this trend by a higher adsorption affinity of CO2 relative to CH4 in microporous coal, in agreement with expected long-term field production trends. In turn, by modeling gas desorption of coal cores, Cui and Bustin [19] reported a decrease in CO2 during canister desorption and explained this trend by the dominance of gas diffusion (and not gas adsorption) through the coal matrix, and by the higher diffusivity of CO2 relative to CH4 in microporous coals. Clearly, even though predicting gas compositional shifts is important to plan CBM utilization and its economics, it is a challenging task to address.
The main objective of this paper is to document and discuss compositional and isotopic changes of coalbed gas over a one-year production period, a length of time transitional between short canister desorption experiments and long-term CBM field production.
2. Methods
Gas samples from 11 wells in Sullivan County (Figure 2) were collected in the field during four sampling events over 13 months between March 2009 and April 2010. All CBM wells are vertical; nine wells produce gas from the Seelyville Coal, whereas two wells reach into the Springfield Coal (Jackson 1 and Creed 1) and produce gas from mine voids. Gas samples were collected from wellheads of producing wells after first flushing the lines for several minutes to remove air contamination. Gas was collected into water-filled 250 mL glass bottles that were immersed upside-down in water. Bottles were tightly capped with butyl septa underwater, crimped with aluminum caps, transported to the laboratory, and analyzed within a few days after sample collection. Identical sample collection procedures were used throughout all sampling events.
Relative volumetric abundances of C1–5 hydrocarbons, oxygen, nitrogen, and carbon dioxide in gas samples were determined using a Multiple Gas Analyzer #2 SRI gas chromatograph (GC) (SRI Instruments, Torrance, CA, USA) [21]. This GC is composed of two ovens (a sampling oven and a column oven) and three detectors (flame ionization detector, FID; thermal conductivity detector, TCD; flame photometric detector, FPD). The sampling oven houses an automated gas sampling valve plumbed with dual sample loops, a sample inlet, and outlet ports. The column oven contains three packed columns (molecular sieve 13× column, Hayesep-D column, and 60-m MXT-1 capillary column). Ultra-high purity helium (99.999 vol %) is used as carrier gas and ultra-high purity hydrogen (99.999 vol %) supports the FID flame. The GC column oven was initially held at 40 °C for 4 min followed by an increase to 250 °C at 30 °C min−1 where it was held isothermally for 19 min. Each gas sample was analyzed twice. For standard gas mixtures from SCOTTY (Sigma-Aldrich, St. Louis, MO, USA) the GC precision was better than ± 400 ppmv for CO2, ± 10 ppmv for CH4 and ±4 ppmv for C2H6 and C3H8. Mole percentages from these analyses were converted to moles using the ideal gas law based on the recorded collection volumes, pressures, and temperatures.
Carbon and hydrogen stable isotopic analyses for methane were performed with a Thermo Delta Plus XP isotope ratio mass-spectrometer (IRMS) (ThermoFisher, Waltham, MA, USA) with a customized pre-concentration inlet system, an HP GC, as well as oxidative and glassy carbon reductive interfaces to convert methane to analyte gases CO2 and H2. At the beginning of the GC program, the PoraBOND Q column was cooled to −20 °C for 7 min with liquid nitrogen cryo-cooling to improve GC separation, followed by successive 50 °C min−1 warming along a series of isothermal plateaus of 4 min at 30 °C, 4 min at 80 °C, 6 min at 130 °C, and 4 min at 250 °C. Each sample was measured in duplicate with a standard deviation of less than ±10‰ for δ2H and ± 0.3‰ for δ13C. Methane isotope in-house standards with known δ13C and δ2H values (see http://mypage.iu.edu/~aschimme/hc.html) were run periodically for two-point calibrations and to monitor the stability of the IRMS. All δ2H and δ13C values are reported in customary δ-notation in ‰ along isotopic scales anchored to Vienna Standard Mean Ocean Water (VSMOW) and Vienna Pee Dee Belemnite (VPDB), respectively.
3. Results and Discussion
In the study area, the depth to the Springfield Coal Member ranges from 53 m to 130 m (175–425 ft) (Figure 3A), and the two Springfield Coal Member wells produce gas from a depth of ~73 m (~250 ft, Jackson 1) and ~91 m (~300 ft, Creed 2). The depth of the Seelyville Coal Member ranges from 137 m to ~190 m (~450–~600 ft) (Figure 3B). CBM production from Seelyville coal derives from a depth of 152 to 183 m (500–600 ft). Within the producing area, the thickness of Springfield coal is ~1.5 m (5 ft) and Seelyville coal ranges from 0.6 to 1.2 m (2–4 ft) (Figure 4A,B). The gas contents for both coals in the study area are similar and on a raw basis range from 2.5 to 3.5 m3/ton (80–112 scf/t), as exemplified by the gas content map of the Seelyville Coal Member in Figure 5.
CBM production from the majority of sampled wells was initiated in 2007 and continued for several years, yielding gas production rates from very low to about 1980 m3 (70 mcf) per day, with maximum production rates reached after about two years of production (Figure 6). It is estimated that these wells produced approximately 15 million m3 of gas during their production period between 2007 and 2013 [10]. Production rates and production histories from mine voids in Springfield Coal Member (exemplified by Creed 2; Figure 6A) and in virgin Seelyville Coal Member (McCammon well, Figure 6B) are relatively similar. Concomitant water production of several cubic meters per day is low during early production and even less later [10].
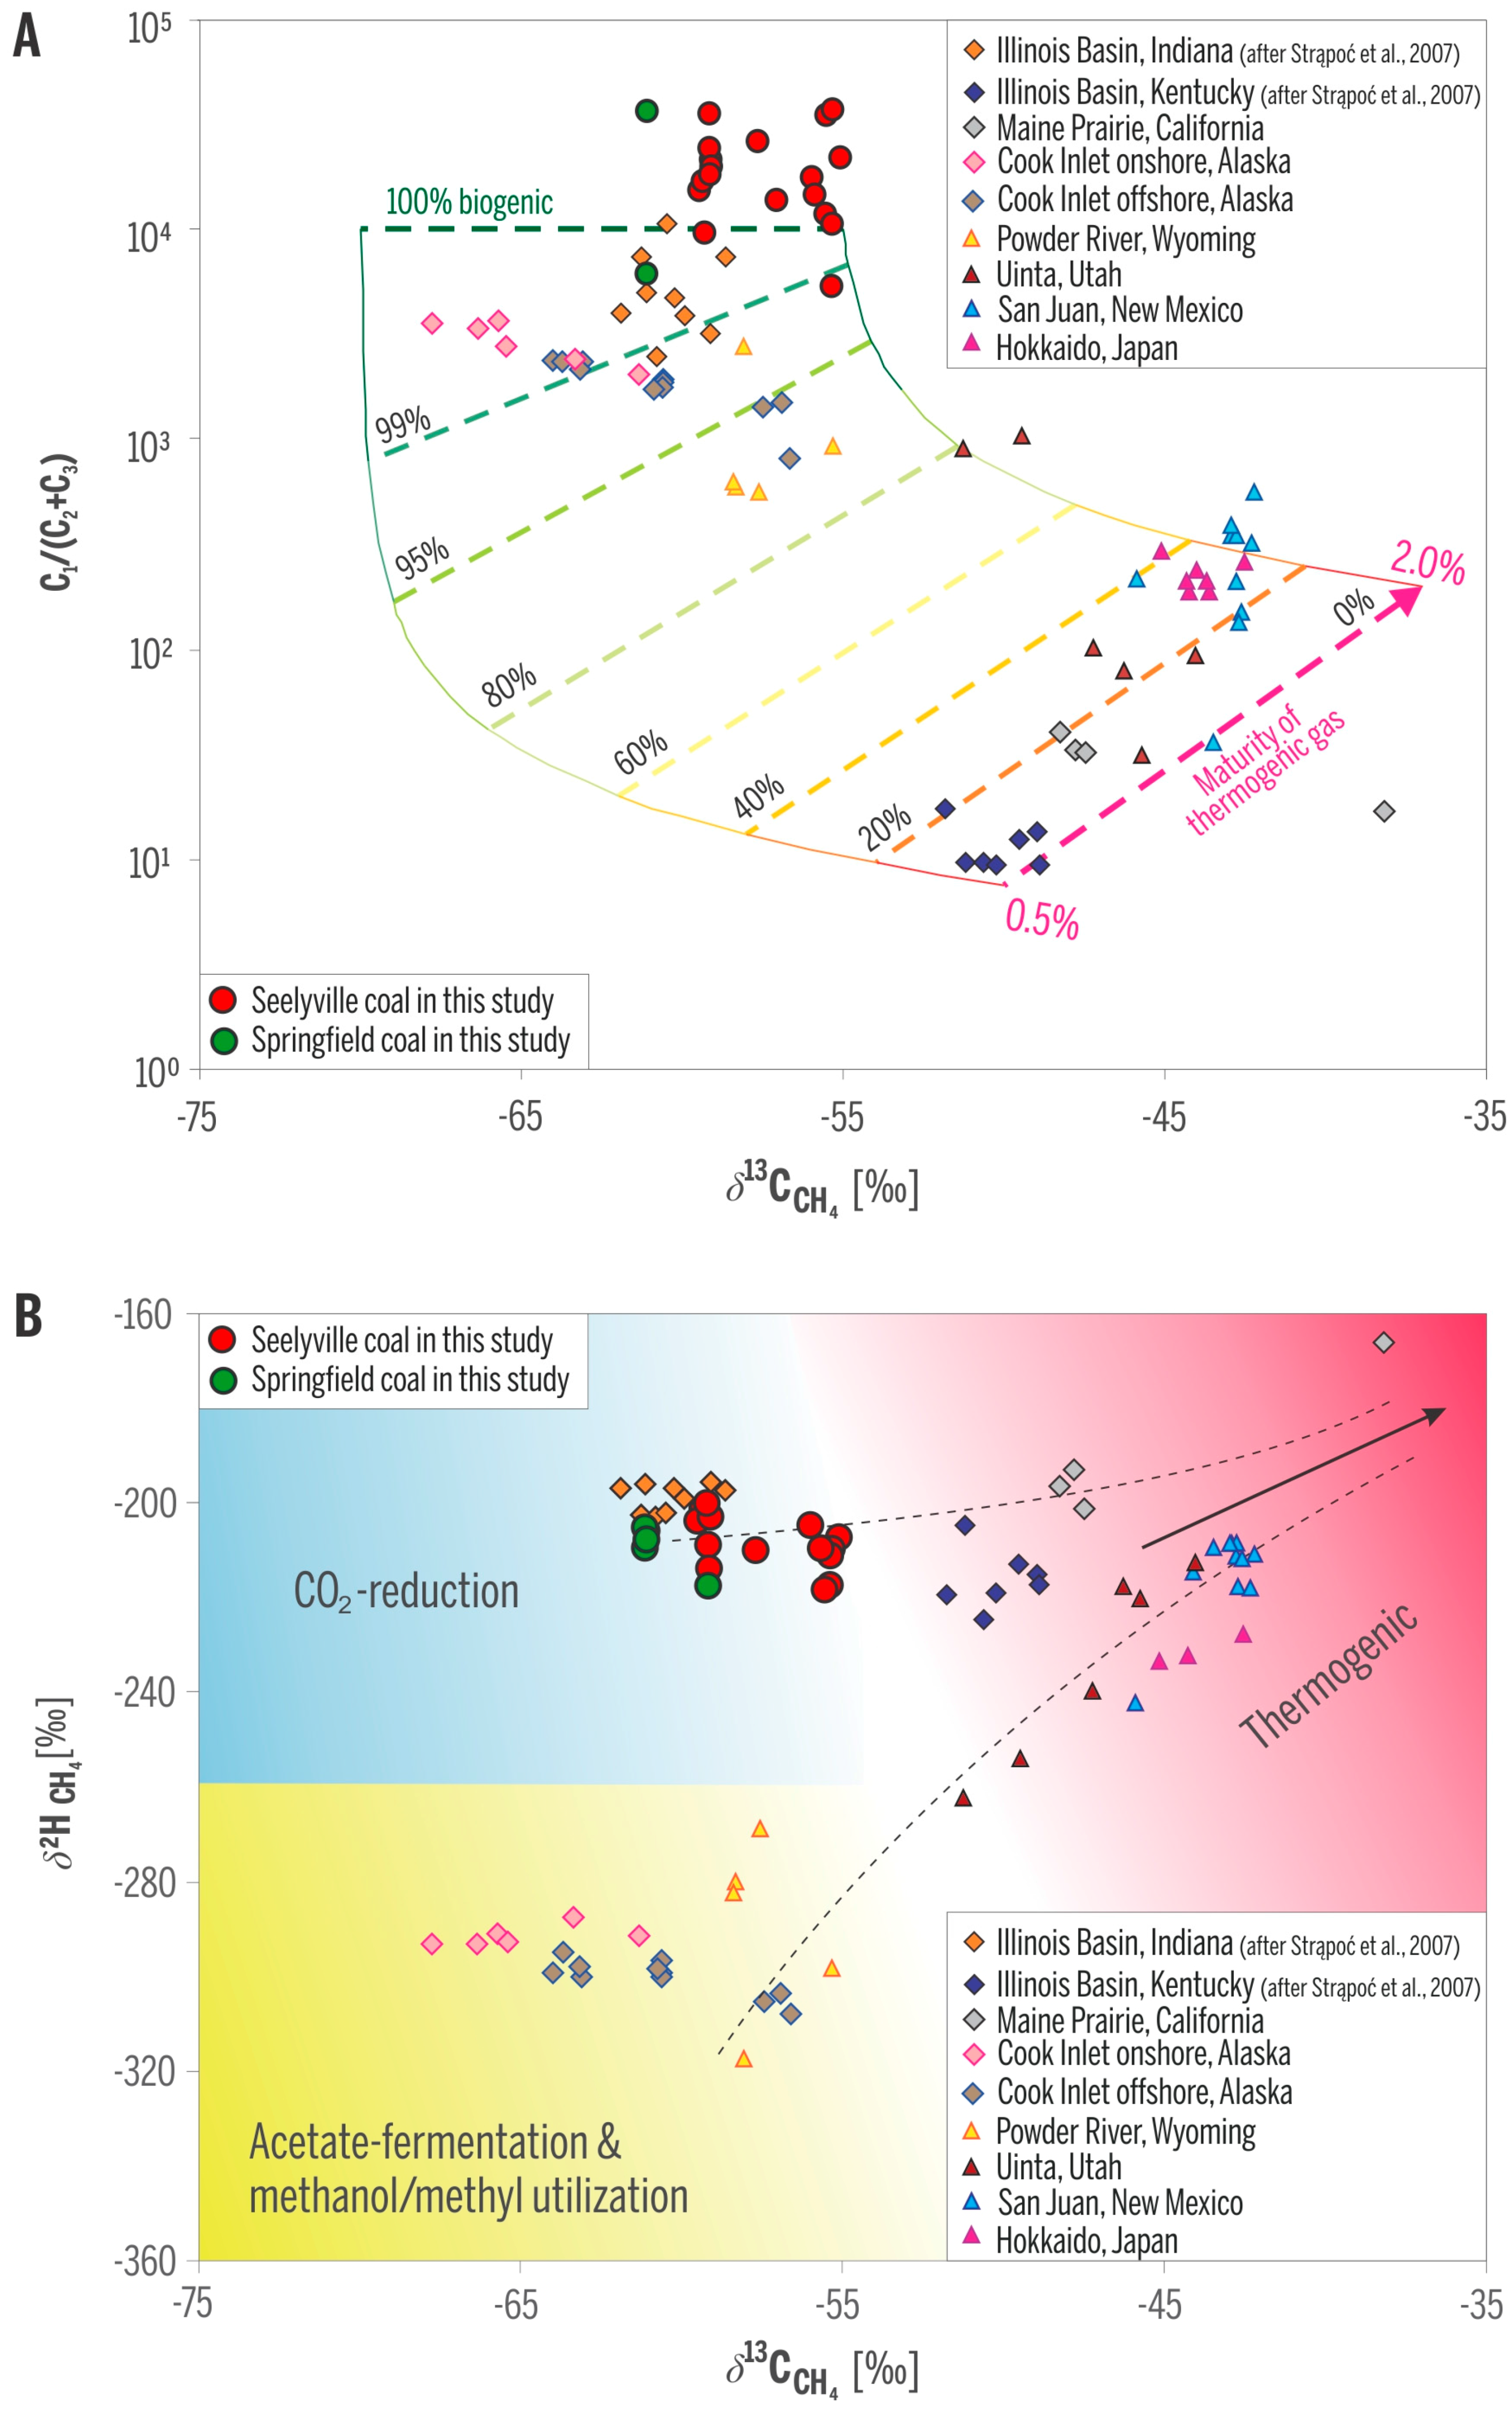
Gas compositions in the studied wells are dominated by methane, ranging from ~94 to almost 98 vol %; ethane is typically below 0.01%, and propane is even much lower to absent (Table 1). CO2 content in most gas samples is below 1%, whereas N2 content ranges from less than 2 to 4.8%. δ13C values of methane range from −55.3‰ to −61.1‰ and δ2H from −201‰ to −219‰. C1/(C2 + C3) ratios and δ13C values of methane place the gases in the purely biogenic field (Figure 7A). Carbon and hydrogen isotopic values further place the methane gases into the field of the microbial CO2-reduction pathway (Figure 7B), consistent with our previous data of CBM gas from Indiana [5,6].
The variance in C1/(C2 + C3) ratios and δ13CCH4 values in gases from the studied CBM production wells over 13 months of monitoring is rather small (Figure 8) and does not cause any significant shift on the gas origin diagrams (Figure 7A,B). The observed variations also express different characteristics for different wells. Specifically wells Hancock, Arnett 1, and Arnett 3 show a distinct decrease in C1/(C2 + C3) values throughout the production history (Figure 8A), supporting the idea that the relative abundance of C2+ gases is expected to increase over the time of production owing to their higher adsorption affinity and smaller mobility relative to CH4 [19]. However, wells Arnett 2 and Creed 2 register the opposite trend and express increasing C1/(C2 + C3) values (Figure 8B), suggesting that either smaller amounts of heavier hydrocarbons were generated over time or relatively more biogenic methane was produced in situ. The remaining wells show irregular trends except Jackson 1 where no significant change over time was noted (Figure 8C).
Changes in the ratio of CH4/CO2 are irregular and specific for each well (Figure 9). In most wells, the trend of a slight decrease of this ratio over time (Figure 9A) is consistent with a general expectation that the CO2 relative abundance increases over the time of production [16,19]. The increase in CO2 over time can be explained by its higher adsorption affinity relative to methane. However, wells Hancock, Vic 1, and Arnett 3 show an increasing CH4/CO2 trend over time (Figure 9B), contradicting the expected trend of CO2 increase and suggesting that CO2 is preferentially removed. An explanation may be the high effective diffusivity of CO2 [23]. The smaller kinetic diameter of the CO2 molecule increases its diffusion rate by one or two orders of magnitude relative to CH4 or N2. It is possible that the Seelyville coal around the measured wells has a higher cleat porosity and permeability, allowing the difference in gas diffusivity to take effect. Indeed, significant variations in the permeability of coal in the study area are expected based on simulation studies [10]. This increasing CH4/CO2 trend over time is most pronounced in the Hancock well. Gas diffusivity is strongly related to pressure [23], and therefore pressure differences can modify this relationship and result in irregular changes in gas composition; irregular changes in the CH4/CO2 ratio over time were documented for the Hall 1, Arnett 1, and Arnett 2 wells (Figure 9C). Such irregular changes may be related to varying coal permeability and pressure changes in response to gas production [19]. Although no pressure data for these wells were available, modeling studies in this area demonstrated that gas production caused large changes in effective gas permeability in response to dynamic changes in the coal and redistribution of fluids [10].
Differences in CH4/N2 ratios among wells (Figure 10) express mainly differences in the nitrogen content of produced gases (Table 1). The CH4/N2 ratios separate wells into two distinct groups, one having values below 30, and the other having values above 40. Wells Mason and Vic 1 have identical, slightly increasing CH4/N2 trends over time and occupy an intermediary position between the two main groups. Some of the nitrogen in produced gas derives from parental coals, but additional N2 likely originates from air that was dissolved in meteoric water and recharged the groundwater. Finally, we cannot rule out minor atmospheric contamination during gas sampling [21]. Multiple potential sources of N2 make it difficult to use the nitrogen content of production gas for diagnostics.
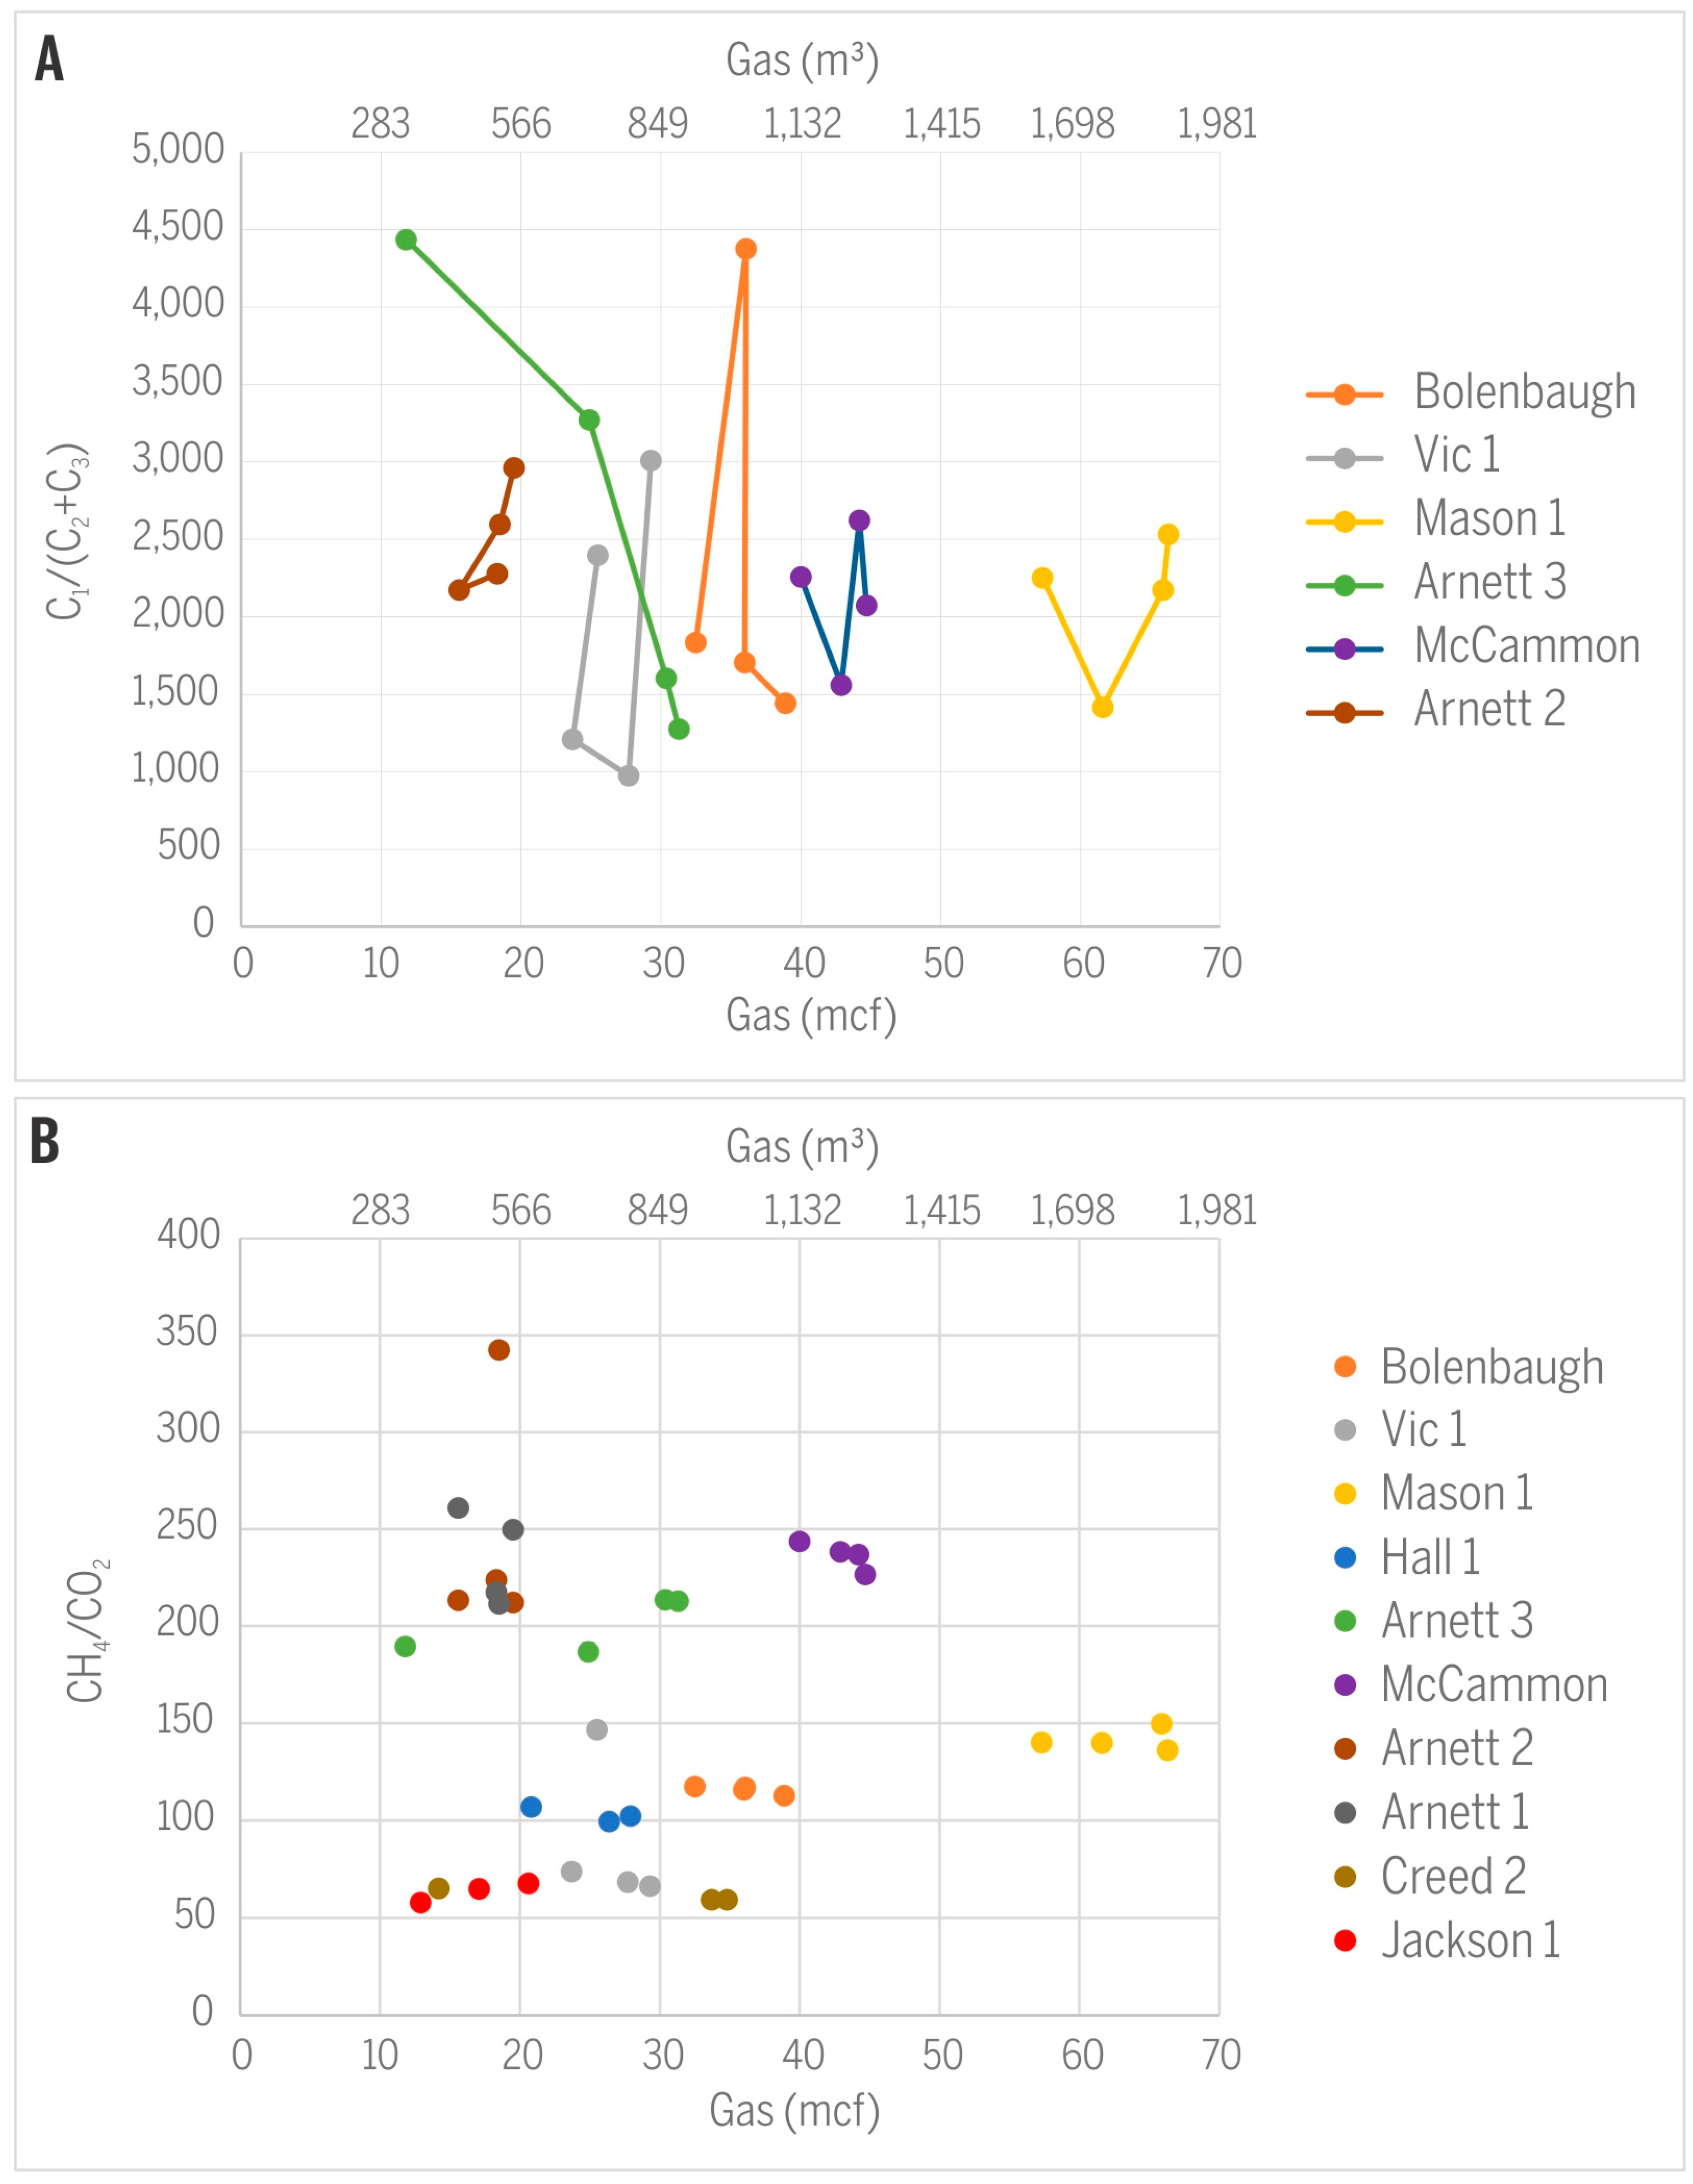
No systematic trend was observed for C1/(C2 + C3) or CH2/CO2 in relation to the amount of gas produced from the monitored wells (Figure 11). The absence of such trends may be caused by very similar gas production rates from wells during the sampling events and, in fact, during their major production periods. Therefore, the amount of gas produced cannot serve as a predictor of gas quality. The presence of microbes in the parental coalbeds further complicates predictions of gas composition and isotopic signatures. Consortia of bacteria and active microbial methanogenesis have been documented in CBM production waters from the same coalbeds in Sullivan County and close to the study area [5,6]. Methanotrophy generally enriches remaining methane with heavier isotopes 13C and 2H (e.g., [17]) and also decreases the C1/(C2 + C3) ratio. It is well documented that practically all CBM in Sullivan County is of microbial origin [4], but the extent of microbial activity varies depending on availability of microbes, water salinity, and other factors [25]. The isotopic signature of hydrocarbon gases, regardless of their origin, can additionally be modified by bacterial methanotrophy preferentially removing 12C and consequently shifting δ13CCH4 towards more positive values [11]. Our methane isotopic data for only two sampling events from well Creed 2 (mine void well) indicate a minor shift in δ13CCH4 from −61.1 to −59.2‰ and might suggest microbial methanotrophy, but the opposite direction of change in δ2HCH4 testifies against such a hypothesis (Table 1).
Increasing coal rank causes a shift in gas composition from wet to dry [17]. The coals studied in this study exclusively represent high-volatility bituminous B rank. Rank, therefore, cannot explain the observed compositional changes. In addition, the produced gases are almost exclusively of secondary microbial origin with no significant thermogenic contribution. Gas compositions do not show relationships with sample depth (Figure 3), coal thickness (Figure 4), or gas content in coal (Figure 5).
Our four sampling events cover one year of CBM production. It is possible that changes in gas properties would be stronger and more consistent over a longer period of time [17]. A similarly irregular variability of gas properties was observed for other wells in Sullivan County, Indiana, over a 27-month production period [5]. We agree with Strąpoć et al. [5] that this study’s relatively short period of monitoring does not allow extrapolation of observed changes of gas characteristics into either the past or the future. An impressive stability of the reservoir and little change in CBM gas quality was observed in the Upper Cretaceous Fruitland Formation of the San Juan Basin over a 35-year production period [26]. In contrast, for the same formation, a significant increase in CO2 was observed over about one year of production [19]. Also for the same formation, Scott et al. [17] demonstrated that dryness of gases differed among overpressured versus underpressured zones, with markedly higher ethane and lower CO2 concentrations in underpressured zones. These observations suggest that the importance of local reservoir conditions on gas properties may be comparable to long-term production-related changes in the reservoir. Therefore, the combination of these often-contrasting effects is likely responsible for irregular gas compositions and makes them difficult to predict. The complexity of geochemical and microbiological processes during gas production was also demonstrated for the Antrim Shale in the Michigan Basin [27].
4. Conclusions
This study examines changes in coalbed gas composition in a microbial system during 13 months of production from commercial CBM wells in the Illinois Basin. The main conclusion is that the changes are site-specific, often irregular and, consequently, difficult to interpret on the time scale of this study. More specifically, our results suggest that:
- (1)
- Trends in the CH4/CO2 ratio can vary over time and can follow different directions depending on the dominance of gas adsorption versus gas diffusion, conditions related largely to permeability and pressure changes in the reservoir. Both decreasing and increasing CH4/CO2 ratios were observed in the study area, in addition to production wells expressing irregular changes, the latter likely reflecting additional local factors unrelated to gas production.
- (2)
- Similar to the CH4/CO2 ratio, variations in C1/(C2 + C3) are site-specific. The decrease in CH4/CO2 over time for gases from Hancock, Arnett 1, and Arnett 3 wells can be explained by higher adsorption affinity and smaller mobility of C2+ gases compared to methane. In contrast, the opposite trend or irregular changes in gases from other wells suggest additional factors that are probably of a more local nature and not strictly related to gas production.
- (3)
- No trends over time were observed for the CH4/N2 ratio. Values of this ratio mainly reflect the nitrogen content of gas samples. The relatively large N2 content ranging from 1.56 to 4.81 vol % likely results from the nitrogen content of the parental coal, some contribution from atmospheric nitrogen dissolved in groundwater, and possibly minor air contamination introduced during gas sampling.
- (4)
- Methane δ13C values ranging from −55.3‰ to −61.1‰ and δ2H values of −201.2‰ to −218.5‰ indicate a microbial methanogenic origin via CO2 reduction. Changes in isotopic values over a three-month period are small and do not change the assessment of the gas origin. Isotopic data give no evidence for microbial methanotrophy, perhaps with the exception of gas from mine void well Creed 2 expressing a small shift towards less negative δ13C values.
Acknowledgments
This material is based upon work supported by the U.S. Department of Energy, Office of Science, Office of Basic Energy Sciences, Chemical Sciences, Geosciences, and Biosciences Division under Award Number DE-SC0006978. We are grateful to Larry Neely and Maverick Energy for access to production data and for permission to collect gas samples from CBM production wells. We also thank our former students Ling Gao, currently with Chevron Texaco, and Agnieszka Furmann, currently with Schlumberger, for help with sample collection and analysis.
Author Contributions
All three authors participated in sample collection, sample analysis, data interpretation, as well as preparation of the manuscript.
Conflicts of Interest
The authors declare no conflict of interest.
References
- Damberger, H.H. Coalification pattern of the Illinois Basin. Econ. Geol. 1971, 66, 488–494. [Google Scholar] [CrossRef]
- Mastalerz, M.; Drobniak, A.; Rupp, J.; Shaffer, N. Characterization of Indiana’s Coal Resource: Availability of the Reserves, Physical and Chemical Properties of the Coal, and Present and Potential Uses; Indiana Geological Survey: Bloomington, IN, USA, 2009. [Google Scholar]
- Macke, D.L. Illinois basin province. In National Assessment of United States Oil and Gas Resources—Results, Methodology, and Supporting Data; Gautier, D.L., Dolton, G.L., Takahashi, K.I., Varnes, K.L., Eds.; U.S. Geological Survey Digital Data Series 30; USGS: Reston, VA, USA, 1995. [Google Scholar]
- Strąpoć, D.; Mastalerz, M.; Eble, C.; Schimmelmann, A. Characterization of the origin of coalbed gases in the southwestern Illinois Basin by compound-specific carbon and hydrogen stable isotope ratios. Organ. Geochem. 2007, 38, 267–287. [Google Scholar] [CrossRef]
- Strąpoć, D.; Mastalerz, M.; Schimmelmann, A.; Drobniak, A.; Hedges, S. Variability of geochemical properties in a microbially dominated coalbed gas system from the eastern margin of the Illinois Basin, USA. Int. J. Coal Geol. 2008, 76, 98–110. [Google Scholar] [CrossRef]
- Strąpoć, D.; Picardal, F.; Turich, C.; Schaperdott, I.; Macalady, J.L.; Lipp, J.S.; Lin, Y.-S.; Ertefai, T.F.; Schubotz, F.; Hinrichs, K.-U.; et al. Methane-producing microbial community in a coal bed of the Illinois Basin. J. Appl. Environ. Microbiol. 2008, 74, 2424–2432. [Google Scholar]
- McIntosh, J.C.; Walter, L.M.; Martini, A.M. Pleistocene recharge to midcontinent basins: Effects on salinity structure and microbial gas generation. Geochim. Cosmochim. Acta 2002, 66, 1681–1700. [Google Scholar] [CrossRef]
- Harper, D. Coalbed Methane in Indiana: Indiana Geological Survey Occasional Paper; Indiana Geological Survey: Bloomington, IN, USA, 1991; Volume 56, p. 18. [Google Scholar]
- Drobniak, A.; Mastalerz, M.; Rupp, J.; Eaton, N. Coalbed gas potential of the Seelyville Coal in Indiana. Int. J. Coal Geol. 2004, 57, 265–282. [Google Scholar] [CrossRef]
- Karacan, C.O.; Drobniak, A.; Mastalerz, M. Coal bed reservoir simulation with geostatistical property realizations for simultaneous multi-well production history matching: A case study from Illinois Basin, Indiana, USA. J. Coal Geol. 2014, 131, 71–89. [Google Scholar] [CrossRef]
- Whiticar, M.J.; Faber, E.; Schoell, M. Biogenic methane formation in marine and freshwater environments: CO2 reduction vs. acetate fermentation—Isotopic evidence. Geochim. Cosmochim. Acta 1986, 50, 693–709. [Google Scholar] [CrossRef]
- Vinson, D.S.; Blair, N.E.; Martini, A.M.; Larter, S.; Orem, W.H.; McIntosh, J.C. Microbial methane from in situ biodegradation of coal and shale: A review and reevaluation of hydrogen and carbon isotope signatures. Chem. Geol. 2017, 453, 128–145. [Google Scholar] [CrossRef]
- Reeves, S.R.; Decker, A.D. A reservoir simulation investigation into the interaction of in-situ stress, pore pressure, and coal rank on coalbed methane exploration strategy. In Proceedings of the 1991 SPE Gas Technology Symposium, Houston, TX, USA, 23–25 January 1991. SPE Paper 21490. [Google Scholar]
- Kaiser, W.R.; Hamilton, D.S.; Scott, A.R.; Tyler, R.; Finley, R.J. Geological and hydrological controls on the producibility of coalbed methane. J. Geol. Soc. Lond. 1994, 151, 417. [Google Scholar] [CrossRef]
- Roadifer, R.D.; Moore, T.R.; Raterman, K.T.; Farnan, R.A.; Crabtree, B.J. Coalbed methane parametric study: What is really important to production and when? In Proceedings of the 2003 SPE Annual Technical Conference and Exhibition, Denver, CO, USA, 5–8 October 2003. SPE Paper 84425. [Google Scholar]
- Arri, L.E.; Yee, D.; Morgan, W.D.; Jeansonne, M.W. Modeling coalbed methane production with binary gas sorption. In Proceedings of the SPE Rocky Mountain Regional Meeting, Casper, Wyoming, 18–21 May 1992. SPE 24363-MS. [Google Scholar]
- Scott, A.R.; Kaiser, W.R.; Ayers, W.B., Jr. Thermogenic and secondary biogenic gases, San Juan Basin, Colorado and New Mexico–Implications for coalbed gas producibility. AAPG Bull. 1994, 78, 1186–1209. [Google Scholar]
- Strąpoć, D.; Schimmelmann, A.; Mastalerz, M. Carbon isotopic fractionation of CH4 and CO2 during canister desorption of coal. Organ. Geochem. 2006, 37, 152–164. [Google Scholar] [CrossRef]
- Cui, X.; Bustin, R.M. Controls of coal fabric on coalbed gas production and compositional shift in both field production and canister desorption tests. Soc. Petrol. Eng. J. 2006, 11, 111–119. [Google Scholar] [CrossRef]
- Thompson, T.A.; Sowder, K.H.; Johnson, M. Generalized Stratigraphic Column of Indiana Bedrock: Indiana Geological Survey Poster; Indiana Geological Survey: Bloomington, IN, USA, 2013; Volume 6. [Google Scholar]
- Jin, H.; Schimmelmann, A.; Mastalerz, M.; Pope, J.; Moore, T.A. Coalbed gas desorption in canisters: Consumption of trapped atmospheric oxygen and implications for measured gas quality. J. Coal Geol. 2010, 81, 64–72. [Google Scholar] [CrossRef]
- Drobniak, A.; Mastalerz, M. The Indiana Geological Survey Coal Stratigraphic Database: The Database and Interactive Map: Indiana Geological Survey Report of Progress 39, CD-ROM; Indiana Geological Survey: Bloomington, IN, USA, 2012. [Google Scholar]
- Cui, X.; Bustin, R.M.; Dipple, G. Selective transport of CO2, CH4, and N2 in coals: Insights from modeling of experimental gas adsorption data. Fuel 2004, 83, 293–303. [Google Scholar] [CrossRef]
- Strąpoć, D.; Mastalerz, M.; Dawson, K.; Macalady, J.; Callaghan, A.V.; Wawrik, B.; Turich, C.; Ashby, M. Biogeochemistry of coal-bed methane. Annu. Earth Planet. Rev. 2011, 39, 617–656. [Google Scholar] [CrossRef]
- Gao, L.; Brassell, S.C.; Mastalerz, M.; Schimmelmann, A. Microbial degradation of sedimentary organic matter associated with shale gas and coalbed methane in Eastern Illinois Basin (Indiana), USA. J. Coal Geol. 2013, 107, 152–164. [Google Scholar] [CrossRef]
- Hale, B.H.; Firth, C.H. Production history of the San Juan 32–7 Unit No. 6 well, Northern San Juan Basin, New Mexico; Geology and Coal-Bed Methane Resources of the Northern San Juan Basin and New Mexico, 2009 Rocky Mountain Association of Geologists: Denver, CO, USA, 1988; pp. 199–204. [Google Scholar]
- Kirk, M.F.; Martini, A.M.; Breecker, D.O.; Colman, D.R.; Takacs-Vesbach, C.; Petsch, S.T. Impact of commercial natural gas production on geochemistry and microbiology in a shale-gas reservoir. Chem. Geol. 2012, 332, 15–25. [Google Scholar] [CrossRef]
Figure 1.
Lithostratigraphy of the Pennsylvanian section of the Illinois Basin (modified from [20]).
Figure 1.
Lithostratigraphy of the Pennsylvanian section of the Illinois Basin (modified from [20]).
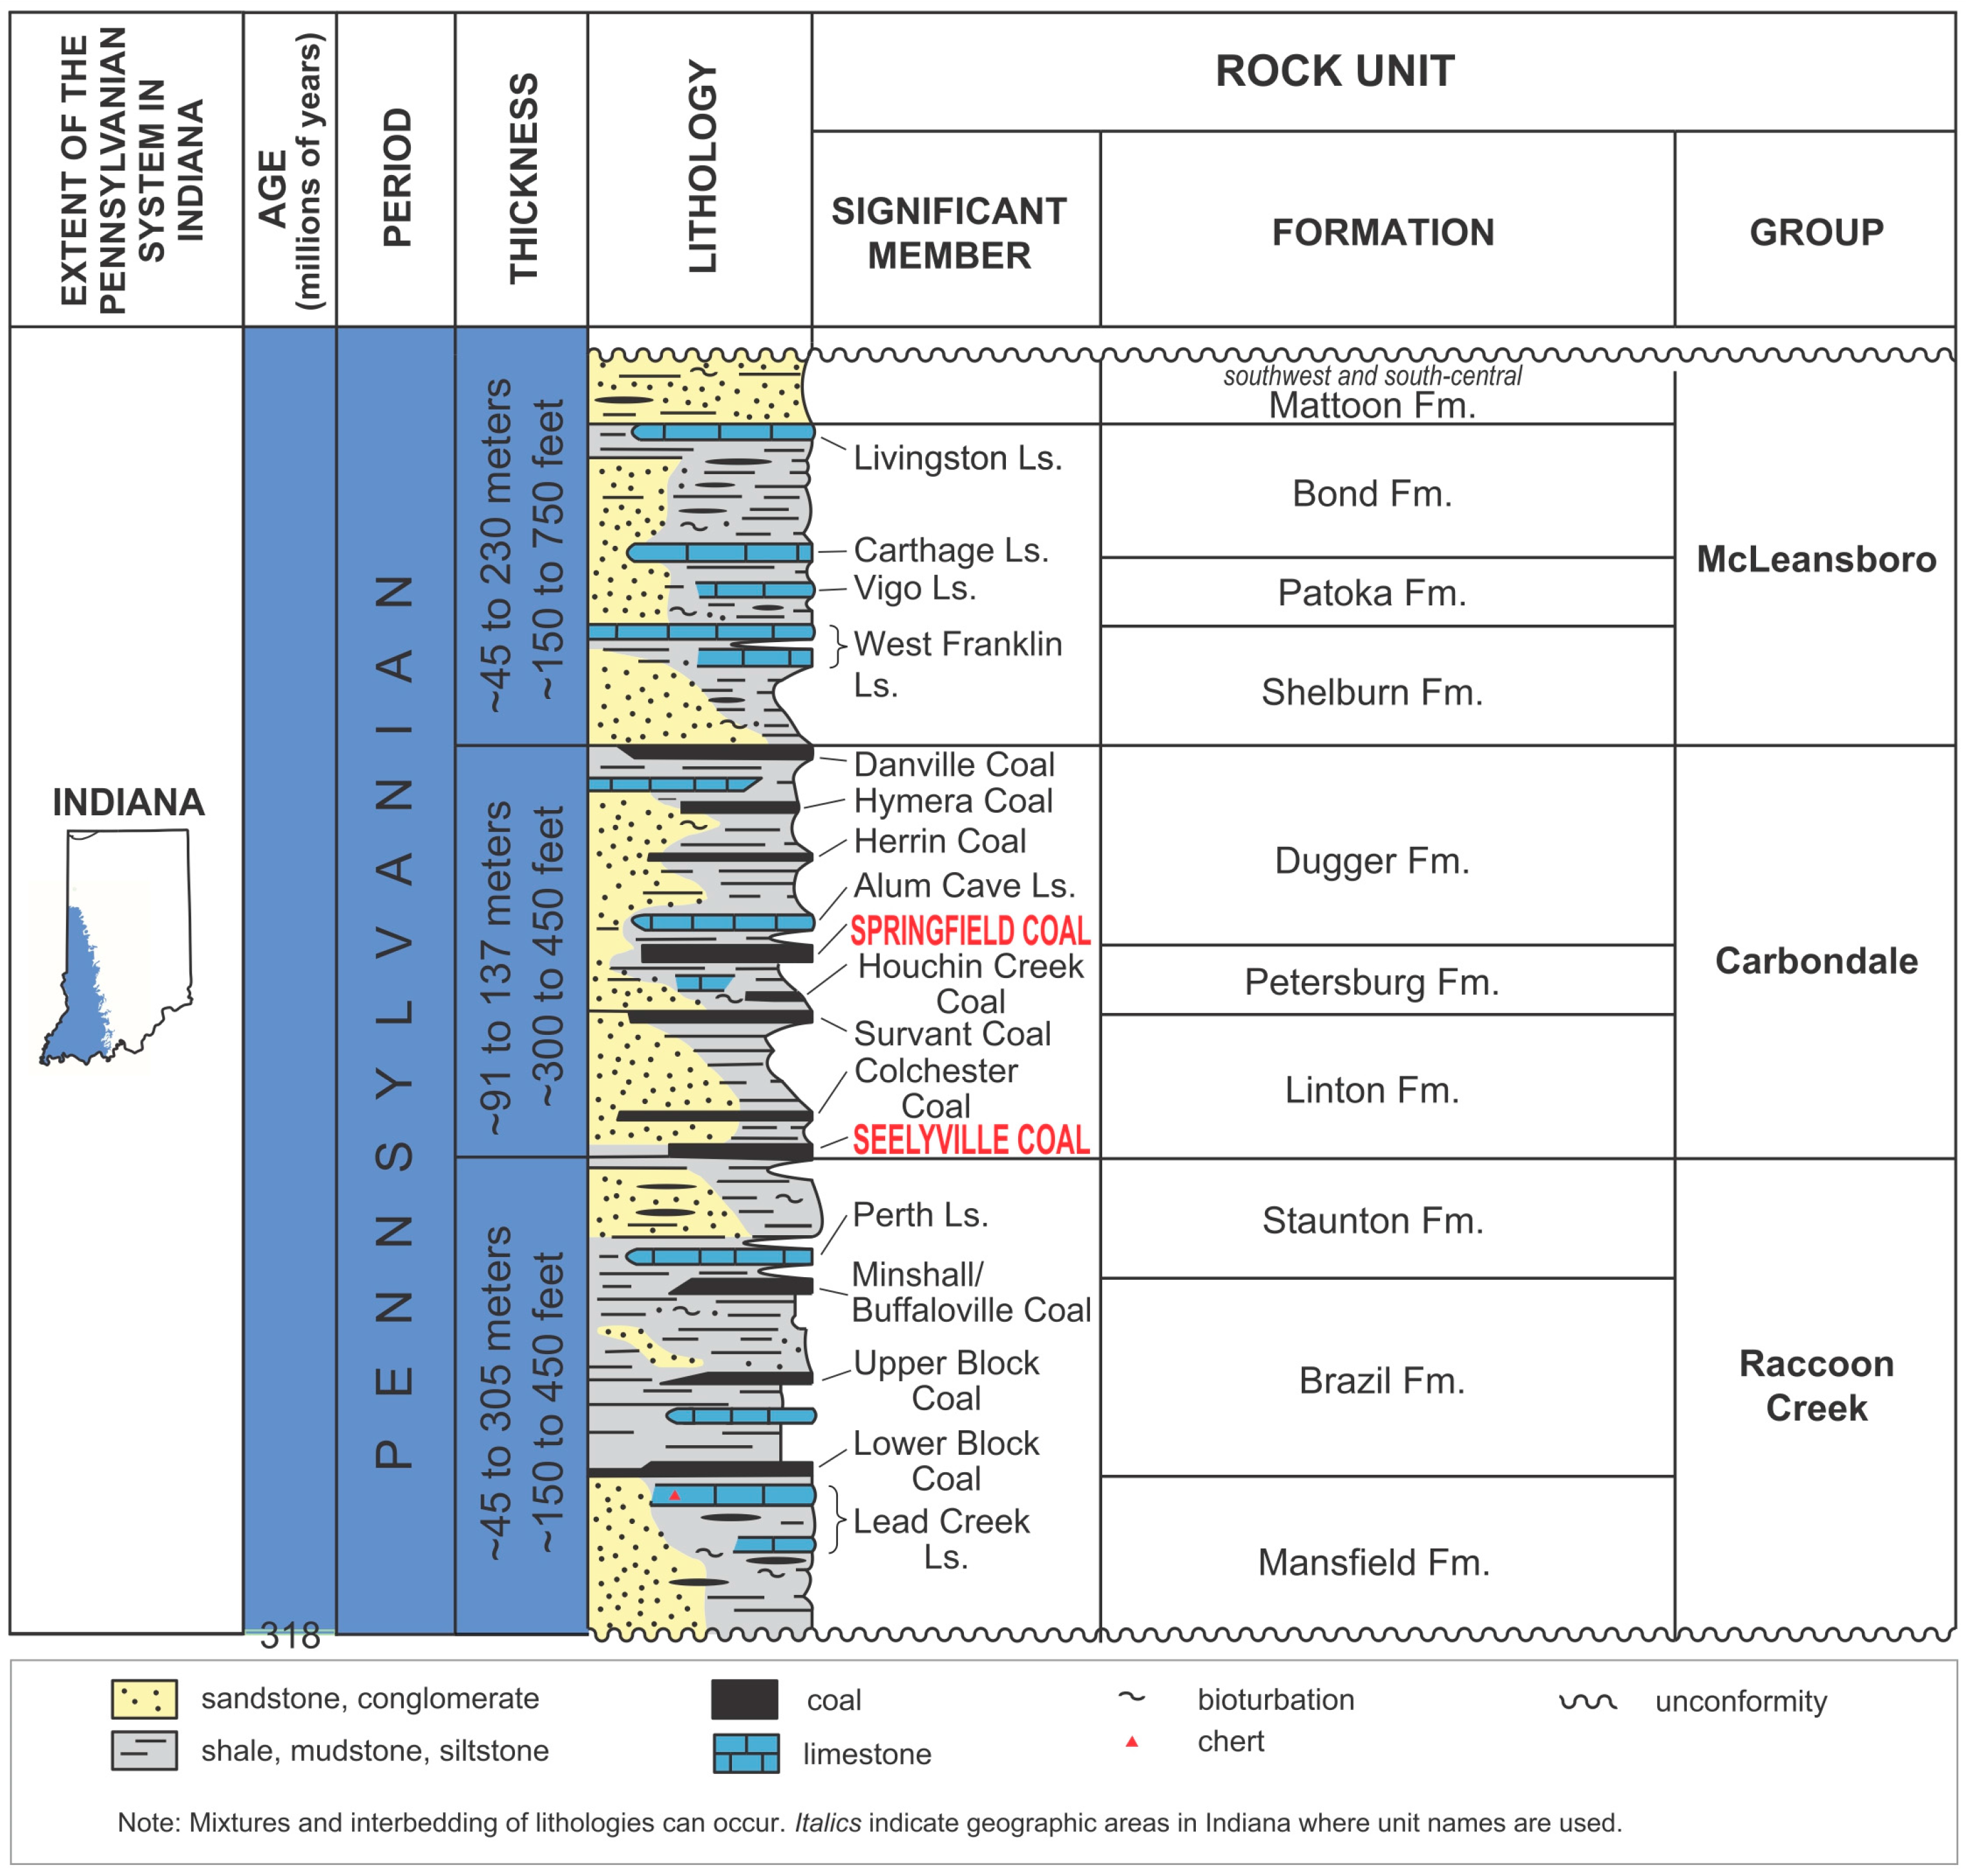
Figure 2.
Map showing the names and locations of the coalbed methane (CBM) wells analyzed in this study. Year when the gas production began is indicated under each name.
Figure 2.
Map showing the names and locations of the coalbed methane (CBM) wells analyzed in this study. Year when the gas production began is indicated under each name.
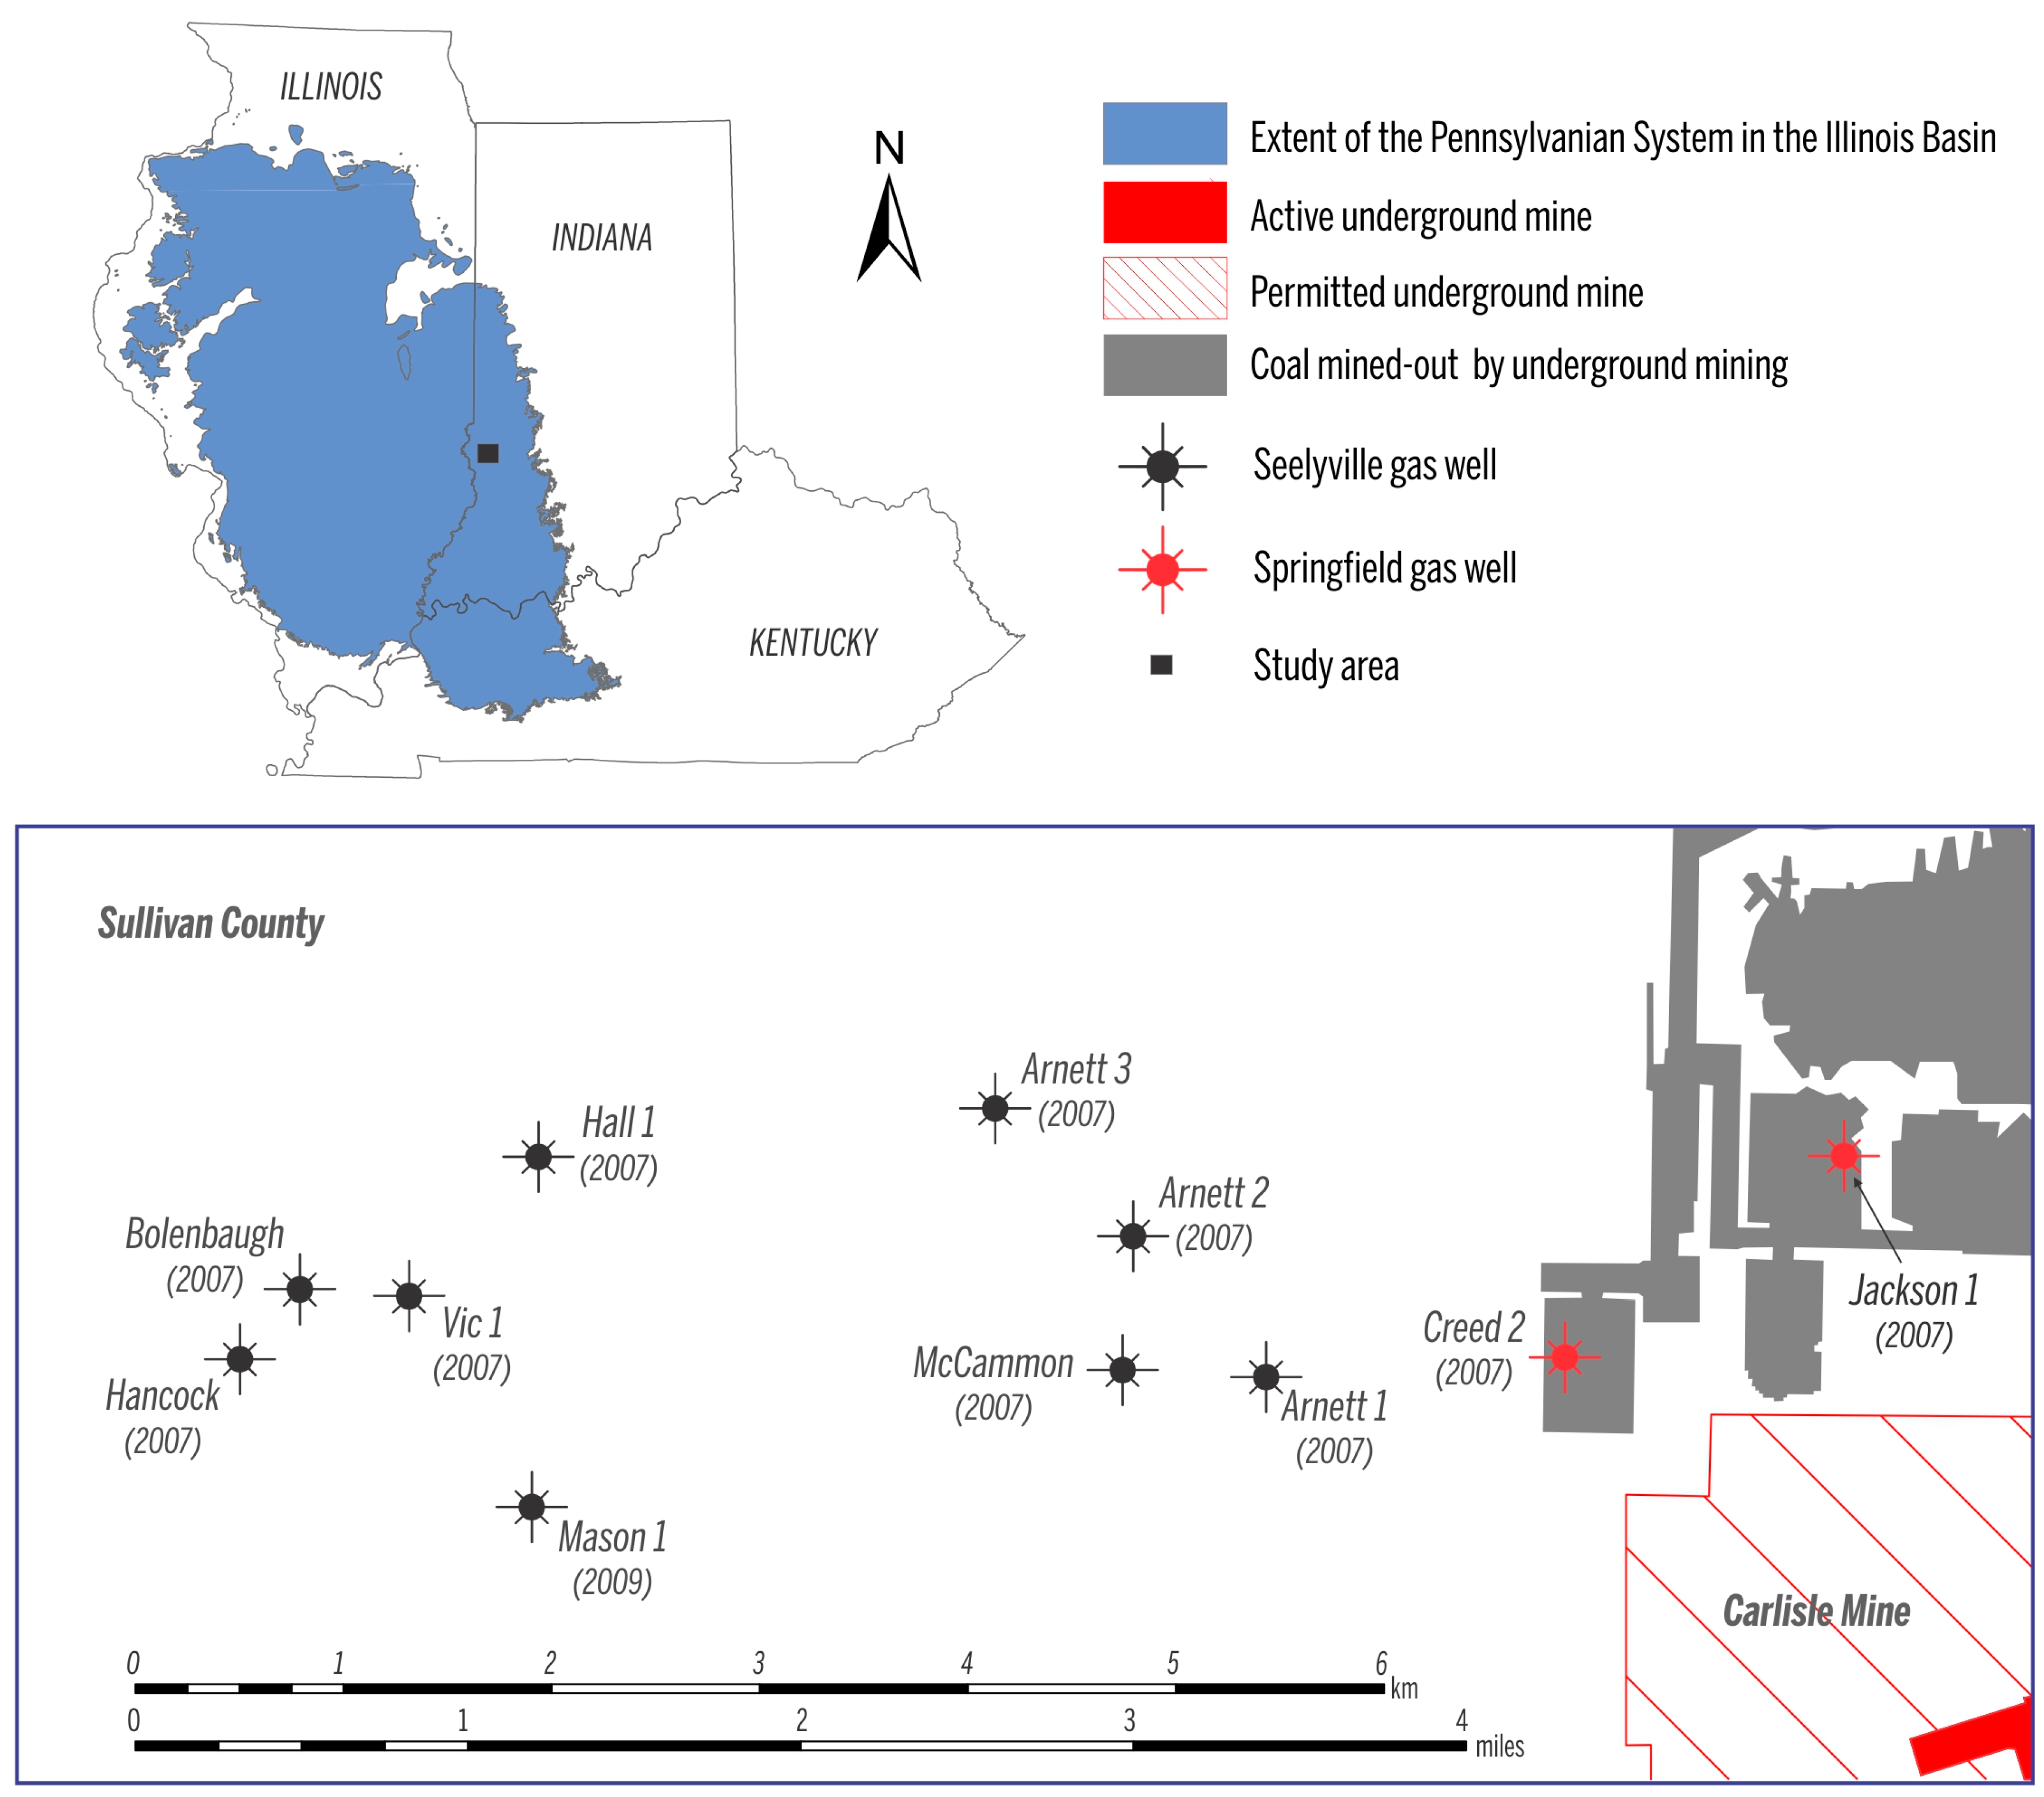
Figure 3.
Depth ranges of the Springfield Coal Member (A); and the Seelyville Coal Member (B). Data source for mapping retrieved from [22].
Figure 3.
Depth ranges of the Springfield Coal Member (A); and the Seelyville Coal Member (B). Data source for mapping retrieved from [22].
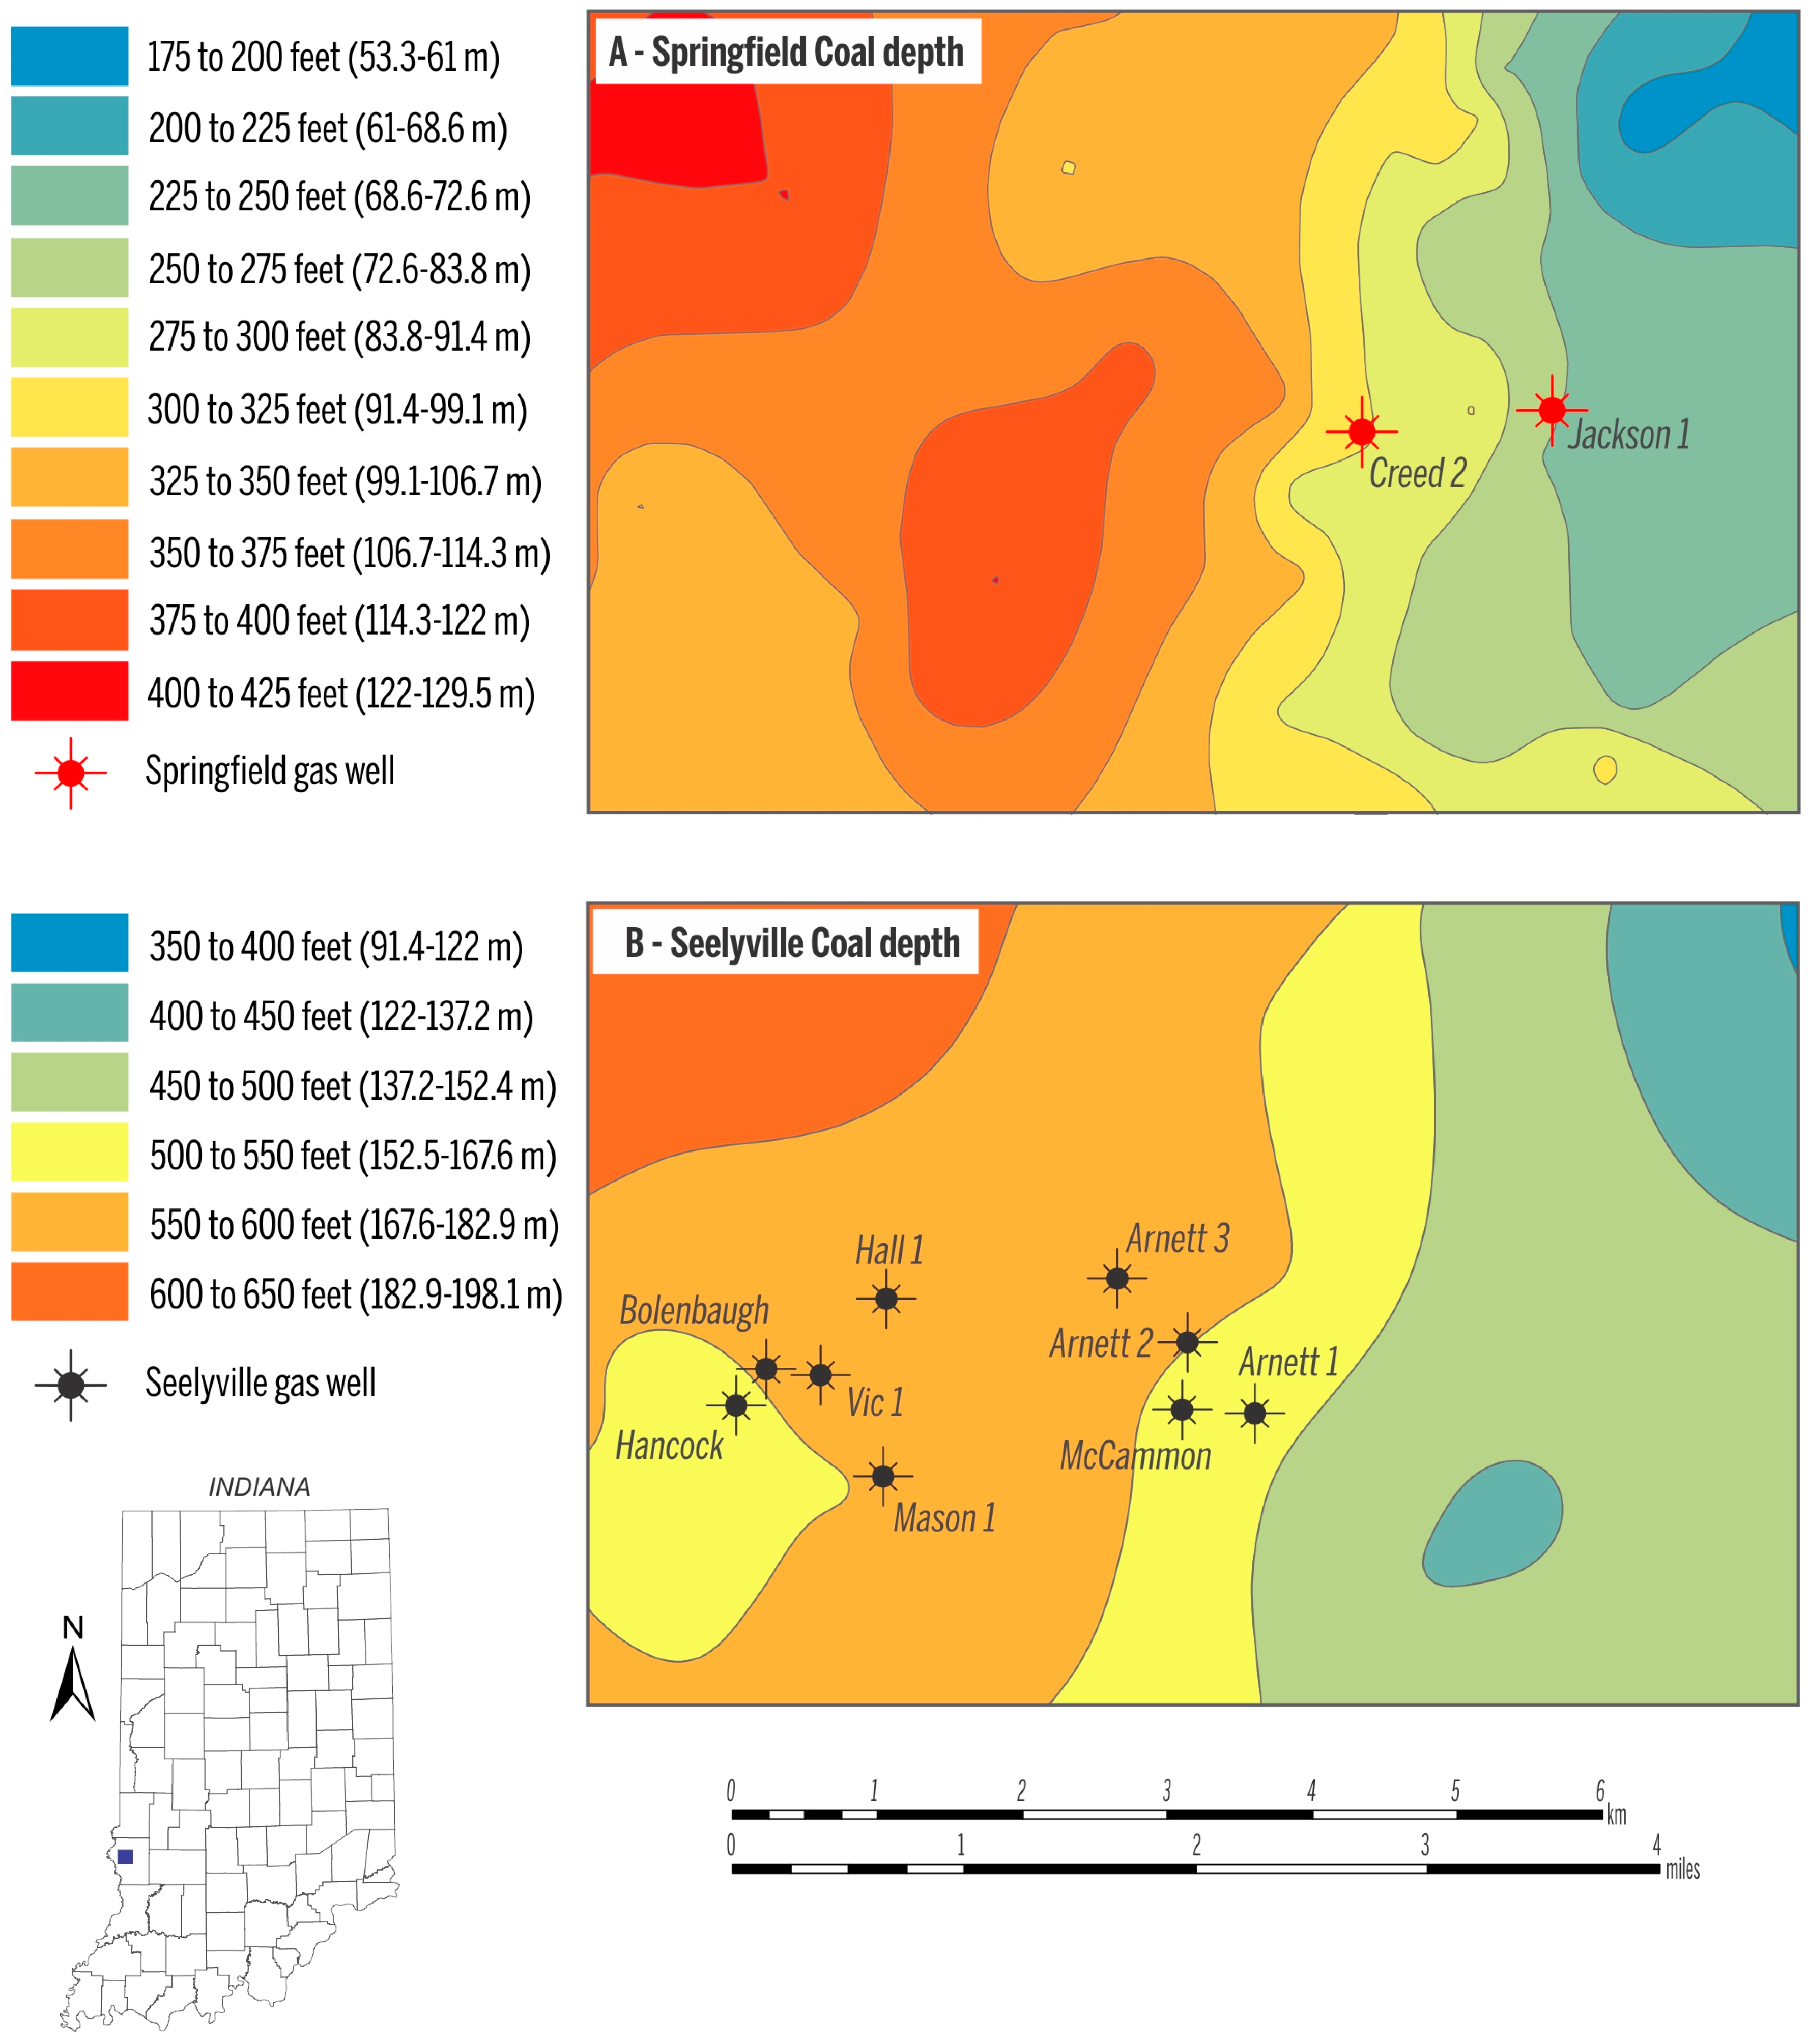
Figure 4.
Thickness of the Springfield Coal (A); and the Seelyville Coal Member (B). Data source for mapping retrieved from [22].
Figure 4.
Thickness of the Springfield Coal (A); and the Seelyville Coal Member (B). Data source for mapping retrieved from [22].
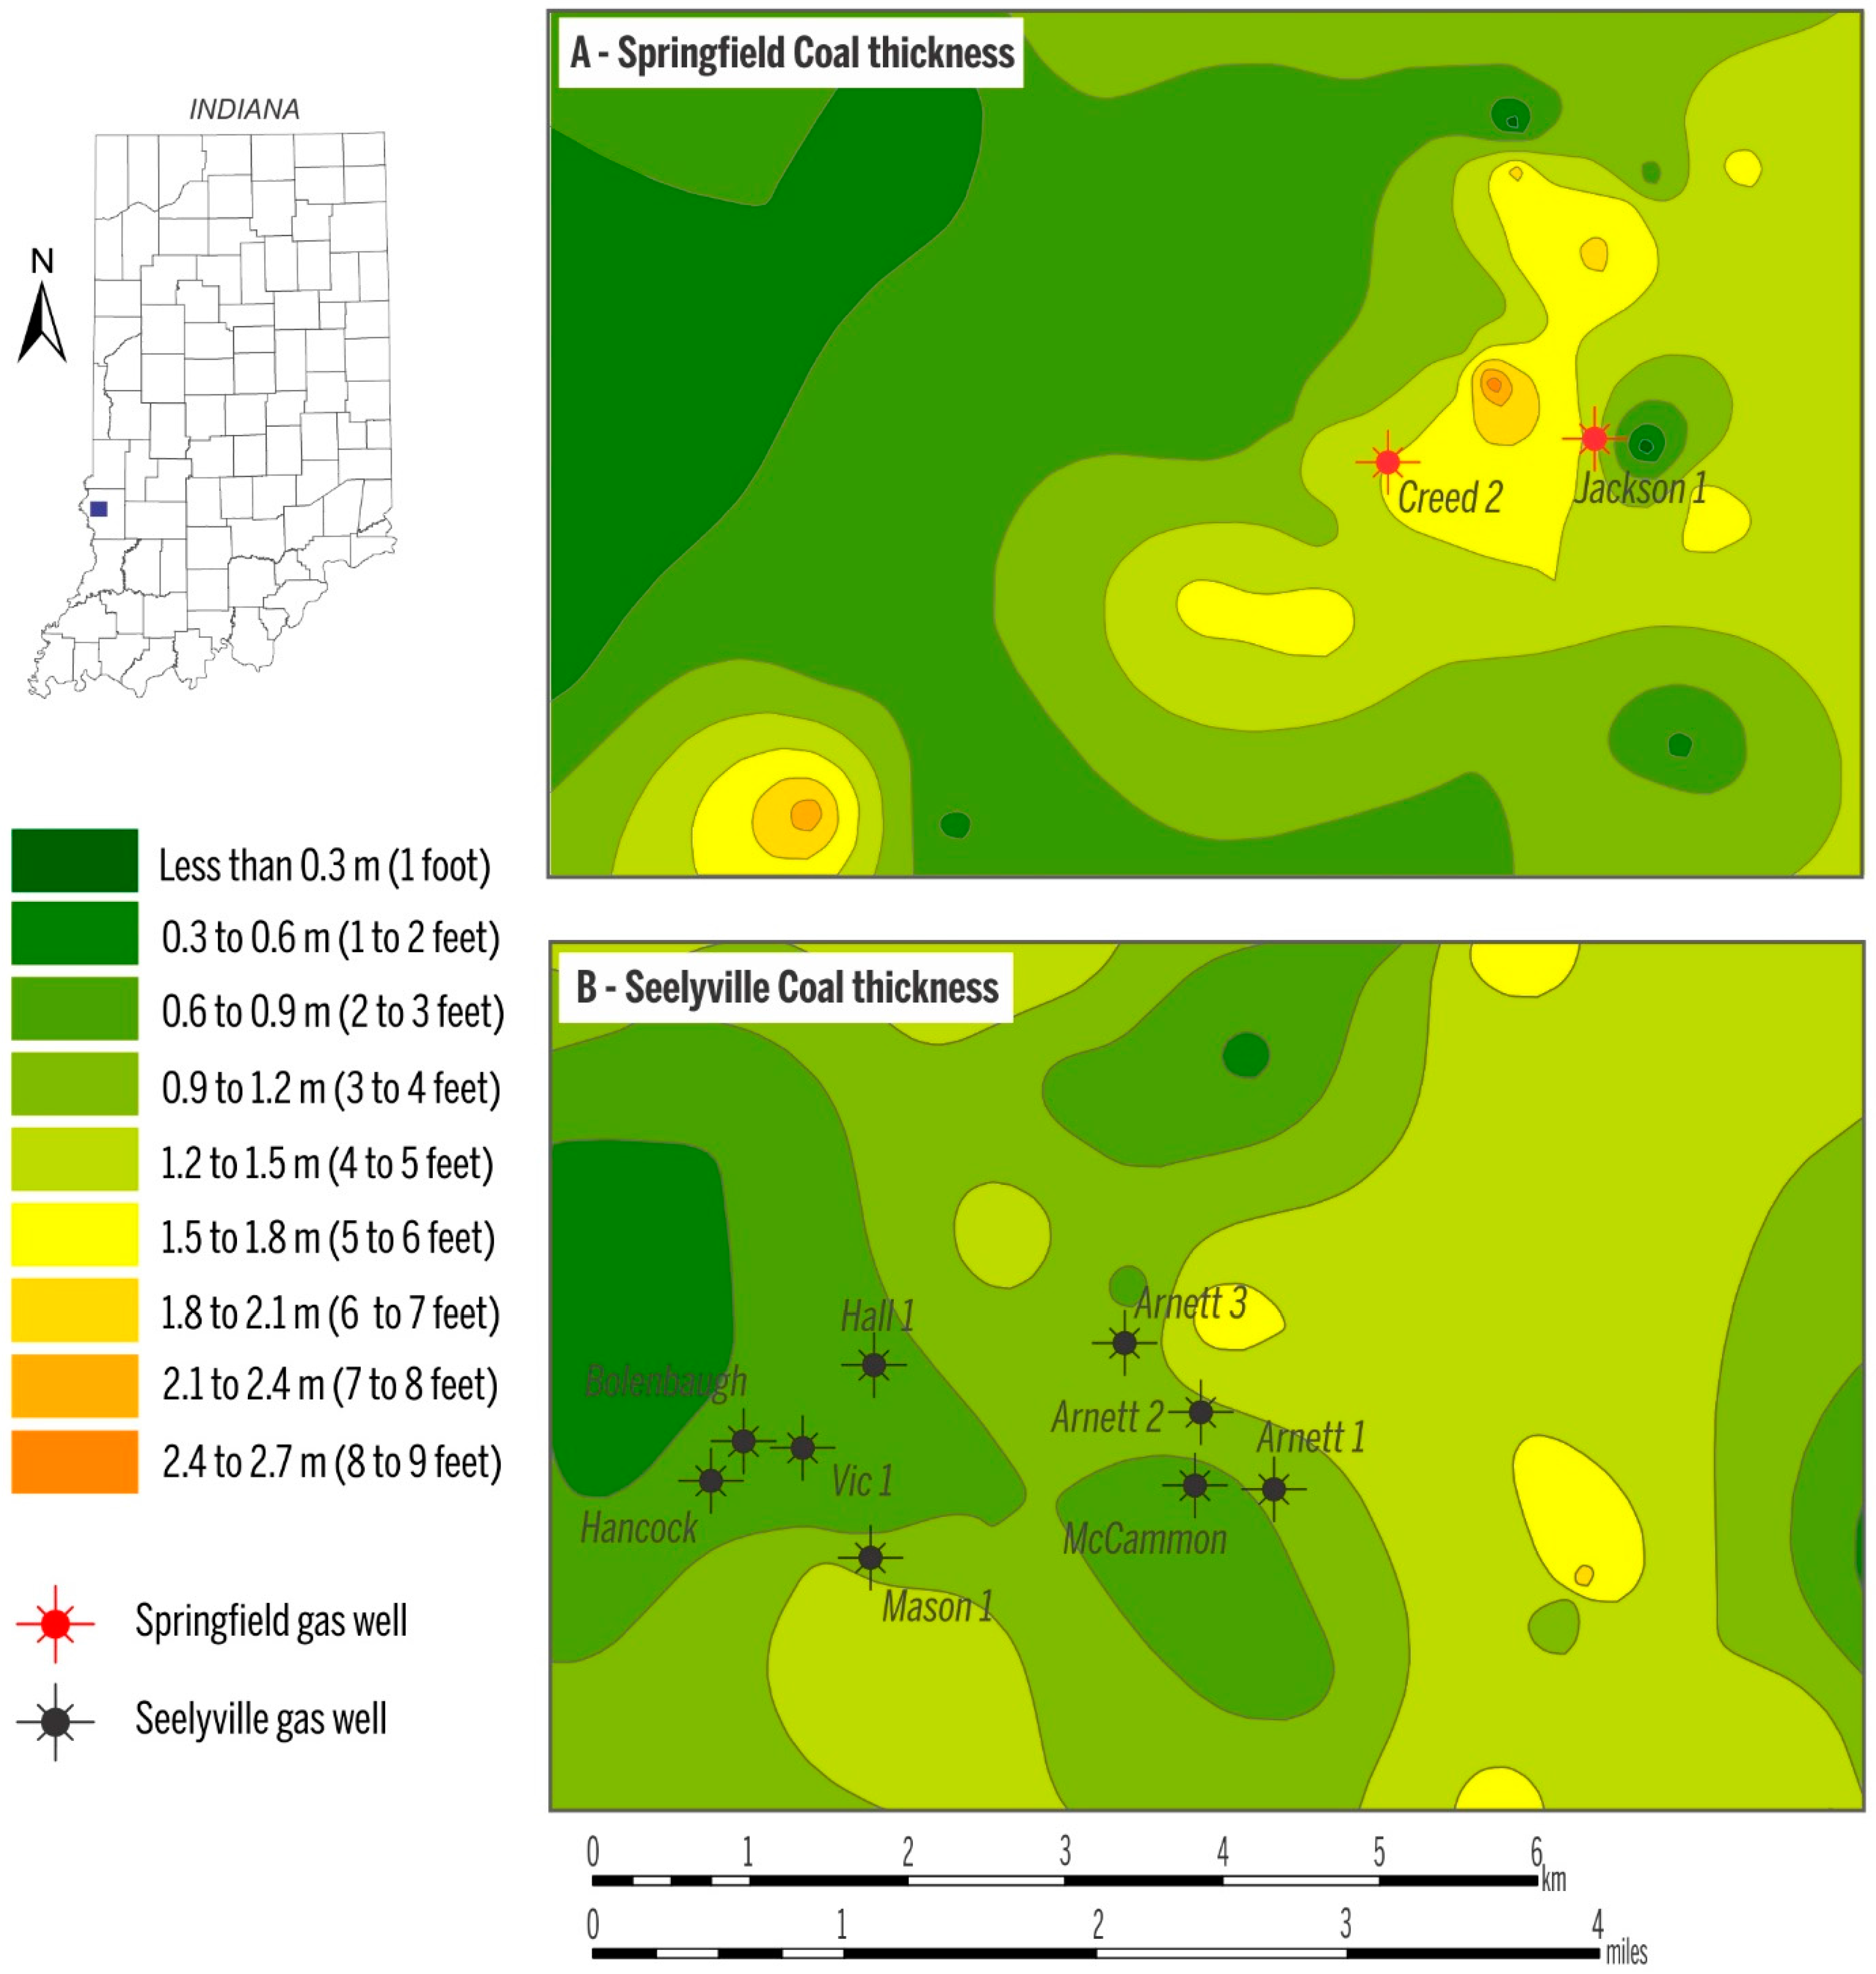
Figure 5.
Gas content of the Seelyville Coal.
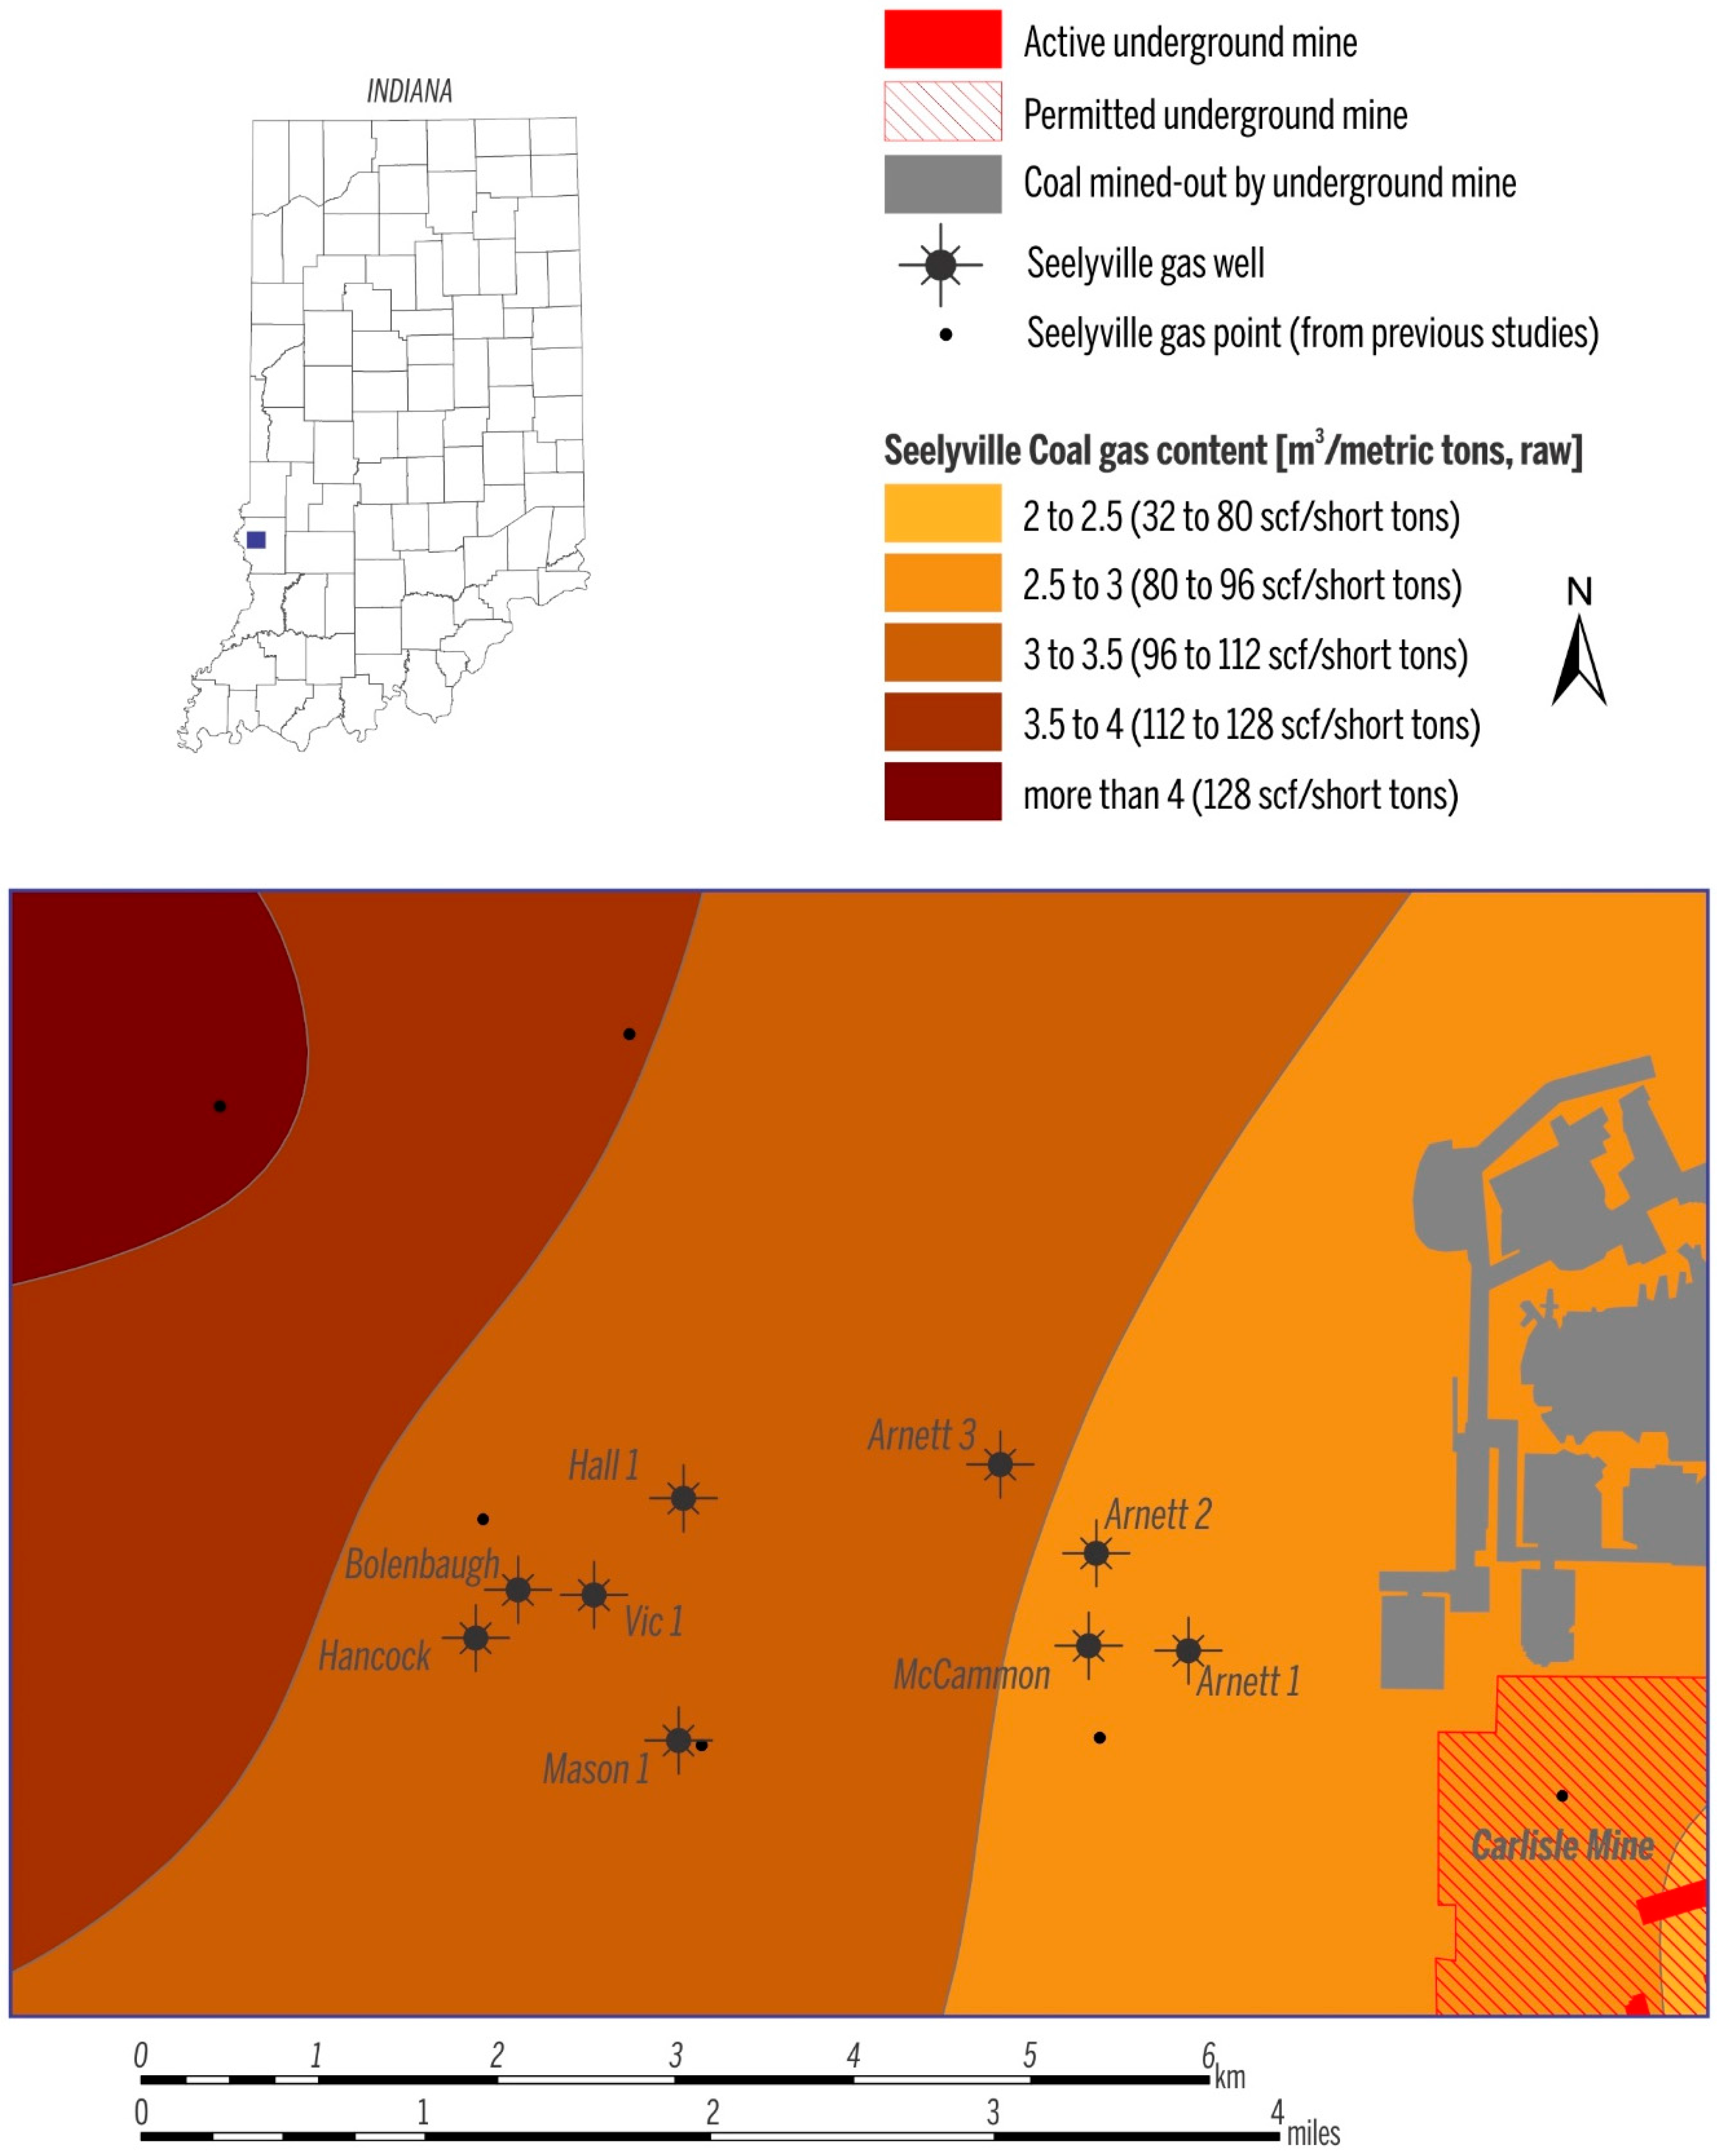
Figure 6.
Gas production in the Creed 2 (A); and McCammon (B) wells. Sampling events are marked by red lines. 1 mcf (thousand cubic feet) = 28.32 m3.
Figure 6.
Gas production in the Creed 2 (A); and McCammon (B) wells. Sampling events are marked by red lines. 1 mcf (thousand cubic feet) = 28.32 m3.
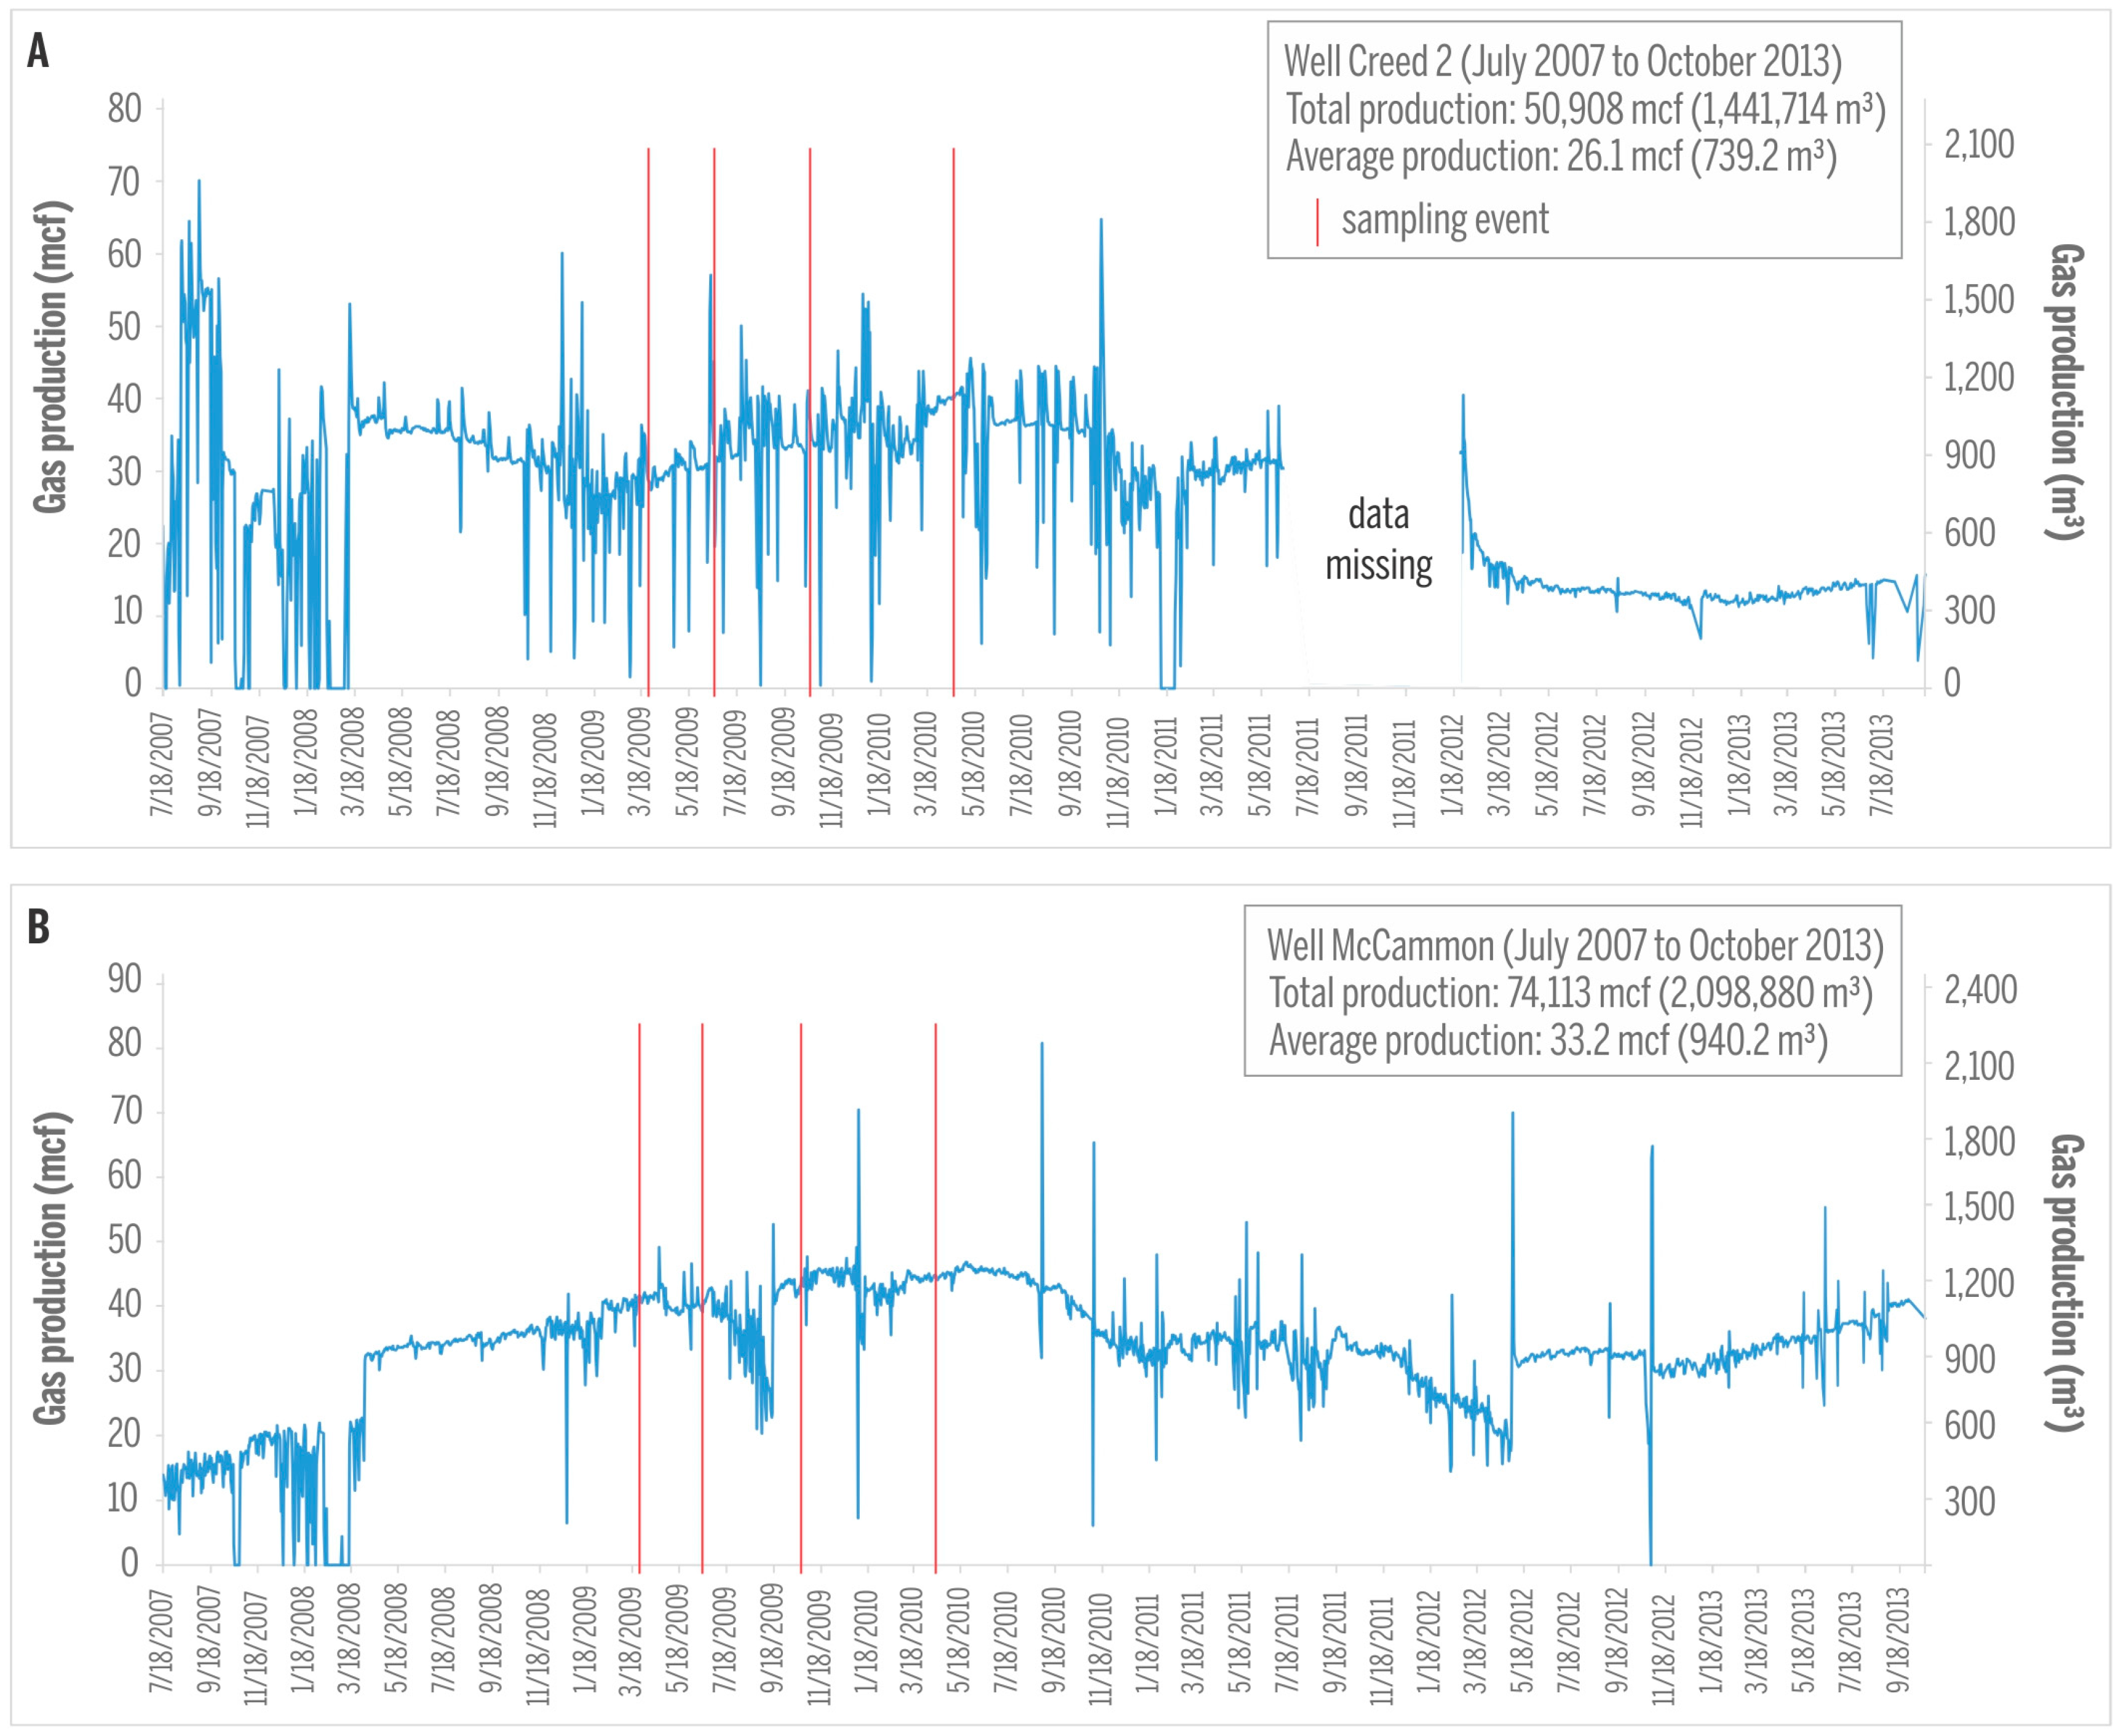
Figure 7.
Geochemical fields of origin of gas samples from studied wells. (A) C1/(C2 + C3) and δ13C of methane document 100% biogenic gas; (B) δ13C and δ2H of methane indicate methanogenic CO2-reduction pathway. Samples from other areas are included for comparison. Modified from [24].
Figure 7.
Geochemical fields of origin of gas samples from studied wells. (A) C1/(C2 + C3) and δ13C of methane document 100% biogenic gas; (B) δ13C and δ2H of methane indicate methanogenic CO2-reduction pathway. Samples from other areas are included for comparison. Modified from [24].

Figure 8.
Variations in C1/(C2 + C3) ratios along the history of CBM production: (A) decreasing trend; (B) increasing trend; (C) irregular variations.
Figure 8.
Variations in C1/(C2 + C3) ratios along the history of CBM production: (A) decreasing trend; (B) increasing trend; (C) irregular variations.
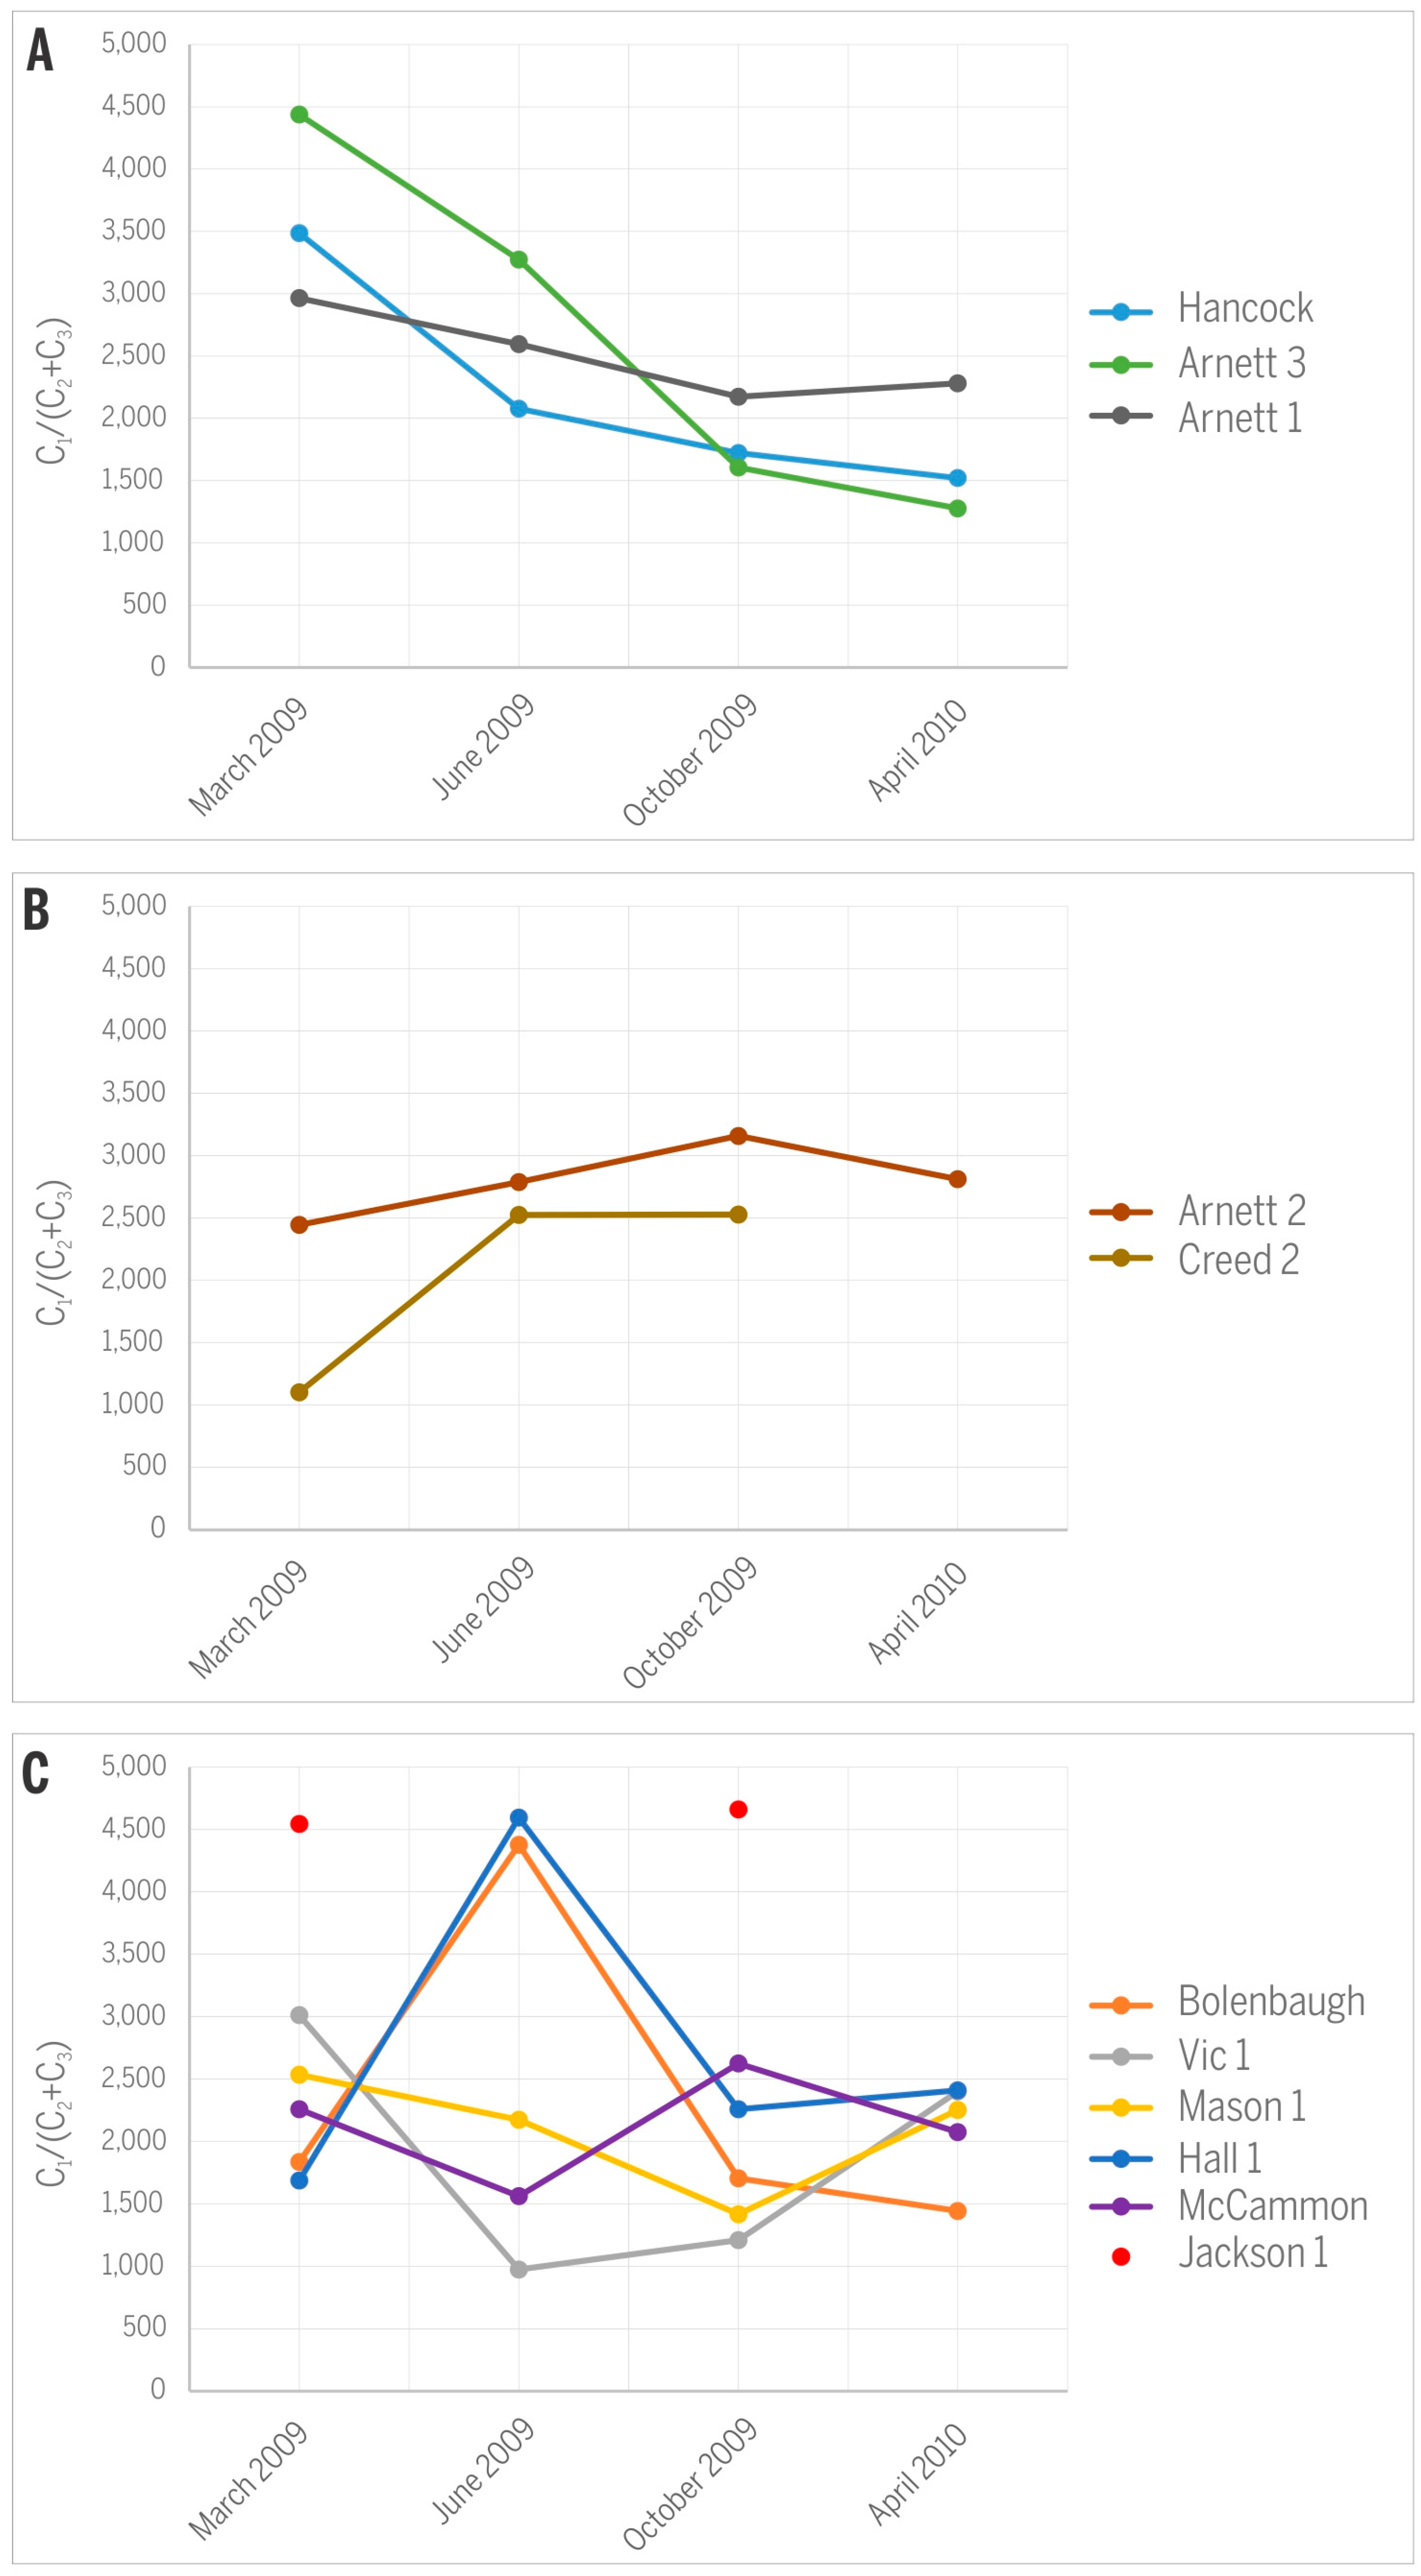
Figure 9.
Variations in CH4/CO2 ratios along the history of CBM production: (A) slightly decreasing trend; (B) increasing trend; (C) irregular variations.
Figure 9.
Variations in CH4/CO2 ratios along the history of CBM production: (A) slightly decreasing trend; (B) increasing trend; (C) irregular variations.
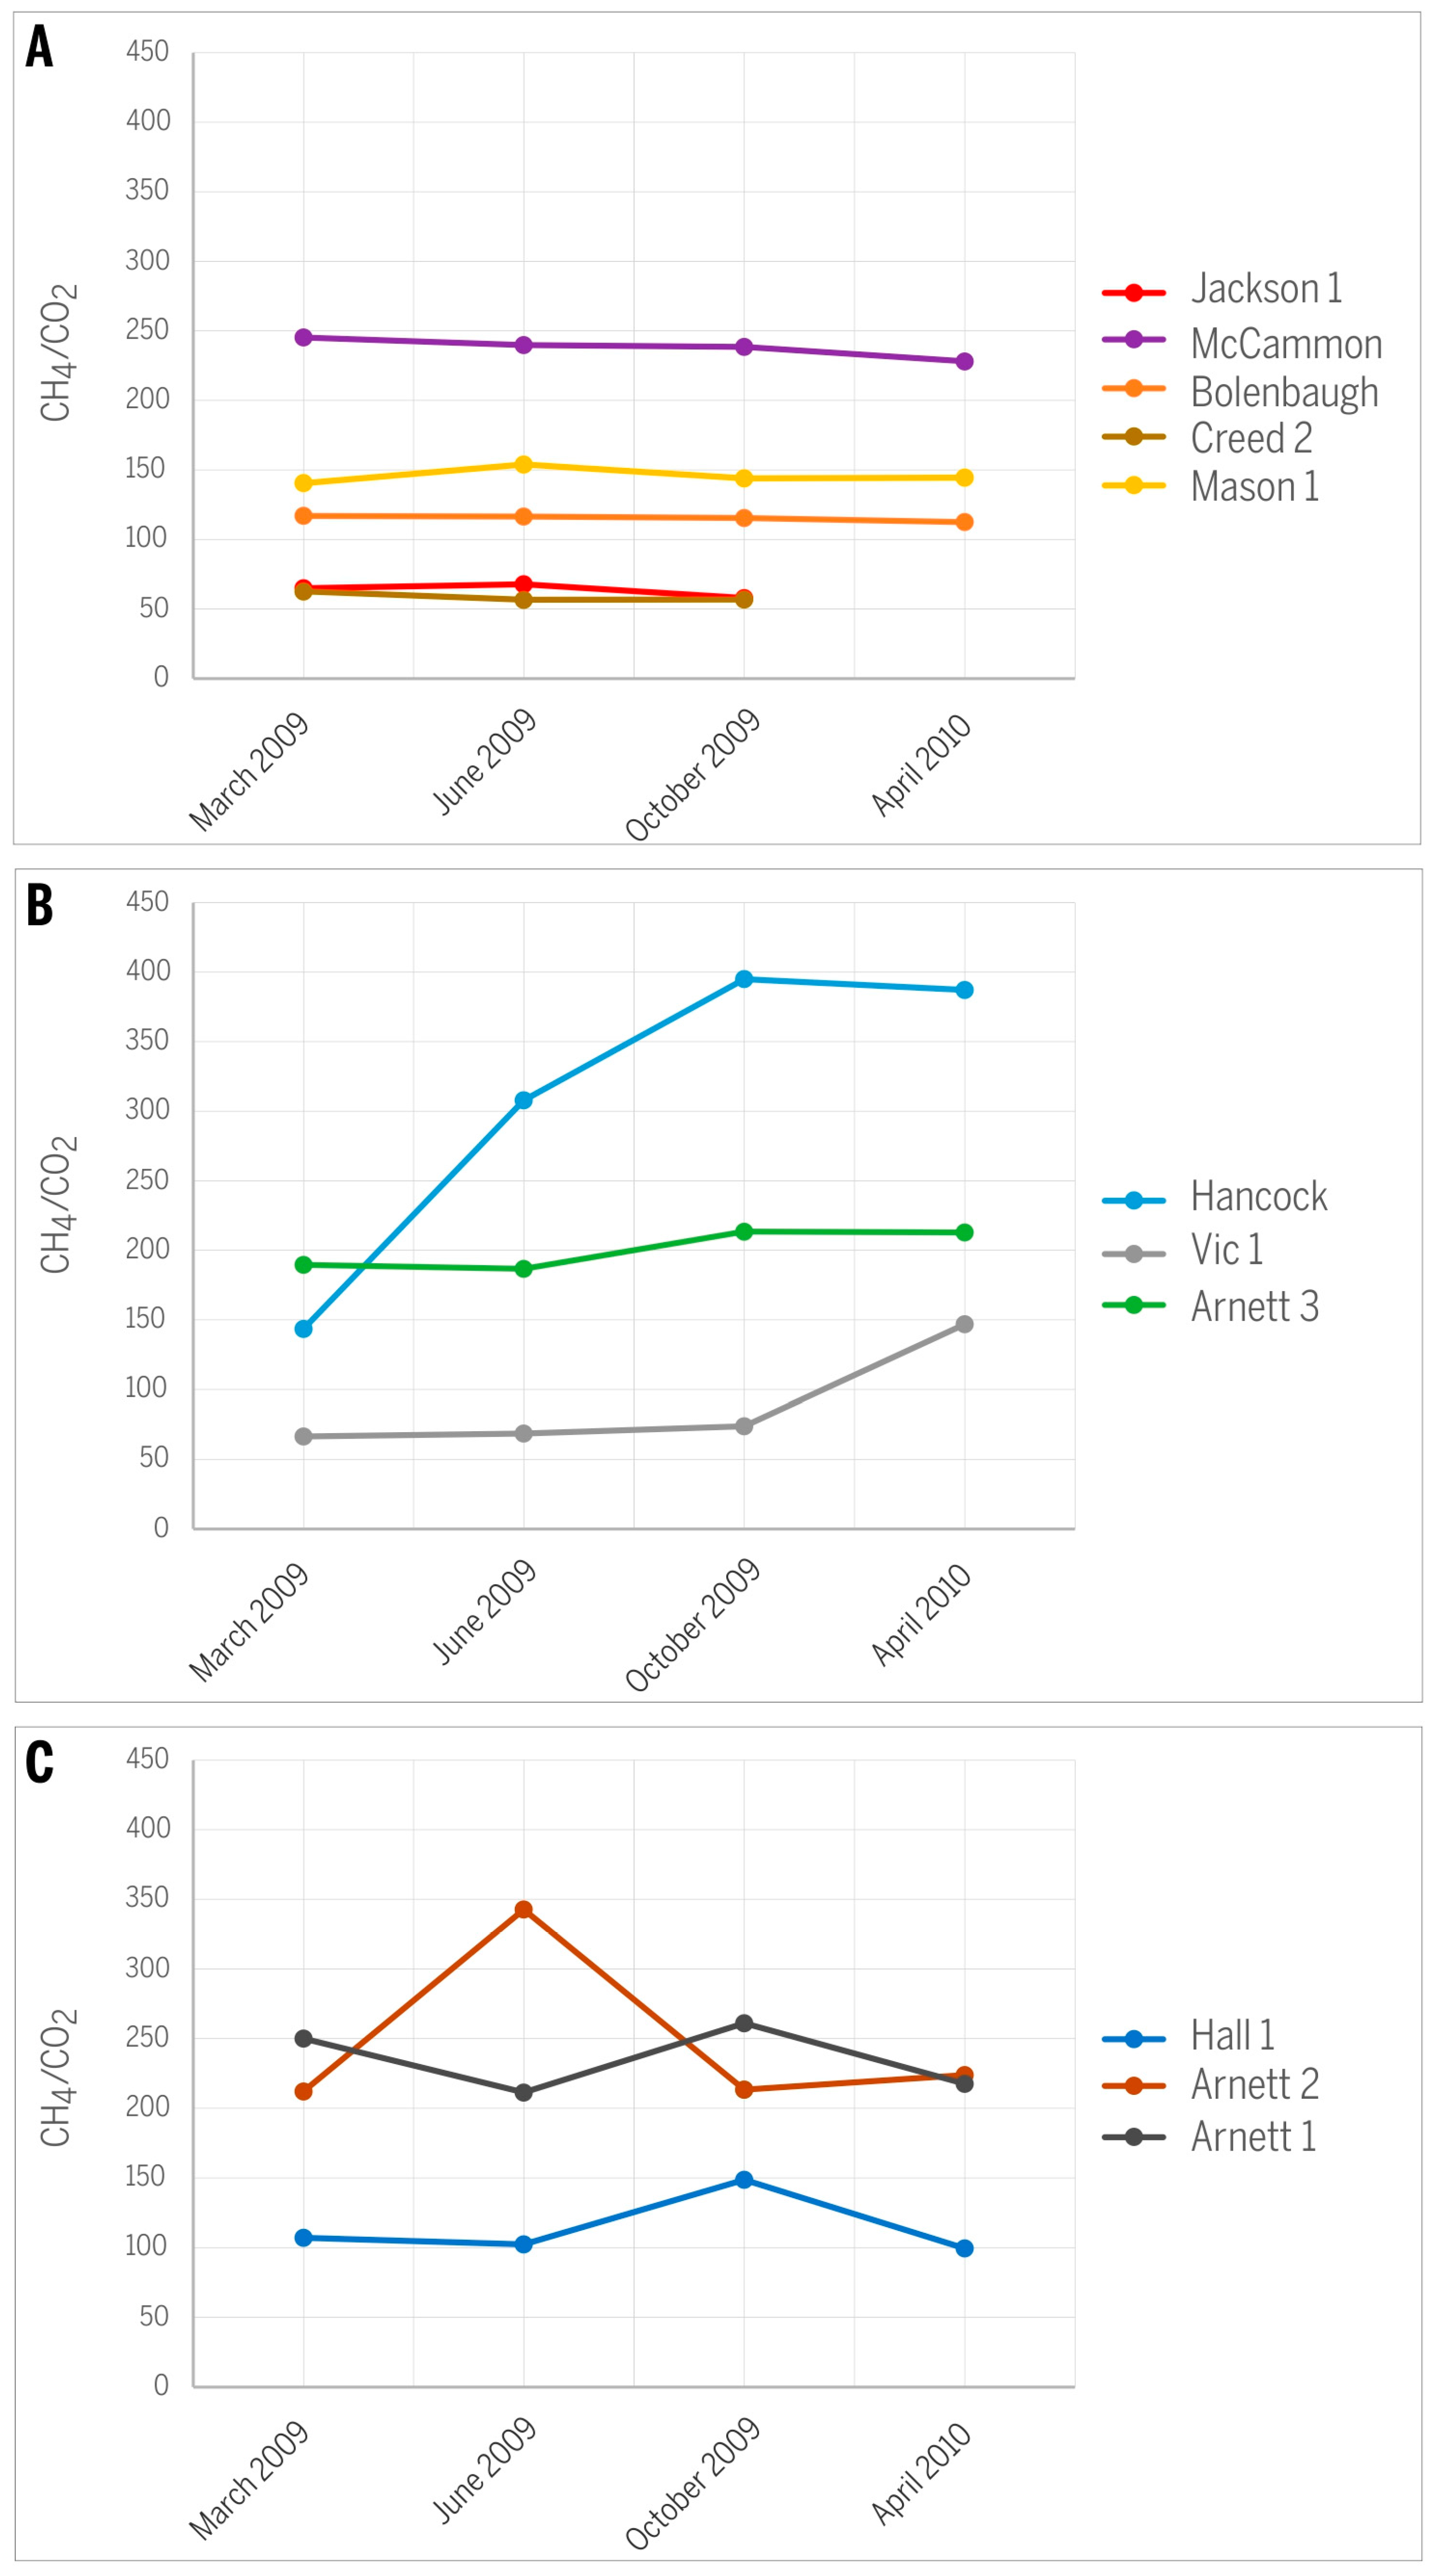
Figure 10.
Variations in CH4/N2 ratios along the history of CBM production.
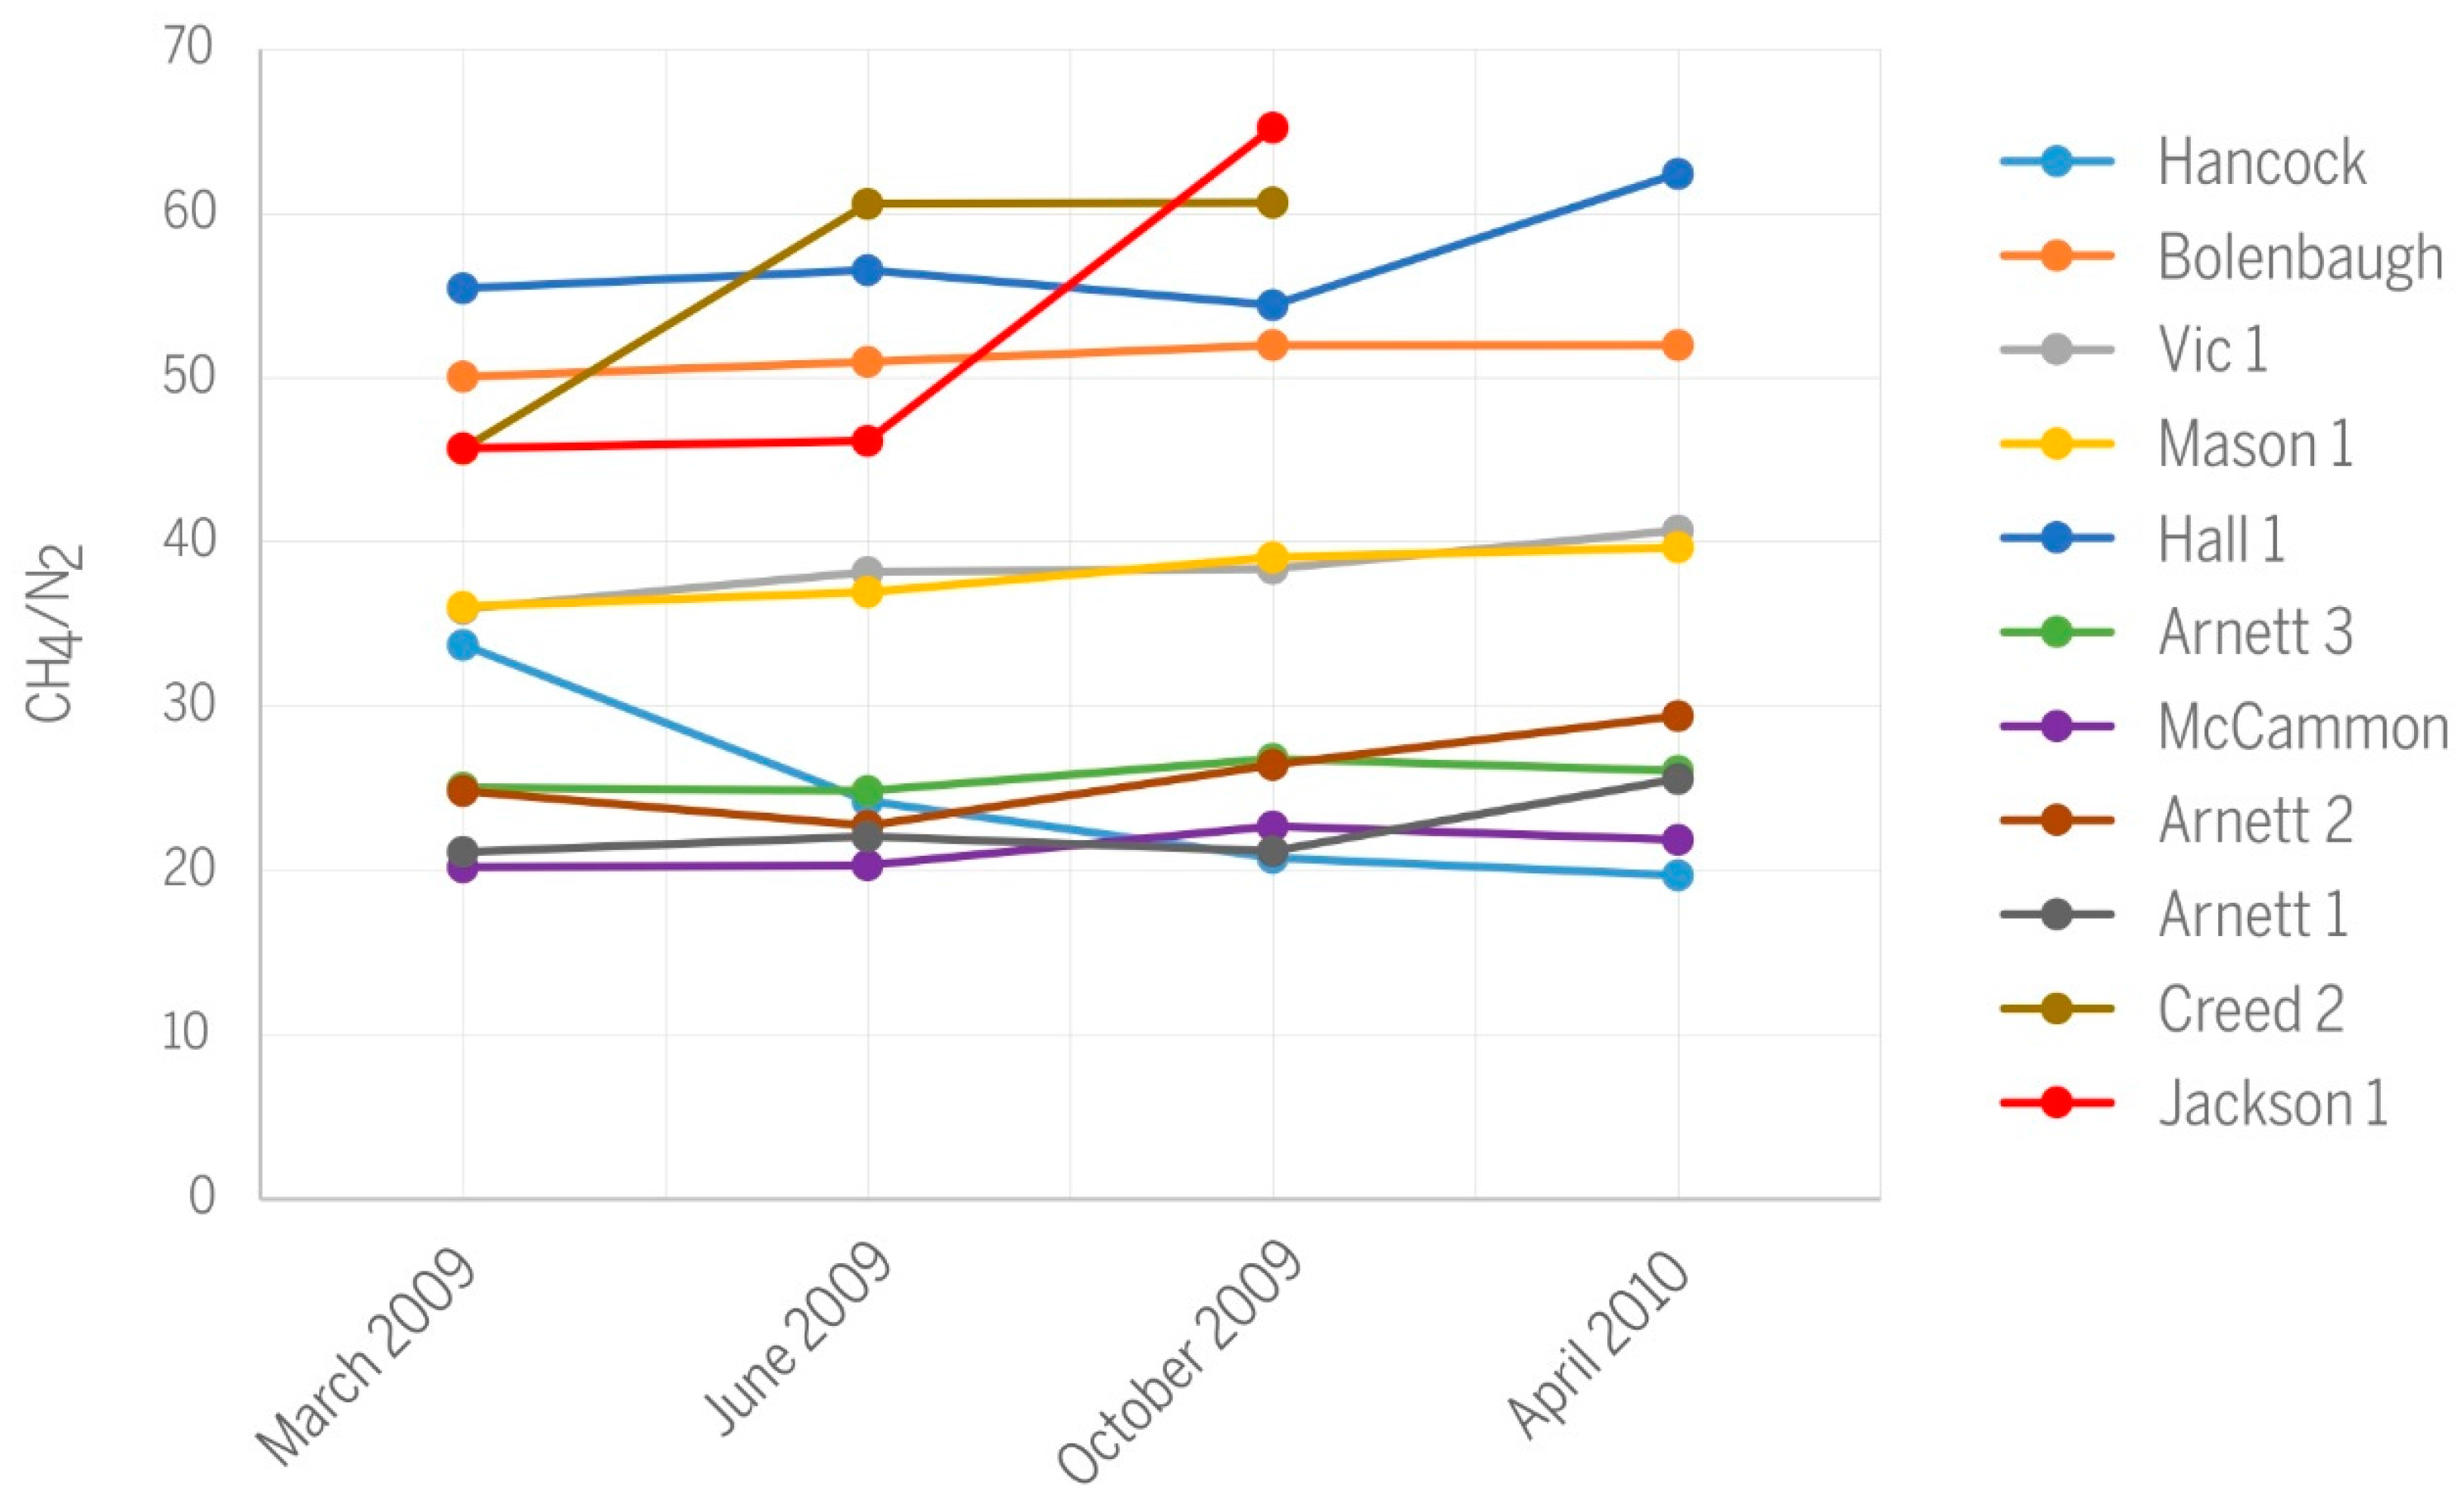
Figure 11.
Relationships between gas production and (A) C1/(C2 + C3) or (B) CH4/CO2.

Table 1.
Gas compositions and isotopic characteristics of methane from studied wells.
| Gas samples collected in March 2009 | Well | Coal | Concentration (vol %) | δ2H (‰) vs. VSMOW | δ13C (‰) vs. VPDB | C1/(C2 + C3) | ||||
| Methane | Ethane | Propane | CO2 | N2 | ||||||
| Creed 2 | Springfield | 96.3 | 0.09 | b.d.l. | 1.47 | 2.11 | −206 | −61.1 | 1088 | |
| Jackson 1 | Springfield | 96.4 | 0.02 | b.d.l. | 1.48 | 2.11 | −209 | −61.1 | 4530 | |
| Arnett 1 | Seelyville | 95.1 | 0.03 | b.d.l. | 0.38 | 4.50 | −201 | −59.1 | 2964 | |
| Arnett 2 | Seelyville | 95.6 | 0.04 | b.d.l. | 0.45 | 3.85 | −203 | −59.4 | 2444 | |
| Arnett 3 | Seelyville | 95.6 | 0.02 | b.d.l. | 0.50 | 3.81 | −203 | −59.2 | 4437 | |
| Mason 1 | Seelyville | 96.6 | 0.04 | b.d.l. | 0.71 | 2.68 | −205 | −56.0 | 2534 | |
| Vic 1 | Seelyville | 95.9 | 0.03 | b.d.l. | 1.44 | 2.67 | −208 | −55.1 | 3010 | |
| Hall 1 | Seelyville | 97.9 | 0.06 | b.d.l. | 0.91 | 1.75 | −211 | −55.4 | 1686 | |
| Bolenbaugh | Seelyville | 97.2 | 0.05 | b.d.l. | 0.83 | 1.94 | −210 | −55.6 | 1835 | |
| McCammon | Seelyville | 94.9 | 0.04 | b.d.l. | 0.39 | 4.69 | −204 | −59.5 | 2259 | |
| Hancock | Seelyville | 96.4 | 0.03 | b.d.l. | 0.67 | 2.86 | −210 | −57.7 | 3486 | |
| Gas samples collected in June 2009 | Well | Coal | Concentration (vol %) | δ2H (‰) vs. VSMOW | δ13C (‰) vs. VPDB | C1/(C2 + C3) | ||||
| Methane | Ethane | Propane | CO2 | N2 | ||||||
| Creed 2 | Springfield | 96.7 | 0.03 | 0.009 | 1.63 | 1.60 | −217 | −59.2 | 2512 | |
| Jackson 1 | Springfield | 96.5 | 0.00 | b.d.l. | 1.42 | 2.09 | −207 | −61.1 | n.d. | |
| Arnett 1 | Seelyville | 95.2 | 0.04 | b.d.l. | 0.45 | 4.31 | −209 | −59.2 | 2597 | |
| Arnett 2 | Seelyville | 95.5 | 0.03 | 0.008 | 0.28 | 4.20 | −214 | −59.1 | 2787 | |
| Arnett 3 | Seelyville | 95.6 | 0.03 | b.d.l. | 0.51 | 3.84 | n.d. | −59.2 | 3273 | |
| Mason 1 | Seelyville | 96.7 | 0.04 | b.d.l. | 0.65 | 2.62 | n.d. | −55.9 | 2173 | |
| Vic 1 | Seelyville | 95.9 | 0.10 | b.d.l. | 1.40 | 2.51 | −218 | −55.4 | 975 | |
| Hall 1 | Seelyville | 97.3 | 0.02 | b.d.l. | 0.95 | 1.72 | −210 | −55.3 | 4595 | |
| Bolenbaugh | Seelyville | 97.2 | 0.02 | b.d.l. | 0.83 | 1.91 | −218 | −55.5 | 4377 | |
| McCammon | Seelyville | 94.9 | 0.05 | 0.008 | 0.40 | 4.67 | −201 | −59.3 | 1561 | |
| Hancock | Seelyville | 95.7 | 0.03 | 0.015 | 0.31 | 3.95 | - | −57.1 | 2077 | |
| Gas samples collected in October 2009 | Well | Coal | Concentration (vol %) | δ2H (‰) vs. VSMOW | δ13C (‰) vs. VPDB | C1/(C2 + C3) | ||||
| Methane | Ethane | Propane | CO2 | N2 | ||||||
| Creed 2 | Springfield | 96.8 | 0.03 | 0.009 | 1.63 | 1.60 | n.d. | n.d. | 2514 | |
| Jackson 1 | Springfield | 96.7 | 0.01 | 0.006 | 1.67 | 1.48 | n.d. | n.d. | 4647 | |
| Arnett 1 | Seelyville | 95.1 | 0.02 | 0.019 | 0.36 | 4.49 | n.d. | n.d. | 2173 | |
| Arnett 2 | Seelyville | 95. 9 | 0.03 | b.d.l. | 0.45 | 3.62 | n.d. | n.d. | 3159 | |
| Arnett 3 | Seelyville | 95.9 | 0.04 | 0.021 | 0.45 | 3.58 | n.d. | n.d. | 1604 | |
| Mason 1 | Seelyville | 96.7 | 0.05 | 0.023 | 0.69 | 2.48 | n.d. | n.d. | 1417 | |
| Vic 1 | Seelyville | 96.1 | 0.06 | 0.022 | 1.30 | 2.50 | n.d. | n.d. | 1210 | |
| Hall 1 | Seelyville | 97.5 | 0.03 | 0.010 | 0.66 | 1.79 | n.d. | n.d. | 2257 | |
| Bolenbaugh | Seelyville | 97.3 | 0.05 | 0.007 | 0.84 | 1.87 | n.d. | n.d. | 13,788 | |
| McCammon | Seelyville | 95.4 | 0.04 | b.d.l. | 0.40 | 4.20 | n.d. | n.d. | 2623 | |
| Hancock | Seelyville | 95.1 | 0.05 | 0.007 | 0.24 | 4.58 | n.d. | n.d. | 1723 | |
| Gas samples collected in April 2010 | Well | Coal | Concentration (vol %) | δ2H (‰) vs. VSMOW | δ13C (‰) vs. VPDB | C1/(C2 + C3) | ||||
| Methane | Ethane | Propane | CO2 | N2 | ||||||
| Creed 2 | Springfield | samples were not collected | ||||||||
| Jackson 1 | Springfield | samples were not collected | ||||||||
| Arnett 1 | Seelyville | 95.8 | 0.04 | b.d.l. | 0.44 | 3.74 | n.d. | n.d. | 2280 | |
| Arnett 2 | Seelyville | 96.2 | 0.02 | 0.010 | 0.43 | 3.27 | n.d. | n.d. | 2810 | |
| Arnett 3 | Seelyville | 95.8 | 0.05 | 0.027 | 0.45 | 3.67 | n.d. | n.d. | 1277 | |
| Mason 1 | Seelyville | 96.8 | 0.04 | b.d.l. | 0.69 | 2.44 | n.d. | n.d. | 2251 | |
| Vic 1 | Seelyville | 96.9 | 0.02 | 0.019 | 0.66 | 2.38 | n.d. | n.d. | 2400 | |
| Hall 1 | Seelyville | 97.4 | 0.03 | 0.015 | 0.98 | 1.56 | n.d. | n.d. | 2409 | |
| Bolenbaugh | Seelyville | 97.2 | 0.06 | 0.012 | 0.86 | 1.87 | n.d. | n.d. | 1443 | |
| McCammon | Seelyville | 95.2 | 0.04 | 0.008 | 0.42 | 4.35 | n.d. | n.d. | 2073 | |
| Hancock | Seelyville | 94.9 | 0.06 | b.d.l. | 0.25 | 4.81 | n.d. | n.d. | 1520 | |
b.d.l: below detection limit; n.d: not determined. VSMOW: Vienna Standard Mean Ocean Water; VPDB: Vienna Pee Dee Belemnite.
© 2017 by the authors. Licensee MDPI, Basel, Switzerland. This article is an open access article distributed under the terms and conditions of the Creative Commons Attribution (CC BY) license (http://creativecommons.org/licenses/by/4.0/).
Share and Cite
MDPI and ACS Style
Mastalerz, M.; Drobniak, A.; Schimmelmann, A. Characteristics of Microbial Coalbed Gas during Production; Example from Pennsylvanian Coals in Indiana, USA. Geosciences 2017, 7, 26. https://doi.org/10.3390/geosciences7020026
AMA Style
Mastalerz M, Drobniak A, Schimmelmann A. Characteristics of Microbial Coalbed Gas during Production; Example from Pennsylvanian Coals in Indiana, USA. Geosciences. 2017; 7(2):26. https://doi.org/10.3390/geosciences7020026
Chicago/Turabian StyleMastalerz, Maria, Agnieszka Drobniak, and Arndt Schimmelmann. 2017. "Characteristics of Microbial Coalbed Gas during Production; Example from Pennsylvanian Coals in Indiana, USA" Geosciences 7, no. 2: 26. https://doi.org/10.3390/geosciences7020026
Note that from the first issue of 2016, this journal uses article numbers instead of page numbers. See further details here.