
Analysis of Costantino Landslide Dam Evolution (Southern Italy) by Means of Satellite Images, Aerial Photos, and Climate Data


Department of Physics and Geology, University of Perugia, Via Pascoli snc, 06123 Perugia, Italy
*
Author to whom correspondence should be addressed.
Geosciences 2017, 7(2), 30; https://doi.org/10.3390/geosciences7020030
Submission received: 16 March 2017
/
Revised: 12 April 2017
/
Accepted: 13 April 2017
/
Published: 19 April 2017
(This article belongs to the Special Issue Observing Geohazards from Space)
Abstract
:Large landslides, triggered by earthquakes or heavy rainfall, often obstruct the river’s flow to form landslide dams, causing upstream inundations, and downstream flooding. In Italy, landslide dams are rather widespread along in Alps and Apennines: although the identification of past events is a complex task, some hundreds of landslide dams are identified in the literature. In order to assess the formation and evolution of landslide dams, several studies suggested the employment of geomorphological indexes. In this framework, the knowledge of site-specific time-space evolution can be useful in the understanding of the landslide dams phenomena. The present work focuses on a landslide dam that occurred in January 1973, which totally dammed the Bonamico River Valley (Southern Italy): the lake reached an area of about 175,000 m2, a volume of about 3.6 × 10⁶ m3 and a maximum depth of 40 m. During 1973–2008, the lake surface gradually decreased and nowadays it is completely extinct by filling. By using satellite and aerial images, the paper discusses the evolution of the lake surface and the causes of the lake extinction. The use of a climate index (i.e., standardized precipitation index at different time scale) indicates that in recent decades the alternance of drought and heavy rainfall periods affected the inflow/outflow dynamics, the filling of lake due to the solid transport of the Bonamico River, and the failure of the landslide dam.

1. Introduction
Landslide dams recur in areas affected by active tectonics (typically areas involved in recent orogenesis), where the rising trend is the main cause of hydrographic network entrenchment and consequent formation of narrow valleys, delimited by steep slopes. This is the main geological-structural factor predisposing to obstruction of riverbeds by landslides [1,2,3]. In addition, earthquakes, even of high magnitude, frequently affect these areas so that, among the causes of occlusion of the riverbeds, seismically-induced landslides represent a high percentage [1,4,5].
The landslide damming phenomenon produces a significant increase in risk compared to that due to landslide movement alone. In fact, the formation of a lake (dam lake) can cause both flooding on the upstream portion of the barrier and abnormal flooding downstream of the occlusion in the case of sudden collapse of the dam (e.g., rapid emptying of the lake, earthquake, piping). Within this framework, even small landslides mobilizing a reduced volume of material can occlude the riverbed, changing the morphological conditions. Overall, the approach of the use of fixed return periods to manage the hydraulic risk of downstream flooding produced by the overtopping or the failure of the landslide dam is not appropriated. In fact in these conditions, downstream flooding is not related to the recurrence time of river peak discharge due to the occasional character of the phenomenon [6,7,8].
In Italy, geological and structural conditions produced the formation of two chains (Alps and Apennines), frequently affected by landslide dam phenomena. Censuses conducted in Alps [9], in the northern Apennines [10,11] and, more recently, in the whole national territory [12], showed the presence of about 300 main occlusions of riverbeds due to landslides. However, in the zoning of hydrogeological risk, promoted in Italy by specific laws (e.g., Hydrogeological Assessment Plans—PAI), the two types of risk (landslide and hydraulic risks) are always addressed separately, without considering what can be generated as a result of the interference between gravitational slope processes and dynamics of riverbeds. The scientific literature mainly focused on the following fundamental aspects of landslide dams:
- -
- the description of case histories (surely the most treated issue, with a countless number of cases described around the world);
- -
- -
- -
- -
As reported by [18,41], many landslide dams fail shortly after formation and overtopping is by far the most common cause of failure: among the 73 landslide-dam failures documented by these papers, 27% of the landslide dams failed less than one day after formation, and about 50% failed within 10 days.
Moreover, in the Mediterranean region, the increase of length and frequency of drought periods, and extreme rainfalls affect the inflow and outflow dynamics of lakes as well as the erosion rates in river basin and solid transport. These factors—coupled with geotechnical properties of dam materials—influence the survival time of the lake and dam stability. The present work takes as reference the landslide dam that occurred in January 1973, which totally dammed the Bonamico River Valley (Southern Italy), producing a small lake that survived for about 36 years. In detail, the paper aims to study and discuss the evolution of the lake surface, analyzing causes that conditioned its evolution up to the drastic surface reduction produced by filling and overtopping/dam failure phenomena.
2. Study Area
The Costantino landslide dam is located in the Bonamico basin along the Arco Calabro-Peloritano in the Southern Ionian side of Calabrian territory, Southern Apennines (Italy) (Figure 1). The Bonamico is a typical Mediterranean basin: it has a maximum altitude of 1956 m a.s.l. (Montalto Mount, Figure 1) and a mean altitude of about 780 m a.s.l. The high relief energy is due to the tectonic uplift during the Pleistocene. The length of the main river channel is 29.68 km with a mean gradient of 6% [42]. Although the basin has a total area of about 137 km2, its upper part (subtended by the Costantino landslide dam) covers an area of about 100 km2. The Bonamico basin, as most basins in Calabria territory, show intense hydraulic and geomorphological dynamics. From a geomorphological point of view, the Bonamico River is a fiumara, a braided river with high gradient, delimited by very steep slopes and characterized by coarse-grained alluvium [43,44]. The hydraulic regime of fiumara is typically torrential, with the predominance of debris production by mass-movement and erosion on slopes. For these reasons, the transport capacity of fiumara torrents is very high. According to the landslide map proposed by [45], the upper part of the basin is characterized by the presence of more than 20 landslides.
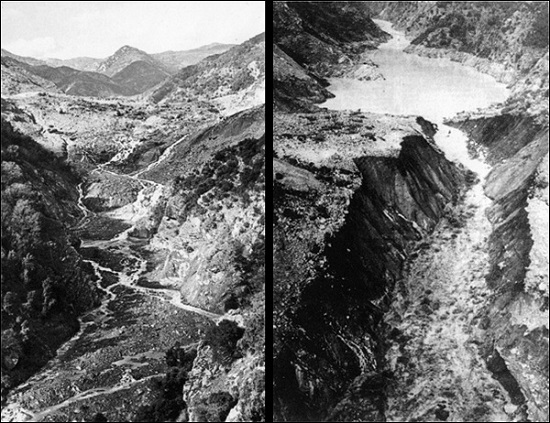
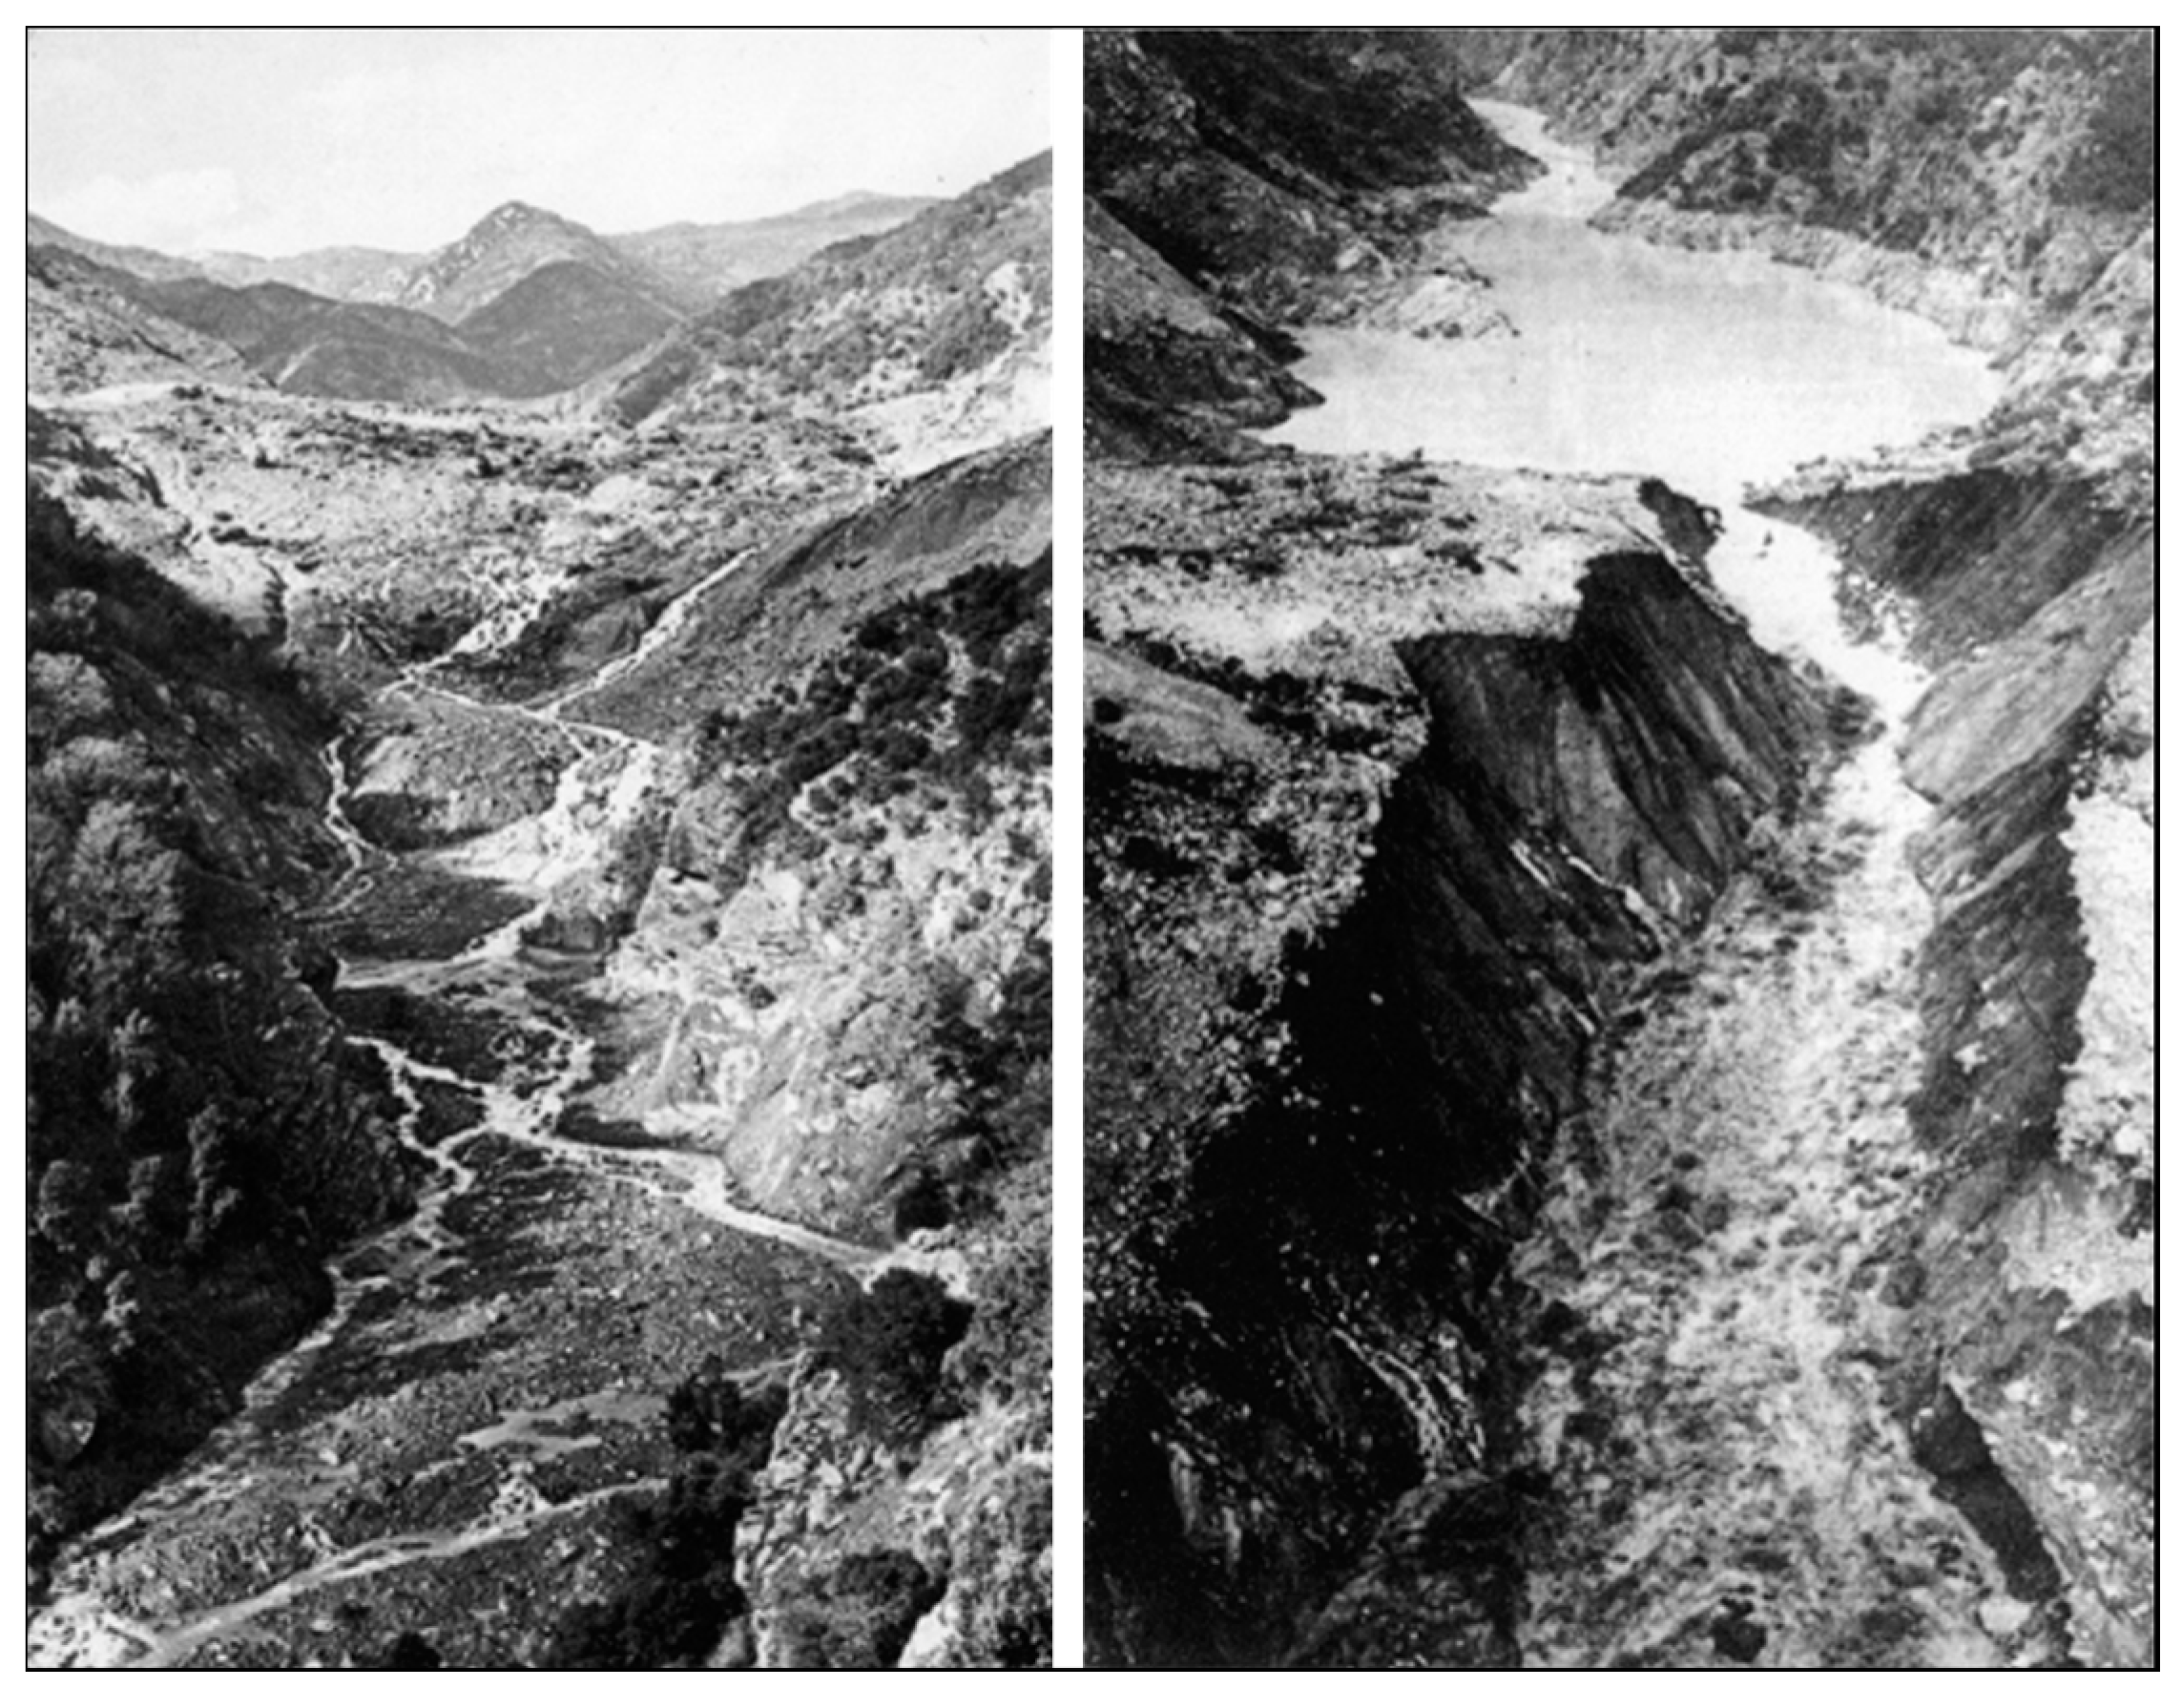
The Costantino landslide, classifiable as debris/earth translational slide, occurred during the night between 3 January and 4 January in 1973 (volume of about 23 × 106 m3 [46,47,48]: the displaced landslide materials—coming from the slope on right bank of the Bonamico river—reached the opposite slope and occluded the riverbed producing a lake. According to [46,47]), the lake after three minor flood waves had a maximum depth of 40 m with a volume of water of about 3.6 × 10⁶ m3. As reported by [48], “the lake lasted only a few hours before breaching occurred, and no significant damage was recorded at the nearby villages and towns”. After about one month (4 February 1973), filtration and erosion phenomena along the lake outlet lowered the lake to a depth of about 20 m. This was the first huge mobilization of landslide materials downstream [47]: this event is clearly shown in Figure 2 that documents the formation of a deep canyon downstream the lake [49]. By this time, the threshold has suffered a temporary stop in its evolution, probably for armoring phenomena, as often occurs in such cases, when the material constituting the natural dam is very heterogeneous and characterized by low sorting [50].
According to the official geological map [51], the Costantino landslide is hosted in metamorphic rocks characterized by schists with garnet and muscovite (unit of Madonna di Polsi). The weathering processes and the high degree of jointing in the rock mass decomposed and transformed the rocks into soils, strongly reducing the overall resistance of the rock mass [46,48].
3. Materials and Methods
3.1. Climatic Characterization and Assessment of Wet/Drought Periods
Climatic characterization of the Bonamico catchment at the Costantino landslide dam (Figure 1) was carried out on different time-scale taking into account the most reliable meteorological stations located close to the study area. In detail, three available meteorological stations were considered: Platì, San Luca, and Santuario di Polsi, located 8, 5, and 4.5 km away from the Costantino Lake, respectively. Daily analysis was carried out to investigate the rainfall amount/intensity responsible for the landslide occurrence in January 1973 and to examine the accumulated rainfall during the days before the sudden reduction of the lake surface (January 2009). Monthly analysis helped us to study the evolution of the Costantino Lake surface during the last decades also considering wet/drought periods. As commonly occurs in other locations along the Apennines, only a few stations registered meteorological data up to the latest years, especially those located at higher altitudes [52,53]. Table 1 shows the characteristics of the available meteorological stations in the study area, two of which are located within the Bonamico basin (San Luca and Santuario di Polsi, Figure 1). Data sets were collected from the rain gauge network of the Centro Funzionale of Calabria Region.
San Luca rain gauge (code 2260) was operating during 1924–2016 with less than 5% of missing data, with a total lack of data during 2001–2004. The Platì rain gauge (code 2230) represents the most reliable rain gauge in the study area (missing data less than 4% during 1920–2016 period). Gaps in time-series were filled by applying multiple regressions based on the best-correlated data series (R2 > 0.75) of the nearest rain gauges. Double mass analysis [54] was used to investigate the consistency of precipitation records in the study area. In detail, a straight double mass curve between Platì and San Luca rain gauges was obtained, indicating a consistent and reliable precipitation record. Data of the Santuario di Polsi rain gauge (code 2250) are not continuous during 1921–2016, since no data have been registered between 1974–1991 period and after 2004. Due to the high gaps in the data time series, rainfall data of this station have been used only to check the amount of daily rain accumulation before the landslide occurrence.
The Mann-Kendall test (MK) [55,56], commonly used to detect monotonic trends in series of data (e.g., climate data, hydrological data, etc.), was used to check the presence of significant rainfall trends on differing time-scales (annual, seasonal, etc.) by analyzing the long-time series of Platì rain gauge. To check the occurrence and intensity of wet/droughts periods, we used the Standardized Precipitation Index, SPI [57,58], which was declared to be an official meteorological drought index by the World Meteorological Organization [59]. This index was also used by [60] to assess drought occurrence in Calabria. As reported by [61], robust relationships were found between the SPI time-scales on river discharges and reservoir storages in complex hydrological systems in mountainous regions and in the Mediterranean region. In the SPI computation, at least 30 years of data are needed [57,62]. In this study, the SPI analysis was carried out on the 1950–2015 period (65 years): this time-span was chosen because we are mainly focused on the analysis of wet/drought periods preceding and following the occurrence of the Costantino landslide dam. Rainfall data passed the test for gamma probability distribution according to Kolmogorov-Smirnov and Chi-square tests. The SPI computation was carried out on varying time-scales with the DrinC software [63]. According to [57,58], seven severity classes—from severe drought (SPI ≤ 2) to severe wet (SPI ≥ 2)—have been proposed (Table 2). The lack of any long time-series of temperature data did not allow the use of index based on monthly precipitation (P) and potential evapotranspiration (PET), such as the Reconnaissance Drought Index (RDI) [64].
3.2. Aerial and Satellite Imagery Database
In order to check the evolution of lake dam, a multi-temporal image analysis was carried out. A similar analysis, based only on visual analysis of three recent satellite images (SI) images (2005, 2008, and 2012), was performed by [12]. In the present work, several SI, aerial photos (AP), and orthophotos (OP) from different sources were collected: SI are available for viewing on Google (www.google.com) and Bing (www.bing.com), AP were bought from Istituto Geografico Militare, while OP were collected through the Web Map Service (WMS) made available by Ministero dell’Ambiente e della Tutela del Territorio e del Mare (http://www.pcn.minambiente.it/GN/accesso-ai-servizi/servizi-di-visualizzazione-wms). Overall, the analysis covered the 1983–2015 time-span also considering the conditions before the landslide occurrence (a in Table 3). Although among the available images, one has a very low resolution (e in Table 3): we believe that the study of this image is useful to increase the understanding of temporal evolution of the lake surface.
4. Results
4.1. Climatic Analysis and Assessment of Wet/Drought Periods
To check the presence of significant rainfall trends in the study area (both positive and negative), a statistical analysis was carried out on monthly data of the Platì station which represents one of the most reliable stations of the Calabria region as it has a long-term dataset (about 96 years of rainfall observations). The data show a statistically significant negative precipitation trend both at annual scale (−2.60 mm/year, MK test > 95%) and autumn/winter seasons (−3.65 mm/6-months, from October to March—MK test > 98%). Conversely, positive rainfall trends have been detected during summer months (+0.8 mm/three months, from July to September—MK test > 98%). Overall, the results are consistent with those of previous studies [65,66,67,68,69]. As reported by [69], the negative trend of annual rainfall data is a typical feature of all the long aggregation rainfalls observed in the Calabria Region and especially on the Southern Ionian side of Calabrian territory. Moreover, also the general significant increase of rainfall during summer months and the significant decrease of rainfall in autumn/winter months is well spatially distributed on the Southern Ionian side of Calabrian territory. In this context, results from the Platì rain gauge can be representative of climatic trend in the upper part of the Bonamico basin.
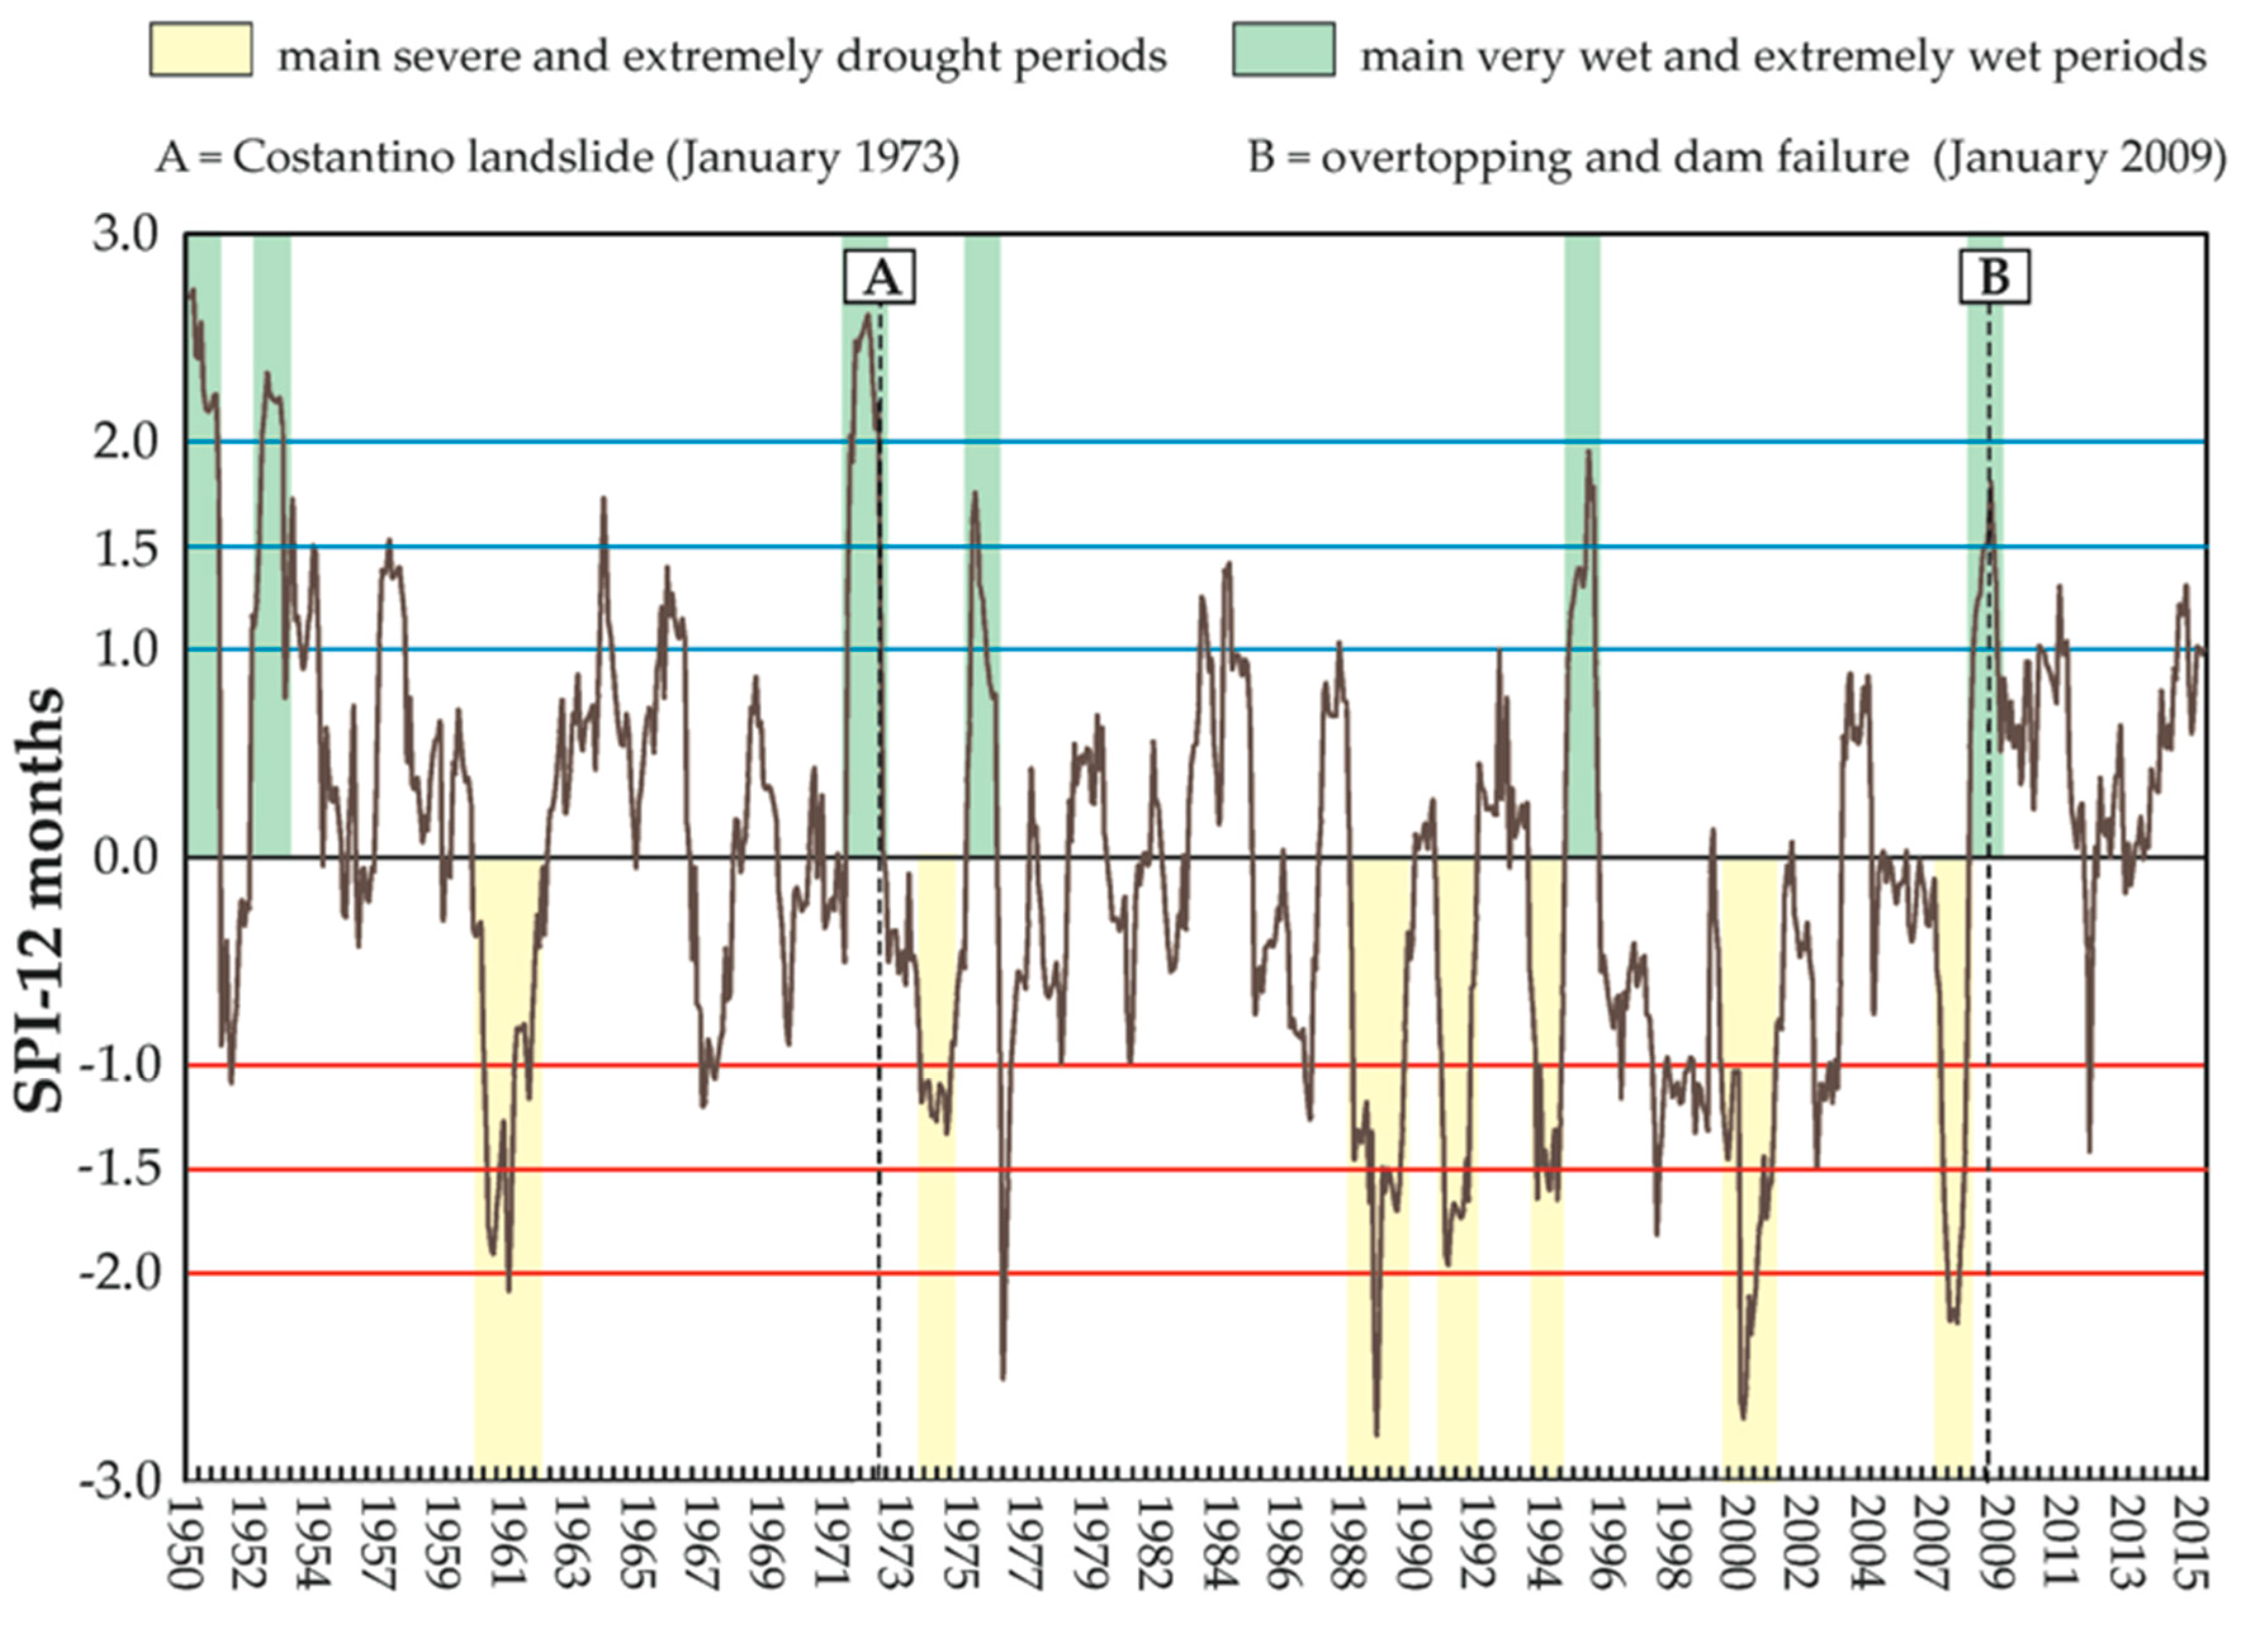
According to [70], “the paradoxical increase of extreme rainfall in spite of a decrease in the totals is not present in this part of southern Italy”. This is also confirmed—at monthly scale—by the SPI index. As shown in Figure 3 in the last three decades (1986–2016) the number and frequency of prolonged drought periods are increased while the prolonged wet and very wet periods are—according to the index used—not so numerous as those recognized in the 1950–1985 period. In detail, for the last three decades, five severe droughts (−2.0 ≤ SPI < −1.5) occurred. Conversely, there were only two main prolonged drought periods between 1950 and 1986 (Figure 3).
4.2. Evolution of Lake Surface and of Landslide Dam
The temporal evolution of the lake surface can be inferred by the imagery database in Table 3. The analysis was carried out in GIS environment by using the ArcGIS Earth (ESRI, Redlands, CA, USA), Google Earth (Google, Mountain View, CA, USA), and Quantum GIS software (OSGeo). As shown in Figure 4 and Figure 5, the lake surface gradually decreased from about 100,000 (July 1983) to about 60,000 m2 (July 2008). After 2008, a sudden decrease of the lake surface was observed by using satellite images: the lake surface passed in few months from about 60,000 (July 2008) to 30,000 m2 (March 2009), reaching about 10,000 m2 (after April 2012). Figure 6a shows the large amount of sediment in the area previously occupied by the lake. Figure 6b shows a picture taken during spring 2012: the reduction of lake surface has nowadays allowed the vegetative colonization of aquatic and riparian plants along the river and the small surviving lake.
5. Discussion on Origin and Evolution of the Costantino Lake
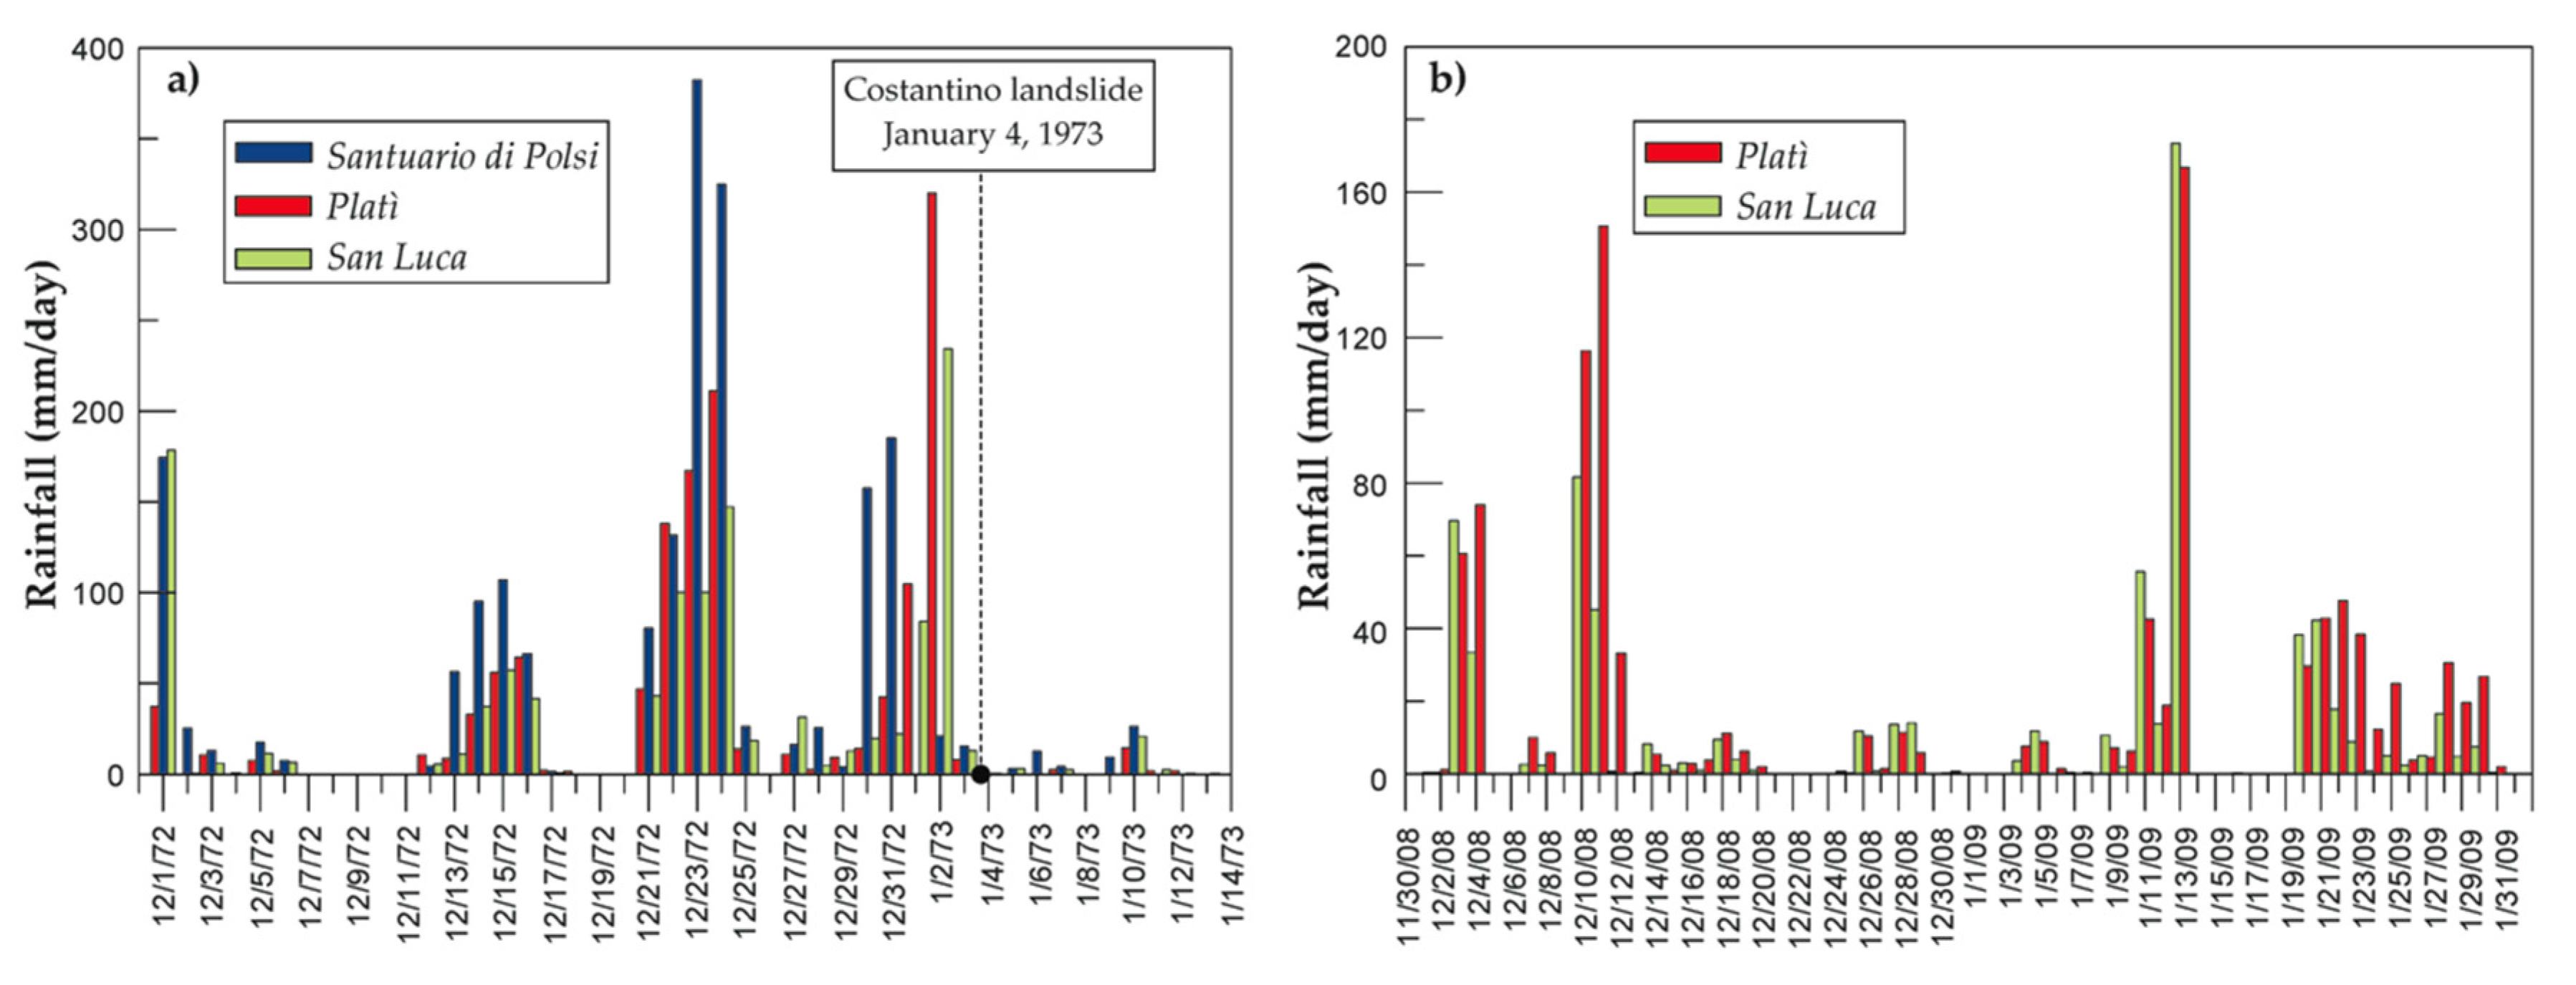
The Costantino Lake was one of the few examples of formed-stable landslide dam documented in Southern Italy [12], which gradually disappeared due to erosion/filling and overtopping/dam failure processes. The landslide originating the dam was triggered by heavy rainfalls that occurred between 21 December 1972 and 4 January 1973. First rainfall events were spatially distributed with peaks of 300–350 and 200 mm/day, in the upper part (data of Santuario di Polsi) and in the medium part (data of San Luca and Platì) of the Bonamico basin, respectively. Although the Platì station is not located within the Bonamico basin, the rainfall data from this station were taken into consideration to better understand rainfall event. In the few days before the landslide triggering, rainfalls mainly affected the medium part of the Bonamico basin with peaks of 200–300 mm/day (Figure 7a), by focusing in the area where the landslide has taken place.
The lake originating from the landslide dam evolved over time (about 36 years) experiencing a gradual reduction of the lake surface up to 2008 [42], based on extrapolation of the amount of solid material deposited in the Costantino Lake, suggesting an average sediment transport of about 10,000 m3/year: this estimation is referred to the two decades before the publication of the research (about 20 years after the landslide occurrence). Since such data are not available after 1992, we studied the evolution of the lake surface by investigating, in a qualitative way, the effect of rainfall on average annual erosion, taking into account the significant decreasing trend of autumn/winter and annual rainfall in the study area. In other words, the use of empirical equations—based on rainfall data—can be useful when no lengthy series of sediment transport measurements are available.
where:
- pimax = rainfall in the rainiest month of the year i (mm);
- Pi = yearly rainfall (mm);
- pi = mean monthly rainfall (mm);
- P = mean annual rainfall (mm).
We calculated the Fournier Index (FI) [71] and the Modified Fournier Index (MFI) [72], defined by Equations (1) and (2), respectively. Both indexes allow understanding, qualitatively at least, of the effect of rainfall on erosion. Based on FI and MFI values, different rainfall erosivity classes are defined (Table 4). Although the risk of erosion is not only linked to the rainfall but also to other factors related to the vegetation dynamic, land use, etc. [73], the decrease of the two indexes should reduce the erosion rates.
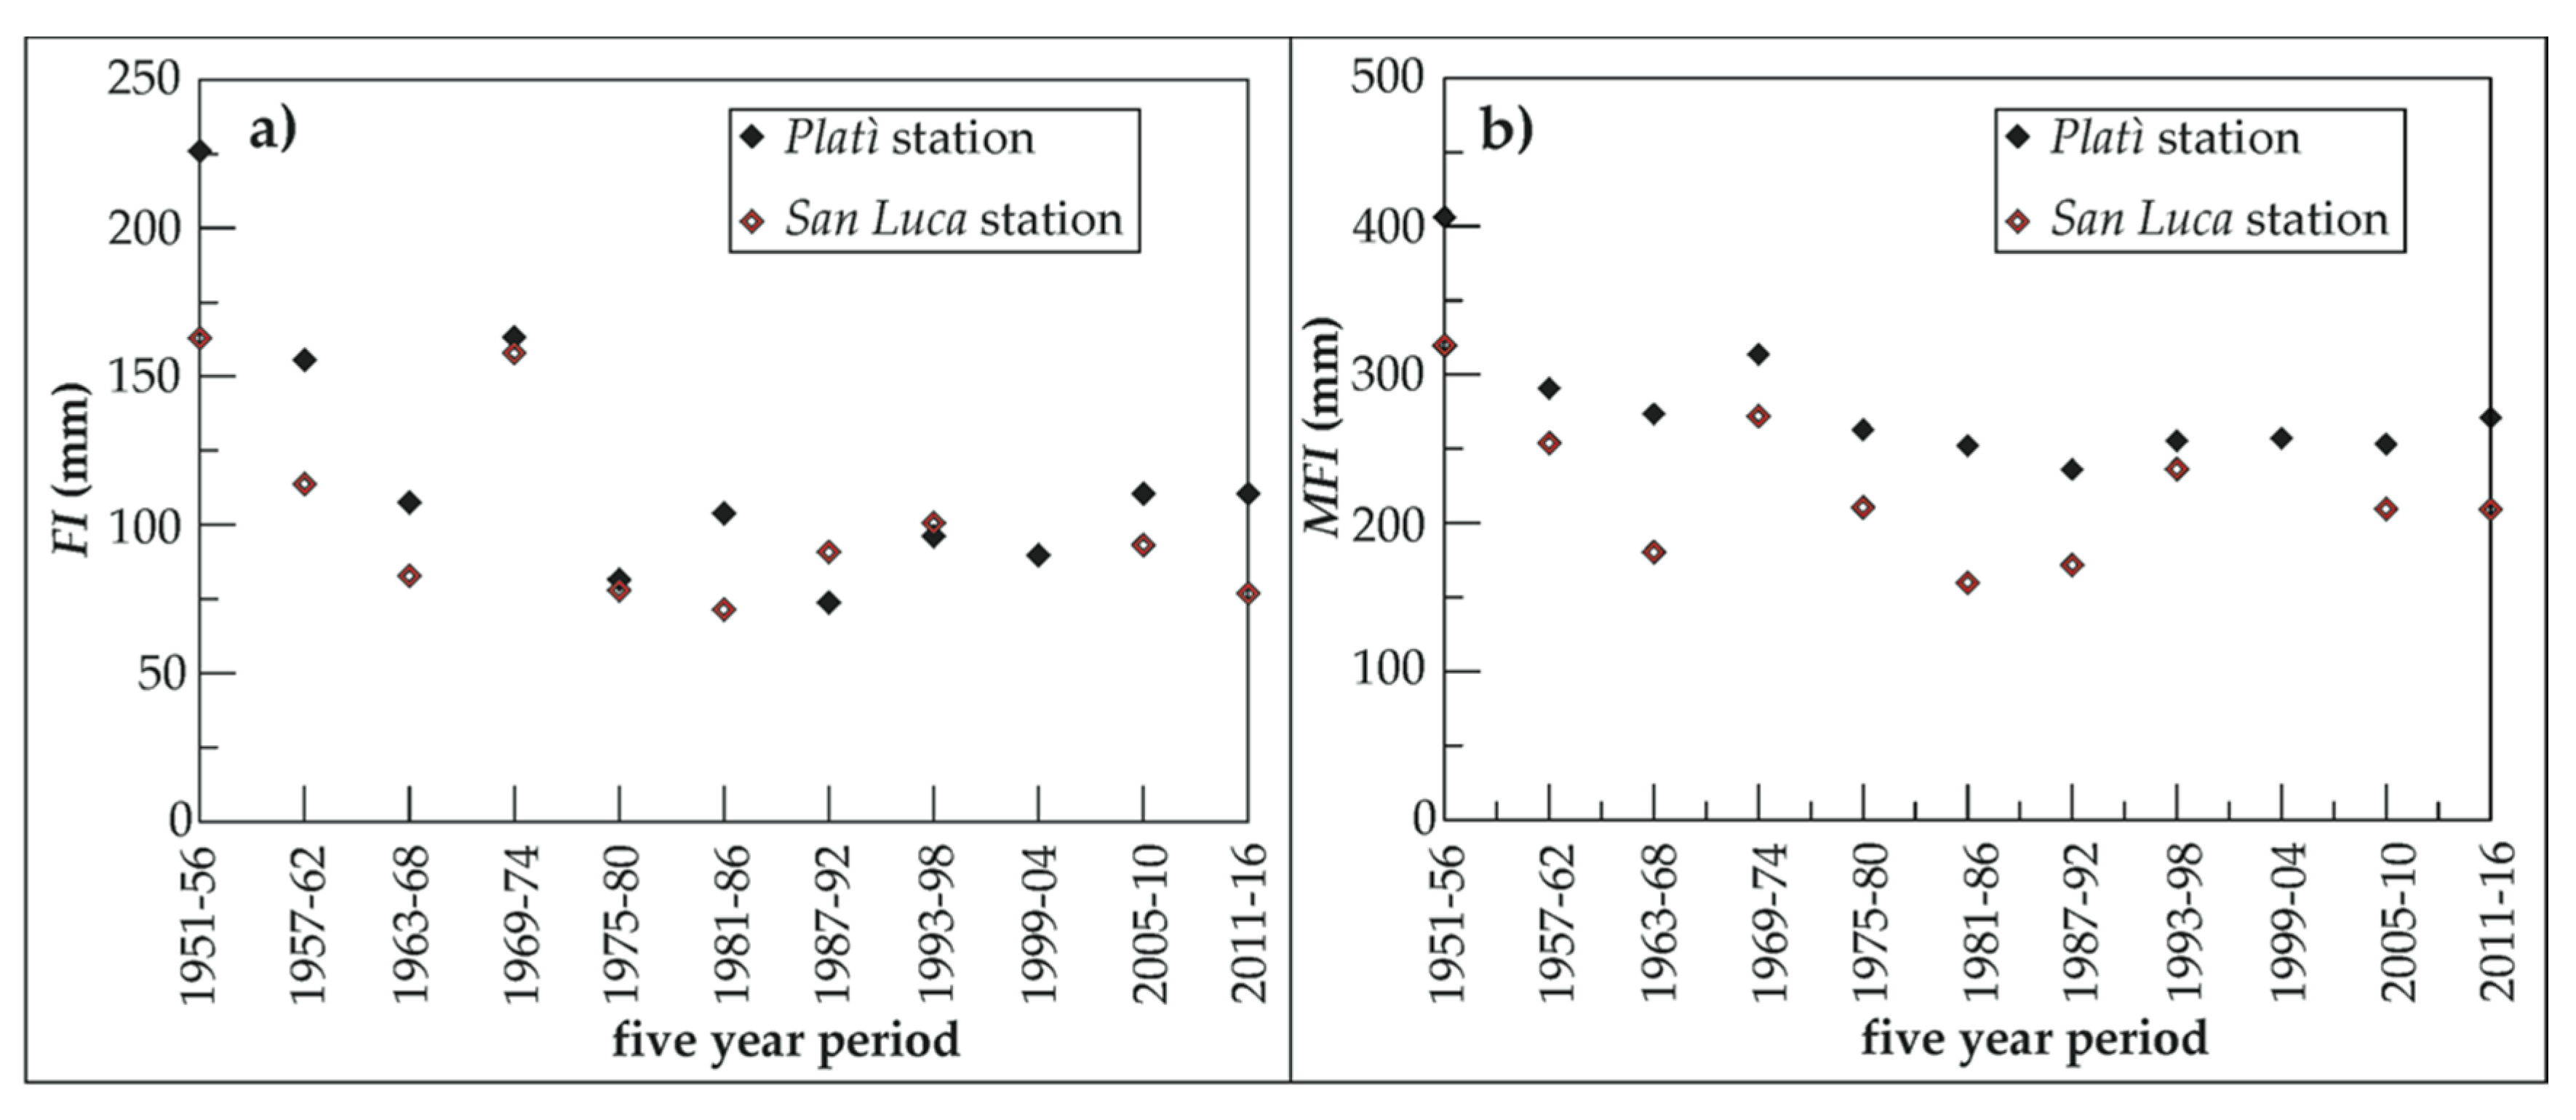
Taking into account the monthly rainfall data of Platì and San Luca stations, FI and MFI values were computed five year by five year (Figure 8), starting from 1951. It is interesting to highlight as the FI index after the occurrence of the Costantino landslide dam (1973), decreased on both stations of about 70 mm, passing from about 165 to 95 mm. Overall, the peak of FI recorded in 1969–1974 is placed in a period characterized by a general decrease of the index since 1951–1956. By comparing the 1951–1986 and 1987–2016 periods, the MFI index has decreased of about 17% on both stations (306 to 257 mm in Platì station and 246 to 203 mm in San Luca station). If other conditions in the catchment remained the same (topographic factors, land use, etc.), as it is likely, a decrease in such indexes implied a decrease in erosion in mountain areas, with a subsequent decrease in sediment yield to the alluvial plains [75].
Despite the increase of droughts periods highlighted in the last three decades by SPI (Figure 3), the erosivity classes for the Bonamico basin remained very severe/very high. The analysis here presented is based only on two meteorological stations, which are located at an altitude much lower than that of the mean altitude of the Bonamico basin; moreover, the station of Platì is located out of the Bonamico basin (about 8 km in line of sight from the Costantino Lake). We believe that without reliable rainfall data at high elevation, the analysis may be considered as a qualitative representation of rainfall effects on erosion and therefore on sediment transport to the Costantino Lake. Overall, considering that the FI index remains almost constant (between 80 and 100 mm) after 1975 (Figure 8), the estimation of sediment transport made by [42], could be representative—at least as order of magnitude—even for the period after 1992, on the basis of only rainfall data. The high sediment transport played a key role in the lake filling, especially up to 2008: as illustrated in Figure 5a gradual decrease of the lake surface during 1983–2008 is mainly due to sediment accumulation in the lake produced by solid transport. After these phases, a sudden reduction of lake surface after January 2009 was observed (Figure 5). It is linked to overtopping and dam failure phenomena. A rainfall event occurred in January 2009, also documented by [76], affected the mountains in the southern-eastern part of Calabria territory with three days of rainfall with a 100-year return period (>200 mm/day). This event was also registered—although in lesser amounts—at the Platì and San Luca rain gauges (Figure 7b) located at low altitude (about 240 mm/3-days on 11–13 January 2009). The effect of the flood related to this rainfall event is well recognized by comparing the satellite images of July 2008 (Figure 4h) and March 2009 (Figure 4i): the vegetation along the lake outflow and on the landslide dam body has been removed and dam materials have been highly eroded. Overtopping and dam failure produced the lowering of the threshold elevation of lake outlet with a consequent reduction of the lake surface.
6. Conclusions
The study, taking as reference the Costantino landslide dam, emphasizes the use of Earth Observation (EO) through multi-temporal high-resolution images as useful tool for understanding, both quantitatively and qualitatively, changes occurring on dam lakes and landslide bodies. On the basis of the results of the study carried out, we can draw the following conclusions:
- –
- The use of imagery dataset of different nature (aerial photos, orthophotos, and satellite images) allowed to study the evolution of the Costantino dam lake. The lake surface between 1983 and 2008 gradually decreased of 40% (from about 100,000 to 60,000 m2). After January 2009, a sudden decrease of the lake surface was observed in few months, leaving a very small lake of less than 8000 m2.
- –
- Climatic data from the most reliable rain gauges in the Costantino landslide dam area indicate a significant decreasing trend in annual and autumn-winter rainfalls, with some significant increase in summer months. The SPI index shows a notable increase in the length and frequency of droughts. The most severe droughts have occurred during the last two decades: this problem is common to many other mountain areas in the Mediterranean basin.
- –
- The use of basic empirical equations shows that the general reduction of rainfalls inevitably affects the erosion rates on the Bonamico catchment: the MFI index decreased of about 17% in the last three decades. This result agrees with those obtained in other areas of the Mediterranean basin (e.g. [75,76,77,78]), but is in contrast to findings in the Mediterranean Iberian peninsula, where some increase (+8.8%) of MFI was observed (e.g. [73]).
- –
- Despite the general decrease of both precipitation and rain erosivity index, the erosivity classes within the Bonamico basin remained ‘very severe/very high’ in the last decades. This indicates that the erosion and sediment transport processes played a key role in the filling up of the Costantino dam lake, at least up to 2008.
- –
- The use of multi-temporal image observations coupled with analysis of daily rainfalls enabled individuation causes of sudden changes in lake surface after January 2009: overtopping/dam failure processes related to heavy rainfall and floods that occurred in January 2009 deeply affected the threshold of the lake outlet. Satellite images visually show the result of these processes, which can be summarized in the removal of vegetation and the mobilization of dam materials along the riverbed downstream.
In conclusion, the results of the present work indicate that Earth Observation data are fundamental in studying and monitoring land processes such as the landslide dams. It should be emphasized that, for a proper understanding of the evolution of this type of landslides and related lakes, an accurate and reliable hydro-meteorological network should be assured. This is a key point in the next few decades, since those data often are missing, especially in mountainous areas.
Acknowledgments
Authors wish to thank Giancarlo Parisi who kindly provided the most recent photos of Costantino Lake.
Author Contributions
All authors contributed equally to the research.
Conflicts of Interest
The authors declare no conflict of interest.
References
- Schuster, R.L. Landslide Dams: Processes, Risk, and Mitigation; Geotechnical Special Publication; American Society of Civil Engineering: New York, NY, USA, 1986; Volume 3, p. 164. [Google Scholar]
- Costa, J.E.; Schuster, R.L. The formation and failure of natural dams. Geol. Soc. Am. Bull. 1988, 100, 1054–1068. [Google Scholar] [CrossRef]
- Evans, S.G. The formation and failure of landslide dams: An approach to risk assessment. Ital. J. Eng. Geol. Environ. 2006, 1, 15–19. [Google Scholar]
- Schuster, R.L. Landslide Dams in the Western United States. In Proceedings of the 4th International Conference and Field Workshop on Landslides, Tokyo, Japan, 23–31 August 1985; pp. 411–418. [Google Scholar]
- Costa, J.E.; Schuster, R.L. Documented Historical Landslide Dams from Around the World; Open-File Report; United States Department of the Interior Geological Survey: Vancouver, WA, USA, 1991; pp. 91–239.
- Cencetti, C.; Conversini, P.; Ribaldi, C.; Tacconi, P. Studio dei sistemi alveo—Pianura fluviale in relazione alle interazioni con fenomeni franosi di versante. Mem. Soc. Geol. Ital. 2001, 56, 249–263. [Google Scholar]
- Cencetti, C.; Conversini, P.; Marchesini, I.; Ribaldi, C.; Tacconi, P. Pericolosità dei fenomeni franosi che interferiscono con i sistemi alveo-pianura fluviale: Un approccio probabilistico. Ital. J. Eng. Geol. Environ. 2002, 1, 49–60. [Google Scholar]
- Cencetti, C.; De Rosa, P.; Minelli, A. A sensitivity analysis on main factors involved in the landslide dam phenomena. Ital. J. Eng. Geol. Environ. 2011, 1, 61–72. [Google Scholar]
- Pirocchi, A. Laghi di sbarramento per frana nelle Alpi: Tipologia ed evoluzione. Ric. Sci. Educ. Perm. 1991, 93, 127–136. [Google Scholar]
- Canuti, P.; Casagli, N.; Ermini, L. Inventory of landslide dams in the Northern Apennine as a model for induced flood hazard forecasting. In Managing Hydro-Geological Disasters in a Vulnerate Environment; Andah, K., Ed.; CNR-GNDCI Publication 1900; CNR-GNDCI-UNESCO (IHP): Perugia, Italy, 1998; pp. 189–202. [Google Scholar]
- Casagli, N.; Ermini, L. Geomorphic analysis of landslide dam of Northern Appenine. Trans. Jpn. Geomorphol. Union 1999, 20, 219–249. [Google Scholar]
- Tacconi Stefanelli, C.; Catani, F.; Casagli, N. Geomorphological investigations on landslide dams. Geoenviron. Dis. 2015, 2, 1–15. [Google Scholar] [CrossRef]
- Dunning, S.A.; Petley, D.N.; Rosser, N.J. Landslide dams: Causes, catastrophic failure prediction and downstream consequences. Geophys. Res. Abstr. 2005, 7, 06893. [Google Scholar]
- Hungr, O. Prospects for prediction of landslide dam geometry using empirical and dynamic models. Ital. J. Eng. Geol. Environ. 2006, 1, 151–155. [Google Scholar]
- Kuo, Y.S.; Tsang, Y.C.; Chen, K.T.; Shieh, C.L. Analysis of landslide dam geometries. J. Mt. Sci. 2011, 8, 544–550. [Google Scholar] [CrossRef]
- Dal Sasso, S.F.; Sole, A.; Pascale, S.; Sdao, F.; Bateman Pinzòn, A.; Medina, V. Assessment methodology for the prediction of landslide dam hazard. Nat. Hazards Earth Syst. Sci. 2014, 14, 557–567. [Google Scholar] [CrossRef]
- Cencetti, C.; De Rosa, P.; Fredduzzi, A. Evaluation of landslide dams hazard and risk: An application in Upper Tiber Valley (central Italy). Rend. Online Soc. Geol. Ital. 2015, 35, 54. [Google Scholar] [CrossRef]
- Costa, J.E. Floods from Dam Failures; Open-File Report n. 85-560; United States Department of the Interior Geological Survey: Vancouver, WA, USA, 1987; pp. 1–59.
- Ermini, L.; Casagli, N. Criteria for a preliminary assessment of landslide dam evolution. In Landslides—Proceedings of 1st European Conference on Landslides; Rybar, J., Stemberk, J., Wagner, P., Eds.; Balkema: Prague, Czech Republic, 2002; pp. 157–162. [Google Scholar]
- Ermini, L. Gli sbarramenti d’alveo da frane: Criteri speditivi per la stesura di scenari evolutivi derivanti dalla loro formazione. In Atti del 1° Congresso Nazionale AIGA (Chieti, 19–20 Febbraio 2003); Rendina Editore: Rome, Italy, 2003; pp. 355–367. [Google Scholar]
- Dong, J.J.; Tung, Y.H.; Chen, C.C.; Liao, J.J.; Pan, Y.W. Logistic regression model for predicting the failure probability of a landslide dam. Eng. Geol. 2011, 117, 52–61. [Google Scholar] [CrossRef]
- Peng, M.; Zhang, L.M. Breaching parameters of landslide dams. Landslides 2012, 9, 13–31. [Google Scholar] [CrossRef]
- Swanson, F.J.; Oyagi, N.; Tominaga, M. Landslide dam in Japan. In Landslide Dam: Processes Risk and Mitigation; Schuster, R.L., Ed.; Geotechnical Special Publication; American Society of Civil Engineers: New York, NY, USA, 1986; Volume 3, pp. 131–145. [Google Scholar]
- Moore, I.D.; Grayson, R.B.; Ladson, A.R. Digital terrain modelling: A review of hydrological, geomorphological, and biological applications. Hydrol. Process. 1991, 5, 3–30. [Google Scholar] [CrossRef]
- Ermini, L.; Casagli, N. Prediction of the behaviour of landslide dams using a geomorphological dimensionless index. Earth Surf. Processes Landf. 2003, 28, 31–47. [Google Scholar] [CrossRef]
- Fan, X.; van Westen, C.J.; Korup, O.; Gorum, T.; Xu, Q.; Dai, F.; Huang, R.; Wang, G. Transient water and sediment storage of the decaying landslide dams induced by the 2008 Wenchuan earthquake, China. Geomorphology 2012, 171, 58–68. [Google Scholar] [CrossRef]
- Tacconi Stefanelli, C.; Segoni, S.; Casagli, N.; Catani, F. Geomorphic indexing of landslide dams evolution. Eng. Geol. 2016, 208, 1–10. [Google Scholar] [CrossRef]
- Pingyi, Z.; Tianchi, L. Flash Flooding Caused by Landslide Dam Failure. In ICIMOD, Mountain Flash Floods; ICIMOD: Kathmandu, Nepal, 2000; Newsletter No. 38. [Google Scholar]
- Schuster, R.L. Outburst debris flows from failure of natural dams. In Proceedings of the 2nd International Conference on Debris-Flow Hazard Mitigation, Taipeh, Taiwan, 16–18 August 2000. [Google Scholar]
- Li, M.H.; Hsu, M.H.; Hsieh, L.S.; Teng, W.H. Inundation Potentials Analysis for Tsao-Ling Landslide Lake Formed by Chi-Chi Earthquake in Taiwan. Nat. Hazards 2002, 25, 289–303. [Google Scholar] [CrossRef]
- Korup, O.; Strom, A.L.; Weidinger, J.T. Fluvial response to large rock-slope failures: Examples from the Himalayas, the Tien Shan, and the southern alps in New Zealand. Geomorphology 2006, 78, 3–21. [Google Scholar] [CrossRef]
- Yoshino, K.; Uchida, T.; Shimizu, T.; Tamura, K. Geomorphic changes of a landslide dam by overtopping erosion. Ital. J. Eng. Geol. Environ. 2011, 797–804. [Google Scholar] [CrossRef]
- Fread, D.L. DAMBRK: The NWS Dam-Break Flood Forecasting Model; Hydrologic Research Laboratory, National Weather Service: Silver Spring, MD, USA, 1984.
- Fread, D.L. BREACH: An Erosion Model for Earthen Dam Failures; Hydrologic Research Laboratory, National Weather Service: Silver Spring, MD, USA, 1987.
- Fread, D.L. The NWS Dambrk Model: Theoretical Background/User Documentation; National Weather Service, NOAA: Silver Spring, MD, USA, 1991.
- Walder, J.S.; O’Connor, J.E. Methods for predicting peak discharge of floods caused by failure of natural and earthen dams. Water Resour. Res. 1997, 33, 2337–2348. [Google Scholar] [CrossRef]
- Tabata, S.; Ikeshima, T.; Inoue, K.; Mizuyama, T. Study on prediction of peak discharge in floods caused by landslide dam failure. J. Jpn. Soc. Eros. Control Eng. 2001, 54, 73–76. [Google Scholar]
- Cencetti, C.; Fredduzzi, A.; Marchesini, I.; Naccini, M.; Tacconi, P. Some considerations about the simulation of the breach channel erosion on landslide dams. Comput. Geosci. 2006, 10, 201–219. [Google Scholar] [CrossRef]
- Ishikawa, Y.; Irasawa, M.; Kuang, S.F. Study on prediction and countermeasures of flood disasters caused by landslide dam failure. J. Jpn. Soc. Eros. Control Eng. 1992, 45, 14–23. [Google Scholar]
- Schuster, R.L. Risk-reduction measures for landslide dams. Ital. J. Eng. Geol. Environ. 2006, 1, 9–13. [Google Scholar]
- Schuster, R.L.; Costa, J.E. Effects of landslide damming on hydroelectric projects. In Proceedings of the 5th International Association of Engineering Geology, Buenos Aires, Argentina, 20–25 October 1986; CRC Press: BOca Ratón, FL, USA, 1990; pp. 1295–1307. [Google Scholar]
- Ergenzinger, P. A conceptual geomorphological model for the development of a Mediterranean river basin under neotectonic stress (Buonamico basin, Calabria, Italy). In Erosion, Debris Flows and Environment in Mountain Regions; Walling, D.E., Davies, T.R., Hasholt, B., Eds.; International Association of Hydrological Sciences (IAHS): Wallingford, UK, 1992; Volume 209, pp. 51–60. [Google Scholar]
- Petrucci, O.; Polemio, M. Catastrophic geomorphological events and the role of rainfalls in South-Eastern Calabria (Southern Italy). In Proceedings of the 2nd EGS Plinius Conference on Mediterranean Storms, Siena, Italy, 16–18 October 2000; Editoriale Bios: Cosenza, Italy, 2000; pp. 449–459. [Google Scholar]
- Sorriso-Valvo, M.; Terranova, O. The Calabrian fiumara. Z. Geomorphol. 2006, 143, 105–121. [Google Scholar]
- Sorriso-Valvo, M. Mass Movements and Accelerated Erosion in the Buonamico Basin; Berliner Geowissenschaftliche Abhandlungen: Berlin, Germany, 1984. [Google Scholar]
- Guerricchio, A.; Melidoro, G. Segni premonitori e collassi delle grandi frane della valle della fiumara Buonamico (Aspromonte, Calabria). Geol. Appl. Idrogeol. 1973, 8, 315–346. [Google Scholar]
- Ibbeken, H.; Schleyer, R. Source and Sediment: A Case Study of Provenance and Mass Balance at an Activeplatemargin (Calabria, Southern Italy); Pangaea: Bremerhaven, Germany, 1991. [Google Scholar]
- Calcaterra, D.; Parise, M. Weathering in the crystalline rocks of Calabria, Italy, and relationships to landslides. Eng. Geol. Spec. Geol. Soc. Lond. 2010, 23, 105–130. [Google Scholar] [CrossRef]
- Delfino, A. L’Aspromonte; Falzea Editore: Reggio Calabria, Italy, 2006; p. 128. [Google Scholar]
- Cencetti, C.; De Rosa, P.; Fredduzzi, A. The Landslide Dam of Ventia Creek (Umbria, Central Italy). In Engineering Geology for Society and Territory—Volume 2. Landslide Processes; Lollino, G., Giordan, D., Crosta, G.B., Corominas, J., Azzam, R., Wasowski, J., Sciarra, N., Eds.; Springer: Cham, Switzerland, 2015; pp. 1125–1128. [Google Scholar]
- ISPRA, CARG Project (Geological Cartography). Geological Map “Foglio 603 Bovalino”; ISPRA—Servizio Geologico d’Italia: Rome, Italy, 2005. [Google Scholar]
- Cambi, C.; Valigi, D.; Di Matteo, L. Hydrogeological study of data-scarce limestone massifs: The case of Gualdo Tadino and Monte Cucco structures (Central Apennines, Italy). Boll. Geofis. Teor. Appl. 2010, 51, 345–360. [Google Scholar]
- Di Matteo, L.; Valigi, D.; Cambi, C. Climatic characterization and response of water resources to climate change in limestone areas: Some considerations on the importance of geological setting. J. Hydrol. Eng. 2013, 18, 773–779. [Google Scholar] [CrossRef]
- Peterson, T.C.; Easterling, D.R.; Karl, T.R.; Groisman, P.; Nicholls, N.; Plummer, N.; Torok, S.; Auer, I.; Boehm, R.; Gullett, D.; et al. Homogeneity adjustments of in situ atmospheric climate data: A review. Int. J. Climatol. 1998, 18, 1493–1517. [Google Scholar] [CrossRef]
- Mann, H.B. Nonparametric tests against trend. Econometrica 1945, 13, 245–259. [Google Scholar] [CrossRef]
- Kendall, M.G. Rank Correlation Methods; Griffin: London, UK, 1975. [Google Scholar]
- McKee, T.B.; Doesken, N.J.; Kleist, J. The relationship of drought frequency and duration to time scales. In Proceedings of the 8th Conference of Applied Climatology, Anaheim, CA, USA, 17–22 January 1993; American Meteorological Society: Boston, MA, USA, 1993; pp. 179–184. [Google Scholar]
- Edwards, D.C.; McKee, T.B. Characteristics of 20th Century Drought in the United States at Multiple Time Scales. Available online: http://ccc.atmos.colostate.edu/edwards.pdf (accessed on 25 January 2017).
- WMO. Experts Agree on a Universal Drought Index to Cope with Climate Risks. WMO Press Release No. 872. 2009. Available online: http://www.wmo.int/pages/prog/wcp/agm/meetings/wies09/documents/872_en.pdf (accessed on 5 March 2017).
- Buttafuoco, G.; Caloiero, T. Drought events at different timescales in southern Italy (Calabria). J. Maps 2014, 10, 529–537. [Google Scholar] [CrossRef]
- Vicente-Serrano, S.M.; López-Moreno, J.I. Hydrological response to different time scales of climatological drought: An evaluation of the standardized precipitation index. Hydrol. Earth Syst. Sci. 2005, 9, 523–533. [Google Scholar] [CrossRef]
- Naresh Kumar, M.; Murthy, C.S.; SeshaSai, M.V.R.; Roy, P.S. On the use of Standardized Precipitation Index (SPI) for drought intensity assessment. Meteorol. Appl. 2009, 16, 381–389. [Google Scholar] [CrossRef]
- Tigkas, D.; Vangelis, H.; Tsakiris, G. DrinC: A software for drought analysis based on drought indices. Earth Sci. Inform. 2015, 8, 697–709. [Google Scholar] [CrossRef]
- Tsakiris, G.; Vangelis, H. Establishing a Drought Index Incorporating Evapotranspiration. Eur. Water 2005, 9, 3–11. [Google Scholar]
- Coscarelli, R.; Gaudio, R.; Caloiero, T. Climatic trends: An investigation for a Calabrian basin (southern Italy). IAHS Publ. 2004, 286, 255–266. [Google Scholar]
- Cotecchia, V.; Casarano, D.; Polemio, M. Characterisation of rainfall trend and drought periods in southern Italy from 1821 to 2001. In Proceedings of 1st Italian-Russian Workshop New Trends in Hydrology; Gaudio, R., Ed.; CNR-GNDCI Publ. 2823; CNR: Rome, Italy, 2004. [Google Scholar]
- Ferrari, E.; Terranova, O. Non-parametric detection of trends and change point years in monthly and annual rainfalls. In Proceedings of 1st Italian-Russian Workshop New Trends in Hydrology; Gaudio, R., Ed.; CNR-GNDCI Publ. 2823; CNR: Rome, Italy, 2004. [Google Scholar]
- Polemio, M.; Casarano, D. Climate change, drought and groundwater availability in southern Italy. In Climate Change and Groundwater; Dragoni, W., Ed.; Special Publications, No. 288; Geological Society: London, UK, 2008; pp. 39–51. [Google Scholar]
- Caloiero, T.; Coscarelli, R.; Ferrari, E.; Mancini, M. Trend detection of annual and seasonal rainfall in Calabria (Southern Italy). Int. J. Climatol. 2011, 31, 44–56. [Google Scholar] [CrossRef]
- Caloiero, T.; Sirangelo, B.; Coscarelli, R.; Ferrari, E. An Analysis of the Occurrence Probabilities of Wet and Dry Periods through a Stochastic Monthly Rainfall Model. Water 2016, 8, 39. [Google Scholar] [CrossRef]
- Fournier, F. Climat et Erosion; Presses Universitaires de France: Paris, France, 1960. [Google Scholar]
- Arnoldus, H.M.J. An approximation of the rainfall factor in the universal Soil Loss Equation. In Assessment of Erosion; FAO Land and Water Development Division, Wiley & Sons: Chichester, UK, 1980; pp. 127–132. [Google Scholar]
- De Luis, M.; Gonzalez-Hidalgo, J.C.; Longares, L.A.; Stepanek, P. Seasonal precipitation trends in Mediterranean Iberian Peninsula in second half of XX century. Int. J. Climatol. 2009. [Google Scholar] [CrossRef]
- European Environment Agency. CORINE—Soil Erosion Risk and Important Land Resources in the Southern Regions of the European Community; Final Report EUR 13233-EN; Publications Office of the European Union: Luxembourg, Luxembourg, 1992.
- Dragoni, W.; Valigi, D. Some considerations regarding climatic change and specific erosion in Central Italy. In Geomorphology and Global Environmental Change; Slaymaker, O., Ed.; John Wiley & Sons: Hoboken, NJ, USA, 2000; pp. 197–208. [Google Scholar]
- Gullà, G.; Antronico, L.; Borrelli, L.; Caloiero, T.; Coscarelli, R.; Iovine, G.; Nicoletti, P.G.; Pasqua, A.A.; Petrucci, O.; Terranova, O. Indicazioni conoscitive e metodologiche connesse all’evento di dissesto idrogeologico dell’autunno-inverno 2008–2009 in Calabria. Geol. Calabria 2009, 10, 4–21. [Google Scholar]
- Angulo-Martınez, M.; Beguerıa, S. Do atmospheric teleconnection patterns influence rainfall erosivity? A comparison between NAO, MO and WEMO in NE Spain, 1955–2006. J. Hydrol. 2012, 450, 168–179. [Google Scholar] [CrossRef]
- Meddi, M. Sediment transport and rainfall erosivity evolution in twelve basins in Central and Western Algeria. J. Urban Environ. Eng. 2013, 7, 253–263. [Google Scholar] [CrossRef]
Figure 1.
Location map of the study area.
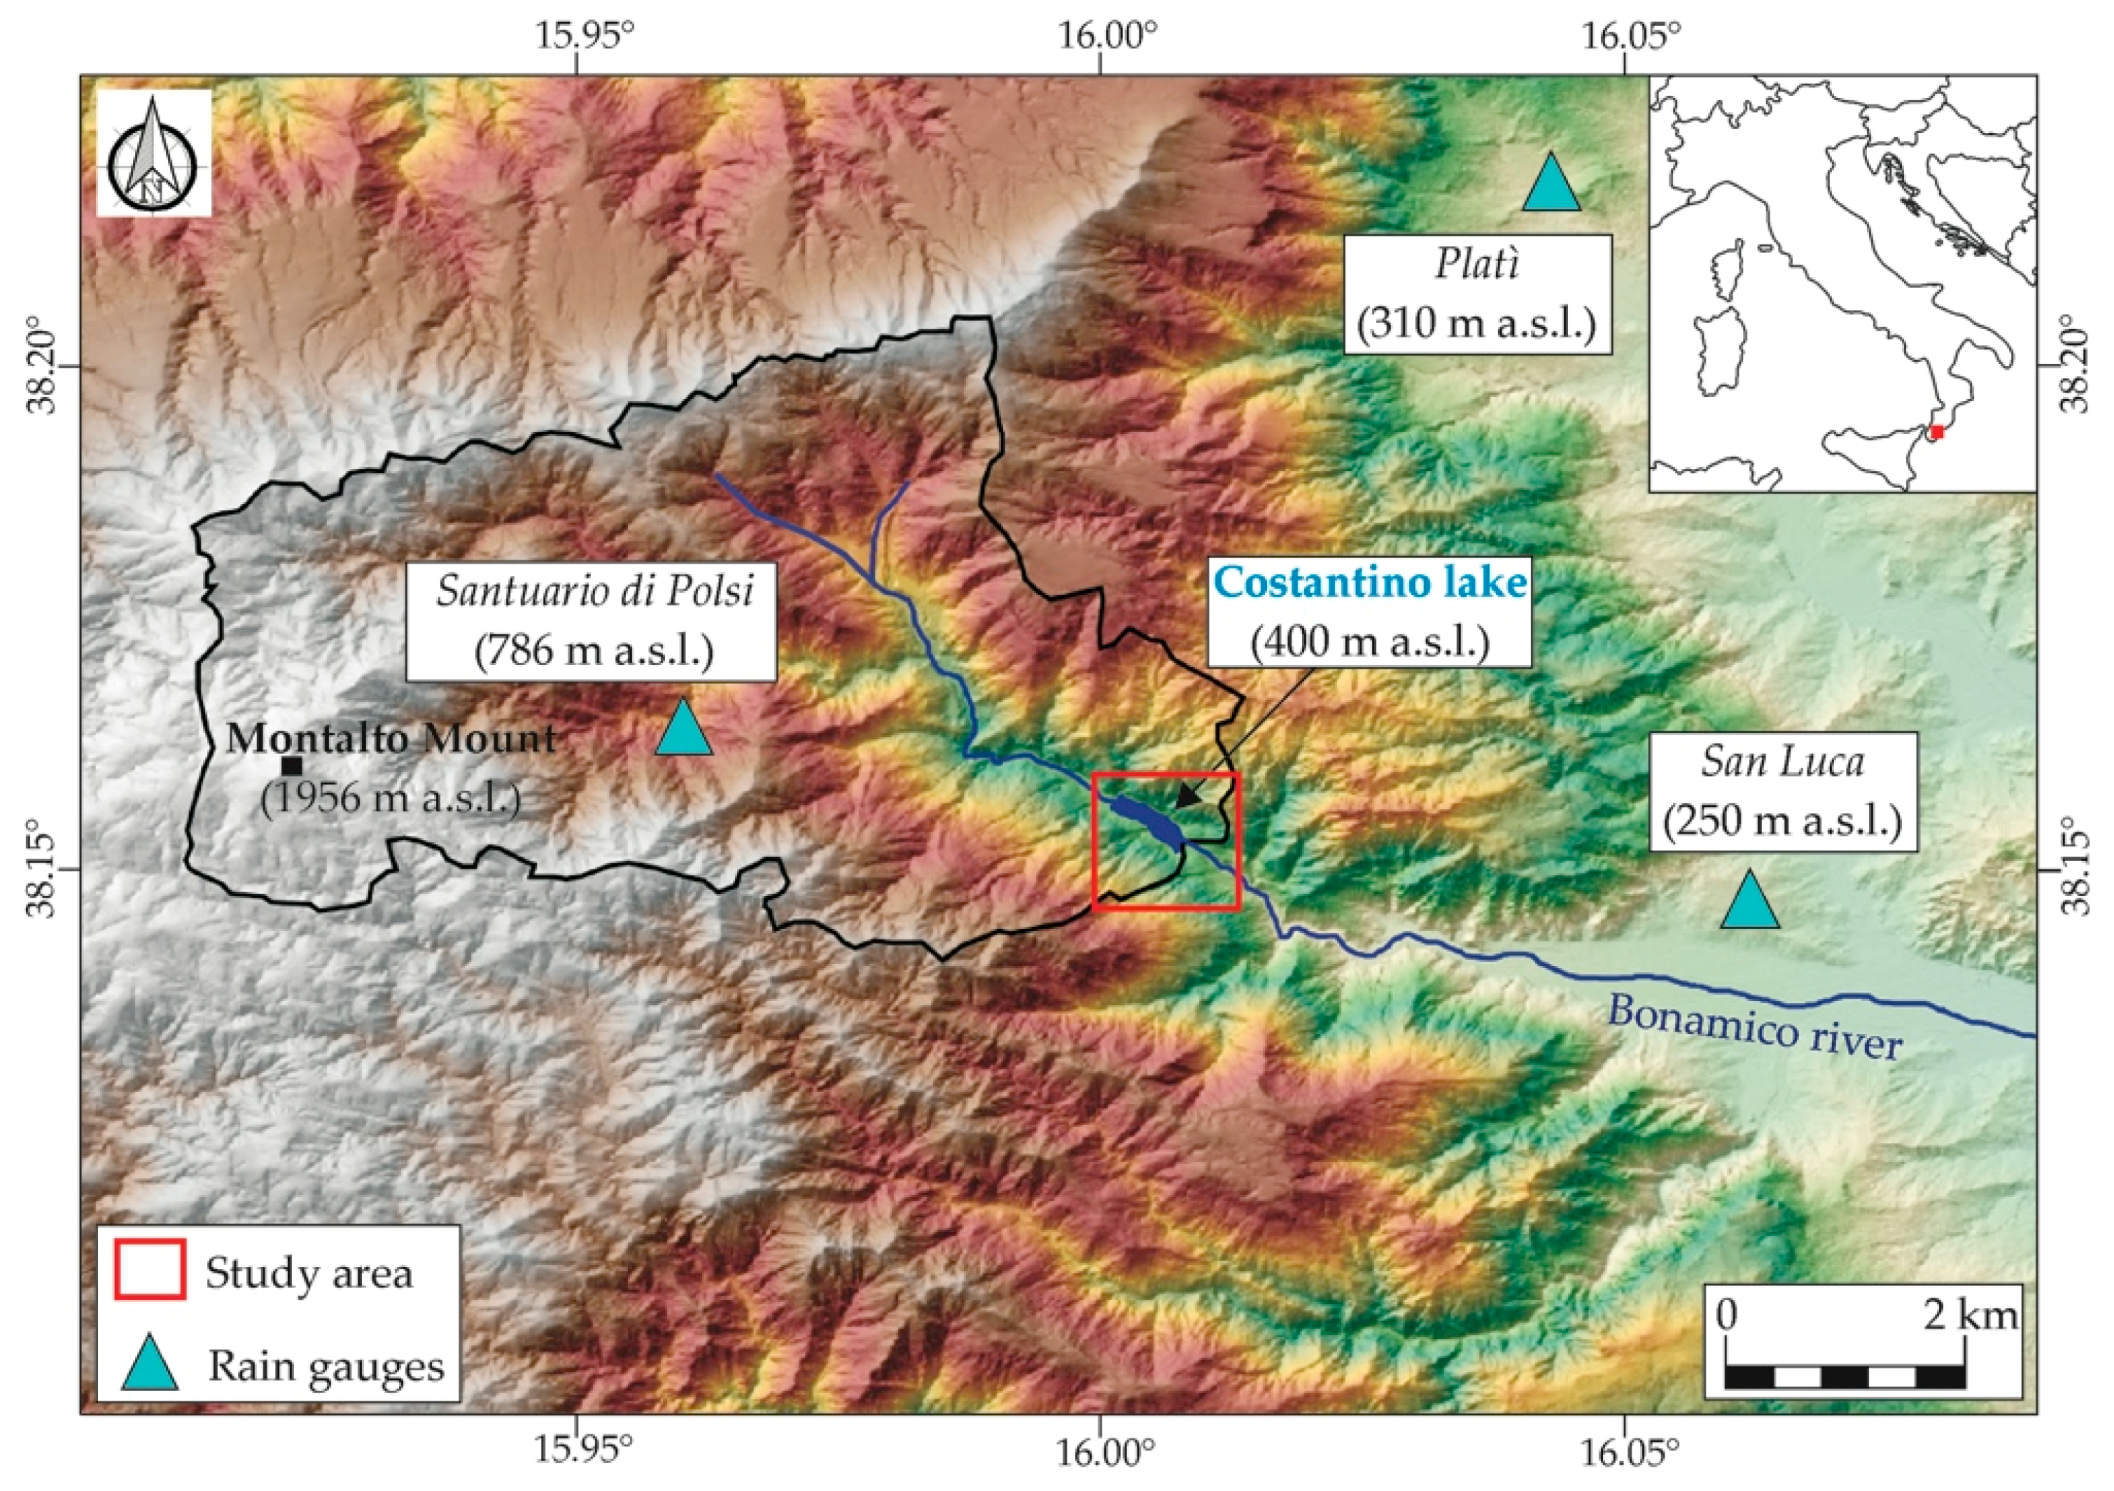
Figure 2.
Photos taken immediately after the landslide events of January 1973. On the left the Bonamico river valley, on the right the diffuse erosion along the Costantino Lake outflow and on the landslide dam body. Photos taken from [49] (used with permission of the copyright holder).
Figure 2.
Photos taken immediately after the landslide events of January 1973. On the left the Bonamico river valley, on the right the diffuse erosion along the Costantino Lake outflow and on the landslide dam body. Photos taken from [49] (used with permission of the copyright holder).

Figure 3.
Twelve-month SPI calculated from meteorological data of Platì station. The SPI computation was carried out with DrinC software [63].
Figure 3.
Twelve-month SPI calculated from meteorological data of Platì station. The SPI computation was carried out with DrinC software [63].

Figure 4.
Evolution of lake surface by using the imagery database in Table 3.
Figure 4.
Evolution of lake surface by using the imagery database in Table 3.
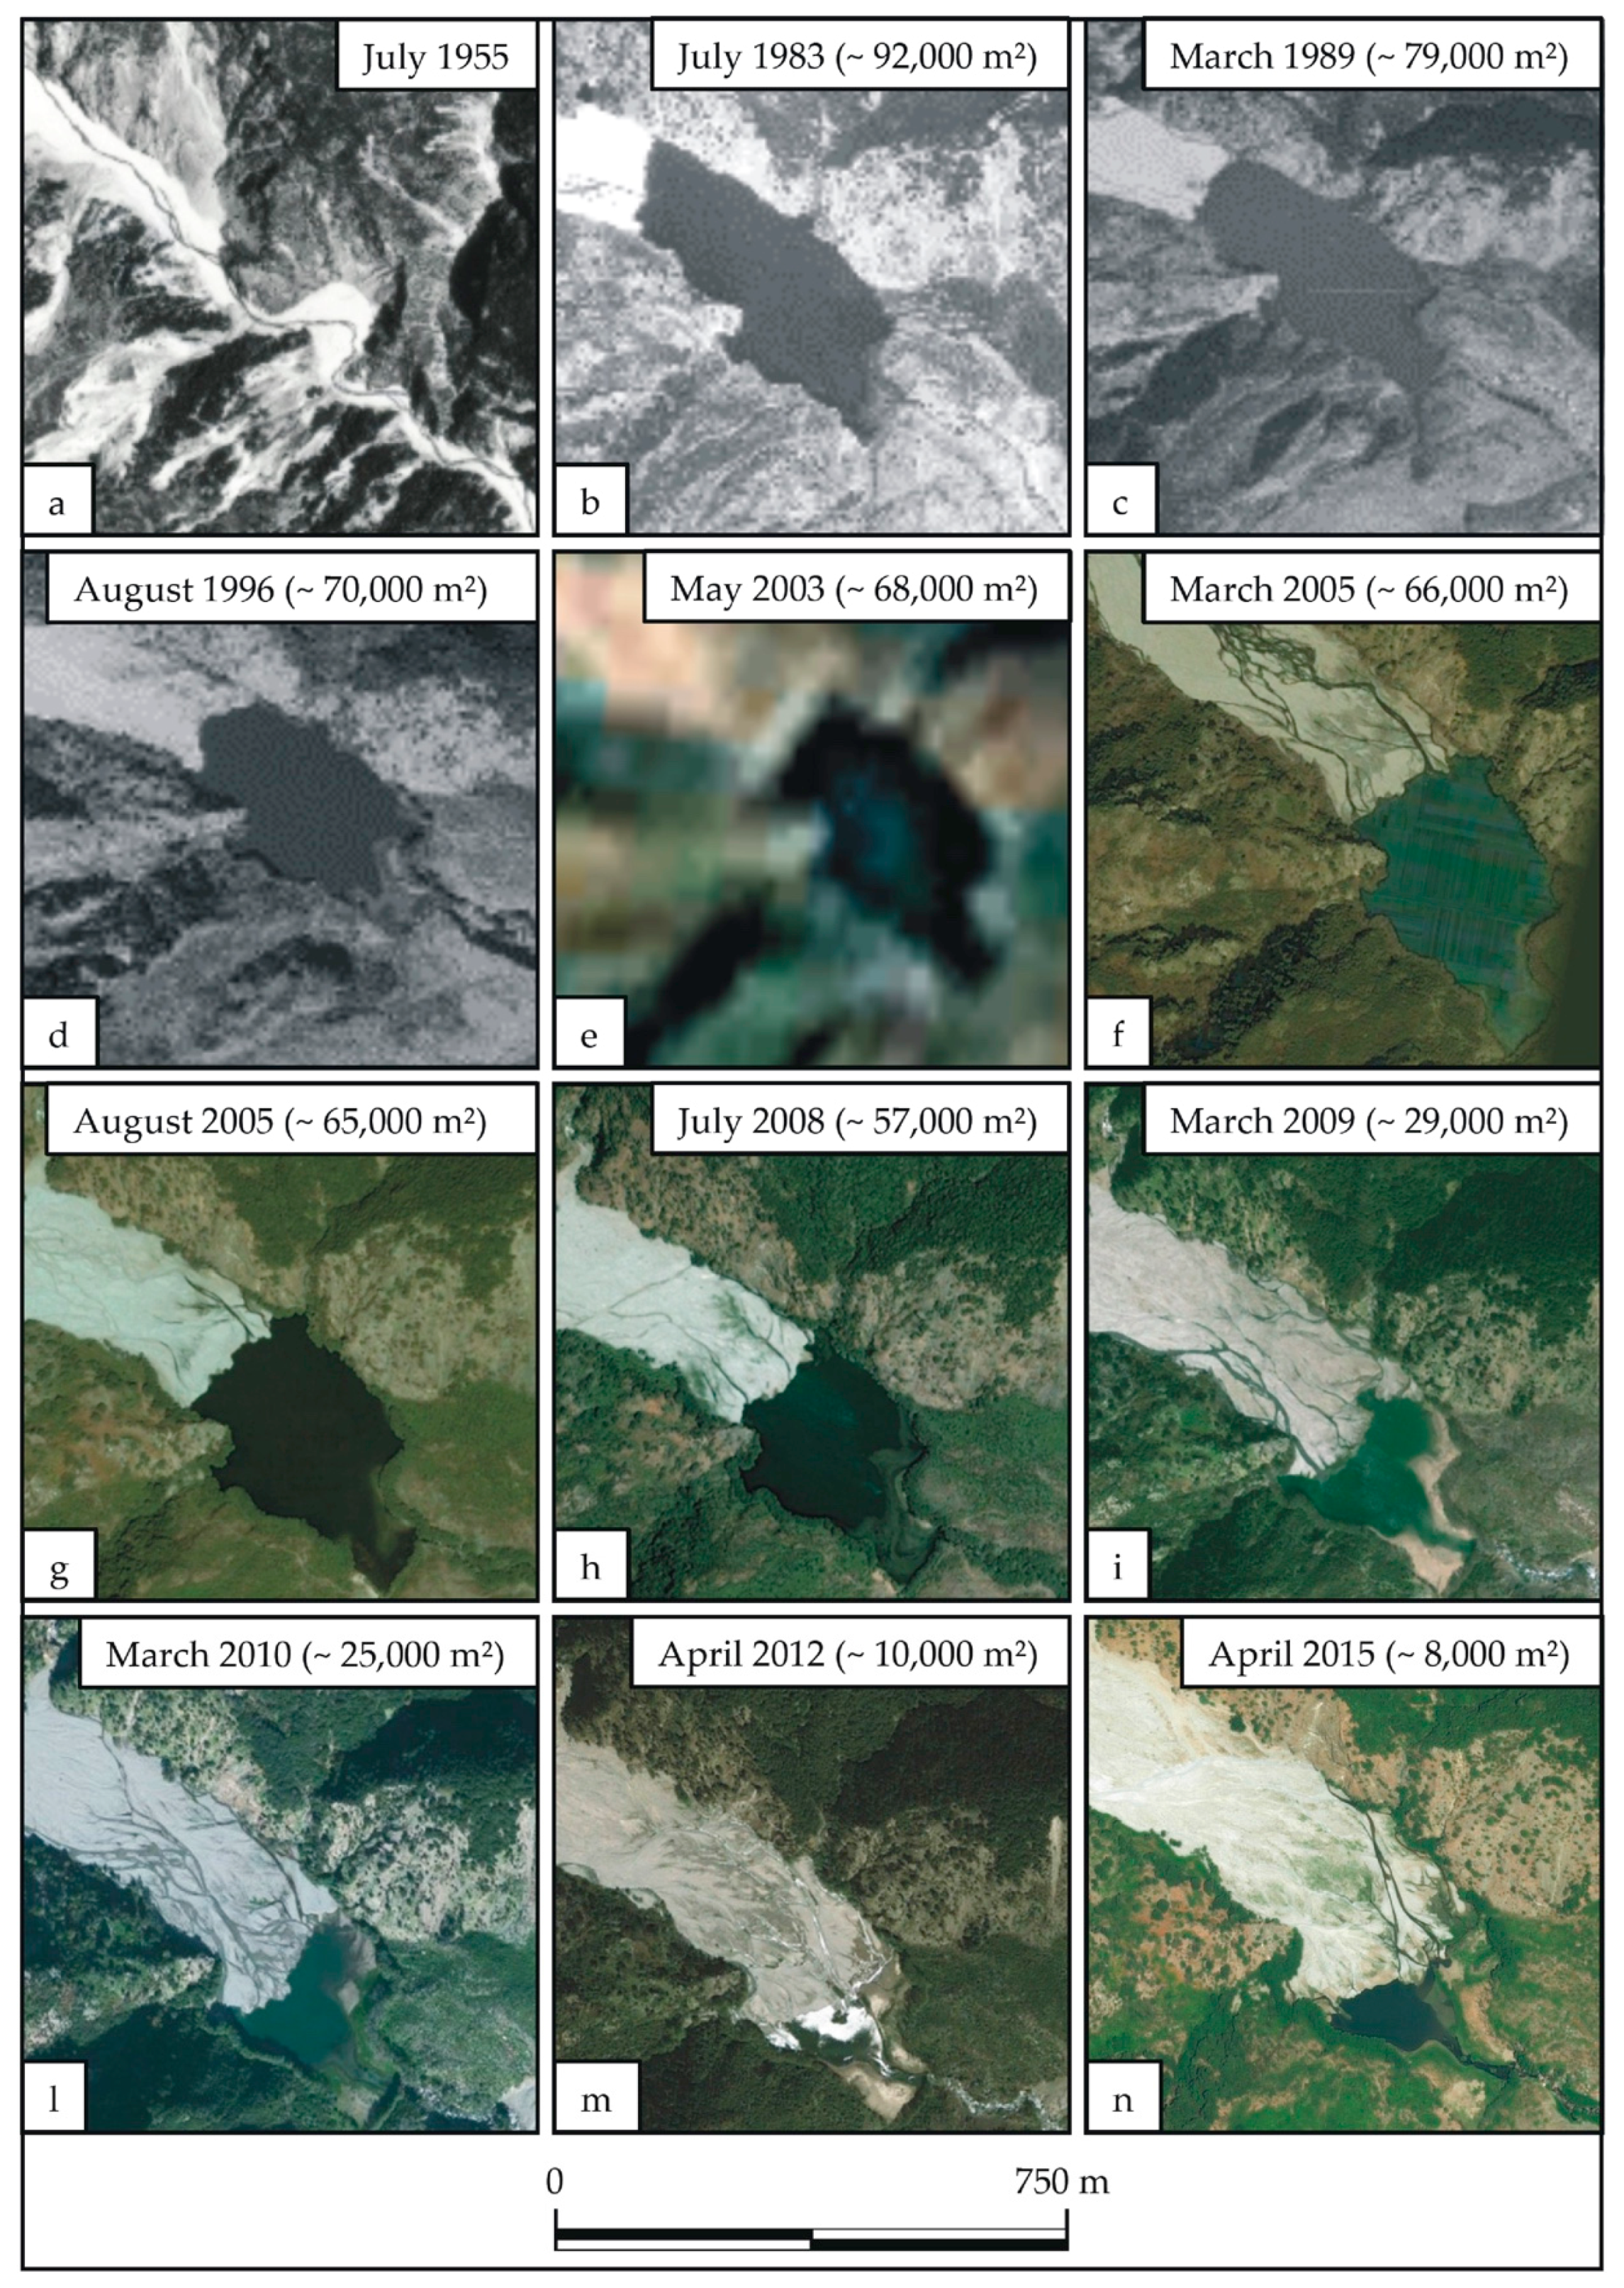
Figure 5.
Evolution of lake surface during the 1983–2015 period as resulted from the analysis of the imagery database in Table 3.
Figure 5.
Evolution of lake surface during the 1983–2015 period as resulted from the analysis of the imagery database in Table 3.
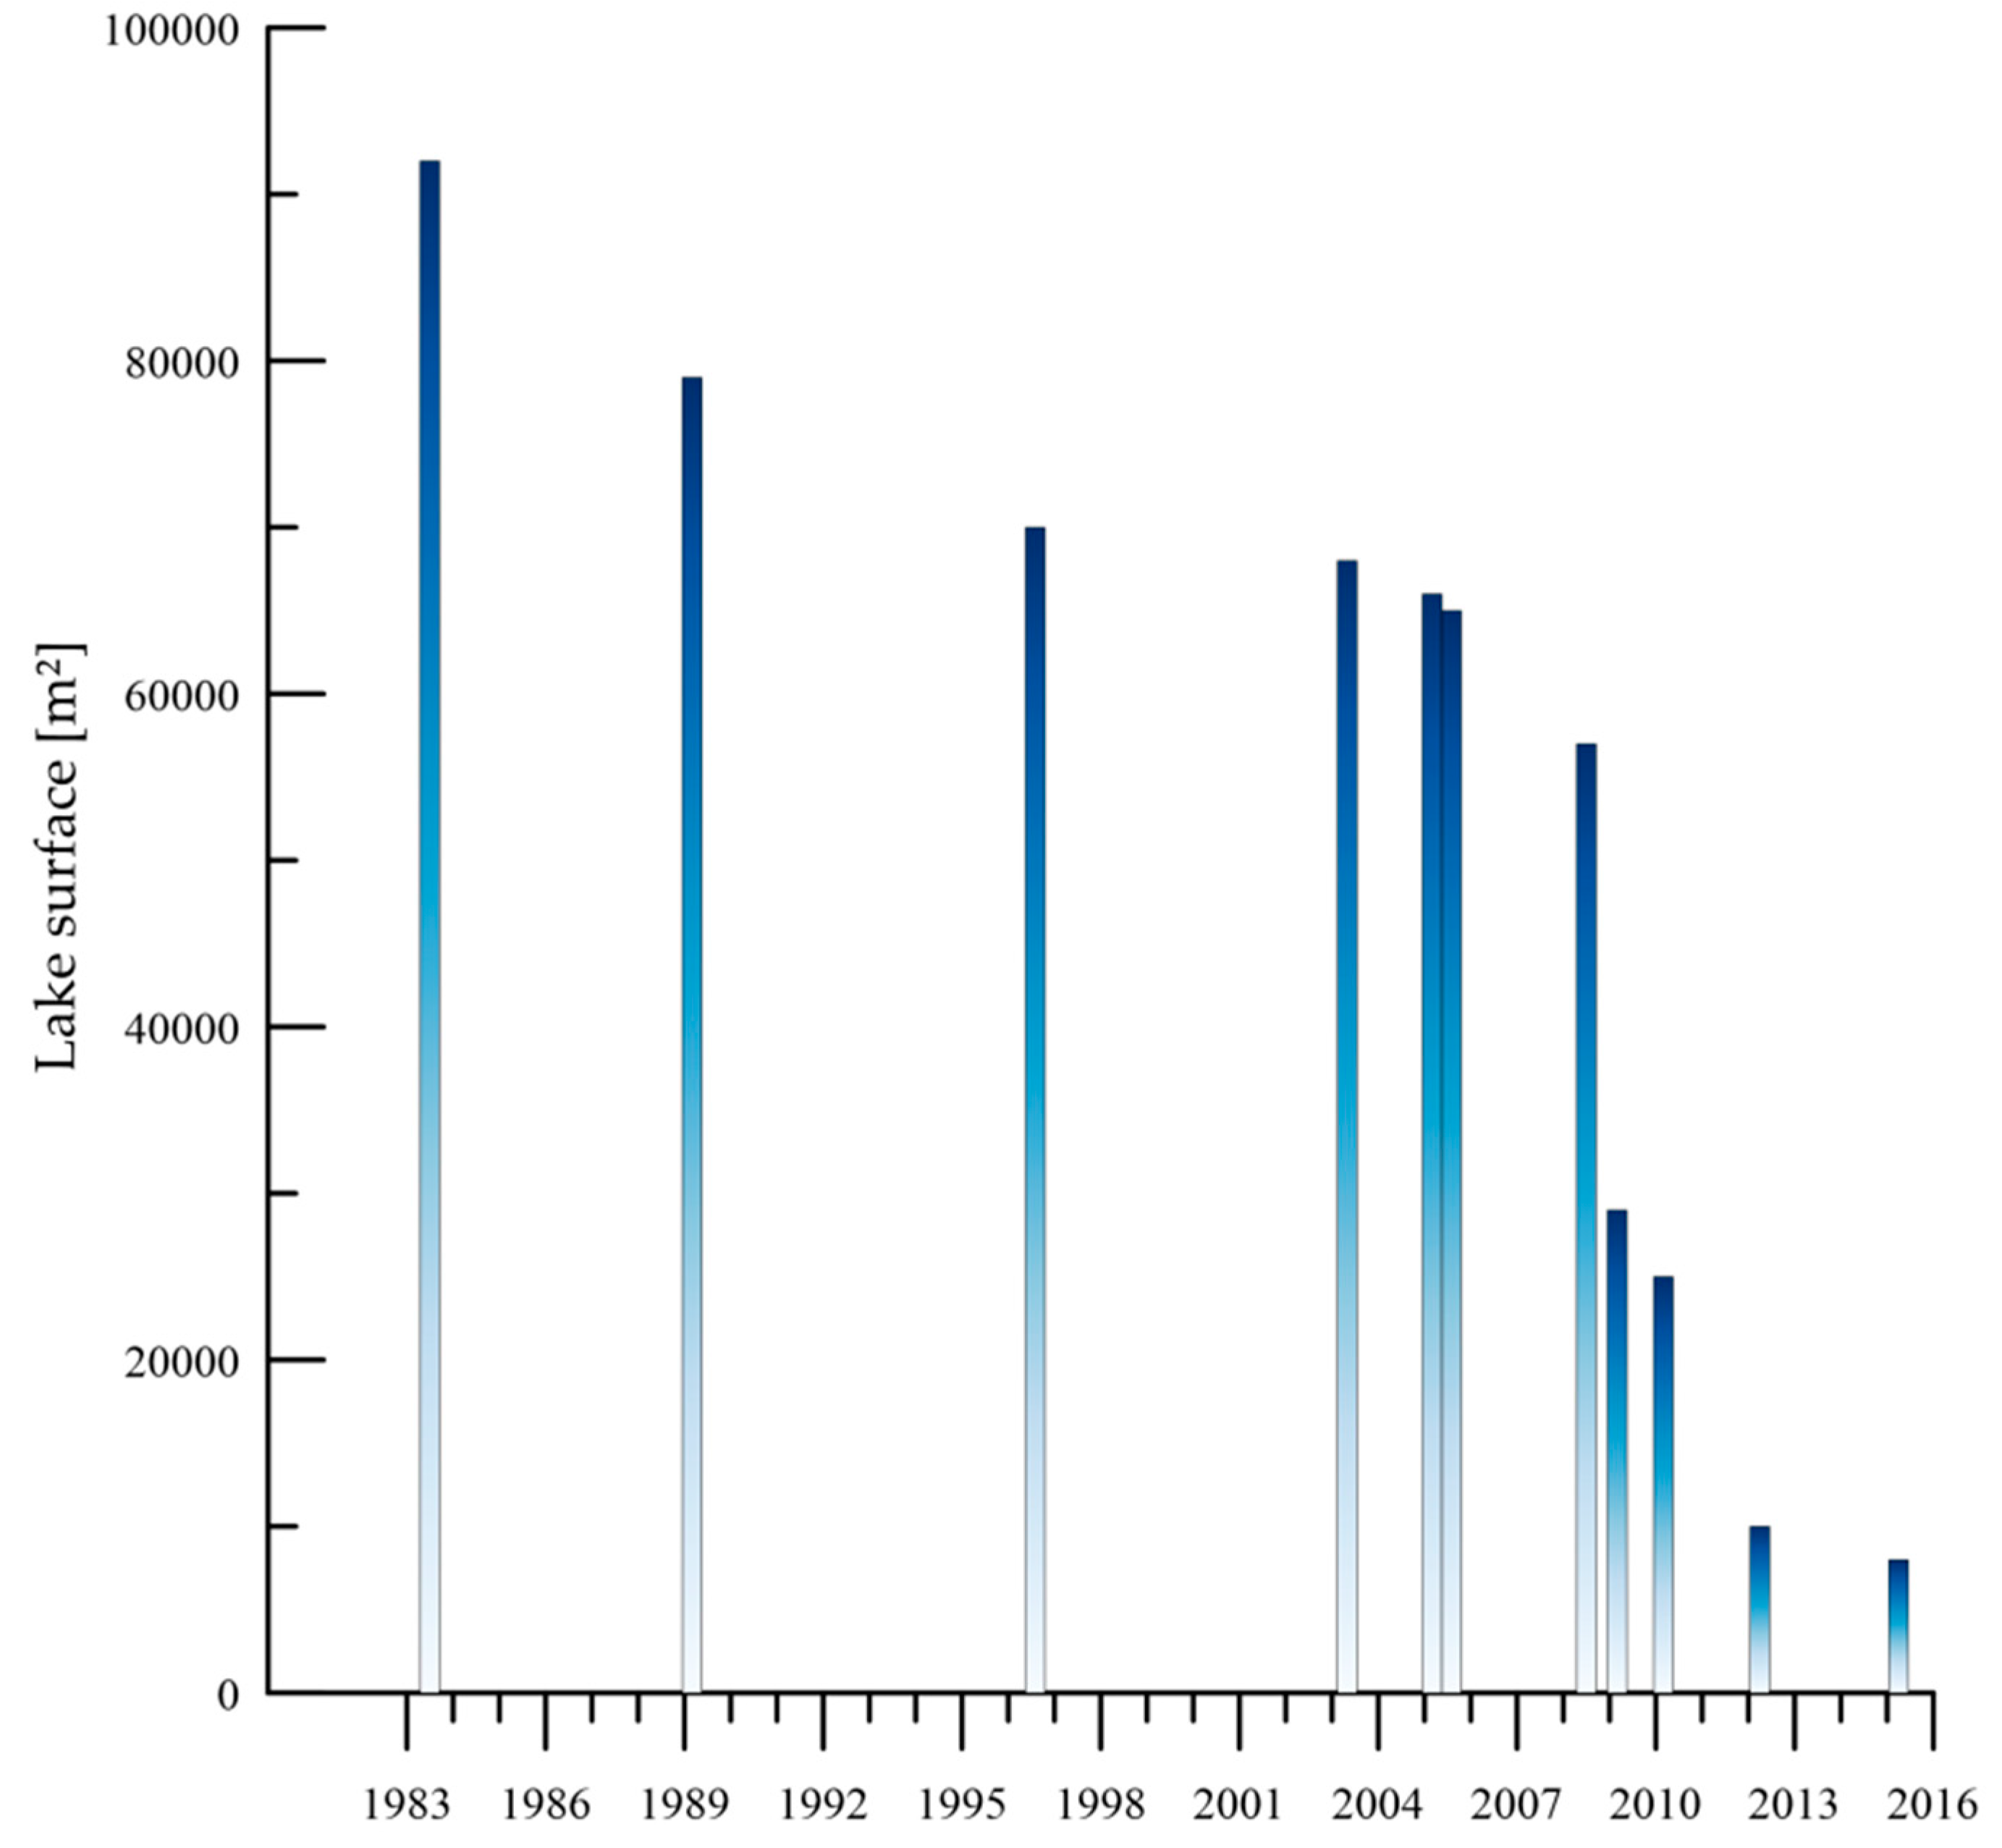
Figure 6.
Photos of Costantino Lake in 2012. (a) Detail of sediment accumulation in the area originally occupied by the lake; (b) vegetative colonization along the river and the small surviving lake.
Figure 6.
Photos of Costantino Lake in 2012. (a) Detail of sediment accumulation in the area originally occupied by the lake; (b) vegetative colonization along the river and the small surviving lake.
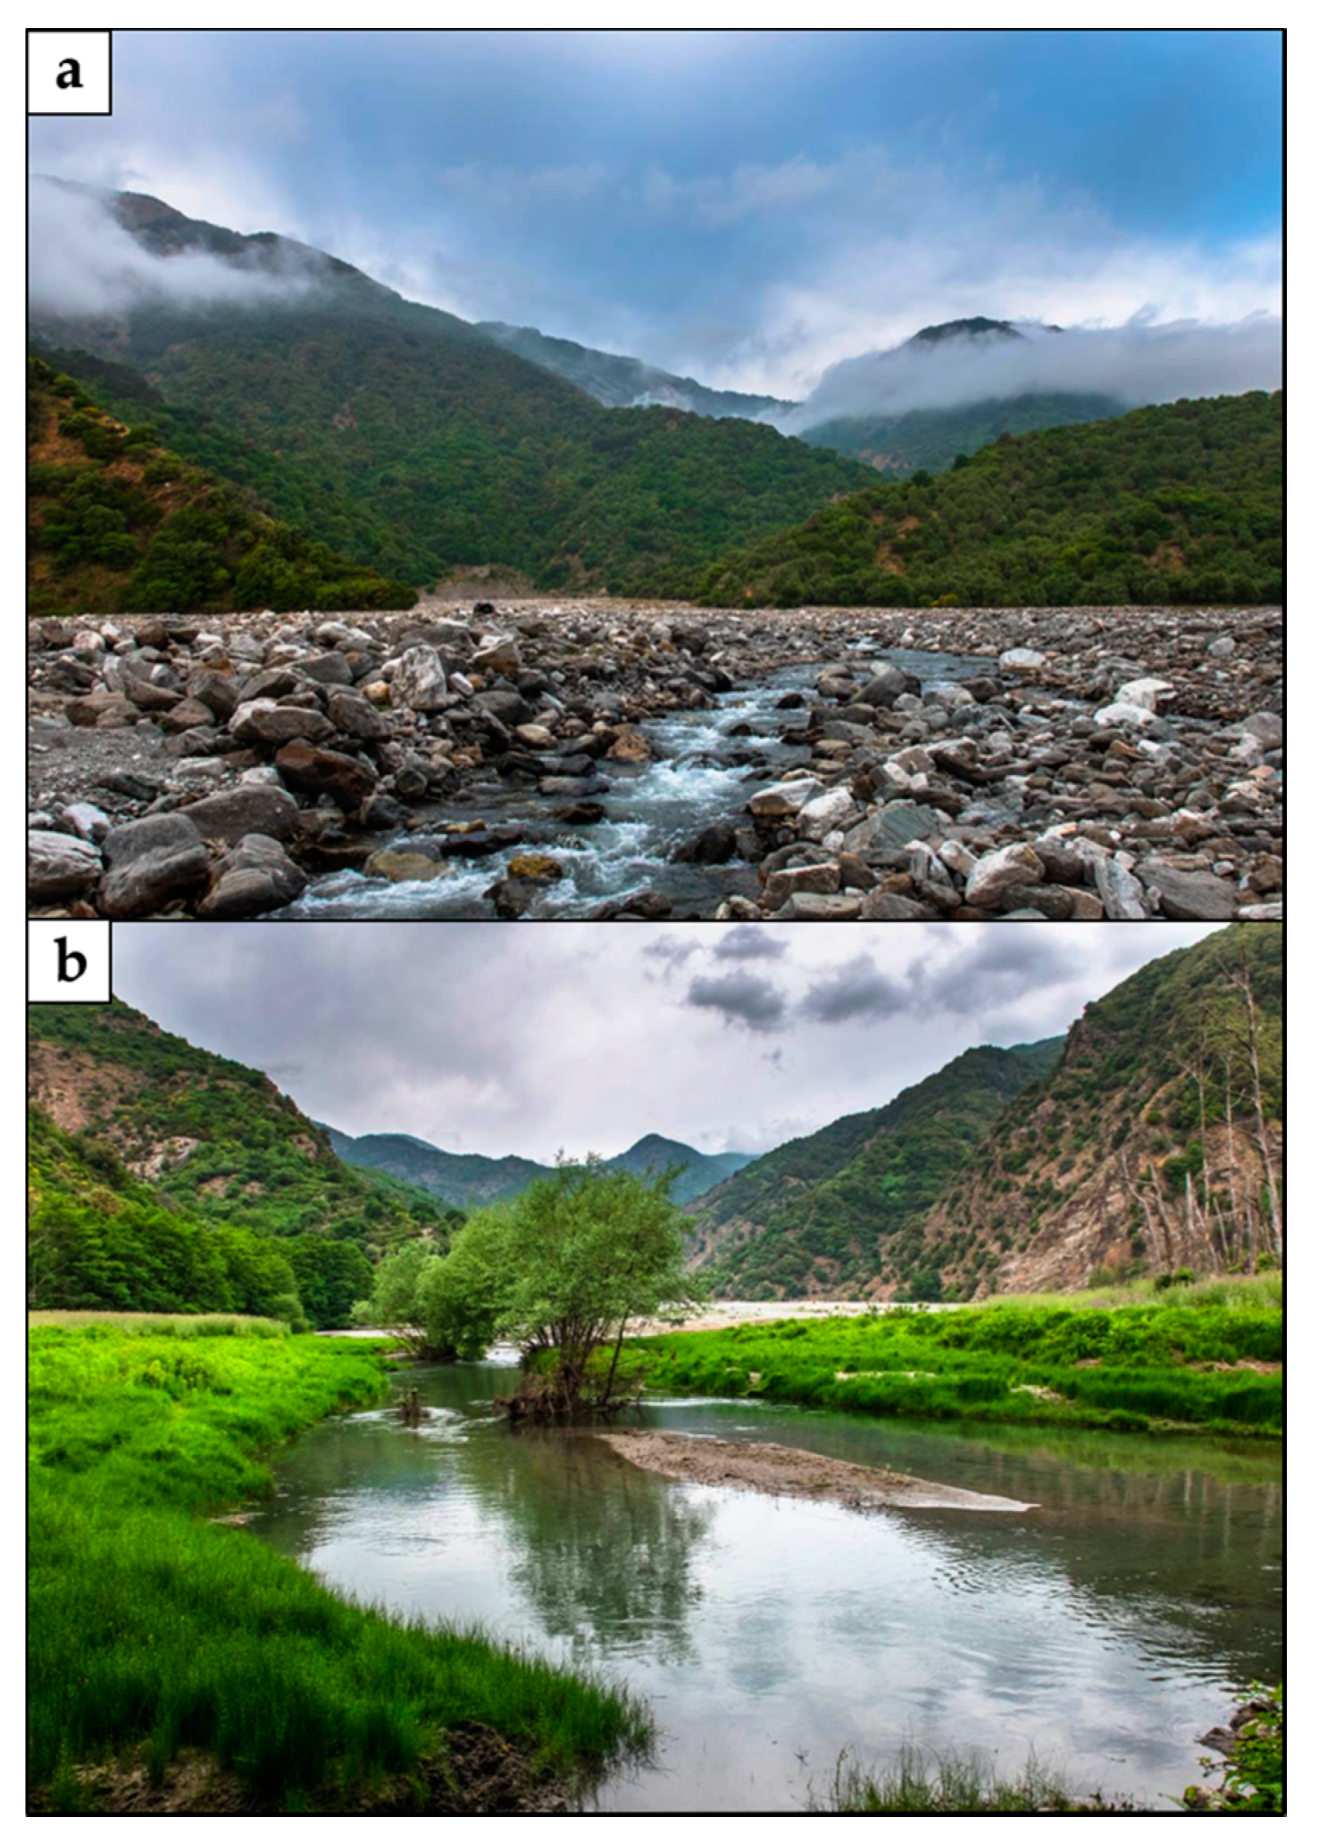
Figure 7.
Daily rainfalls registered by the available rain gauges during: (a) the occurrence of the Costantino landslide in January 1973; (b) the overtopping/dam failure in December 2008–January 2009.
Figure 7.
Daily rainfalls registered by the available rain gauges during: (a) the occurrence of the Costantino landslide in January 1973; (b) the overtopping/dam failure in December 2008–January 2009.

Figure 8.
(a) Fournier index (FI); and (b) modified Fournier index (MFI) for Platì and San Luca stations, five year by five year, starting from 1951.
Figure 8.
(a) Fournier index (FI); and (b) modified Fournier index (MFI) for Platì and San Luca stations, five year by five year, starting from 1951.


Table 1.
Characteristics of the available meteorological stations (for locations, see Figure 1).
Table 1.
Characteristics of the available meteorological stations (for locations, see Figure 1).
| Station | Code | Type | Elevation (m a.s.l.) | Period | Missing Data |
|---|---|---|---|---|---|
| Platì | 2230 | Rain gauge | 310 | 1920–2016 | 4% |
| San Luca | 2260 | Rain gauge | 250 | 1924–2016 | 5% (no data during 2001–2004) |
| Santuario di Polsi | 2250 | Rain gauge | 786 | 1928–2005 | 27% (no data during 1973–1992) |
Table 2.
Standardized Precipitation Index (SPI) classification (adapted from [57]).
Table 2.
Standardized Precipitation Index (SPI) classification (adapted from [57]).
| SPI Values | Classification | Abbreviation |
|---|---|---|
| ≥2.0 | Extremely wet | EW |
| 1.5–1.99 | Very wet | VW |
| 1.0–1.49 | Moderately wet | MW |
| 0.99–0 | Normal | N |
| 0–−0.99 | Near Normal | NN |
| −1.0–−1 49 | Moderately drought | MD |
| −1.5–−1.99 | Severe drought | SD |
| ≤−2.0 | Extremely drought | ED |
Table 3.
Characteristics of the imagery database used in the study area: AP: aerial photos; OP: orthophotos; SI: satellite images. (Source: Ministero dell’Ambiente e della Tutela del Territorio e del Mare, Istituto Geografico Militare, Google, Bing).
Table 3.
Characteristics of the imagery database used in the study area: AP: aerial photos; OP: orthophotos; SI: satellite images. (Source: Ministero dell’Ambiente e della Tutela del Territorio e del Mare, Istituto Geografico Militare, Google, Bing).
| Labels of images | Type | Season | Date |
|---|---|---|---|
| a | AP black/white | Summer | July 1955 |
| b | AP black/white | Summer | July 1983 |
| c | OP black/white | Winter | March 1989 |
| d | OP black/white | Summer | August 1996 |
| e | SI colour | Spring | May 2003 |
| f | SI colour | Winter | March 2005 |
| g | SI colour | Summer | August 2005 |
| h | SI colour | Summer | July 2008 |
| i | SI colour | Spring | March 2009 |
| l | SI colour | Winter | March 2010 |
| m | SI colour | Spring | April 2012 |
| n | SI colour | Spring | April 2015 |
© 2017 by the authors. Licensee MDPI, Basel, Switzerland. This article is an open access article distributed under the terms and conditions of the Creative Commons Attribution (CC BY) license (http://creativecommons.org/licenses/by/4.0/).
Share and Cite
MDPI and ACS Style
Cencetti, C.; Di Matteo, L.; Romeo, S. Analysis of Costantino Landslide Dam Evolution (Southern Italy) by Means of Satellite Images, Aerial Photos, and Climate Data. Geosciences 2017, 7, 30. https://doi.org/10.3390/geosciences7020030
AMA Style
Cencetti C, Di Matteo L, Romeo S. Analysis of Costantino Landslide Dam Evolution (Southern Italy) by Means of Satellite Images, Aerial Photos, and Climate Data. Geosciences. 2017; 7(2):30. https://doi.org/10.3390/geosciences7020030
Chicago/Turabian StyleCencetti, Corrado, Lucio Di Matteo, and Saverio Romeo. 2017. "Analysis of Costantino Landslide Dam Evolution (Southern Italy) by Means of Satellite Images, Aerial Photos, and Climate Data" Geosciences 7, no. 2: 30. https://doi.org/10.3390/geosciences7020030
Note that from the first issue of 2016, this journal uses article numbers instead of page numbers. See further details here.