Evidence of Road Salt in New Hampshire’s Snowpack Hundreds of Meters from Roadways


Institute for the Study of Earth, Oceans, and Space, University of New Hampshire, 8 College Rd, Morse Hall, Durham, NH 03824, USA
*
Author to whom correspondence should be addressed.
Geosciences 2017, 7(3), 54; https://doi.org/10.3390/geosciences7030054
Submission received: 1 May 2017
/
Revised: 28 June 2017
/
Accepted: 30 June 2017
/
Published: 7 July 2017
Abstract
:Salinization of surface and groundwater has been directly linked to the area of road surfaces in a watershed and the subsequent wintertime maintenance used to keep roads free of snow and ice. Most studies that explore road salt in snow along roadways limit the study to within 100 m from a roadway and conclude that there is negligible deposition of de-icing salt at distances greater than 100 m. In this study, we analyze the ion content of the southern New Hampshire snowpack and use Mg2+ as a conservative sea-salt tracer to calculate sea salt and non-sea salt fractions of Cl−. There is a minimum of 60% non-sea salt Cl−, which we attribute to road salt, in the snowpack at our study sites 115 to 350 m from the nearest maintained roadways. This suggests that larger areas need to be considered when investigating the negative impact of Cl− loading due to winter-time maintenance.
1. Introduction
Chloride contamination of surface and groundwater has become an area of increased environmental concern and research focus in New Hampshire (NH) where deicing of roads using road salt is a regular practice during winter months [1]. One study by the NH Department of Environmental Services (DES) that focused on four watersheds in southeastern NH found that road salt was the main contributor to excess Cl− in streams—accounting for over 90% of total chloride load in some cases [2]. This is likely part of a broader regional trend observed by Kaushal et al., 2005, who note increases in baseline Cl− concentrations in rural and urban northeastern United States streams over the past 30 years [3]. Many studies attribute increasing Cl− concentrations in northern freshwater systems to increasing road-surface area and the subsequent increase in winter-time maintenance [3,4,5,6,7,8]. One study suggests impervious land cover will increase in the United States by at least 19% into the year 2100 [9], which will lead to further increases in Cl− concentrations. After the year 2100, many surface waters in the northeastern United States could have Cl− concentrations toxic to freshwater life and unsuitable for human consumption [3].
The state of NH used about 170,000 tons of road salt between November 2014 and April 2015 [10], most of which is applied as coarse sodium chloride (halite) crystals to roads and parking lots. Once applied to such surfaces, salt crystals are either covered up by precipitation and plowed off the surface or left loose on the surface. Salt that is plowed off and mixed with snow is stored in the snowbank until snowmelt. Salt that remains on the surface can be transported through a variety of different mechanisms including airborne transport through splashing and spraying of pooled water or particulate matter, infiltration into the surface, or as runoff [11]. Airborne spreading is perhaps the most prominent mechanism to transport road salt from roads, with resuspended de-icing salt aerosols capable of being transported over 1 km from their source [12]. In any case, conductive species such as Na+ and Cl− that enter an adjacent environment during winter are ultimately destined to end up in streams at the onset of melt during the spring time pulse [13,14], or infiltrate through the soil into groundwater where lasting effects are more pronounced [1,15]. In fact, one study notes high road salt contamination year-round in springs up to 800 m from maintained roadways [15].
Prior investigations into the accumulation of de-icing salt in snowpacks near roads often restrict their study areas to within 30 m from the shoulder of the roadside [16,17], and attribute most road side salt accumulation dispersion from the roadside to plowing, splashing, or spraying of fine droplets [18]. Restricted study areas could lead to underestimated road salt loading in snowpacks if, as previously suggested [12], de-icing salts are transported much further than 30 m. Underestimation of total road salt contained in a snowpack, inaccurate representation of its spatial distribution, and uncertainty in transport mechanisms will lead to uncertainty when trying to quantify the impact of salting roads on nearby environments.
Previously, Lazarcik et al. observed that the snowpack near Hanover, NH had about double the Cl− load compared to snowpacks near Durham, NH, in two consecutive seasons [13]. They note that this was unexpected, because Hanover is much further than Durham from the Atlantic coast and deposition of sea-salt aerosol (SSA) decreases rapidly with distance from the coast [19]. This indicates that there is a source of chloride near the Hanover snowpack in addition to SSA. This study explores the potential for road salt to be a substantial source of chloride in the snowpack at several NH field sites over the course of two winter field campaigns using daily or near-daily measurements of snowpack ions. We hypothesize that wind transport of fine dry road salt particles is the primary process delivering excess Cl− to the snowpack hundreds of meters from roadways, though this can only be inferred from this study.
2. Materials and Methods
Snow samples were collected at daily or near daily intervals at several sites spanning the southern half of NH for two winter seasons in 2013–2014 to 2014–2015 [13,20], hereby denoted as Winter 2 and Winter 3, respectively (Table 1, Figure 1). Winters 2 and 3 are used to be consistent with a previous study; study sites, sampling methods, data analysis methods, and quality control procedures are identical to those previously described [13]. During the first year of the study in winter 2012–2013, sampling was conducted at six sites, creating regular gaps of 2–3 days between repeat visits of all sites which made time series difficult to interpret [13]. As an additional quality measure, five consecutive days (10–14 February) of Winter 3 data at the two sites near Durham—Thompson Farm (TFO) and Burley-Demeritt (BDO)—were rejected due to analytical errors caused by progressive failure of the pump on the autosampler making injections into the cation channel of the ion chromatograph.
Sea salt chloride fractions in precipitation are often calculated from a measured reference species within the sample and a known bulk seawater composition [21]. Magnesium and sodium are typical reference species for samples of liquid precipitation and aerosol; however, sodium may not be suitable as a reference species due to prolific road salt application in NH. Road salt aerosol resuspended from the road and deposited on the snowpack will increase sodium load above what is expected from bulk seawater compositions.
Sea salt fractions of Cl− and Na+ are therefore calculated using the amount of Mg2+ present in each snow sample and multiplying by the expected sea salt ratio for each with respect to Mg2+ (the molar ratios of these ions in sea salt are Cl−/Mg2+ = 10.33; Na+/Mg2+ = 8.88 [22]). Non-sea salt, or excess, Cl− (Na+) is simply total measured Cl− (Na+) minus the calculated sea salt Cl− (Na+) fraction. Dust deposition may increase magnesium inventories above the amount due to sea salt; however, dust deposition containing Mg2+ is at a yearly low during the winter in the eastern United States [23,24]. It should be noted that any addition of Mg2+ to the snowpack not derived from sea-salt aerosol, which includes small amounts of Mg2+ found in road salt, will cause calculated non-sea salt Na+ and Cl− fractions in snow to be underestimated. Similarly, if Cl− is lost to the gas phase due to reaction of NaCl with sulfuric or nitric acid derived from fossil fuel emissions [25], non-sea salt Cl− in NH snow could also be underestimated.
3. Results and Discussion
On average, non-sea salt Cl− accounts for over 60% of the measured Cl− at all sites in both winters, with excess Cl− averaging 81% of total Cl− at the Dartmouth Organic Farm site (DFO) in Winter 3 (Table 2; Figure 2). Additionally, linear regression of excess Cl− versus excess Na+ in all samples from the two seasons shows very strong correlation and slopes slightly below the value of 1.0 expected for halite, which is much lower than the Cl−/Na+ molar ratio of 1.16 in sea salt (Figure 3). At the highest concentrations, Cl− decreases with respect to Na+. This is likely caused by acid reactions displacing Cl− to the gas phase. Therefore, it appears that most of the Cl− in southern NH snowpacks is not sourced from sea salt, but is actually from road salt.
While the deposition of road salt Cl− is lower at the seacoast sites BDO and TFO, the fact that road salt is a more important source of Cl− than sea salt for these sites greater than 100 m from maintained roads is surprising. Many studies either do not sample more than 100 m from the road, or conclude that de-icing salt deposition is negligible at distances greater than 100 m from the road [11,16,17,18]. Considering that both BDO and TFO are 330 and 350 m away from local secondary roads, respectively (Table 1), it is a matter of concern that more than 400 and nearly 700 nmol cm−2 of road salt Cl− reached BDO and TFO, respectively, in Winter 3 (Table 2). These road salt Cl− inventories are equivalent to accumulation of 0.25 and 0.39 grams of road salt halite per square meter of land well removed from the nearby roadway. Winter 2 had less frequent snow events compared to Winter 3 [13,20], resulting in less road salt reaching all three sites (Table 2). However, road salt was still the dominant source of Cl− in the seacoast snowpack with about 140 and 190 nmol cm−2 of road salt Cl− (0.08 and 0.11 g m−2 road salt halite) reaching BDO and TFO, respectively (Table 2).
If our findings near Durham are representative of dispersion of road salt to distances of approximately 350 m on both sides of all roads, a minimum of 4000–6000 metric tons of road salt are being widely spread along the nearly 2000 km of roads in New Hampshire in heavy snow years such as Winter 3. Even in a light snow year such as Winter 2 our results suggest at least 1200–1600 tons of road salt is being dispersed hundreds of meters on both sides of salted roadways. This is a small fraction (just 2–3%) of the total amount of applied road salt, all of which is released to the environment, but suggests negative impacts of increased Cl− loading may need to be considered for a larger portion of the landscape than nearby the streams and lakes that have received close study to date [3,4,5,6,7].
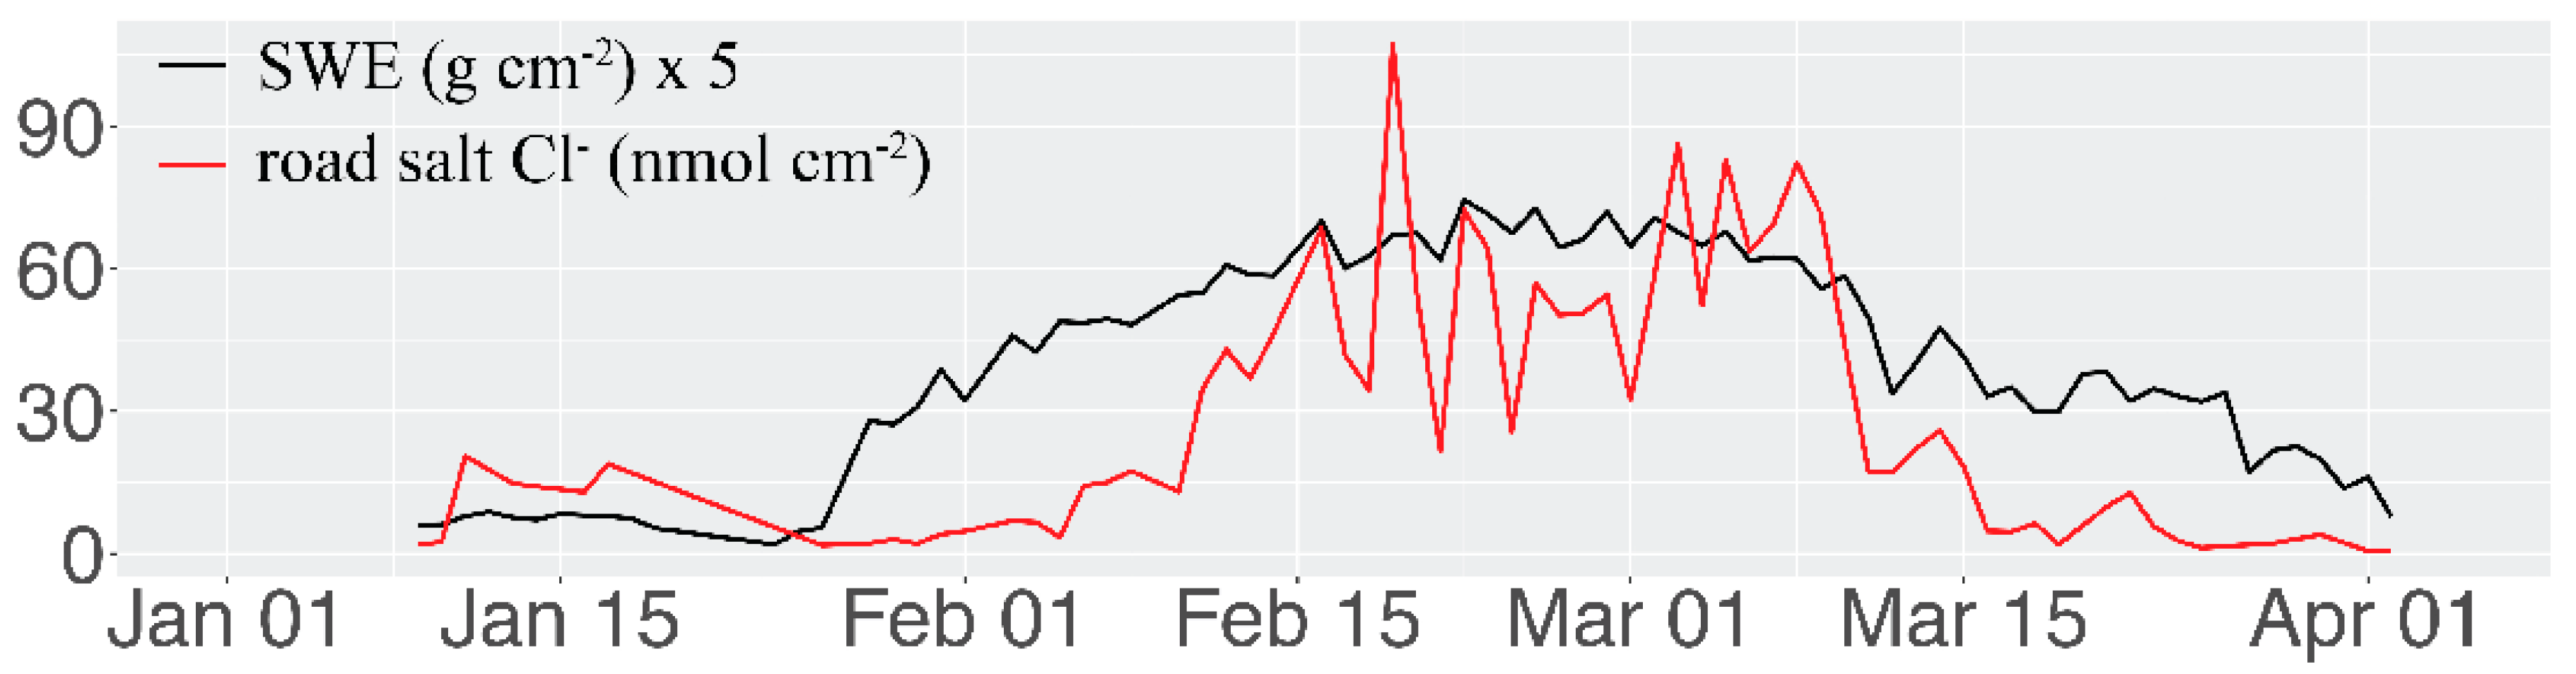
We acknowledge that most salt applied to roads is likely to remain relatively near the road until it dissolves and infiltrates the soil and enters the groundwater, or is dispersed in surface runoff produced by major snow melt events. Coarse halite crystals may bounce to the road edge and salty slush on the road way is frequently pushed into and some short distance beyond roadside snowbanks by plows. The brine on wet salted roadways is clearly lifted by passing traffic but these droplets apparently tend to be deposited within 30–100 m of the roadway, based on the previous studies mentioned above. We propose that remobilization of fine dry road salt that covers de-iced roadways a few days after each snowfall that required de-icing may contribute to dispersion over distances of 100 s of m. A comparison of non-sea salt Cl inventory and the overall snowpack snow-water equivalence (SWE) shows one case where road salt Cl inventory increases in the snowpack days after new snow accumulates (Figure 4). This case was recorded in Winter 3, 7–9 February, where snow was deposited at a rate of 3 to 9 cm per hour for most of the period, which halted travel and required many de-icing operations. Road salt Cl− inventory takes several days to increase in turn. This example may support the remobilization of dry salt as a more important source of distant dispersion than spray of salty droplets during and immediately after a snowfall event. In contrast, the very beginning of a spring melt is accompanied by an immediate rapid decrease in road salt Cl− inventory as impurities are flushed from the snowpack in what is commonly called an ‘ion pulse’ [13]. However, the evidence presented in favor of fine dry road salt dispersion in this work is insufficient to draw firm conclusions and further work must be conducted to better understand the various mechanisms of road salt transport.
4. Conclusions
Calculating road salt Cl− using Mg2+ as a conservative seawater tracer likely leads to an underestimation of total road salt Cl−, which makes the high amounts of road salt Cl− calculated for CYO and DFO especially concerning considering nearly all snowpack Cl− must eventually enter the nearby watershed. At BDO and TFO, a significant amount of road salt Cl− appears to have travelled at least 300 m. This indicates that studies focusing on only the first 30 m of the snowpack nearest to roads are inadequately estimating total road salt Cl− in snowpacks. On average, total snowpack Cl− was calculated to have at least a 60% fraction originating from road salt at all sites in both study years, which means more than twice as much Cl− than naturally comes from sea salt is being deposited onto the snowpack over an area far greater than the first initial 30 m alongside roadways. Road salt widely spread over the landscape as opposed to culverts and ditches, which are designed to deliver snowmelt and rain quickly to streams, may result in a larger fraction of road salt infiltrating into the groundwater system. Therefore, larger land areas and the presence of road salt in groundwater and surface water need to be considered when studying the negative effects of Cl− loading due to wintertime maintenance.
Acknowledgments
The authors would like to thank Eric Heim, Alden Adolph, Jacqueline Amante, Mary Albert, Cameron Wake, Eric Scheuer, Cecilia Robinson, Beth Bloom, Andrea Price, Brian Taetzch, Megan Dalton, Tristan Amaral, Louis Saviano, Jeferson Prado Swerts, and Jessica Lindes Fonseca for their contributions to this study. The authors would also like to thank the editor and the reviewers for their thoughtful comments. This work was supported by the New Hampshire EPSCoR Program and funding was provided by the National Science Foundation’s Research Infrastructure Improvement Award EPS 1101–245. This material is based upon work supported by the National Science Foundation Graduate Research Fellowship under grant 2014186404. Data collected throughout the EPSCoR Track 1 project, including data leading to relevant conclusions in this work, can be found on the Data Discovery Center at https://ddc.unh.edu/ddc_data/variables/list/ under Intensive Snow Measurements.
Author Contributions
Jack Dibb conceived and designed the experiments; James Lazarcik made the field observations and collected samples; Jack Dibb supported and oversaw the laboratory that did the ion chemistry analyses; James Lazarcik and Jack Dibb analyzed the data; James Lazarcik wrote and Jack Dibb edited the paper.
Conflicts of Interest
The authors declare no conflict of interest.
References
- Daley, M.L.; Potter, J.D.; McDowell, W.H. Salinization of urbanizing New Hampshire streams and groundwater: effects of road salt and hydrologic variability. J. N. Am. Benthol. Soc. 2009, 28, 929–940. [Google Scholar] [CrossRef]
- Trowbridge, P. Data Report for the Total Maximum Daily Loads for Chloride for Waterbodies in the Vicinity of the I-93 Corridor from Massachusetts to Manchester, NH: Policy—Porcupine Brook, Beaver Brook, Dinsmore Brook, North Tributary to Canobie Lake; State of New Hampshire, Department of Environmental Services: Concord, NH, USA, 2007.
- Kaushal, S.S.; Groffman, P.M.; Likens, G.E.; Belt, K.T.; Stack, W.P.; Kelly, V.R.; Band, L.E.; Fisher, G.T. Increased salinization of fresh water in the northeastern United States. Proc. Natl. Acad. Sci. USA 2005, 102, 13517–13520. [Google Scholar] [CrossRef] [PubMed]
- Godwin, K.S.; Hafner, S.D.; Buff, M.F. Long-term trends in sodium and chloride in the Mohawk River, New York: the effect of fifty years of road-salt application. Environ. Pollut. 2003, 124, 273–281. [Google Scholar] [CrossRef]
- Corsi, S.R.; Graczyk, D.J.; Geis, S.W.; Booth, N.L.; Richards, K.D. A Fresh Look at Road Salt: Aquatic Toxicity and Water-Quality Impacts on Local, Regional, and National Scales. Environ. Sci. Technol. 2010, 44, 7376–7382. [Google Scholar] [CrossRef] [PubMed]
- Corsi, S.R.; De Cicco, L.A.; Lutz, M.A.; Hirsch, R.M. River chloride trends in snow-affected urban watersheds: increasing concentrations outpace urban growth rate and are common among all seasons. Sci. Total Environ. 2015, 508, 488–497. [Google Scholar] [CrossRef] [PubMed]
- Cassanelli, J.P.; Robbins, G.A. Effects of Road Salt on Connecticut’s Groundwater: A Statewide Centennial Perspective. J. Environ. Qual. 2013, 42, 737–748. [Google Scholar] [CrossRef] [PubMed]
- Dugan, H.A.; Bartlett, S.L.; Burke, S.M.; Doubek, J.P.; Krivak-Tetley, F.E.; Skaff, N.K.; Summers, J.C.; Farrell, K.J.; McCullough, I.M.; Morales-Williams, A.M.; et al. Salting our freshwater lakes. Proc. Natl. Acad. Sci. USA 2017, 114, 4453–4458. [Google Scholar] [CrossRef] [PubMed]
- Bierwagen, B.G.; Theobald, D.M.; Pyke, C.R.; Choate, A.; Groth, P.; Thomas, J.V.; Morefield, P. National housing and impervious surface scenarios for integrated climate impact assessments. Proc. Natl. Acad. Sci. USA 2010, 107, 20887–20892. [Google Scholar] [CrossRef] [PubMed]
- New Hampshire Department of Transportation Bureau of Highway Maintenance. Statewide Report: FY 2015 Salt and Sand Report (November 2014–April 2015); Report Week No. 21, Report Date 21 November 2014–2 April 2015, Page 1; New Hampshire Department of Transportation: Concord, NH, USA.
- Blomqvist, G.; Johansson, E.-L. Airborne spreading and deposition of de-icing salt—A case study. Sci. Total Environ. 1999, 235, 161–168. [Google Scholar] [CrossRef]
- Kelsey, P.D.; Hootman, R.G. Deicing Salt Dispersion and Effects on Vegetation along Highways. Case Study: Deicing Salt Deposition on the Morton Arboretum. In Chemical Deicers and the Environment Proceedings of Alternative Deicing Technologies and the Environment, East Lansing, MI, USA, 25–26 March 1991; Lewis Publishers, Inc.: Boca Raton, FL, USA, 1992. [Google Scholar]
- Lazarcik, J.; Dibb, J.E.; Adolph, A.C.; Amante, J.M.; Wake, C.P.; Scheuer, E.; Mineau, M.M.; Albert, M.R. Major fraction of black carbon is flushed from the melting New Hampshire snowpack nearly as quickly as soluble impurities. J. Geophys. Res. Atmos. 2017, 122, 537–553. [Google Scholar] [CrossRef]
- Contosta, A.R.; Adolph, A.; Burchsted, D.; Burakowski, E.; Green, M.; Guerra, D.; Albert, M.; Dibb, J.; Martin, M.; McDowell, W.H.; et al. A longer vernal window: the role of winter coldness and snowpack in driving spring transitions and lags. Glob. Chang. Biol. 2017, 23, 1610–1625. [Google Scholar] [CrossRef] [PubMed]
- Schweiger, A.H.; Audorff, V.; Beierkuhnlein, C. Salt in the wound: The interfering effect of road salt on acidified forest catchments. Sci. Total Environ. 2015, 532, 595–604. [Google Scholar] [CrossRef] [PubMed]
- McBean, E.A.; Al-Nassri, S. Migration pattern of de-icing salts from roads. J. Environ. Manag. 1987, 25, 231–238. [Google Scholar]
- Hautala, E.L.; Rekilä, R.; Tarhanen, J.; Ruuskanen, J. Deposition of motor vehicle emissions and winter maintenance along roadside assessed by snow analyses. Environ. Pollut. 1995, 87, 45–49. [Google Scholar] [CrossRef]
- Lundmark, A.; Olofsson, B. Chloride Deposition and Distribution in Soils Along a Deiced Highway—Assessment Using Different Methods of Measurement. Water Air Soil Pollut. 2007, 182, 173–185. [Google Scholar] [CrossRef]
- Liang, T.; Chamecki, M.; Yu, X. Sea salt aerosol deposition in the coastal zone: A large eddy simulation study. Atmos. Res. 2016, 180, 119–127. [Google Scholar] [CrossRef]
- Adolph, A.C.; Albert, M.R.; Lazarcik, J.; Dibb, J.E.; Amante, J.M.; Price, A. Dominance of grain size impacts on seasonal snow albedo at open sites in New Hampshire. J. Geophys. Res. Atmos. 2017, 122, 121–139. [Google Scholar] [CrossRef]
- Keene, W.C.; Pszenny, A.A.P.; Galloway, J.N.; Hawley, M.E. Sea-salt correction and interpretation of constituent ratios in marine precipitation. J. Geophys. Res. Atmos. 1986, 91, 6647–6658. [Google Scholar] [CrossRef]
- Pilson, M.E.Q. Major Constituents of Seawater. In An Introduction to the Chemistry of the Sea, 1st ed.; Prentice Hall (Pearson Education Inc.): London, UK, 1998; p. 58. [Google Scholar]
- Perry, K.D.; Cahill, T.A.; Eldred, R.A.; Dutcher, D.D.; Gill, T.E. Long-range transport of North African dust to the eastern United States. J. Geophys. Res. Atmos. 1997, 102, 11225–11238. [Google Scholar] [CrossRef]
- VanCuren, R.A.; Cahill, T.A. Asian aerosols in North America: Frequency and concentration of fine dust. J. Geophys. Res. Atmos. 2002, 107, AAC 19-1–AAC 19-16. [Google Scholar] [CrossRef]
- Mahalinganathan, K.; Thamban, M.; Laluraj, C.M.; Redkar, B.L. Relation between surface topography and sea-salt snow chemistry from Princess Elizabeth Land, East Antarctica. Cryosphere 2012, 6, 505–515. [Google Scholar] [CrossRef]
Figure 1.
A map of TFO (panel A), BDO (panel B), DFO (panel C) and CYO (panel D) in relation to the nearest roads. Each site location in panels A–D is color coded to its location within New Hampshire in the broader region shown (upper left). CYO was located near the CRREL yard drive, but the nearest public road is 290 m away.
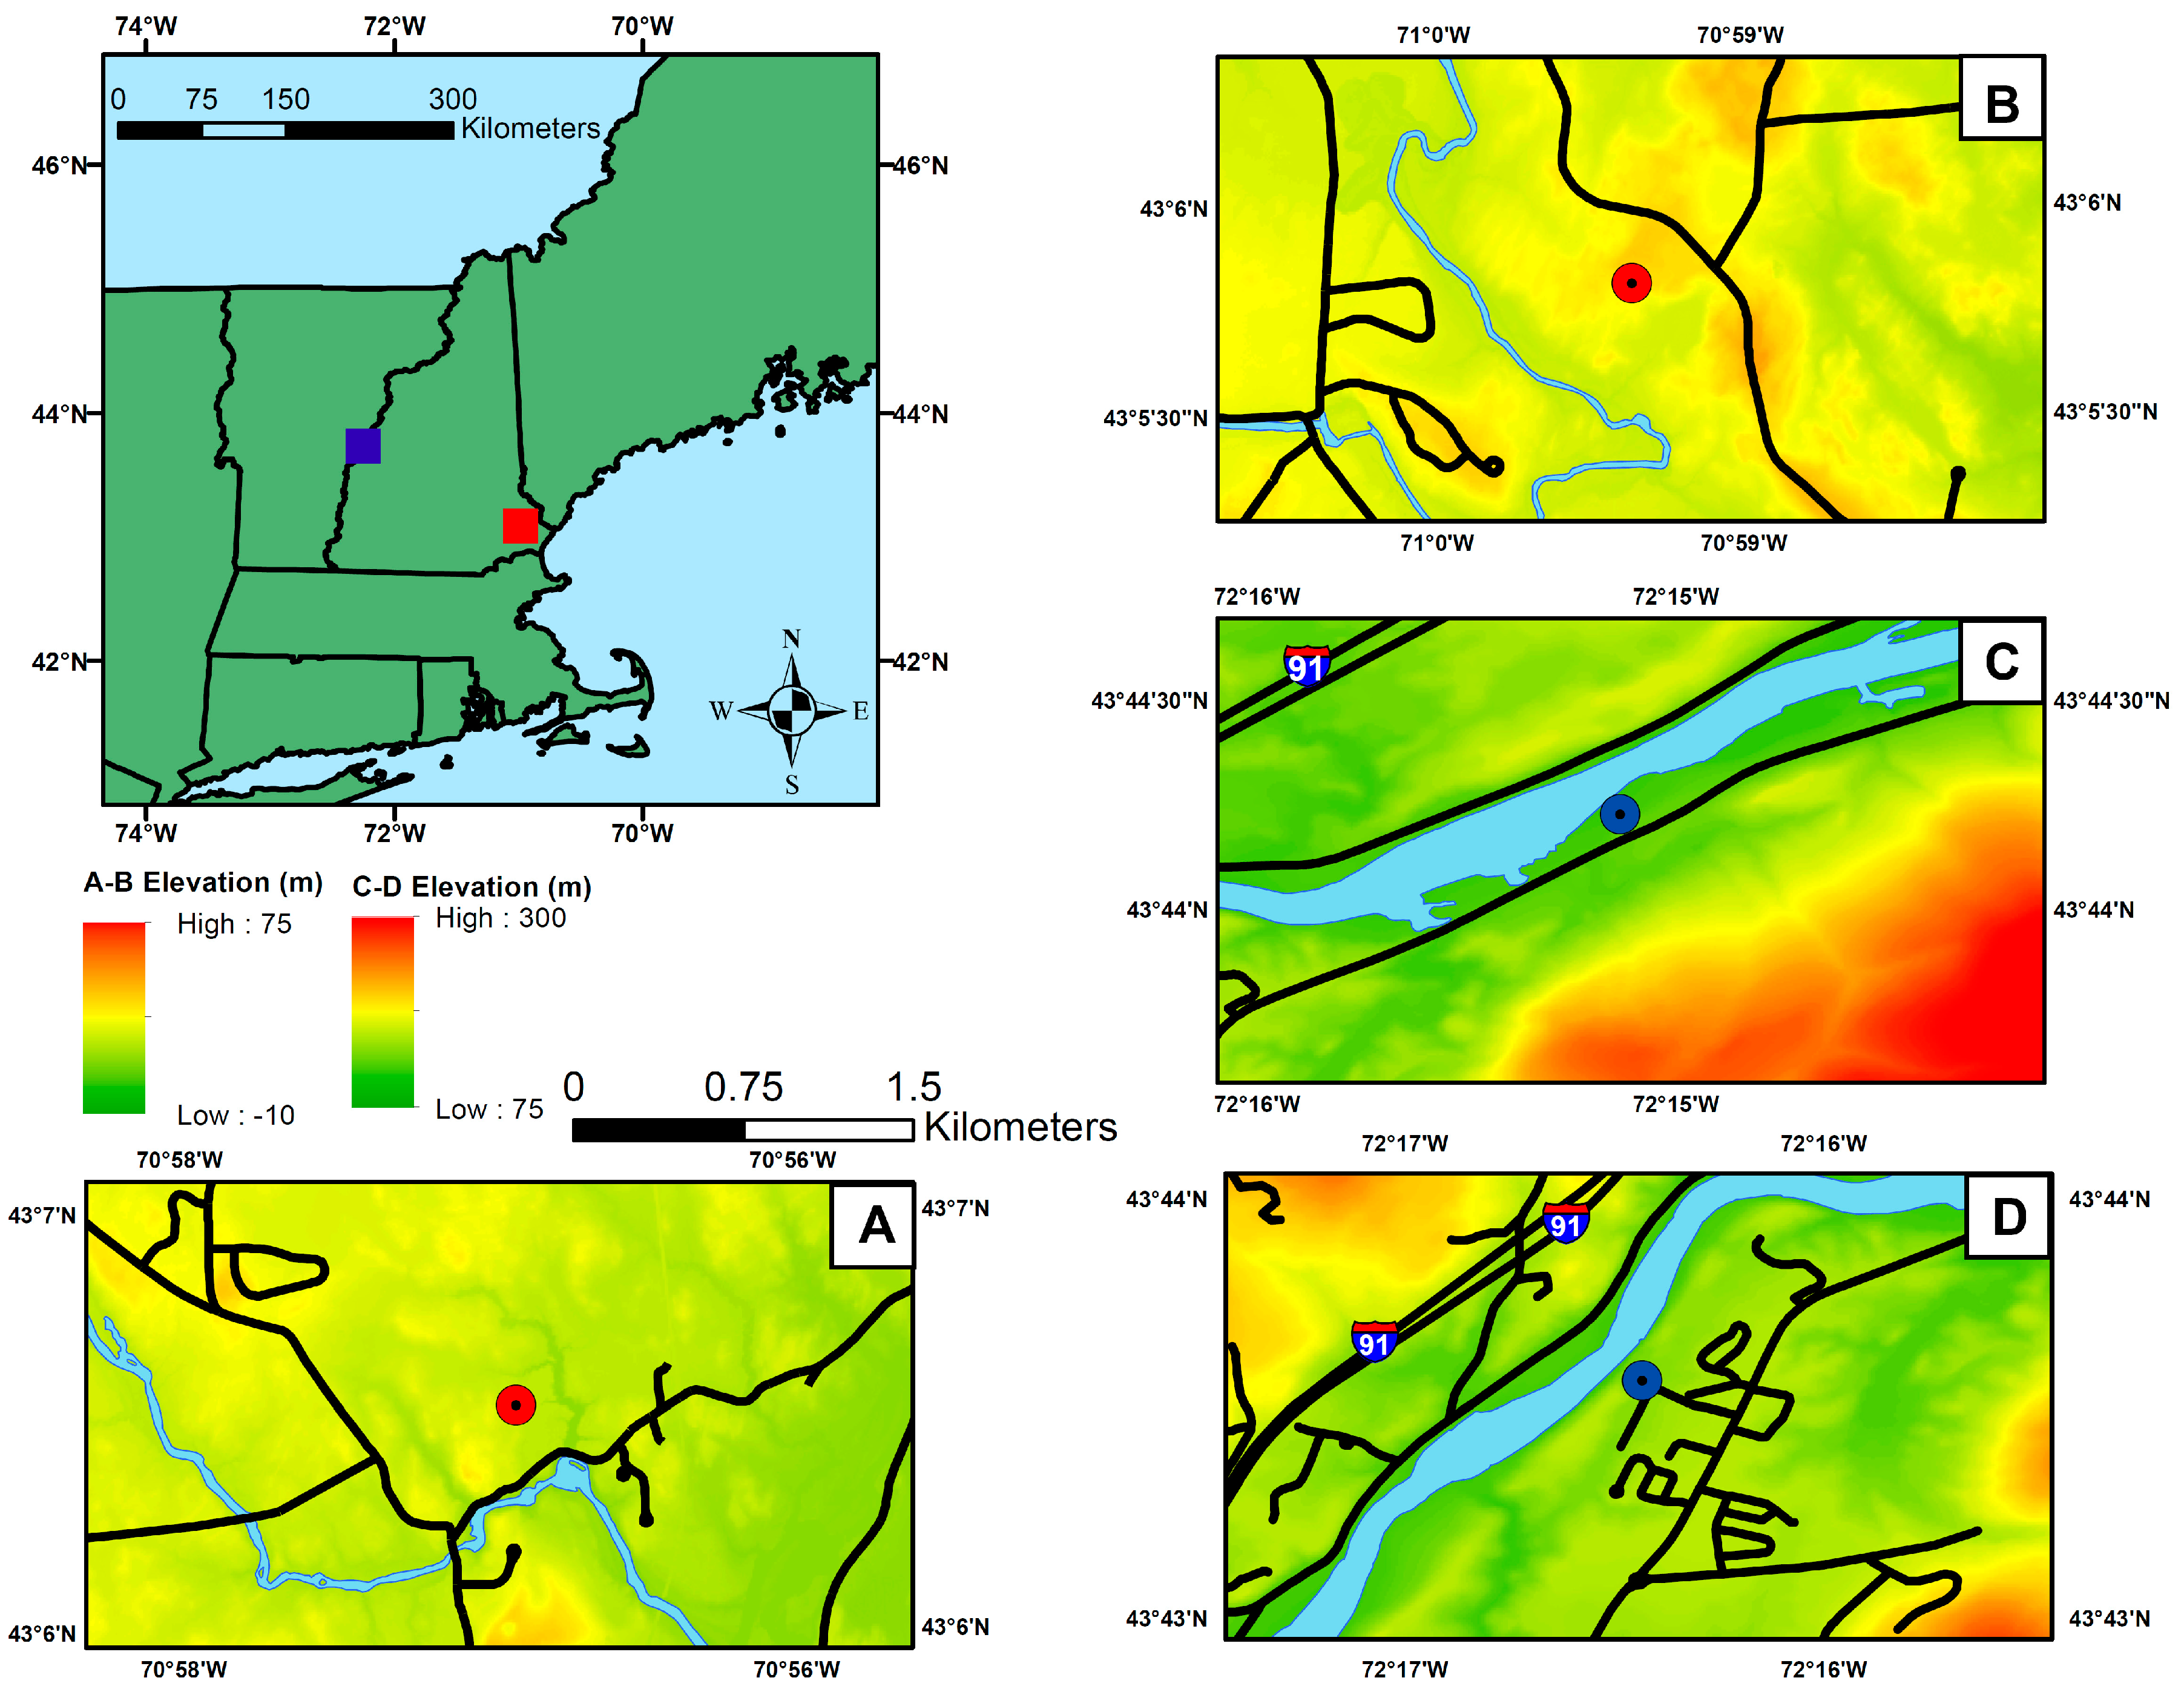
Figure 2.
Percent non-sea salt Cl− inventory time series for each site during Winters 2 (a) and 3 (b) and total SWE for Winters 2 (c) and 3 (d). Percent Cl− are the percent of the total daily pit Cl− inventory that is calculated to be due to road salt. Percent Cl− data gaps are days when no snow chemistry data was gathered either due to no snow or severe weather. The SWE data has been interpolated over missing data points. The Hanover site moved to DFO from the CRREL Yard (CYO) between Winters 2 and 3; DFO is more than 150 m closer to a maintained roadway than CYO.
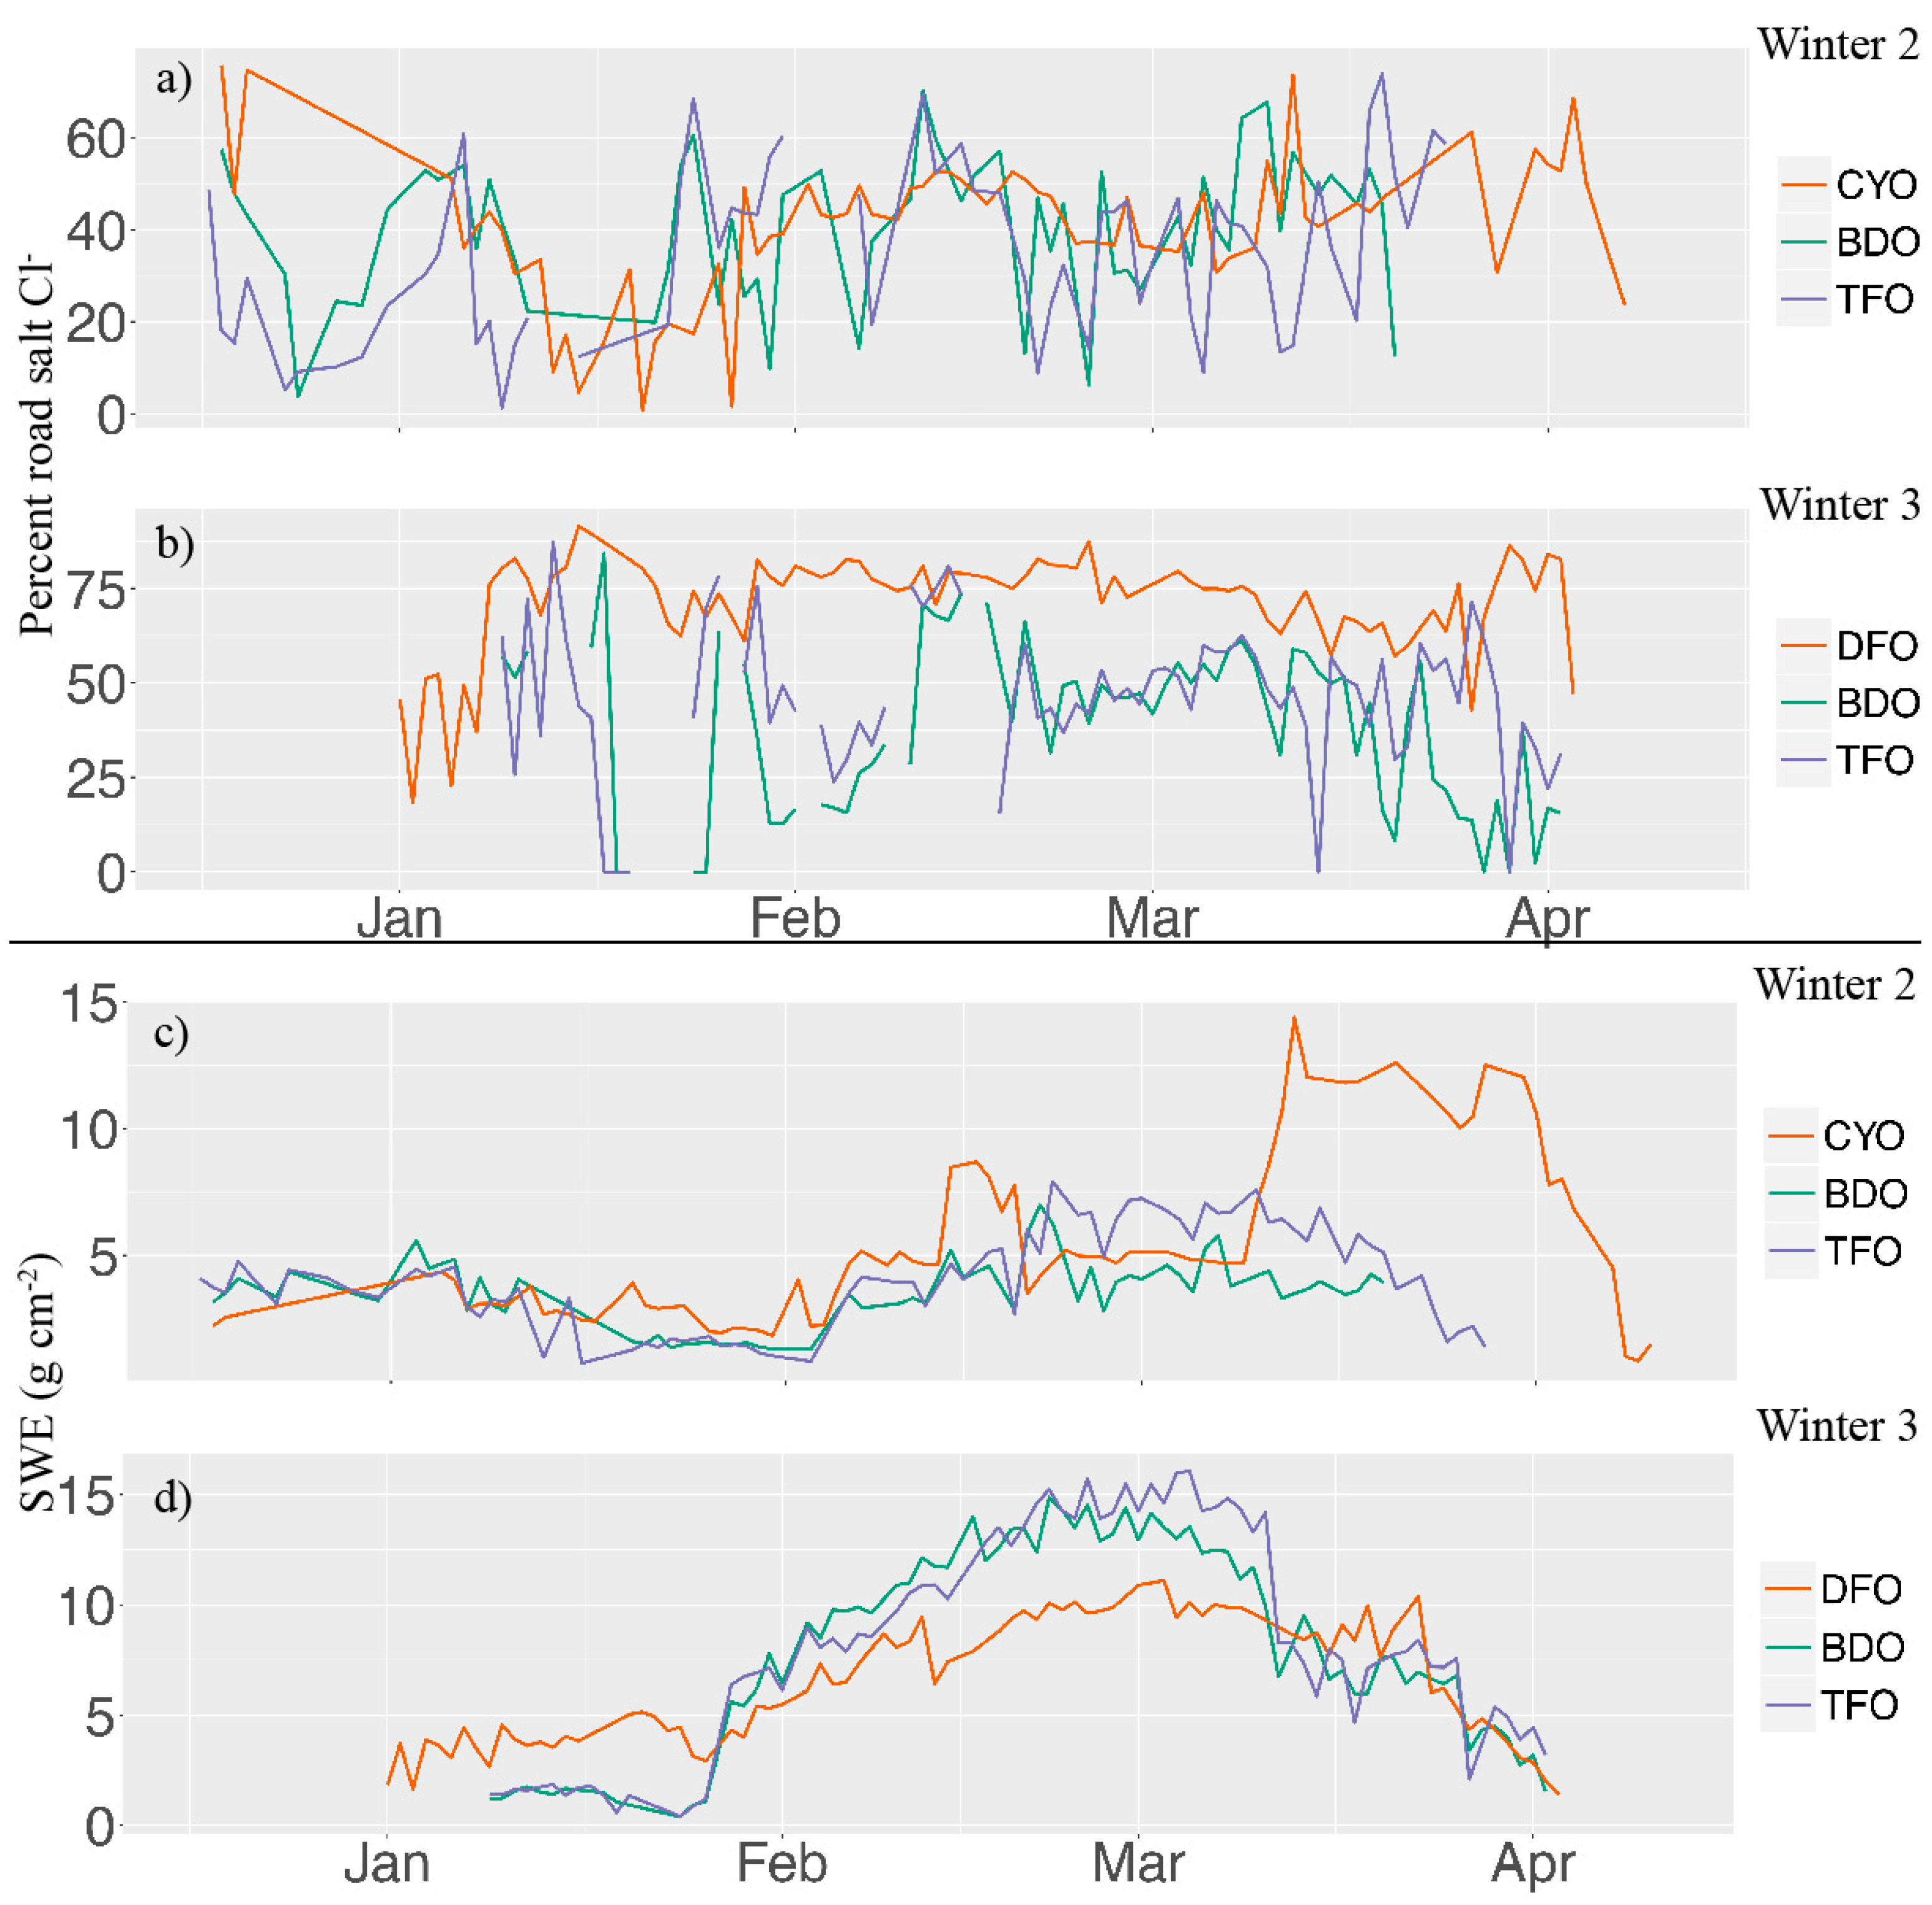
Figure 3.
Scatter plot of non-sea salt Na+ and Cl− for Winters 2 (a) and 3 (b) calculated using Mg2+ as a conservative SSA tracer. The black lines demonstrate slopes of Cl−/Na+ of 1.16 (SSA) or 1.00 (halite). The red dotted lines, and equation in the top left of each panel, show the line of best fit for a yearly data set, and has a slope of 0.87 in Winter 2 and 0.97 in Winter 3.
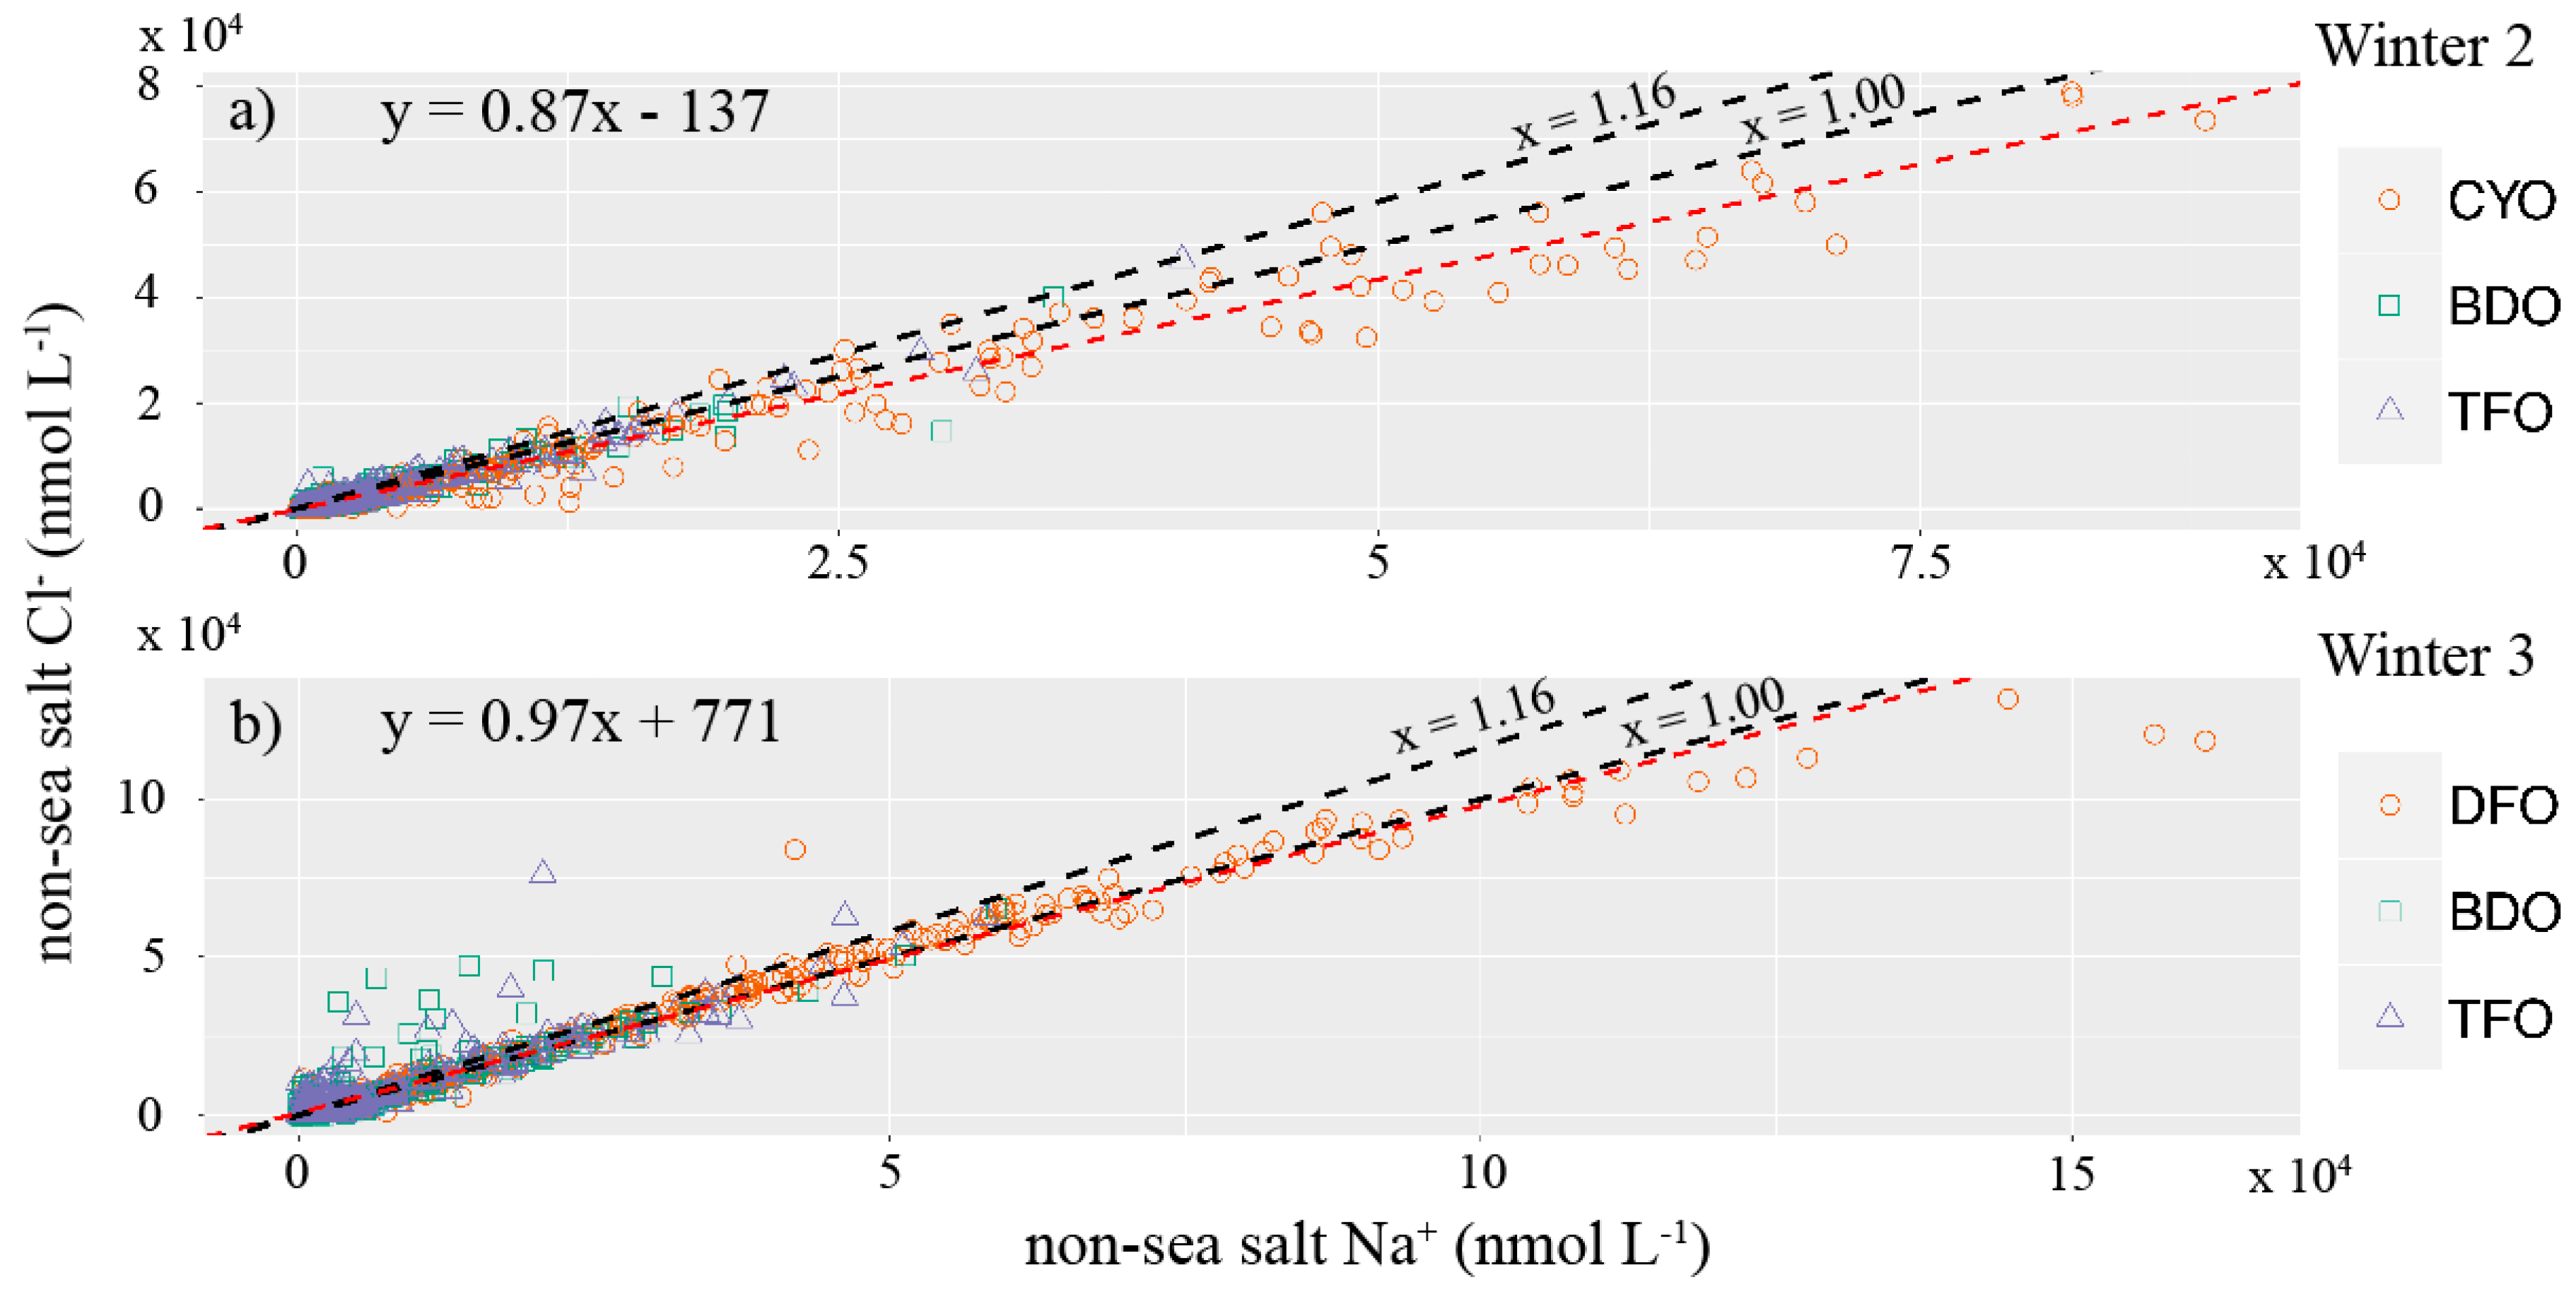
Figure 4.
A comparison of total snowpack road salt Cl− and SWE during Winter 3 at BDO. Cl− data has been interpolated over missing data points in the time series.
Figure 4.
A comparison of total snowpack road salt Cl− and SWE during Winter 3 at BDO. Cl− data has been interpolated over missing data points in the time series.

Table 1.
Site location overview.
| Site (Abbr.) | Distance to Nearest Maintained Road (m) | Distance to Atlantic Ocean (km) | Elevation (m) | Latitude and Longitude |
|---|---|---|---|---|
| CRREL Yard Open (CYO) a | 290 | 150 | 143 | N 43°43′ |
| W 72°16′ | ||||
| Dartmouth Farm Open (DFO) a | 114 | 150 | 119 | N 43°44′ |
| W 72°15′ | ||||
| Burley-Demeritt Open (BDO) | 330 | 23 | 35 | N 43°05′ |
| W 70°59′ | ||||
| Thompson Farm Open (TFO) | 348 | 22 | 19 | N 43°06′ |
| W 70°56′ |
a Less than 1 km from I 91 in Vermont.
Table 2.
Average sample Cl−/Na+ ratio, average sample % non-sea salt Cl−, and cumulative non-sea salt Cl−.
Table 2.
Average sample Cl−/Na+ ratio, average sample % non-sea salt Cl−, and cumulative non-sea salt Cl−.
| Site | Average Cl−/Na+ | % Non-Sea Salt Cl− | Cumulative Non-Sea Salt Cl− (nmol cm−2) |
|---|---|---|---|
| Winter 2 1 | |||
| CYO | 0.94 | 61 ± 21 | 510 ± 173 |
| BDO | 1.02 | 63 ± 21 | 140 ± 48 |
| TFO | 0.99 | 60 ± 20 | 188 ± 64 |
| Winter 3 1 | |||
| DFO | 1.02 | 81 ± 28 | 1780 ± 605 |
| BDO | 0.97 | 63 ± 21 | 434 ± 148 |
| TFO | 1.02 | 66 ± 22 | 667 ± 227 |
1 The spatial variability of Cl− in snow for the study region was previously assessed to be a maximum of 34% [13].
© 2017 by the authors. Licensee MDPI, Basel, Switzerland. This article is an open access article distributed under the terms and conditions of the Creative Commons Attribution (CC BY) license (http://creativecommons.org/licenses/by/4.0/).
Share and Cite
MDPI and ACS Style
Lazarcik, J.; Dibb, J.E. Evidence of Road Salt in New Hampshire’s Snowpack Hundreds of Meters from Roadways. Geosciences 2017, 7, 54. https://doi.org/10.3390/geosciences7030054
AMA Style
Lazarcik J, Dibb JE. Evidence of Road Salt in New Hampshire’s Snowpack Hundreds of Meters from Roadways. Geosciences. 2017; 7(3):54. https://doi.org/10.3390/geosciences7030054
Chicago/Turabian StyleLazarcik, James, and Jack E. Dibb. 2017. "Evidence of Road Salt in New Hampshire’s Snowpack Hundreds of Meters from Roadways" Geosciences 7, no. 3: 54. https://doi.org/10.3390/geosciences7030054
Note that from the first issue of 2016, this journal uses article numbers instead of page numbers. See further details here.