Drought Occurrences and Their Characteristics across Selected Spatial Scales in the Contiguous United States

1
Moore Engineering, Inc., West Fargo, ND 58078, USA
2
Department of Civil and Environmental Engineering, North Dakota State University, Fargo, ND 58108, USA
*
Author to whom correspondence should be addressed.
Geosciences 2017, 7(3), 59; https://doi.org/10.3390/geosciences7030059
Submission received: 25 March 2017
/
Revised: 26 June 2017
/
Accepted: 14 July 2017
/
Published: 19 July 2017
(This article belongs to the Special Issue Drought Monitoring and Prediction)
Abstract
:An understanding of drought occurrences and their characteristics such as intensity, duration, frequency, and areal coverage, and their variations on different spatial scales, is crucial to plan for droughts in different regions and in different sized areas. This study investigated the variations of spatio-temporal characteristics of droughts under selected spatial scales: National (Contiguous U.S.), regional (High Plains), state (North Dakota, ND), climatic division (South Central, ND), and county (Grant, ND). Weekly drought area coverage data for the period spanning the years 2000–2014 from the U.S. Drought Monitor of the National Drought Mitigation Center were used. The study captured the areal coverages and occurrence frequency of droughts with different intensity levels for the years 2000 to 2014 for the contiguous U.S. Year to year variability in spatial distribution of the areal coverages of droughts with different intensity levels were also analysed. The study further investigated how the weekly percentage area under different intensity categories varied along time, and extracted the spatio-temporal characteristics of different drought intensity categories at different spatial scales. The study identified areas that are frequently affected by droughts of different intensity categories in the U.S. at the national scale, and reported the spatial scale dependence of drought characteristics.
1. Introduction
Drought stands apart from other natural hazards in many ways, particularly in that it is difficult to identify and predict its onset and termination [1,2,3,4]. The creeping behavior of droughts also makes it difficult to define and quantify their impact [5,6]. Droughts in general can be characterized based on severity, areal coverage, duration, and frequency. Drought indices are used to identify and monitor drought conditions, and to decide the timing and level of mitigating actions in response to droughts [7]. Numerous drought indices have been developed. Typically, drought indices are derived from meteorological variables (e.g., precipitation, temperature) and hydrological variables (e.g., stream flows, reservoir storage, soil moisture, groundwater levels) [7]. There are also indices developed based on the eco-hydrological model to assess different types of droughts [8]. The most commonly used indices include: (1) The Palmer Drought Severity Index (PDSI) [9]; (2) the Standardized Precipitation Index (SPI) [4,10]; (3) the Crop Moisture Index (CMI) [11]; and (4) the Surface Water Supply Index (SWSI) [12]. Several authors have discussed the usability and/or applicability of the indices [13,14,15,16,17,18,19]. A comparison study between the Palmer Drought Index and the Standardized Precipitation Index based on their spectral characteristics can be found in Guttman [13]. Heim [14] did a comprehensive review of 20th century drought indices used in the United States (U.S.). Keyantash and Dracup [15] evaluated some selected hydrological, agricultural, and meteorological drought indices for their usefulness based on a weighted score of six criteria: Robustness, tractability, transparency, sophistication, extendability, and dimensionality. Narasimhan and Srinivasan [16] discussed the PDSI, CMI, SPI, and SWSI. They also have developed and evaluated the Soil Moisture Deficit Index (SMDI) and the Evapotranspiration Deficit Index (ETDI) using a hydrologic model, the Soil and Water Assessment Tool (SWAT). Mishra and Singh [17] have listed and discussed several commonly used drought indices in their review paper on drought concepts. Dai [18] compared the calculation method, classification scheme, strength, and weakness of commonly used drought indices. Qin et al. [19] evaluated the performance of drought indices derived from precipitation and soil moisture. Although there are several drought indices, each index has its own advantages and disadvantages from the user’s perspective. In a 2009 workshop held at Lincoln, Nebraska on “Indices and Early Warning Systems for Drought”, the importance of having a general agreement on a standard index for each type of drought (i.e., meteorological, agricultural, and hydrological) was recognized. Although SPI was recommended as a standard index to monitor the meteorological drought universally, the group did not recommend any particular index for agricultural and hydrological droughts. The group did not want to diminish the importance of other indices [20].
Kallis [21] discussed drought in detail from an interdisciplinary perspective, and emphasized the usage of multiple indices and qualitative judgments in drought monitoring. Drought monitoring products using multiple indices include U.S. Drought Monitor (USDM) data [22], the Joint Deficit Index (JDI) [23], and the Multivariate Standardized Drought Index (MSDI) [24]. JDI and MSDI were developed using multiple drought indices based on the probabilistic concept. The USDM drought indicator is a combination of agricultural, meteorological, and hydrological severity indicators plus a subjective assessment of the impact of drought conditions by the community of drought observers [22]. The USDM data are widely accepted in the U.S. by researchers, federal agencies, and public. Detailed information about the formulation and methods of derivation of USDM data can be found in Svoboda et al. [22].
There are several other notable sources also available for data on drought studies. For example, (1) NOAA’s National Centers for Environmental Information (NCEI) has in its database monthly climate indices, including the suite of PDSI and SPI, on a climate division scale; (2) the University of Washington Surface Water Monitor (SWM) publishes hydrologic and drought condition data (soil moisture (SM)), snow water equivalent (SWE), runoff, SPI, and the Standardized Runoff Index (SRI) for the contiguous U.S. and Mexico at a half degree of resolution on a daily basis [25]; (3) the US-Mexico Drought Prediction Tool uses probabilistic prediction of SPI and publishes the data [26,27]; (4) the Global Integrated Drought Monitoring and Prediction System (GIDMaPS) is another data source for drought indices at different spatial and temporal scales [28]; (5) the Western Regional Climate Center’s WestWide Drought Tracker (WWDT) provide monthly drought conditions at county scales [29]. This study utilizes the USDM data, a metric derived using multiple indices and subjective input on impact, and is widely used in the U.S. for monitoring droughts.
The drought occurrences and their characteristics need to be studied based on past data to get a better understanding of the phenomenon. Drought is one of the costliest natural disasters to strike the U.S. [30,31,32]. Cook et al. [33] predicted that there is a high risk for severe extended drought coming years in the Southwest and Central Plains of Western North America due to climate change, and warn that it may lead to a “mega drought”. Mishra and Singh [17] discussed the recent droughts around the world and their impact. A study of variation in severity, duration, frequency, areal coverage, and impact of drought events at different spatial scales will be helpful to understand the mechanism of drought propagation and to plan for future drought events. There are many studies in the literature that address drought characteristics from different study areas (for example, the spatio-temporal characteristics of drought for the U.S. using PDSI [34]; the spatio-temporal properties of droughts and their impacts in North Dakota, U.S. using a refined county-wide drought index from USDM data [35]; the spatial pattern of drought in the Iberian Peninsula based on SPI using Principal Component Analysis [36]; the spatio-temporal variability of drought using SPI for the central plains region of the U.S. [37]; and drought characteristics in Serbia [38]. However, none of these studies investigated the effect of the spatial scale on drought characteristics. Only recently, some studies have been reported on this aspect. Mishra and Singh [39] summarized some of the studies on spatio-temporal drought analysis. Russo et al. [40] studied the effect of Circulation Weather Types (CWT) on spatio-temporal variability. They did not specifically focus on spatial scale dependence. Their main objective was to determine the role of CWTs on the spatial and temporal variability of droughts allowing better identification of the atmospheric processes associated with severe drought in the Iberian Peninsula. Their spatial regionalization was based on CWTs and drought patterns, not on spatial size scale. Wang et al. [41] listed selected works on spatio-temporal characteristics on global, continental, and regional scales. They also studied the area and frequency of severe drought in global, Northern Hemisphere, Southern Hemisphere, and major crop-planting regions from six continents’ spatial scales using the Standardized Precipitation Evaporation Index (SPEI). However, their analysis considered only drought event frequency and area, but recommend also including severity and duration. Our study takes into account drought area, severity, duration, and frequency. Panu and Sharma [42] insisted that the spatial behaviour of droughts has to be studied. Demuth and Stahl [43] emphasized the need to study frequency, magnitude, and regional spread of droughts at different temporal and spatial scales. It is possible that drought characteristics and mechanics of propagation may be different under different spatial scales in different geographic regions. As discussed, the spatial variation of characteristics of drought from a spatial scale perspective has not received adequate attention in the past. Severity, duration, frequency, and spatial coverage are four major characteristics necessary to define drought. These characteristics either individually or collectively have been studied for several regions of interest using station or defined spatial unit data. In the United States (U.S.), drought indices are mostly reported as a single severity value for a spatial unit (e.g., climate division). Only the U.S. drought Monitor (USDM), a recently developed drought monitoring tool, reports spatial coverage of drought at different intensity levels. In light of availability of such data (USDM), this study investigates the spatial scale dependence of spatio-temporal characteristics of droughts.
The important research question is how the spatio-temporal characteristics of droughts change with spatial scale. As pointed out in the previous paragraph, there is a need for developing a methodology to investigate the spatial scale effect on drought characteristics using an integrated drought index which accounts for spatial coverage of droughts.
This study focuses on the pattern and frequency of occurrences of droughts, their spatio-temporal characteristics, and their variation over different spatial scales. The USDM data form 2000 to 2014 are used. The occurrences of droughts of different intensity categories, and the spatio-temporal characteristics and their variations under different spatial scales, were analysed. The results could help identify the areas in the contiguous U.S. that have been exposed to frequent and intense droughts in recent years, and potentially in the future, and they could also identify the characteristics of different intensity categories from different spatial scales perspective.
2. Study Area and Data
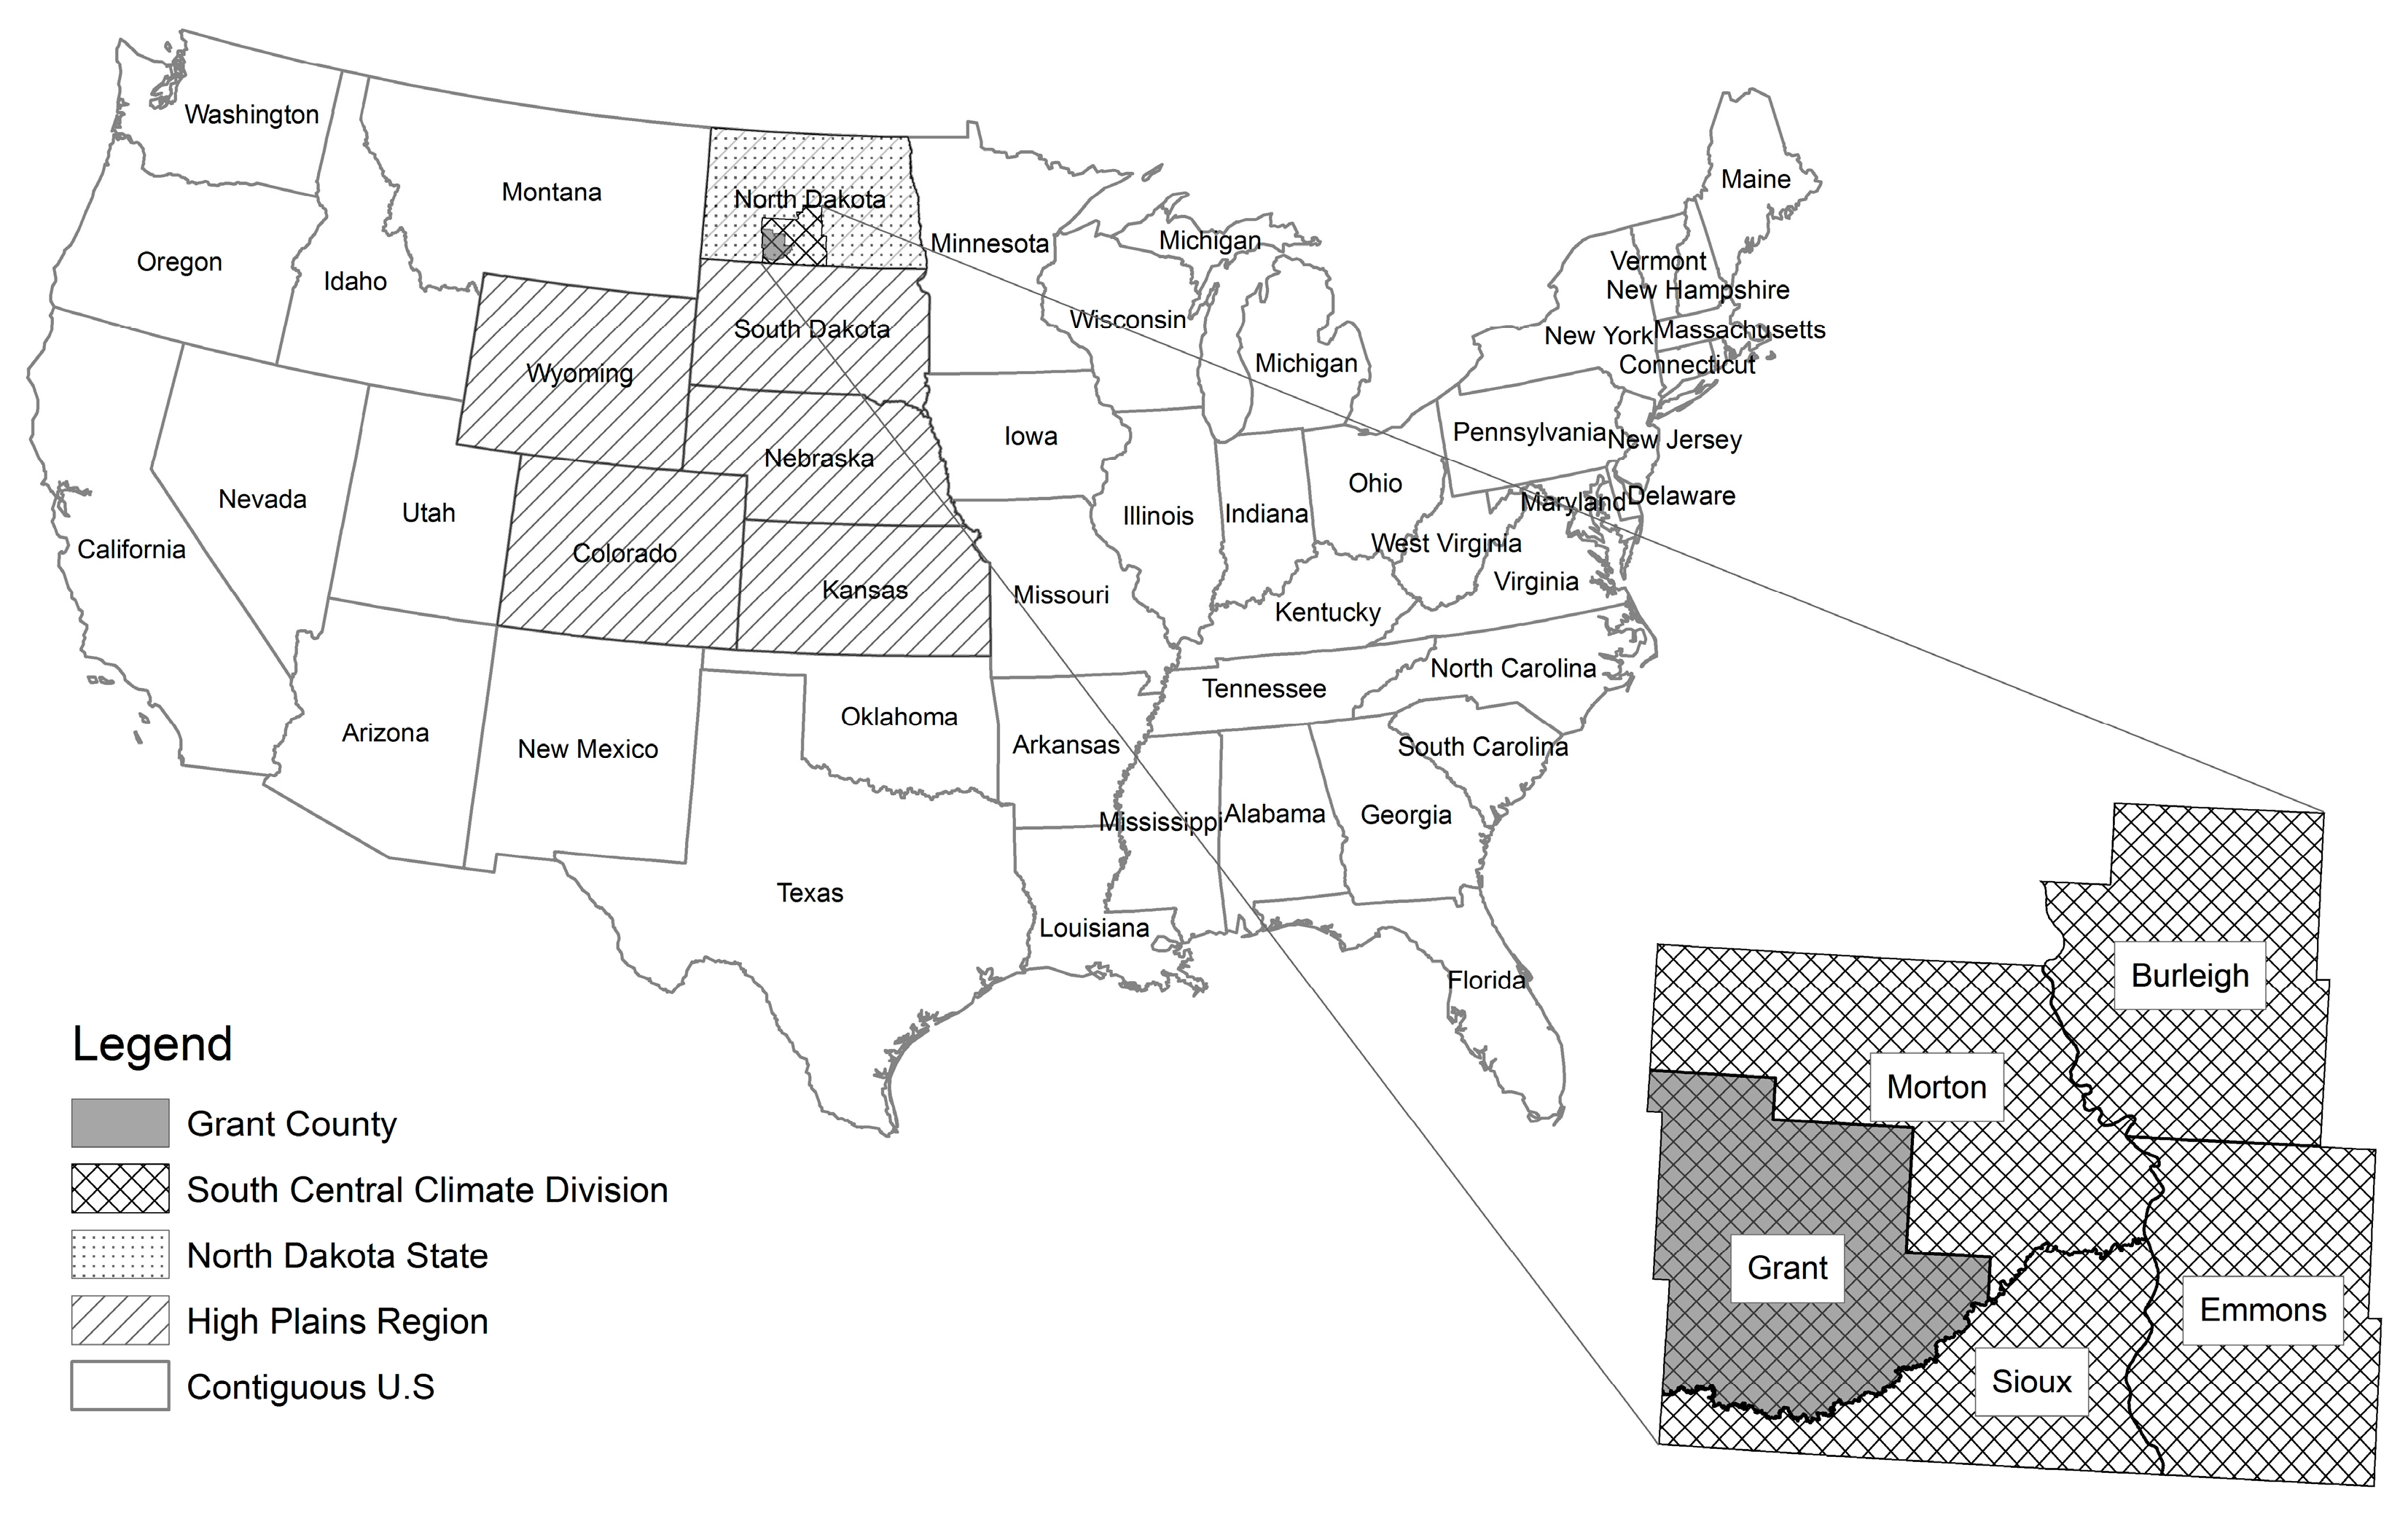
The purpose of this study is to demonstrate the variation of spatial scale dependence of drought characteristics, and to emphasise the need of considering spatial scale in drought management. The contiguous U.S. (48 states) consists of 3007 counties. Droughts have significantly impacted North Dakota in the past. The region is well known as the bread basket of the world because of its large-scale agricultural production. The agriculture sector has experienced vast losses because of drought. Therefore, we chose the areas starting from a county in North Dakota, then the state, region, and country for representing different spatial scales for this study.
This study uses USDM data. USDM is a major source of U.S. drought data available to the public from the NDMC since the year 2000. USDM was developed as a comprehensive tool to depict the drought conditions across the U.S. [44]. USDM data in the form of areal coverage of different intensity droughts are published weekly. Several federal agencies including the U.S. Department of Agriculture (USDA), the National Oceanic and Atmospheric Administration (NOAA), and NDMC have their input to produce the weekly maps of areal coverage of USDM intensity categories. NDMC also hosts the web site Drought Risk Atlas (DRA) which provides station-wide statistics of several drought indices/indicators including USDM [45].
In this study, the USDM weekly percentage area coverage values of different drought intensity categories were used for the years 2000 to 2014. The USDM data utilize the subjective input from experts along with several drought indices. We believe that extensive time series analysis using this data may not be appropriate as it is possible that different experts might have provided input over the span of the data period. Therefore, the time series data may not be homogeneous. This study does not involve time series analysis in the strict sense except comparison of yearly values in one of the components of the study. This study compares only the spatial pattern of occurrences, and not the temporal variation of the occurrences.
Drought intensity categories used in this study are from USDM defined as; abnormally dry (D0), moderate drought (D1), severe drought (D2), extreme drought (D3), and exceptional drought (D4). The detailed information about the drought intensity classification and USDM products can be found in the USDM website [46]. National, regional, state, climatic division, and county levels of spatial magnitude were chosen for the study. Contiguous U.S., High Plains Region (HPR), North Dakota (ND) State, South Central Climate Division (SCCD) in ND, and Grant County in ND were the areas selected to study drought characteristics variation under different spatial scales (Figure 1). Percentage area coverage values for different drought intensity categories were derived for years 2000–2014 (15 years) from the USDM web portal for selected spatial scales.
3. Methods
3.1. Occurrences of Drought in the Contiguous U.S.
The contiguous U.S. has experienced several drought episodes during the study period (2000–2014). In this part of the study, the goal was to analyse the occurrences of different drought intensity categories. The weekly USDM GIS shapefiles were obtained from the USDM web portal for the years 2000 to 2014 and were assessed in ArcGIS10.3®. A series of batch commands were executed to clip the shapefiles into contiguous U.S., and extract areal extents pertinent to different USDM drought intensity categories (i.e., D0, D1, D2, D3, and D4).
The number of weeks that an area has been hit by D1, D2, D3, and D4 drought intensity category during the years 2000 to 2014 was extracted first. It was decided not to include D0 for two reasons: (1) Due to the difficulty in processing a large number of multiple intersections (as subsequently described); and (2) also D0 is an “abnormally dry” condition not significant enough in terms of its intensity to qualify for a “drought” condition. The following steps were implemented in ArcGIS 10.3® to count the number of weeks that an area has been hit by D1, D2, D3, and D4: (a) The “Union” tool was used to combine all 783 weekly shapefiles of selected intensity drought; (b) weekly USDM shapefiles had several attributes including drought intensity category (DM). The final shapefile, after combining all 783 weekly data, contained all the attributes from 783 weekly files in different columns. Except for the attributes that indicated the drought category (DM) all the other fields were deleted; (c) The attribute table was exported to Microsoft EXCEL sheet and the “countif” function was used to count the number of drought occurrences within each feature. Each weekly shapefile for particular intensity had several polygonal features. The union of 783 weekly shapefile inputs created numerous features in the output as a result of multiple intersections (output of union for 783 weeks of D4, D3, D2, and D1 category droughts had 63,453, 683,381, 2,115,430, 38,994,466 polygon features respectively). Each feature had attributes from 783 input shapefiles which included the occurrences of drought categories. The attribute from output of union were exported to Microsoft Excel and number of occurrences were counted.
The drought coverage areas were also extracted for all intensity categories (D0, D1, D2, D3, and D4) on a yearly basis for the period 2000 to 2014. The D0 was included for this and following part of the analysis because an understanding of variation in areal coverages of D0 will help to understand the drought, and can be related to other intensity categories. The extracted drought intensity categories from the weekly data for each year were grouped, and spatially combined to get the yearly intensity coverage. The intensity coverages were mapped for each year from 2000 to 2014. The total area coverage queried was one that experienced a particular intensity of drought at least once/year in the contiguous U.S.
3.2. Drought Characteristics across Spatial Scales in the U.S.
The study also investigated how droughts evolve at five different spatial scales: Contiguous U.S., HPR, ND State, SCCD in ND, and Grant County in ND. The areal coverage of weekly drought intensity categories was plotted with time for the study period (2000–2014). USDM also provides similar graphical plots based on their traditional statistics, which is a percent of an area that is same or worse than a certain drought category. However, the purpose of this part of the study was to analyse how the areal extent of different intensity categories evolved with different spatial scales. Spatio-temporal behavior of the drought during the period 20 December 2005 to 23 October 2006 (44 weeks) was further investigated. This was one of the periods in which all intensity categories occured at least in some part of the contiguous U.S., and for all spatial scales considered.
Based on years 2000–2014 (783 weeks) of USDM weekly data, the drought characteristics for different spatial scales: Contiguous U.S., HPR, ND State, SCCD in ND, and Grant County in ND were derived. The following drought characteristics were extracted:
3.2.1. Number of Events
A drought event was defined as the occurrence of “greater than zero” drought intensity coverage anywhere in the considered area in any week during the study period. However, occurrences in consecutive weeks were considered as one event. The total number of drought events for the different intensity categories (D0, D1, D2, D3 and D4) were determined.
3.2.2. Total Duration
The total number of weeks (not necessarily consecutive) in the study period in which the area covered by different intensity categories (D0, D1, D2, D3 and D4) were greater than zero.
3.2.3. Maximum Duration
This was the maximum number of consecutive weeks that were subject to a drought event as defined previously. This was extracted for each drought intensity category (D0, D1, D2, D3, and D4).
3.2.4. Minimum, Maximum, and Average Percentage Area Coverage
Minimum and maximum weekly percentage area coverage of different drought intensity categories (D0, D1, D2, D3, and D4) were identified over the study period. The average of weekly percentage area coverage was also calculated for different intensity categories over the study period, that is, from 2000 to 2014.
4. Results
4.1. Drought Occurrences in the Contiguous U.S.
Drought occurrence (in number of weeks) in the contiguous U.S. is shown in Figure 2. Figure 2 shows the distribution of drought occurrences for intensity categories D4, D3, D2, and D1 during the years 2000 to 2014 (783 weeks). Mapping the occurrences of drought using USDM data helps identify the areas that are vulnerable to droughts. In the contiguous U.S., during the years 2000 to 2014 about half of the (51.7%) area had experienced D4, and almost the entire area (99.8%) experienced D1 at least once (Figure 2). D3 and D2 drought occurred at least once in 86.4% and 97.4% of the area, respectively. The southern part of the contiguous U.S. has experienced high intensity droughts (D3 and D4) in the study period, whereas some areas, including areas in north-eastern part, have been free of high intensity droughts. Each drought occurrence had a different spatial pattern. Parts of several counties (Wilbarger, Wichita, and Baylor in Texas, and Tillman in Oklahoma) experienced D4 intensity drought with a range of 168–156 weeks (out of 783 weeks) (Figure 2). Other areas that were affected by D4 for at least 96 weeks during years 2000 to 2014 can be found in Colorado, Idaho, Montana, New Mexico, Oklahoma, Texas, and Utah states (Figure 2). Frequent occurrences of D3 are mostly in the western U.S. Parts of counties (Pershing and Humboldt in Nevada, and Apache in Arizona) experienced D3 drought between 223 to 231 weeks out of 783 weeks. The areas that had been hit by D3 more than 130 weeks during years 2000 to 2014 can be found in Alabama, Arizona, Colorado, Georgia, Idaho, Kansas, Montana, Nebraska, Nevada, New Mexico, Oklahoma, Oregon, South Carolina, South Dakota, Texas, Utah, and Wyoming states (Figure 2).
D2 occurred mostly in the western part of the U.S. similar to D3. Parts of Arizona, California, Nevada, and Oregon states have been in D2 condition at least 312 weeks out of 783 weeks (Figure 2). Figure 2 also shows that most of the eastern states were in D2 less frequently. Some areas in Ohio, New York, Pennsylvania, Vermont, and West Virginia have never been under a D2 drought. Occurrences of D1 can be seen almost in the entire contiguous U.S. Some parts of Nevada, and Oregon were in D0 at least 335 weeks out of 783 weeks (Figure 2).
Overall, the western part of the US experienced droughts frequently compared to the east (Figure 2); however, spatial patterns of occurrences varied significantly. For example, Alabama was the only state that was in D4 entirely at least once during the years 2000 to 2014 but with relatively less frequency, whereas parts of Oklahoma and Texas were in the D4 category very frequently. Some parts of Colorado were in the D4 category frequently whereas other parts have never experienced D4. The characteristics of drought can be understood and/or interpreted differently when observed from a different spatial scales perspective. For example, the southeast part of Colorado is exposed to a high intensity drought frequently compared to the north central part of the state. Considering the value of the drought index reported for the state, it is possible that the reported value may reflect the drought condition differently for each state. One may get a completely different picture of the drought conditions from the state level compared to a county or climate division. The drought information of a smaller area such as at the county extents could be masked when the drought is reported at the state level.
The variation of areal coverage of droughts in the contiguous U.S. on an annual basis was also analysed. The percentage area covered by different drought intensity categories for each drought during specific years are tabulated in Table 1. In the contiguous U.S., 16.9% of the area experienced exceptional drought (D4) at least once in the year 2012 whereas none of the areas had D4 in 2010. In 2012, the extreme drought (D3) occurred in 42.6% of the area at least once, and only 4.4% of the area had D3 in 2010. The percentage areal coverage ranges for severe drought (D2) from 67.5% in 2012 to 20.1% in 2009, moderate drought (D1) 81.6% in 2012 to 42.8% in 2014, and abnormally dry conditions (D0) 91.2% in 2001 to 62.6% in 2014. Figure 3 shows the highest intensity drought that an area has experienced for each year from 2000 to 2014 in the U.S.
Although the total areal coverage may be the same in different years, it may be distributed differently in those years (Figure 3). For example, in the year 2011 and 2012, the total percentage area coverage of D4 intensity is 16.1 and 16.9, respectively (Table 1). It is spread out in 2012 whereas in 2011 it is concentrated in one region (Figure 3). This type of spatial characteristic of drought significantly influences drought management and resource allocation, and emphasizes the need to address drought at different spatial scales. Also, from these yearly maps, the progression and onset of intensifying drought in the state of California can be seen in the years 2011 and 2014. In Texas, D4 intensity drought occurred in the years 2009 and 2011, but not in 2010. The maps in Figure 3 are helpful in extracting information of this type of the areal extent and pattern of droughts over the years in a region. In general, the contiguous U.S. was covered by higher intensity droughts in 2012 whereas in 2010 had less coverage by higher intensity droughts. Over the study period, occurrence of drought in the contiguous U.S. varied spatially, and a state like Texas had repeatedly experienced higher intensity drought.
4.2. Spatial Propagation of Drought Intensity Categories across Spatial Scales in the U.S.
Figure 4a–e shows how the areal extent of different intensity categories evolved at different spatial scales. In the HPR and contiguous U.S. scales, several long episodes of drought can be seen at different intensity levels (Figure 4d,e). The onset, progress and termination of drought were gradual for larger scales such as HPR and the contiguous U.S. However, it can be seen from Figure 4a–c that for the smaller scales, the duration of certain intensity drought was short and had a sudden onset and termination. At the greater spatial scales, it was observed that the dynamics were smoother than those observed for the smaller spatial scales. This may be because at the greater spatial scale, i.e., at the contiguous U.S. scale, when a given sub-area changes its intensity category (e.g., from D3 to D2), another sub-area could assume the D3 category, leading to a diminished D3 areal coverage. This occurrence becomes more and more unlikely as the spatial scale decreases due to more homogeneous hydrological conditions allowing sudden variations of the area coverage of certain drought intensity. Recognition of this feature is important from a drought management perspective across scales because the small scales are subject to sudden drought and can be unnoticed at larger spatial scales, as is evident from this study.
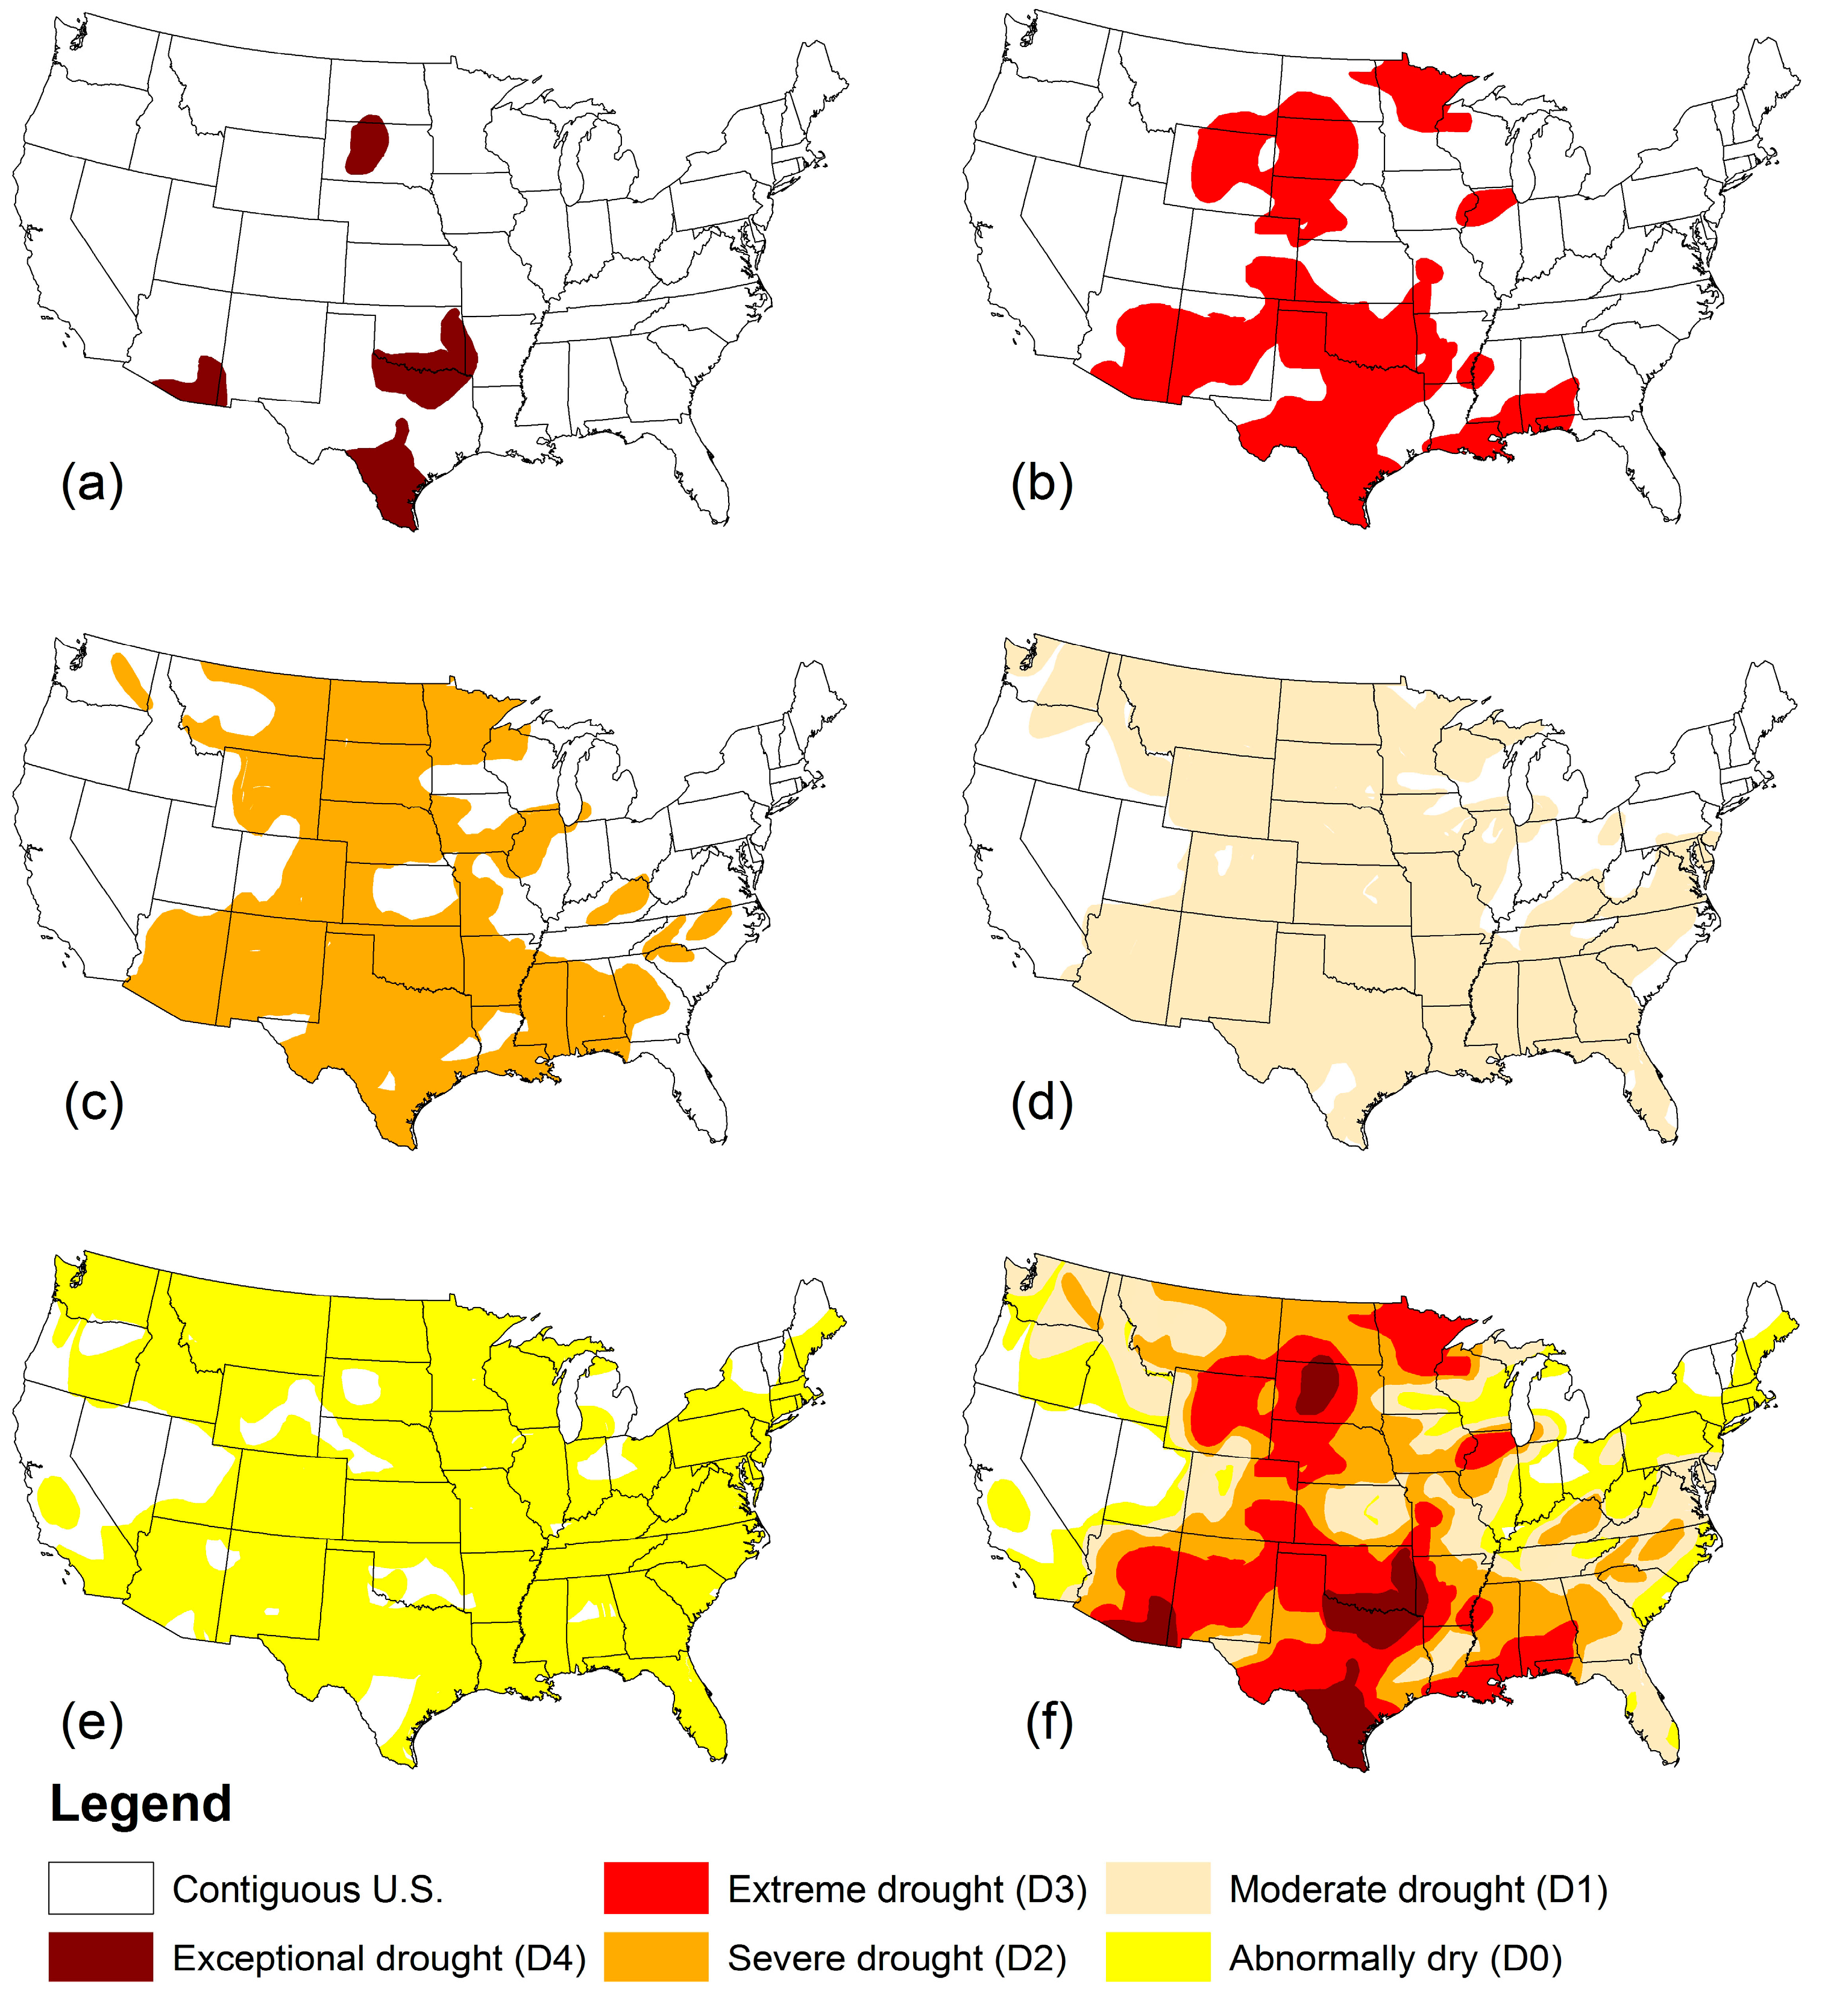
From Figure 4, it can be seen that the 20 December 2005 to 23 October 2006 period shown in box was the only period where all the categories were present in all the spatial scales considered. D4 occurred at least in some part of the contiguous U.S. throughout the 44 week period, and D4 existed 8 weeks in HPR, 5 weeks in ND, 5 weeks in SCCD in ND, and 2 weeks in Grant County in ND.
Figure 5a–e shows the area that had experienced drought at least once during the 20 December 2005 to 23 October 2006 period (44 weeks) at different intensity levels. Figure 5f shows the highest intensity drought that an area has experienced within the same time frame. The areal coverage maps show that more intense droughts (D4 and D3) occur as spatially disjointed areas, and less intense droughts are spatially connected. It should be noted that the coverage was for the whole 44 week drought period considered, and might not be spatially connected at any given week. The spatio-temporal features of drought propagation significantly change with spatial scale. The same drought may appear to have different characteristics when viewed at different spatial scales, and that needs to be considered in drought management.
4.3. Characteristics of Droughts across Spatial Scales in the U.S.
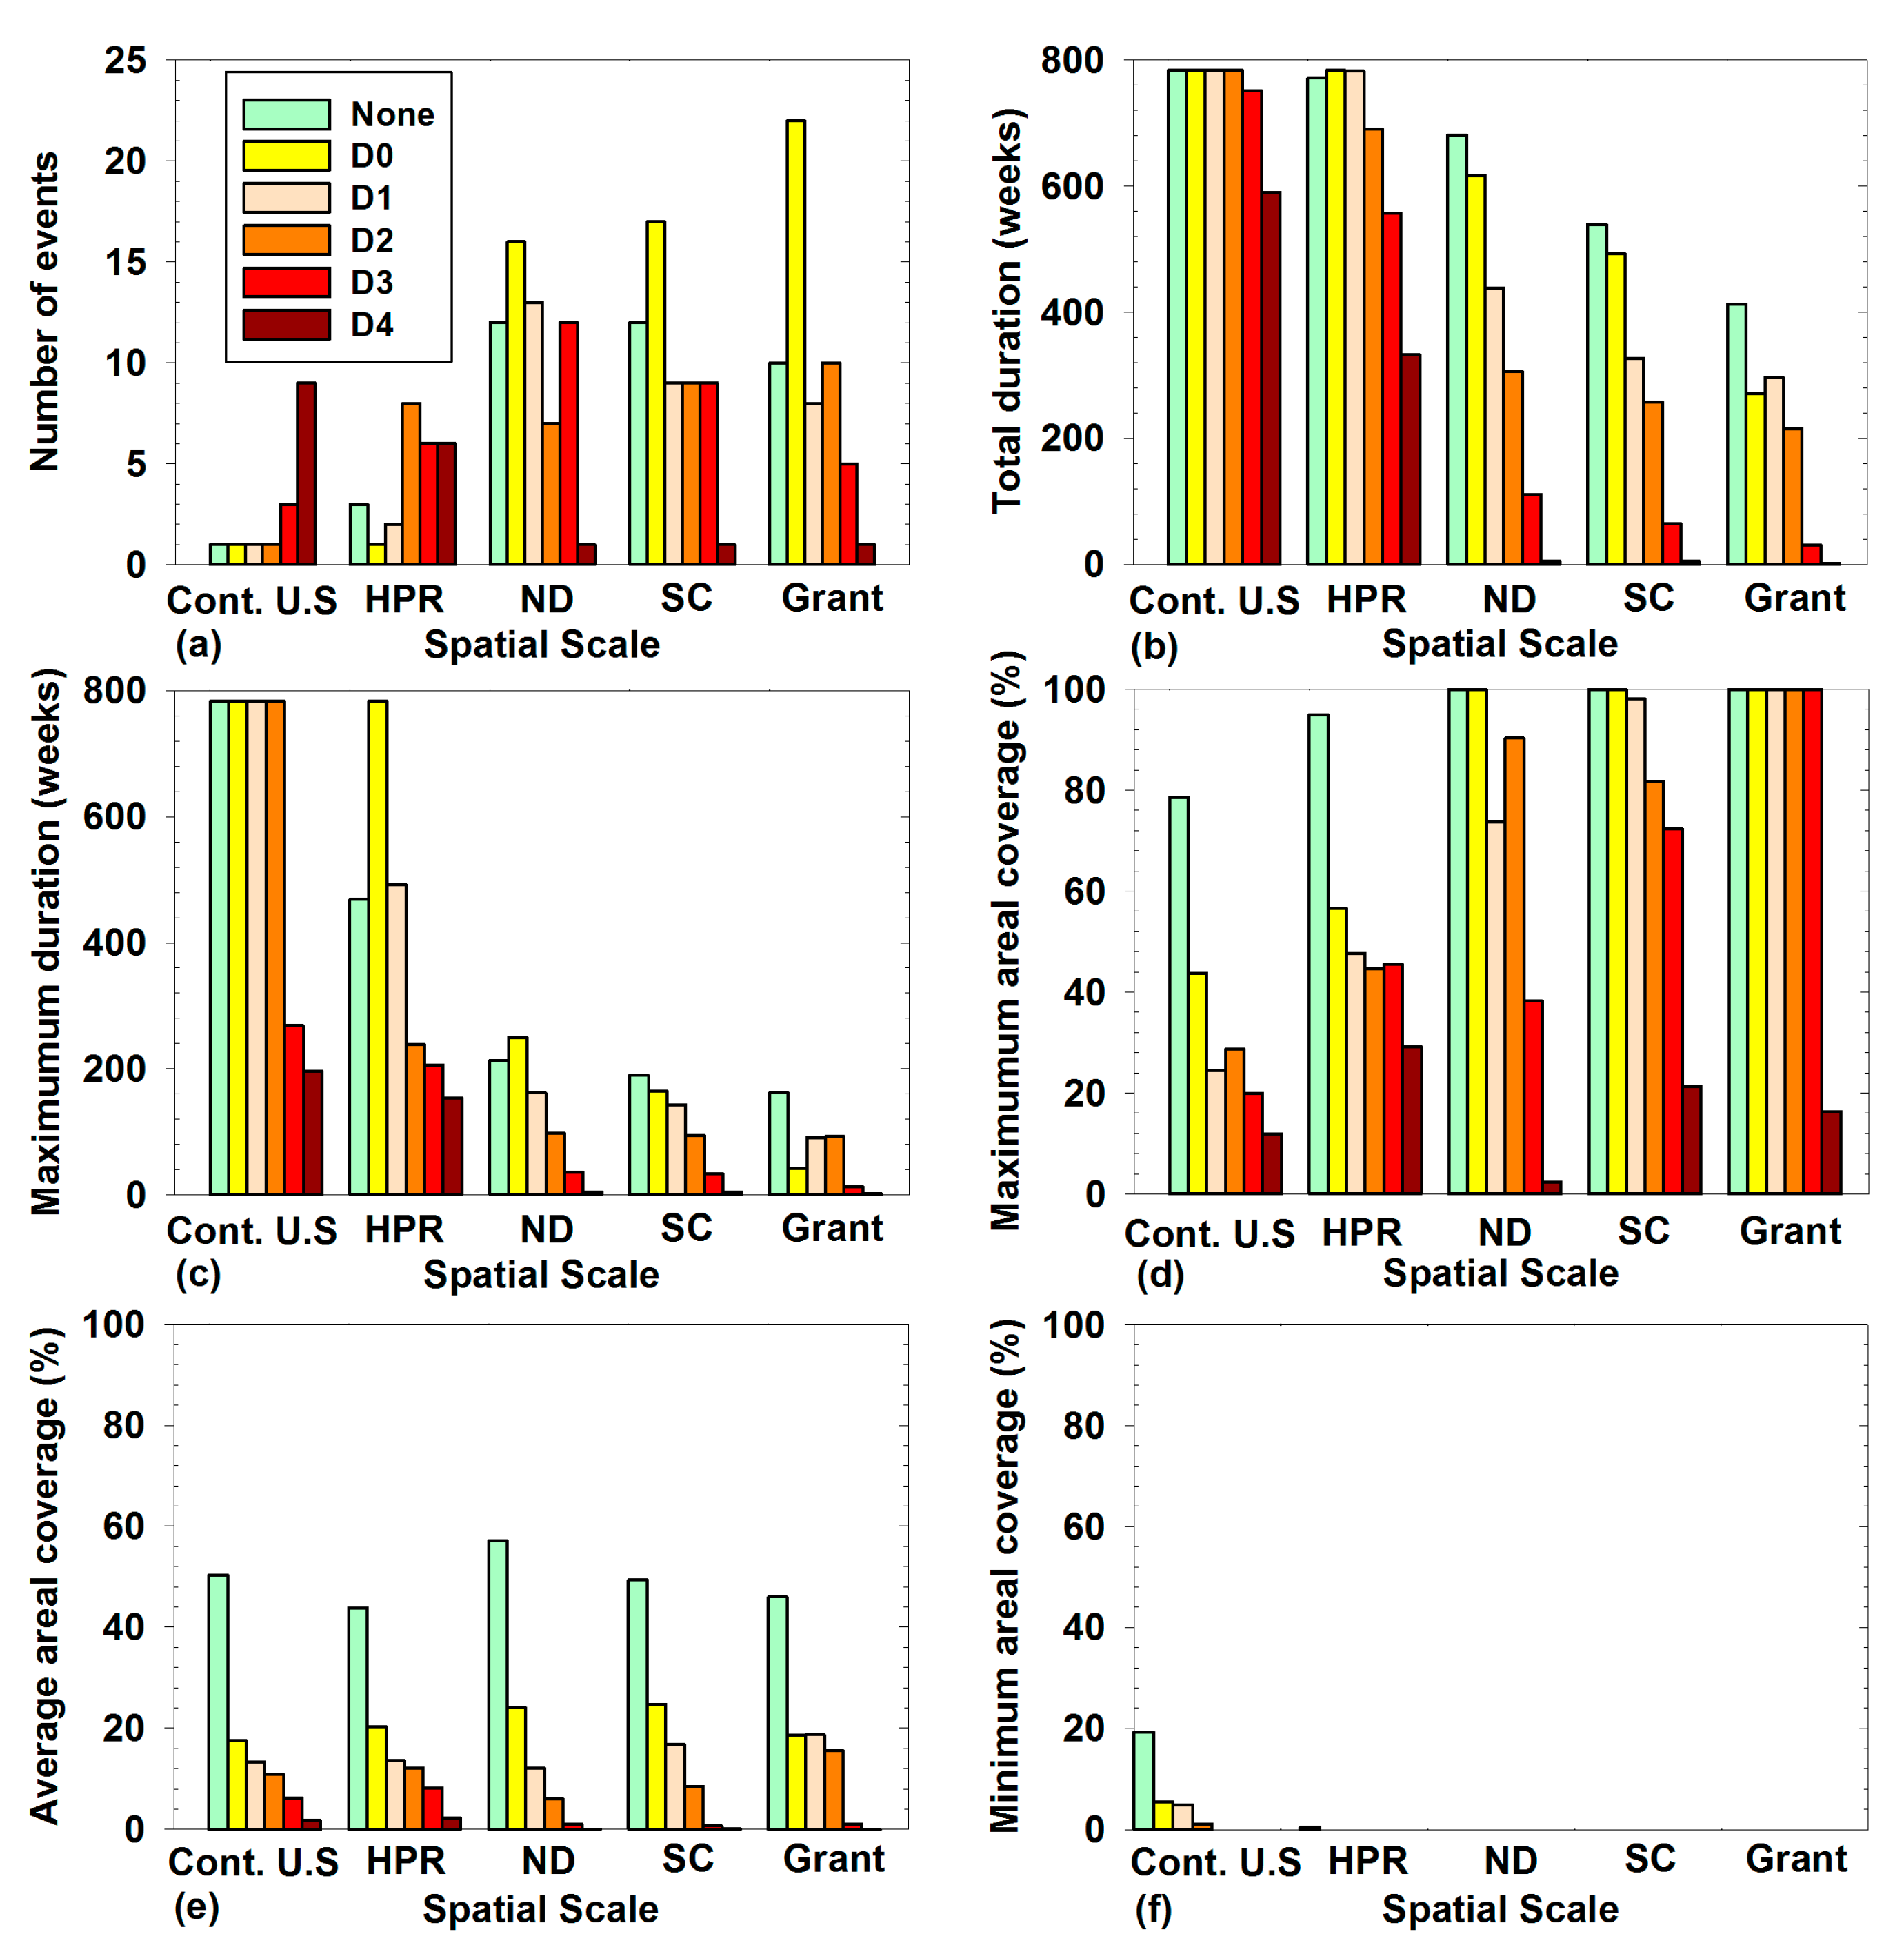
Figure 6 shows the characteristics of drought occurrences of different USDM intensity categories and at different spatial scales in the U.S.: The number of drought events, the total and maximum duration, and the maximum, average, and minimum areal coverages. From the number of events and total duration it can be concluded that at any given time in the time frame (2000–2014) at least some part of the contiguous U.S. experienced no drought (None), D0, D1, and D2 conditions (Figure 6a,b). Extreme drought (D3) and exceptional drought (D4) persisted continuously for 269 and 196 weeks, respectively, in the contiguous U.S. to their maximum duration (Figure 6c). The contiguous U.S. experienced D3 drought for 751 weeks out of 783 weeks, as three separate events, and D4 drought for 590 weeks out of 783 weeks as nine different events (Figure 6a,b).
The High Plains Region experienced the D0 condition throughout the study period. The “None” condition occurred for 771 weeks in the region whereas the D4 condition existed for 332 weeks with a maximum duration of 154 weeks (Figure 6b,c). North Dakota state experienced the absence of all drought conditions at least once in the past (Figure 6b,f). The state had 100% of its area covered by “None” and D0 conditions at their maximum coverages (Figure 6d). The state has experienced the D4 category only once for a duration of 5 weeks with a maximum areal coverage of 2.4% (Figure 6a–d). The South-Central climate division in ND experienced the “None” condition for 539 weeks, and has experienced the D4 condition for only about five weeks as a single event with a maximum coverage of 21.32% (Figure 6a–d). The Grant County in ND is covered 100% by None, D0, D1, D2, and D3 conditions at their maximum coverages (Figure 6d). The county experienced the D4 condition only once for a two week period with the maximum coverage of 16.36% (Figure 6c,d).
The number of events for the D0 condition appears to be increasing from a larger spatial scale to a smaller spatial scale. However, for all other drought conditions, the number of events do not show any relation to spatial scales (Figure 6a). The total and maximum duration for all conditions are decreasing from larger to smaller spatial scales (Figure 6b,c). It was an expected observation since smaller spatial scales are a subset of larger spatial scales. The average areal coverage of drought conditions did not show any trends related to spatial scales (Figure 6e). The maximum percentage area coverages were increasing from the larger spatial scales to smaller spatial scales for the “None”, D0, and D1 conditions (Figure 6d). All the spatial scales had been free of D4 and D3 at least once, as seen in the minimum area percentage coverage. All the spatial scales except the contiguous U.S. had been totally covered by D0 or high intensity drought at least once (i.e., zero percentage covered by “None”) whereas in the contiguous U.S. 80.75% had been covered by D0 or a high intensity drought at least once (i.e., 19.25% covered by “None”). The minimum percentage area coverages of D0 for the contiguous U.S. and HPR were 5.42% and 0.38%, respectively. The other spatial scales were devoid of the D0 category at least once. A section of the contiguous U.S. was covered by the D1 and D2 categories, at 4.80% and 1.08% areal extents, respectively, and all the other spatial scales were free of D1 and D2 at least once. In general, the minimum areal percentage coverages are decreasing towards the smaller spatial scales (Figure 6f).
5. Conclusions and Discussion
This study shows that southern and western parts of contiguous U.S. experienced high intensity drought frequently whereas the northeast part did less frequently. A combination of hydro-climatology and management practices of those areas could be the driver for the obtained spatial distribution and frequency of droughts. The spatial distribution of the areal coverage of droughts of different intensities also varied significantly from year to year. The propagation of different intensity droughts shows dissimilar patterns across different spatial scales. Depending on the size of the governing unit such as a county or state, an understanding of this scale-dependency is important for drought management and resource allocation.
The spatio-temporal characteristics of drought under different spatial scales show that the total duration, average percentage area, and maximum percentage areas are decreasing with increasing intensity for all spatial scales; and in the smaller spatial scale, the drought persists for a smaller duration compared to a larger spatial scale. There have been discussions about appropriate temporal scale for reporting drought. It may be useful to consider a finer temporal scale for smaller spatial scales and a larger temporal scaling for larger spatial scales. This study quantitatively demonstrates that there is clear variation in the drought characteristics such as intensity coverage, duration, and occurrence at different spatial scales. The findings emphasize that drought management and resource allocation policies need to be developed for different spatial scales, even for smaller administrative units such as a county. In order to manage drought impact in any administrative areal unit in any geographic location better, the dependence of drought characteristics on spatial scales needs to be studied at that location to derive drought characteristics appropriate for that scale. In recent years, there has been increasing concern about the drought and its threat to water availability and food security all over the world. Therefore, drought analysis and management has assumed greater significance. Any study to better quantify drought characteristics and their variation would be of great societal importance. In that context, a study of spatial scale dependence of drought characteristics such as this will be helpful in drought management and resource allocation.
It is to be noted that no generalization of the findings can be made based on this single case study. Nonetheless, spatial scale dependence of drought characteristics was evident in this particular study using areas of increasing spatial size around a county in North Dakota, U.S. The idea here is not to derive general findings, but only to verify the presence of the spatial scale’s effect on drought characteristics and to develop a methodology for investigating the effect of the scale on the spatio-temporal characteristics of droughts. Such scale investigations are necessary in order to account for the scale dependence of drought characteristics for effective drought management and allocation of resources.
Acknowledgments
The research reported in this paper was carried out at North Dakota State University while the first author was pursuing his doctoral degree. The authors would like to acknowledge North Dakota State University Graduate School Doctoral Dissertation Fellowship Award and the U.S. Geological Survey (USGS)-North Dakota Water Recourses Research Institute (ND WRRI) Fellowship Program for the financial support to this study.
Author Contributions
Navaratnam Leelaruban and G. Padmanabhan conceived the main idea. Navaratnam Leelaruban performed data collection, construction of data base, and analysis of the data. Both authors jointly wrote the paper.
Conflicts of Interest
The authors declare no conflict of interest.
References
- Dracup, J.A.; Lee, K.S.; Paulson, E.G. On the definition of droughts. Water Resour. Res. 1980, 16, 297–302. [Google Scholar] [CrossRef]
- Tallaksen, L.M.; Madsen, H.; Clausen, B. On the definition and modelling of streamflow drought duration and deficit volume. Hydrol. Sci. J. 1997, 42, 15–33. [Google Scholar] [CrossRef]
- Hisdal, H.; Tallaksen, L.M. Drought Event Definition. In ARIDE Technical Report 2000; University of Oslo: Oslo, Norway, December 2000. [Google Scholar]
- Mc Kee, T.B.; Doeskin, N.J.; Kleist, J. The Relationship of Drought Frequency and Duration to Time Scales. In Proceedings of the 8th Conference on Applied Climatology, Anaheim, CA, USA, 17–22 January 1993; pp. 179–184. [Google Scholar]
- Gillette, H.P. A creeping drought under way. Water Sew. Works 1950, 104, e105. [Google Scholar]
- Wilhite, D.A.; Sivakumar, M.V.K.; Pulwarty, R. Managing drought risk in a changing climate: The role of national drought policy. Weather Clim. Extrem. 2014, 3, 4–13. [Google Scholar] [CrossRef]
- Steinemann, A.C.; Hayes, M.; Cavalcanti, L. Drought indicators and triggers. In Drought and Water Crises: Science, Technology, and Management Issues; Wilhite, D., Ed.; CRC Press–Taylor & Francis group: Boca Raton, FL, USA, 2005; pp. 71–92. [Google Scholar]
- Sawada, Y.; Koike, T.; Jaranilla-Sanchez, P.A. Modeling hydrologic and ecologic responses using a new eco-hydrological model for identification of droughts. Water Resour. Res. 2014, 50, 6214–6235. [Google Scholar] [CrossRef]
- Palmer, W.C. Meteorological Drought; Research Paper No. 45; US Department of Commerce, Weather Bureau: Washington, DC, USA, 1965; p. 58.
- Mc Kee, T.B.; Doeskin, N.J.; Kleist, J. Drought Monitoring with Multiple Time Scales. In Proceedings of the 9th Conference on Applied Climatology, Dallas, TX, USA, 15–20 January 1995; pp. 233–236. [Google Scholar]
- Palmer, W.C. Keeping track of crop moisture conditions, nationwide: The new crop moisture index. Weatherwise 1968, 21, 156–161. [Google Scholar] [CrossRef]
- Shafer, B.; Dezman, L. Development of a Surface Water Supply Index (SWSI) to assess the severity of drought conditions in snowpack runoff areas. In Proceedings of the 50th Western Snow Conference, Reno, NV, USA, 19–23 April 1982; pp. 164–175. [Google Scholar]
- Guttman, N.B. Comparing the palmer drought index and the standardized precipitation index. J. Am. Water Resour. Assoc. 1998, 34, 113–121. [Google Scholar] [CrossRef]
- Heim, R.R. A review of twentieth-century drought indices used in the united states. Bull. Am. Meteorol. Soc. 2002, 83, 1149–1165. [Google Scholar]
- Keyantash, J.; Dracup, J.A. The quantification of drought: An evaluation of drought indices. Bull. Am. Meteorol. Soc. 2002, 83, 1167–1180. [Google Scholar] [CrossRef]
- Narasimhan, B.; Srinivasan, R. Development and evaluation of Soil Moisture Deficit Index (SMDI) and Evapotranspiration Deficit Index (ETDI) for agricultural drought monitoring. Agric. For. Meteorol. 2005, 133, 69–88. [Google Scholar] [CrossRef]
- Mishra, A.K.; Singh, V.P. A review of drought concepts. J. Hydrol. 2010, 391, 204–216. [Google Scholar] [CrossRef]
- Dai, A. Drought under global warming: A review. Wiley Interdiscip. Rev. Clim. Change 2011, 2, 45–65. [Google Scholar] [CrossRef]
- Qin, Y.; Yang, D.; Lei, H.; Xu, K.; Xu, X. Comparative analysis of drought based on precipitation and soil moisture indices in haihe basin of North China during the period of 1960–2010. J. Hydrol. 2015, 526, 55–67. [Google Scholar] [CrossRef]
- Hayes, M.; Svoboda, M.; Wall, N.; Widhalm, M. The Lincoln declaration on drought indices. Bull. Am. Meteorol. Soc. 2011, 92, 485–488. [Google Scholar] [CrossRef]
- Kallis, G. Droughts. Annu. Rev. Environ. Resour. 2008, 33, 85–118. [Google Scholar] [CrossRef]
- Svoboda, M.; LeComte, D.; Hayes, M.; Heim, R.; Gleason, K.; Angel, J.; Rippey, B.; Tinker, R.; Palecki, M.; Stooksbury, D.; et al. The drought monitor. Bull. Am. Meteorol. Soc. 2002, 83, 1181–1190. [Google Scholar]
- Kao, S.C.; Govindaraju, R.S.; Niyogi, D. A spatio-temporal drought analysis for the Midwestern US. In Proceedings of the World Environmental and Water Resources Congress, Kansas City, MO, USA, 17–21 May 2009; pp. 4654–4663. [Google Scholar]
- Hao, Z.; AghaKouchak, A. Multivariate standardized drought index: A parametric multi-index model. Adv. Water Resour. 2013, 57, 12–18. [Google Scholar] [CrossRef]
- Wood, A.W. The University of Washington Surface Water Monitor: An experimental platform for national hydrologic assessment and prediction. In Proceedings of the 22nd conference on hydrology American Meteorology Society annual meeting, New Orleans, LA, USA, 20–24 January 2008. [Google Scholar]
- Lyon, B.; Bell, M.A.; Tippett, M.K.; Kumar, A.; Hoerling, M.P.; Quan, X.W.; Wang, H. Baseline probabilities for the seasonal prediction of meteorological drought. J. Appl. Meteorol. Climatol. 2012, 51, 1222–1237. [Google Scholar] [CrossRef]
- Quan, X.W.; Hoerling, M.P.; Lyon, B.; Kumar, A.; Bell, M.A.; Tippett, M.K.; Wang, H. Prospects for dynamical prediction of meteorological drought. J. Appl. Meteorol. Climatol. 2012, 51, 1238–1252. [Google Scholar] [CrossRef]
- Hao, Z.; AghaKouchak, A.; Nakhjiri, N.; Farahmand, A. Global integrated drought monitoring and prediction system. Sci. Data 2014, 1, 140001. [Google Scholar] [CrossRef] [PubMed]
- Abatzoglou, J.T. Development of gridded surface meteorological data for ecological applications and modelling. Int. J. Climatol. 2013, 33, 121–131. [Google Scholar] [CrossRef]
- Lott, N.; Ross, T. Tracking and Evaluating US Billion Dollar Weather Disaster 1985–2005. Available online: http://www1.ncdc.noaa.gov/pub/data/papers/200686ams1.2nlfree.pdf (accessed on 20 March 2017).
- Cook, E.R.; Seager, R.; Cane, M.A.; Stahle, D.W. North American drought: Reconstructions, causes, and consequences. Earth-Sci. Rev. 2007, 81, 93–134. [Google Scholar] [CrossRef]
- Smith, A.B.; Katz, R.W. US billion-dollar weather and climate disasters: Data sources, trends, accuracy and biases. Nat. Hazards 2013, 67, 387–410. [Google Scholar] [CrossRef]
- Cook, B.I.; Ault, T.R.; Smerdon, J.E. Unprecedented 21st century drought risk in the American southwest and central plains. Sci. Adv. 2015, 1, e1400082. [Google Scholar] [CrossRef] [PubMed]
- Karl, T.R. Some spatial characteristics of drought duration in the United States. J. Clim. Appl. Meteorol. 1983, 22, 1356–1366. [Google Scholar] [CrossRef]
- Leelaruban, N.; Oduor, P.G.; Akyuz, A.; Shaik, S.; Padmanabhan, G. Leveraging a spatio–temporal drought severity and coverage index with crop yield modelled as a stochastic process. Int. J. Hydrol. Sci. Technol. 2012, 2, 219–236. [Google Scholar] [CrossRef]
- Vicente-Serrano, S. Differences in spatial patterns of drought on different time scales: An analysis of the Iberian Peninsula. Water Resour. Manag. 2006, 20, 37–60. [Google Scholar] [CrossRef]
- Logan, K.E.; Brunsell, N.A.; Jones, A.R.; Feddema, J.J. Assessing spatiotemporal variability of drought in the US central plains. J. Arid Environ. 2010, 74, 247–255. [Google Scholar] [CrossRef]
- Gocic, M.; Trajkovic, S. Spatiotemporal characteristics of drought in Serbia. J. Hydrol. 2014, 510, 110–123. [Google Scholar] [CrossRef]
- Mishra, A.K.; Singh, V.P. Drought modeling—A review. J. Hydrol. 2011, 403, 157–175. [Google Scholar] [CrossRef]
- Russo, A.C.; Gouveia, C.M.; Trigo, R.M.; Liberato, M.L.; DaCamara, C.C. The influence of circulation weather patterns at different spatial scales on drought variability in the Iberian Peninsula. Front. Environ. Sci. 2015, 3. [Google Scholar] [CrossRef]
- Wang, Q.; Wu, J.; Lei, T.; He, B.; Wu, Z.; Liu, M.; Mo, X.; Geng, G.; Li, X.; Zhou, H.; Liu, D. Temporal-spatial characteristics of severe drought events and their impact on agriculture on a global scale. Quat. Int. 2014, 349, 10–21. [Google Scholar] [CrossRef]
- Panu, U.S.; Sharma, T.C. Challenges in drought research: Some perspectives and future directions. Hydrol. Sci. J. 2002, 47, S19–S30. [Google Scholar] [CrossRef]
- Demuth, S.; Stahl, K. ARIDE—Assessment of the Regional Impact of Droughts in Europe; Final Report 2001; Institute of Hydrology, University of Freiburg: Freiburg, Germany, 2001. [Google Scholar]
- Hayes, M.J.; Svoboda, M.; Le Comte, D.; Redmond, K.T.; Pasteris, P. Drought monitoring: New tools for the 21st century. In Drought and Water Crises: Science, Technology, and Management Issues; Wilhite, D., Ed.; CRC Press-Taylor & Francis group: Boca Raton, FL, USA, 2005; pp. 53–69. [Google Scholar]
- Svoboda, M.D.; Fuchs, B.A.; Poulsen, C.C.; Nothwehr, J.R. The drought risk atlas: Enhancing decision support for drought risk management in the United States. J. Hydrol. 2015, 526, 274–286. [Google Scholar] [CrossRef]
- The U.S. Drought Monitor. Available online: http://droughtmonitor.unl.edu/ (accessed on 16 July 2017).
Figure 1.
Spatial scales considered in this study.

Figure 2.
Drought occurrences (in weeks) of intensity categories D4, D3, D2, and D1 during the years 2000 through 2014 (783 weeks).
Figure 2.
Drought occurrences (in weeks) of intensity categories D4, D3, D2, and D1 during the years 2000 through 2014 (783 weeks).
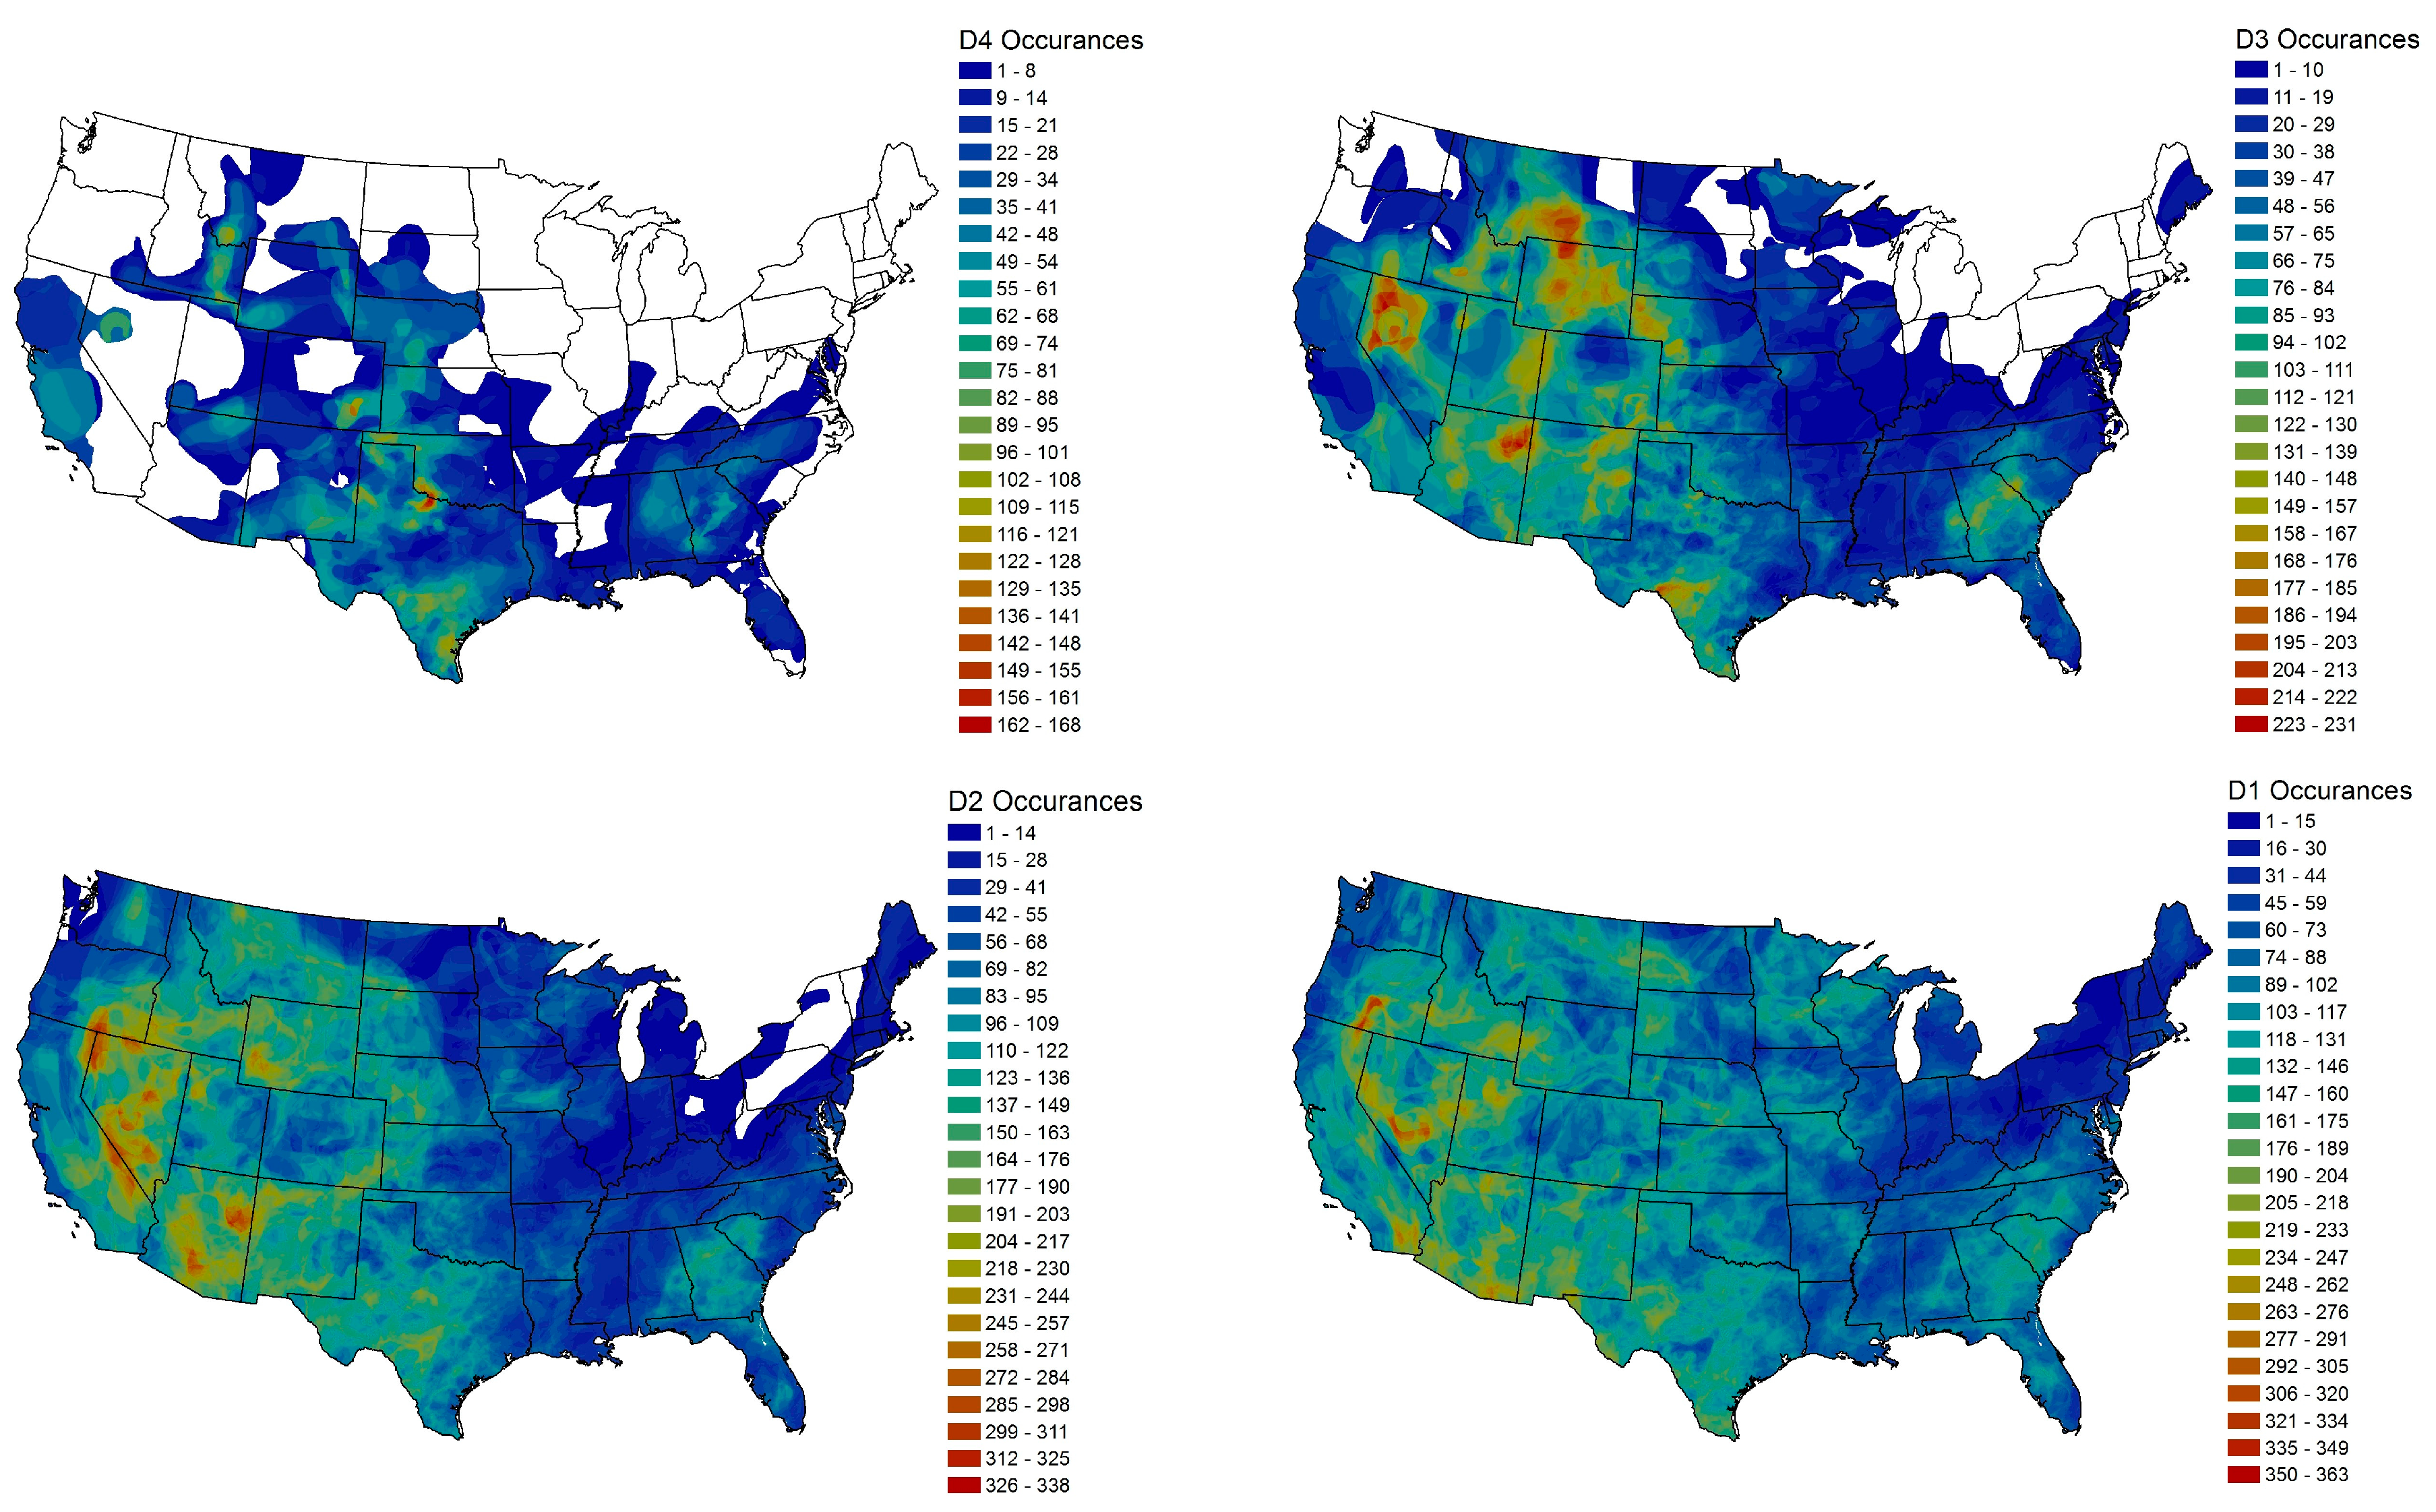
Figure 3.
Areal coverage of the highest intensity of drought that an area experienced for years 2000–2014 (a–o).
Figure 3.
Areal coverage of the highest intensity of drought that an area experienced for years 2000–2014 (a–o).
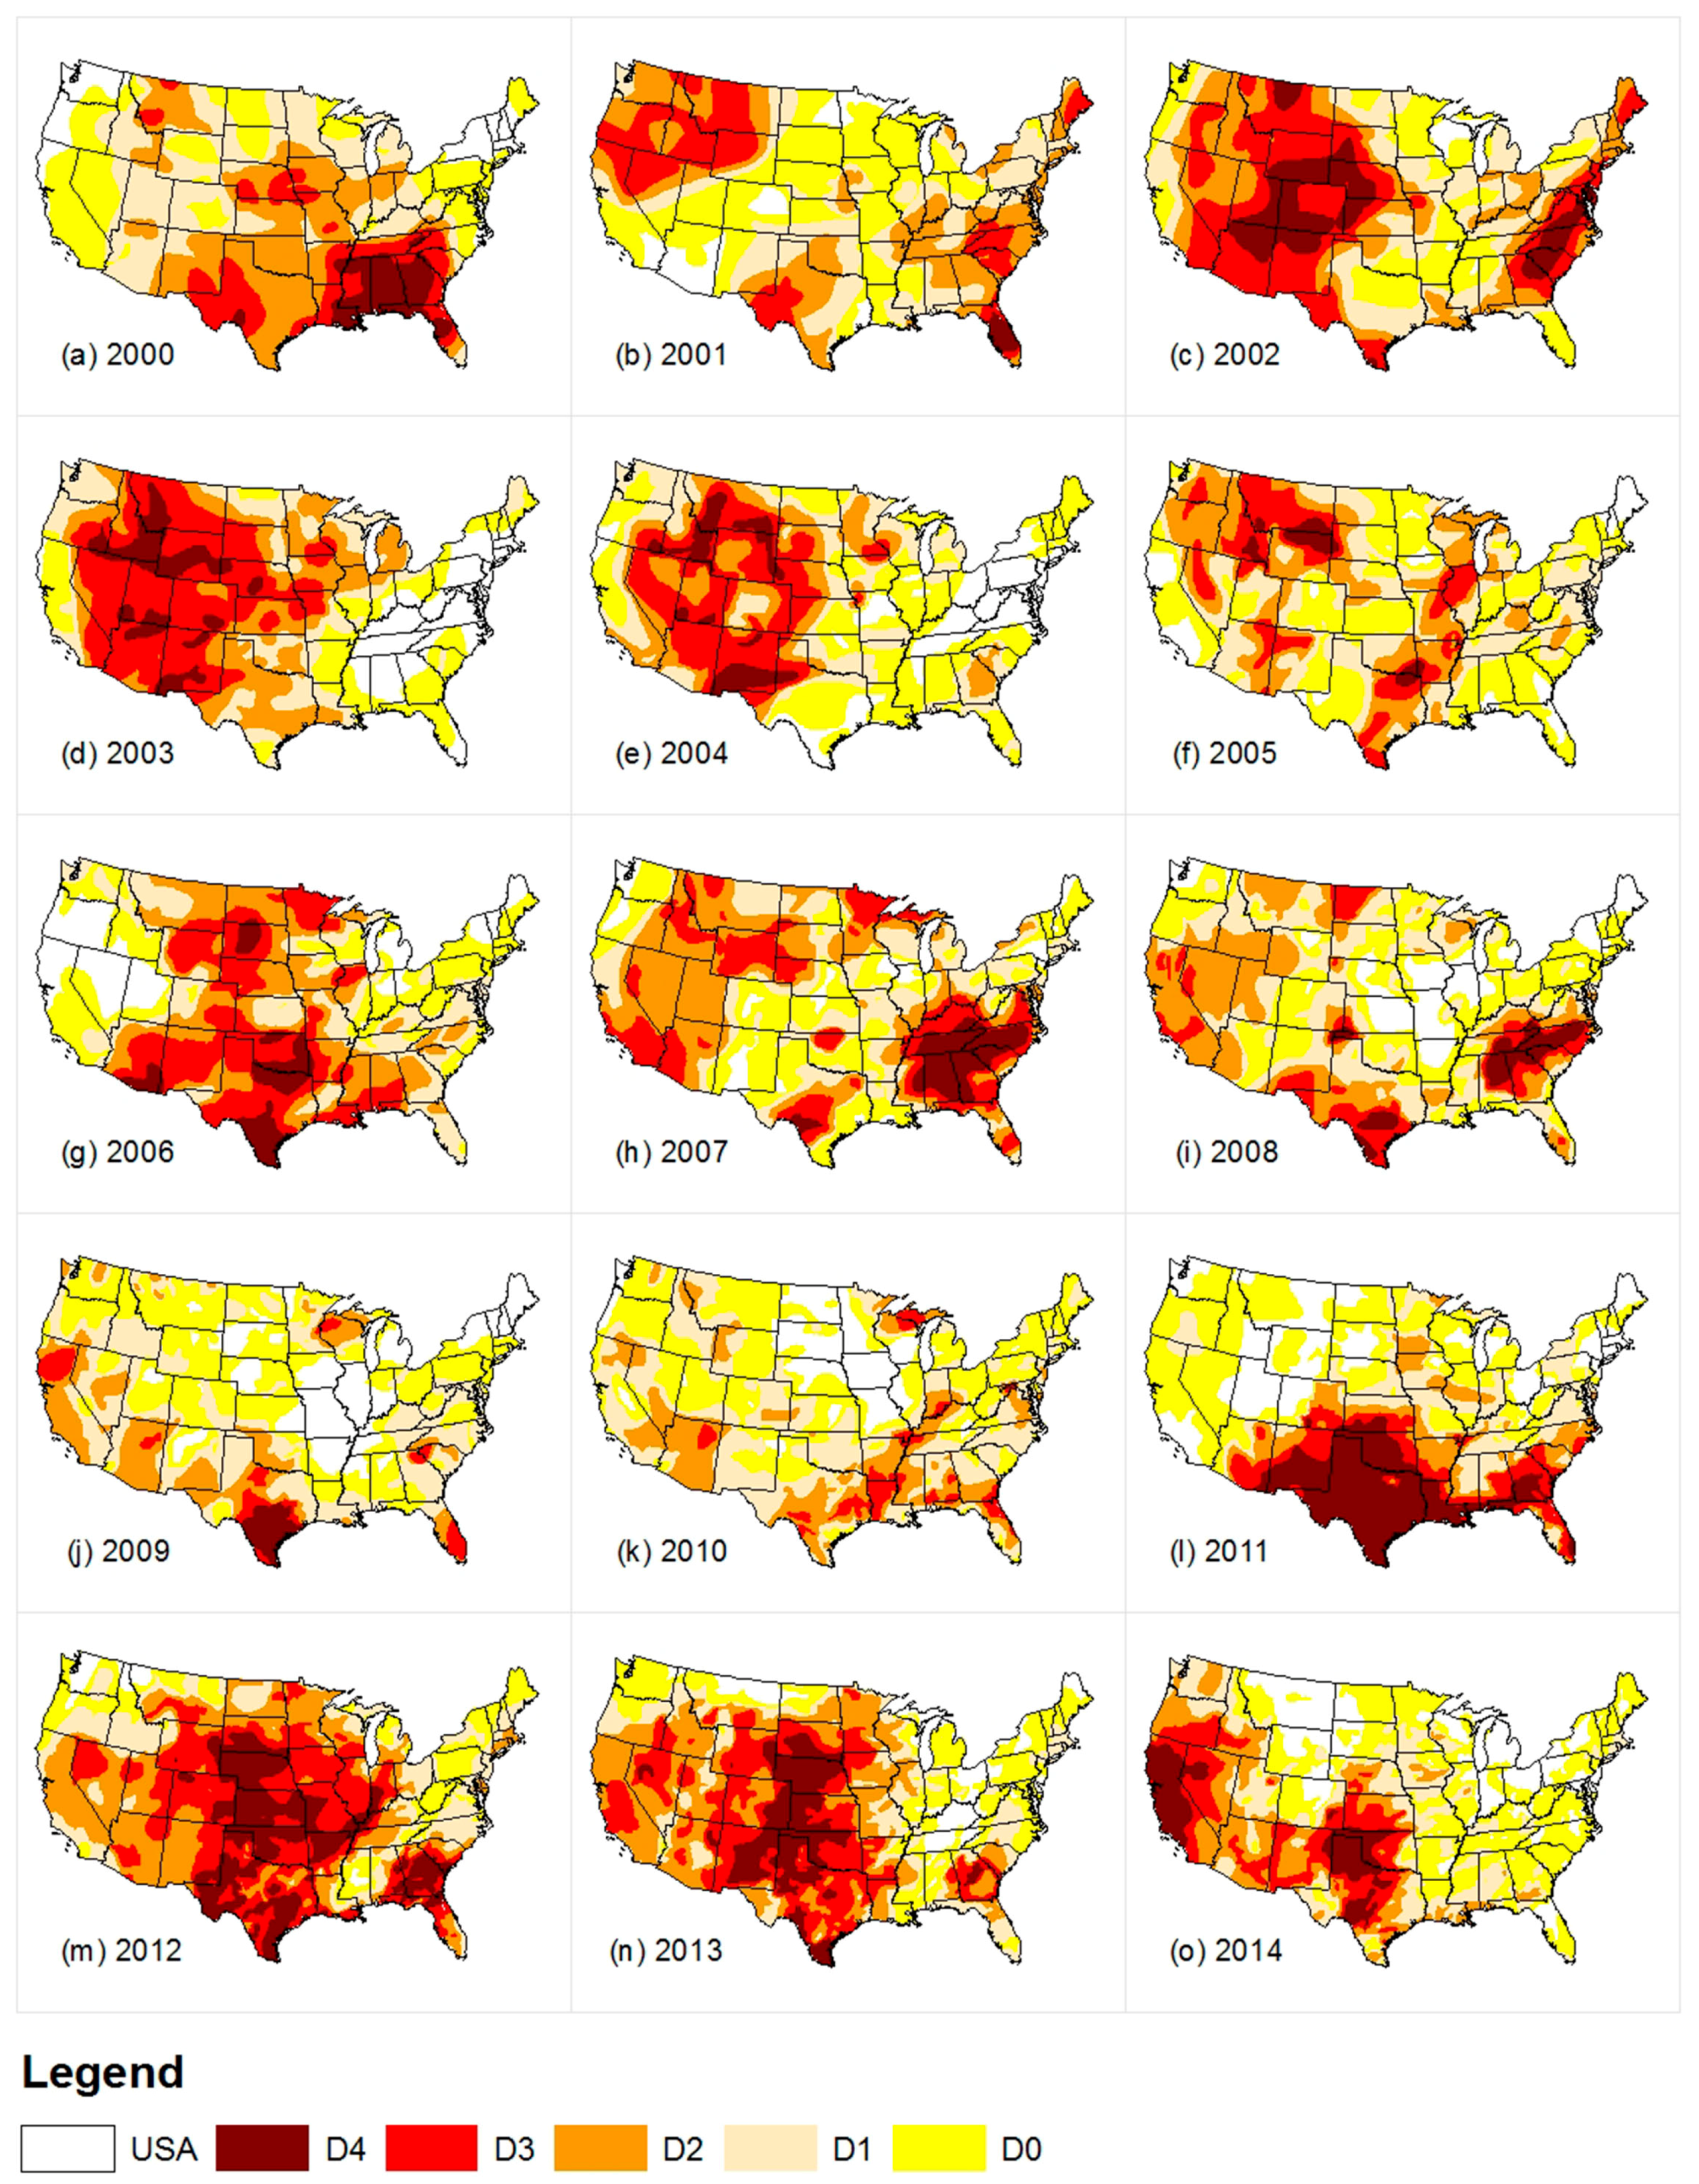
Figure 4.
Propagation of areal coverage (AC) of different intensity category droughts over (a) Grant county, ND; (b) SCCD, ND; (c) ND State; (d) HPR; and (e) the contiguous U.S.
Figure 4.
Propagation of areal coverage (AC) of different intensity category droughts over (a) Grant county, ND; (b) SCCD, ND; (c) ND State; (d) HPR; and (e) the contiguous U.S.

Figure 5.
Areal coverage of drought during 20 December 2005–23 October 2006. (a) exceptional drought (D4); (b) extreme drought (D3); (c) severe drought (D2); (d) moderate drought (D1); (e) abnormally dry (D0); and (f) all categories.
Figure 5.
Areal coverage of drought during 20 December 2005–23 October 2006. (a) exceptional drought (D4); (b) extreme drought (D3); (c) severe drought (D2); (d) moderate drought (D1); (e) abnormally dry (D0); and (f) all categories.

Figure 6.
Comparing spatial scales with: (a) The number of events; (b) the total duration (weeks); (c) the maximum duration (weeks); (d) the maximum areal coverage; (e) the average areal coverage; and (f) the minimum areal coverage for each intensity category and “none” condition.
Figure 6.
Comparing spatial scales with: (a) The number of events; (b) the total duration (weeks); (c) the maximum duration (weeks); (d) the maximum areal coverage; (e) the average areal coverage; and (f) the minimum areal coverage for each intensity category and “none” condition.


Table 1.
The percentage areal coverage of different drought intensity categories in the contiguous U.S.
Table 1.
The percentage areal coverage of different drought intensity categories in the contiguous U.S.
| Year | Drought Intensity Categories | ||||
|---|---|---|---|---|---|
| D4 | D3 | D2 | D1 | D0 | |
| 2000 | 6.2 | 17.8 | 43.7 | 70.8 | 90.1 |
| 2001 | 0.8 | 16.6 | 41.0 | 63.2 | 91.2 |
| 2002 | 12.3 | 38.3 | 58.7 | 77.5 | 90.1 |
| 2003 | 7.4 | 34.5 | 53.5 | 58.4 | 63.0 |
| 2004 | 5.4 | 23.0 | 36.4 | 46.1 | 63.0 |
| 2005 | 2.4 | 14.5 | 37.6 | 64.0 | 90.3 |
| 2006 | 5.6 | 27.7 | 49.0 | 68.4 | 82.8 |
| 2007 | 6.2 | 24.1 | 50.8 | 70.5 | 89.0 |
| 2008 | 4.2 | 12.5 | 36.5 | 60.4 | 80.9 |
| 2009 | 2.2 | 5.7 | 20.1 | 47.5 | 78.1 |
| 2010 | 0.0 | 4.4 | 22.5 | 54.1 | 86.6 |
| 2011 | 16.1 | 24.3 | 33.9 | 47.6 | 70.3 |
| 2012 | 16.9 | 42.6 | 67.5 | 81.6 | 83.9 |
| 2013 | 11.7 | 33.5 | 58.5 | 66.6 | 72.0 |
| 2014 | 7.3 | 19.0 | 31.8 | 42.8 | 62.6 |
© 2017 by the authors. Licensee MDPI, Basel, Switzerland. This article is an open access article distributed under the terms and conditions of the Creative Commons Attribution (CC BY) license (http://creativecommons.org/licenses/by/4.0/).
Share and Cite
MDPI and ACS Style
Leelaruban, N.; Padmanabhan, G. Drought Occurrences and Their Characteristics across Selected Spatial Scales in the Contiguous United States. Geosciences 2017, 7, 59. https://doi.org/10.3390/geosciences7030059
AMA Style
Leelaruban N, Padmanabhan G. Drought Occurrences and Their Characteristics across Selected Spatial Scales in the Contiguous United States. Geosciences. 2017; 7(3):59. https://doi.org/10.3390/geosciences7030059
Chicago/Turabian StyleLeelaruban, Navaratnam, and G. Padmanabhan. 2017. "Drought Occurrences and Their Characteristics across Selected Spatial Scales in the Contiguous United States" Geosciences 7, no. 3: 59. https://doi.org/10.3390/geosciences7030059
Note that from the first issue of 2016, this journal uses article numbers instead of page numbers. See further details here.