Comparison of the Mineral Element Content of Public Drinking Fountains and Bottled Water: A Case Study of Ferrara City


1
Department of Environmental, Biological and Pharmaceutical Sciences and Technologies, University of Campania “Luigi Vanvitelli”, Via Vivaldi 43, 81100 Caserta, Italy
2
Department of Physics and Earth Sciences, University of Ferrara, Via Saragat 1, 44122 Ferrara, Italy
Geosciences 2017, 7(3), 76; https://doi.org/10.3390/geosciences7030076
Submission received: 25 June 2017
/
Revised: 23 August 2017
/
Accepted: 29 August 2017
/
Published: 1 September 2017
(This article belongs to the Special Issue Urban Environmental and Medical Geochemistry)
Abstract
:Mineral elements are essential nutrients for humans and play important roles in many human physiological and bio-chemical processes. In this study, a comparison between the levels of mineral elements present in the water of public drinking fountains (PDRF) and in bottled water was carried out. The aim of the study is to assess the effectiveness of PDRF as a mineral supplement, compared to the low-mineral bottled water for out-door non-competitive activity, such as jogging. The city of Ferrara was chosen as the study site. It has ancient walls and on their top there is a gravel road that people use for jogging and walking. Along the road, there are two public drinking fountains that are always used. Water from these fountains was sampled and analysed for major cations and anions using ionic chromatography. Data analyses were compared with the same analyses carried out on bottled water usually used by joggers. Results showed that fountains are a valid substitute of bottled water as they have a moderate content of mineral elements. During outdoor sport activity, the water from fountains is preferable for the reintegration of mineral elements, instead of bottled water that has a very low quantity of minerals.
1. Introduction
Mineral elements (such as Ca2+, Mg2+, K+, and Na+) are essential nutrient elements for humans, and play important roles in many physiological (such as muscle contraction) and bio-chemical (for example, enzymatic reactions) processes [1,2,3,4]. Since many of these processes are accelerated during physical exercise, an adequate amount of mineral integration is necessary for optimal health during sport activities [1,4,5]. Macro-elements, e.g., Ca2+, Mg2+, K+, and Na+, are of particular importance for metabolic balance in sports and during physical exercise [1,2]. Na+ contributes to the maintenance of osmotic pressure, water regulation, and acid–base balance. The cations K+ and Mg2+ are involved in the propagation of nerve impulses and in muscle and heart contraction. Ca2+ controls vascular tonicity and coagulation of the blood [2].
The main source of mineral intake is water, but significant differences exist among the mineral content of available drinking water, and often water ingested daily does not contain the recommended dietary allowances [6].
In modern cities, jogging is one of the most practiced outdoor sports, and runners frequently use energy drinks to compensate for the loss of mineral elements. However, since the majority of runners in the city perform easy physical activities, the absorption of mineral nutrients can be supplied by simple tap water. In addition, some studies showed that some substances contained in energy drinks could be unsuitable for human health [7,8].
The use of water for body rehydration is also recommended given that the ions in water are easily absorbed from the gastrointestinal tract [9], and the best way to reintegrate minerals is to drink water with an adequate total dissolved salt content [6].
Runners have access to two types of outdoor water sources: bottled water and public drinking fountains (hereafter PDRF).
Mineral levels of public drinking water (for example, PDRF) vary among various cities, and commercially available bottled water has different compositions related to the hydrology and chemical characteristics of the water sources [6]. Therefore, people should be selective when deciding which water to drink when jogging. However, frequently, the choice between these two sources is driven by misconceptions. Often, people are not sure about the quality of tap water and think bottled water is healthier, even if this is not always true [10]. Many people are convinced that tap water is not good to drink, and bottled is perceived as safer, healthier and of better quality; however, there is no proof to confirm this [10,11]. Indeed, bottled water is not always better in quality than tap water, and the population’s fear about public piped water is not justifiable [12,13,14,15,16].
In the new millennium, a modern Smart City should include among its urban planning strategies the optimization of the drinking water supply structure, in order to improve the quality of life and satisfy the needs of citizens. Part of this optimization is possible by informing people about the advantage of drinking water supply structures by using PDRF during jogging. This is true because there are ecological and healthy reasons to prefer PDRF water to bottled water. Regarding the environmental impact, it is known that Polyethylene Terephthalate (PET) water bottles (production, transportation, disposal, packaging waste and pollution) and mineral water industry (bottling, trading and transporting) impacts are extremely negative [11,17,18,19,20]. In terms of health, mineral elements in bottled water are in some cases low, whereas often, public drinking water sources have an optimal mineral profile (high levels of Ca2+ and Mg2+ and little Na+), and adequate daily consumption of tap water may help people supplement their dietary intake of mineral nutrients [6].
The objectives of this study were to determine whether PDRF water contains satisfactory levels of mineral elements and determine whether differences in the mineral content of PDRF and commercially bottled water are significant.
In this research, the city of Ferrara (Italy) was taken as a case study. This city has ancient city walls used by people for jogging and walking, and along the path there are two PDRFs available to citizens. During 2015, a short survey was conducted regarding the average number of people who jog, how many of them drink from the PDRFs and how many drink bottled water.
Water from these PDRFs was sampled and analysed for major cations and anions for the chemical characterization of water. Results were compared with data obtained for bottled water used by people who go jogging.
Mineral levels (Mg2+, Ca2+, K+ and Na+) in PDRF and bottled waters were compared to Dietary Reference Intakes (DRI) values [21] in order to assess how useful they are in terms of the intake of the recommended dietary allowance of minerals.
If the potential effectiveness of PDRF as an adequate mineral supplier for non-competitive activity (such as jogging) can be demonstrated, it will be possible to devise a future project aiming at revaluating PDRFs. This can be achieved by showing the results of this study and highlighting the fact that bottled water is not always superior in quality compared to tap water, and the population’s concern about municipal piped water is not justified.
2. Materials and Methods
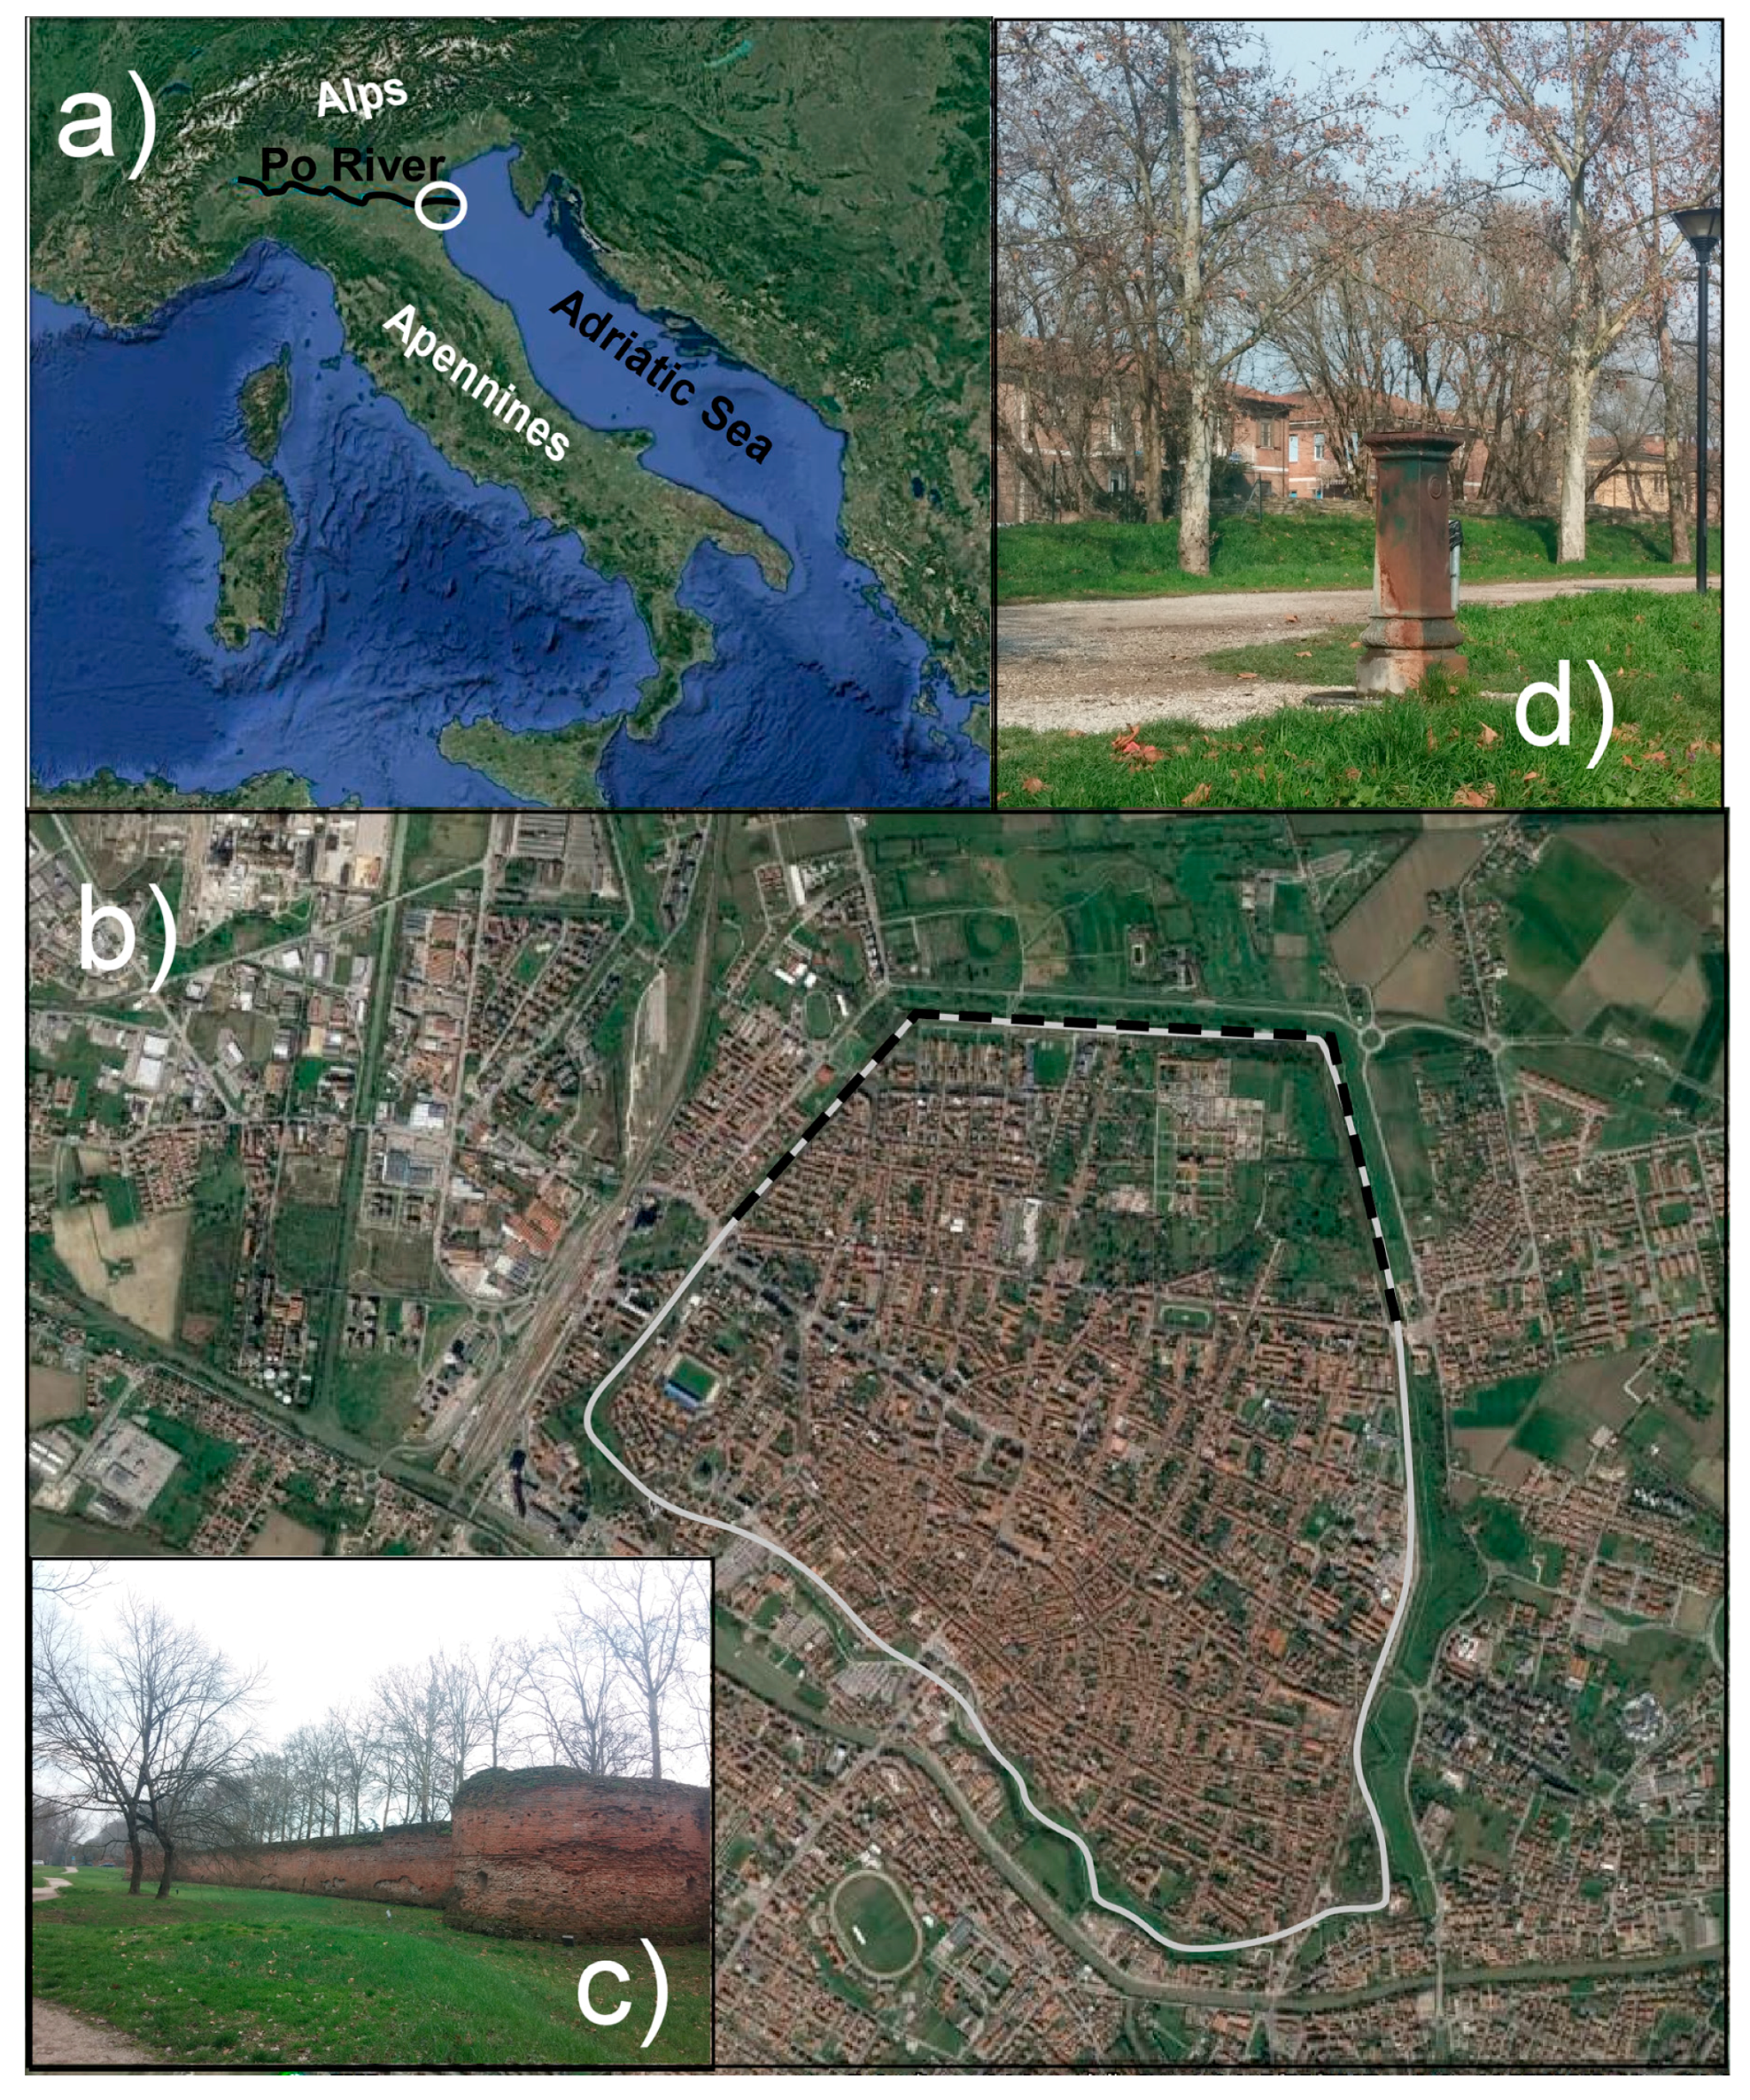
Ferrara is a city located in north-eastern Italy, inhabited by 132,000 people and a population density of 326 people per km2 (Figure 1a,b). The downtown is surrounded by 9 km of city walls for the exclusive use of cyclists and pedestrians (Figure 1b,c). On the top of the walls there is a gravel road used by people who jog. Public water is taken from the Po River and made potable by a water treatment plant located in Pontelagoscuro village (North of Ferrara). Information about the water disinfection and treatment is available at the website: http://www.gruppohera.it.
During 2015, every weekend for five months, from April to August, (i.e., the period when there is a greater presence of people jogging on the city’s walls) a survey was carried out, regarding the average number of people who jog, how many of them drink from the PDRFs, and how many drink bottled water. Daily, during periods of high activity, the number of people running or walking briskly near the two PDRFs during an hour was counted (Figure 1d). In addition, the number of people who drank was recorded, and if they used bottled water, the brand name was noted. Another method that was used to gain information on the types of bottled water used was to look into the waste bins situated near the PDRFs.
In order to have a representative idea of the types of commercially available mineral water, nine bottles were additionally analysed. The choice of water bottle type was determined according to a classification based on the total dissolved solids (TDS) values [22]. Three bottles of water with a very low mineral content (TDS < 50 mg/L), low mineral content (TDS > 50 and < 500 mg/L) and a medium mineral content (TDS between 500 and 1500 mg/L) were purchased at a local supermarket.
During the monitoring activity, 20 samples of PDRF water were taken. Each sample was obtained by combining two sub-samples, one for each PDRF along the path.
Electrical conductivity (EC) and pH were measured in situ using a HANNA 236 Multi 340i multiparameter probe. The probe was calibrated for EC (at 25 °C) and pH before each sampling round. Parameters were also crosschecked in the laboratory by measuring them with an Orion 4star multi-parameter benchtop probe (Thermo Fisher, Waltham, MA, USA). High-density polyethylene bottles, used for sampling, were washed with a solution with 10% HNO3 for 24 h and rinsed twice with ultrapure water (resistivity of ca. 18.2 MΩ × cm). All samples were stored at 4 °C until analysis. The major and most common ions present in natural water were analysed using Dionex® ICS 1000 ion chromatography systems. Detailed descriptions of analytical methods are reported in Cuoco et al. [23]. All samples were filtered through 0.45-μm Minisart® NML cellulose acetate syringe filters and then stored in 5-mL plastic Dionex® ion chromatography vials. A CS12A 4 × 250-mm high-capacity column and a 244CSRS-ULTRA 4-mm suppressor acid ware used for cation analysis, and a AS9-HC 4 × 250-mm high-capacity column and an ASRS-ULTRA 4-mm suppressor were used for anion analysis. Specific anion (F−, NO3−, SO42−, Br− and Cl−) and cation (Na+, K+, Mg2+, Li+, NH4+ and Ca2+) standards, provided by Dionex®, were used to the calibration of the instrument. A 10 mg/L anion and cation Fluka spike (Sigma-Aldrich, St. Louis, MO, USA) was analysed along with the samples, standards, and blanks. Internal and external calibrations using a minimum of five standards for both cations and anions were carried out for each analysis [23].
Total salts was determined using gravimetric methods and expressed as the substance content in grams, obtained after evaporation of 1 L of water at 180 °C. HCO3− was determined using a Hanna Instruments alkalinity test kit (model HI-3811). The samples were analysed in triplicate. The errors on ionic balances were always less than 5%.
3. Results
During monitoring activity (1 h), an average of 120 joggers were counted, but only 20% drank water during running, and of these, 3 of 4 drunk from the PDRFs.
From a direct and indirect inspection (through observations of the waste bins), the most consumed bottled water was of two types B4 and B5 (Table 1). Table 1 shows the results of chemical analyses of B4 and B5 water, together with 9 other bottled water types that can be purchased in the study area (B1, B2, B3, B6, B7, B8, B9, B10 and B11). Table 2 shows the physical parameters and chemical compositions of 20 PDRF water samples.
Based on the obtained TDS (Table 1), the bottled water was classified as follows: B1, B2, B3, B4 and B5 had a very low mineral content (average TDS 50 mg/L; Group 1); B6, B7 and B8 (average TDS 176 mg/L; Group 2) had a low mineral content; and B9, B10 and B11 were classified as oligomineral water (mean TDS 989 mg/L; Group 3).
Another parameter that indicates the amount of dissolved ions in drinking water is the EC [24]. According to Van der Aa [22], the B1, B2 and B3 samples (EC < 77 µS/cm) had a very low mineral concentration, the B4-5-6-7-8 samples (EC 77–769 µS/cm) had a low mineral concentration, whereas B9, B10 and B11 (EC 769–2308 µS/cm) had an intermediate mineral concentration. Rosborg et al. [24] also suggest a detailed classification based on EC, and according to their range value, the B1 sample was rainwater (EC 10–30 µS/cm), the B1 and B3 samples were mineral-poor water (30–100 µS/cm), the B4-5-6-7 samples had moderate nutrient levels (mesotrophic water; 100–250 µS/cm), and the B8 sample was mineral-rich water (eutrophic water 250–600 µS/cm). B9, B10 and B11 had EC values above the range based on the Rosborg et al. [24] classification; therefore, it was impossible to use this classification for these samples.
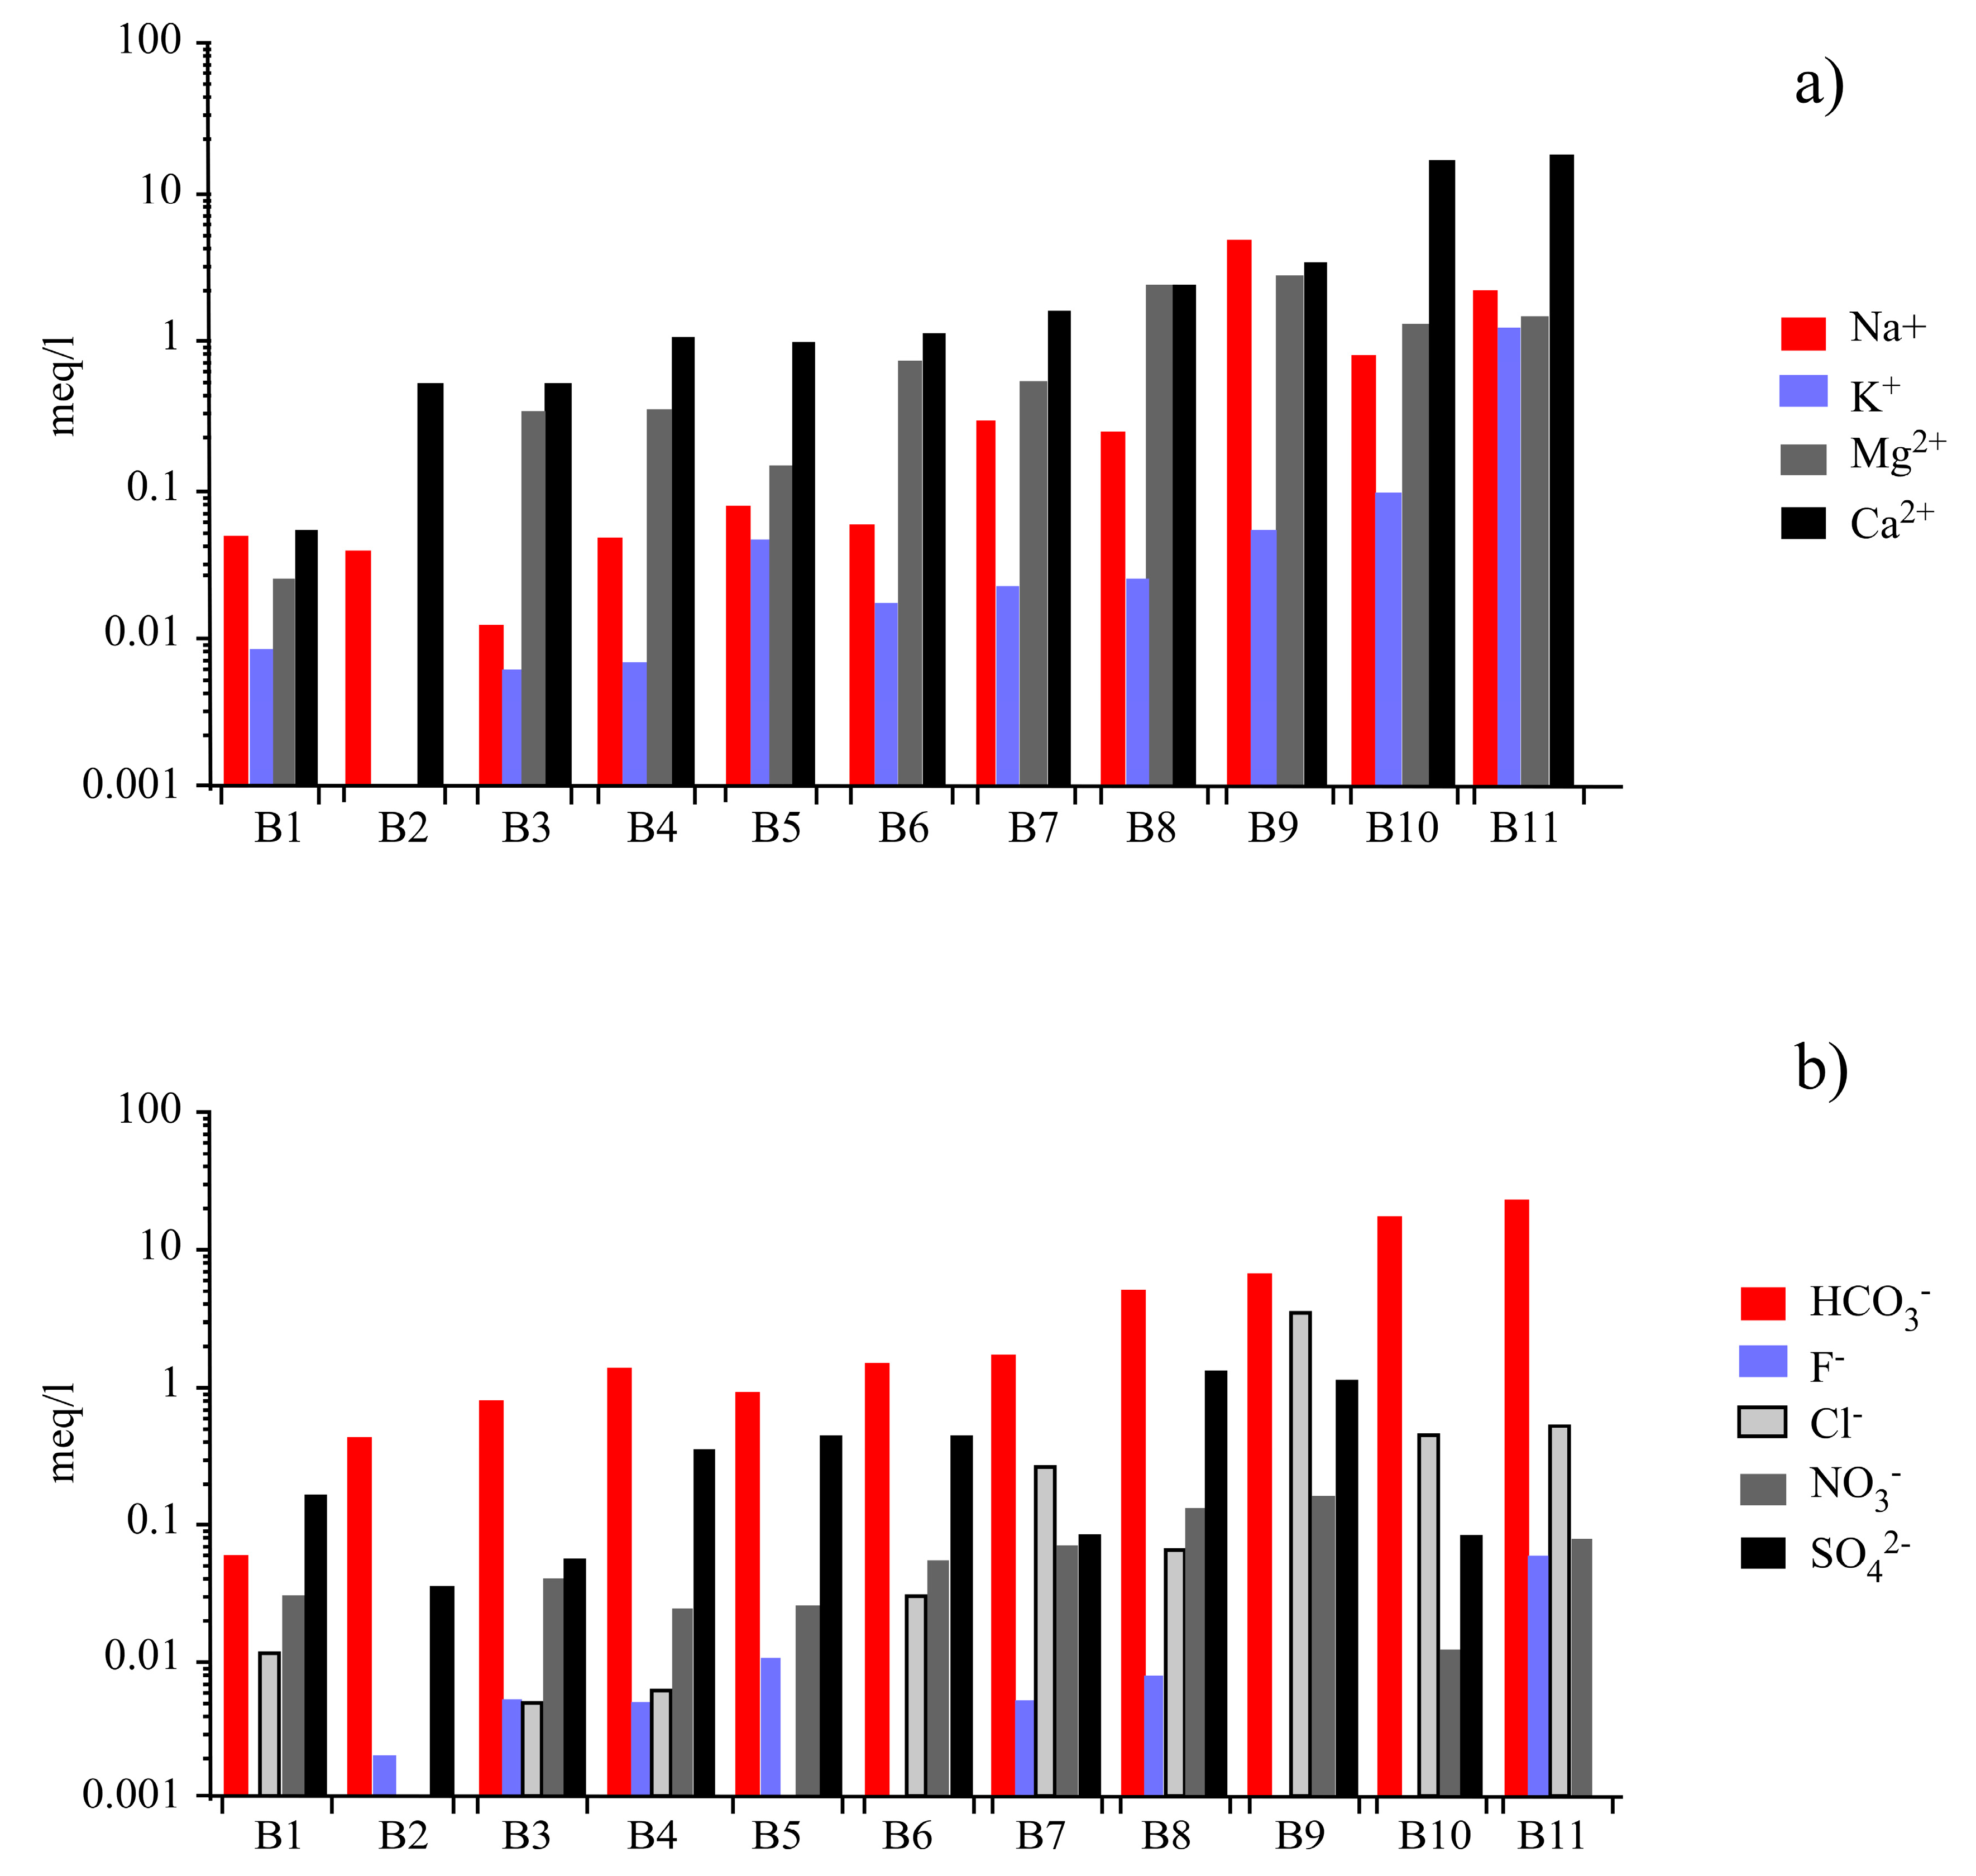
The chemical composition of bottled water is non-uniform and depends strongly on the origin (spring, groundwater, etc.). Figure 2 shows the concentrations, expressed in meq/L, of the main anions and cations analysed. A chemical parameter that quantifies the mineral content of the water is the sum of cations expressed as meq/L (ΣCation). Using ΣCation, the content of mineral elements in the bottled water followed this order: Group 3 > Group 2 > Group 1 (Table 1).
According to Azoulay et al. [6], a comparison between DRI and mineral intake from drinking water is made using a reference volume of 2 litres. The DRI of Ca2+ is 1200 mg/day; for Mg2+, 420 mg/day; 500 mg/day for Na+; and 4700 mg/day for K+. The percentage mineral intake with respect to the DRI can be calculated for each mineral using the average values in Table 1.
Two litres of Group 3 water provide 42% of Ca2+ DRI, 11% of Mg2+ DRI, 24% of Na+ DRI and 0.8% of K+ DRI. Two litres of Group 2 water provide 6% of Ca2+ DRI, 7% of Mg2+ DRI, 2% of Na+ DRI and 0.04% of K+ DRI. Two litres of Group 1 water provide 2% of Ca2+ DRI, 1% of Mg2+ DRI, 0.4% of Na+ DRI and 0.03% of K+ DRI.
In the analysed samples, the concentrations of the major cations are in the order of Ca+ > Mg2+ > Na+ > K+, compared with Ca2+ > Na+ > K+ > Mg2+ for B1 and B5 (Group 1). In Group 3, the B11 order is Ca2+ > Na+ = K+ > Mg2+ (Figure 2a; Table 1). Ca2+ levels varied from 1.0 to 21.0 mg/L in Group 1, 23.8–48.6 mg/L in Group 2 and 70–375 mg/L in Group 3.
The major anion concentrations followed the same general trend observed for cations. ΣAnion follows the order: Group 3 > Group 2 > Group 1 (Table 1).
For Groups 1 and 2, anions were in the order of HCO3− > SO42− > NO3− > Cl− >F−. In Group 3, the trend is HCO3− > SO42− > Cl− > NO3− > F− (Figure 2b; Table 1).
Group 1 is water with a generally low EC of the Ca-HCO3 type (similar to rainwater), derived from limited interaction with various lithological types, e.g., rocks of the western Alps. Group 2 is the Ca–Mg–HCO3 type, i.e., water with higher HCO3− and (Ca + Mg)2+ concentrations than Group 1. This group includes water originating from the Dolomitic Alps, the Venetian plain and northern Apennines. Group 3 includes Ca–Na–Mg–HCO3-type water, rich in K+, that originated from a volcanic province in south-central Italy rich in geothermal spring water [25].
The composition of the PDRF water did not vary over time or between samples. Therefore, the average values of the data analysis reported in Table 2 can be considered a good proxy of the chemical and physical composition of the PDRF water.
PDRF water had an average TDF of 332 mg/L, a value nine times higher than the average of Group 1, double that of Group 2, but three times lower than the average of Group 3. The EC of PDRF water is 429 µS/cm, and considering the mean EC values of bottled waters: Group 3 > PDRF > Group 2 > Group 3. Based on the TDS and EC values, PDRF water can be classified as water with a low mineral concentration.
The chemical composition of PDRF is 55 mg/L of Ca2+, 15 mg/L of Na+, 11 mg/L of Mg2+ and 2.6 mg/L of K+ for the cations; 178 mg/L of HCO3−, 34 mg/L of SO42−, 29 mg/L Cl−, 7.2 mg/L of NO3− and 0.1 mg/L of F− for the anions.
Two liters of PDRF water provide 9% of Ca2+ DRI, 5.3% of Mg2+ DRI, 6% of Na+ DRI and 1% of K+ DRI.
4. Discussion
The monitoring showed that people who chose to rehydrate with bottled water used only two types of brands (B4 and B5; Table 1). These two types of bottled water are preferred because they are available in half-litre quantities at an economical price.
Compared with the recommended daily intakes of Ca2+, Mg2+, K+ and Na+, the total mineral intake from B4 and B5 water is very low. For example, a runner may fulfill only 0.8% of their Mg2+ DRI, 0.36% of their Ca2+ DRI, 0.04% of their Na+ DRI and <0.01% of their K+ DRI by drinking 0.5 L of B4 water. On the contrary, drinking 0.5 L of PDRF water may help joggers fulfill 2.3% of their Mg2+ DRI, 0.9% of their Ca2+ DRI, 0.6% of their Na+ DRI and 0.01% of their K+ DRI.
With respect to the bottled water available on the market, there is a wide choice in the study area. Among those taken into consideration in this study, only Group 3 had a ΣCation value much higher than PDRF water. Mineral intake from B9, B10 and B11 water is very high and runners who drink 2 L of this water, which contains on average 253 mg/L of Ca2+ and 22 mg/L of Mg2+, may consume more than 10% of the DRIs of these minerals. In general, this water is not used as a supplement during sporting activities because it is very expensive and is not available in half-liter quantities.
Saylor et al. [14] report that common barriers to drinking tap water include perceived risks of tap water and the perceived safety of bottled water, and the convenience of drinking bottled water. Results of the study carried out on Ferrara’s PDRF help to highlight the weaknesses of these perceptions. Tap water (e.g., PDRF) is as healthy as bottled water and is a more effective source of mineral elements compared with low-mineral bottled water (TDS < 50 mg/L).
Another important outcome of this study is the recorded high number of people that did not drink during physical activity. Rehydrating during sport activities is essential to avoid excessive water loss and related health issues. During exercise, athletes should drink at regular intervals in an attempt to replace all of the water lost through sweating or consume only the maximum amount of water that can be tolerated [26].
5. Conclusions
This manuscript shows the results of a pilot study that is the basis for future and more extensive studies. The ultimate goal is to demonstrate the potential effectiveness of PDRF as an adequate mineral supplier compared to bottled water with a low mineral content.
Some commercially available bottled water is poor in mineral salts and if consumed during (or after) physical activity such as jogging, is not always the best option to reintegrate essential elements such as Ca2+, Mg2+, Na+ and K+.
This study, carried out in the city of Ferrara, showed that public drinking fountains are a valid substitute compared to bottled water commonly used. Chemical analysis results showed a moderate content of mineral elements in PDRF water. Moreover, the water of the fountains is easily obtained and economically advantageous. Therefore, in situations such as those considered in this study, during outdoor sport activity, PDRF water is preferable for the reintegration of mineral elements instead of bottled water that has a very low mineral content.
This study focused only on the evaluation of mineral elements in drinking water, but future studies on potentially toxic inorganic (e.g., Pb, Cr and Hg) and organic (e.g., antibiotics and pathogen microorganisms) elements in bottled and tap water should be carried out according to the Italian Decree 31/01 “Water intended for human consumption”.
Acknowledgments
The author would like to thank Micòl Mastrocicco (University of Campania), Massimo Coltorti (University of Ferrara) and Nicolò Colombani (University of Ferrara) for their support.
Conflicts of Interest
The author declares no conflict of interest.
References
- Maughan, R.J. Role of micronutrients in sport and physical activity. Br. Med. Bull. 1999, 55, 683–690. [Google Scholar] [CrossRef] [PubMed]
- Speich, M.; Pineau, A.; Ballereau, F. Minerals, trace elements and related biological variables in athletes and during physical activity. Clin. Chim. Acta 2001, 312, 1–11. [Google Scholar] [CrossRef]
- Soetan, K.O.; Olaiya, C.O.; Oyewole, O.E. The importance of mineral elements for humans, domestic animals and plants: A review. Afr. J. Food Sci. 2010, 4, 200–222. [Google Scholar]
- Lukaski, H.C. Magnesium, zinc, chromium nutrition and athletic performance. Can. J. Appl. Physiol. 2001, 26, S13–S22. [Google Scholar] [CrossRef] [PubMed]
- Kara, E.; Mustafa, A.; Yalçinkaya, O. The effect of aerobic exercise programme on trace element levels of young men. Afr. J. Microbiol. Res. 2012, 6, 165–168. [Google Scholar]
- Azoulay, A.; Garzon, P.; Eisenberg, M.J. Comparison of the mineral content of tap water and bottled waters. J. Gen. Intern. Med. 2001, 16, 168–175. [Google Scholar] [CrossRef] [PubMed]
- American Academy of Pediatrics. Clinical Report–Sports Drinks and Energy Drinks for Children and Adolescents: Are They Appropriate? Pediatrics 2011, 127, 1182–1189. [Google Scholar]
- Milosevic, A. Sports drinks hazard to teeth. Br. J. Sports Med. 1997, 31, 28–30. [Google Scholar] [CrossRef] [PubMed]
- Gibson, R.S.; Vanderkooy, P.S.; McLennan, C.E.; Mercer, N.M. Contribution of tap water to mineral intakes of Canadian preschool children. Arch. Environ. Health 1987, 42, 165–169. [Google Scholar] [CrossRef] [PubMed]
- Doria, M.F.; Pidgeon, N.; Hunter, P.R. Perceptions of drinking water quality and risk and its effect on behaviour: A cross-national study. Sci. Total Environ. 2009, 407, 5455–5464. [Google Scholar] [CrossRef] [PubMed]
- Botto, S.; Niccolucci, V.; Rugani, B.; Nicolardi, V.; Bastianoni, S.; Gaggi, C. Towards lower Carbon Footprint patterns of consumption: The case of drinking water in Italy. Environ. Sci. Policy 2011, 14, 388–395. [Google Scholar] [CrossRef]
- Cidu, R.; Frau, F.; Tore, P. Drinking water quality: Comparing inorganic components in bottled water and Italian tap water. J. Food Compos. Anal. 2011, 24, 184–193. [Google Scholar] [CrossRef]
- Carstea, M.E.; Levei, E.A.; Hoaghia, M.A.; Savastru, R. Quality assessment of Romanian bottled mineral water and tap water. Environ. Monit. Assess. 2016, 188, 521. [Google Scholar] [CrossRef] [PubMed]
- Saylor, A.; Prokopy, L.S.; Amberg, S. What’s wrong with the tap? Examining perceptions of tap water and bottled water at Purdue University. Environ. Manag. 2011, 48, 588–601. [Google Scholar] [CrossRef] [PubMed]
- Huerta-Saenz, L.; Irigoyen, M.; Benavides, J.; Mendoza, M. Tap or bottled water: Drinking preferences among urban minority children and adolescents. J. Community Health 2012, 37, 54–58. [Google Scholar] [CrossRef] [PubMed]
- De Giglio, O.; Quaranta, A.; Lovero, G.; Caggiano, G.; Montagna, M.T. Mineral water or tap water? An endless debate. Ann. Ig. 2015, 27, 58–65. [Google Scholar] [PubMed]
- Lagioia, G.; Calabrò, G.; Amicarellia, V. Empirical study of the environmental management of Italy’s drinking water supply. Resour. Conserv. Recycl. 2012, 60, 119–130. [Google Scholar] [CrossRef]
- Torretta, V. Environmental and economic aspects of water kiosks: Case study of a medium-sized Italian town. Waste Manag. 2013, 33, 1057–1063. [Google Scholar] [CrossRef] [PubMed] [Green Version]
- Dias, P.; Bernardes, A.M. Carbon emissions and embodied energy as tools for evaluating environmental aspects of tap water and bottled water in Brazil. Desalination Water Treat. 2016, 57, 13020–13029. [Google Scholar] [CrossRef]
- Carson, H.S. The incidence of plastic ingestion by fishes: From the prey’s perspective. Mar. Pollut. Bull. 2013, 74, 170–174. [Google Scholar] [CrossRef] [PubMed]
- National Academy of Sciences. Dietary Reference Intakes for Water, Potassium, Sodium, Chloride, and Sulfate; The National Academies Press: Washington, DC, USA, 2005; p. 638. [Google Scholar]
- Van der Aa, M. Classification of mineral water types and comparison with drinking water standards. Environ. Geol. 2003, 44, 554–563. [Google Scholar] [CrossRef] [Green Version]
- Cuoco, E.; Colombani, N.; Darrah, T.H.; Mastrocicco, M.; Tedesco, D. Geolithological and anthropogenic controls on the hydrochemistry of the Volturno River (Southern Italy). Hydrol. Process. 2017, 31, 627–638. [Google Scholar] [CrossRef]
- Rosborg, I.; Nihlgård, B.; Ferrante, M. Mineral Composition of Drinking Water and Daily Uptake. In Drinking Water Minerals and Minerals Balance Importance, Health Significance, Safety Precautions; Rosborg, I., Ed.; Springer International Publishing: Cham, Switzerland, 2015; pp. 25–30. [Google Scholar]
- Dinelli, E.; Lima, A.; De Vivo, B.; Albanese, S.; Cicchella, D.; Valera, P. Hydrogeochemical analysis on Italian bottled mineral waters: Effects of geology. J. Geochem. Explor. 2010, 107, 317–335. [Google Scholar] [CrossRef]
- Convertino, V.A.; Armstrong, L.E.; Coyle, E.F.; Mackm, G.W.; Sawka, M.N.; Senay, L.C.; Sherman, W.M. American College of Sports Medicine position stand. Exercise and fluid replacement. Med. Sci. Sports Exerc. 1996, 28, i–vii. [Google Scholar] [CrossRef] [PubMed]
Figure 1.
(a) Location map of Ferrara City (white circle); (b) Aerial view (extracted from Google Earth®) of the city of Ferrara and its walls; (c) City walls; (d) One of the two studied public drinking fountains.
Figure 1.
(a) Location map of Ferrara City (white circle); (b) Aerial view (extracted from Google Earth®) of the city of Ferrara and its walls; (c) City walls; (d) One of the two studied public drinking fountains.

Figure 2.
Bar chart showing the concentrations, expressed as meq/L, of the main cations (a) and anions (b) detected in the bottled water.
Figure 2.
Bar chart showing the concentrations, expressed as meq/L, of the main cations (a) and anions (b) detected in the bottled water.

Table 1.
Physical parameters and chemical compositions of selected bottled water; bdl, below the detection limit.
Table 1.
Physical parameters and chemical compositions of selected bottled water; bdl, below the detection limit.
| Samples | TDS | EC | pH | HCO3− | F− | Cl− | NO3− | SO42− | ΣAnion | Na+ | K+ | Mg2+ | Ca2+ | ΣCation | Charge Imbalance |
|---|---|---|---|---|---|---|---|---|---|---|---|---|---|---|---|
| mg/L | µS/cm | - | mg/L | mg/L | mg/L | mg/L | mg/L | meq/L | mg/L | mg/L | mg/L | mg/L | meq/L | % | |
| Group 1 | |||||||||||||||
| B1 | 14.0 | 17.6 | 5.82 | 3.60 | bdl | 0.4 | 1.90 | 1.40 | 0.13 | 1.10 | 0.33 | 0.31 | 1.05 | 0.13 | 1.33 |
| B2 | 39.2 | 65.8 | 7.40 | 26.2 | 0.04 | bdl | bdl | 7.8 | 0.59 | 0.90 | bdl | bdl | 10.5 | 0.56 | −2.66 |
| B3 | 47.0 | 71.0 | 6.90 | 48.8 | 0.10 | 0.2 | 2.50 | 1.7 | 0.89 | 0.28 | 0.25 | 4.00 | 10.2 | 0.86 | −1.68 |
| B4 | 69.0 | 119 | 8.34 | 84.0 | 0.10 | 0.22 | 1.50 | 2.80 | 1.47 | 1.10 | 0.27 | 4.20 | 21.5 | 1.47 | 0.08 |
| B5 | 80.5 | 124 | 7.70 | 57.1 | 0.20 | bdl | 1.60 | 16.9 | 1.32 | 1.90 | 1.85 | 1.73 | 21.0 | 1.32 | −0.15 |
| Group 2 | |||||||||||||||
| B6 | 114 | 178 | 8.18 | 94.6 | bdl | 1.1 | 3.40 | 22.0 | 2.09 | 1.30 | 0.70 | 8.70 | 23.8 | 1.98 | −2.87 |
| B7 | 142 | 223 | 7.90 | 106 | 0.10 | 9.0 | 4.30 | 21.1 | 2.50 | 6.40 | 0.92 | 6.52 | 32.9 | 2.48 | −0.51 |
| B8 | 272 | 415 | 7.42 | 301 | 0.15 | 2.4 | 8.50 | 4.1 | 5.23 | 5.80 | 1.02 | 29.4 | 48.6 | 5.12 | −1.06 |
| Group 3 | |||||||||||||||
| B9 | 695 | 1065 | 7.57 | 395 | bdl | 120 | 10.0 | 64.2 | 11.4 | 112 | 2.10 | 33.1 | 70.1 | 11.1 | −0.96 |
| B10 | 988 | 1513 | 6.41 | 1021 | bdl | 16.3 | 0.76 | 55.2 | 18.4 | 19.6 | 3.79 | 15.2 | 325 | 18.4 | 0.19 |
| B11 | 1283 | 1800 | 6.20 | 1430 | 1.13 | 19.0 | 5.00 | 4.0 | 24.2 | 49.0 | 49.0 | 18.0 | 365 | 23.1 | −2.36 |
Table 2.
Physical parameters and chemical compositions of PDRF water.
| Samples | TDS | EC | pH | HCO3− | F− | Cl− | NO3− | SO42− | ΣAnion | Na+ | K+ | Mg2+ | Ca2+ | ΣCation | Charge Imbalance |
|---|---|---|---|---|---|---|---|---|---|---|---|---|---|---|---|
| mg/L | µS/cm | - | mg/L | mg/L | mg/L | mg/L | mg/L | meq/L | mg/L | mg/L | mg/L | mg/L | meq/L | % | |
| F1 | 337 | 436 | 7.89 | 179 | 0.09 | 29.4 | 8.35 | 33.9 | 4.61 | 16.1 | 2.82 | 11.5 | 58.0 | 4.61 | 0.07 |
| F2 | 312 | 407 | 7.75 | 164 | 0.14 | 28.1 | 7.44 | 31.3 | 4.26 | 14.0 | 2.47 | 10.3 | 53.2 | 4.17 | −1.05 |
| F3 | 315 | 414 | 7.91 | 163 | 0.14 | 28.6 | 7.75 | 31.5 | 4.26 | 14.4 | 2.49 | 10.3 | 52.7 | 4.16 | −1.22 |
| F4 | 340 | 441 | 7.97 | 183 | 0.09 | 29.6 | 7.42 | 34.0 | 4.67 | 14.6 | 2.49 | 10.5 | 58.0 | 4.46 | −2.30 |
| F5 | 303 | 353 | 7.95 | 183 | 0.12 | 22.9 | 7.45 | 33.5 | 4.47 | 14.3 | 2.45 | 12.0 | 59.1 | 4.62 | 1.67 |
| F6 | 321 | 423 | 7.87 | 166 | 0.10 | 29.6 | 7.25 | 32.3 | 4.35 | 14.9 | 2.49 | 10.3 | 52.8 | 4.19 | −1.82 |
| F7 | 317 | 421 | 7.67 | 162 | 0.20 | 29.3 | 7.06 | 31.7 | 4.27 | 14.8 | 2.53 | 10.2 | 51.3 | 4.11 | −1.90 |
| F8 | 337 | 450 | 7.71 | 171 | 0.09 | 30.9 | 7.53 | 34.7 | 4.52 | 15.8 | 2.70 | 11.0 | 54.6 | 4.38 | −1.55 |
| F9 | 326 | 431 | 7.88 | 168 | 0.10 | 29.2 | 7.54 | 34.0 | 4.41 | 15.1 | 2.61 | 10.6 | 53.4 | 4.26 | −1.80 |
| F10 | 325 | 436 | 7.8 | 164 | 0.10 | 29.7 | 7.21 | 32.7 | 4.33 | 15.0 | 2.50 | 10.5 | 51.8 | 4.16 | −1.94 |
| F11 | 339 | 441 | 7.71 | 185 | 0.11 | 29.1 | 6.82 | 31.7 | 4.63 | 15.2 | 2.47 | 12.1 | 56.1 | 4.50 | −1.41 |
| F12 | 353 | 442 | 7.82 | 196 | 0.11 | 32.1 | 7.40 | 36.1 | 4.99 | 17.2 | 2.53 | 13.1 | 60.2 | 4.87 | −1.24 |
| F13 | 356 | 434 | 7.25 | 203 | 0.12 | 30.1 | 6.90 | 44.1 | 5.21 | 14.3 | 2.50 | 13.2 | 63.1 | 4.89 | −3.18 |
| F14 | 388 | 517 | 7.90 | 201 | 0.11 | 33.1 | 7.15 | 42.1 | 5.22 | 17.2 | 2.54 | 13.1 | 61.3 | 4.92 | −2.99 |
| F15 | 340 | 442 | 7.73 | 185 | 0.11 | 28.1 | 7.48 | 34.1 | 4.66 | 16.2 | 2.45 | 13.2 | 52.1 | 4.42 | −2.57 |
| F16 | 320 | 413 | 7.85 | 175 | 0.14 | 27.1 | 7.42 | 30.1 | 4.38 | 13.2 | 2.59 | 10.2 | 57.1 | 4.30 | −0.96 |
| F17 | 344 | 439 | 7.75 | 188 | 0.18 | 30.2 | 5.55 | 39.1 | 4.84 | 13.3 | 2.55 | 12.1 | 58.3 | 4.51 | −3.51 |
| F18 | 315 | 412 | 7.74 | 172 | 0.10 | 27.1 | 6.7 | 30.1 | 4.32 | 12.2 | 2.52 | 11.2 | 51.2 | 4.04 | −3.39 |
| F19 | 334 | 419 | 7.90 | 185 | 0.14 | 29.7 | 6.47 | 39.1 | 4.79 | 15.2 | 3.47 | 11.1 | 55.2 | 4.39 | −4.38 |
| F20 | 315 | 412 | 7.72 | 172 | 0.10 | 27.1 | 6.45 | 30.1 | 4.31 | 12.2 | 2.41 | 11.4 | 51.2 | 4.03 | −3.37 |
| Average | 332 | 429 | 7.79 | 178 | 0.12 | 29.1 | 7.17 | 34.3 | 4.57 | 14.8 | 2.58 | 11.4 | 55.5 | 4.40 | −1.94 |
| Maximun | 388 | 517 | 7.97 | 203 | 0.20 | 33.1 | 8.35 | 44.1 | 5.22 | 17.2 | 3.47 | 13.2 | 63.1 | 4.92 | 1.67 |
| Minimun | 303 | 353 | 7.25 | 162 | 0.09 | 22.9 | 5.55 | 30.1 | 4.26 | 12.2 | 2.41 | 10.2 | 51.2 | 4.03 | −4.38 |
| Standard deviation | 18.9 | 28.8 | 0.15 | 12.3 | 0.03 | 2.06 | 0.57 | 3.90 | 0.29 | 1.36 | 0.22 | 1.07 | 3.57 | 0.27 | 1.34 |
© 2017 by the author. Licensee MDPI, Basel, Switzerland. This article is an open access article distributed under the terms and conditions of the Creative Commons Attribution (CC BY) license (http://creativecommons.org/licenses/by/4.0/).
Share and Cite
MDPI and ACS Style
Di Giuseppe, D. Comparison of the Mineral Element Content of Public Drinking Fountains and Bottled Water: A Case Study of Ferrara City. Geosciences 2017, 7, 76. https://doi.org/10.3390/geosciences7030076
AMA Style
Di Giuseppe D. Comparison of the Mineral Element Content of Public Drinking Fountains and Bottled Water: A Case Study of Ferrara City. Geosciences. 2017; 7(3):76. https://doi.org/10.3390/geosciences7030076
Chicago/Turabian StyleDi Giuseppe, Dario. 2017. "Comparison of the Mineral Element Content of Public Drinking Fountains and Bottled Water: A Case Study of Ferrara City" Geosciences 7, no. 3: 76. https://doi.org/10.3390/geosciences7030076
Note that from the first issue of 2016, this journal uses article numbers instead of page numbers. See further details here.