Article

Analysis and Processing of Nadir and Stereo VHR Pleiadés Images for 3D Mapping and Planning the Land of Nineveh, Iraqi Kurdistan

by
Eva Savina Malinverni
1,*,
Roberto Pierdicca
1,
Carlo Alberto Bozzi
1,
Francesca Colosi
2 and
Roberto Orazi
2
1
Department of Construction, Civil Engineering and Architecture (DICEA), Universitá Politecnica delle Marche, 60131 Ancona, Italy
2
Institute for technologies applied to cultural heritage (ITABC), Consiglio Nazionale delle Ricerche, 00185 Roma, Italy
*
Author to whom correspondence should be addressed.
Geosciences 2017, 7(3), 80; https://doi.org/10.3390/geosciences7030080
Submission received: 4 August 2017 / Revised: 26 August 2017 / Accepted: 29 August 2017 / Published: 6 September 2017
(This article belongs to the Special Issue Remote Sensing and Geosciences for Archaeology)

Abstract

:
The impressive hydraulic system built by the Assyrian King Sennacherib is composed by different archaeological areas, displaced along the Land of Nineveh, in Iraqi Kurdistan. The extensive project we are working on has the aim of mapping and geo-referencing any kind of documentation in order to design an archaeological-environmental park able to preserve and enhance the archaeological complex. Unfortunately, the area is failing a topographic documentation and the available cartography is not sufficient for planning and documentation purposes. The research work presented in these pages moves towards this direction, by exploiting Pleiadés Very High Resolution (VHR) images (in both nadir and stereo configuration) for an accurate mapping of the site. In more depth, Pleiadés nadir VHR images have been used to perform a pansharpening procedure used to enhance the visual interpretation of the study area, whilst stereo-pair have been processed to produce the Digital Elevation Model (DEM) of the study area. Statistical evaluations show the high accuracy of the processing and the reliability of the outputs as well. The integration of different products, at different Levels of Detail within a unique GIS environment, besides protecting, preserving and enhancing the water system of Sennacherib’s, paves the way to allow the Kurdistan Regional Government to present a proposal for the admission of the archaeological complex in the UNESCO World Heritage Tentative List (WHTL).

1. Introduction

With the advent of fast and agile pipelines of data collection, it has become easier and easier to gather detailed information of archaeological areas. However, some zones can be impervious to be reached due to the morphology, the wideness or, sometimes, because the war impedes systematic campaigns on site. It is well known, in fact, that a common problem for archaeologists studying the evolutions of ancient settlement is overcoming the hazardous conditions of those risky areas. Often, investigations are realized by extensive ground surveys in which insiders perform on site surveys and excavations [1] but, if not possible, an excellent opportunity is nowadays offered by high resolution satellite images, which allow one to infer useful information of an area, also whereas unreachable; in its broadest meaning in fact, archaeology might strongly benefit from the use of remote sensing (RS) techniques, since embrace methods to uncover (and map) evidence of the past [2]. RS capabilities can be exploited as complementary data (and sometimes as alternative ones) to the ground surveys, that are more accurate but are not able to provide a large scale overview of ancient settlements, especially where they are too wide and hence need a wider sight to perform investigations [3].
The applications are many and strictly dependent on the purpose of the study. Nadiral Very High Resolution (VHR) satellite images are suitable for detecting changes over time, inferring historical information about the impact of human activities over ancient sites, or monitoring the state of conservation of a site [4]. In addition, satellite platforms are nowadays providing a growing amount of data: multispectral and multi-temporal data demonstrated an adequate accuracy even for medium-scale maps (1:10,000, 1:5,000), since they hold data related to physical and environmental parameters for the detection of potential buried structures [5]. In addition, hyper-spectral sensors are the most appropriate tools for producing thematic maps (use of the soil, extraction of road system, classification of vegetation, etc.), thanks to the image classification techniques [6,7]. Moreover, some sensors can capture images in stereo mode, enabling for the creation of accurate Digital Elevation Models (DEMs), representing a great improvement to deepen the knowledge of a certain area. The unavailability of cartography, updated or in adequate scale, is a recurring problem for the archaeological research operating in urban and territorial contexts. In those areas where cartographies are inaccessible or not updated, the use of DEM and ortho-photos represents an optimal solution for the creation of topographical maps and space maps to be used as plans during archaeological field works. In this context, the automatic extraction of 3D metrical information from satellite images taken from different angles represents a turnkey. The aid of the third dimension is fundamental for understanding the morphology of a place in order to document the area and to perform planning activities.
The research work presented in this paper moves towards this direction, by exploiting Pleiadés Very High Resolution (VHR) images (in both nadir and stereo configuration) for an accurate mapping of a wide archaeological area; the activities are conducted within the framework of an International project (http://www.terradininive.com, The project is directed by Prof. Daniele Morandi Bonacossi of Udine University. The project for Sennacherib’s Archaeological Park is directed by Arch. Roberto Orazi) “Land of Nineveh—Training for the enhancement of the cultural heritage of Northern Kurdistan”. An overview of the territorial framework can be found in Figure 1.
In the context of this extensive project, the task is to map and geo-reference any kind of documentation in order to design an archaeological-environmental park able to preserve and enhance the vast archaeological complex. World View2 and Pleiadés VHR images have been used; for what is regarding Khinis, the area subject of this case study, the Pleiadés images allowed us to produce both a medium scale cartography, vector maps and DEM. It is important to underline that, up to now, the archaeological area is failing a topographic documentation of the region and the activity described in the paper copes with the lack of available data; in fact, the cartography was not sufficient for planning purposes, consisting of very small scale national maps (with a scale of 1:100,000), Corona and Orbview3 imagery with a very coarse radiometric and geometric resolution and DEM arising from Shuttle Radar Topography mission SRTM (approximately 30 m). The use of VHR images give a product suitable to: (i) have a first geographical view of the area; (ii) design a preliminary planning of the site; (iii) define the first limits of the core and the buffer zone and the archaeological and geological prescriptions; (iv) geo-reference those areas investigated through the archaeological survey campaigns. These elaborations gave us a precise geometric representation of the territory, and were therefore indispensable starting points for the design process. All the products of our computations are suitable for being integrated in a Geographical Information System (GIS), where most of the available data of the area can be localized and organized: technical, thematic, historical maps, archaeological survey (by close range photogrammetry or by terrestrial laser scanning) about monuments’ details and niches and so on. The contribution of this paper is twofold: on one hand, we share with the research community (dealing with RS in archaeology) a mapping dataset of an unknown area, that have been studied testing several methods of image processing. In more detail, Pleiadés nadir VHR images have been used to perform a pansharpening procedure used to enhance the visual interpretation of the study area (thanks to a 50 cm resolution image for a medium scale map of the whole area), whilst stereo-pair have been processed to produce the DEM of the study area. In this last case, the panchromatic stereo-pair produces a more reliable output w.r.t. the pansharpened ones. On the other, we provide the overall design of a large archaeological and environmental park. The integration of different products at different Levels of Detail (LOD) within a unique GIS environment, besides protecting, preserving and enhancing Sennacherib’s water system of Sennacherib’s, paves the way to allow the Kurdistan Regional Government (KRG) to present a proposal for the admission of the archaeological complex in the UNESCO World Heritage Tentative List (WHTL).
The reminder of the paper is organized as follows: after the general overview already discussed, the introduction includes a brief review over the related works in the literature, besides describing in detail the study area and the reasons why our approach have been fundamental for the project. Section 2 is devoted to describe in detail the Pleiadés images processing; this section has been divided into two sub-sections to facilitate the reader to understand the different steps of the work-flow: high resolution images processing and stereo-pair computation. The output results of the process are presented in Section 3, demonstrating how the different product can be easily managed inside the GIS environment. Discussion and concluding remarks about the findings of our research are reported in Section 4.

1.1. State of the Art

Satellite remote sensing in archaeology has become a common tool of investigation, documentation and planning. The new possibility offered by remotely sensed data processing allows for understanding environmental changes and, through the development of GIS-based models and decision-support instruments, to have an enhanced decision-making process. Moreover, by using satellite RS techniques the monitoring process of archaeological sites can be efficiently supported in a reliable, repetitive, non-invasive, rapid and cost-effective way [8]. By exploiting multitemporal high-resolution satellite images, for instance, it is possible to study areas that were without documentation just few years before. Like in the work of Di Giacomo and Scaradozzi [9] where the ancient city of Ur, in southern Mesopotamia, was studied with the aid of different new satellites (QuickBird-2, Ikonos-2, WorldView-1) in comparison with older declassified spy space photos. It is also a common practice to extract 3D information from satellite dataset; the approach consists on exploiting stereo-pairs (or triplets) with an acquisition scheme insuring that every point on the ground is seen from, at least, two different points of view [10]. The approach has been used in several domains; the best choice of viewing angles for stereoscopic measurement is always a matter of compromise: a wide stereo angle provides a good geometric accuracy, but the matching of two images points may be difficult, or even impossible if the two points of view are very different. In dense urban areas, for instance, the simultaneous visibility at the street level is highly dependent on the directions and the incidence angles of the pair of images. In [11], for instance, World-View2 were used for extracting LOD for CityGML (which stands for Geography Markup Language) application of urban areas, proposing an automatic processing chain for urban modelling based on stereo images. To increase the matching between the overlapped images, sometimes the use of tri-stereo for the DEM generation is required [12]. With respect to the automation of processing large dataset, the work of Shean et al. is worth being mentioned [13]. For an open landscape instead, with moderate slopes, the use of pairs is generally sufficient [14] (depending on the purpose of the project), allowing also for detecting changes of environmental dynamics, like in the case of glacier studies [15], or volcanological applications [16]. In fact, other approaches of changes detection from stereo images are also discussed in [17], demonstrating that the production of DEMs for the change detection purposes is fundamental. In these studies, the use of 3D data at different temporal resolution allows the evaluation of changes among time.
In line with recent research trends, our work can cover different scales of representation, starting from the processing of satellite images to create the cartographic base that can be further integrated with detailed ground surveys (e.g., through Unmanned Aerial Vehicles (UAV) mapping). A similar approach in the literature can be found in [18], where the authors compute Pleiadés to map the Valley of Turu Alty (Siberia, Russia). Several articles deal with the realization of DEM highlighting the benefits of using Pleiadés sensors as the data source. As a demonstration of that, accuracy evaluations are stated in different works, using as a benchmark SRTM images at 30 m [19], as well as more accurate LiDAR data [20]. The purpose of Pleiadés is to deliver optical images of sub-metric resolution with daily access to any point on the globe (with its two satellites): a panchromatic channel with a 70 cm vertical viewing resolution and a multispectral one composed of four spectral bands (blue, green, red and near-infrared) with a 2.8 m resolution (re-sampled at 0.5 m and 2 m, respectively), image swath of about 20 km in vertical viewing, acquisition capacity, in a single pass, of a 100 × 100 km mosaic of images, virtually instantaneous acquisition capacity for stereoscopic pairs (and even triplets) of 20 km up to 300 km cloud-free image coverage of 2,500,000 km2 per year. Interested readers can find more accurate features and capability of these sensors in [21], and in particular their 3D capabilities for the creation of DEM in [22]. By the way, the procedures already discussed present some bottlenecks. First of all, the stereo images need refinement and re-sampling works to make them suitable for 3D mapping purposes. The work of Cantou et al. represents an excellent example for the archaeological domain, since the image treatment depends on the material of the sites and the procedures cannot be extended to other domains [23]. Moreover, in some cases and depending on the purpose of the mapping, the resolution for the representation scale revealed insufficient [24], requiring different approaches or the integration with ground survey data. In this regard, resorting to UAV surveying can overcome the drawbacks of RS solutions (i.e., cloud coverage, resolution and so on). Recent research showed that nowadays drones are the most widespread tool for archaeological mapping campaigns and to achieve detailed and accurate documentations, but only of a small portion of a site. Just to mention some, the works in [25,26,27] are good examples to be reported.
The work presented in these pages ends up with the creation of an accurate cartography at a territorial scale (up to 1:5000), and it opens up to the possibility of integrating different data sources in a unique GIS, which demonstrated to represent a great advantage especially in the archaeological domain [28,29,30,31].

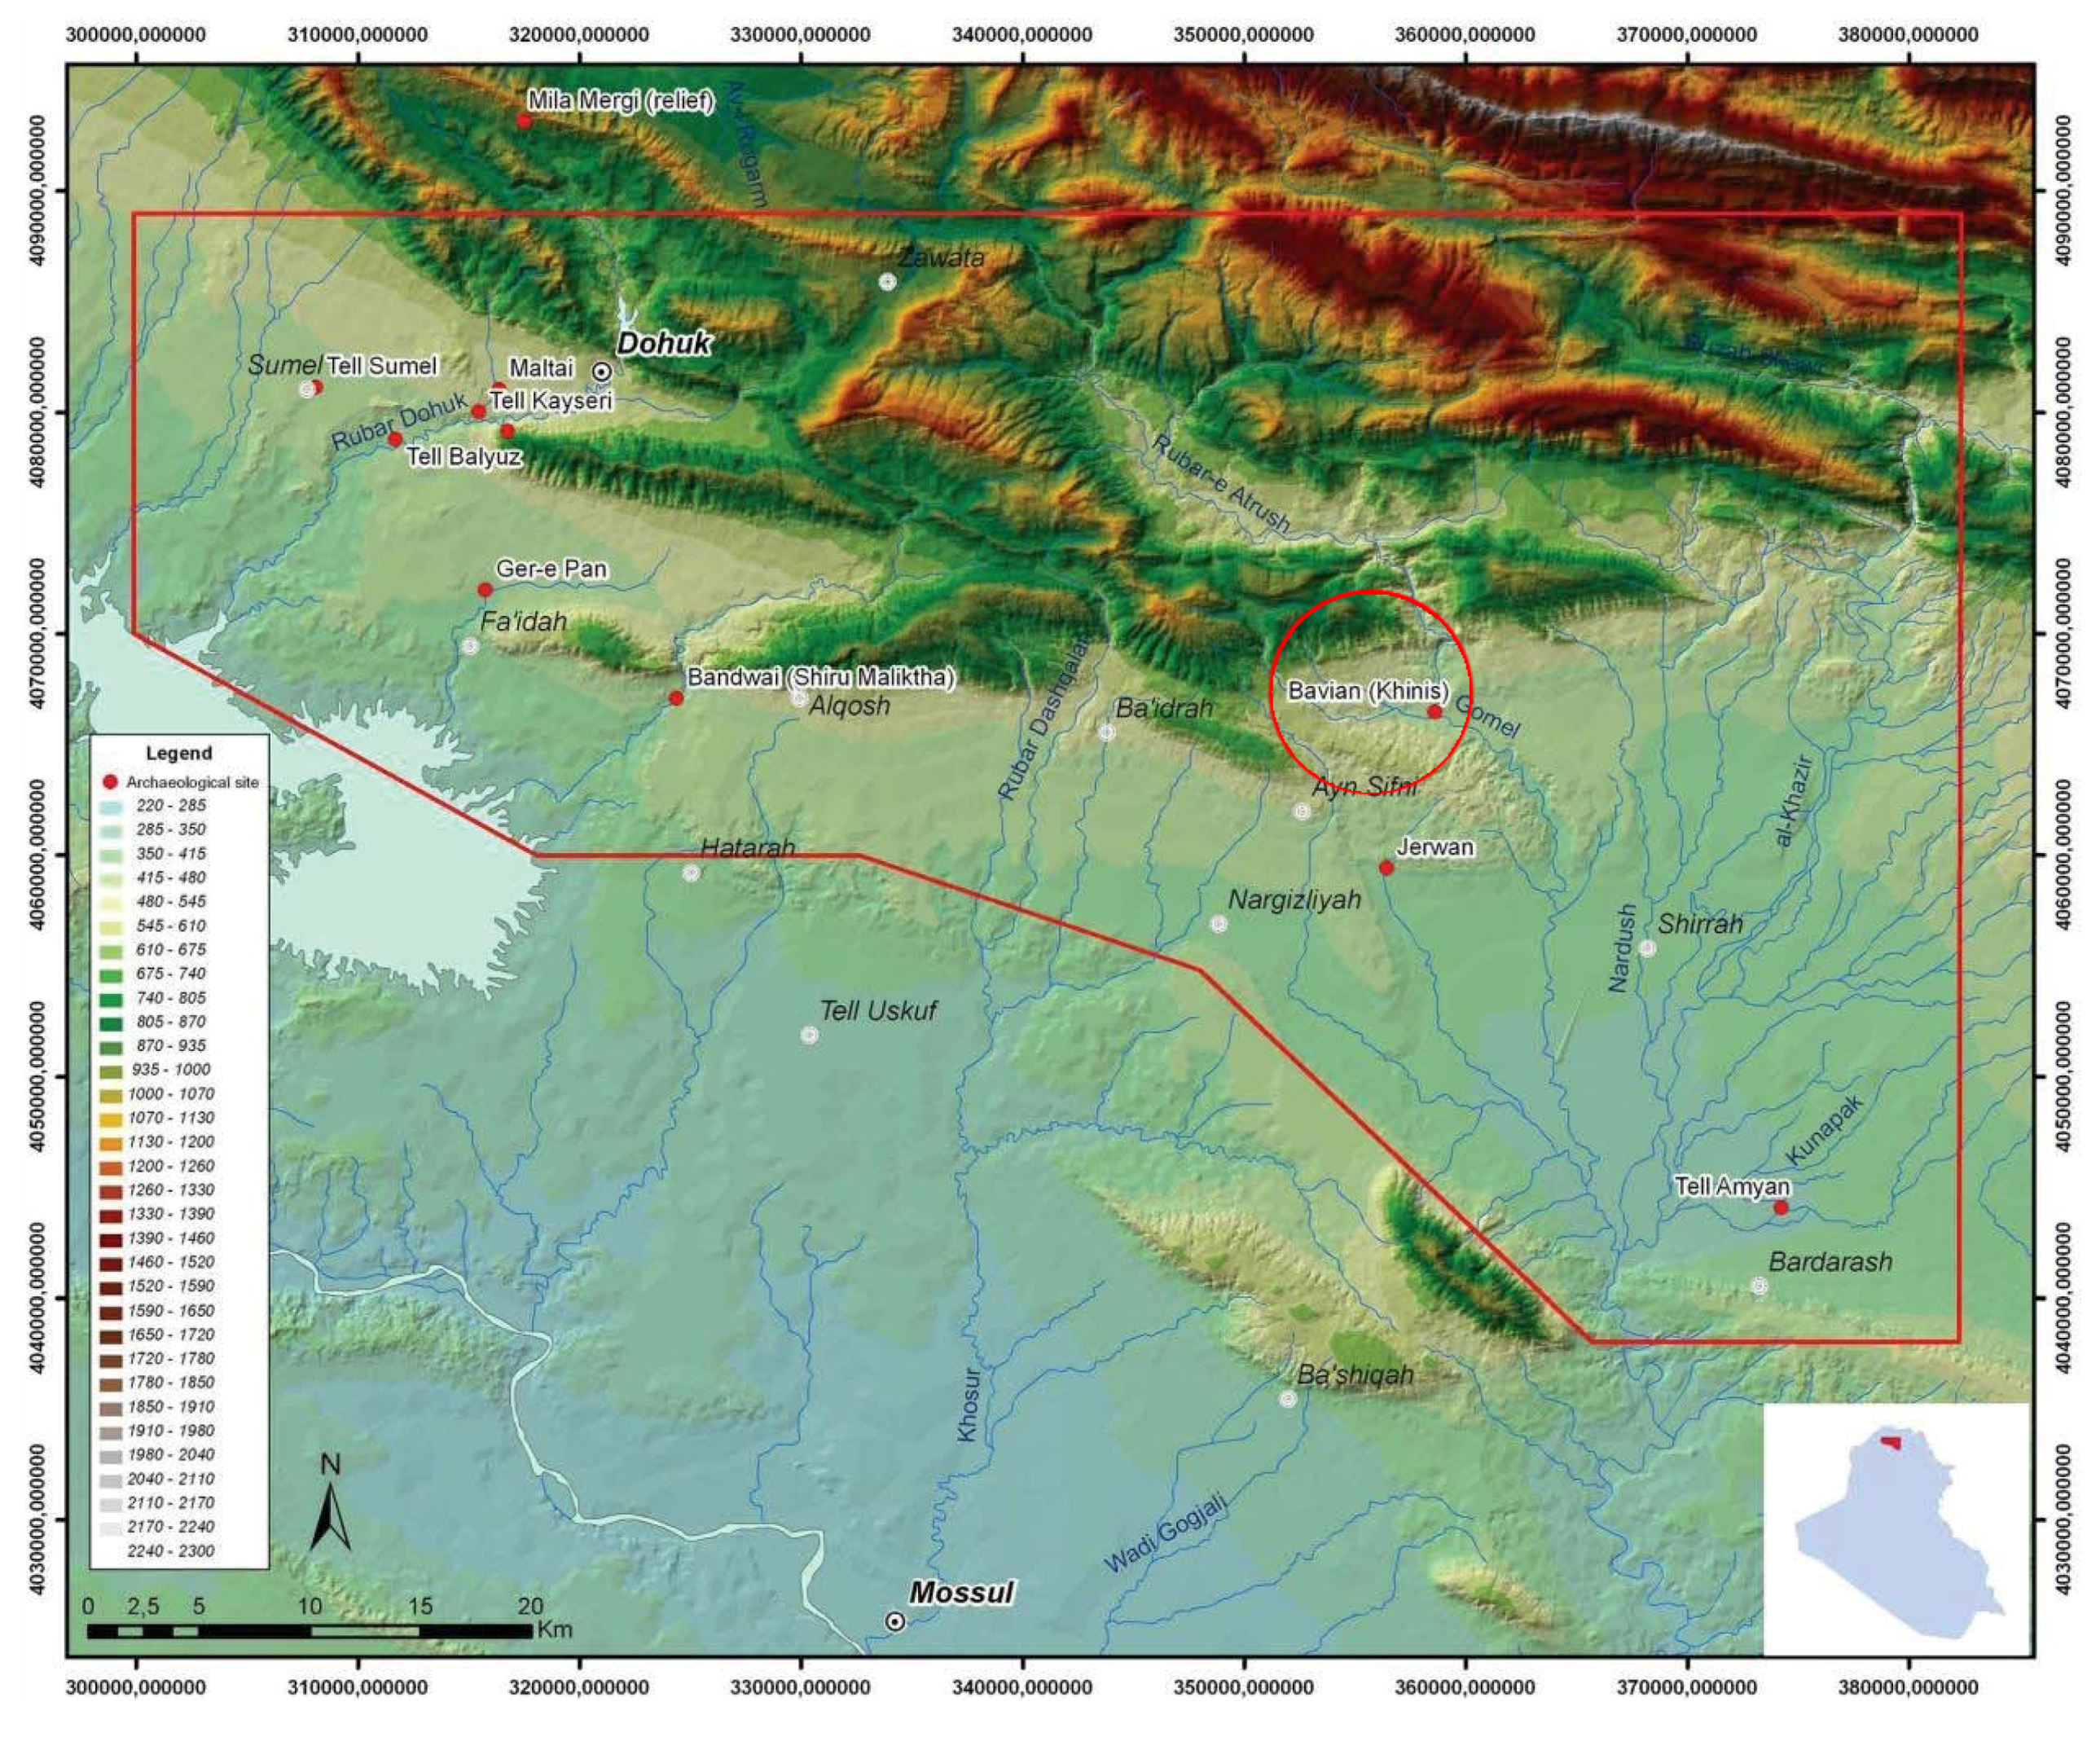
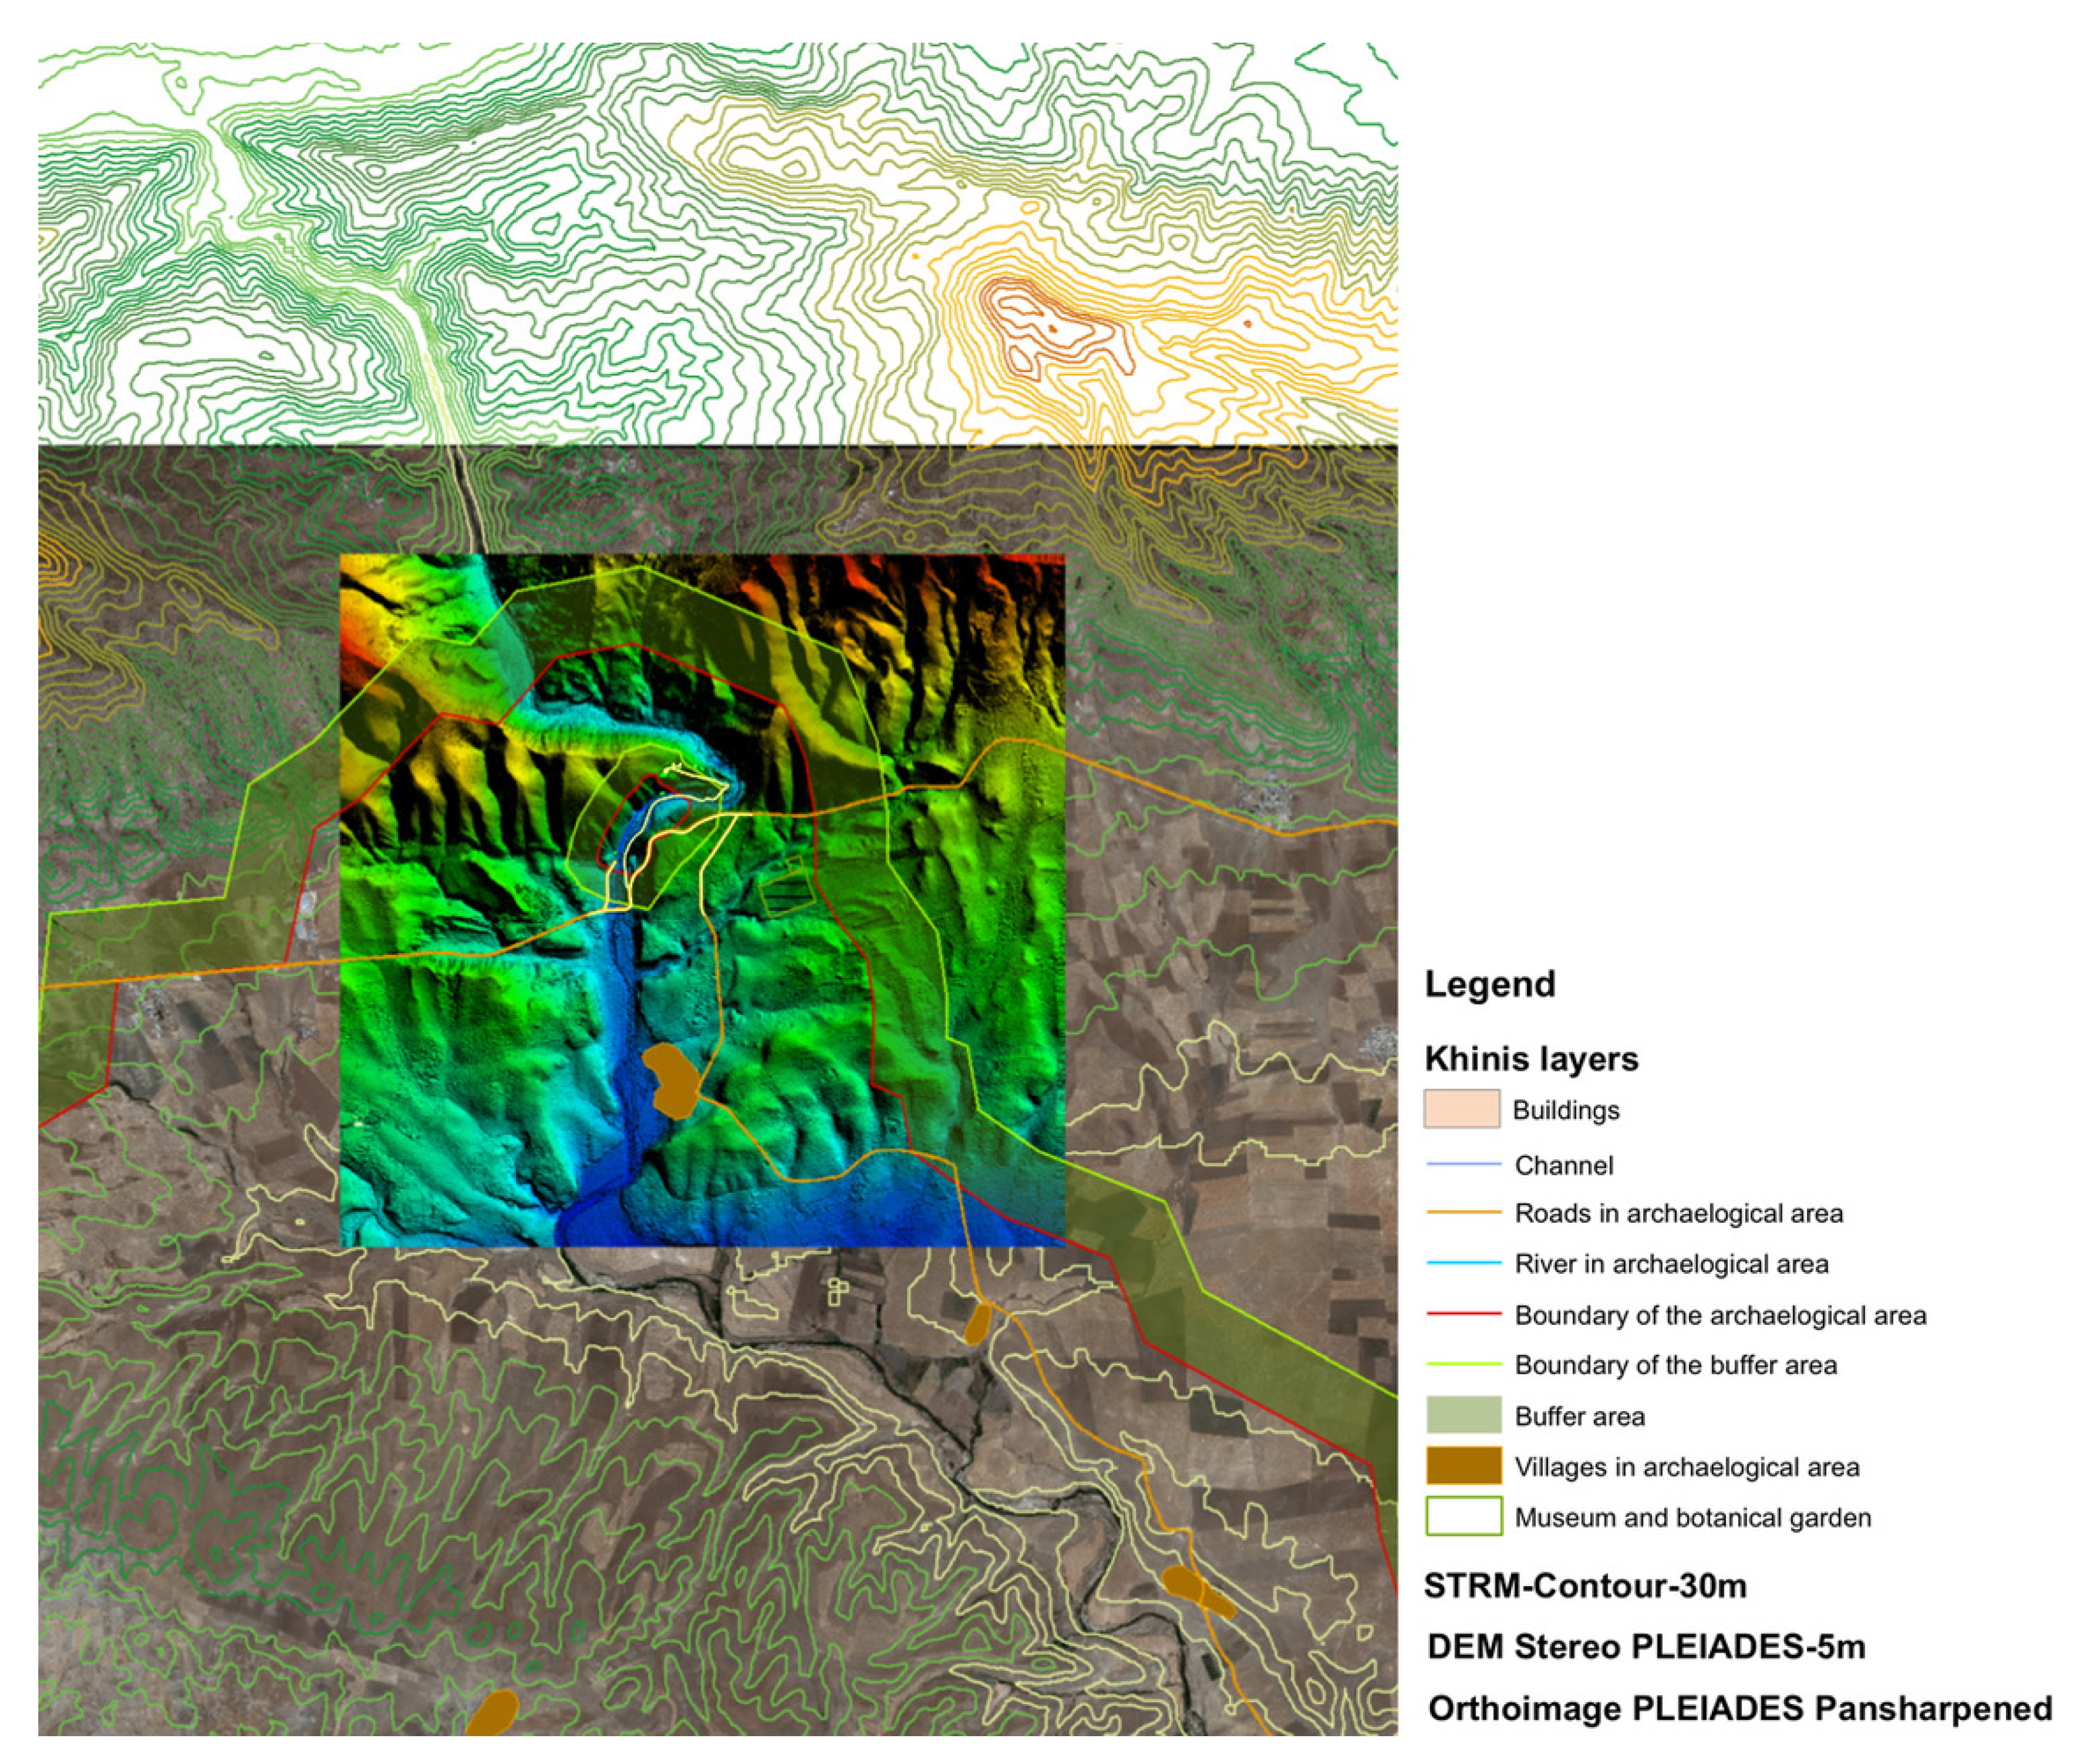
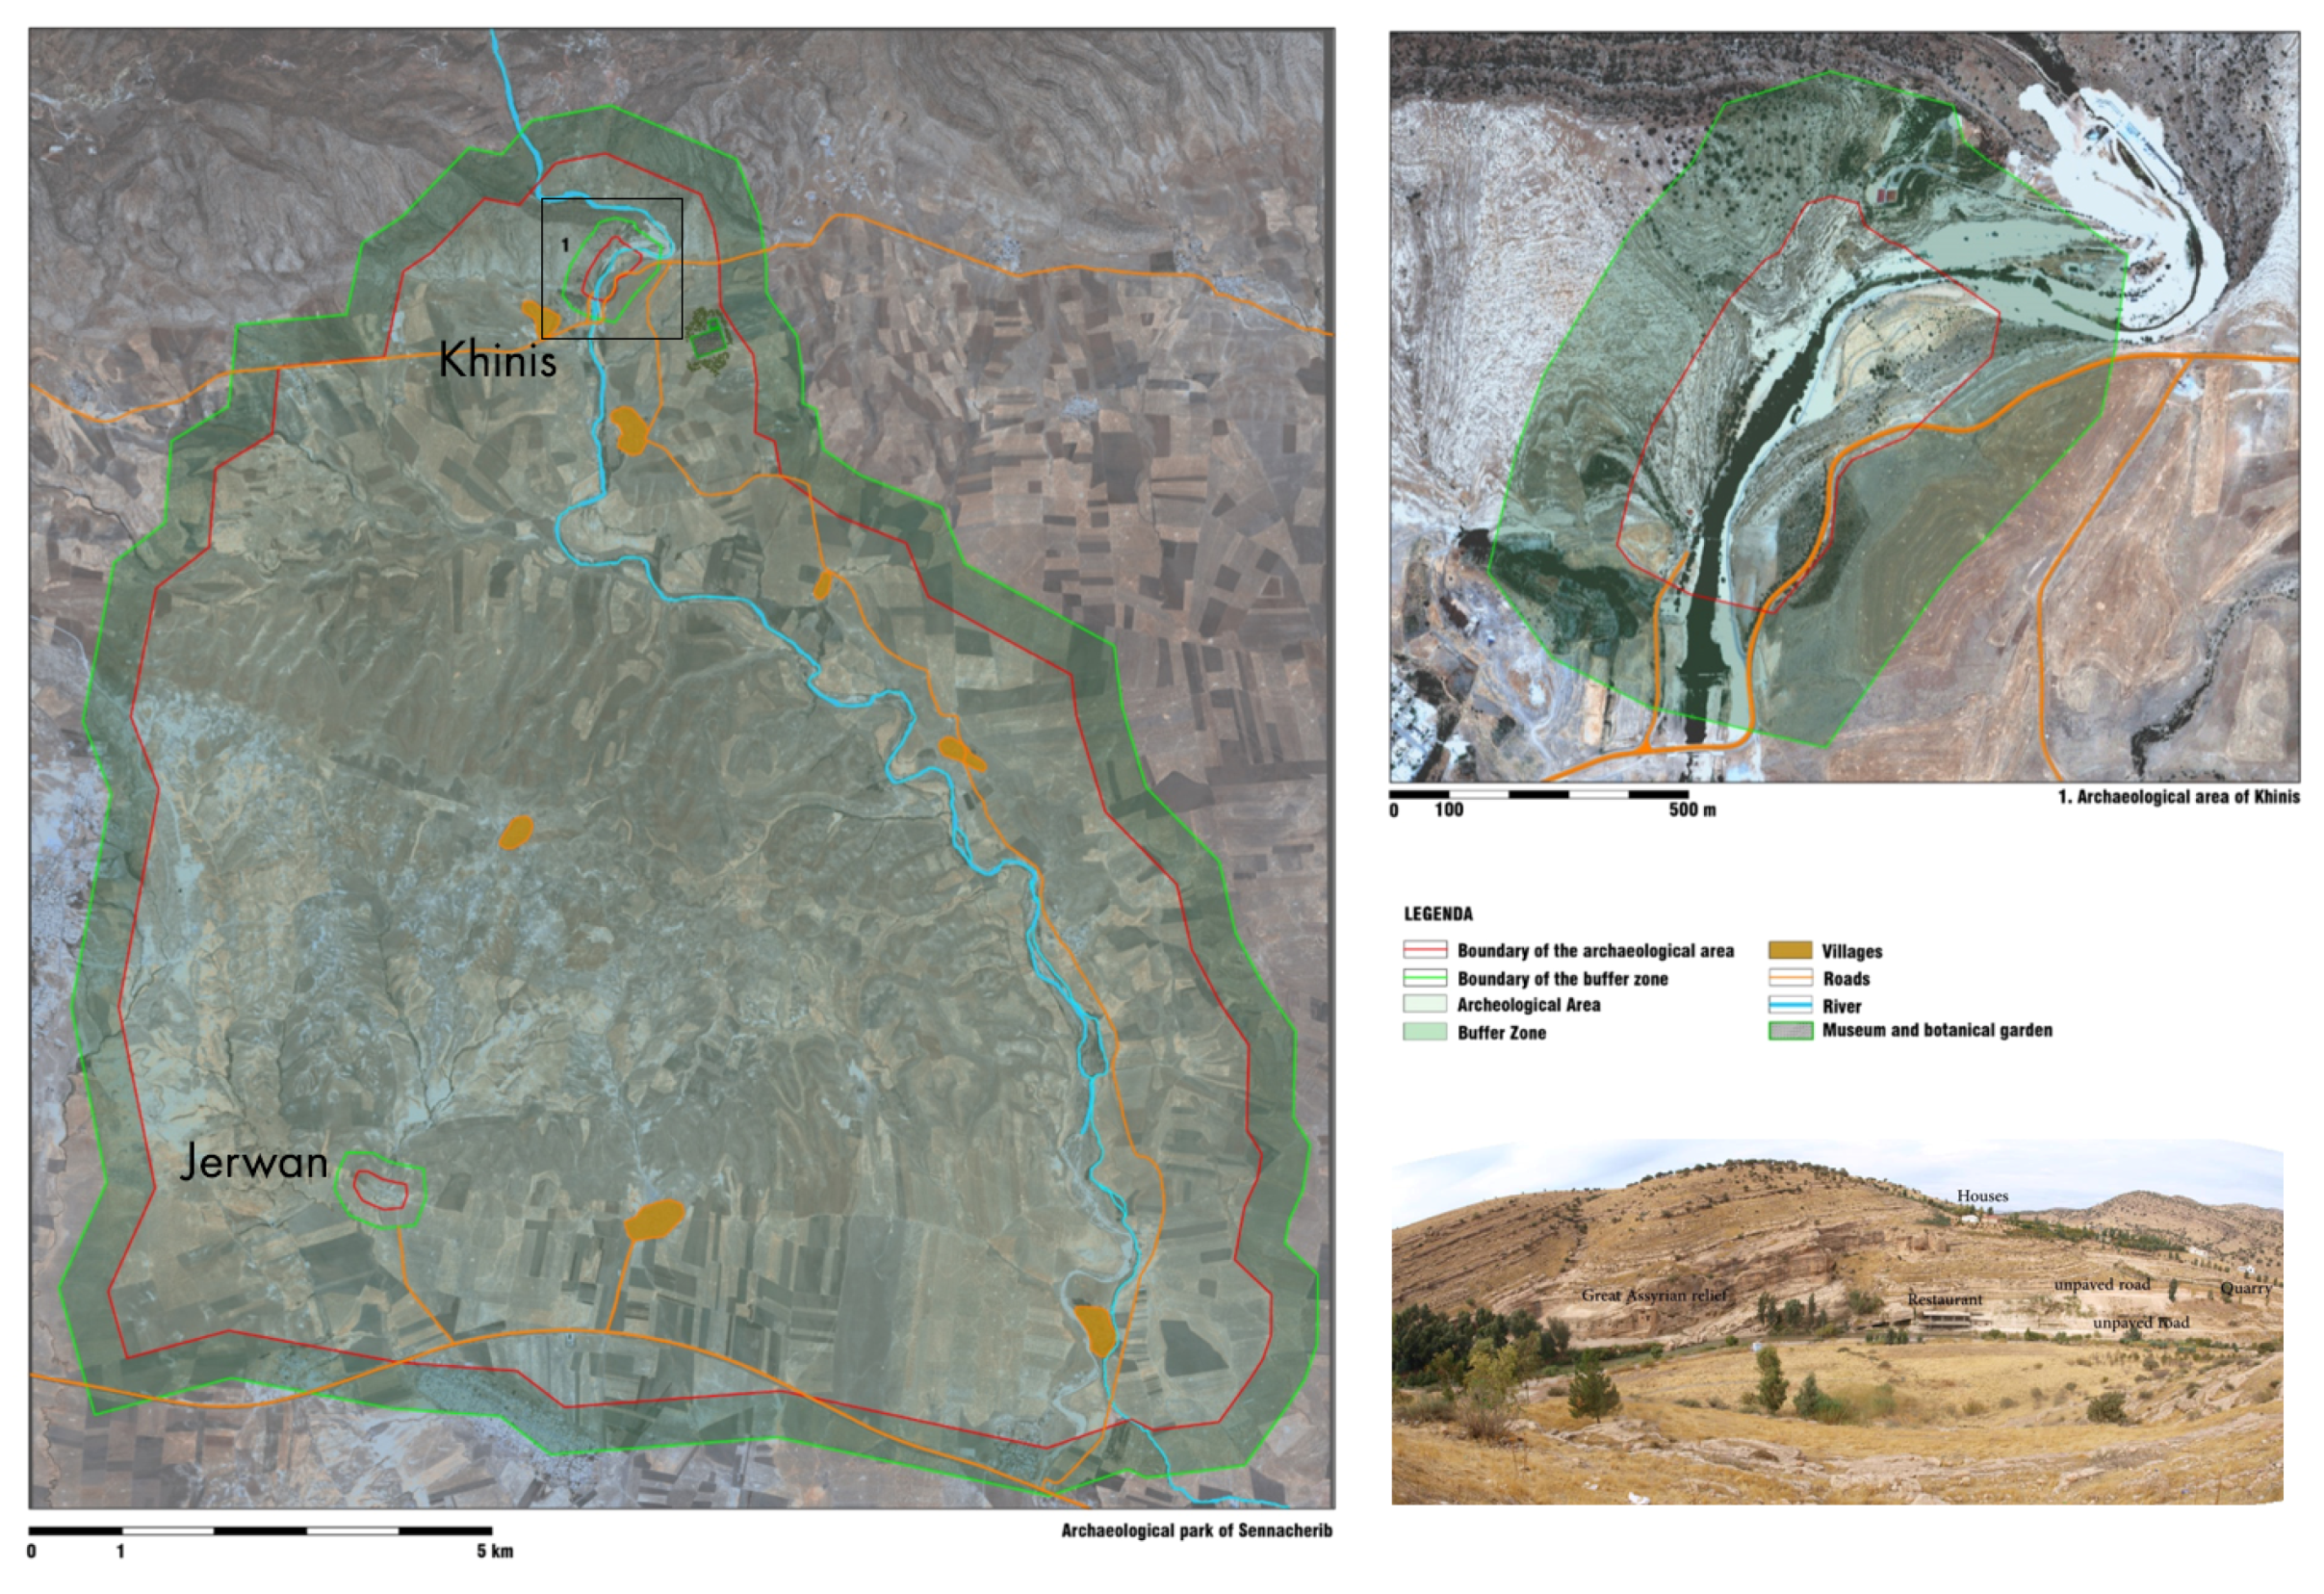
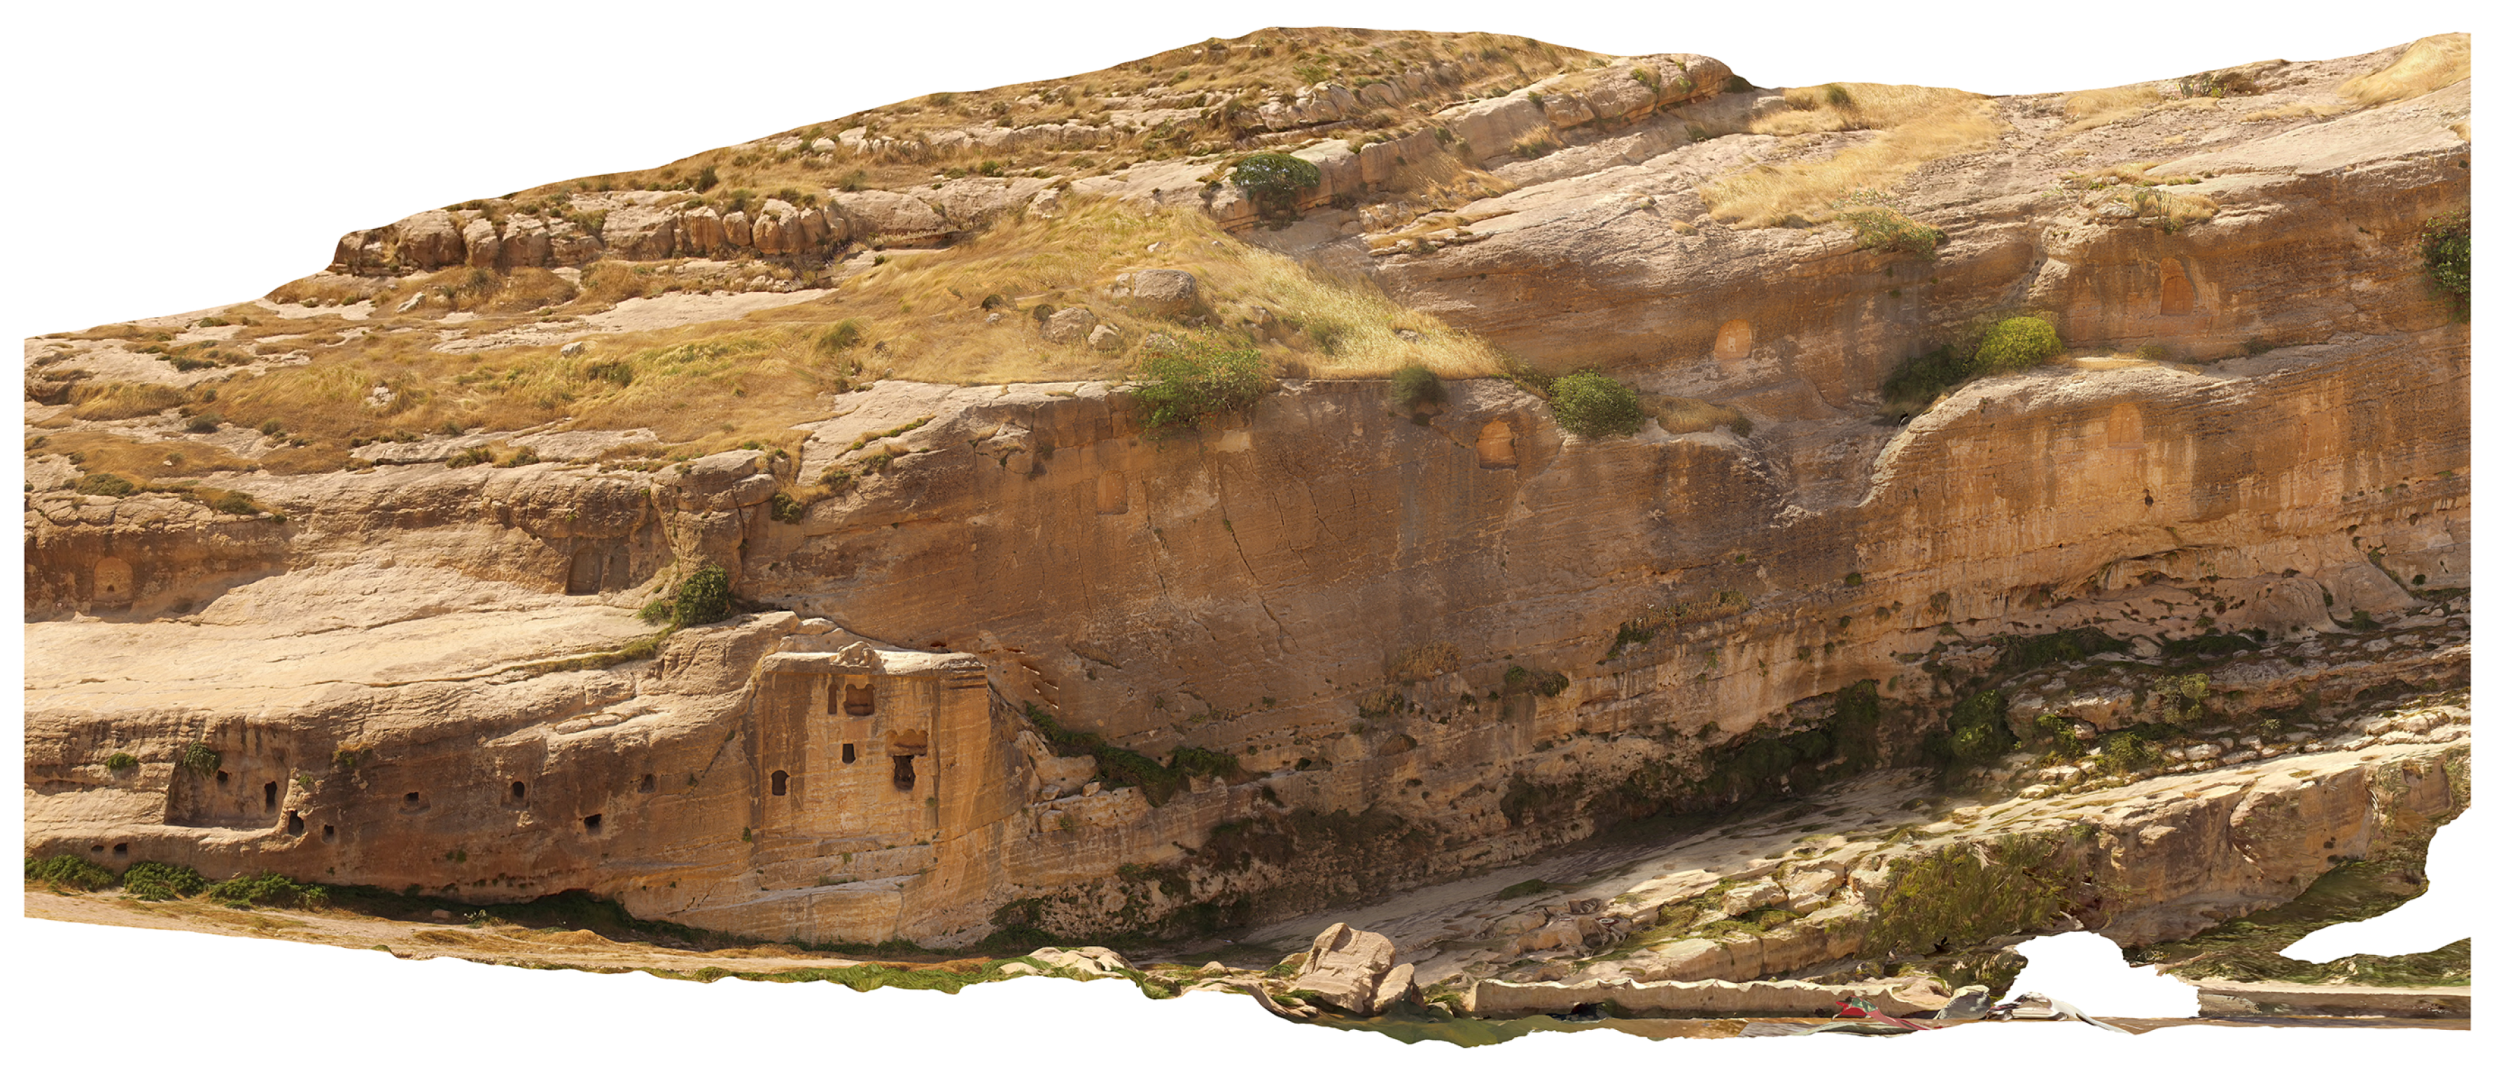
1.2. Description of the Study Area

The impressive hydraulic system built by the Assyrian King Sennacherib is composed by different archaeological areas. The various parts of the waterworks and celebratory works were built by the sovereign in four phases from 706 to 686 B.C. [32,33]. His purpose was to supply water to the royal palaces and gardens of Nineveh—a city neglected by his father, Sargon, but chosen by Sennacherib as his new capital—and to irrigate the land surrounding the city. Nineveh covered a larger area than all capitals before. Not only the city of Nineveh itself but the surrounding large agricultural areas that were necessary to feed the city required an enormous amount of water. To secure this water supply, Sennacherib therefore initialized his hydro-projects. They were carried out on a much higher technological level than previously known water installations. The first phase of Sennacherib’s project concerned a series of canals located in the vicinity of Nineveh; these tapped water from the Khosr River near the village of Kisiri. The second phase was based on a survey made by Sennacherib himself near Mount Musri (now Jebel Bashiqah). Many springs were enlarged, 18 canals were built to feed water into the Khosr, marshes and cane-brakes were created, and a large park containing trees, fruit and animals of all kinds. The third phase concerned the so-called northern canals, which departed from the village of Rimussa (Jerrahiah); the last phase focussed on the set of canals that started in Khinis. In some parts, either at the head or along the canals, reliefs and cuneiform inscriptions were sculpted into the rock which inform us still today about the aims of King Sennacherib when ordering the construction of the canals [34]. Only two parts—Khinis and Jerwan, both belonging to the Khinis-Khosr canal—have received more detailed archaeological interventions. All other parts are known only through short-time surveys and the documentation of the findings. The project for the realization of the Archaeological Environmental Park is studying and enhancing the two last phases of the Sennacherib’s irrigation system located in the Governatorate of Dohuk, in the northern part of Kurdistan region. The third construction phase is characterized by the reliefs of Maltai, situated on a very steep cliff-side overlooking the city of Dohuk, and by the Faideh bas-reliefs, situated farther south, perhaps at places where water was drawn off to irrigate the surrounding territory. Only their upper edges are visible; the rest is out of sight in the now-earth-filled canal. They are seriously threatened by cement companies operating only a few metres away. Lastly, the archaeological area of the Wadi Bandwai and of the Shiru Malikta reliefs is especially evocative, though the reliefs have largely been eroded away. The most impressive monuments belong to the fourth phase of channels, starting from the Gomel River, at the height of the Kinhis rock. Though in terms of technology and construction, the Jerwan aqueduct was the most important part of Sennacherib’s water supply system [35], the Khinis monumental complex embodies the system’s celebratory, ritual and artistic aspects. In both cases, their environmental impact is impressive, hence it will be vital to make sure that no extraneous elements disrupt their understanding and accessibility. For this reason, the archaeological site of Khinis and the Jerwan aqueduct are included in the boundaries of the archaeological—environmental park that the Italian Mission are planning [36]. The Khinis area seems to be of primary importance (see Figure 2 and Figure 3).
Though the works here date from the last phase of construction, this was actually the starting point where the canal tapped water from the Gomel River. Moreover, it stands out as a major celebratory work comprising an incredible amount of bas-reliefs, inscriptions and technical works. Blocks of stone were quarried on both sides of the Gomel and rafted downstream to land at stone wharfs; dams and leaves were built; tunnels were dug through the bedrock; ornamented niches were carved out at various heights along the whole rock wall; and artworks were created, signally the great bas-relief and the imposing monolith. The relief, approximately 12 × 14 m, showed king Sennacherib (on the sides of the panel) paying homage to the deities portrayed in the centre. In front of the relief, a huge monolith, decorated on at least two sides, marked the divide between the Gomel River and the head of the canal. One stretch of the rock face, around 300 m long, featured a great number of niches bearing inscriptions and bas-reliefs portraying Sennacherib (see Figure 3). Given this general overview of the entire archaeological site, from now on, the computations presented in this paper will be focused only on this latter area.

2. Materials and Methods: Documenting the Whole Archaeological Park

In the previous sections, a general overview of the subject area of the investigation and a brief overview of the current methods used in archaeology have been outlined. In the following, a detailed description of the steps performed to achieve a thorough topographic mapping of a portion of a landscape archaeological area will be given—in particular, the Khinis area. The work has been performed at different scales and with different products to meet the needs of archaeologists, by exploiting the following steps of the workflow:
  • Pleiadés VHR images processing, used for a visual interpretation of the study area, together with a general overview of the entire Archaeological Park;
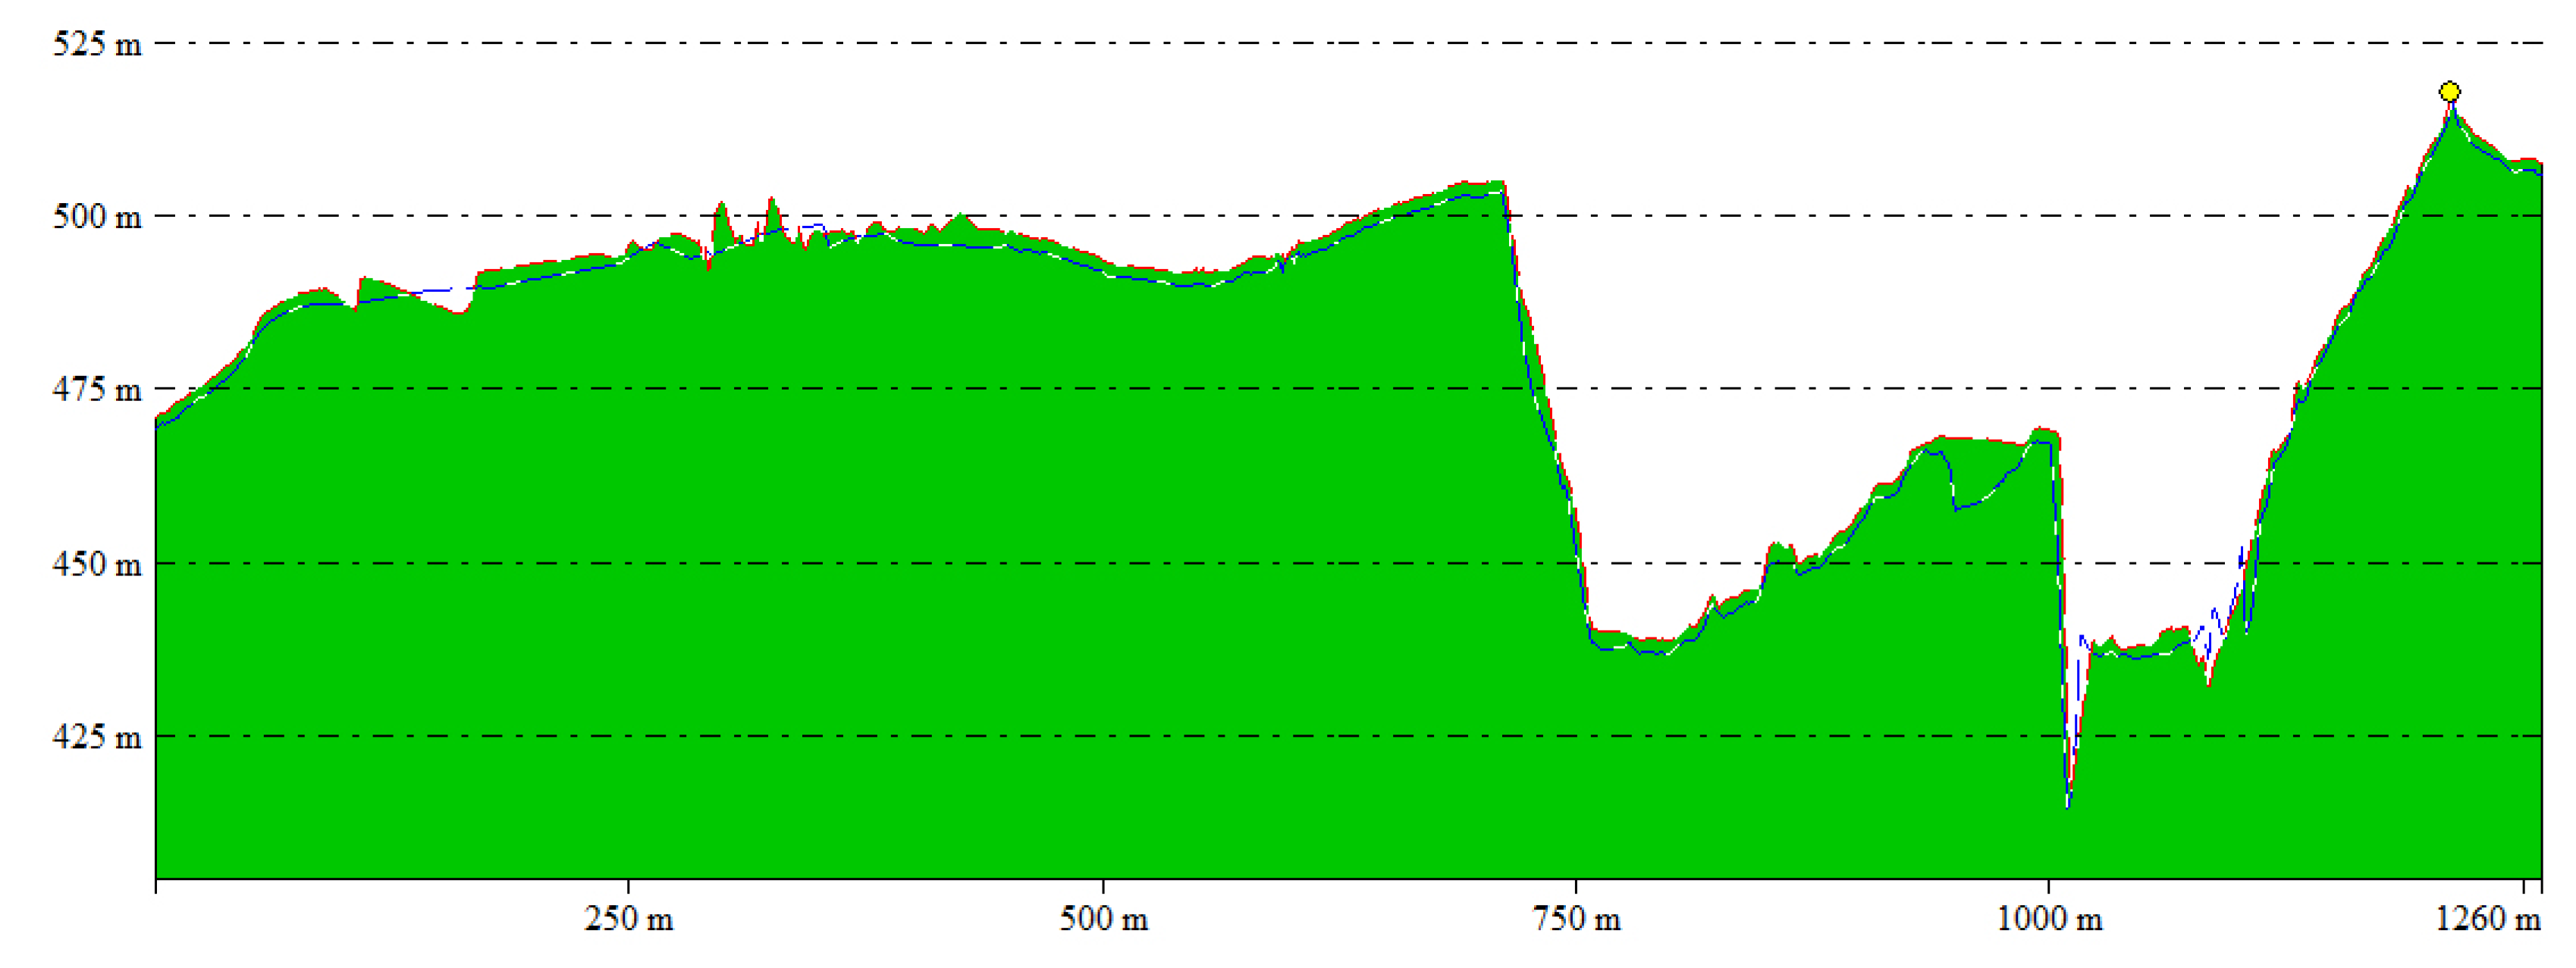
  • Stereo-pair processing, used for obtaining the DEM of the area, useful to study in detail the morphology of the area of Khinis.

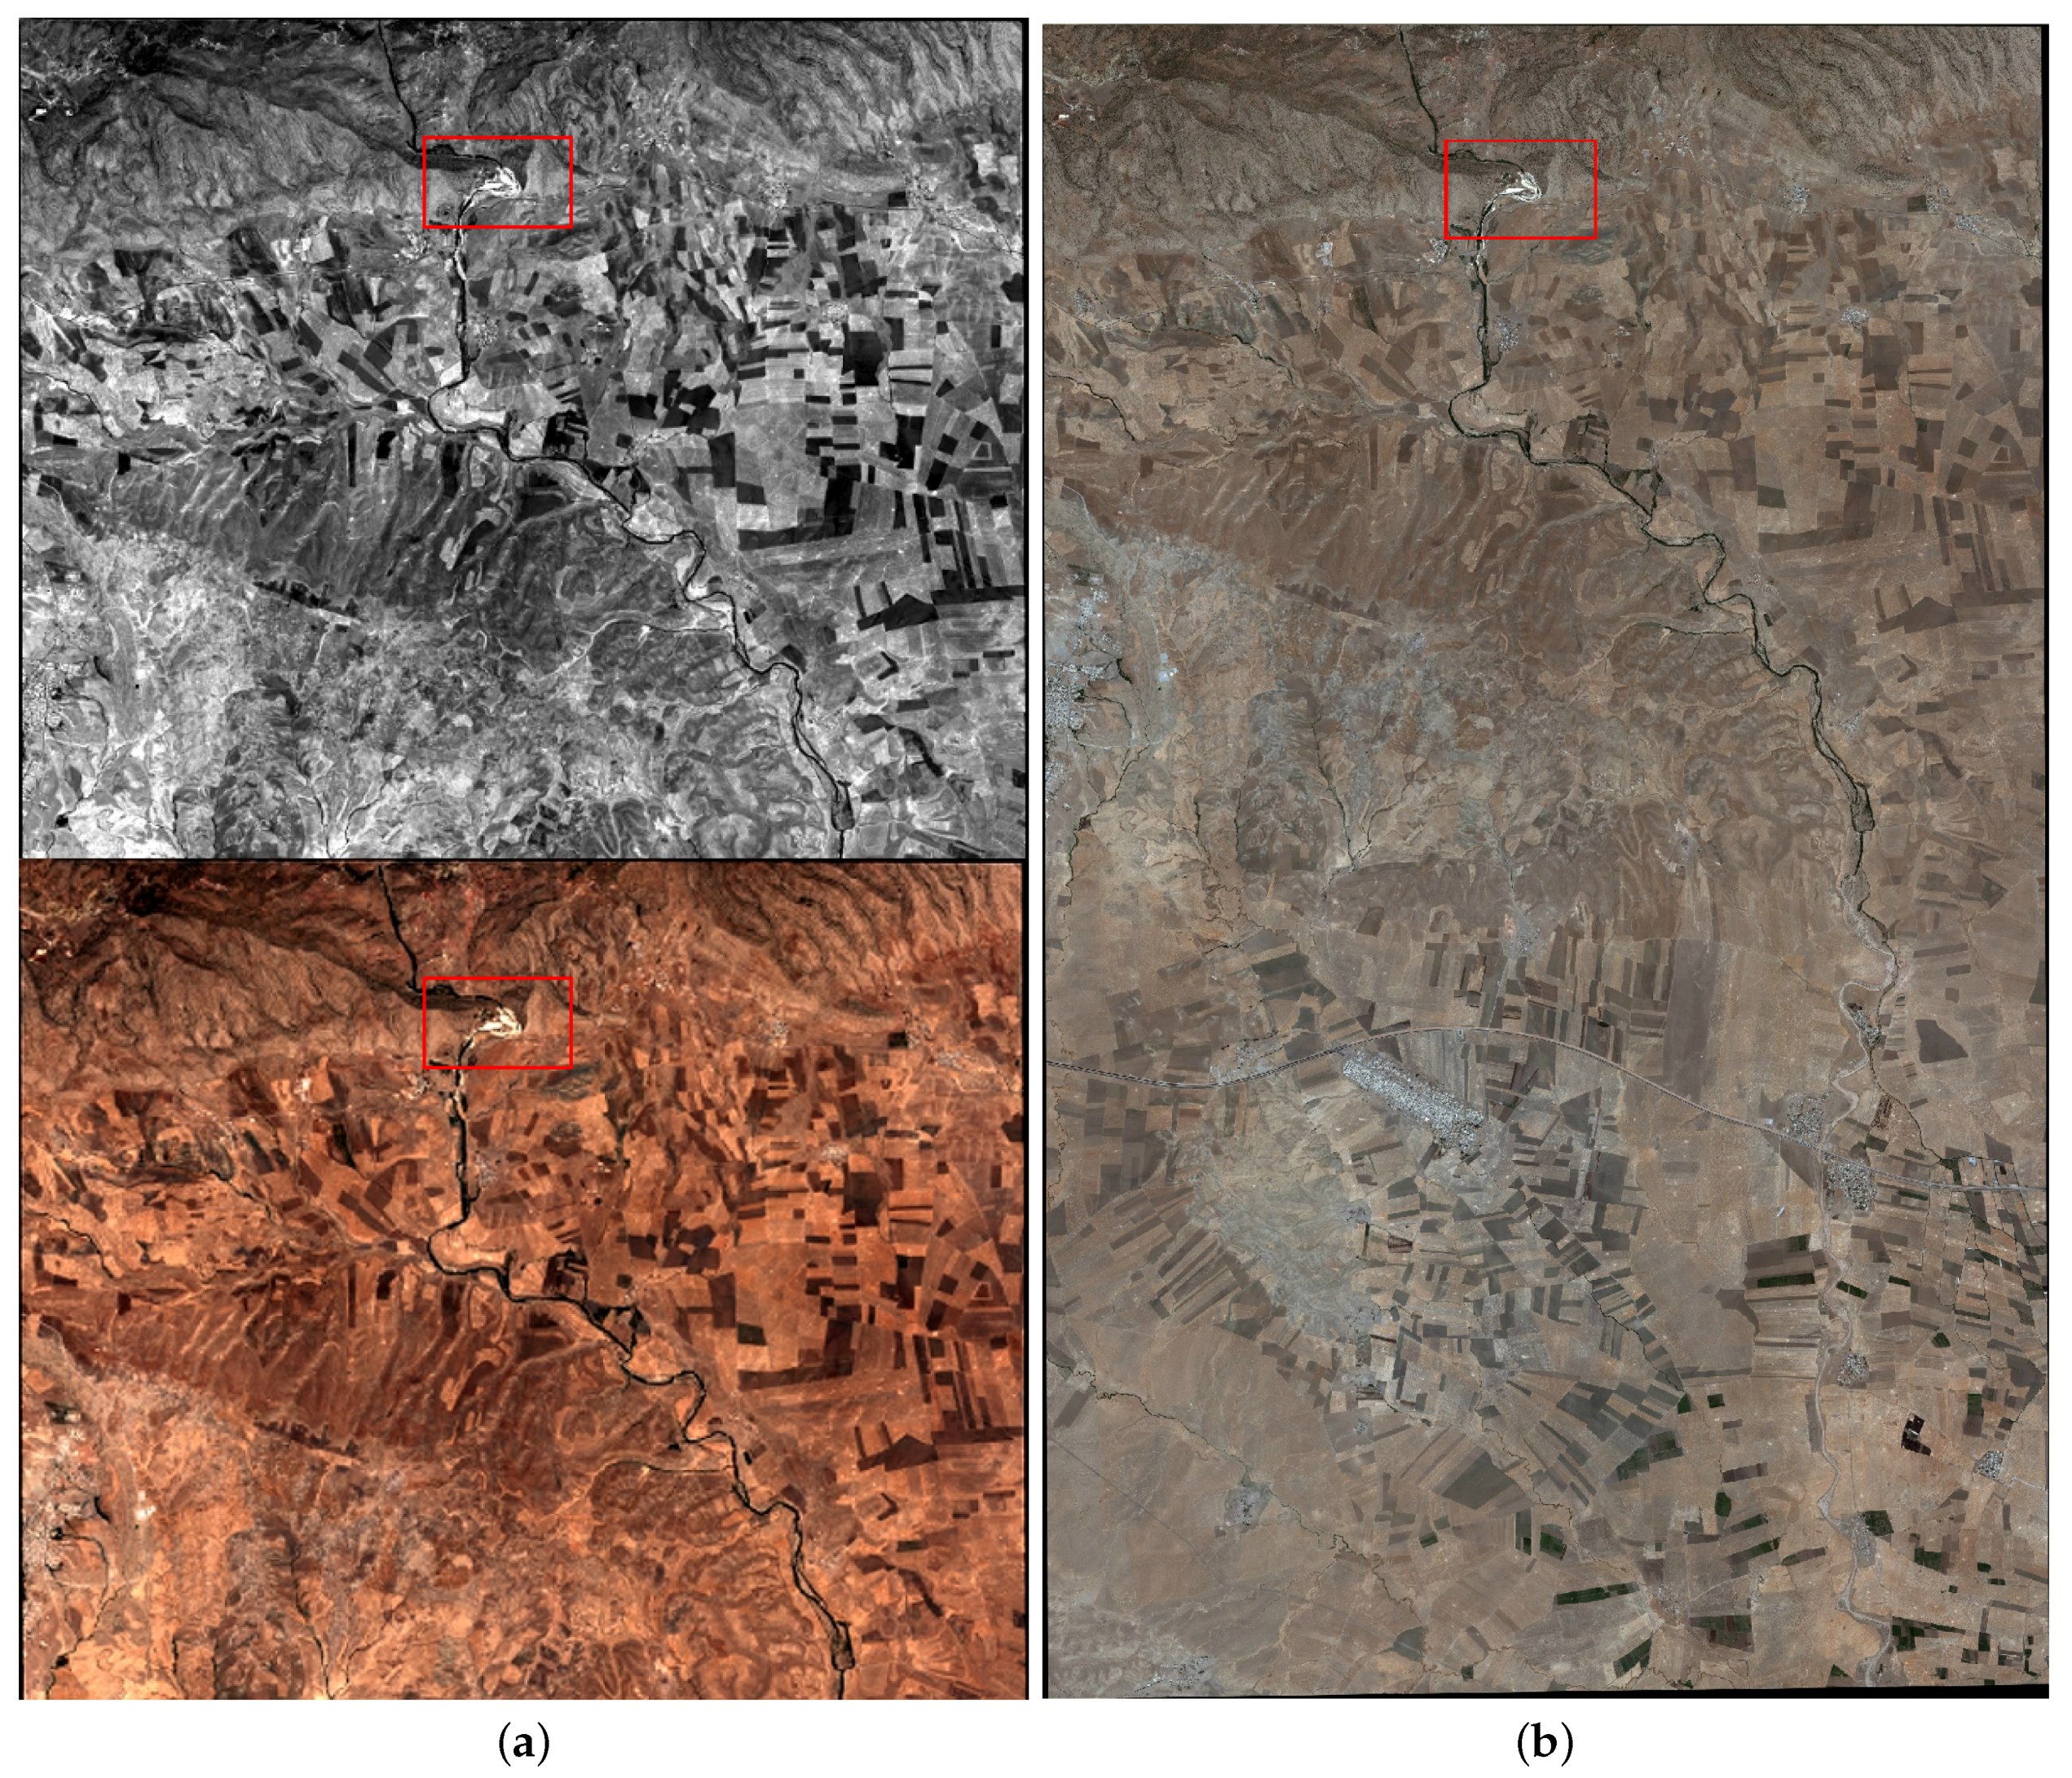
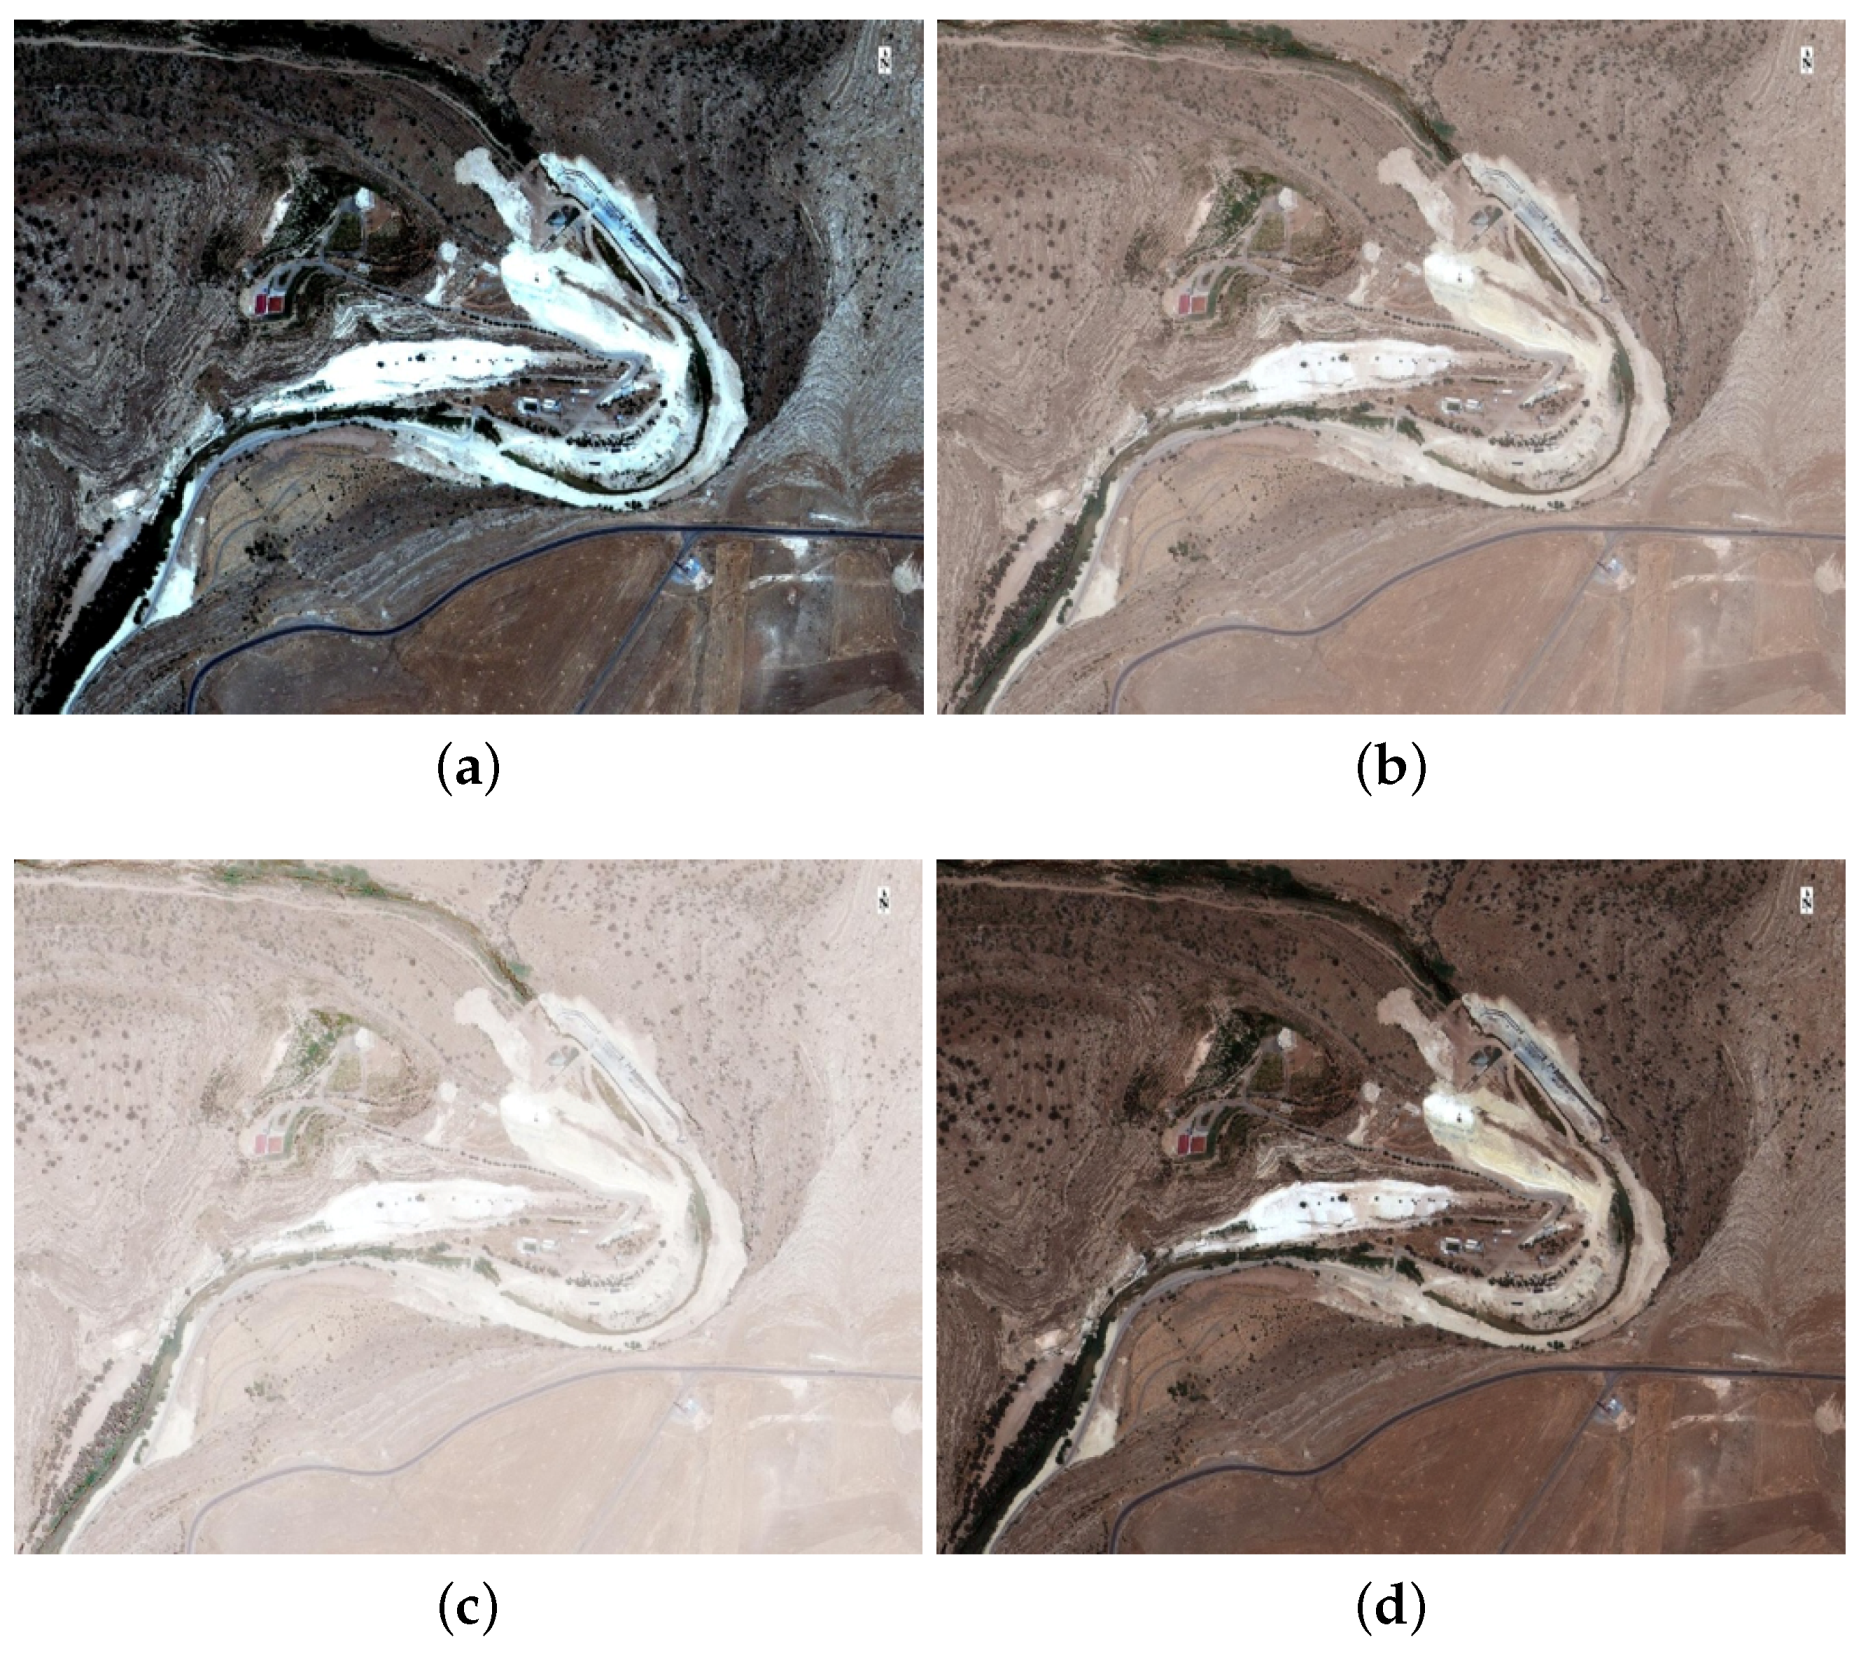
2.1. Pleiadé VHR Images Processing

The planning process of such wide archaeological setting cannot disregard from a first step of visual interpretation of the area. This first stage of the work consists of the use of VHR images aimed at studying the archaeological landscape and at highlighting the main areas where the cartographic features are concentrated (streets, ducts, borders, villages, and so on). In the following, the main features of the input dataset will be described and the details of the steps performed to create pansharpened pictures, together with the details about the comparison between the different methods of pansharpening adopted.

2.1.1. Dataset

The input images processed have been obtained from Pleiadés sensor. For this stage, a strip of the same region of the Iraqi Kurdistan was taken, with the simultaneous acquisition of panchromatic and multispectral, the day 01-07-2012, in Universal Transverse Mercator (UTM) planar projection, Zone 38 N, and WGS84 datum. Of course, the two set of images have two different geometric resolutions: the panchromatic ones with a ground resolution at nadir of about 0.50 m, while the multispectral ones can reach a ground resolution of 200 m. The acquisition in multispectral mode for this type of satellites is in turn subdivided in four bands of the spectrum: red, green, blue (bands of the spectrum visible to the naked eye), and near infra-red (NIR-spectrum invisible to the naked eye). The dataset, ortho-ready, is 100% cloud free and it has not been necessary to perform any radiometric calibration to the data, since there was not the presence of meaningful distortions (Figure 4a).

2.1.2. Images Processing

Pansharpening is a well known methodology of image fusion which combines the high resolution of panchromatic images with the lower resolution of multispectral ones. The advantage of such method is to get as a final result a coloured image of a certain area with a high resolution, optimizing the starting panchromatic one. This step is required since the images have different geometric resolution, and this does not allow their direct overlay, unless an appropriate breakdown of the pixels is carried out, and a re-sampling through dedicated algorithms. It is hence necessary to produce a pansharpened image (Figure 4b), obtaining high-resolution images (0.50 cm) in the four bands acquired by Pleiadé sensors. We therefore performed a co-registration (using the red band) to achieve a perfect overlap of the two images, with the automatic selection of the tie points and choosing a Root Mean Square (RMS) lower than 0.25 m on them. Afterwards, HSV (Hue, Saturation, Value), Principal Components (PC), Brovey and Gram–Schmidt (G–S) methods have been tested; the visual comparison exhibits that all the pansharpening algorithms have significantly improved the initial low resolution Multi-Spectral (MS) image (see Figure 5).
To validate this assumption, the first and second order statistics (namely, mean and variance) were calculated for all images to make a comparison between the original and the pansharpened ones. The comparison was done for the whole strip and for a subset of the image particularly over-exposed (see Figure 4 and Figure 6a). The results are shown in Table 1 and can be compared with the image subset in Figure 5, which reports the four outputs from the pansharpening algorithms used. The PC algorithm obtains the maximum mean compared with the original one. The variance values are very close to each other, apart from the HSV method, which performs worse. The Gram–Schmidt method is the most balanced.
The final pansharpened, used is the one obtained by using the Gram–Schmidt [37] algorithm implemented in ENVI© software. The results are in line with similar research in the field [38,39]. This choice is supported with the statistics performed in a subset (row three and four of Table 1). We finally added some filters in order to achieve results closer to the real color of the area. The results of this step are shown in Figure 6. The figure demonstrates how the image have been enhanced with respect to the original one. Choosing the quarry as a demonstrative example, it is clear that, if in the initial input image, the white area was overexposed and hence not usable, after the pansharpening procedure and the application of a linear filter to the pansharpened image, the picture can be exploited for a more accurate visual interpretation.

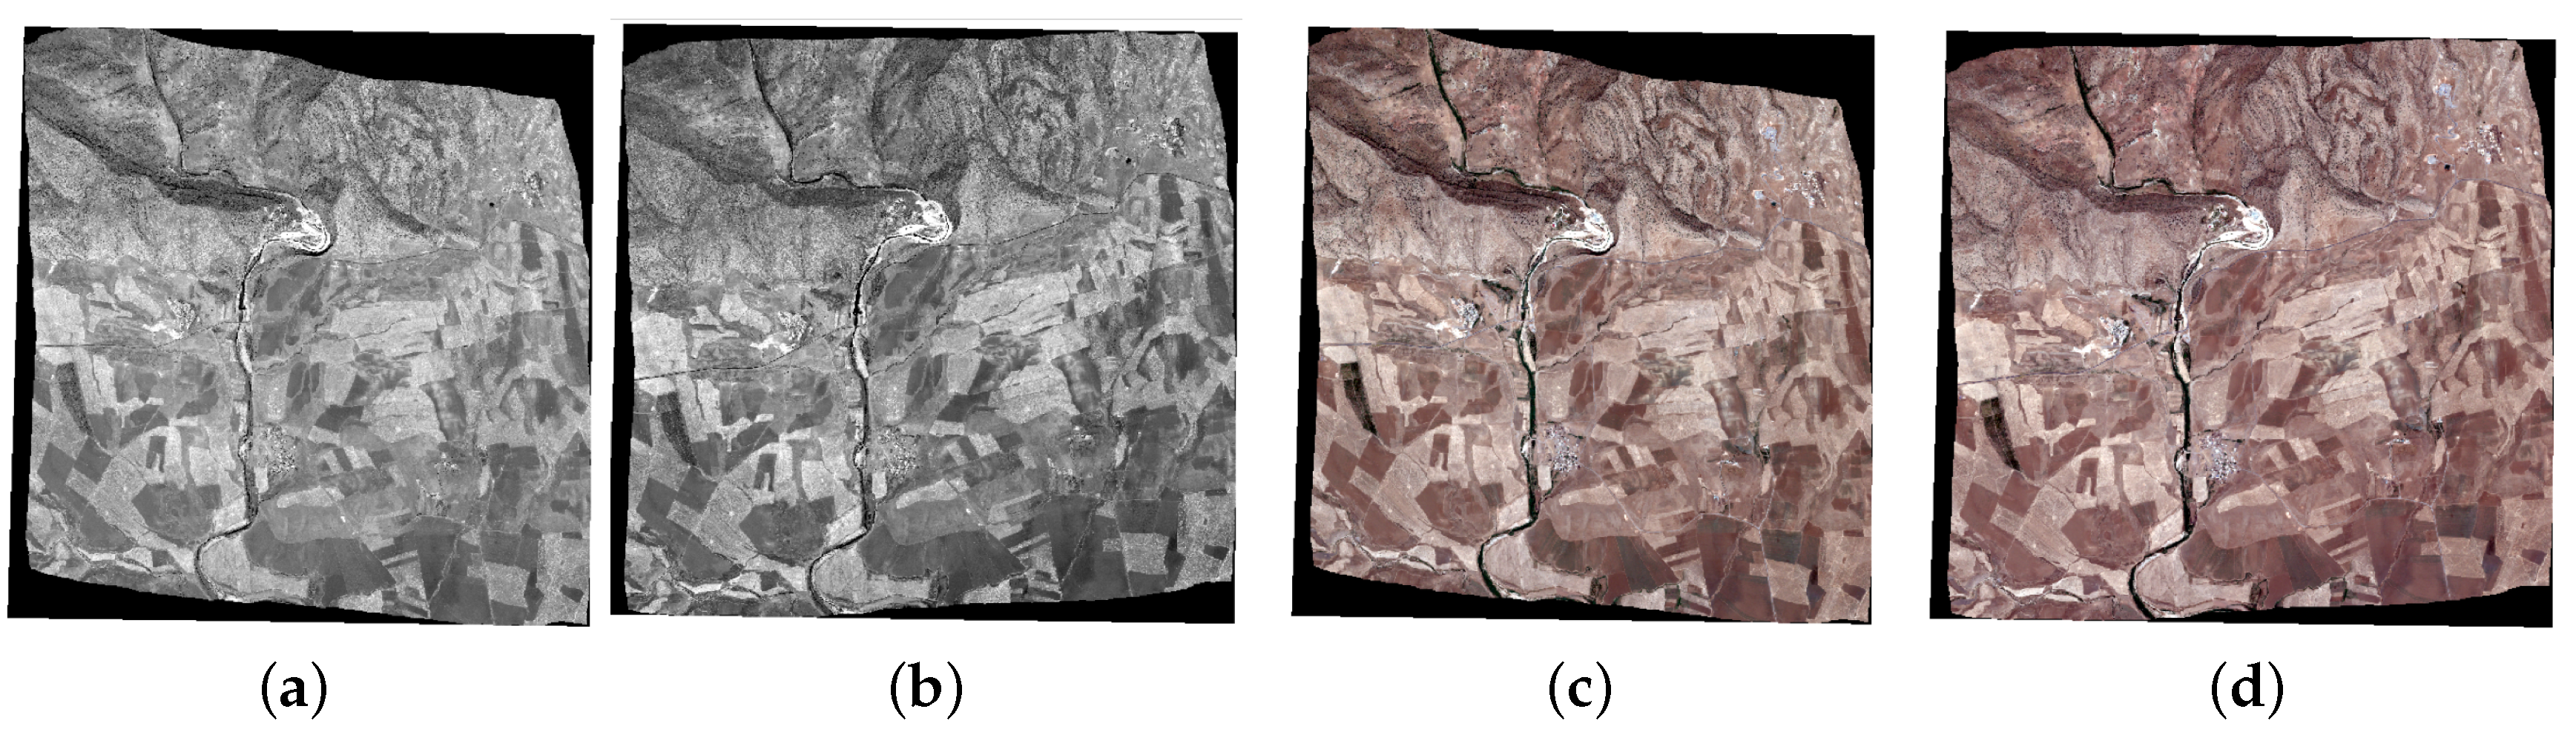
2.2. Stereo-Pair Imagery Processing

The second stage of the work consists of the creation of the DEM of the Khinis area, starting from the satellite stereo-pair. It is indeed fundamental to recreate the morphology of this territory, with the purpose of planning all the services of the future Archaeological Park. The 3D model of the site is an instrument for controlling the urban development, for planning efficient exploitation of resources and raw materials and for studying intervention of sustainable agriculture, including the monitoring of hydrographical net and possible environmental risks. The remote sensing image observation can localize the areas where there are critical situations; this type of monitoring can be extremely important in a moment in which climatic changes are going to produce even more probable floods and drought and other consequences in the cycle of water. As in the duct fell several rests, the program of intervention requires a more detailed cartography of the area made of level curves and ortophotos in adequate scale to be managed within the GIS. The process of DEM extraction followed different tests performed to achieve the best balance between accuracy and resolution to better represent the morphology; namely, the purpose was to compare the performances of panchromatic and multispectral (then pansharpened) stereo-pairs for the creation of a DEM with 1 m of grid. To do so, we created, using the same procedure described in the previous section, the pansharpened images of the stereo-pair. The software suite used for the processing are ERDAS IMAGINE© and ERDAS eATE© software, respectively for the photogrammetric orientation of the images and for the creation of the DEM.

2.2.1. Dataset

As in the previous stage, the input dataset comes from Pleiadés sensor, acquired on 30 June 2013, considering in this stage the stereo-pair. In fact, thanks to the huge satellite agility obtained with control momentum gyros as actuators, the optical system delivers as well instantaneous stereo images, under different stereoscopic conditions and mosaic images, issued from along the track, thus enlarging the field of view. The dataset is composed of a couple of panchromatic images with a resolution of 0.5 m and a couple of multispectral images with a resolution of 2 m (the dataset is depicted in Figure 7).
The dataset is even provided accompanied with information of the image capture (Rational Polynomial Coefficients—RPCs), that is, the data regarding the satellite orbit (ephemerides), platform and sensor orientation (in WGS84), and the data on optical-geometric conditions of the sensor at the time of the acquisition. ERDAS IMAGINE software uses these parameters implementing Rational Polynomial Functions (RPFs) to create a connection between image space and terrain space. After the image pyramid generation, the automatic tie point measurement has been run to provide an automatic selection of tie points to make the relative orientation. This process involves a bundle adjustment, a review of the results and, if it is necessary, a refinement of the performances to improve the quality of the solution. All these steps have been implemented for the panchromatic and pansharpened stereo-pairs, getting as a result of the triangulation accuracy, the values reported in Table 2.
The absolute orientation of the photogrammetric model was obtained using the original RPC, since it was not possible to collect any Ground Control Point on site with Global Navigation Satellite System (GNSS) positioning instruments.

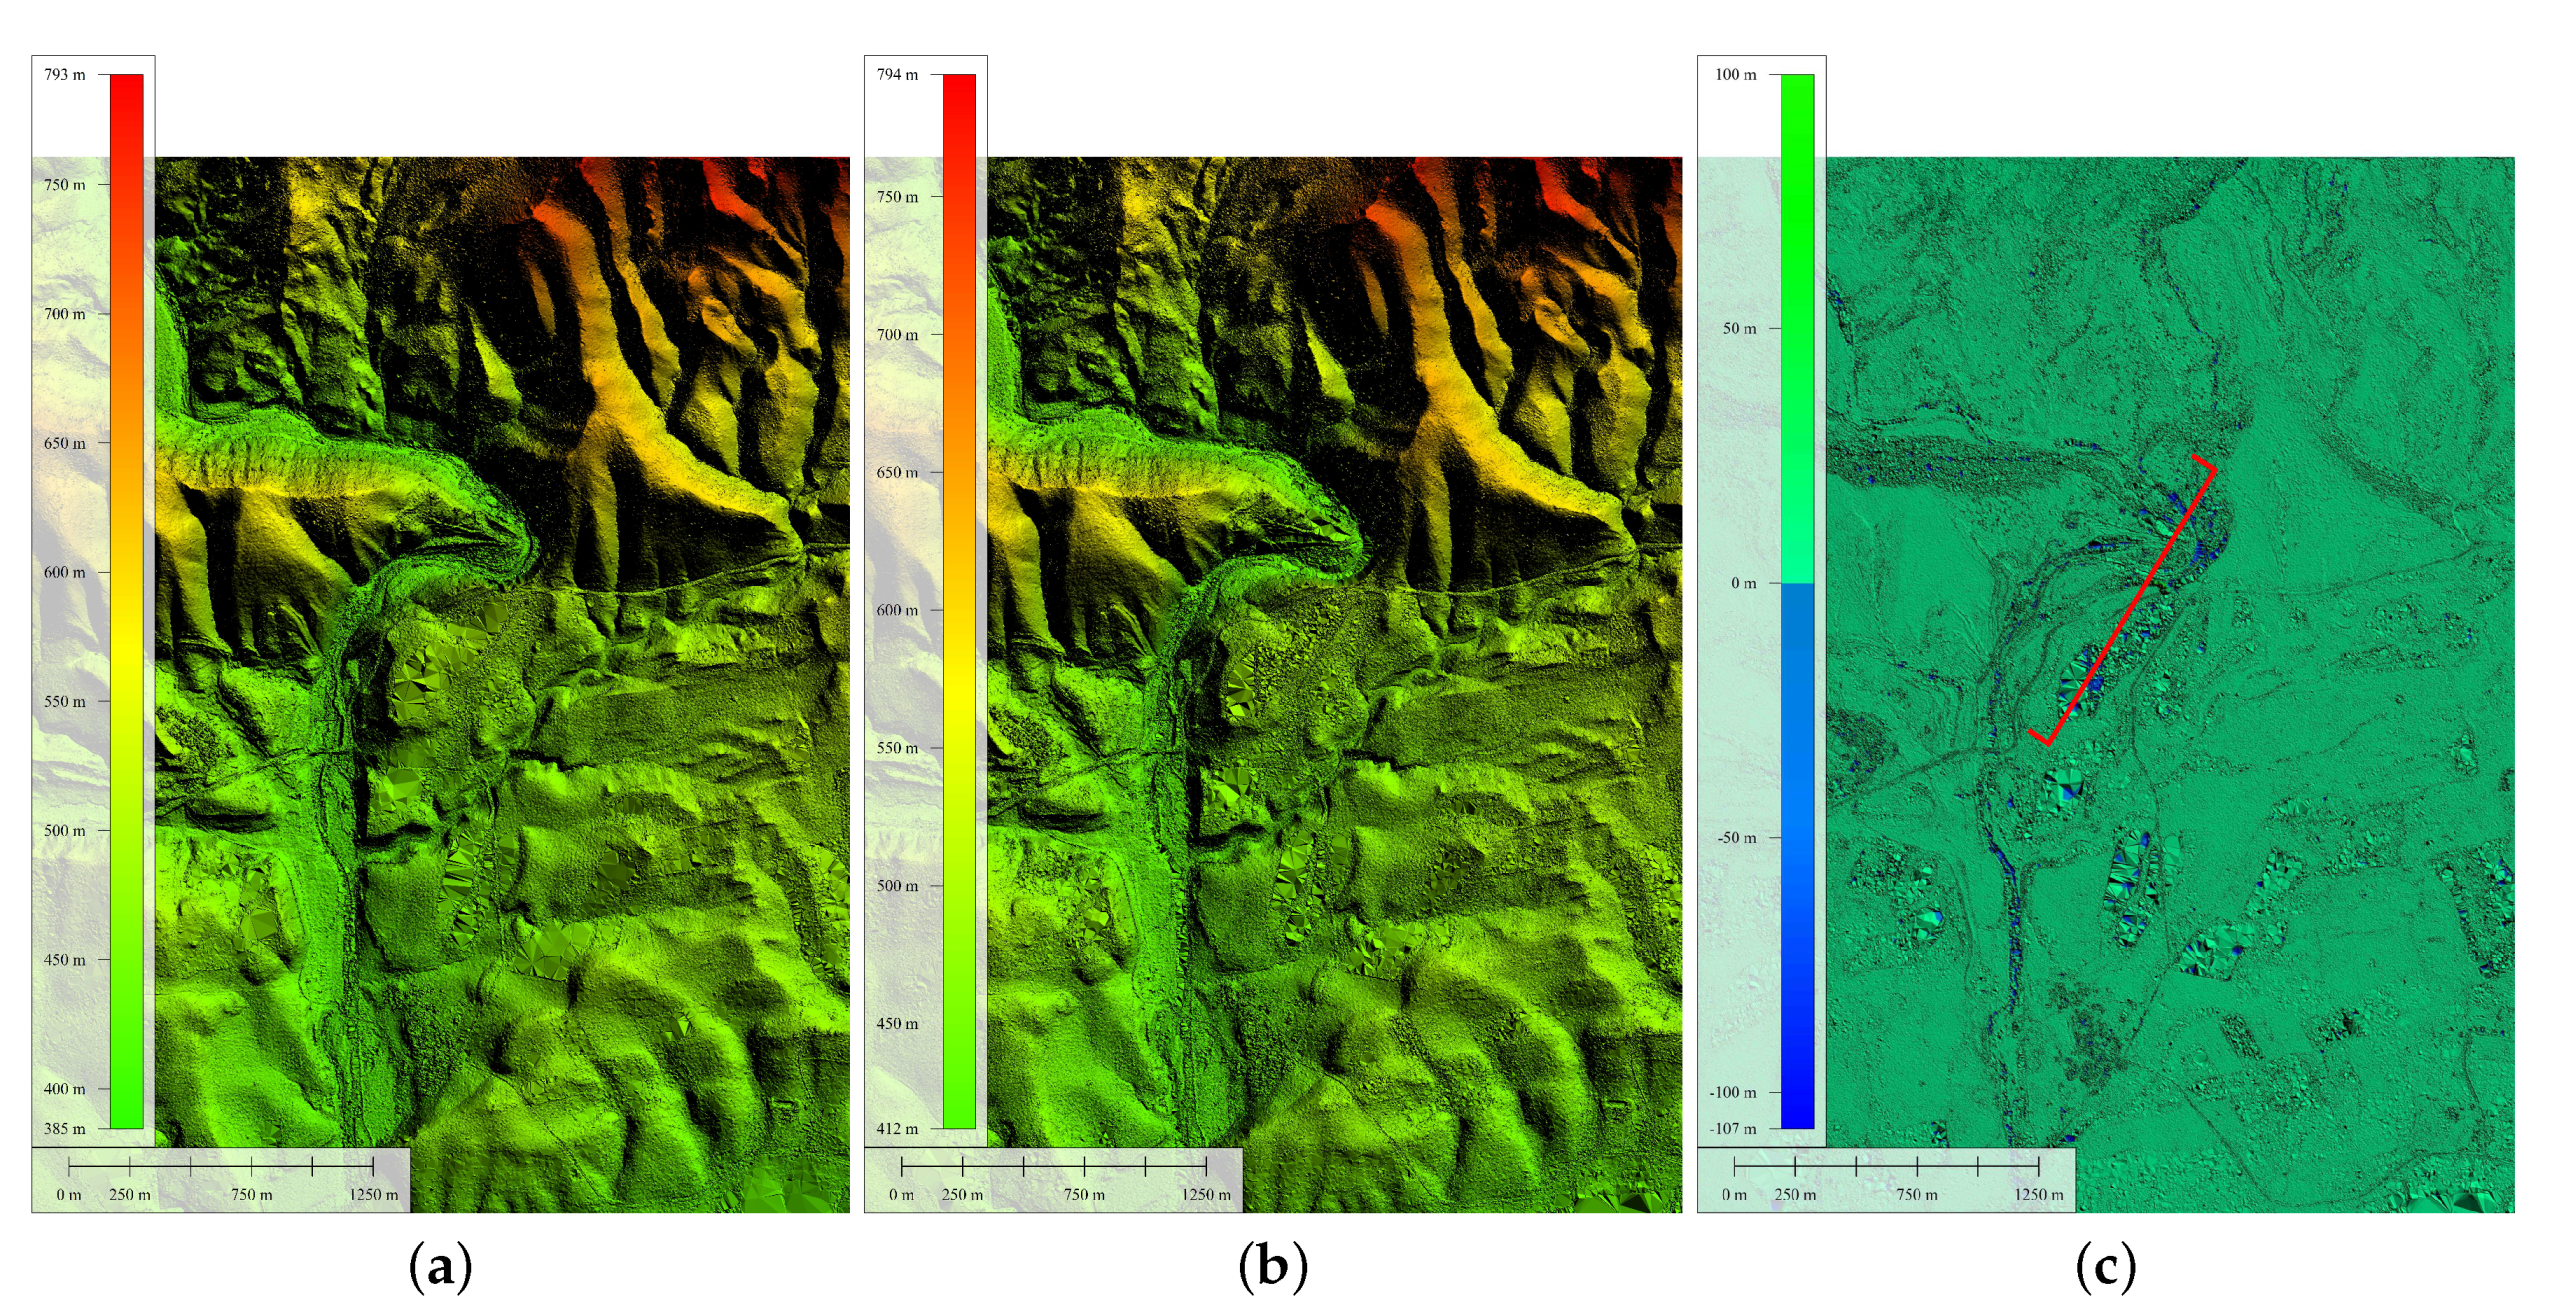
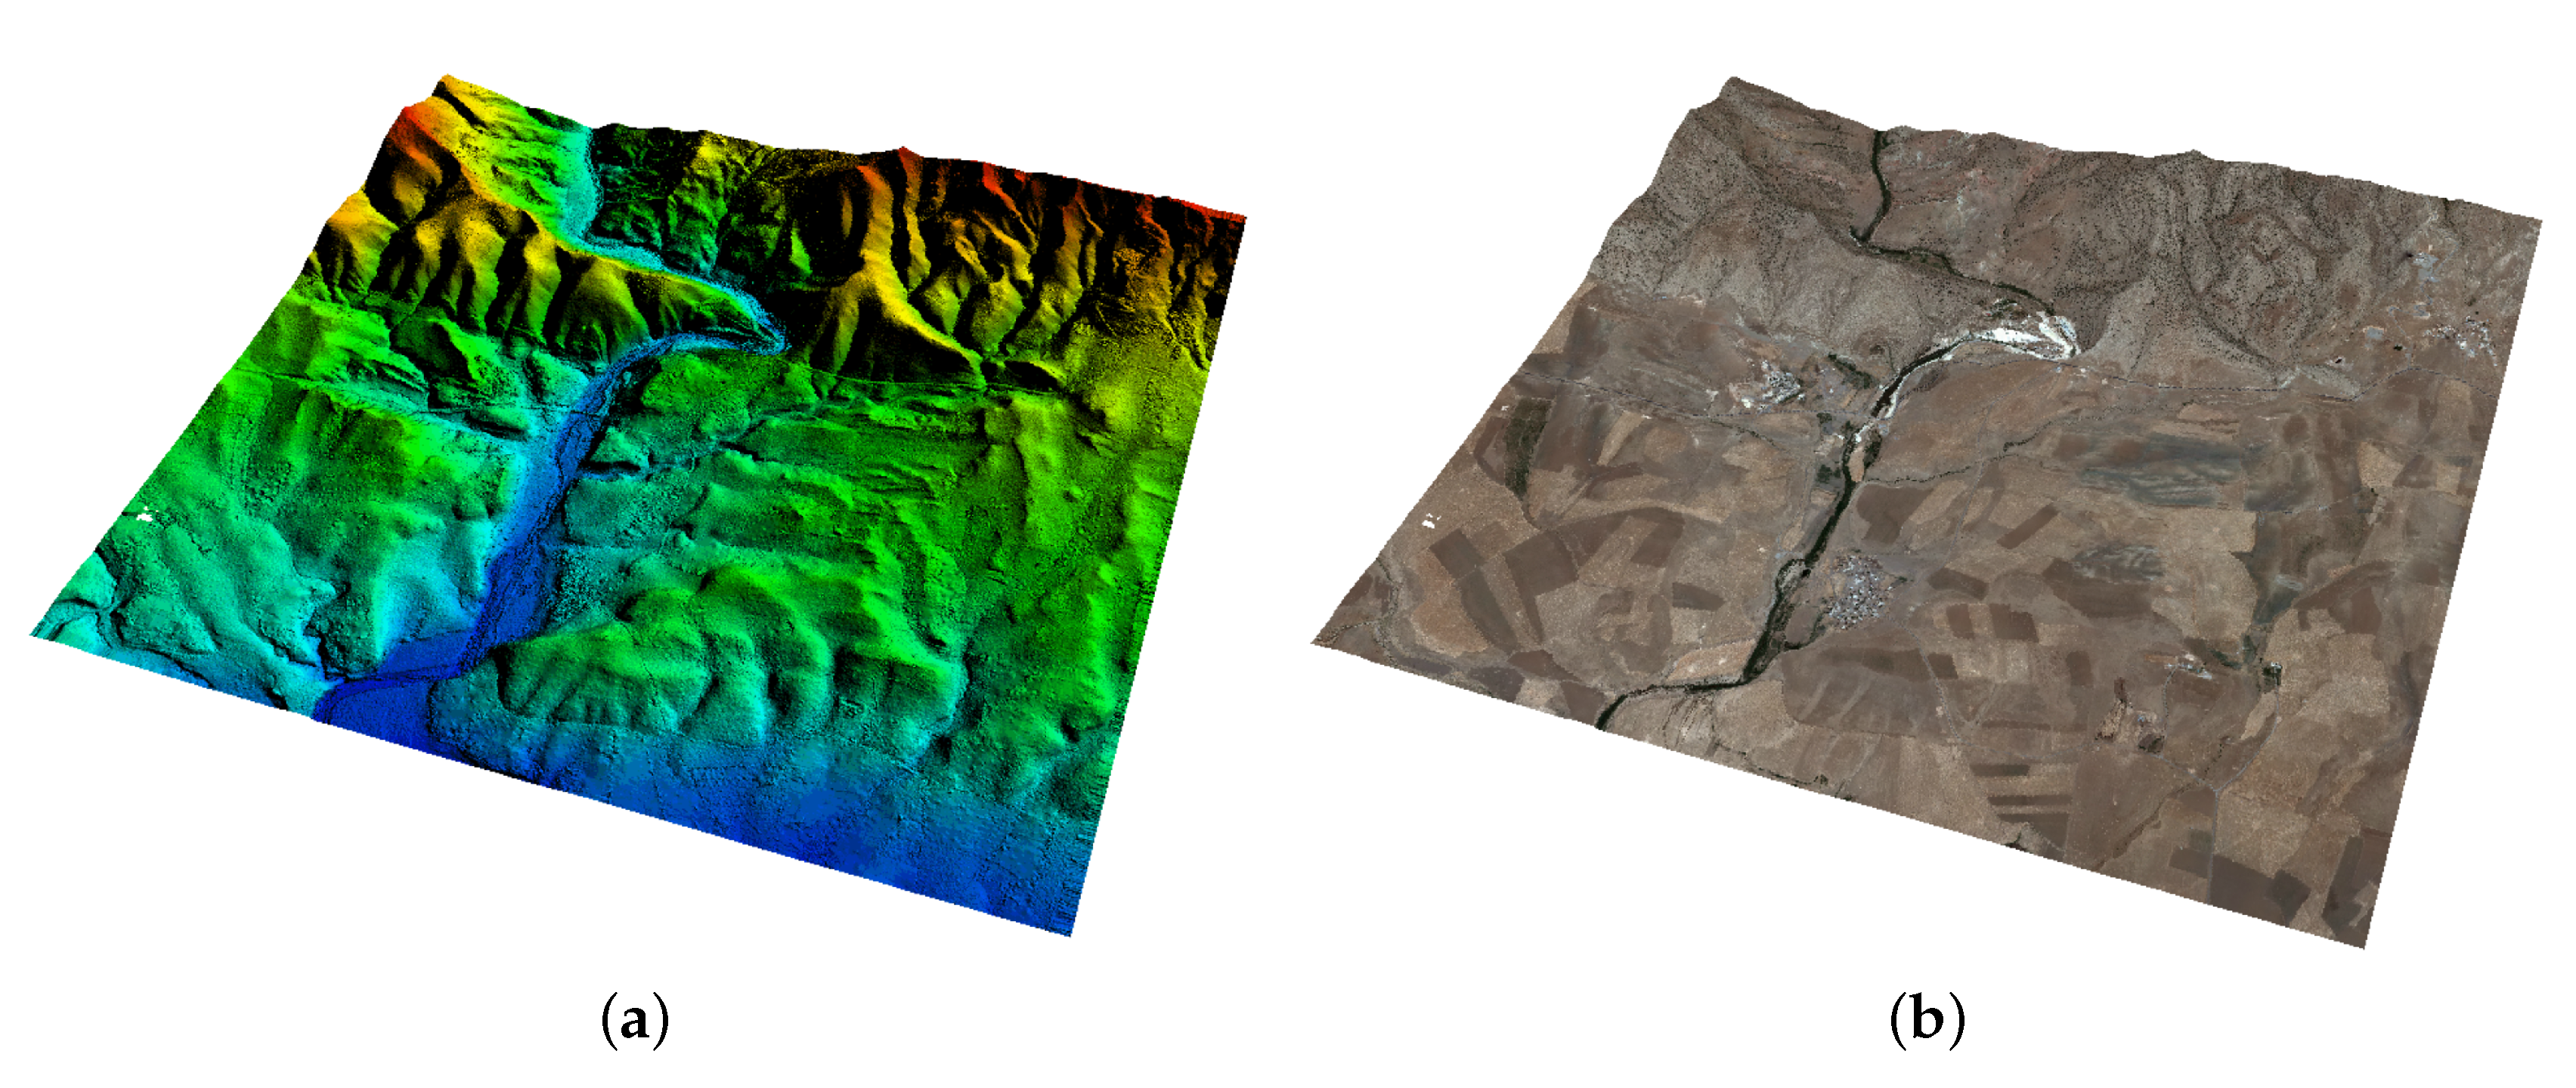
2.2.2. DEM Extraction

Given the satisfactory values of the residuals from the triangulation phase, the set of images was then ready to be used for the creation of the DEM. For its production, we used eATE (Automatic Terrain Extraction) by ERDAs, with the new LPS module for generating high resolution terrain information from multi-stereo imagery (both panchromatic and pansharpened, the latter obtained with Gram–Schmidt to work with the same resolution). Thus, we performed the automatic extraction of cloud points setting some parameters: the overlapping over 90%, the area with min and max altitude (0–800 m) and the smoothing strategy, suitable for the archaeological area. The correlation method used by eATE is the well known Normalized Cross Correlation (NCC) [40], and we set up a correlation threshold between 0.3 and 0.8, getting in output eight iterations in both cases. The comparison between the panchromatic and pansharpened are reported in Table 3.
As it can be inferred from the values of the table, the two points cloud is comparable in terms of both accuracy and points density, and it is therefore impossible to choose the point cloud to be used, and we proceeded with a geometrical comparison of the DEMs, setting up a grid of 1 m. In certain critical areas, where the matching algorithm fails on extracting correlated tie points, it is visible that the panchromatic DEM is better than the pansharpened one. As a demonstration of that, we report, in Figure 8, a comparison of the two DEMs, taking as an example the quarry area, where the computation of the 3D model generates some mistakes.
For a better understanding, we also report the profile extracted from the DEM, where the approximation made for the pansharpened dataset is visible, caused by the lack of information on the rocks composing the hill (see Figure 9). In fact, the highland on the left is very coarse and the saddle on the right created by the rock is more accurate with the panchromatic DEM.

3. Results

Once all the steps of image processing have been performed, all the output products are suitable to be managed within the GIS. First of all, and in line with previous research conducted to evaluate the differences between the DEM production using panchromatic and pansharpened images [10], to produce the cartography of the site, we used the first one, which final DEM have been submitted to a post processing and editing phase. A 3D orthophoto has been further realized using a draping technique, by associating the DEM with the otho-ready pansharpened of the area (see Figure 10).
With the consequent extraction of contour lines, with a step of 2 m, we upgraded the archaeological plans of the sites and create a vector documentation utilized for 3D reconstructions of monuments and ancient cities. Thus, the vectorization of all archaeological remains and traces visible in all multitemporal remote sensing data allowed the creation of new archaeological maps ready for input in a GIS with new data on ancient layout of sites, monuments and roads; in these maps, the contour lines were extracted from DEMs (see Figure 11).
The produced cartographic base is fundamental to arrange the general organization of the structure, the different location of the functional areas and of the archaeological ones and the interrelation between the sites included in the core zone of the park and those located outside but belonging, according to the historical and architectural point of view, to the same archaeological complex.

4. Discussion and Conclusions

The methodology adopted for the case study proved to produce useful updating of the available cartography. The use of nadir and stereo Pleiadés images represents a great aid for the archaeological research since, against a medium expense, they provide a dataset suitable to be used at different scales of representation. Some processing is notwithstanding required. For a visual approach of such wide archaeological areas, the pansharpening procedure is required since it gives a more reliable instrument of interpretation. The Gram–Schmidt method showed the best results and, with a simple operation of filtering, we were able to produce usable maps, whereas the initial brightness did not allow any use. We cannot say the same for the creation of DEM. In fact, even if the same procedure had been used for the stereo-pair, the more reliable DEM was the one produced with the panchromatic dataset. The work presented in these pages opens up new possibilities for the Land of Nineveh, up to now almost unknown and lacking of any kind of spatial information. The purposes of the Archaeological-Environmental Park are to safeguard the cultural landscape related to the Sennacherib’s irrigation complex and to offer to the local population the possibility of enjoying all its cultural, spiritual and social benefits. The region’s heritage, if properly protected and enhanced, can constitute a notable driver of economic and social development by encouraging local and international tourism. The greater economic resources that can be created by new eco-friendly businesses such as those related to tourism and crafts, and the consequent development of small and medium enterprises (SMEs), can raise the society’s standard of living, including in terms of physical and psychophysical health. Moreover, the arrival of foreign tourists in the region can help Iraqi Kurdistan extricate itself from the state of international isolation caused by recent warfare, and lead to new and beneficial cultural exchange and to economic progress. Regarding the boundaries of the Archaeological-Environmental Park, we must keep thinking that we have a unique monumental complex composed of different archaeological areas widespread over a vast territory. Therefore, the sites of Khinis, Jerwan, Maltai, Bandaway or other sites that will be brought to light by the future archaeological investigation have to be considered separately but also in connection with each other, since they all belong to the same complex that, for its historical, technical and artistic values, has to be preserved in its entirety. Anyway, the vastness of the archaeological complex, which is extended over a territory of almost 3.500 km 2 , suggests an operative strategy tended to do so that the proposal is realistically evaluated by the UNESCO World Heritage Committee. Therefore, the boundaries of the Archaeological and Environmental Park are determined by the need to find an area small enough to be controlled, but full of important ancient structures. Under these conditions, it seems natural to think of the area that contains the bas-reliefs of Khinis and the great aqueduct of Jerwan as the basic elements of the park. As a matter of fact, we have to remember that the realization of a WHTL has to be accompanied by the management project requested by UNESCO. In this frame, the planning of an Archaeological Park will allow the creation of a decision-making structure able to manage the maintenance, the monitoring and the conservation of those sites located in its territory, but, at the same time, to start the necessary connections with the sites located outside the Park and belonging to the same system of canalization, bas-reliefs and inscriptions. A Museum Center provided with modern multimedia technologies will allow management not only of the archaeological areas of the Park, but also all those sites located at great distances that will be possible to study and visualize both in their specific location and related to the entire complex of Sennacherib. To achieve such ambitious goals, in the future, we are planning to integrate different data at different scale (drone acquisitions have been already done in different areas) within a unique and complex GIS (preliminary achievements of this phase of the work are showed in Figure 12), containing the whole graphic project of the Archaeological and Environmental Park and, at the same time, representing the managing project required by UNESCO for any site inscribed in the World Heritage List.
The GIS, which will have different levels of access for scholars and tourists, will allow the organization of the different areas of the Park and the visualization of documents (photos, videos, 3D models, AutoCAD drawings) of the archaeological structures and of the related paths to reach them, the visualization of the progress of the archaeological investigation and of the architectural and surface restoration, management of the technical structures of the park and of the tourist flow, valorisation of the site through the diffusion on the internet of a web site and of all the information on the cultural and social initiatives of the Centre. By means of mobile equipment [41], the GIS will allow tourists to move around the territory following pre-established itineraries.

Acknowledgments

The authors would like to thank Daniele Morandi Bonacossi of Udine University for involving the working team in the project. We also thank the students of Universitá Politecnica delle Marche for their work on the data processing conducted for the Master’s Thesis (Carloni Soledad, Molinelli Michele, Dimitriou Anthoura, Pagnanelli Matteo). The authors also thank Planetek S.R.L. enterprise for providing satellite images and the temporary software licence.

Author Contributions

All the activities of the research work were led by R.O. The introduction section has been written by R.P. and E.S.M. (general overview and the state-of the art study) and R.O. and F.C. (description of the project historical framework). Data processing, computation and results were performed by R.P., E.S.M and C.A.B. Finally, discussion and conclusions have been outlined by R.P. and E.S.M. (technical part), and R.O. and F.C. (perspective outlook). All authors have reviewed and approved the content of this paper.

Conflicts of Interest

The authors declare no conflict of interest.

Abbreviations

The following abbreviations are used in this manuscript:
RSRemote Sensing
DEMDigital Elevation Model
SRTMShuttle Radar Topography Mission
GISGeographical Information System
VHRVery High Resolution
HVSHue Value Saturation
G–SGram–Schmidt
PCPrincipal Components
GCPGround Control Point
WHTLWorld Heritage Tentative List
GNSSGlobal Navigation Satellite System

References

  1. Malinverni, E.; Barbaro, C.C.; Pierdicca, R.; Bozzi, C.; Tassetti, A. UAV surveying for a complete mapping and documentation of archaeological findings. The early Neolithic site of Portonovo. Int. Arch. Photogramm. Remote Sens. Spat. Inf. Sci. 2016, 41, 1149–1155. [Google Scholar] [CrossRef]
  2. Laet, V.D.; Paulissen, E.; Waelkens, M. Methods for the extraction of archaeological features from very high-resolution Ikonos-2 remote sensing imagery, Hisar (southwest Turkey). J. Archaeol. Sci. 2007, 34, 830–841. [Google Scholar] [CrossRef]
  3. Forte, M.; Campana, S. Digital Methods and Remote Sensing in Archaeology: Archaeology in the Age of Sensing; Springer: Berlin, Germany, 2017. [Google Scholar]
  4. Hadjimitsis, D.G.; Agapiou, A.; Themistocleous, K.; Alexakis, D.D.; Sarris, A. Remote sensing for archaeological applications: Management, documentation and monitoring. In Remote Sensing of Environment-Integrated Approaches; Hadjimitsis, D.G., Ed.; InTech: Rijeka, Croatia, 2013. [Google Scholar]
  5. Orlando, P.; Villa, B.D. Remote sensing applications in archaeology. Arch. Calcolatori 2011, 22, 147–168. [Google Scholar]
  6. Castrianni, L.; Giacomo, G.D.; Ditaranto, I.; Scardozzi, G. High resolution satellite ortho-images for archaeological research: Different methods and experiences in the Near and Middle East. Adv. Geosci. 2010, 24, 97–110. [Google Scholar] [CrossRef] [Green Version]
  7. Malinverni, E.S.; Tassetti, A.N.; Mancini, A.; Zingaretti, P.; Frontoni, E.; Bernardini, A. Hybrid object-based approach for land use/land cover mapping using high spatial resolution imagery. Int. J. Geogr. Inf. Sci. 2011, 25, 1025–1043. [Google Scholar] [CrossRef]
  8. Parcak, S.H. Satellite Remote Sensing for Archaeology; Routledge: Abingdon, UK, 2009. [Google Scholar]
  9. Di Giacomo, G.; Scardozzi, G. Multitemporal high-resolution satellite images for the study and monitoring of an ancient Mesopotamian city and its surrounding landscape: The case of Ur. Int. J. Geophys. 2012, 2012. [Google Scholar] [CrossRef]
  10. Malinverni, E. DEM automatic extraction on Rio de Janeiro from WV2 stereo pair images. IOP Conf. Ser. Earth Environ. Sci. 2014, 18. [Google Scholar] [CrossRef]
  11. Krauß, T.; Lehner, M.; Reinartz, P. Generation of coarse 3D models of urban areas from high resolution stereo satellite images. Int. Arch. Photogramm. Remote Sens. 2008, 37, 1091–1098. [Google Scholar]
  12. Perko, R.; Raggam, H.; Gutjahr, K.; Schardt, M. Advanced DTM generation from very high resolution satellite stereo images. ISPRS Ann. Photogramm. Remote Sens. Spat. Inf. Sci. 2015, 2. [Google Scholar] [CrossRef]
  13. Shean, D.E.; Alexandrov, O.; Moratto, Z.M.; Smith, B.E.; Joughin, I.R.; Porter, C.; Morin, P. An automated, open-source pipeline for mass production of digital elevation models (DEMs) from very-high-resolution commercial stereo satellite imagery. ISPRS J. Photogramm. Remote Sens. 2016, 116, 101–117. [Google Scholar] [CrossRef]
  14. Casana, J.; Cothren, J. Stereo analysis, DEM extraction and orthorectification of CORONA satellite imagery: Archaeological applications from the Near East. Antiquity 2008, 82, 732–749. [Google Scholar] [CrossRef]
  15. Berthier, E.; Vincent, C.; Magnússon, E.; Gunnlaugsson, Á.; Pitte, P.; Le Meur, E.; Masiokas, M.; Ruiz, L.; Pálsson, F.; Belart, J.; et al. Glacier topography and elevation changes derived from Pléiades sub-meter stereo images. Cryosphere 2014, 8, 2275–2291. [Google Scholar] [CrossRef]
  16. Bagnardi, M.; González, P.J.; Hooper, A. High-resolution digital elevation model from tri-stereo Pleiades-1 satellite imagery for lava flow volume estimates at Fogo Volcano. Geophys. Res. Lett. 2016, 43, 6267–6275. [Google Scholar] [CrossRef]
  17. Parmegiani, N.; Poscolieri, M. DEM data processing for a landscape archaeology analysis (Lake Sevan-Armenia). Int. Arch. Photogramm. Remote Sens. Spat. Inf. Sci. 2003, 34, 255–258. [Google Scholar]
  18. Vandenbulcke, A.; Stal, C.; Lonneville, B.; Bourgeois, J.; De Wulf, A. Using 3D modelling in the valley of Turu Alty (Siberia, Russia) for research and conservational purposes. In Proceedings of the 8th International Congress on Archaeology, Computer Graphics, Cultural Heritage and Innovation ’ARQUEOLÓGICA 2.0’, Valencia, Spain, 5–7 September 2016; Lerma, J.L., Cabrelles, M., Eds.; Universitat Politécnica de Valéncia: Valencia, Spain, 2016; pp. 408–411. [Google Scholar]
  19. Nasir, S.; Iqbal, I.A.; Ali, Z.; Shahzad, A. Accuracy assessment of digital elevation model generated from pleiades tri stereo-pair. In Proceedings of the IEEE 7th International Conference on Recent Advances in Space Technologies (RAST), Istanbul, Turkey, 16–19 June 2015; pp. 193–197. [Google Scholar]
  20. Sofia, G.; Bailly, J.S.; Chehata, N.; Tarolli, P.; Levavasseur, F. Comparison of Pleiades and LiDAR Digital Elevation Models for terraces detection in farmlands. IEEE J. Sel. Top. Appl. Earth Obs. Remote Sens. 2016, 9, 1567–1576. [Google Scholar] [CrossRef]
  21. Gleyzes, M.A.; Perret, L.; Kubik, P. Pleiades system architecture and main performances. Int. Arch. Photogramm. Remote Sens. Spat. Inf. Sci. 2012, 39. [Google Scholar] [CrossRef]
  22. Bernard, M.; Decluseau, D.; Gabet, L.; Nonin, P. 3D capabilities of Pleiades satellite. Int. Arch. Photogramm. Remote Sens. Spat. Inf. Sci. 2012, 39, 553–557. [Google Scholar] [CrossRef]
  23. Cantou, J.; Maillet, G.; Flamanc, D.; Buissart, H. Preparing the use of Pleiades images for mapping purposes: Preliminary assessments at IGN-France. Int. Arch. Photogramme. Remote Sens. 2006, 36. [Google Scholar]
  24. Šedina, J.; Pavelka, K.; Housarová, E. Archaeological documentation of a defunct Iraqi Town. Int. Arch. Photogramm. Remote Sens. Spat. Inf. Sci. 2016, XLI-B1, 1031–1035. [Google Scholar]
  25. Asăndulesei, A. Inside a Cucuteni Settlement: Remote Sensing Techniques for Documenting an Unexplored Eneolithic Site from Northeastern Romania. Remote Sens. 2017, 9, 41. [Google Scholar] [CrossRef]
  26. Jiang, S.; Jiang, W.; Huang, W.; Yang, L. UAV-Based Oblique Photogrammetry for Outdoor Data Acquisition and Offsite Visual Inspection of Transmission Line. Remote Sens. 2017, 9, 278. [Google Scholar] [CrossRef]
  27. Sonnemann, T.F.; Ulloa Hung, J.; Hofman, C.L. Mapping Indigenous Settlement Topography in the Caribbean Using Drones. Remote Sens. 2016, 8, 791. [Google Scholar] [CrossRef]
  28. Harrower, M.J. Geographic Information Systems (GIS) hydrological modeling in archaeology: An example from the origins of irrigation in Southwest Arabia (Yemen). J. Archaeol. Sci. 2010, 37, 1447–1452. [Google Scholar] [CrossRef]
  29. Parcak, S.H. GIS, Remote Sensing, and Landscape Archaeology; Oxford Handbooks Online; Oxford University Press: New York, NY, USA, 2017. [Google Scholar]
  30. Campana, S. Ikonos-2 multispectral satellite imagery to the study of archaeological landscapes: An integrated multi-sensor approach in combination with “traditional” methods. In Proceedings of the 30th Conference CAA, Heraklion, Greece, 2–6 April 2002; pp. 2–6. [Google Scholar]
  31. Pierdicca, R.; Malinverni, E.; Clini, P.; Mancini, A.; Bozzi, C.; Nespeca, R. Development of a GIS environment for archaeological multipurpose applications: The Fano historic centre. In Proceedings of the XIII International Forum Le Vie dei Mercanti, Lecce, Italy, 11–13 June 2015; pp. 588–597. [Google Scholar]
  32. Ur, J. Sennacherib’s northern Assyrian canals: New Insights from Satellite Imagery and Aerial Photography. Iraq 2005, 67, 317–345. [Google Scholar] [CrossRef]
  33. Bagg, A.M. Irrigation in northern Mesopotamia: Water for the Assyrian Capitals (12th–7th centuries BC). Irrig. Drain. Syst. 2000, 14, 301–324. [Google Scholar] [CrossRef]
  34. Bachmann, W. Felsreliefs in Assyrien: Bawian, Maltai und Gundük; Hinrichs: Leipzig, Germany, 1927. [Google Scholar]
  35. Jacobsen, T.; Lloyd, S. Sennacherib’s Aqueduct at Jerwan; University of Chicago Press: Chicago, IL, USA, 1935; Volume 24. [Google Scholar]
  36. Orazi, R.; Colosi, F. Archaeological Environmental Park of Sennacherib’s irrigation system (Iraqi Kurdistan). In Heritage and Technology. Mind, Knowledge, Experience, Proceedings of the Le vie dei Mercanti, XIII Forum Internazionale di Studi, Aversa, Capri, Italy, 11–13 June 2015; Gabardella, C., Ed.; Consiglio Nazionale Delle Ricerche: Roma, Italy, 2015; pp. 2021–2030. [Google Scholar]
  37. Lasaponara, R.; Masini, N. Pan-sharpening techniques to enhance archaeological marks: An overview. In Satellite Remote Sensing; Lasaponara, R., Masini, N., Eds.; Springer: Cham, Switzerland, 2012; pp. 87–109. [Google Scholar]
  38. Lasaponara, R.; Masini, N. Satellite Remote Sensing: A New Tool for Archaeology; Springer: Cham, Switzerland, 2012; Volume 16. [Google Scholar]
  39. Manakos, I.; Kalaitzidis, C. Imagin [e, G] Europe: Proceedings of the 29th Symposium of the European Association of Remote Sensing Laboratories, Chania, Greece; IOS Press: Amsterdam, The Netherlands, 2010. [Google Scholar]
  40. Liua, C.; He, G.J. Auto-matching algoritmh for Remote Sensing images. In Proceedings of the 4th International Conference on GEographic Object Based Image Analysis (GEOBIA), Rio de Janeiro, Brazil, 7–9 May 2012; p. 248. [Google Scholar]
  41. Pierdicca, R.; Frontoni, E.; Zingaretti, P.; Malinverni, E.S.; Colosi, F.; Orazi, R. Making visible the invisible. Augmented reality visualization for 3D reconstructions of archaeological sites. In Proceedings of the International Conference on Augmented and Virtual Reality, Ugento, Italy, 12–15 June 2016; Springer: Cham, Switzerland, 2015; pp. 25–37. [Google Scholar]
Figure 1. The borders of the “Land of Nineveh” in Iraqi Kurdistan (red line). The red circle highlights the area of Khinis, one of the areas of the Archaeological Park, subject of this case study.
Geosciences 07 00080 g001
Figure 2. On the left: the borders of the entire Archaeological Park with the core (in red) buffer zones (in green) and with highlighted Khinis and Jerwan areas. The upper right side represents the borders of the Khinis area, while, in the lower right side, a picture of the area is reported.
Geosciences 07 00080 g002
Figure 3. A view of the Khinis’ rock. On the left, the rider’s panel is the great bas-relief and, on the top, many different niches with Sennacherib’s inscriptions.
Geosciences 07 00080 g003
Figure 4. The input images arising from Pleiadés. Image (a) represents the panchromatic and multispectral original images (northern part); and (b) the pansharpened one. The red rectangle indicates a quarry inside the Khinis area, particularly important for the project; this subset of the image was studied due to its high brightness.
Geosciences 07 00080 g004
Figure 5. A comparison of the different pansharpening algorithms. The details show the area of the quarry since it is meaningful to evaluate the performances of the test. (a) HSV; (b) PC; (c) Brovey; (d) G–S.
Geosciences 07 00080 g005
Figure 6. A comparison of the different test performed to achieve a more comprehensible result. The detail shows the area of the quarry that is overexposed and not suitable for a visual interpretation of the area. (a) the original picture; (b,c) pansharpened with failure filtering; (d) optimized pansharpened.
Geosciences 07 00080 g006
Figure 7. Stereo-pair images from Pleiadés. (a,b) panchromatic images; (c,d) multispectral images.
Geosciences 07 00080 g007
Figure 8. Comparison between the two DEMs. (a,b) are the panchromatic and pansharpened DEM, respectively; (c) is the subtraction of (a,b) with highlighted the zones with major defects.
Geosciences 07 00080 g008
Figure 9. The profile of the two DEMs is reported. The red dashed line represents the DEM arising from the panchromatic image, while the blue dashed line represents the pansharpened one.
Geosciences 07 00080 g009
Figure 10. (a) 3D visualization of the DEM with color intensity visualization scaled according to the elevation; (b) the pansharpened image projected on the DEM.
Geosciences 07 00080 g010
Figure 11. (a) shaded visualization of the DEM and (b) the contour lines with 2 m steps.
Geosciences 07 00080 g011
Figure 12. Topographic/archaeological layers have been stored inside a GIS environment. The management of different layers with different information are fundamental for the planning process of the area. The legend shows the different layers represented in the figure.
Geosciences 07 00080 g012
Table 1. Comparison of mean and variance for all images.
OriginalHue, Saturation, ValuePrincipal ComponentsBroveyGram–Schmidt
Mean111,721106.473120.683103.687120.496
Variance66.10769.79564.66765.50665.090
Mean (subset)127.834126.668140.149123.126123.364
Variance (subset)71.07877.91371.78774.43877.037
Table 2. The table reports the comparison of the triangulation results between the panchromatic and pansharpened images. The first one performed using 39 tie points with a standard deviation of around 7 cm, while the second one using 37 tie points with a standard deviation of around 12 cm.
ImagePointsIterationsWeighted Std Error (cm)Residuals Max ValueResiduals Min Value
Panchromatic3920.0670.4540.001
Pansharpened3720.1260.4240.009
Table 3. Synthesis of the orientation residual after the optimization.
ImageCheck PointsStandard DeviationRoot Mean Square ErrorMatched PointsOutput PointsMatching Quality
Panchromatic180.5870.5936736223440156839Excellent: 92.7%
Good: 7.5%
Pansharpened210.3260.3358590163045195964Excellent: 91.1%
Good: 8.9%

