Ground Stability Monitoring of Undermined and Landslide Prone Areas by Means of Sentinel-1 Multi-Temporal InSAR, Case Study from Slovakia

 , ,
, , 
Abstract
:1. Introduction
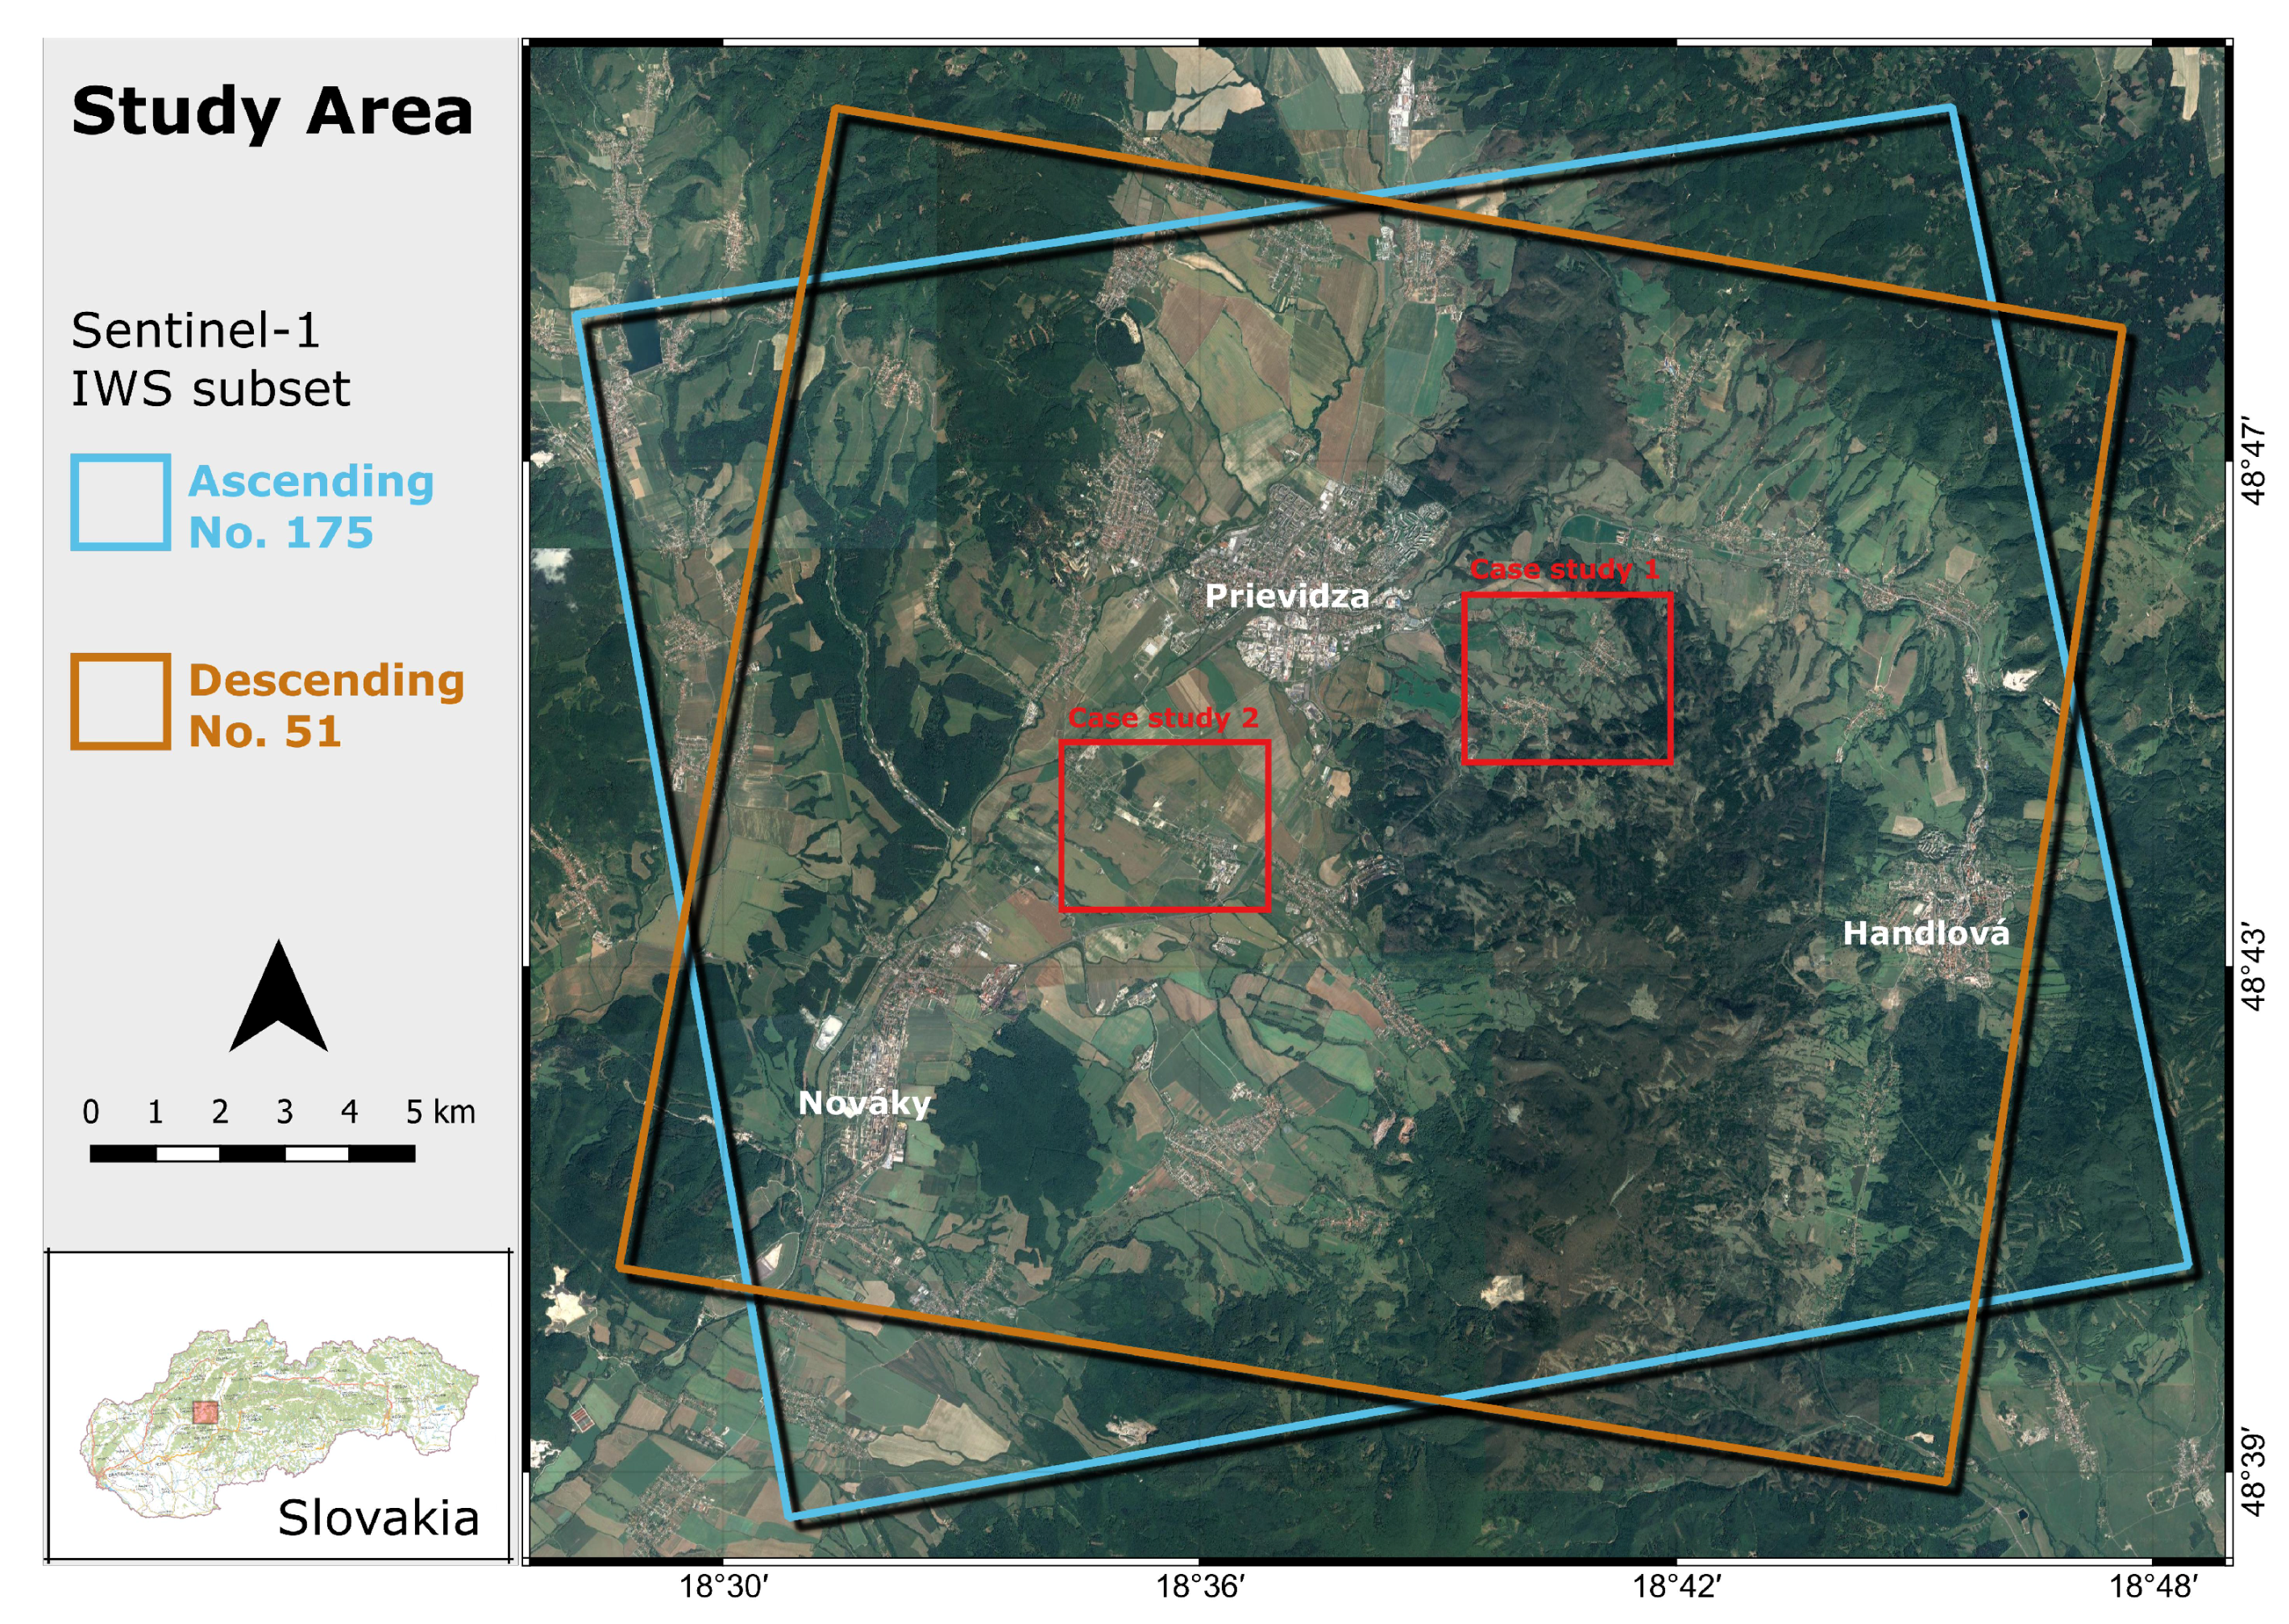
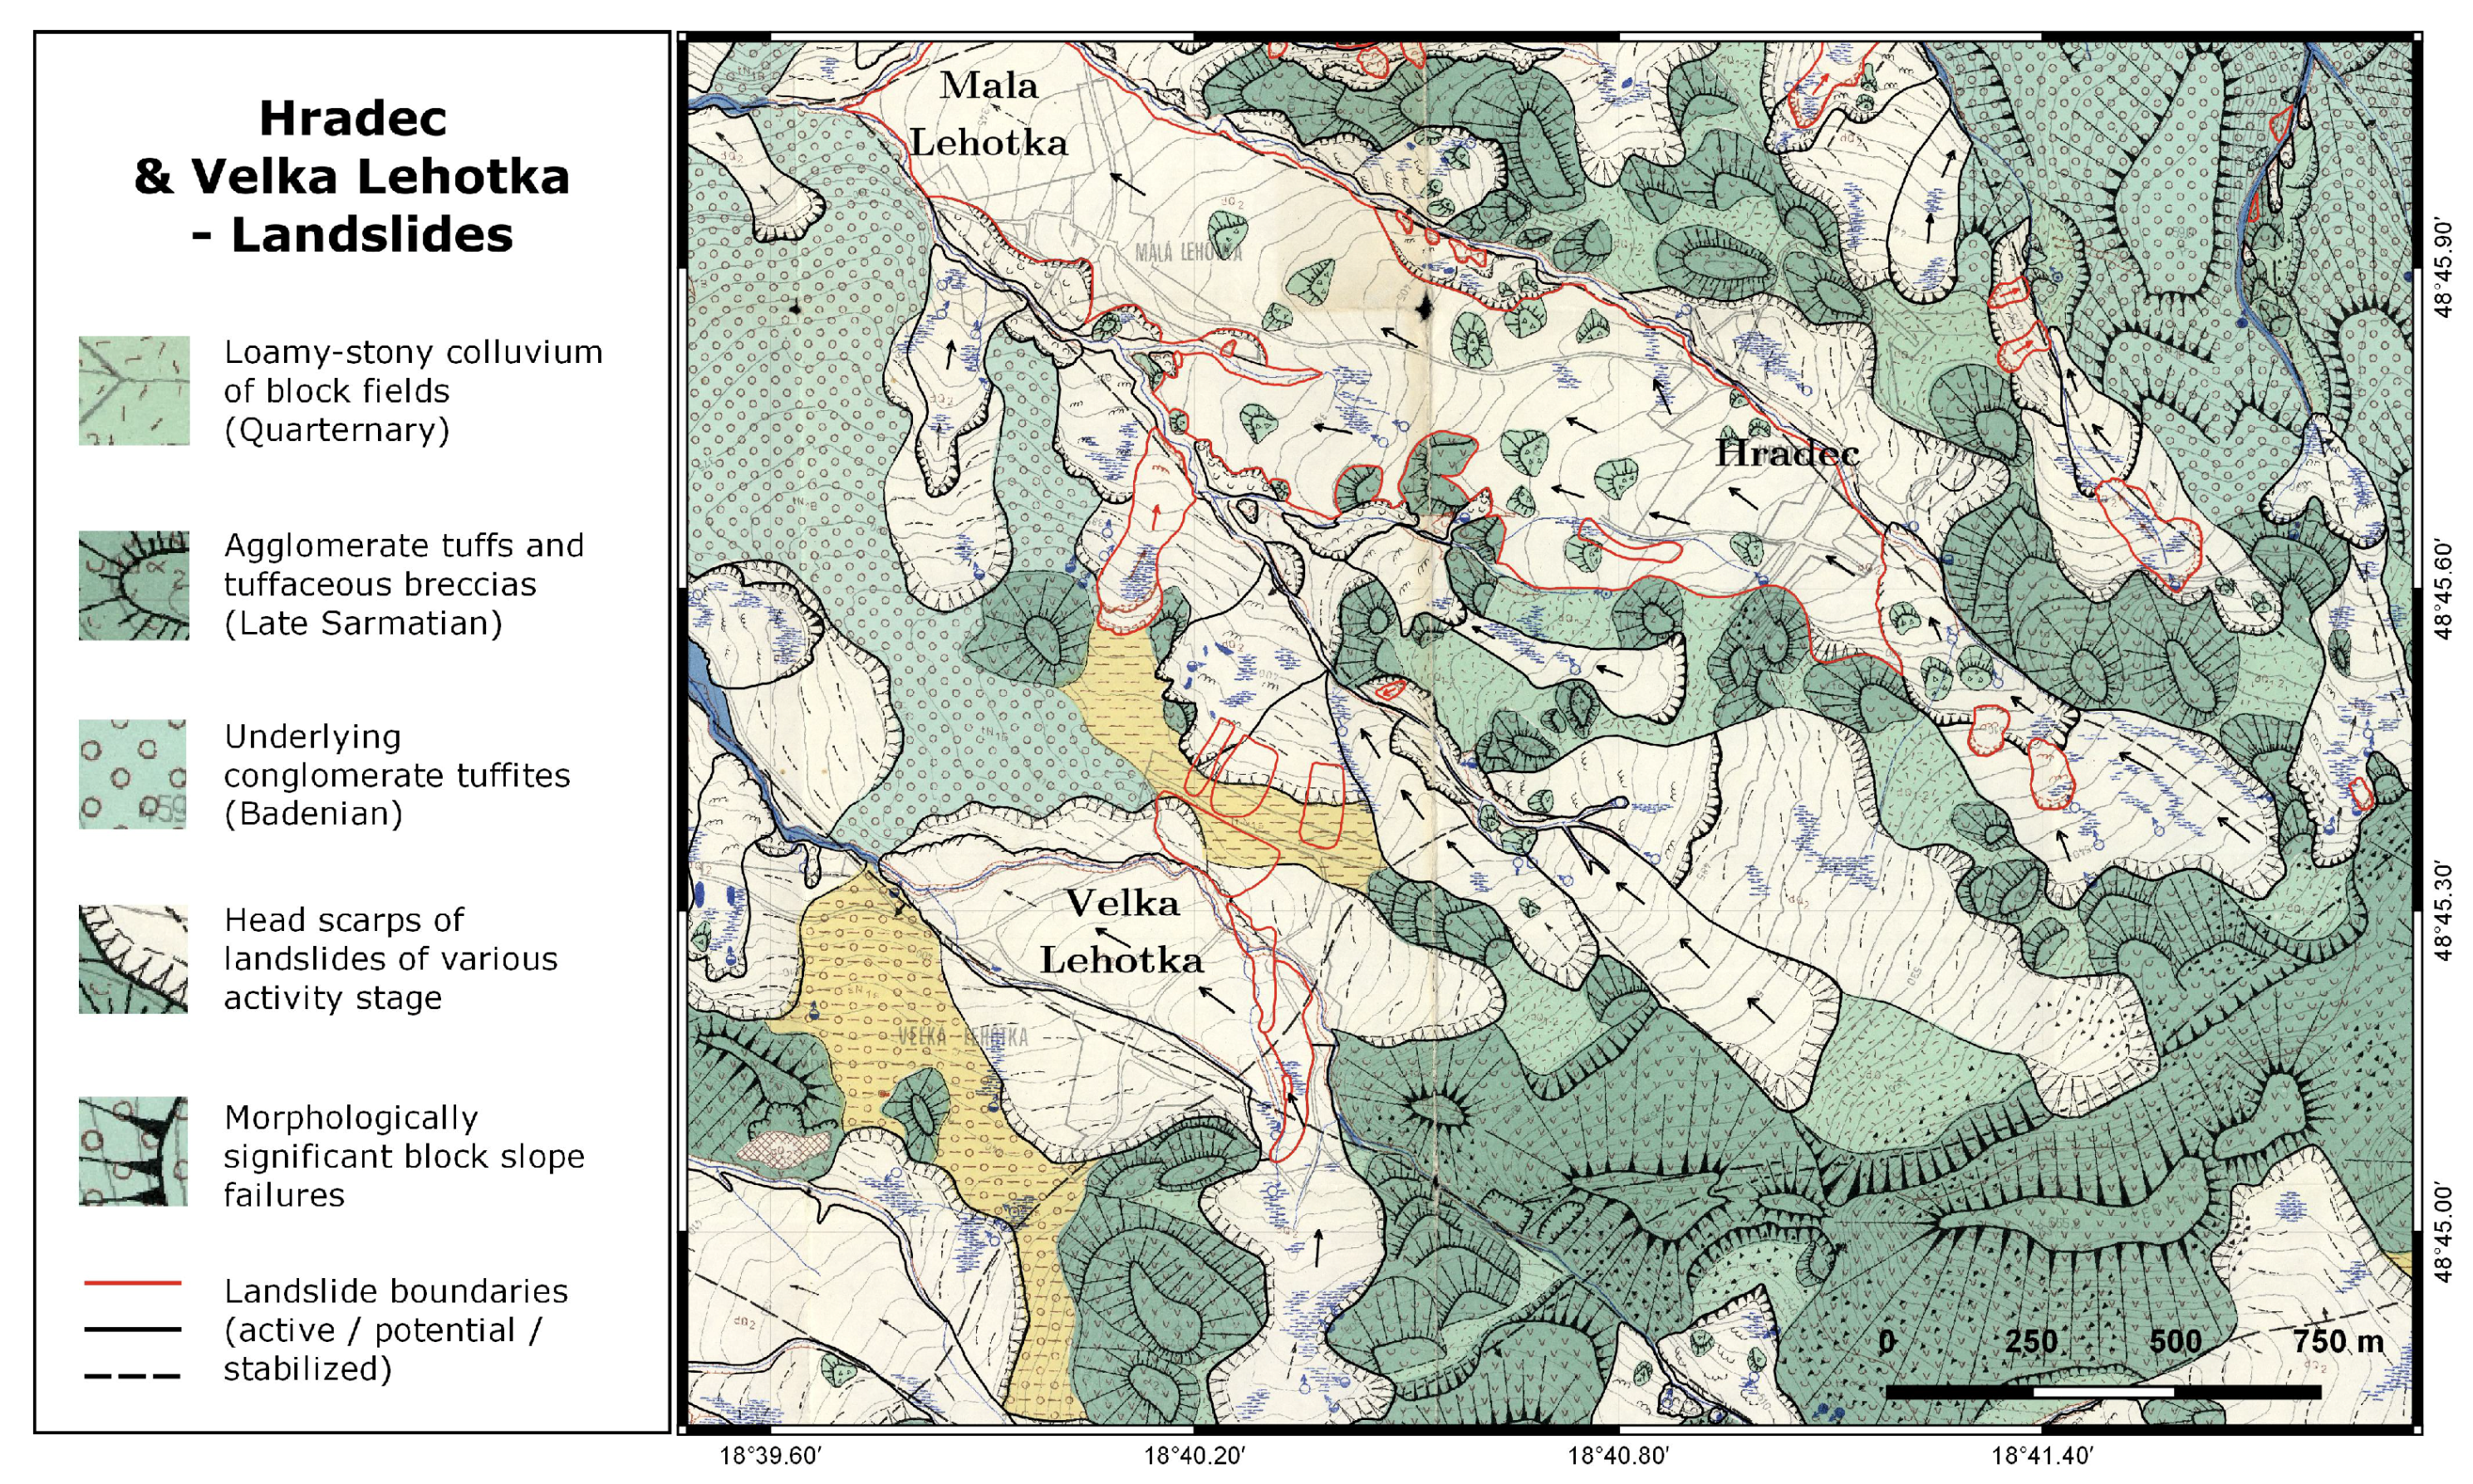
2. Study Area
3. Materials and Methods
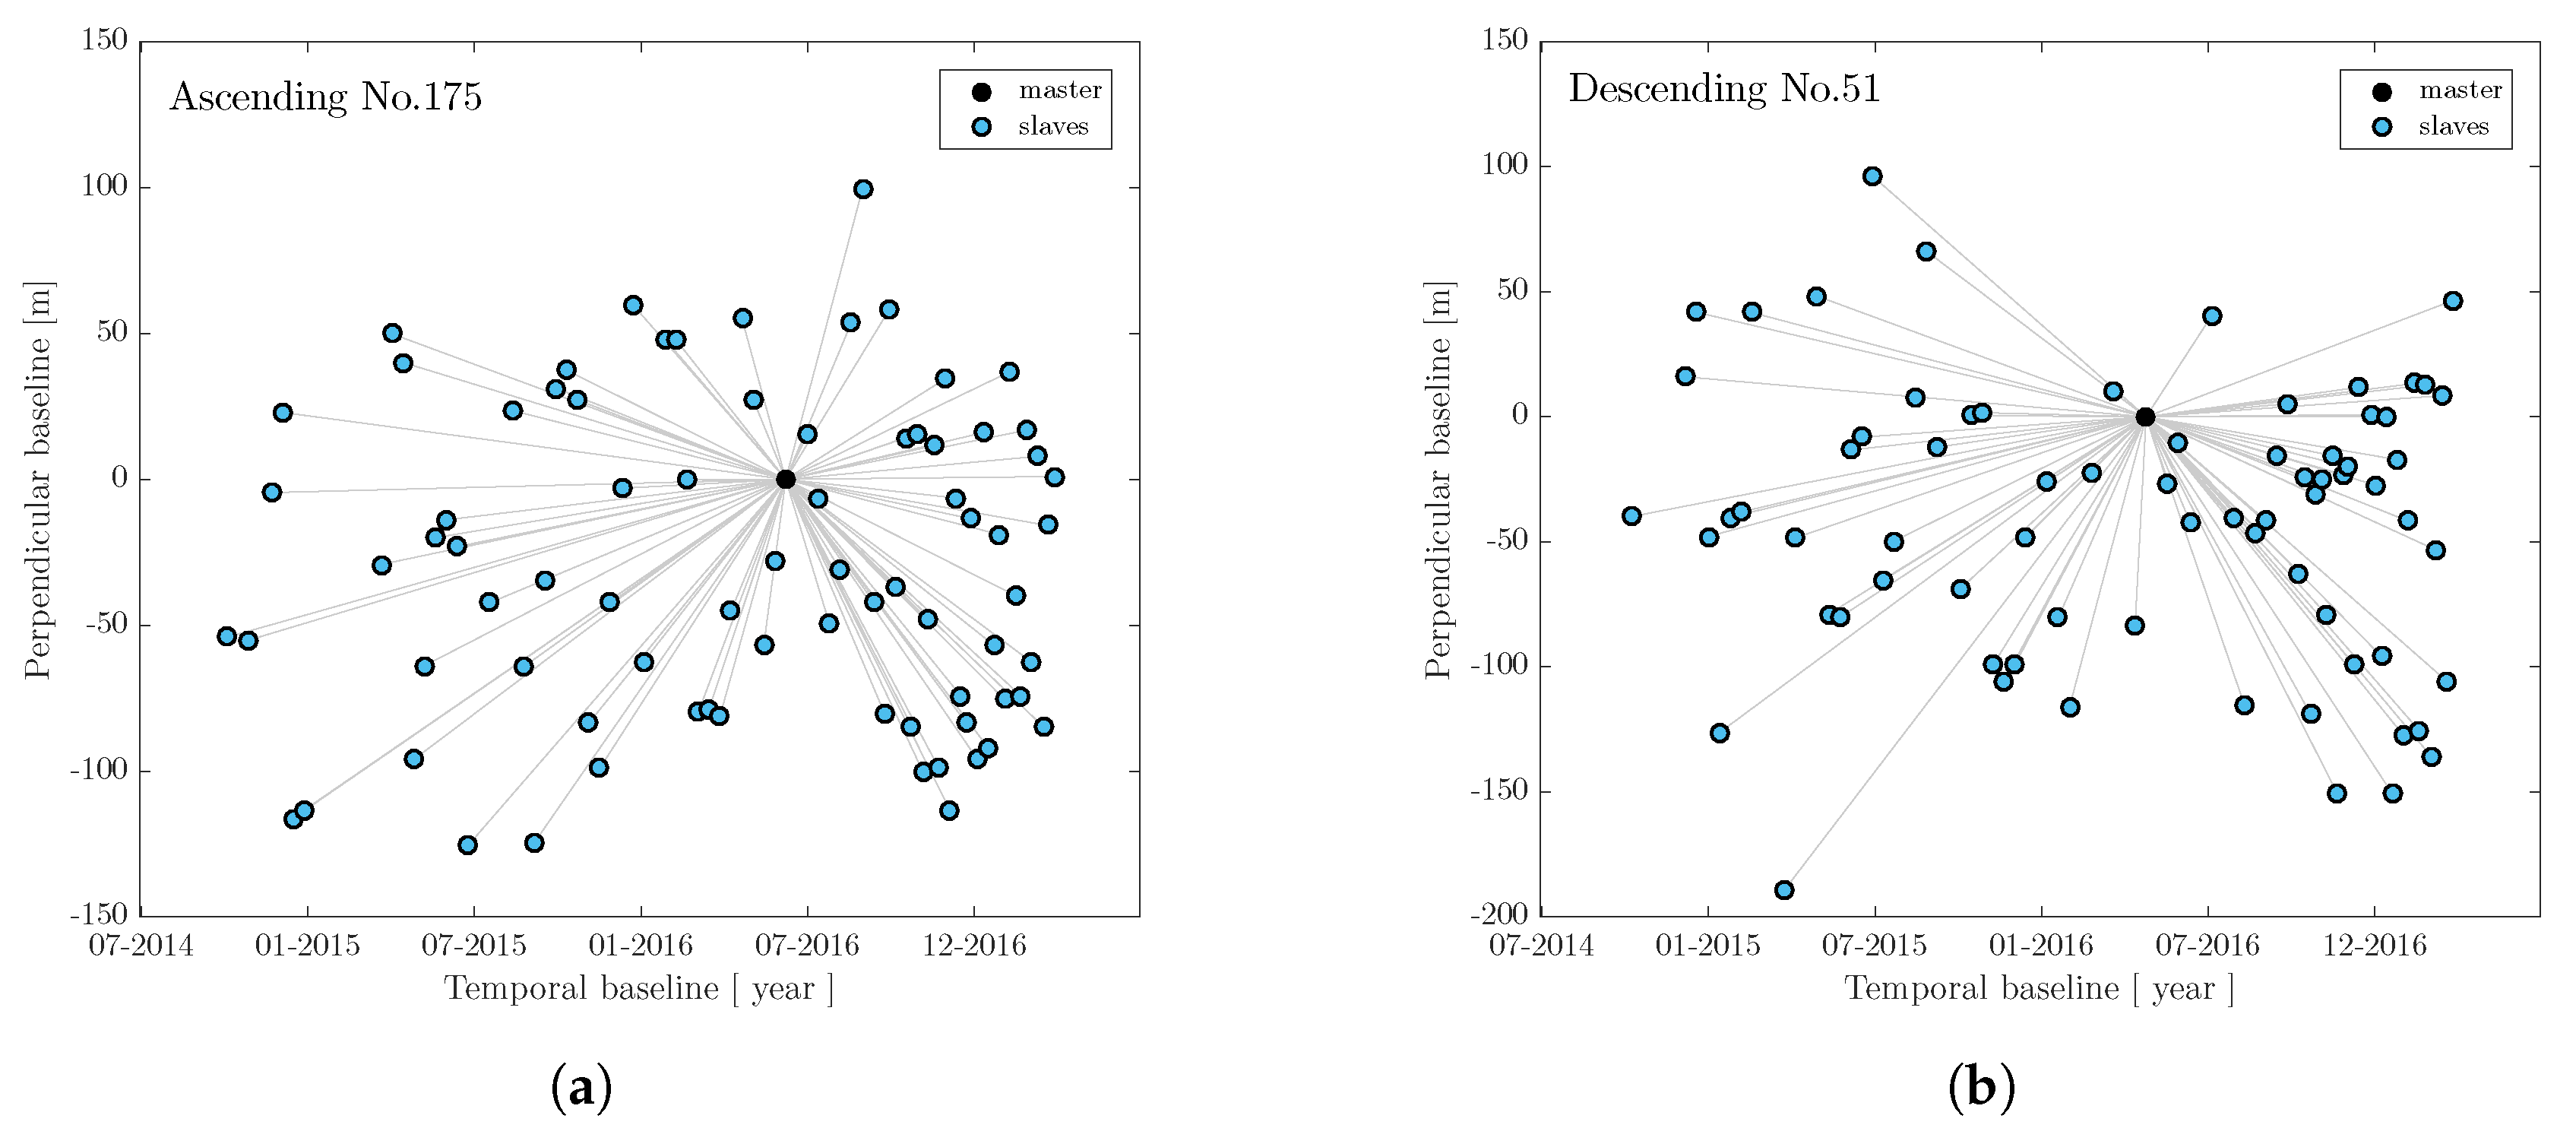
3.1. Sentinel-1 Dataset
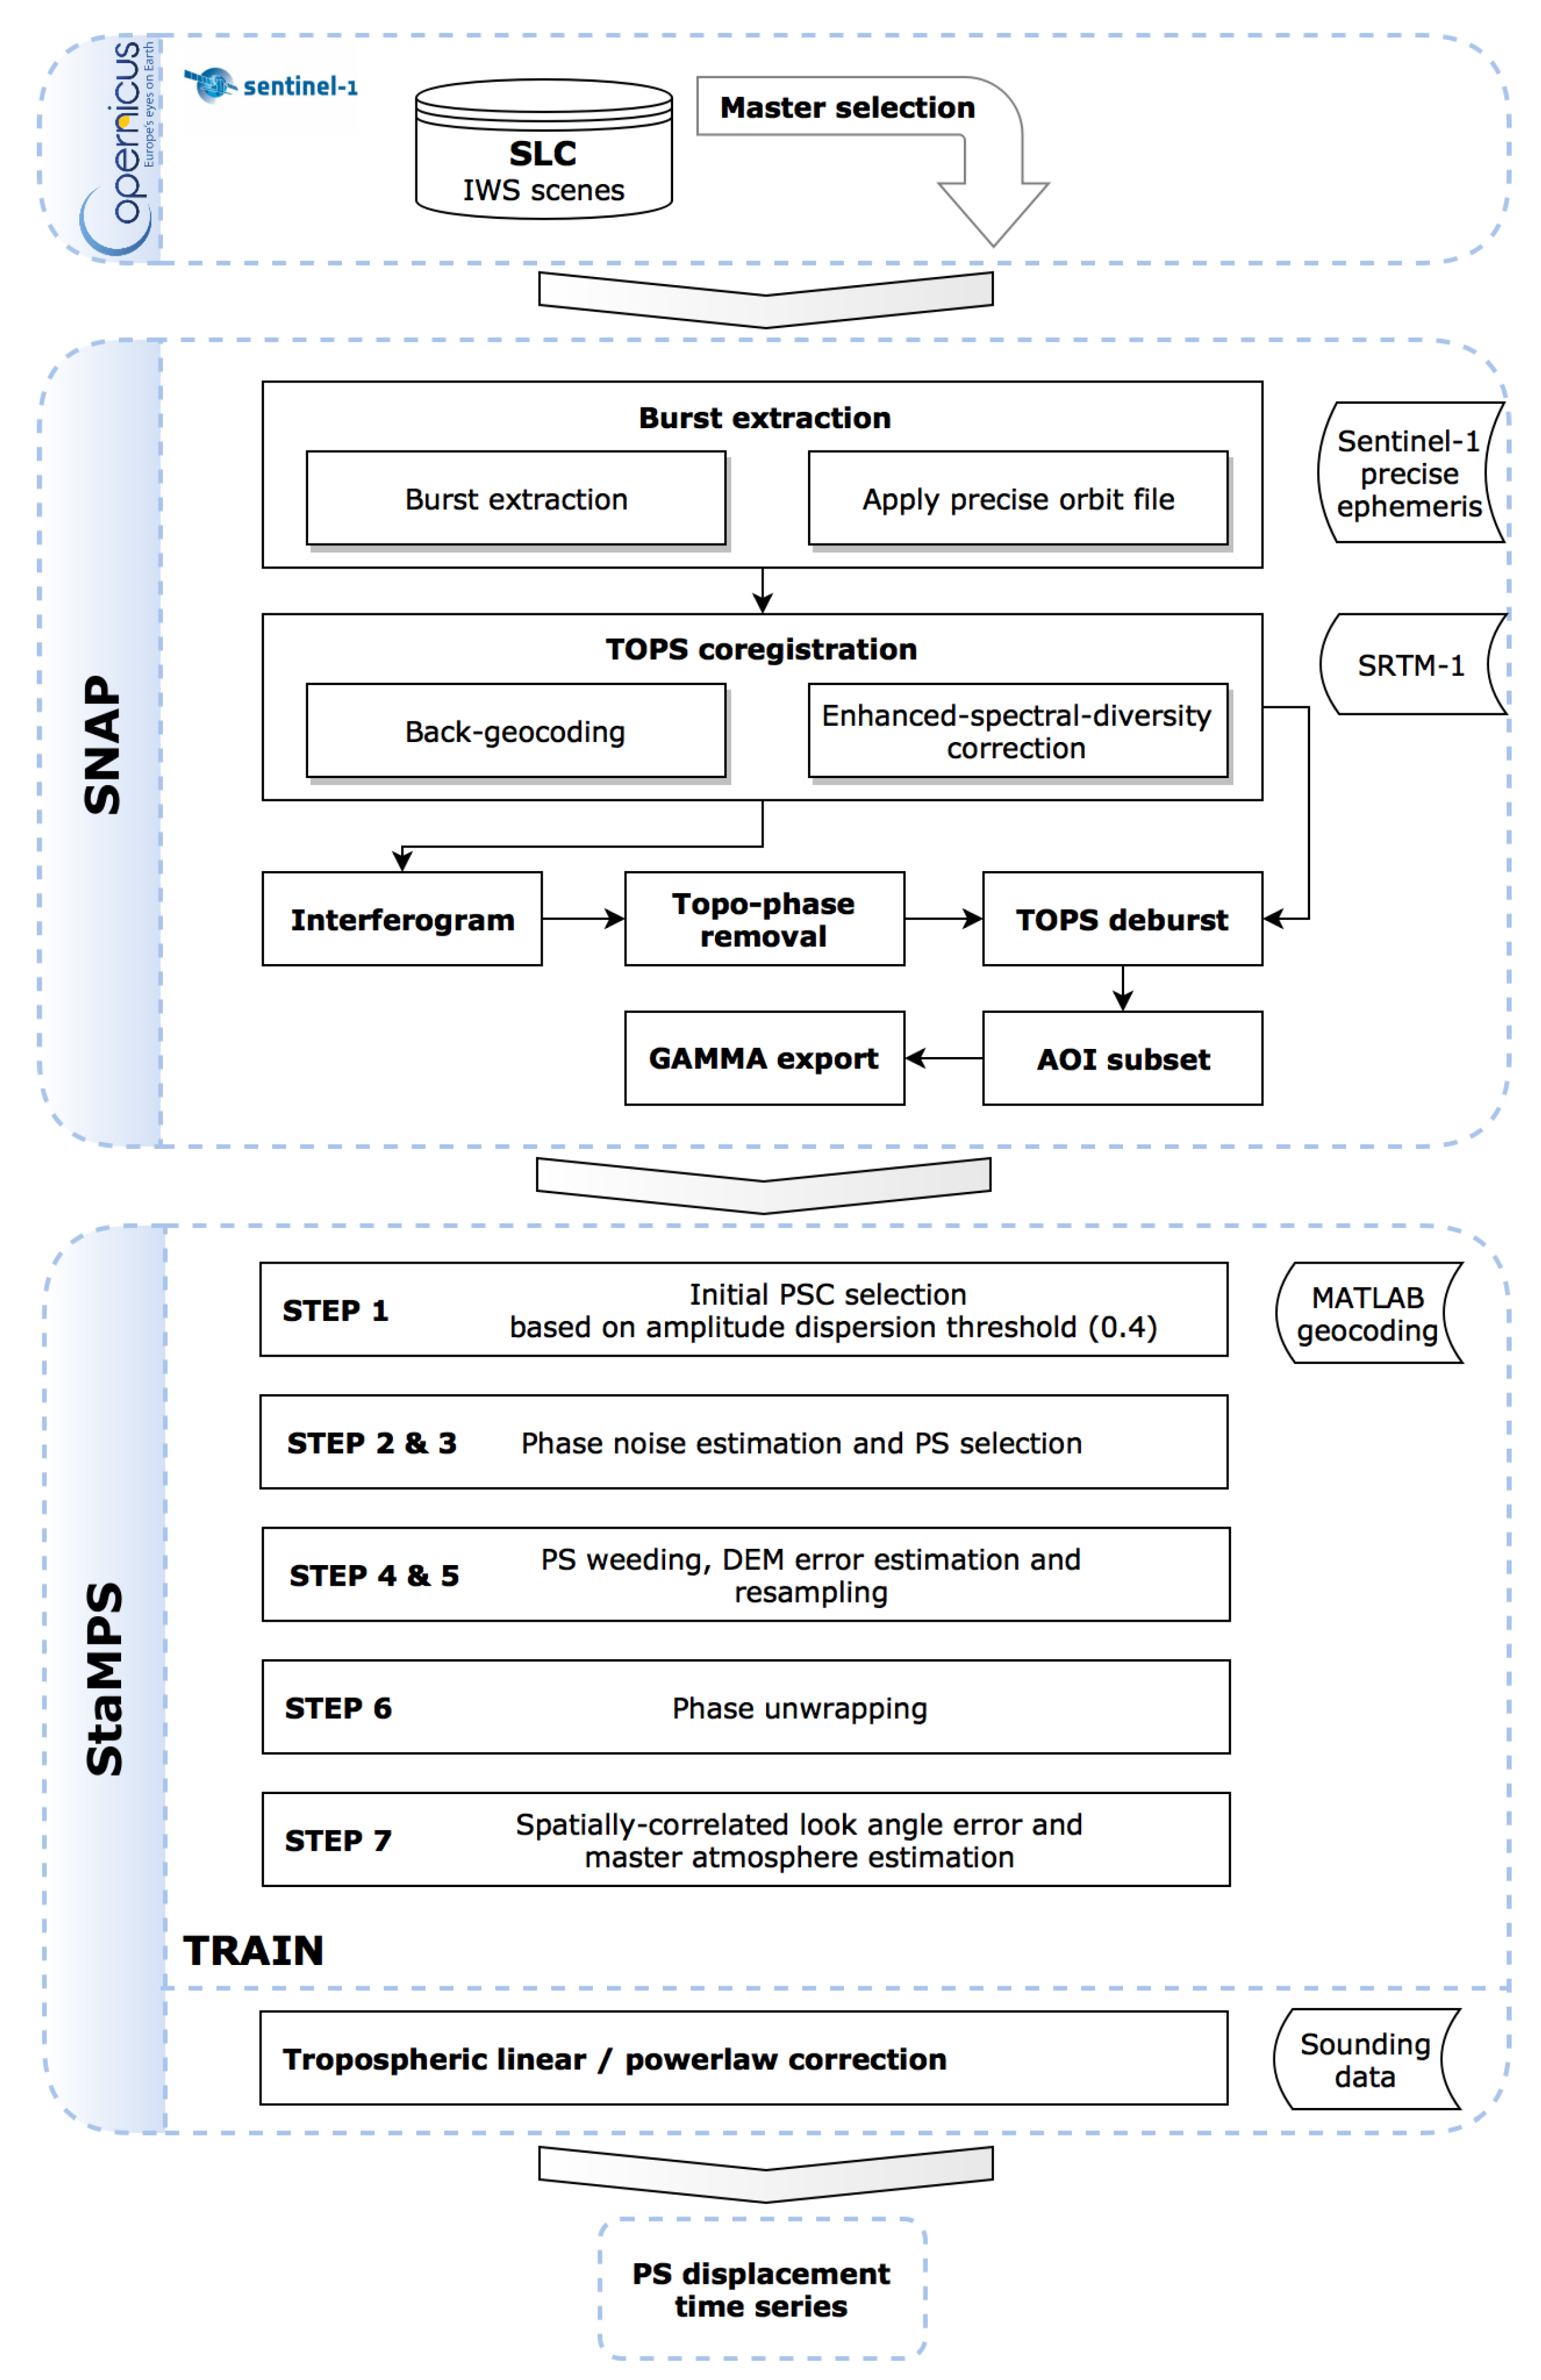
3.2. MT-InSAR Processing
- Apriori PS candidates selection based on the 0.4 amplitude dispersion threshold.
- Iterative phase stability estimation of PS candidates (analyzing their phase noise term).
- PS selection based on ensemble temporal coherence in a probabilistic fashion.
- Side-lobes elimination.
- Elimination of phase contribution due to residual topography (DEM error).
- 3D phase unwrapping.
- Estimation of spatially-correlated nuisance terms (atmosphere and orbital phase contributions).
4. Results and Discussion
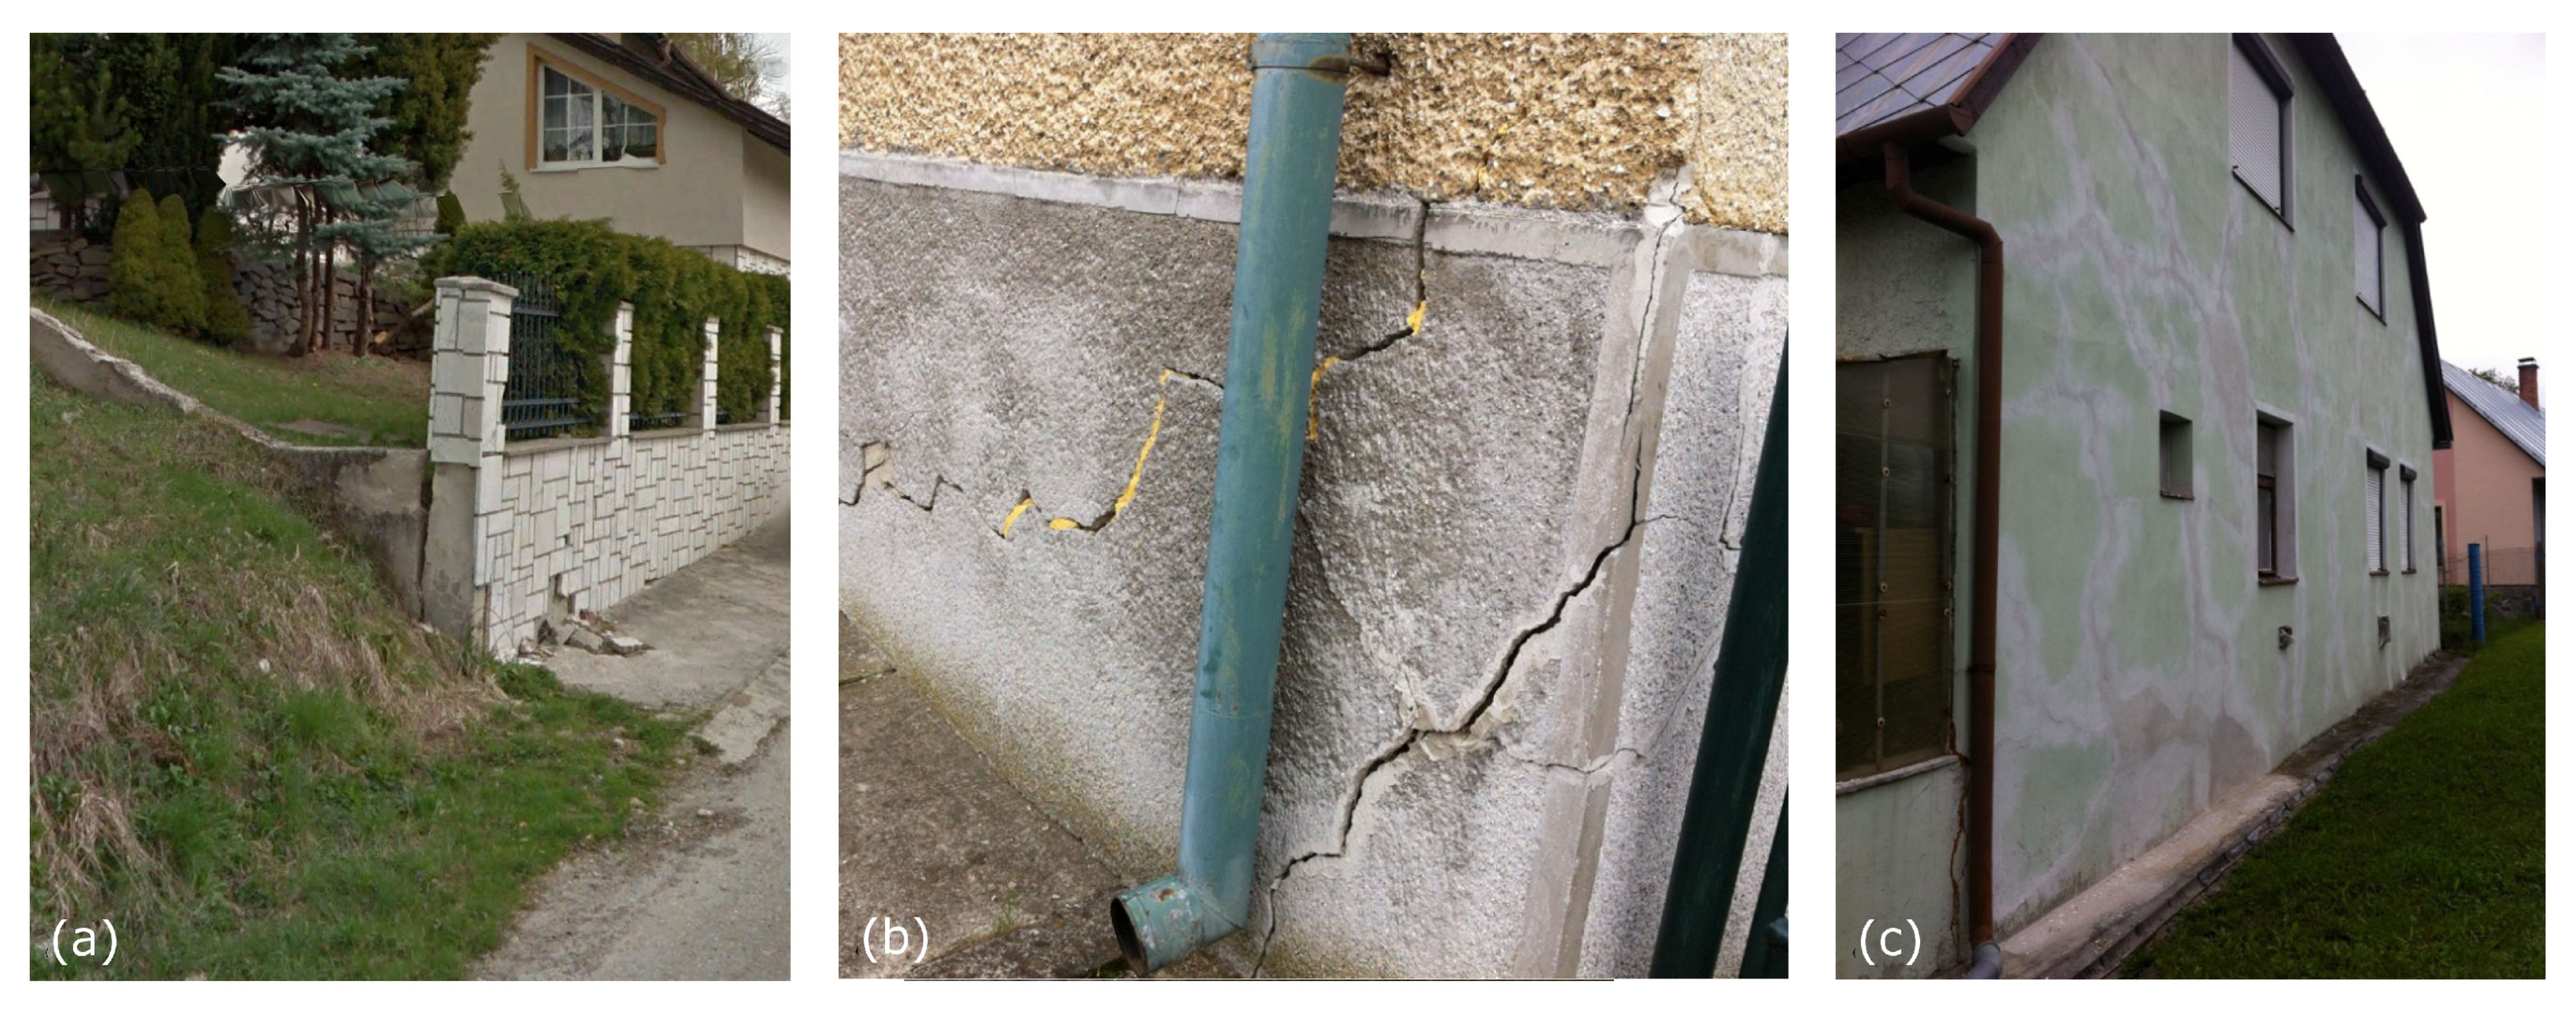
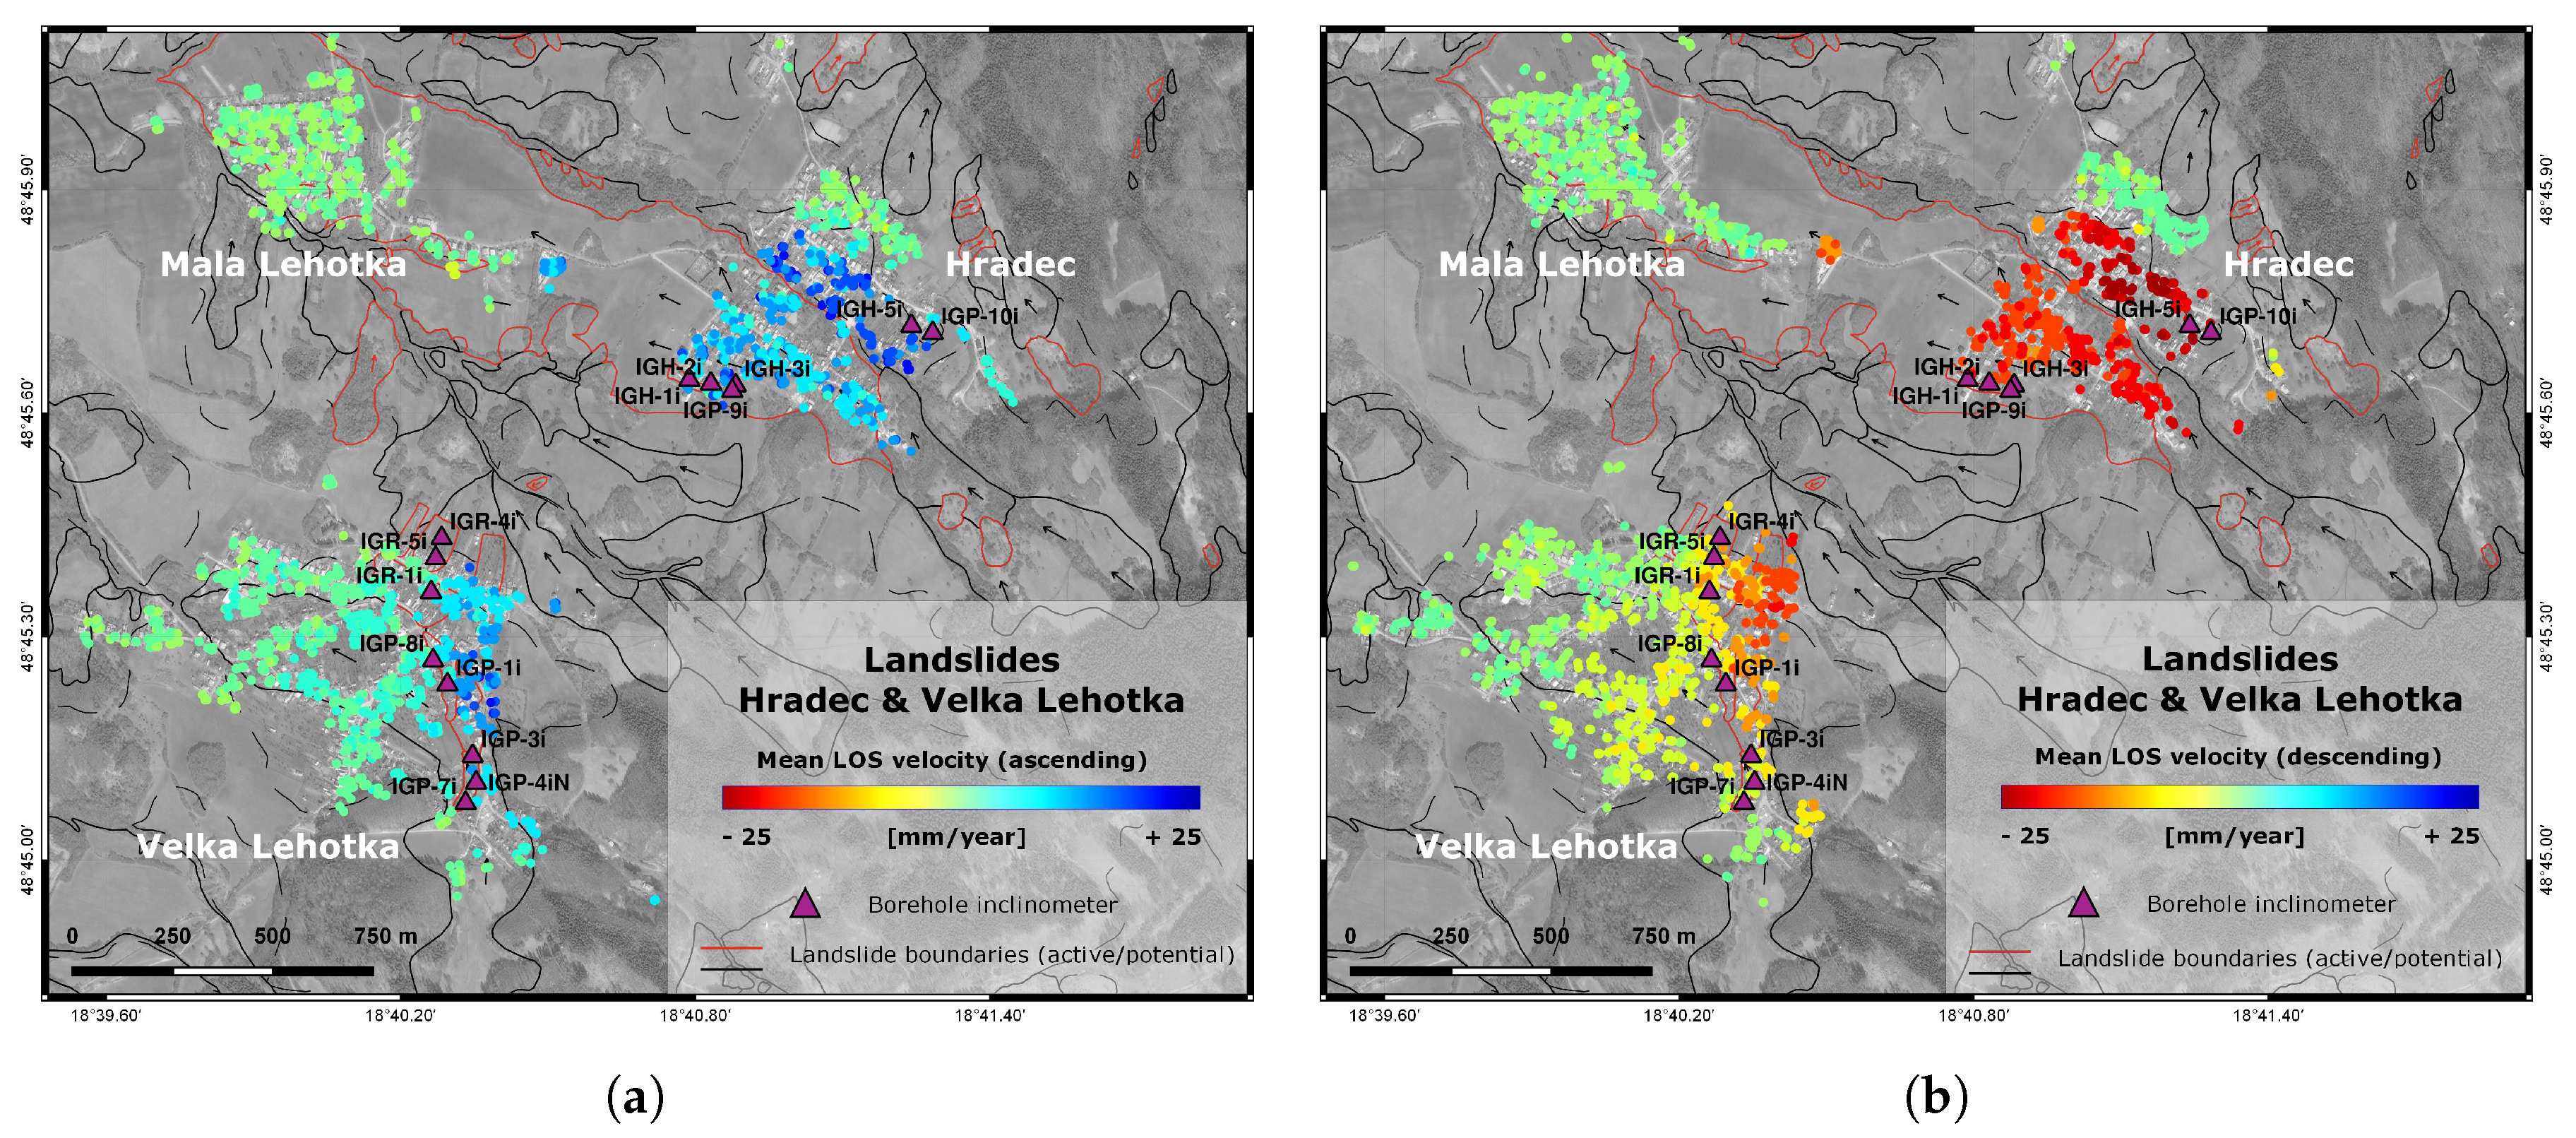
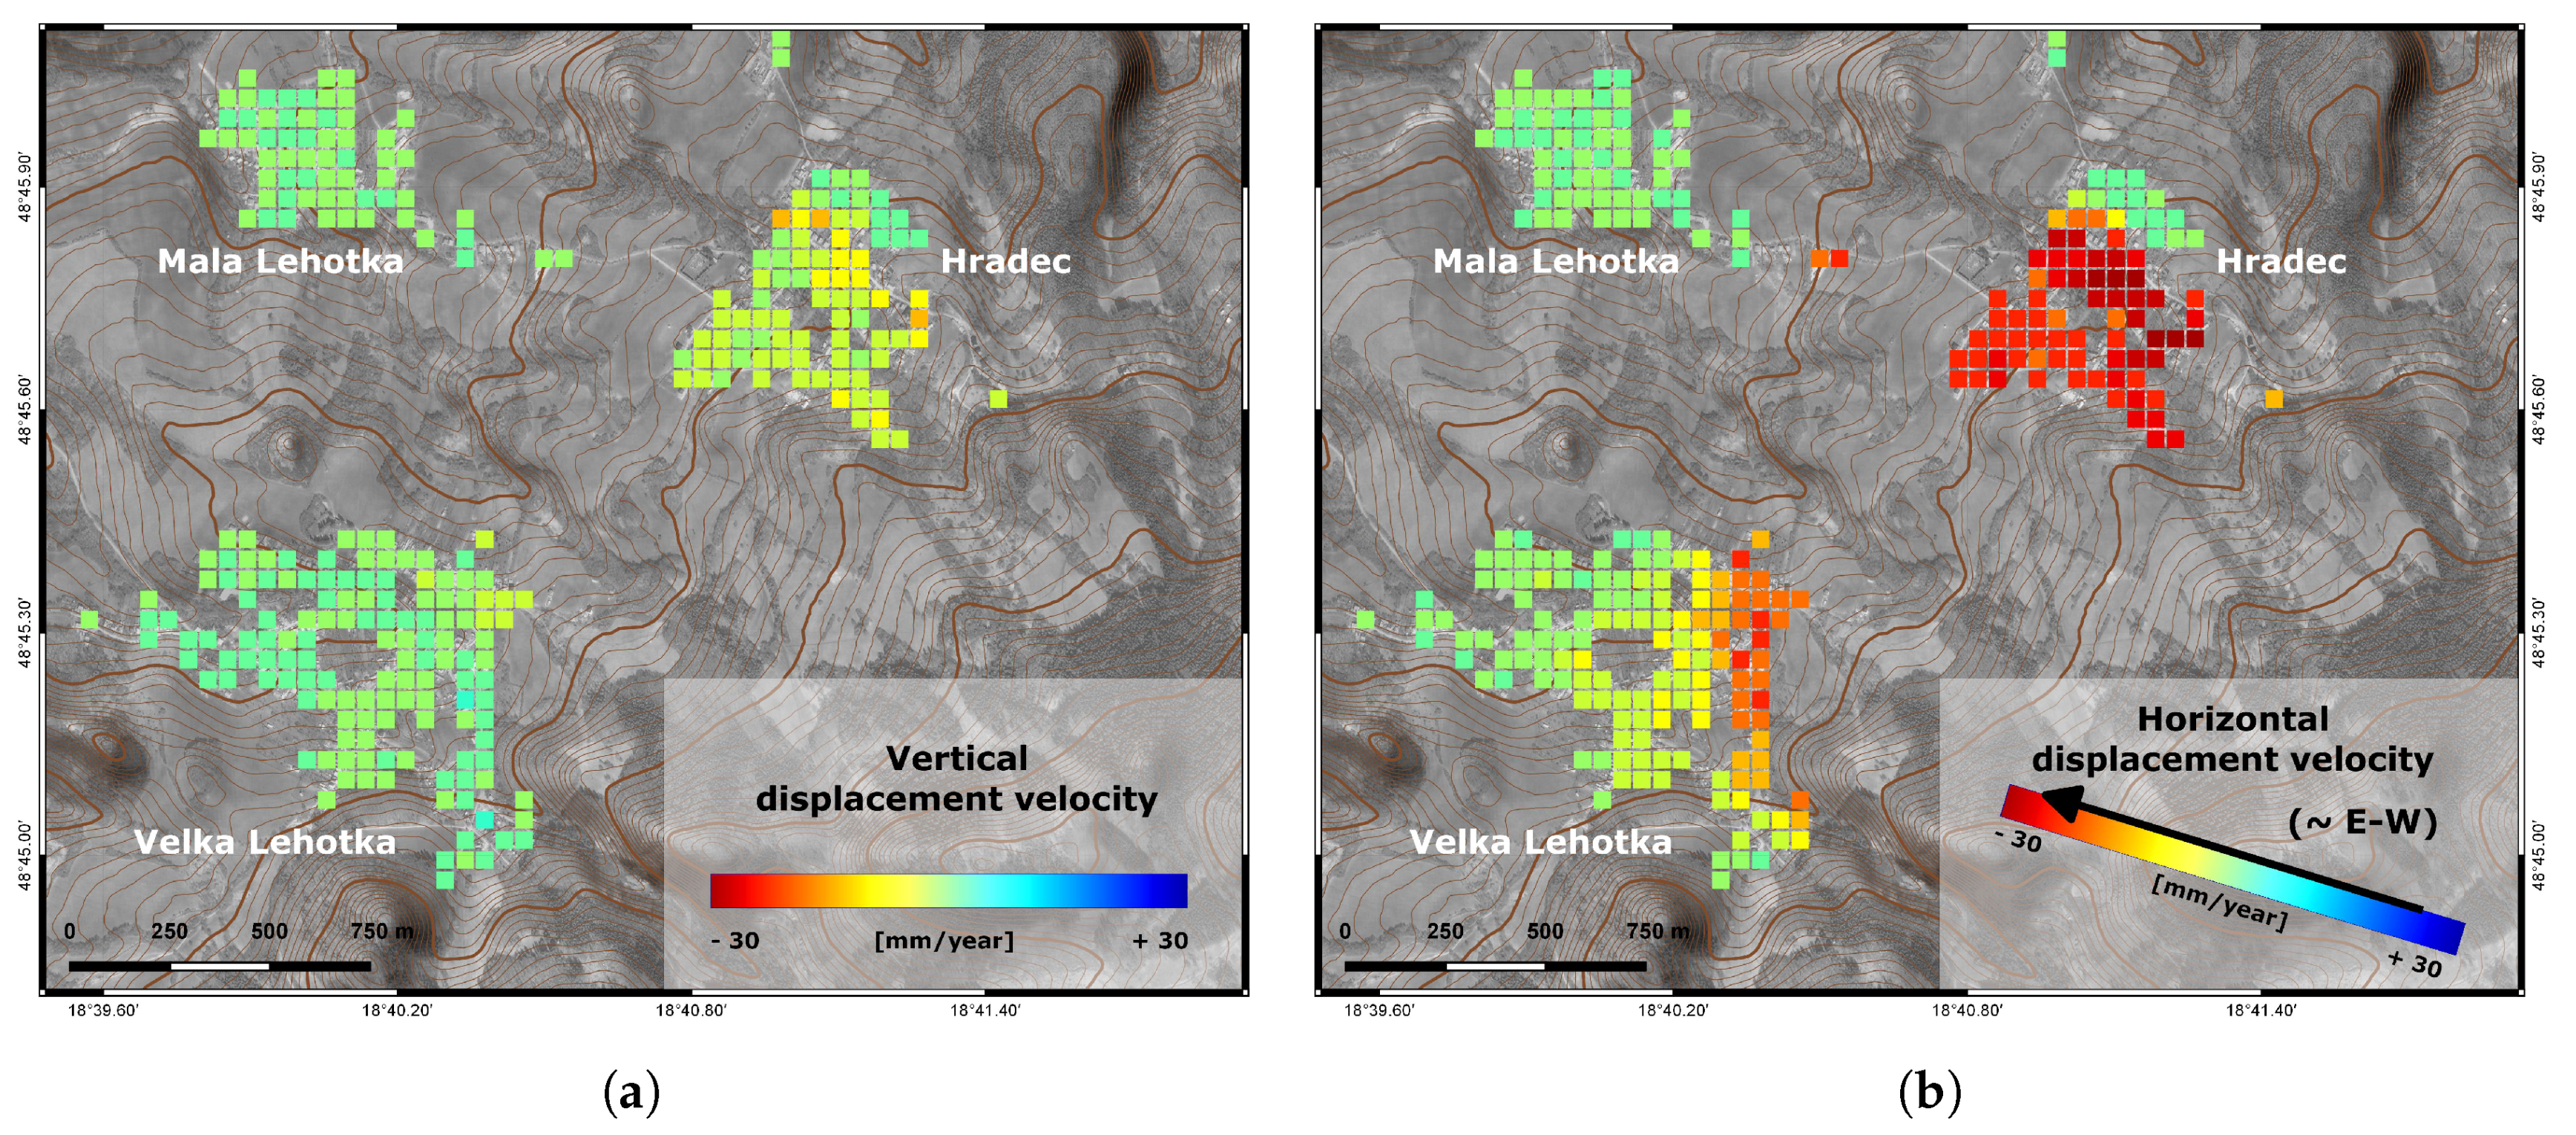
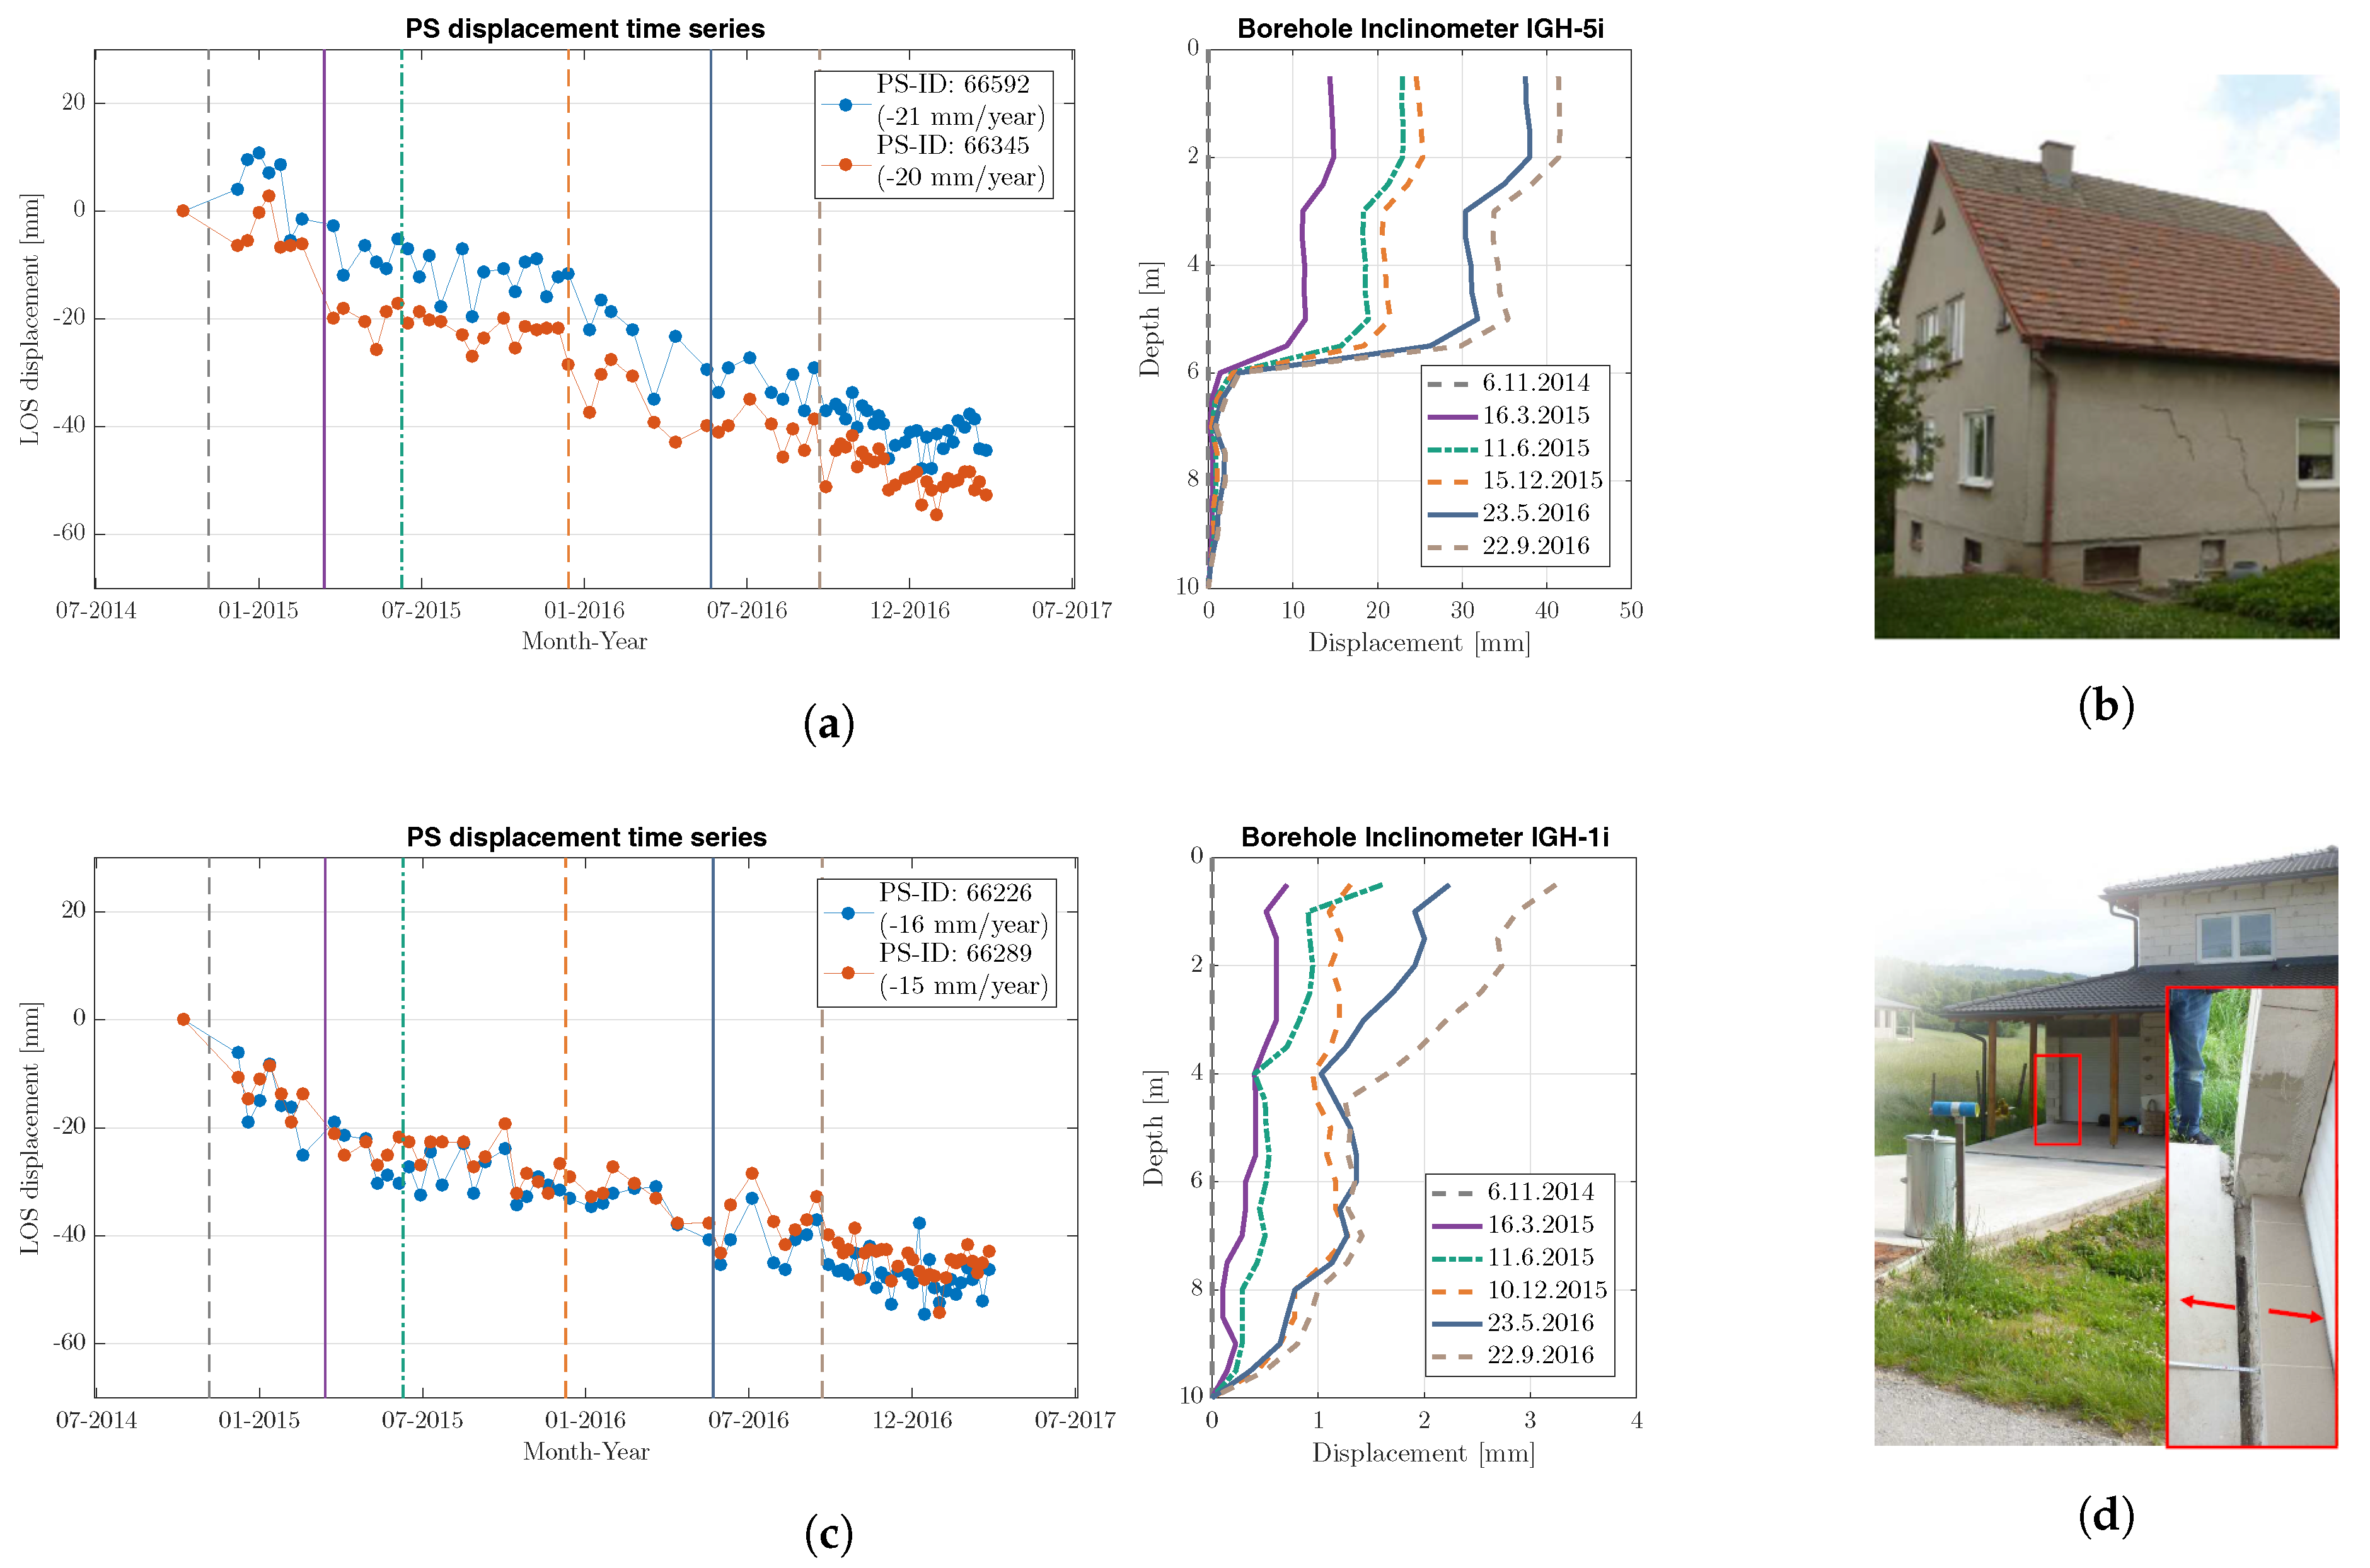
4.1. Case Study 1: Landslides
- Mean LOS velocities are resampled into regular 50 m × 50 m grid.
- The grid is subsequently filled by the weighted average of all PS’s velocities allocated within individual cells. Temporal coherence is assumed a weighting factor.
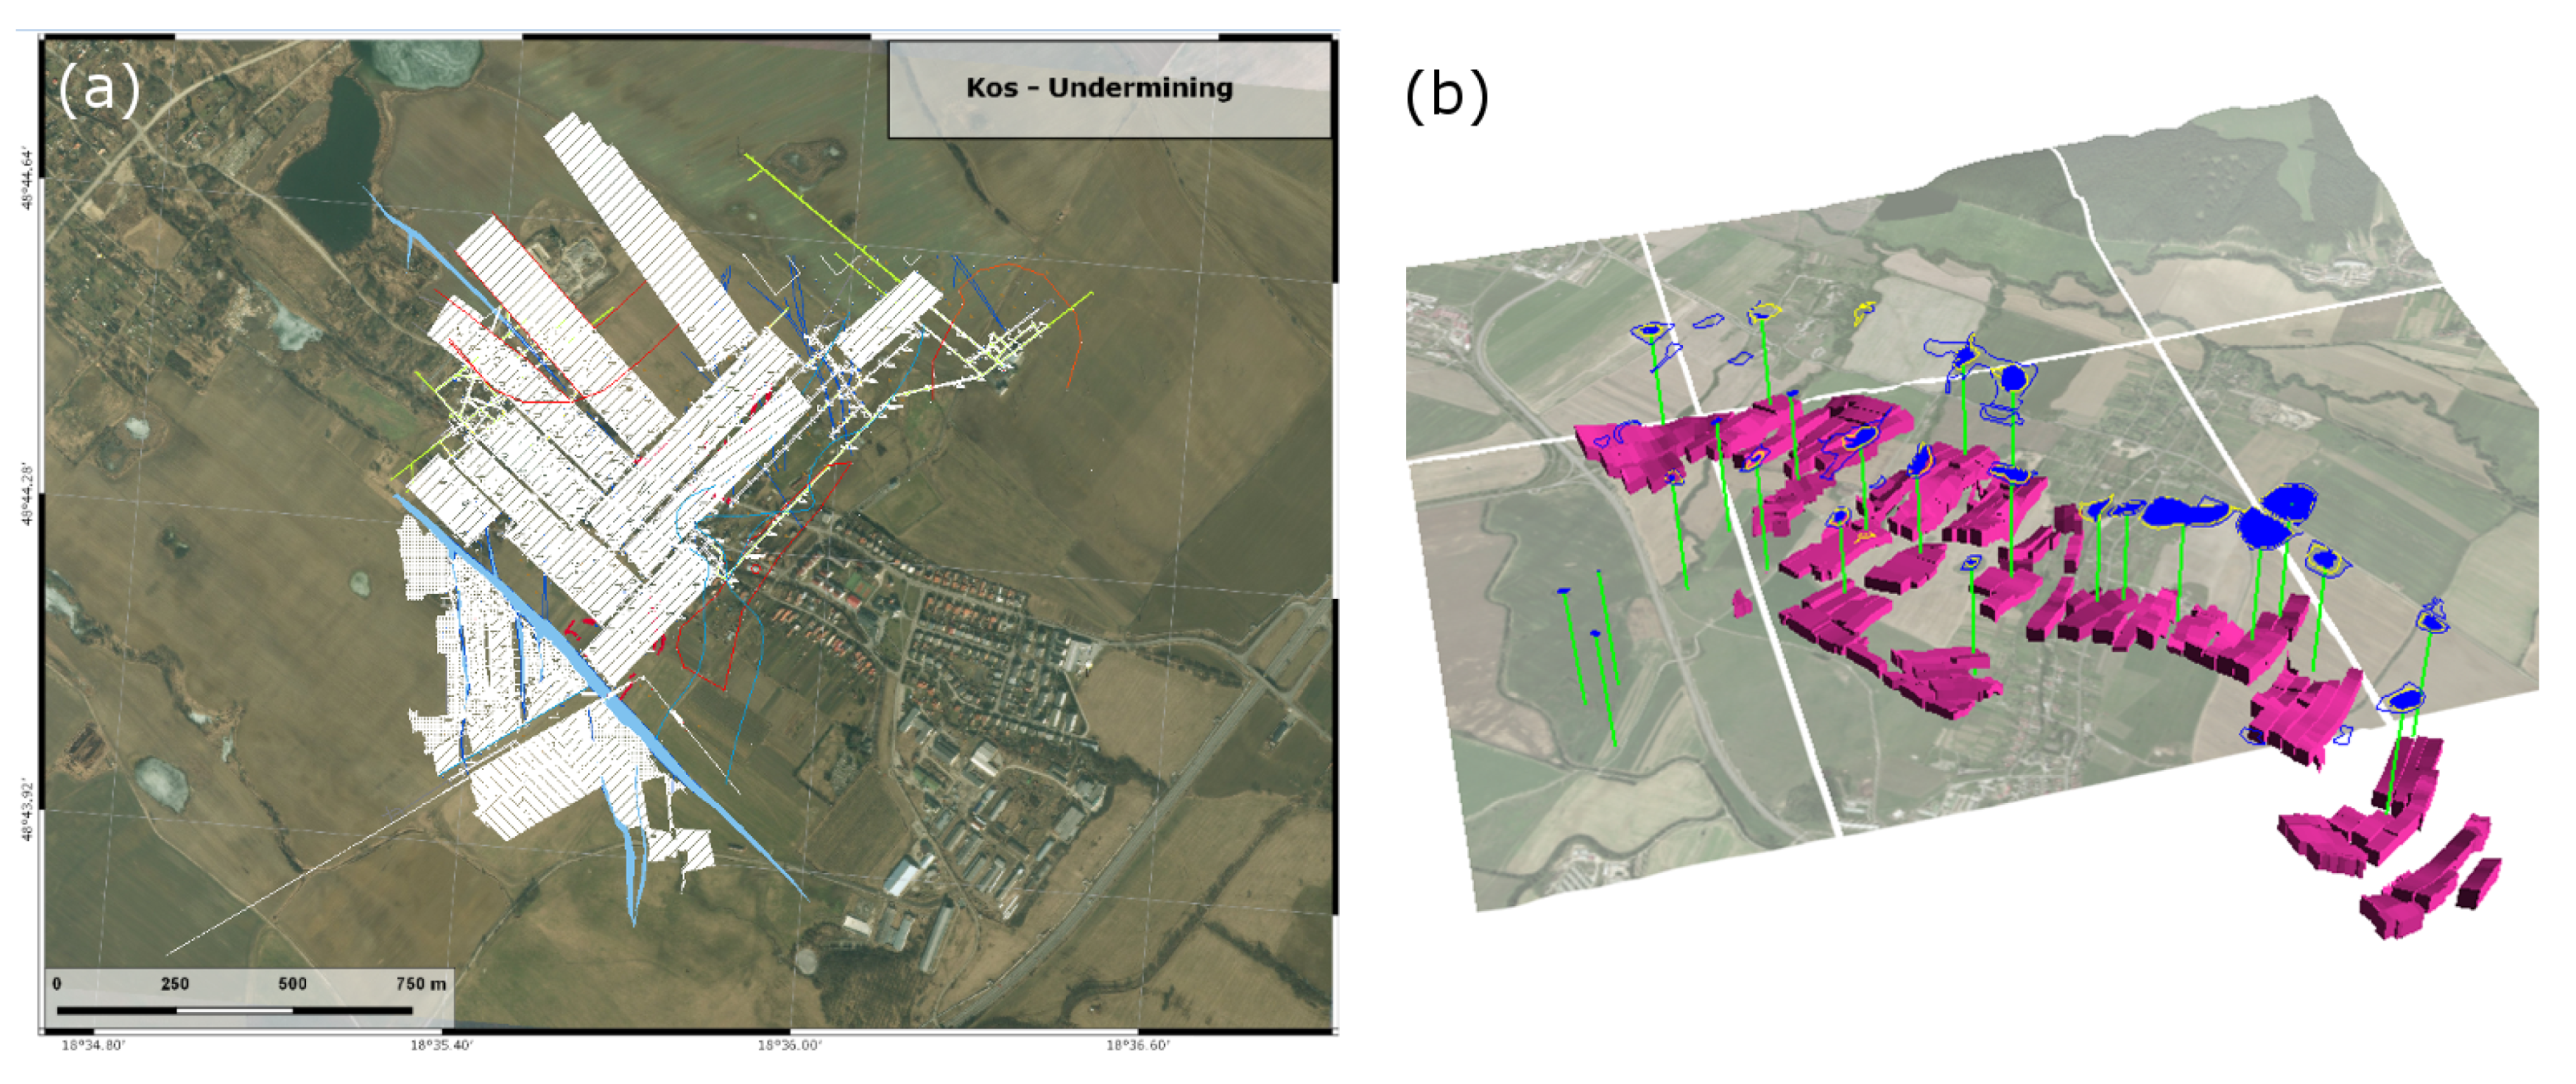
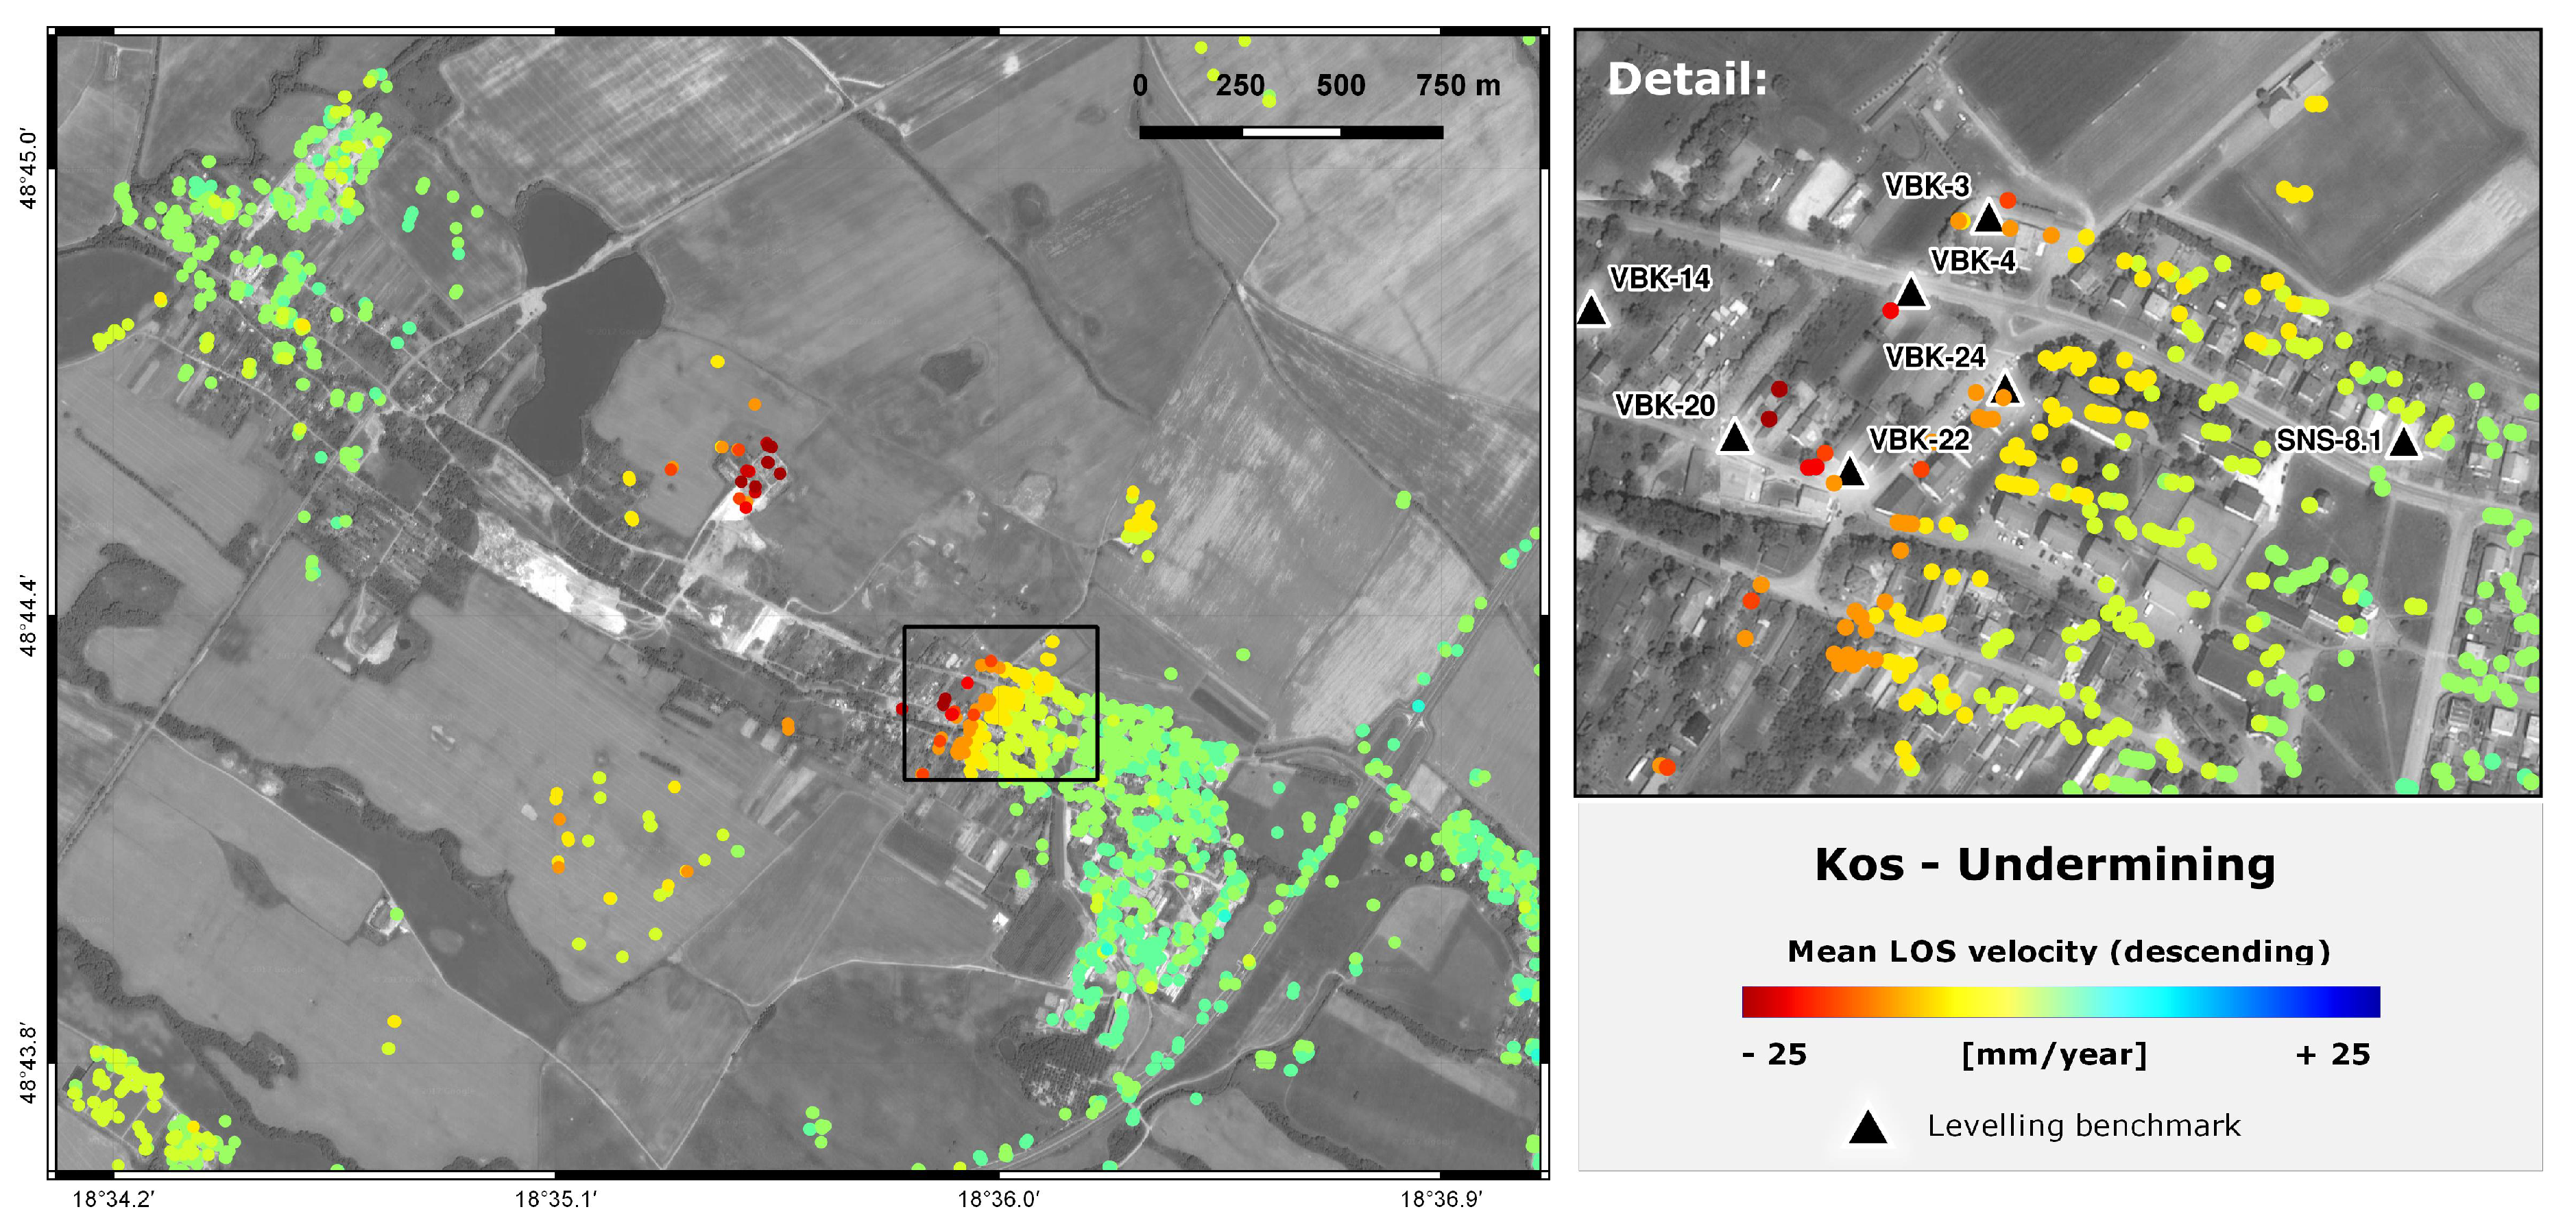
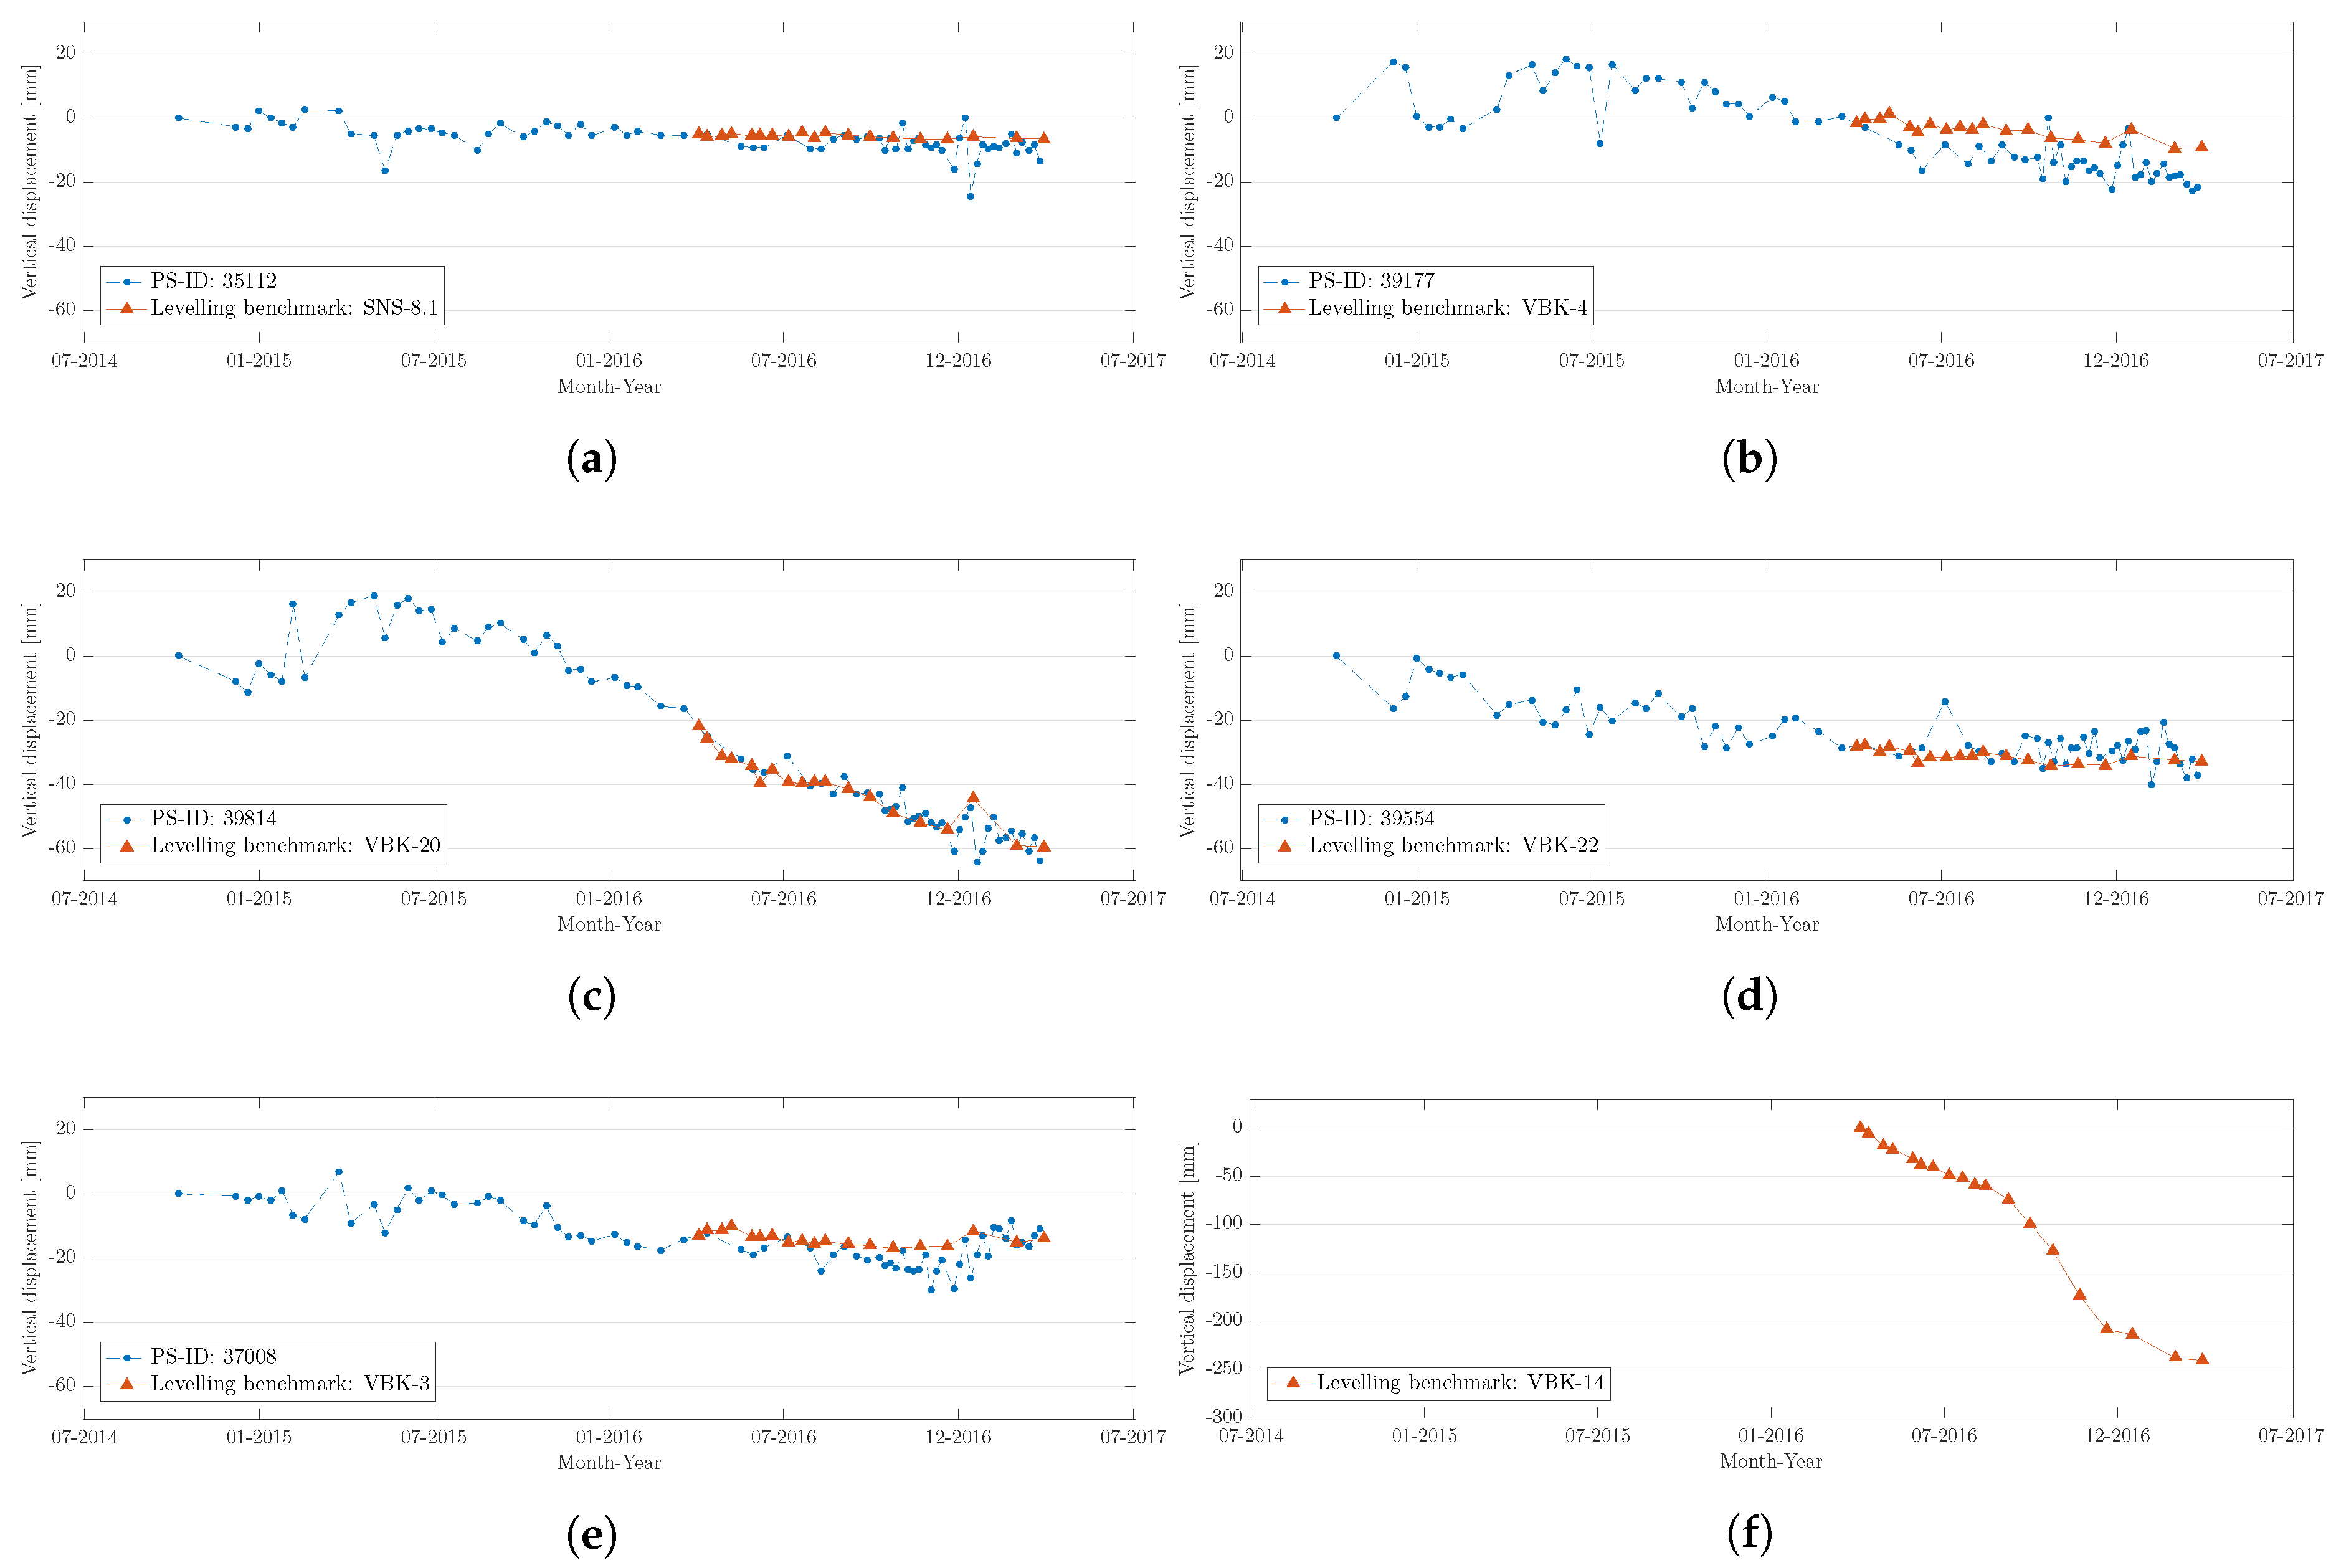
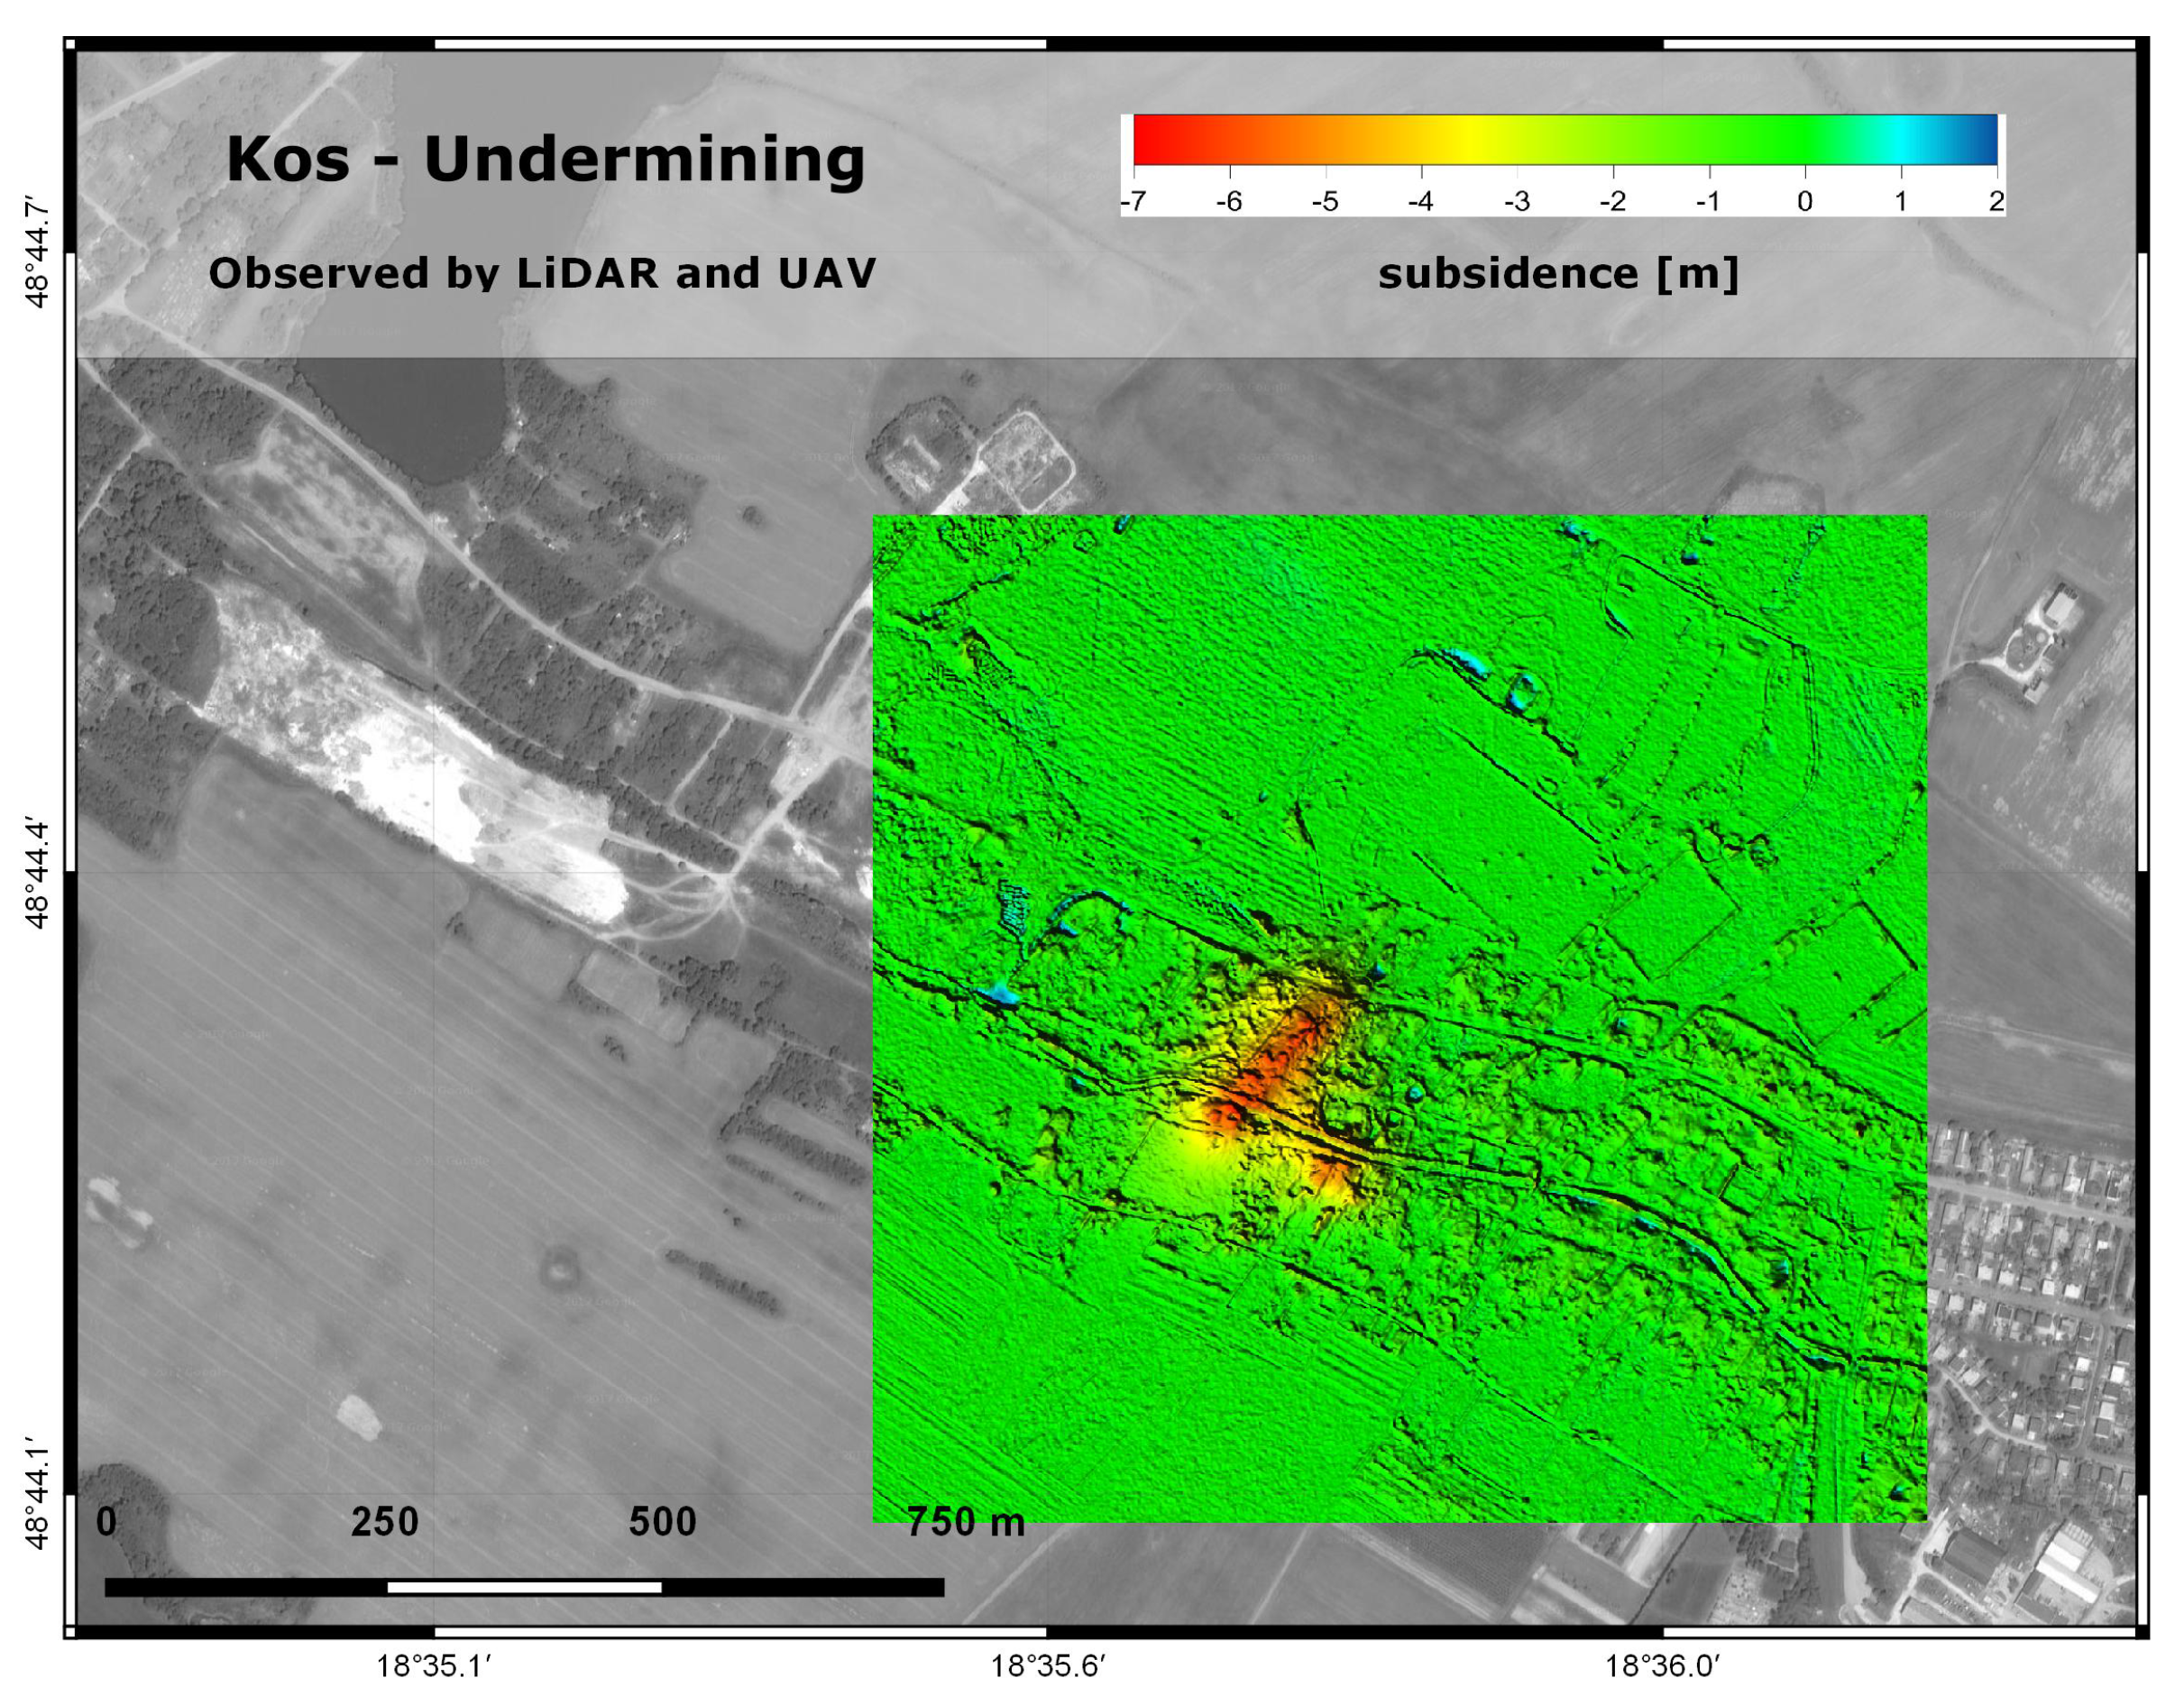
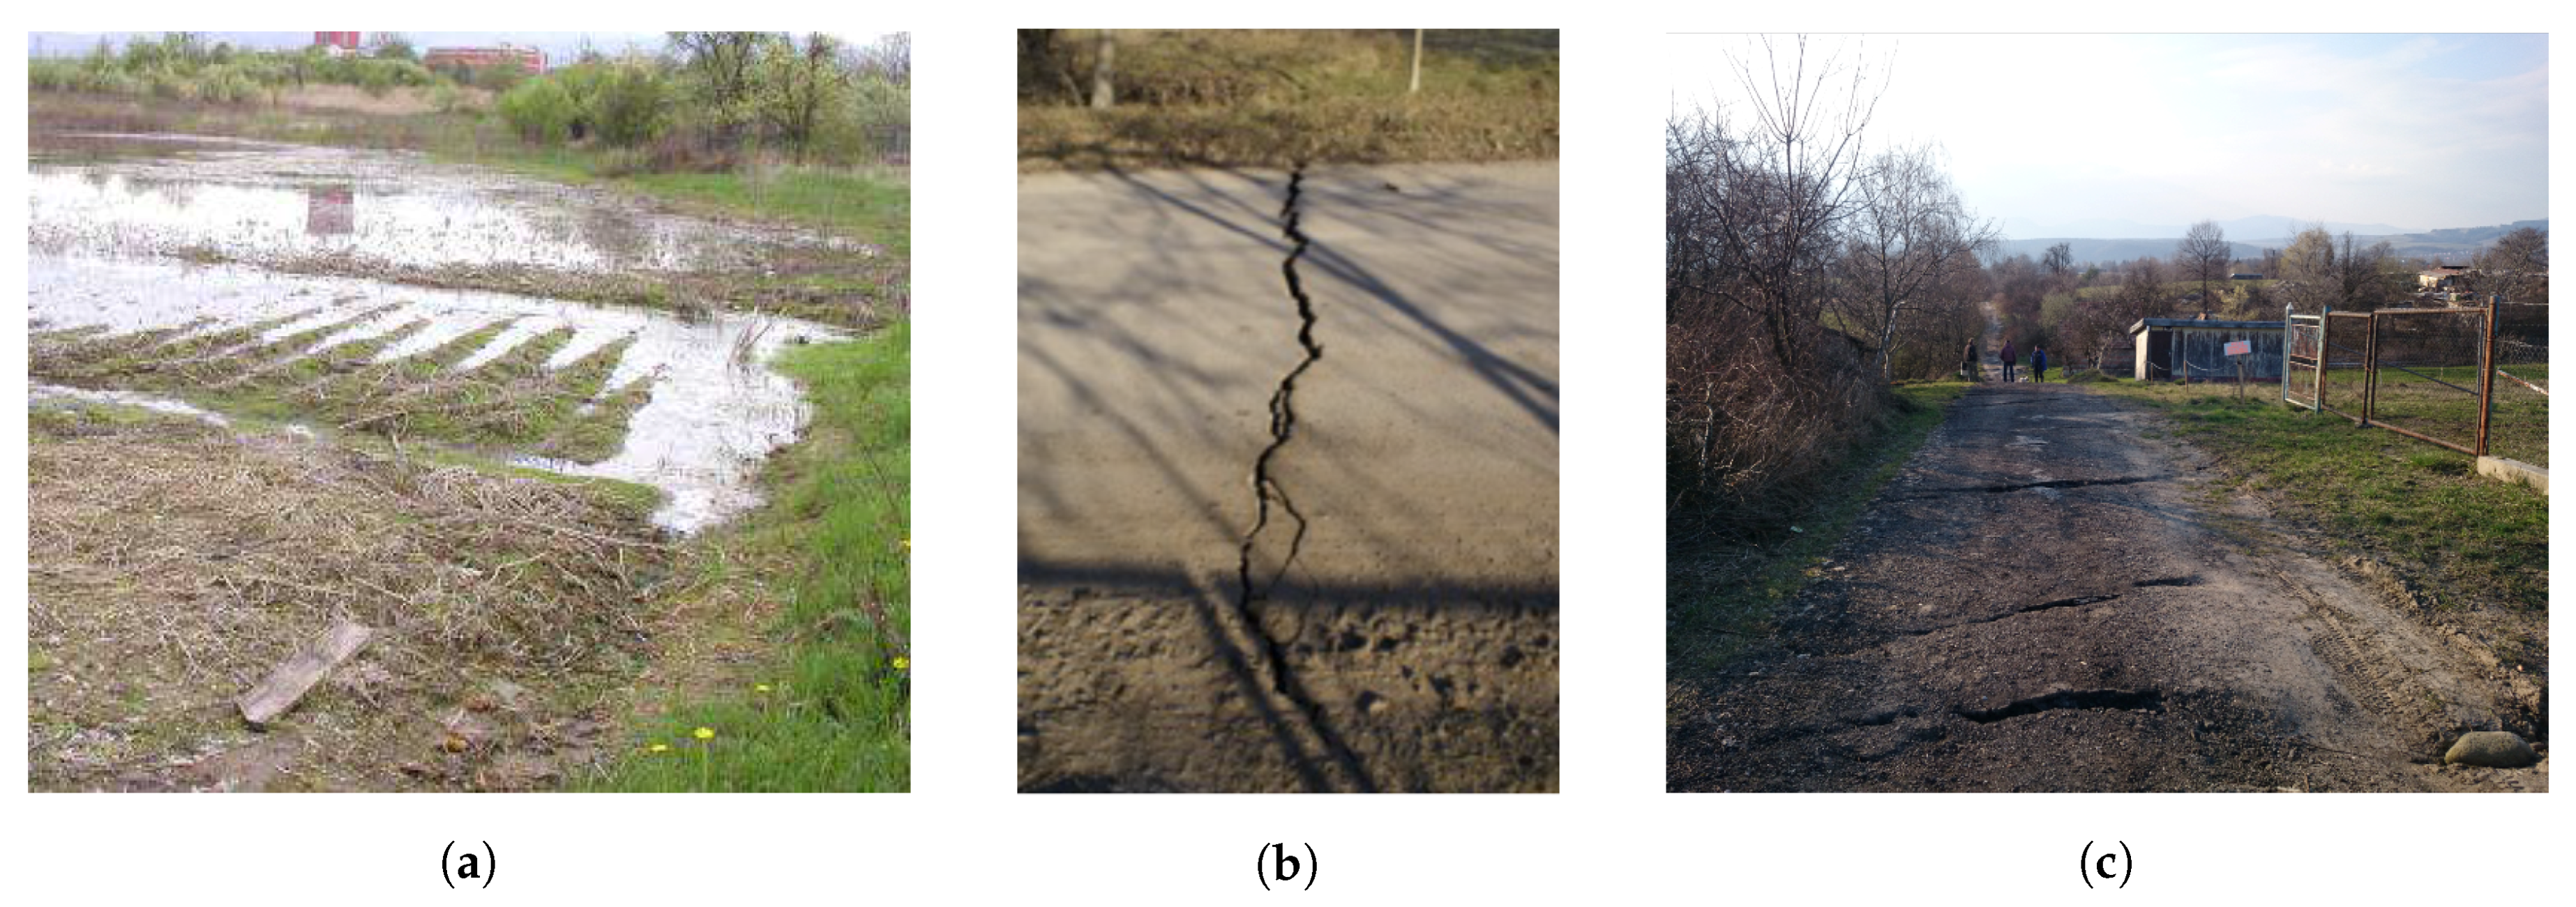
4.2. Case Study 2: Land Subsidence Due to Undermining
5. Conclusions
Acknowledgments
Author Contributions
Conflicts of Interest
References
- Liscak, P.; Ondrejka, P.; Simekova, P.; Petro, L.; Paudits, P.; Zilka, A.; Maslarova, I.; Iglarova, L.; Madaras, J. Actual emergency landslides in Slovakia (2011–2014). Geol. Prac. Spravy 2014, 124, 71–88. (In Slovak) [Google Scholar]
- Wagner, P.; Ondrejka, P.; Iglarova, L.; Frastia, M. Current trends in monitoring of slope movements. Miner. Slovaca 2014, 42, 229–240. (In Slovak) [Google Scholar]
- Ondrejka, P.; Bakon, M.; Papco, J.; Liscak, P. Monitoring of sliding activity of the territory Prievidza-Hradec. Geotechnika 2016, 1/2016, 3–12, (In Slovak with English summary). [Google Scholar]
- Crosetto, M.; Monserrat, O.; Cuevas-González, M.; Devanthéry, N.; Crippa, B. Persistent Scatterer Interferometry: A review. ISPRS J. Photogramm. Remote Sens. 2016, 115, 78–89. [Google Scholar] [CrossRef]
- Ferretti, A.; Prati, C.; Rocca, F. Permanent scatterers in SAR interferometry. IEEE Trans. Geosci. Remote Sens. 2001, 39, 8–20. [Google Scholar] [CrossRef]
- Colesanti, C.; Locatelli, R.; Novali, F. Ground deformation monitoring exploiting SAR permanent scatterers. In Proceedings of the IEEE International Geoscience and Remote Sensing Symposium, Toronto, ON, Canada, 24–28 June 2002; Volume 2, pp. 1219–1221. [Google Scholar]
- Atzori, S.; Manunta, M.; Fornaro, G.; Ganas, A.; Salvi, S. Postseismic displacement of the 1999 Athens earthquake retrieved by the Differential Interferometry by Synthetic Aperture Radar time series. J. Geophys. Res.: Solid Earth 2008, 113, B09309. [Google Scholar] [CrossRef]
- Šimon, L.; Elečko, M.; Lexa, J.; Pristaš, J.; Halouzka, R.; Konečný, V.; Gross, P.; Kohút, M.; Mello, J.; Polák, M.; et al. Geological Map of the Vtacnik Mts. and Upper Nitra Depression, 1:50,000; Geological Survey of Slovak Republic: Bratislava, Slovakia, 1997. [Google Scholar]
- Nemcok, A. Landslides in Slovak Carpathians; Veda Publishers, Slovak Academy of Sciences: Bratislava, Slovakia, 1982; p. 319, (In Slovak with English summary). [Google Scholar]
- Malgot, J.; Nemčok, A.; Jesenák, J.; Šajgalík, J.; Baliak, F.; Mahr, T.; Čabalová, D.; Masarovičová, M.; Abelovič, J.; Gregor, V.; et al. Engineering Geological Assessment of Geosystems, Part 2—Stability of Slopes and Subsoil of Constructions; Final Report; SGUDS Archive: Bratislava, Slovakia, 1985. (In Slovak) [Google Scholar]
- Ilkanič, A.; Jasovská, A.; Nigrínyová, J.; Pilko, M.; Vasiľko, T.; Smrek, M. Engineering Geological Survey of the Affected Sites in Velka Lehotka and Hradec; Final Report; MoE SR, SGUDS Archive: Bratislava, Slovakia, 2013; p. 50. (In Slovak) [Google Scholar]
- Fekeč, P.; Ilkanič, A. Realisation of Remedial Measures in Velka Lehotka, Hradec and Kraľovany. Consortium Engineering Geological Survey and Remediation of Emergency Landslides at Selected Sites of Slovakia; Kosper, a.s.: Prague, Czech Republic, 2014; p. 33. (In Slovak) [Google Scholar]
- Tupý, P.; Ilkanič, A.; Masiar, R.; Mišuth, K. Remediation of Emergency Landslides in Velka Lehotka and Hradec (Part I.). Consortium “Sanácia Prievidza“; TMG, a.s.: Prievidza, Slovakia, 2014; p. 37. (In Slovak) [Google Scholar]
- Malgot, J.; Baliak, F.; Mahr, T. Map of Vtacnik Slope Failures 1:10,000; Slovak Cartography: Bratislava, Slovakia, 1983. [Google Scholar]
- David, S. Landscape-Ecological, Environmental and Socio-Economic Consequences of Coal Mining in the Kos Cadastre. Zivotne Prostr. 2010, 44, 40–44. [Google Scholar]
- Gregor, T.; Zlocha, M.; Vybíral, V.; Čapo, J.; Lanc, J.; Kováčik, M.; Bednarik, M.; Hrabinová, J.; Pivovarči, M. Application of Remote Sensing at Monitoring of Environment Loads Impact Upon Geofactors in Selected Regions; Final Report; SGUDS Archive: Bratislava, Slovakia, 2008; p. 657. (In Slovak) [Google Scholar]
- Perissin, D.; Wang, T. Repeat-Pass SAR Interferometry With Partially Coherent Targets. IEEE Trans. Geosci. Remote Sens. 2012, 50, 271–280. [Google Scholar] [CrossRef]
- Weather Underground, Inc. History & Data Archive. Available online: https://www.wunderground.com/history/ (accessed on 14 September 2017).
- Sentinel Application Platform (SNAP). Sentinel-1 Toolbox. Available online: https://qc.sentinel1.eo.esa.int/ (accessed on 14 September 2017).
- Sentinel Payload Data Ground Segment (PDGS). Sentinel-1 Quality Control. Available online: https://github.com/senbox-org/s1tbx (accessed on 14 September 2017).
- Zan, F.D.; Guarnieri, A.M. TOPSAR: Terrain Observation by Progressive Scans. IEEE Trans. Geosci. Remote Sens. 2006, 44, 2352–2360. [Google Scholar] [CrossRef]
- Prats-Iraola, P.; Scheiber, R.; Marotti, L.; Wollstadt, S.; Reigber, A. TOPS Interferometry With TerraSAR-X. IEEE Trans. Geosci. Remote Sens. 2012, 50, 3179–3188. [Google Scholar] [CrossRef] [Green Version]
- Jarvis, A.; Reuter, H.I.; Nelson, A.; Guevara, E. Hole-filled SRTM for the Globe Version 4. CGIAR-CSI SRTM 90 m Database. Available online: http://srtm.csi.cgiar.org (accessed on 14 September 2017).
- Hooper, A.; Bekaert, D.; Spaans, K.; Arıkan, M. Recent advances in SAR interferometry time series analysis for measuring crustal deformation. Tectonophysics 2012, 514–517, 1–13. [Google Scholar] [CrossRef]
- Hooper, A.; Zebker, H.; Segall, P.; Kampes, B. A New Method for Measuring Deformation on Volcanoes and Other Natural Terrains Using InSAR Persistent Scatterers. Geophys. Res. Lett. 2004, 31, 5. [Google Scholar] [CrossRef]
- Hooper, A. Persistent Scatterer Radar Interferometry for Crustal Deformation Studies and Modeling of Volcanic Deformation. Ph.D. Thesis, Stanford University, Stanford, CA, USA, 2006. [Google Scholar]
- Hooper, A.; Zebker, H.A. Phase Unwrapping in Three Dimensions with Application to InSAR Time Series. J. Opt. Soc. Am. A 2007, 24, 2737–2747. [Google Scholar] [CrossRef]
- Goldstein, R.M.; Werner, C.L. Radar interferogram filtering for geophysical applications. Geophys. Res. Lett. 1998, 25, 4035–4038. [Google Scholar] [CrossRef]
- Notti, D.; Calò, F.; Cigna, F.; Manunta, M.; Herrera, G.; Berti, M.; Meisina, C.; Tapete, D.; Zucca, F. A user-oriented methodology for DInSAR time series analysis and interpretation: Landslides and subsidence case studies. Pure Appl. Geophys. 2015, 172, 3081–3105. [Google Scholar] [CrossRef] [Green Version]
- Liu, S. Satellite Radar Interferometry: Estimation of Atmospheric Delay. Ph.D. Thesis, Delft University of Technology, Delft, The Netherlands, 2012. [Google Scholar]
- Bekaert, D.P.S.; Hooper, A.; Wright, T.J. Reassessing the 2006 Guerrero slow-slip event, Mexico: Implications for large earthquakes in the Guerrero Gap. J. Geophys. Res.: Solid Earth 2015, 120, 1357–1375. [Google Scholar] [CrossRef]
- Bekaert, D.; Walters, R.; Wright, T.; Hooper, A.; Parker, D. Statistical comparison of InSAR tropospheric correction techniques. Remote Sens. Environ. 2015, 170, 40–47. [Google Scholar] [CrossRef]
- Bakon, M.; Oliveira, I.; Perissin, D.; Sousa, J.J.; Papco, J. A Data Mining Approach for Multivariate Outlier Detection in Postprocessing of Multitemporal InSAR Results. IEEE J. Sel. Top. Appl. Earth Obs. Remote Sens. 2017, 10, 2791–2798. [Google Scholar] [CrossRef]
- Mahapatra, P.; van der Marel, H.; van Leijen, F.; Samiei-Esfahany, S.; Klees, R.; Hanssen, R. InSAR datum connection using GNSS-augmented radar transponders. In Proceedings of the 2016 IEEE International Geoscience and Remote Sensing Symposium (IGARSS), Beijing, China, 10–15 July 2016. [Google Scholar]
- Samieie-Esfahany, S.; Hanssen, R.; van Thienen-Visser, K.; Muntendam-Bos, A. On the effect of horizontal deformation on InSAR subsidence estimates. In Proceedings of the Fringe 2009 Workshop, Frascati, Italy, 30 November–4 December 2009; European Space Agency (Special Publication): Paris, France, 2010. [Google Scholar]
- Ketelaar, V.B.H.G. Satellite Radar Interferometry: Subsidence Monitoring Techniques; Springer: Dordrecht, The Netherlands, 2009. [Google Scholar]
- van Leijen, F. Persistent Scatterer Interferometry Based on Geodetic Estimation Theory. Ph.D. Thesis, Delft University of Technology, Delft, The Netherlands, 2014. [Google Scholar]
- Berardino, P.; Fornaro, G.; Lanari, R.; Sansosti, E. A New Algorithm for Surface Deformation Monitoring Based on Small Baseline Differential SAR Interferograms. IEEE Trans. Geosci. Remote Sens. 2002, 40, 2375–2383. [Google Scholar] [CrossRef]
- Chaussard, E.; Amelung, F.; Abidin, H.; Hong, S.H. Sinking cities in Indonesia: ALOS PALSAR detects rapid subsidence due to groundwater and gas extraction. Remote Sens. Environ. 2013, 128, 150–161. [Google Scholar] [CrossRef]
- Huang, J.; Deng, K.; Fan, H.; Yan, S. An improved pixel-tracking method for monitoring mining subsidence. Remote Sens. Lett. 2016, 7, 731–740. [Google Scholar] [CrossRef]
- Berti, M.; Corsini, A.; Franceschini, S.; Iannacone, J.P. Automated classification of Persistent Scatterers Interferometry time series. Nat. Hazards Earth Syst. Sci. 2013, 13, 1945–1958. [Google Scholar] [CrossRef]
- Chang, L.; Hanssen, R.F. A Probabilistic Approach for InSAR Time-Series Postprocessing. IEEE Trans. Geosci. Remote Sens. 2016, 54, 421–430. [Google Scholar] [CrossRef]
- Mahapatra, P.; Samiei-Esfahany, S.; van der Marel, H.; Hanssen, R. On the Use of Transponders as Coherent Radar Targets for SAR Interferometry. IEEE Trans. Geosci. Remote Sens. 2014, 52, 1869–1878. [Google Scholar] [CrossRef]


© 2017 by the authors. Licensee MDPI, Basel, Switzerland. This article is an open access article distributed under the terms and conditions of the Creative Commons Attribution (CC BY) license (http://creativecommons.org/licenses/by/4.0/).
Share and Cite
Czikhardt, R.; Papco, J.; Bakon, M.; Liscak, P.; Ondrejka, P.; Zlocha, M. Ground Stability Monitoring of Undermined and Landslide Prone Areas by Means of Sentinel-1 Multi-Temporal InSAR, Case Study from Slovakia. Geosciences 2017, 7, 87. https://doi.org/10.3390/geosciences7030087
Czikhardt R, Papco J, Bakon M, Liscak P, Ondrejka P, Zlocha M. Ground Stability Monitoring of Undermined and Landslide Prone Areas by Means of Sentinel-1 Multi-Temporal InSAR, Case Study from Slovakia. Geosciences. 2017; 7(3):87. https://doi.org/10.3390/geosciences7030087
Chicago/Turabian StyleCzikhardt, Richard, Juraj Papco, Matus Bakon, Pavel Liscak, Peter Ondrejka, and Marian Zlocha. 2017. "Ground Stability Monitoring of Undermined and Landslide Prone Areas by Means of Sentinel-1 Multi-Temporal InSAR, Case Study from Slovakia" Geosciences 7, no. 3: 87. https://doi.org/10.3390/geosciences7030087