Quantitative Examination of Piezoelectric/Seismoelectric Anomalies from Near-Surface Targets


School of Earth Sciences, Faculty of Exact Sciences, Tel Aviv University, Ramat Aviv, Tel Aviv 6997801, Israel
Geosciences 2017, 7(3), 90; https://doi.org/10.3390/geosciences7030090
Submission received: 21 August 2017
/
Revised: 8 September 2017
/
Accepted: 13 September 2017
/
Published: 19 September 2017
(This article belongs to the Special Issue Remote Sensing and Geosciences for Archaeology)
Abstract
:The piezoelectric and seismo-electrokinetic phenomena are manifested by electrical and electromagnetic processes that occur in rocks under the influence of elastic oscillations triggered by shots or mechanical impacts. Differences in piezoelectric properties between the studied targets and host media determine the possibilities of the piezoelectric/seismoelectric method application. Over a long time, an interpretation of obtained data is carried out by the use of methods developed in seismic prospecting. Examination of nature of piezoelectric/seismoelectric anomalies observed in subsurface indicates that these may be related (mainly) to electric potential field. In this paper, it is shown that quantitative analysis of piezoelectric/seismoelectric anomalies may be performed by the advanced and reliable methodologies developed in magnetic prospecting. Some examples from mining geophysics (Russia) and ancient metallurgical site (Israel) confirm applicability of the suggested approach.
1. Introduction
The piezoelectric and seismo-electrokinetic phenomena are manifested by electrical and electromagnetic processes that occur in rocks under the influence of elastic oscillations triggered by shots or mechanical impacts (hits) [1,2,3,4,5,6,7,8,9,10,11,12,13,14,15,16,17,18,19,20,21,22,23,24,25,26,27,28,29,30,31,32].
Because the manifestation patterns of the above phenomena are different in different rocks, these phenomena can be used as a basis for geophysical exploration techniques. In this paper, it is assumed that the studied piezoelectric and seismoelectric anomalies cannot be separated from one another, since the anomalous targets with the contrast piezoelectric properties as a rule occur in sedimentary host deposits where the seismoelectric effects take a place.
The piezoelectric method is an example of a successful application of piezoelectric/seismo-electrokinetic phenomena in exploration geophysics. It has been successfully applied in mineral exploration and environmental features research in Russia, USA, Canada, USA, Australia and other countries. The greatest contribution to the piezoelectric method application in subsurface geophysics (since the mid-1950s) was made by Naum Neishtadt (1929–2016) (Figure 1).
Interpretation of seismoelectric/piezoelectric anomalies is often carried out using procedures similar to those employed in seismic prospecting. In the paper, it is shown that quantitative interpretation of expressed anomalies observed in near-surface may be performed using the methods developed for potential geophysical fields.
2. A Brief Background
This method is based on the piezoelectric activity of rocks, ores, and minerals. It enables direct exploration for pegmatite, apatite-nepheline, essentially sphalerite, and ore-quartz deposits of gold, tin, tungsten, molybdenum, zinc, crystal, and other raw materials. This method also enables differentiation of rocks such as bauxites, kimberlites, etc., from the host rocks, by their electrokinetic properties [14].
Classification of some rocks, ores, and minerals by their piezoactivity is given in Table 1. These objects (targets) transform wave elastic oscillations into electromagnetic ones. It should be take into account that, sometimes, anomalous bodies may be detected not by positive, but by negative anomalies, if low-piezoactive body occurs in the higher piezoactive medium.
The piezoelectric method is an example of successful application of piezoelectric/seismo-electrokinetic phenomena in exploration and environmental geophysics and designed for delineation of targets differing from the host media by piezoelectric properties [14,30]. This method can be employed in surface, downhole, and underground modes.
Experimental investigations enabled obtaining the main equation of the piezoelectric effect [30]:
where ε is the dielectric constant, and σ is the electric conductivity of rock. It explains why the piezoelectric effect may be registered by both observations of intensities of electric field E and magnetic field H.
Recent testing of piezeoelectric effects of archaeological samples composed from the fired clay have shown values of (3.0–4.0) × 10−14 C/N (Coulomb/Newton).
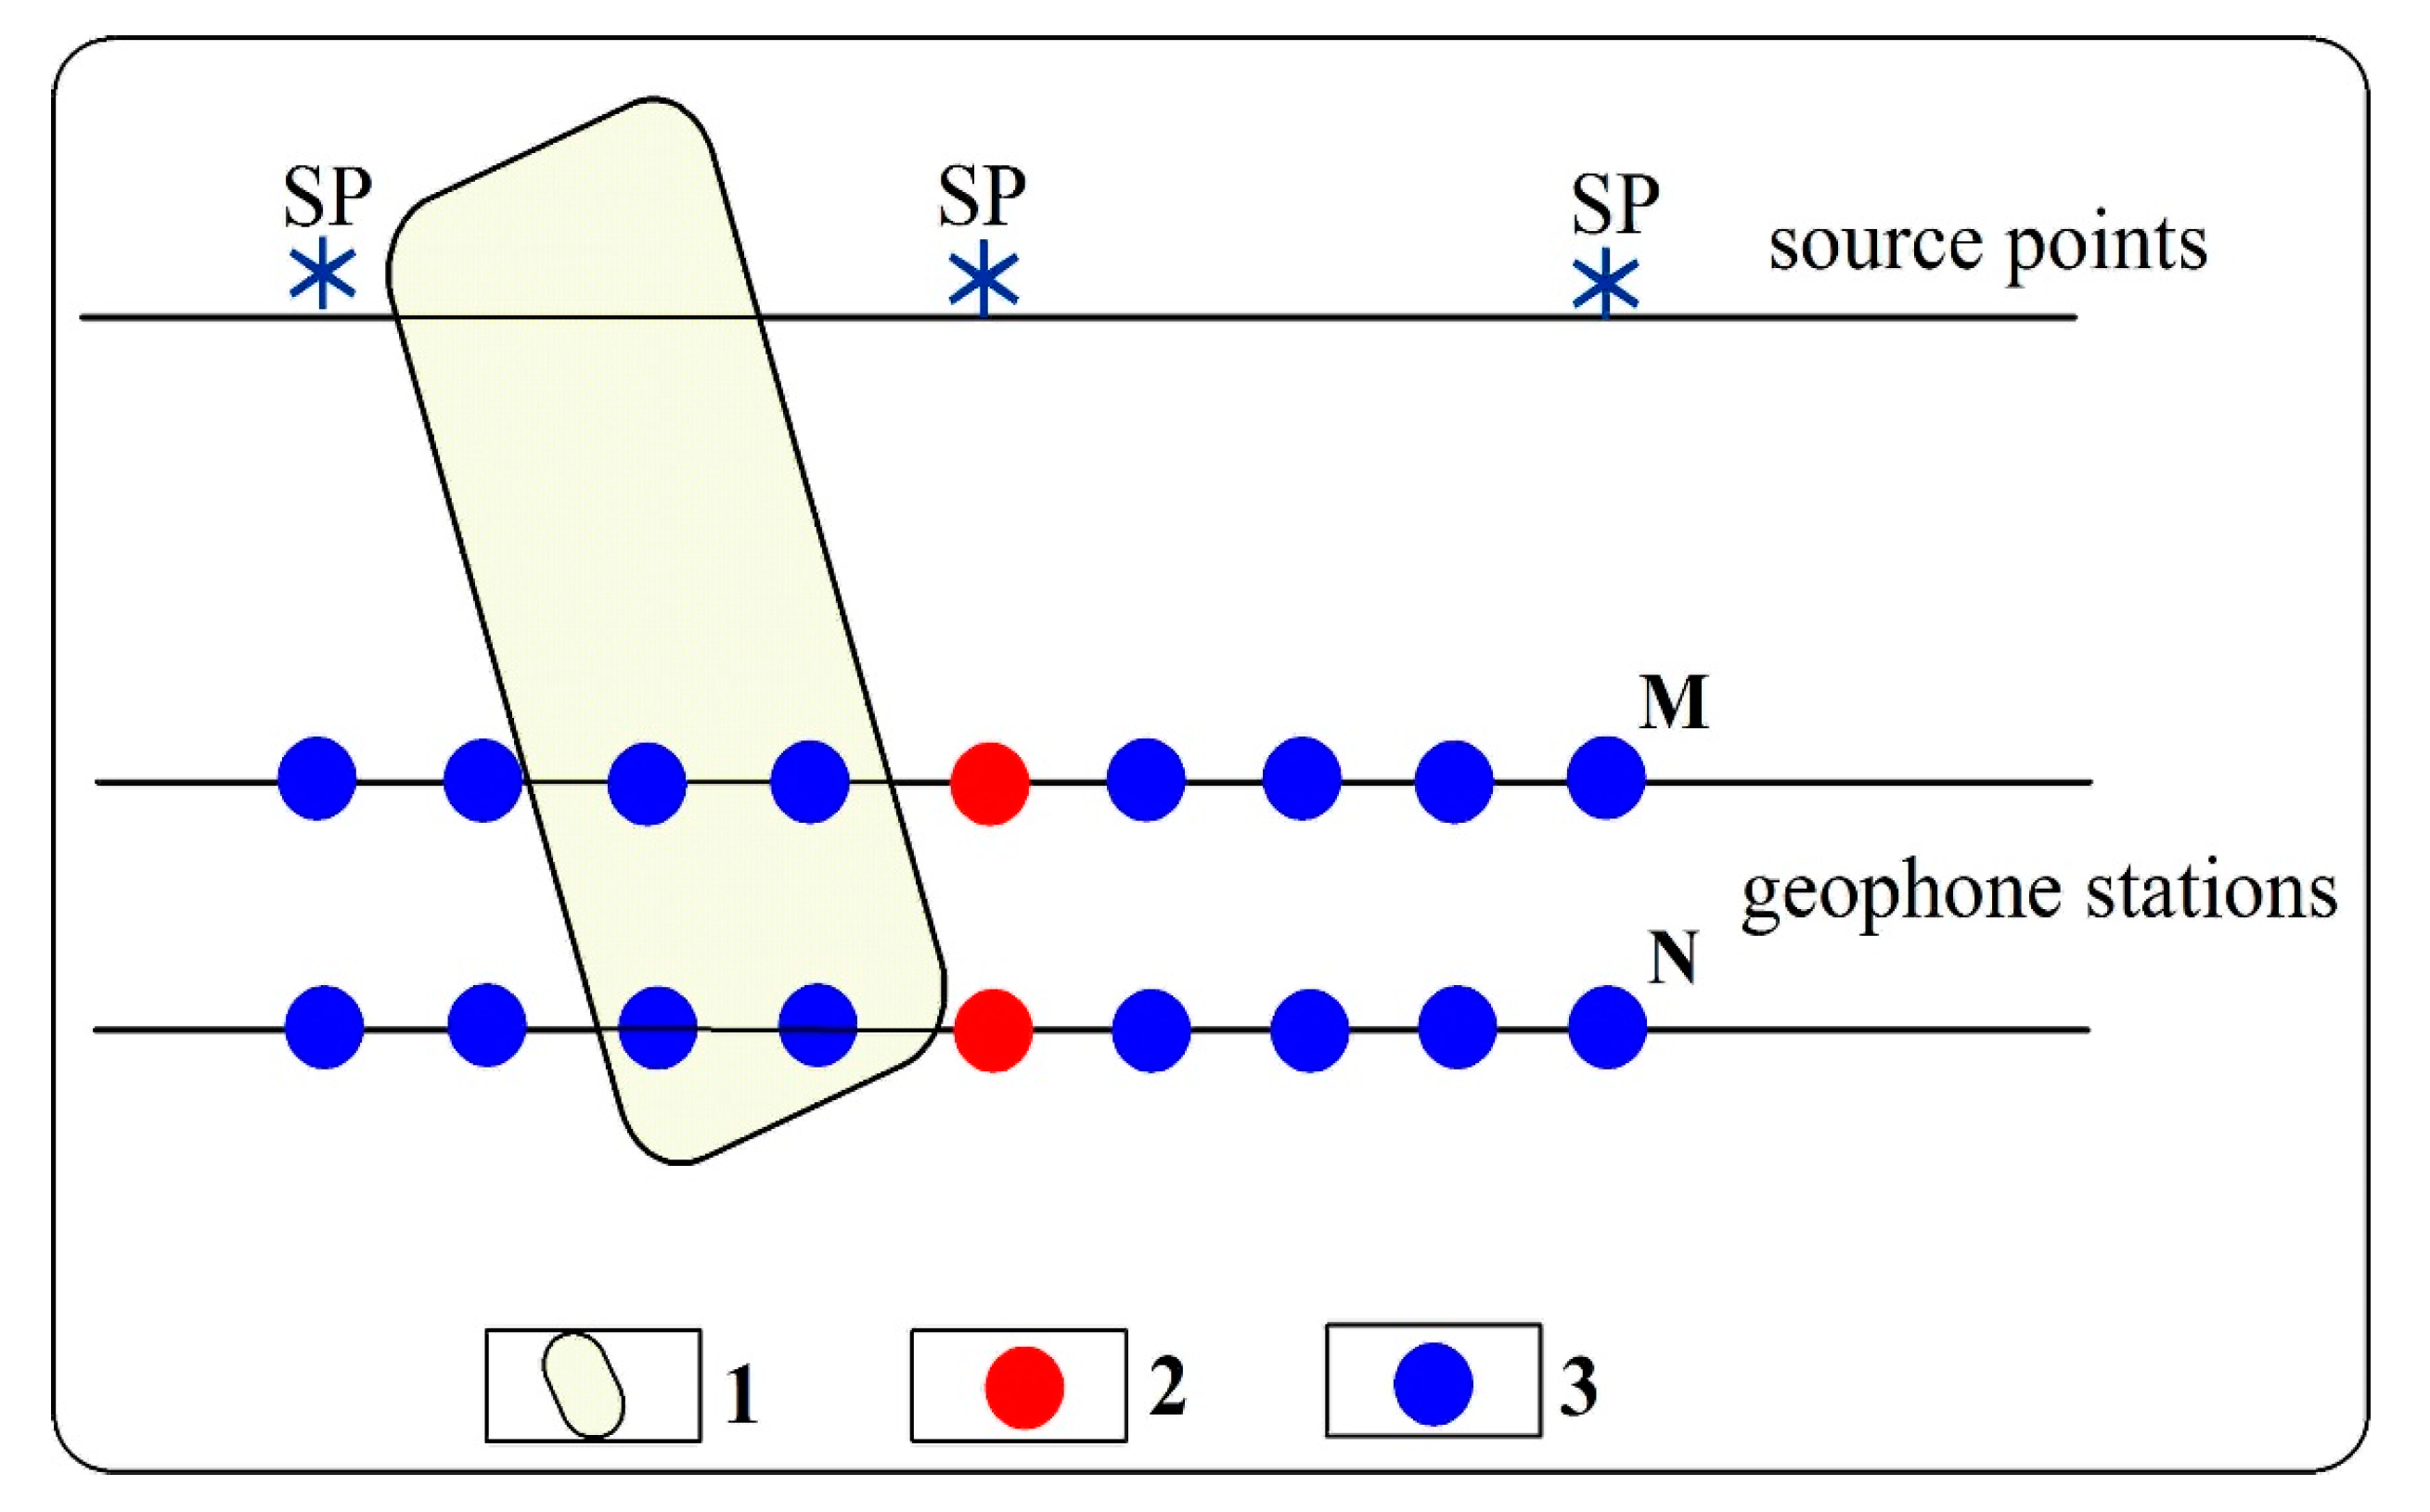
An observation scheme for ground surveys using the piezoelectric method is presented in Figure 2. The conventional piezoelectric measurements are conducted using electrodes, while the geophones play a subsidiary role for monitoring intensity of the elastic oscillation generation and behavior of the initial seismic field.
3. Can Piezoelectric and Seismoelectric Effects Be Related to Potential Fields?
The seismo-electrokinetic (electrokinetic) phenomenon E in rocks is triggered by the potential gradient due to the displacement of liquid phase relative to the solid “skeleton” of the rock under the elastic wave influence. Essential similarity of this phenomenon to potential produced by water flow in rocks proposes a similar origin for these phenomena [33].
Firstly, Ivanov [34] discovered the seismoelectric effect E in the rocks of sedimentary complex. He proposed a filtration hypothesis consisting of that in the sedimentary rocks occurs a double diffusion layer at the boundary between hard particles and liquid. A propagation of elastic waves causes a relative distortion of electrolyte and hard phase; thus, equilibrium condition in the double electric layer is distorted. This effect generates appearance of so-called filtration potential U, flow (streaming) potential, an instantaneous value of which is determined over a part of the length of the elastic wave by the equation of Helmholtz–Smoluchowsky [35]:
where ρ1 and ρ2 are the instantaneous pressure values in the section under consideration; k is the coefficient calculating the dynamics of the elastic wave distribution, ε is the dielectric constant, ζ is the potential of the double electric layer, η is the solution viscosity, and σ is the conductivity.
Frenkel [36] offered a mathematical description of the seismo-electric phenomenon E, which was based on the Ivanov’s [34] hypothesis regarding the electro-filtration nature of this phenomenon. Frenkel described compression and stretching of rock particles and pores, as well as of the pore moisture, under the influence of the elastic wave propagation. Moreover, he proposed an equation that described the propagation of elastic waves in moisturized soil. For calculating electro-kinetic potential, this equation uses the Helmholtz–Smoluchowski equation that describes the intensity of longitudinal electric field for stationary flow of liquid through the pores of the solid “skeleton”:
where μ is the coefficient of viscosity of the medium, i is the complex-valued electric field intensity, α is the parameter that describes the mechanical properties of the medium, K0 is the coefficient of compressibility of the solid phase, is the coefficient of permeability, r is the pore radius, f is the porosity, K1 is the coefficient of permeability of the soil, ρ2 is the true specific gravity of the pore moisture, K2 is the coefficient of compressibility of the liquid phase, ω0 is the propagation velocity of the longitudinal elastic wave, and u is the displacement.
Equation (2) shows that the electric field intensity is proportional to porosity and is independent of the pore radius, because the α coefficient is proportional to the square of this radius. With the assumed values of displacement, the electric field intensity is proportional to the square of frequency of the elastic oscillations. In the above formula, the author assumes that the period of time required to produce the electro-kinetic potential gradient is negligibly short compared to the oscillation period 2π/ω. This is why the value of E at any given moment practically coincides with the value corresponding to the instantaneous value of the relative velocity.
To confirm Ivanov’s [34] suggestion on the nature of this effect in rocks, Volarovich and Parkhomenko [1] put experiments to reproduce this phenomenon on the artificially moistened rock samples under the laboratory conditions. They found that before the artificial moistening, the dolomite sample did not show any elastic oscillations when electrified; after the moistening, the appearance of an electric potential was observed on its faces. At the same time, the sign of the charge did not depend on which side of the sample the charges were taken from, but determined by the gradient of the pressure drop.
Parkhomenko [5] stated that further study of the phenomenon E will advance the current perception of electrokinetic phenomena, and that it may lead to the development of a new geophysical exploration technique for determination of porosity properties of rocks. The author emphasized the importance of studying the behavior of the phenomenon E in various sedimentary rocks, its dependencies on the medium saturation, chemical composition of the pore moisture, and the values of ζ-potential, apparent conductivity and polarizability.
Parkhomenko [6] established that the magnitude of the phenomenon E is a function of several variables, the most important of which are the medium saturation, concentration of salts in the liquid phase, electrochemical properties of the solid phase, texture of the rock, and the frequency of the applied seismic field. Specific surface of the electric double layer was found to be the key factor.
Butler [37] applied the Laplace equation to solve some problems of seismoelectric effects. Haines et al.’s [26] constructions in seismoelectric imaging are based on the potential electric quasi-static current dipole. Jardani et al. [38] several times underlined the role of electrostatic potential in seismoelectric imaging. Mahardika and Revil [39] noted a necessity employment of electrostatic potential for calculation of seismoelectric response generated at the boundary of two mediums.
Antonova [40] applied the Laplace equation for calculation of finite piezoelectric body with open electric boundaries. Jandaghian and Jafari [41] assumed that the electric potential field in the piezoelectric layer is satisfied to the Maxwell static electricity equation. Jouniaux and Zyserman [32] gave a description of the electric potential within the electric double layer by seismo-electric and electro-seismic measurements.
All the aforementioned facts testify that the seismoelectric and piezoelectric anomalies observed in subsurface can be considered as anomalies of quasi-potential field.
Absence of reliable procedures for solving the direct and inverse problems of piezoelectric anomalies (PEA) drastically hampers further progression of the method. Therefore, it was suggested to adapt the tomography procedure, widely used in the seismic prospecting, to the PEA modeling. Diffraction of seismic waves has been computed for models of circular cylinder, thin inclined bed and thick bed [42]. As a result, spatial-time distribution of the electromagnetic field caused by the seismic wave has been found. The computations have shown that effectiveness and reliability of PEA analysis may be critically enhanced by considering total electro- and magnetograms as differentiated from the conventional approaches. Distribution of the electromagnetic field obtained by solving the direct problem was the basis for an inverse problem, i.e., revealing depth of a body occurrence, its location in a space as well as determining physical properties. At the same time, this method has not received a wide practical application taking into account complexity of real geological media.
4. Short Description of the Interpretation Methodology Developed in Magnetic Prospecting
Careful analysis of piezoelectric/seismoelectric anomalies shows (see Section 3) the possibility of application for quantitative analysis of these effects in advanced methodologies developed for magnetic prospecting in complex physical-geological conditions: rugged terrain relief, oblique polarization and complex media [43,44,45,46,47,48]. Employment of these methodologies (improved modifications of tangents, characteristic points and areal methods) for obtaining quantitative characteristics of ore bodies, environmental features and archaeological targets (models of horizontal circular cylinder, sphere, thin bed, thick bed and thin horizontal plate were utilized) may have significant importance [49].
According to analogy with magnetic field, such parameter as “piezoelectric moment” (PM) can be calculated. The formulas for calculation of PM for the models of thin bed, horizontal circular cylinder (HCC) and thick bed are presented below.
- (1)
- Thin bed:where Ae is the piezoelectric moment, AT is the total intensity of the piezoelectric (seismoelectric) anomaly, and h is the depth of the upper edge of a thin bed.
- (2)
- (3)
If anomalies are observed on an inclined profile, then the obtained parameters characterize a certain fictitious body. The transition from fictitious body parameters to those of the real body is performed using the following expressions (the subscript “r” stands for a parameter of the real body) [43]:
where h is the depth of the upper edge (center of HCC) occurrence, x0 is the location of the source’s projection to plan relative to the extremum having the greatest magnitude, and ω0 is the angle of the terrain relief inclination (ω0 > 0 when the inclination is toward the positive direction of the x-axis).
5. Application of the Proposed Methodology: Field Cases
5.1. Employment of the Interpretation Methodology in Ore Geophysics
5.1.1. Gold-Bearing Quartz Deposit Ustnerinskoe (Eastern Yakutia, Russia)
Surface measurements at a gold-bearing quartz deposit Ustnerinskoe (Eastern Yakutia, Russia) showed wide anomaly with intensity of about 1700 microVolt (Figure 3). As it follows in Table 1 (Group I), quartz is one of the most piezoactive minerals. This anomaly is produced by integral effect from several quartz-mica zones. A form of this anomaly indicates that it can be examined as thick bed (or intermediate model between thick bed and thin plate). Results of interpretation position of angle points and center of the upper edge of the anomalous target (see Figure 3) coincide well with geological data. PM calculated for this target (coefficient k′m was obtained from [43]) consists of ≈300 μV.
5.1.2. Gold Quartz Deposit (Central Yakutia, Russia)
A gold-quartz deposit of central Yakutia occurs in conditions of very rugged relief (Figure 4). It should be noted that upper part of the crystal-quartz body is influenced by different weathering processes and its piezoelectric properties were eliminated. For transfer from fictitious to real coordinates of the anomalous object, Equation (4) was applied. Results of interpretation (here a model of thin bed was used) are in line with the available geological data.
The following terms are taken from the plot:
- d1 = distance between the maximum and minimum of the anomaly;
- d2 = distance between the left and right branches at the level of semiamplitude;
- d3 = difference in abscissae of the points of intersection of an inclined tangent with horizontal tangents on one branch;
- d4 = the same on the other branch (d3 is selected from the plot branch with conjugated extremums, d3 ≤ d4), and the x-axis is oriented in this direction);
- d5 = distance between the middle point of the left and right tangents;
- d6 = distance between d3 and d4;
- d7 = d3 + d4 + d6;
and
- d8 = distance between the ending of parameter d4 and beginning of parameter d5.
Calculated PM factor is 1/2⋅600(μV)⋅7(m) = 2100 μV⋅m.
5.1.3. Crystal-Quartz Deposit Pilengichey (Subpolar Ural, Russia)
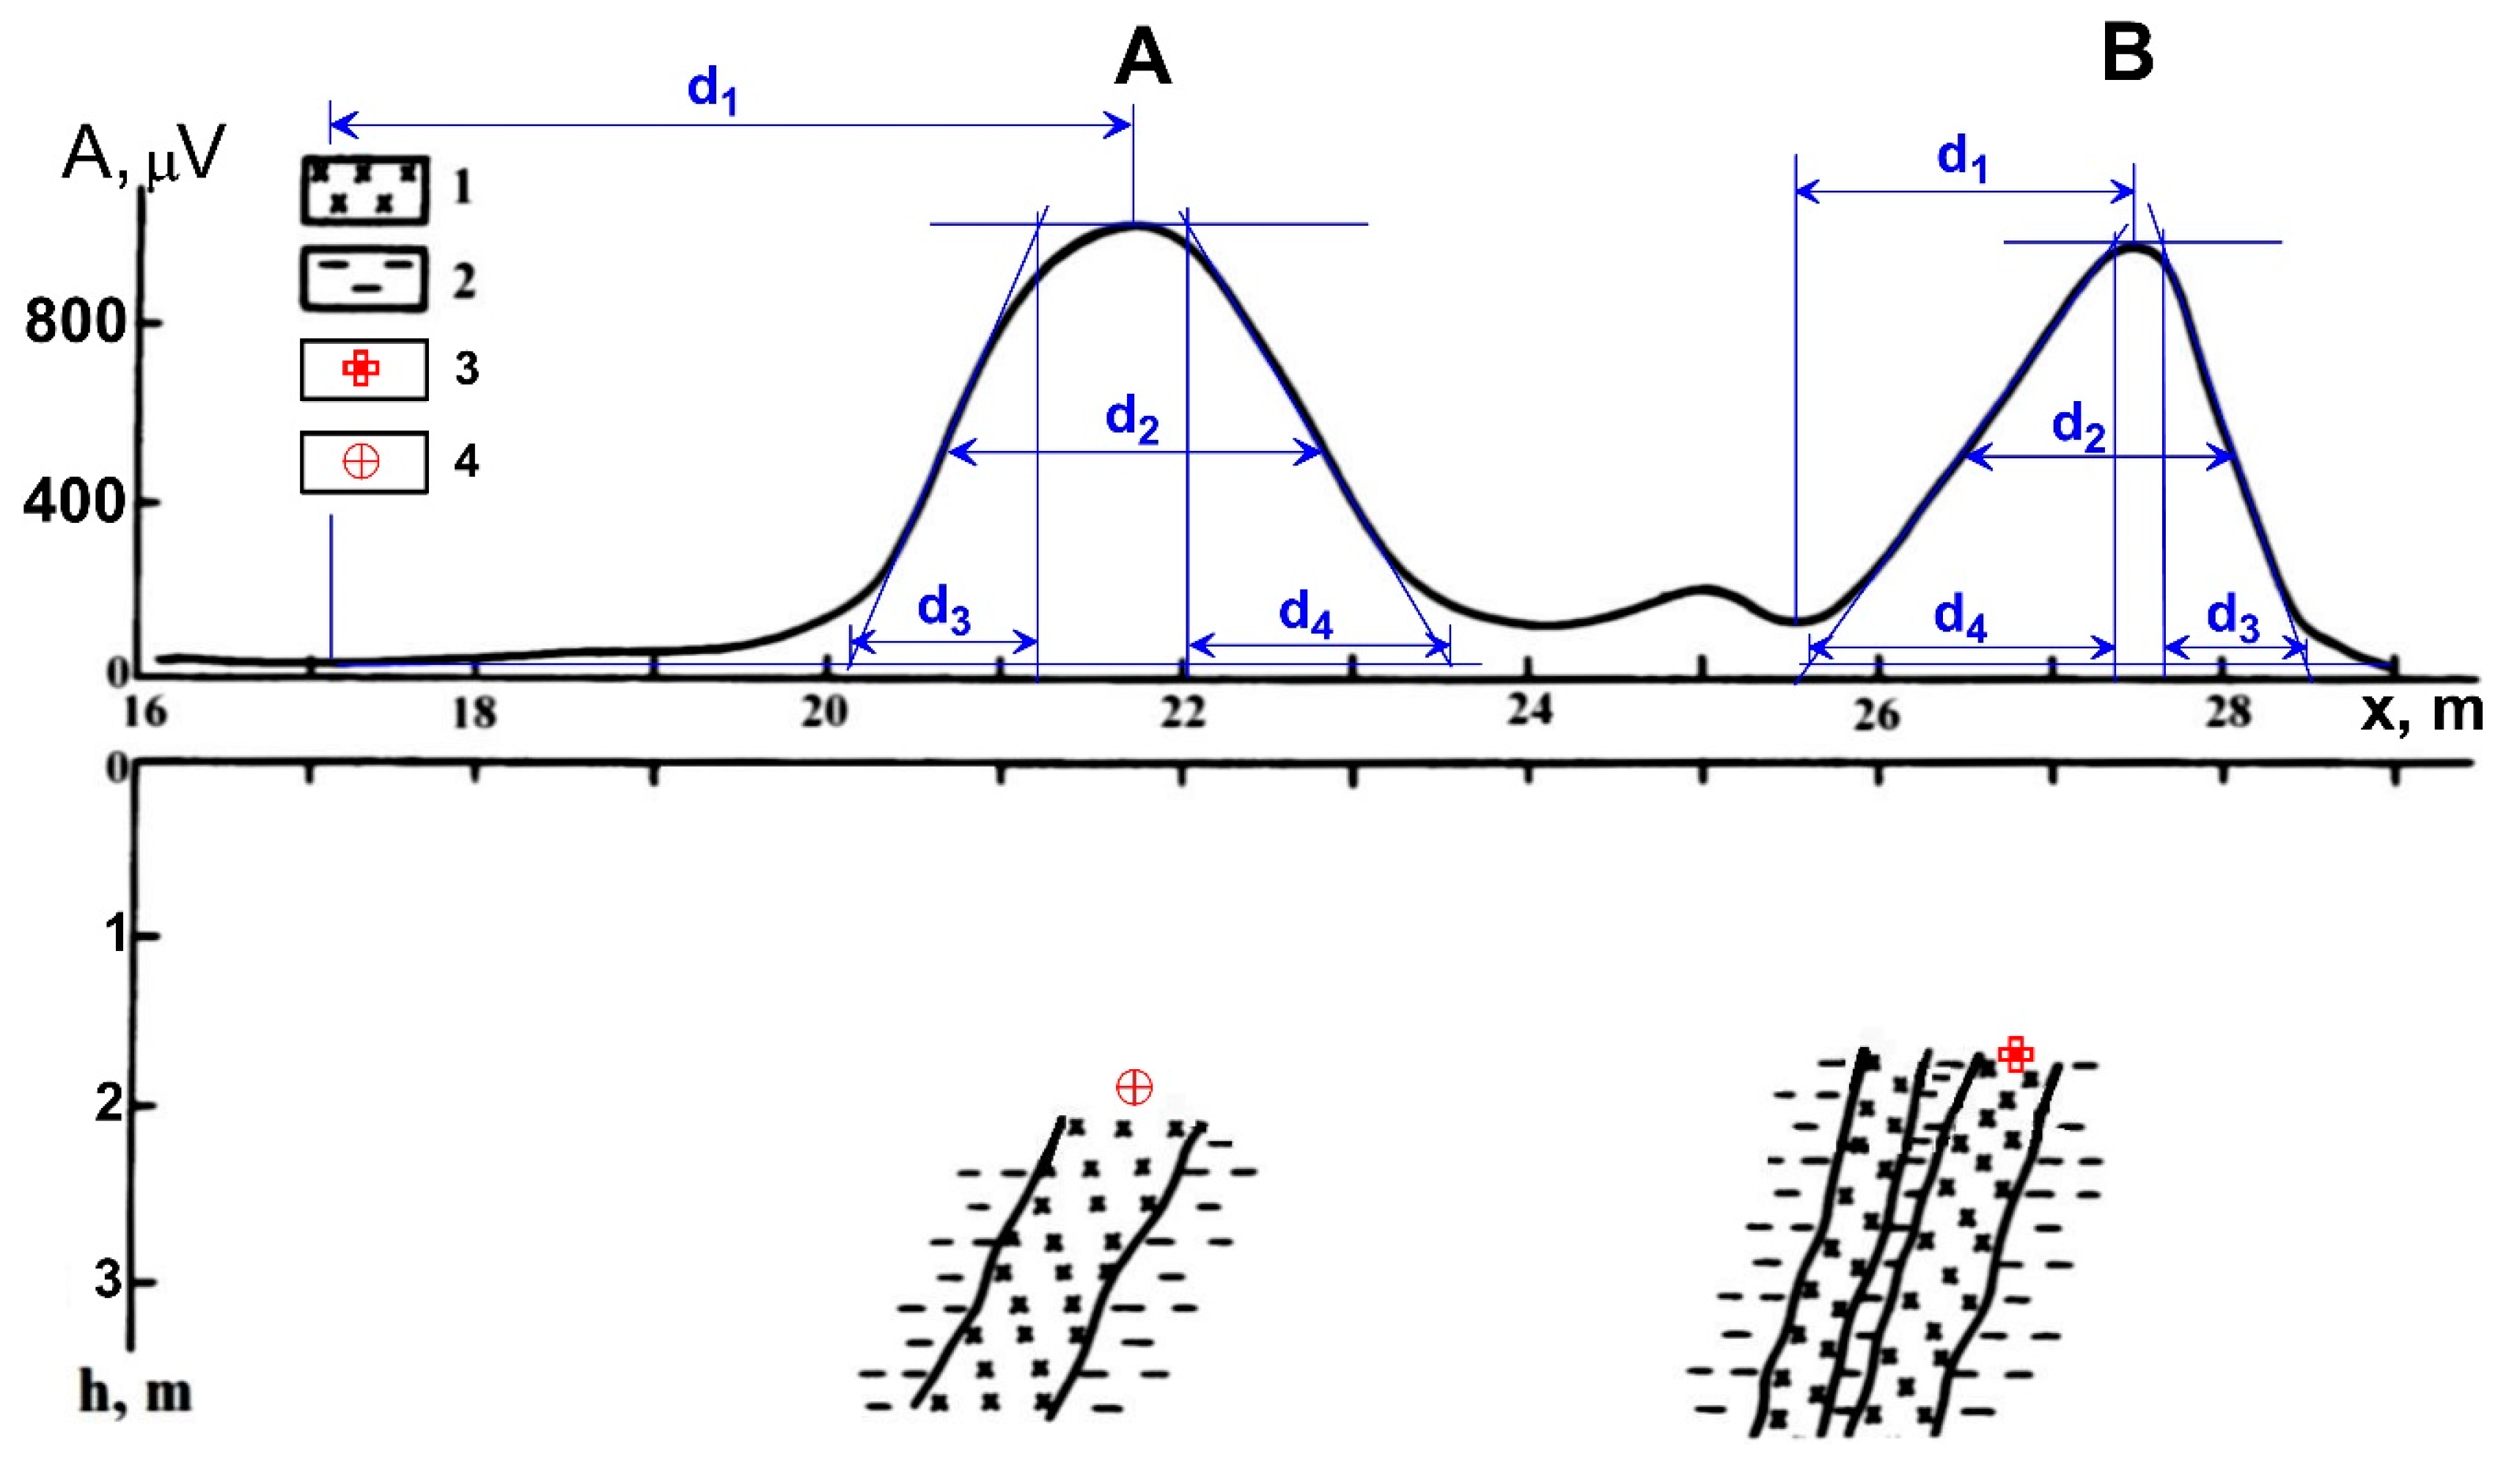
Piezoelectric profile across the central zone of the crystal-quartz deposit Pilengichey (Subpolar Ural) displays two clear anomalies with intensity about 1000 microVolt (Figure 5). Anomaly “A” and “B” were interpreted uding the HCC and thin bed models, respectively. The obtained results indicate that, if position of the upper edge center of thin bed received a good fit to the geological data, HCC position occurs above the geological body. This not large discrepancy may be explained by some host media inhomogeneities. PM for anomaly A is ≈1300 μV⋅m2, and for anomaly B—720 μV⋅m.
5.2. Case Study at the Archaeological Site Tel Kara Hadid (Southern Israel)
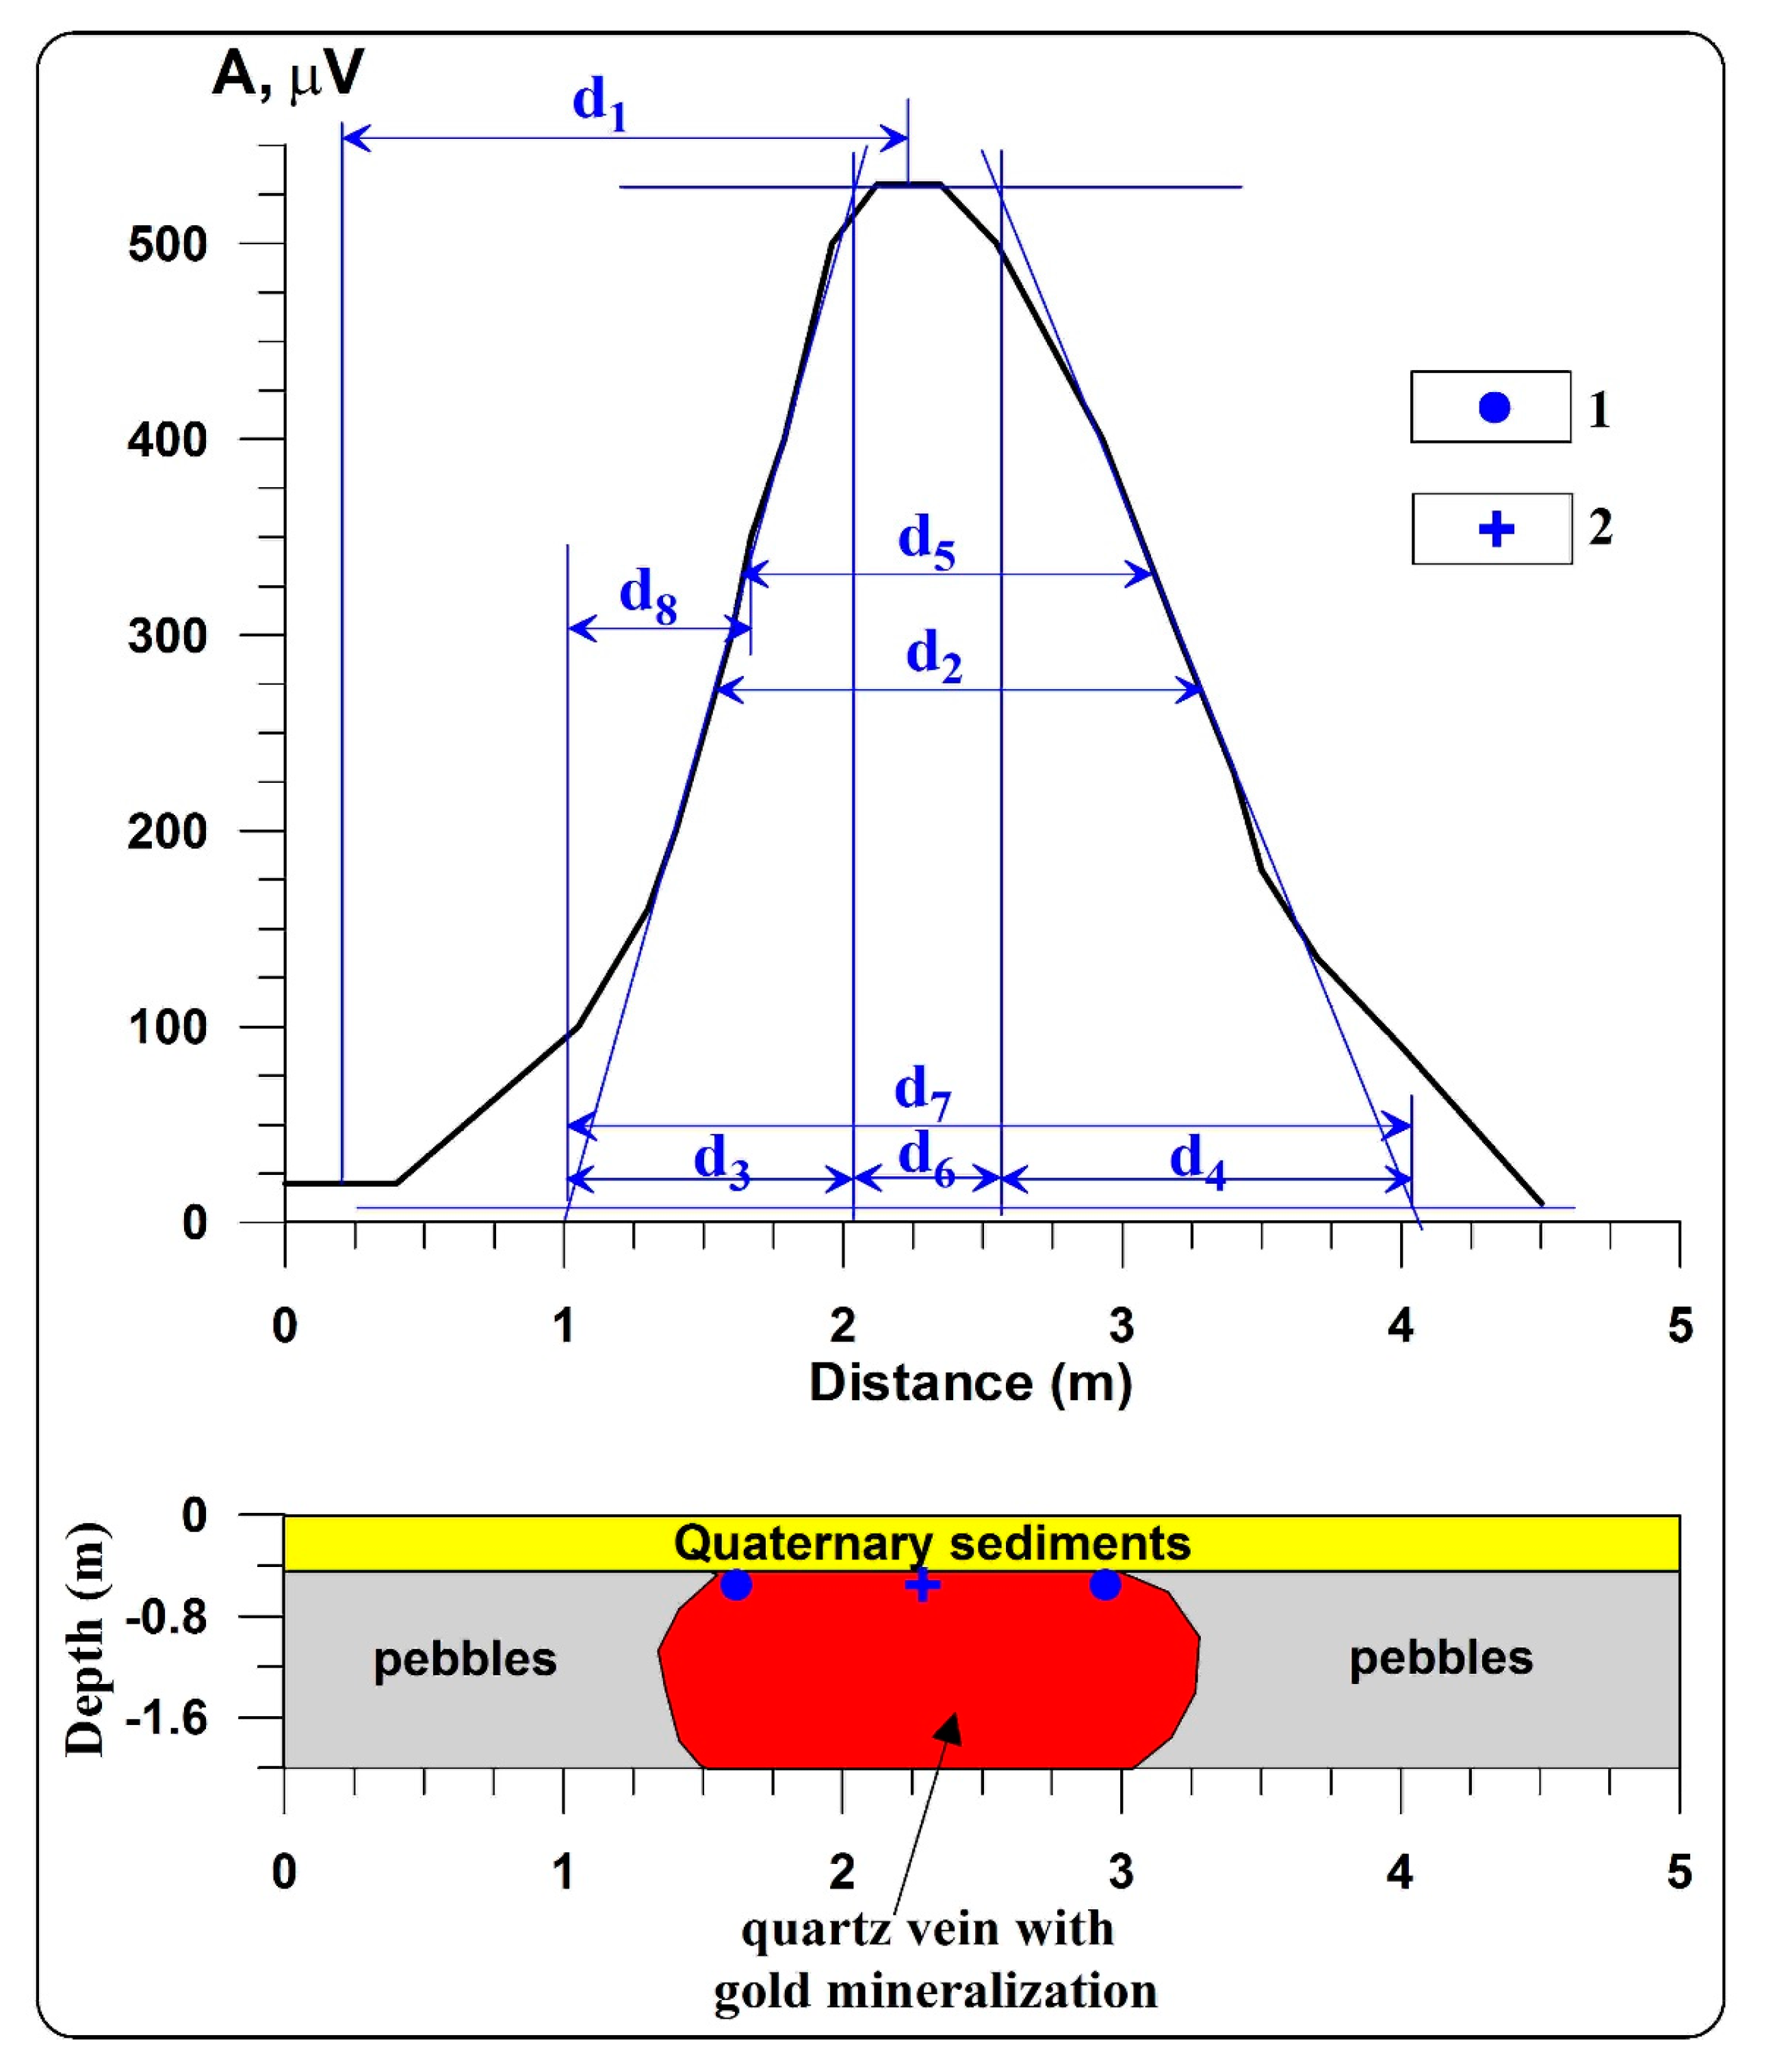
Field piezoelectric observations were conducted at an ancient archaeological site Tel Kara Hadid with gold-quartz mineralization in southern Israel, within the Precambrian terrain at the northern extension of the Arabian-Nubian Shield [14]. The area of the archaeological site is located eight kilometers north of the town of Eilat, in an area of strong industrial noise. Ancient river alluvial terraces (extremely heterogeneous at a local scale, varying from boulders to silt) cover the quartz veins and complicate their identification. Piezoelectric measurements conducted over a quartz vein covered by surface sediments (approximately of 0.4 m thickness) produced a sharp (500 microVolt) piezoelectric anomaly (Figure 6). Values recorded over the host rocks (clays and shales of basic composition) were close to zero. The observed piezoelectric anomaly was firstly quantitatively interpreted by the use of methodologies developed in magnetic prospecting for the model of thick and intermediate bodies [48]. Calculated PM here is ≈95 μV.
6. Discussion and Conclusions
The presented physical characteristics of piezoactive rocks, ores and minerals give a wide spectrum of targets for searching of which seismo/piezoelectric method may be employed. Examined peculiarities of seismo/piezoelectric signals propagation in near-surface enable accepting these observations as quasi-potential ones.
For the first time, it was shown in detail that seismoelectric/piezoelectric anomalies in the near-surface geophysics may be analyzed using effective and reliable methods (improved version of characteristic points, tangents and areal) earlier developed in magnetic prospecting. It was proposed to employ such parameter as “piezoelectric moment” for classification of seismoelectric/piezoelectric anomalies. Effectiveness of this methodology was tested on several ore targets (Russia) and archaeological object (Israel). Obviously, further employment of seismoelectric/piezoelectric modifications in archaeology may include (besides quartz bodies), first, any clay (fired clay) targets (clay was widely used in antiquity as a building material and as a matter for construction of various domestic targets). Boulytchov [19] has shown applicability of seismoelectric/piezoelectric method for delineation of underground caves (ancient caves account for at least 5–7% of archaeological targets).
At the same time, it must be underlined that proposed technology does not contradict to the conventional methodologies of piezoelectric/seismoelectric data analysis and could be applied as independent interpretation “method”.
Acknowledgments
The author would like to thank two anonymous reviewers, who thoroughly reviewed the manuscript, and their critical comments and valuable suggestions were helpful in preparing this paper.
Conflicts of Interest
The authors declare no conflict of interest.
References
- Volarovich, M.P.; Parkhomenko, E.I. Piezoelectric effect of rocks. Acad. Sci. USSR Geophys. 1955, 215–222. [Google Scholar]
- Neishdadt, N.M.; Osipov, L.N. On using of seismoelectric effects of the second type observed by pegmatites searching. Trans. VITR (All-Union Inst. Tech. Prospect. Methods) 1958, 11, 63–71. (In Russian) [Google Scholar]
- Neishdadt, N.M.; Osipov, L.N. Piezoelectric method. In Borehole and Mine Geophysics; Nedra Publisher: Moscow, Russia, 1959; pp. 153–168, 251–256, and 371–372. (In Russian) [Google Scholar]
- Neishtadt, N.M. Searching pegmatites using seismo-electric effect of the second kind. Sov. Geol. 1961, 1, 121–127. (In Russian) [Google Scholar]
- Parkhomenko, E.I. Electrification Phenomena in Rocks; Plenum Press: New York, NY, USA, 1971. [Google Scholar]
- Parkhomenko, E.I. Main peculiarities of seismoelectric effect of sedimentary rocks and ways of its using in geophysics. In Physical Properties of Rocks and Minerals under High Pressure and Temperature; Nauka Publisher: Moscow, Russia, 1977; pp. 201–208. (In Russian) [Google Scholar]
- Kondrashev, S.N. The Piezoelectric Method of Exploration; Nedra, Moscow, Engl. Transl.; University of British Columbia: Vancouver, BC, Canada, 1980. [Google Scholar]
- Sobolev, G.A.; Demin, V.M.; Narod, B.B.; White, P. Tests of piezoelectric and pulsed-radio methods for quartz vein and base-metal sulfides prospecting at Giant Yellowknife Mine, N.W.T., and Sullivan Mine, Kimberley, Canada. Geophysics 1984, 49, 2178–2185. [Google Scholar] [CrossRef]
- Neishdadt, N.M.; Mazanova, Z.V.; Suvorov, N.D. The application of piezoelectric method for searching ore-quartz deposits in Yakutia. In Seismic Methods of Studying Complicated Media in Ore Regions; NPO Rudgeofizika: Leningrad, Russia, 1986; pp. 109–116. (In Russian) [Google Scholar]
- Maxwell, M.; Russel, R.D.; Kepic, A.W.; Butler, K.E. Electromagnetic responses from seismically excited targets: Non-Piezoelectric Phenomena. Explor. Geophys. 1992, 23, 201–208. [Google Scholar] [CrossRef]
- Neishtadt, N.M.; Mazanova, Z.V.; Suvorov, V.D.; Popov, A. Technology of the piezoelectric method application in ore-quartz deposits using the Ametist-type station. In Proceedings of the Transaction of SEG-EAGE Moscow Geophysical Conference and Exhibition, Moscow, Russia, 16–19 August 1993; pp. 76–77. [Google Scholar]
- Butler, K.E.; Russell, R.D.; Kepic, A.W.; Maxwell, M. Mapping of a Stratigraphic Boundary by its Seismoelectric Response. In Proceedings of the SAGEEP 1994 Conference, Englefield, OH, USA, 27 March 1994; pp. 689–699. [Google Scholar]
- Kepic, A.W.; Maxwell, M.; Russell, R.D. Field trials of a seismoelectric method for detecting massive sulfides. Geophysics 1995, 60, 365–373. [Google Scholar] [CrossRef]
- Neishtadt, N.; Eppelbaum, L.; Levitski, A. Application of seismo-electric phenomena in exploration geophysics: Review of Russian and Israeli experience. Geophysics 2006, 71, B41–B53. [Google Scholar] [CrossRef]
- Haartsen, M.W.; Pride, S.R. Electroseismic waves from point sources in layered media. J. Geophys. Res. 1997, 102, 24745–24769. [Google Scholar] [CrossRef]
- Mikhailov, O.V.; Haarsten, M.W.; Toksoz, N. Electroseismic investigation of the shallow subsurface: Field measurements and numerical modeling. Geophysics 1997, 62, 97–105. [Google Scholar] [CrossRef]
- Sasaoka, H.; Yamanaka, S.; Ikea, M. Measurements of electric potential variation by piezoelectricity of granite. Geophys. Res. Lett. 1998, 25, 2225–2228. [Google Scholar] [CrossRef]
- Beamish, D. Characteristics of near surface electrokinetic coupling. Geophys. J. Int. 1999, 137, 231–242. [Google Scholar] [CrossRef]
- Boulytchov, A. Seismic-electric effect method on guided and reflected waves. Phys. Chem. Earth Part A Solid Earth Geod. 2000, 25, 333–336. [Google Scholar] [CrossRef]
- Neishtadt, N.M. Application of piezoelectric method in ore deposits. In Proceedings of the Transaction of the 15th Conference of Israel Mineral Science and Engineering Association, Jerusalem, Israel, 12–13 April 2000; pp. 74–78. [Google Scholar]
- Zhu, Z.; Haartsen, M.W.; Toksöz, M.N. Experimental studies of seismoelectric conversions in fluid-saturated porous media. J. Geophys. Res. Solid Earth 2000, 105, 28055–28064. [Google Scholar] [CrossRef]
- Gershenzon, N.; Bambakidis, G. Modeling of seismo-electromagnetic phenomena. Russ. J. Earth Sci. 2001, 3, 247–275. [Google Scholar] [CrossRef]
- Tiesseyre, K.P. Anomalous piezoelectric effects found in the laboratory and reconstructed y numerical simulation. Ann. Geophys. 2002, 45, 273–278. [Google Scholar]
- Butler, K.E.; Russell, R.D. Cancellation of multiple harmonic noise series in geophysical records. Geophysics 2003, 68, 1083–1090. [Google Scholar] [CrossRef]
- Pride, S.R.; Garambois, S. Electroseismic wave theory of Frenkel and more recent developments. J. Eng. Mech. 2005, 131, 898–907. [Google Scholar] [CrossRef]
- Haines, S.S.; Pride, S.R.; Klemperer, S.L.; Biodi, B. Seismoelectric imaging of shallow targets. Geophysics 2007, 72, G9–G20. [Google Scholar] [CrossRef]
- Dupuis, J.C.; Butler, K.E.; Kepic, A.W.; Harris, B.D. Anatomy of a seismoelectric conversion: Measurements and conceptual modeling in boreholes penetrating a sandy aquifer. J. Geophysl Res. 2009, 114, B10306. [Google Scholar] [CrossRef]
- Glover, P.W.J.; Jackson, M.D. Borehole electrokinetics. Lead. Edge 2010, 29, 724–728. [Google Scholar] [CrossRef]
- Schakel, M.D.; Smeulders, D.M.J.; Slob, E.C.; Heller, H.K.J. Seismoelectric interface response: Experimental results and forward model. Geophysics 2011, 76, N29–N36. [Google Scholar] [CrossRef]
- Neishtadt, N.M.; Eppelbaum, L.V. Perspectives of application of piezoelectric and seismoelectric methods in applied geophysics. Russ. Geophys. J. 2012, 51, 63–80. (In Russian) [Google Scholar]
- Gershenzon, N.I.; Bambakidis, G.; Ternovskiy, I. Coseismic electromagnetic field due to the electrokinetic effect. Geophysics 2014, 79, E217–E229. [Google Scholar] [CrossRef]
- Jouniaux, L.; Zyserman, F. A review on electrokinetically induced seismo-electrics, electro-seismics, and seismo-magnetics for Earth sciences. Solid Earth 2016, 7, 249–284. [Google Scholar] [CrossRef] [Green Version]
- Fridrichsberg, D.A. Course of Colloidal Chemistry; Chemistry Publisher: S.-Petersburg, Russia, 1995. (In Russian) [Google Scholar]
- Ivanov, A.G. The electroseismic effect of the second kind. Izv. Acad. Sci. USSR (Trans. Sov. Acad. Sci.) 1940, 5, 699–727, (In Russian, transl. to English). [Google Scholar]
- Probstein, R.F. Physiochemical Hydrodynamics: An Introduction, 2nd ed.; Wiley & Sons: New York, NY, USA, 1994. [Google Scholar]
- Frenkel, Y.I. On the theory of seismic and seismoelectric phenomena in a moist soil. Izv. Acad. Sci. USSR 1944, 133–150, (In Russian, transl. to English). [Google Scholar] [CrossRef]
- Butler, K.E. Seismoelectric Effects of Electrokinetic Origin. Ph.D. Thesis, The University of British Columbia, Vancouver, BC, Canada, 1996. [Google Scholar]
- Jardani, A.; Revil, A.; Slob, E.; Söllner, W. Stochastic joint inversion of 2D seismic and seismoelectric signals in linear poroelastic materials: A numerical investigation. Geophysics 2010, 75, N19–N31. [Google Scholar] [CrossRef]
- Mahardika, H.; Revil, A. Seismoelectric conversion generated from water-oil boundary in unsaturated porous media. In Proceedings of the Transactions of SEG Meeting, Houston, TX, USA, 22–27 September 2013; pp. 1852–1857. [Google Scholar]
- Antonova, E. Finite Elements for Electrically Unbounded Piezoelectric Vibrations. Ph.D. Thesis, McGill University, Montreal, QC, Canada, 2000. [Google Scholar]
- Jandaghian, A.A.; Jafari, A.A. Investigating the Effect of Piezoelectric layers on Circular Plates under Forced Vibration. Int. J. Adv. Des. Manuf. Technol. 2012, 5, 1–9. [Google Scholar]
- Alperovich, L.S.; Neishtadt, N.M.; Berkovitch, A.L.; Eppelbaum, L.V. Tomography approach and interpretation of the piezoelectric data. In Proceedings of the Transactions of the IX General Assembly of the European Geophysical Society, Strasbourg, France; 1997. 59/4P02. p. 546. Available online: https://www.researchgate.net/profile/Lev_Eppelbaum/publication/240527113_Tomography_approach_and_interpretation_of_the_piezoelectric_data/links/0deec531d5667bc6ab000000.pdf (accessed on 15 September 2017).
- Eppelbaum, L.V.; Itkis, S.E.; Khesin, B.E. Optimization of Magnetic Investigations in the Archaeological Sites in Israel. In Filtering, Modeling and Interpretation of Geophysical Fields at Archaeological Objects; Special Issue of Prospezioni Archeologiche; 2000; pp. 65–92. Available online: https://www.researchgate.net/publication/250613019_Optimization_of_magnetic_investigations_in_the_archaeological_sites_in_Israel (accessed on 15 September 2017).
- Eppelbaum, L.V.; Khesin, B.E.; Itkis, S.E. Prompt magnetic investigations of archaeological remains in areas of infrastructure development: Israeli experience. Archaeol. Prospect. 2001, 8, 163–185. [Google Scholar] [CrossRef]
- Eppelbaum, L.V.; Khesin, B.E.; Itkis, S.E. Archaeological geophysics in arid environments: Examples from Israel. J. Arid Environ. 2010, 74, 849–860. [Google Scholar] [CrossRef]
- Eppelbaum, L.V. Archaeological geophysics in Israel: Past, Present and Future. Adv. Geosci. 2010, 24, 45–68. [Google Scholar] [CrossRef]
- Eppelbaum, L.V. Study of magnetic anomalies over archaeological targets in urban conditions. Phys. Chem. Earth 2011, 36, 1318–1330. [Google Scholar] [CrossRef]
- Eppelbaum, L.V. Quantitative interpretation of magnetic anomalies from thick bed, horizontal plate and intermediate models under complex physical-geological environments in archaeological prospection. Archaeol. Prospect. 2015, 23, 255–268. [Google Scholar] [CrossRef]
- Eppelbaum, L.V. Quantitative Analysis of Piezoelectric and Seismoelectric Anomalies in Subsurface Geophysics. In Proceedings of the Transactions of the 13th EUG Meeting Geophysical Research Abstracts, Vienna, Austria, 23–28 April 2017; Volume 19. [Google Scholar]
- Eppelbaum, L.V.; Mishne, A.R. Unmanned Airborne Magnetic and VLF investigations: Effective Geophysical Methodology of the Near Future. Positioning 2011, 2, 112–133. [Google Scholar] [CrossRef]
- Eppelbaum, L.V. Geophysical observations at archaeological sites: Estimating informational content. Archaeol. Prospect. 2014, 21, 25–38. [Google Scholar] [CrossRef]
- Eppelbaum, L.V.; Alperovich, L.; Zheludev, V.; Pechersky, A. Application of informational and wavelet approaches for integrated processing of geophysical data in complex environments. In Proceedings of the 2011 SAGEEP Conference, Charleston, SC, USA, 10–14 April 2011; pp. 24–60. [Google Scholar]
Figure 1.
Prof. Naum Neishtadt, one of the founders of the piezoelectric method of geophysical prospecting (1927–2016).
Figure 1.
Prof. Naum Neishtadt, one of the founders of the piezoelectric method of geophysical prospecting (1927–2016).

Figure 2.
Piezoelectric measurement array (after [14] with some modifications): (1) projection of the piezoactive body to the earth’s surface; (2) geophone; and (3) electrode.
Figure 2.
Piezoelectric measurement array (after [14] with some modifications): (1) projection of the piezoactive body to the earth’s surface; (2) geophone; and (3) electrode.

Figure 3.
Quantitative analysis of piezoelectric measurements at a gold-bearing quartz deposit Ustnerinskoe (Yakutia region, Russia) (initial geological-geophysical data from [14]): (1) deluvium; (2) limestone; (3) quartz-mica shales; (4) veined quartz; and (5) obtained parameters for the model of thick bed: (a) angle points; and (b) center of the anomalous body.
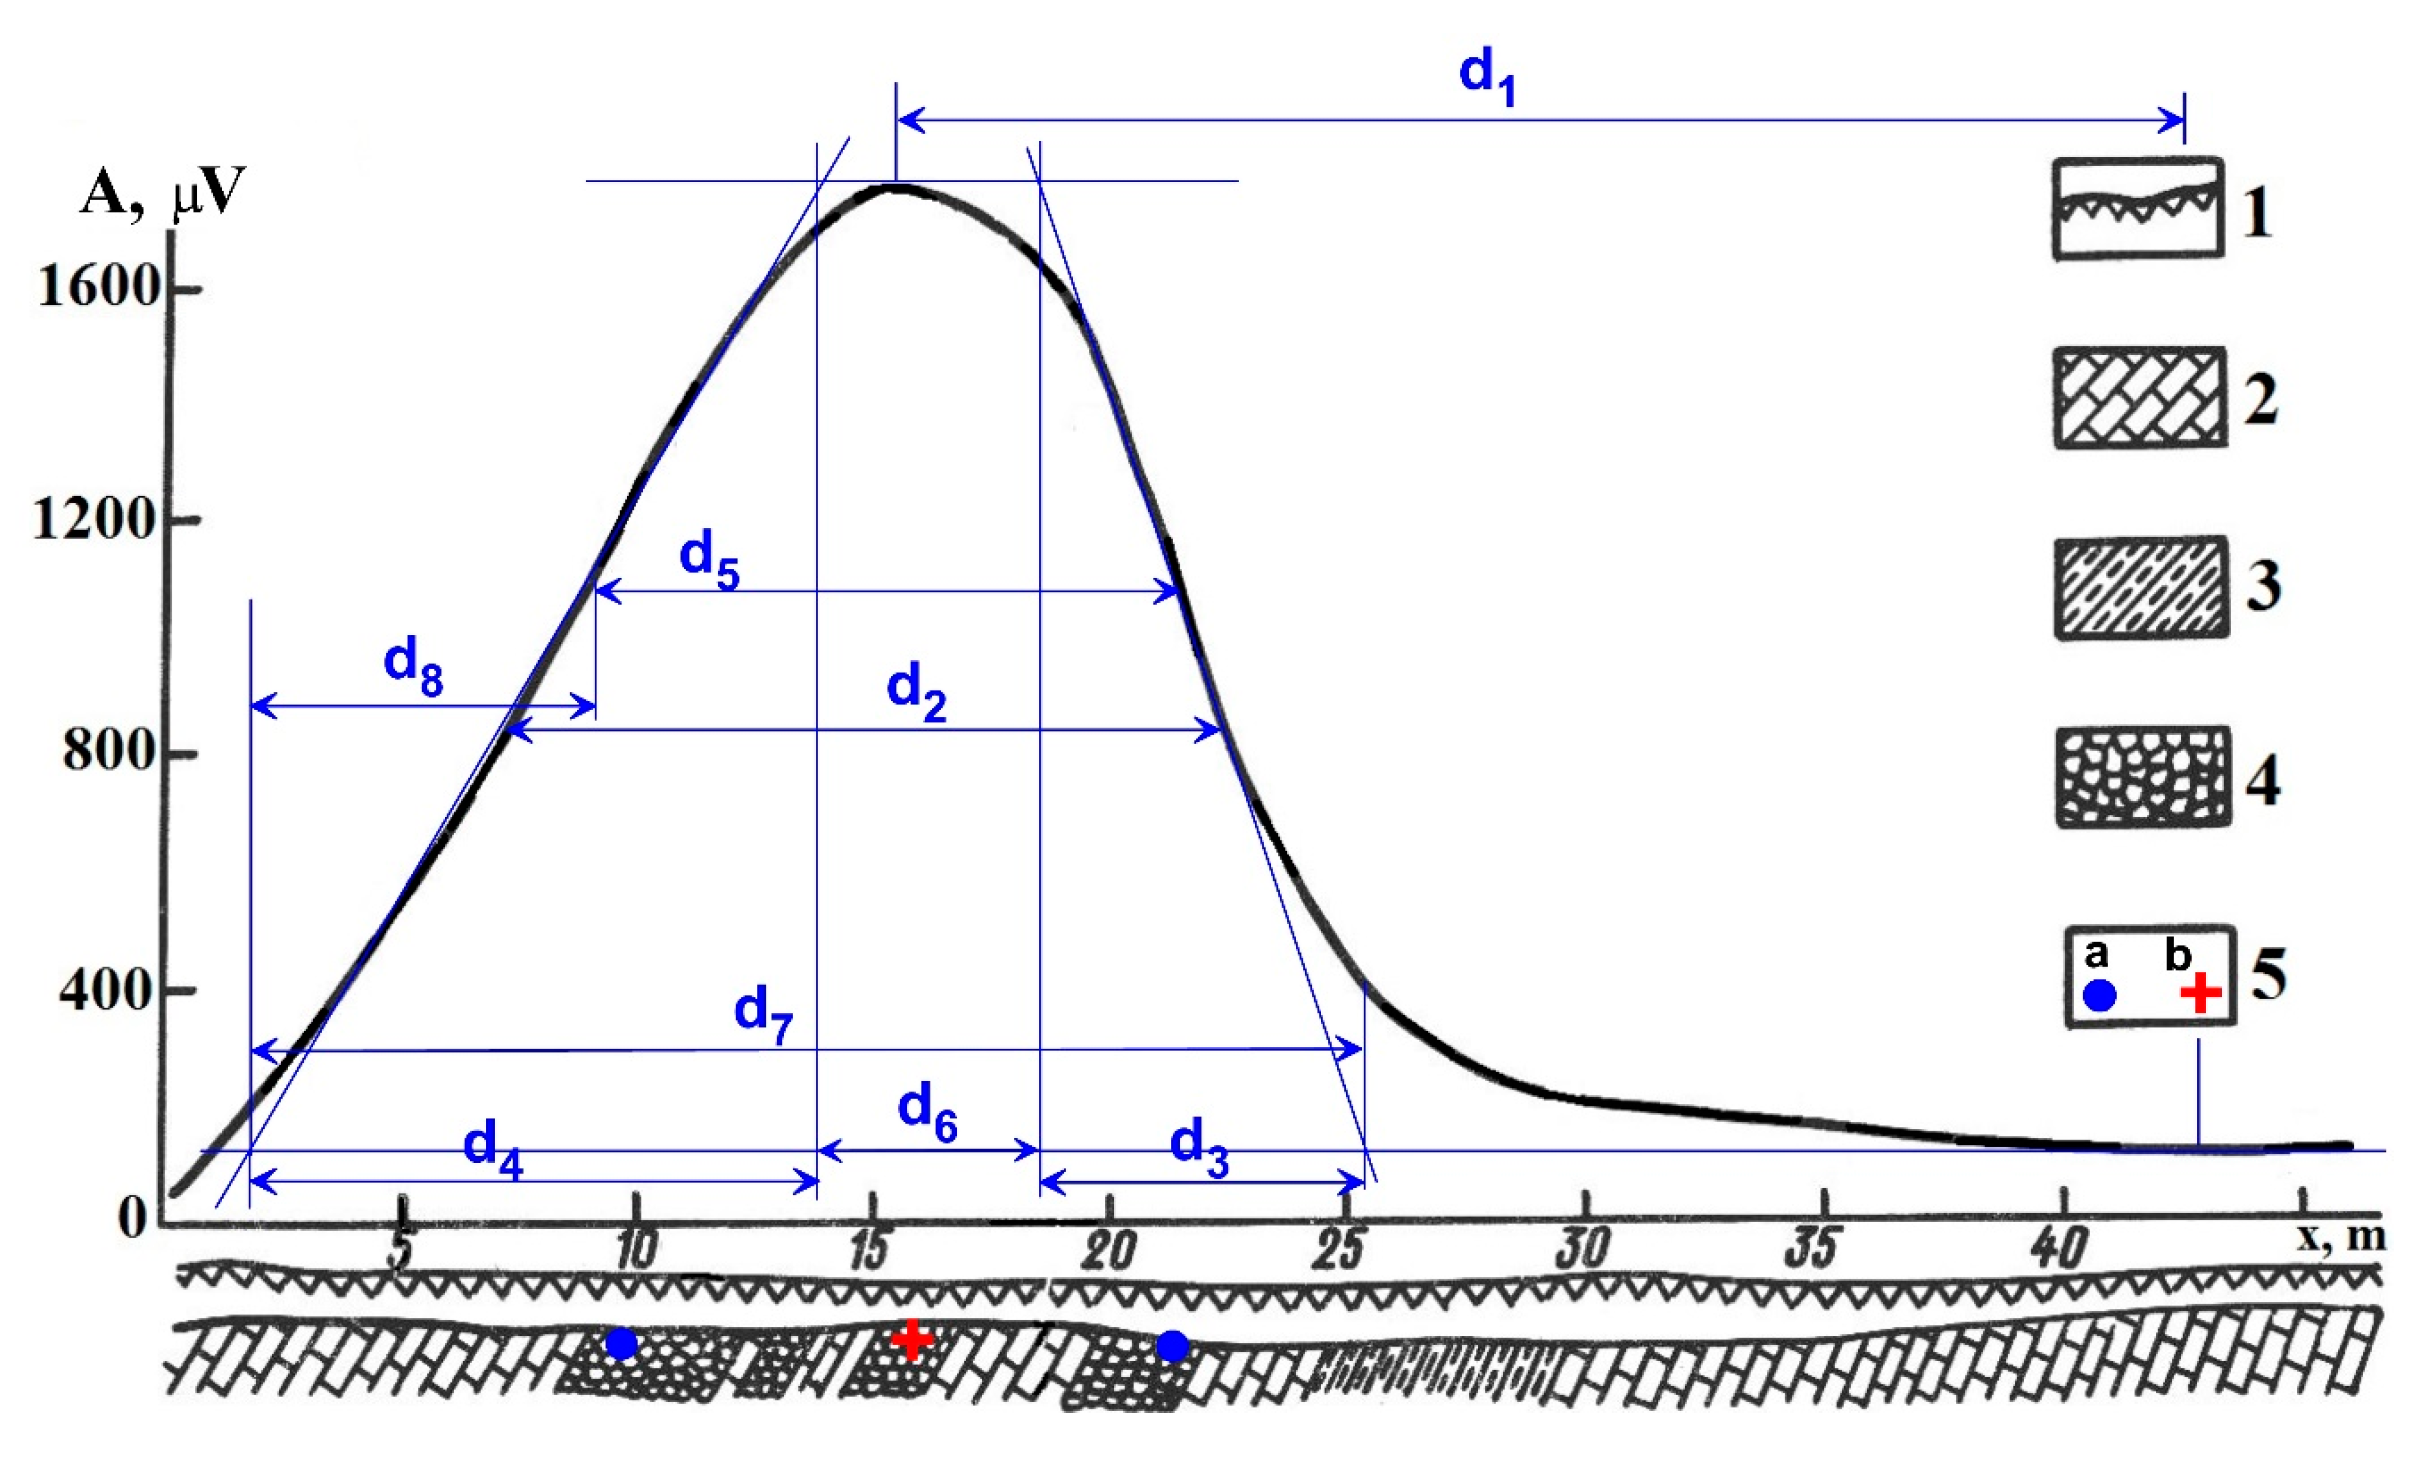
Figure 4.
Quantitative examination of piezoelectric anomaly observed at one of gold-quartz deposits of Yakutia region (Russia) (initial geological-geophysical data from [30]: (1) soil-vegetation layer; (2) oxidized upper part of quartz vein; (3) quartz vein; (4) sandstone; (5) siltstone; and (6) determined position of the center of upper edge of anomalous body.
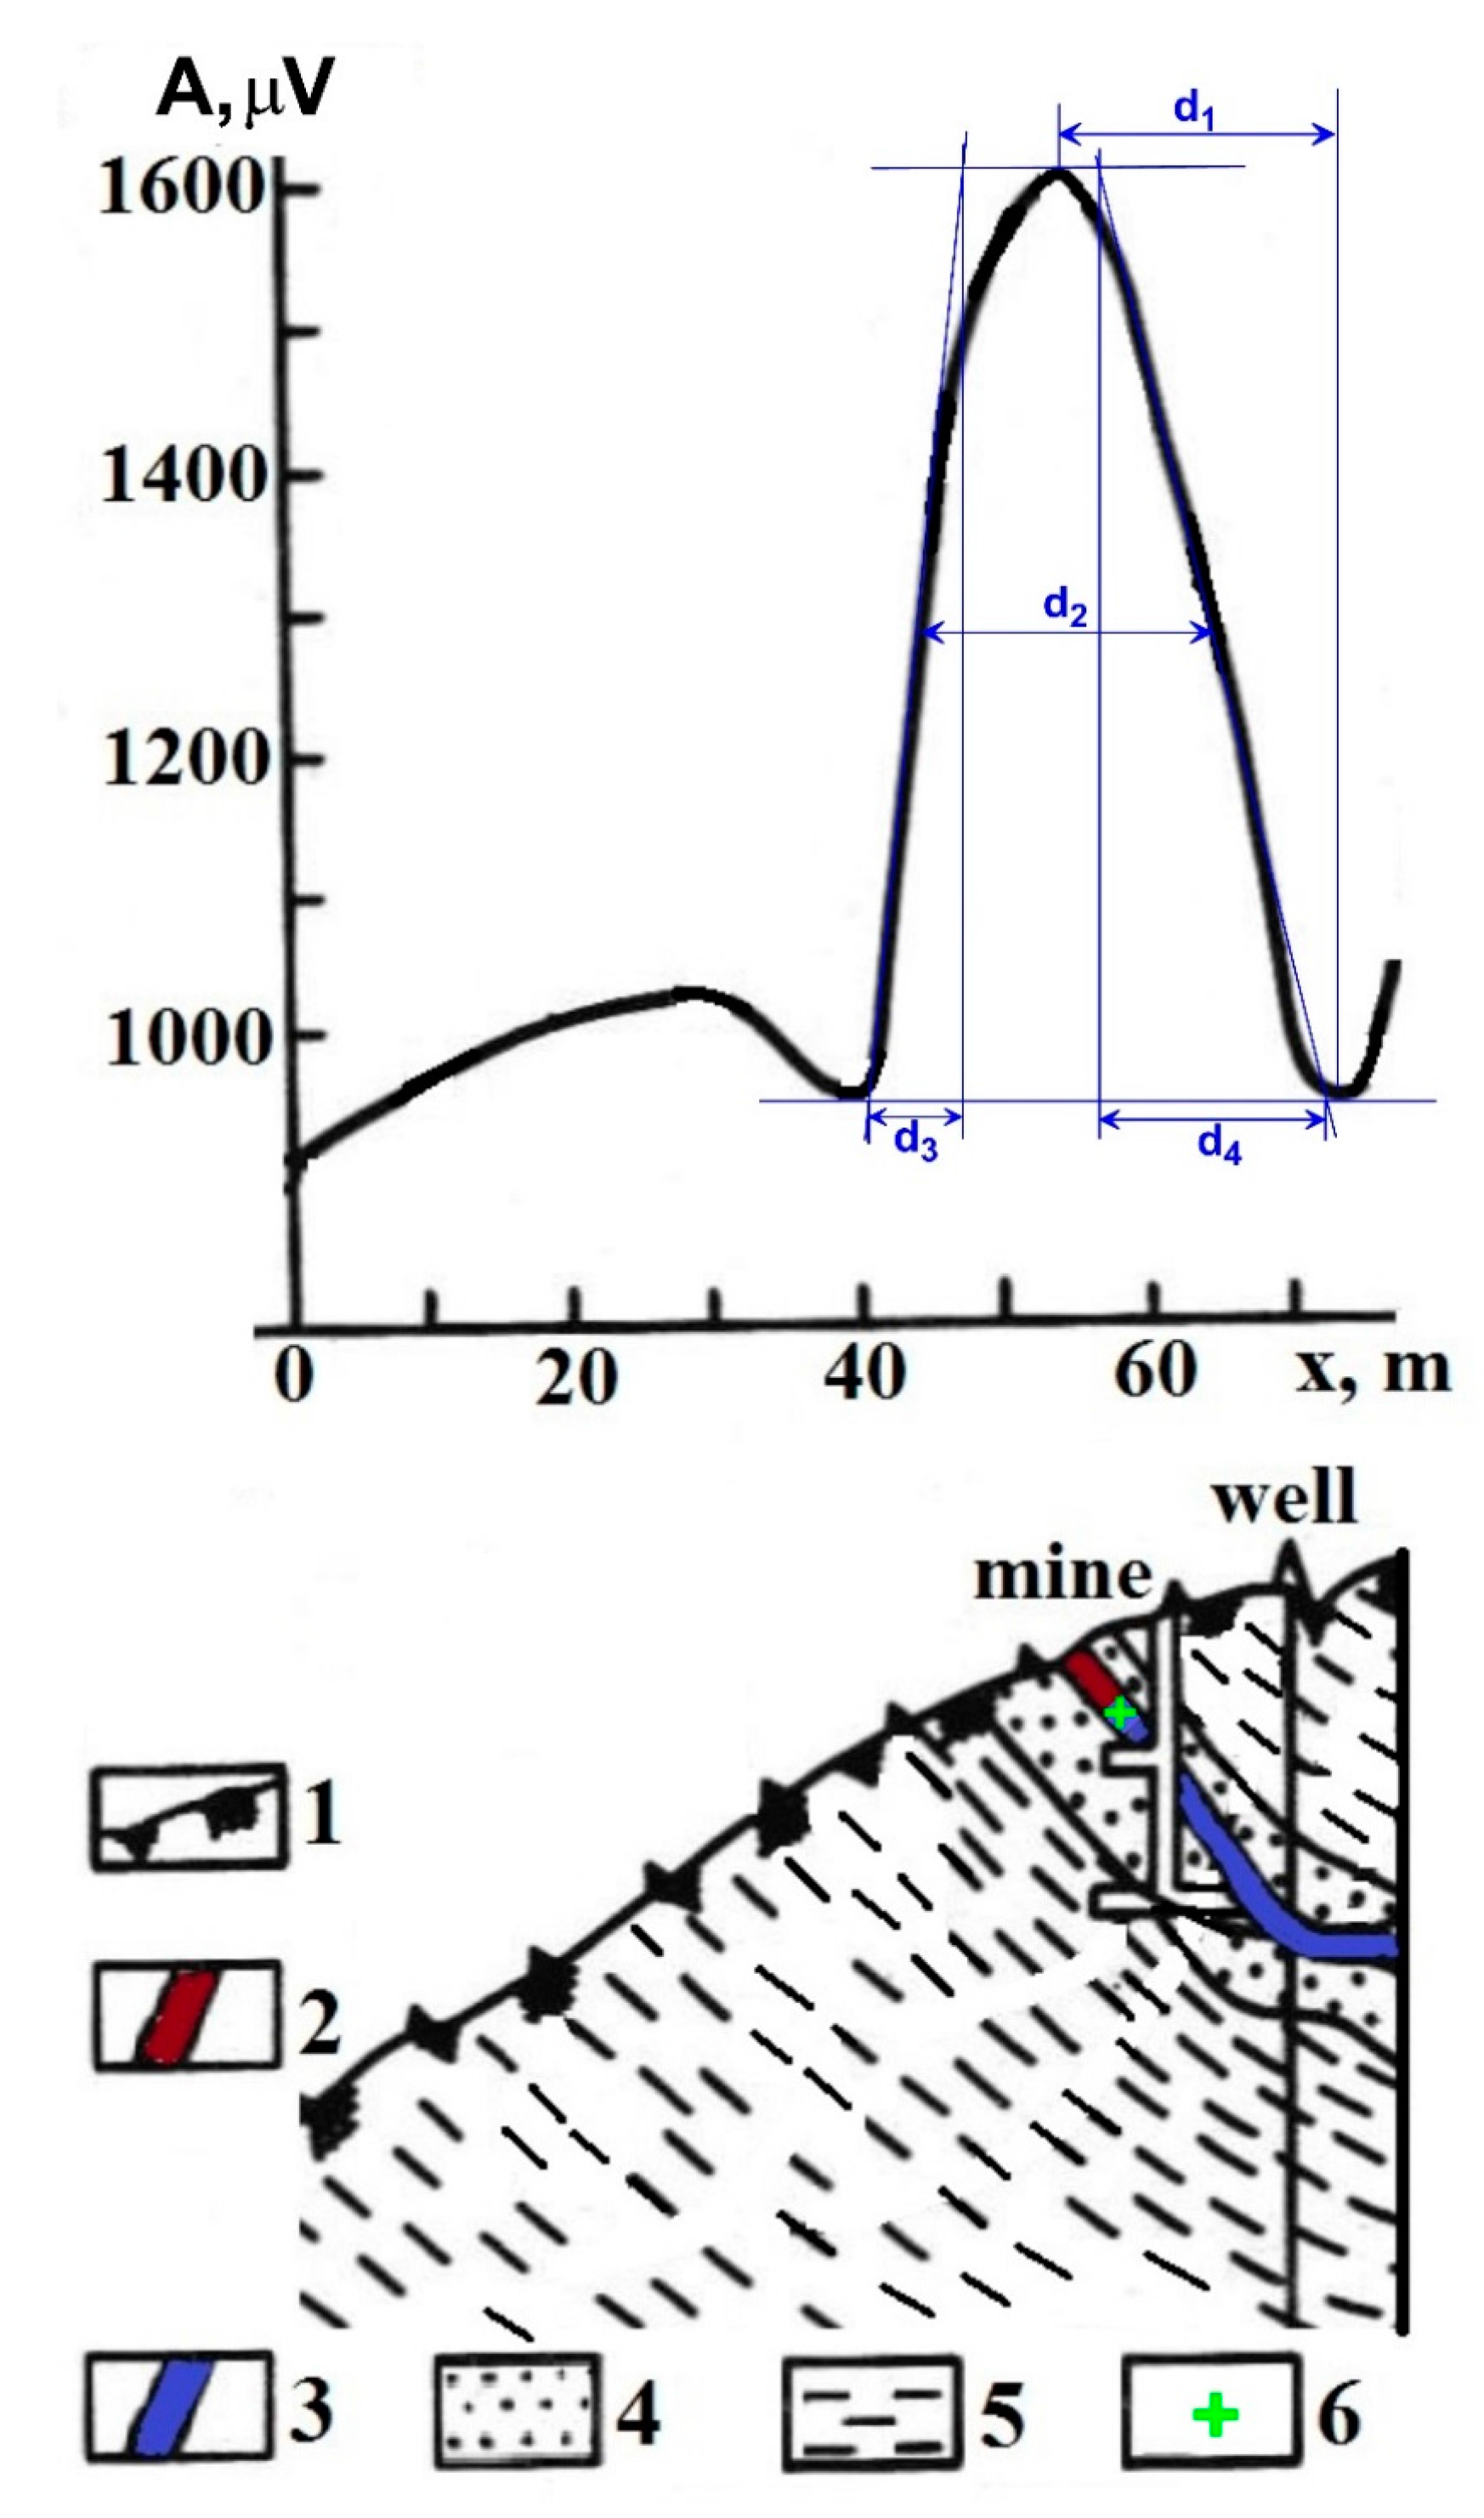
Figure 5.
Quantitative analysis of piezoelectric anomaly in the crystal-quartz deposit Pilengichey of the Subpolar Ural (Russia) (initial geological-geophysical data from [30]. (1) ore-quartz zone; (2) host rocks, siltstone; results of quantitative examination ((3) and (4)): (3) position of the center of HCC inscribed to the upper part of the anomalous body; and (4) position of the center of upper edge of a thin bed.

Figure 6.
Quantitative analysis of piezoelectric anomaly from gold-containing quartz vein (Tel Karra Hadid, southern Israel) (initial geological-geophysical data after [14]). Results of interpretation: (1) location of angle points of anomalous target; and (2) position of the center of the upper edge of anomalous target.

Table 1.
Classification of some rocks, ores, and minerals by their piezoactivity d, 10−14 Coulomb/Newton (after [14,30], with modifications).
| Piezoactivity Group | Rock/Ore/Mineral | Dmin–Dmax | Daver |
|---|---|---|---|
| I | Quartz-tourmaline-cassiterite ore | 0.8–28.0 | 15.7 |
| Antimonite-quartz ore | 0.2–1.35 | 0.6 | |
| Apatite-nepheline ore | 0–5.0 | 0.9 | |
| Galenite-sphalerite ore | 0.2–7.7 | 3.3 | |
| Ijolite | 0.1–8 | 1.3 | |
| II | Melteigite | 0.2–5.0 | 1.6 |
| Pegmatite | 0.1–4.8 | 1.3 | |
| Skarn with galenite-sphalerite mineralization | 0.1–3.0 | 0.6 | |
| Sphalerite-galenite ore | 0.3–7.7 | 3.8 | |
| Turjaite | 0.9–4.8 | 2.2 | |
| Urtite | 0.1–32.5 | 3.4 | |
| Juvite | 0.2–5.4 | 1.8 | |
| III | Aleurolite silicificated | 0–0.5 | 0.2 |
| Aplite | 0–1.7 | 0.6 | |
| Breccia aleurolite-quartz | 0.1–0.4 | 0.2 | |
| Gneiss | 0–1.4 | 0.3 | |
| Granite | 0–1.6 | 0.4 | |
| Granodiorite | 0–0.2 | 0.1 | |
| Quartzite | 0–3.3 | 0.6 | |
| Pegmatite ceramic | 0–1.0 | 0.1 | |
| Sandstone silicificated and tourmalinised | 0.1–1.4 | 0.5 | |
| Feldspars | 0–0.4 | 0.15 | |
| Porphyrite | 0–0.3 | 0.1 | |
| Ristschorrite | 0.3–0.9 | 0.5 | |
| Schist argillaceous | 0–0.6 | 0.1 | |
| Hornfels | 0–0.4 | 0.2 | |
| Skarn sphaleritic-garnet | 0–1 | 0.3 | |
| Skarn pyroxene-garnet | 0–0.2 | 0.1 | |
| IV | Aleurolite, amphibolites, andesite, gabbro, greisens, diabase, sandstone | 0–0.1 | 0.05 |
| Argillite, beresite, dacite, diorite-porphyrite, felsite-liparite, limestone, tuff, fenite | 0 | 0 |
I (highly active): piezo-activity of samples is greater than 5.0 × 10⁻¹⁴ C/N; II (moderately active): piezo-activity of samples is (0.5–5.0) × 10−14 C/N; III (weakly active): piezo-activity of samples is less than 0.5 × 10⁻¹⁴ C/N; IV (non-active): piezo-activity of samples are near zero.
© 2017 by the author. Licensee MDPI, Basel, Switzerland. This article is an open access article distributed under the terms and conditions of the Creative Commons Attribution (CC BY) license (http://creativecommons.org/licenses/by/4.0/).
Share and Cite
MDPI and ACS Style
Eppelbaum, L. Quantitative Examination of Piezoelectric/Seismoelectric Anomalies from Near-Surface Targets. Geosciences 2017, 7, 90. https://doi.org/10.3390/geosciences7030090
AMA Style
Eppelbaum L. Quantitative Examination of Piezoelectric/Seismoelectric Anomalies from Near-Surface Targets. Geosciences. 2017; 7(3):90. https://doi.org/10.3390/geosciences7030090
Chicago/Turabian StyleEppelbaum, Lev. 2017. "Quantitative Examination of Piezoelectric/Seismoelectric Anomalies from Near-Surface Targets" Geosciences 7, no. 3: 90. https://doi.org/10.3390/geosciences7030090
Note that from the first issue of 2016, this journal uses article numbers instead of page numbers. See further details here.