1. Introduction
Evacuation is an important life-saving action in any disaster, such as fires and typhoons. Specifically, evacuation behaviour is crucial for saving lives during tsunami disasters. In the 2004 Indian Ocean Tsunami event, the lack of a warning system and disaster information caused a delay in the response of citizens to the tsunami and led to approximately 230,000 casualties, including missing persons [
1]. In contrast to the 2004 event, evacuations were widely conducted during the 2011 Tohoku tsunami, and they had a significant effect on reducing casualties [
2], although the tsunami still claimed over 20,000 lives. Additionally, the effectiveness of evacuation behaviour has been statistically confirmed in previous studies. Koshimura et al. [
3] found a strong positive relationship between the tsunami height and casualty ratio for the 2004 tsunami event; however, Suppasri et al. [
4] reported that a strong relationship existed between these factors at specific locations, but not at most locations for the 2011 tsunami event. This comparison between the 2004 event and 2011 event clearly shows the importance of evacuation behaviour during tsunami disasters. As discussed above, appropriate evacuation behaviour can significantly reduce possible casualties; however, tsunamis still claim a large number of victims due to inappropriate evacuation behaviour. Thus, it is necessary to study the decision-making mechanisms that lead to both inappropriate and appropriate evacuation behaviour.
Many researchers have studied the decision-making process in tsunami disasters, and almost all of the previous studies and public surveys have focused on evacuation departures by studying the relationships among disaster awareness, disaster information, and evacuation departure [
5,
6,
7,
8,
9,
10,
11] before the 2011 event. Even for the 2011 event, many studies and surveys have been limited to general features of evacuation behaviour [
12,
13,
14], and few studies have attempted to analyse the decision-making process of shelter-choice behaviour in detail [
15,
16]. Because mega-tsunami disasters are low-frequency disasters and it is challenging to obtain sufficient data, it is challenging to study comprehensive decision-making processes, such as evacuation departures [
17], destination choice [
18], mode choice [
19], and route choice [
20], as are studied in the case of typhoon disasters. Thus, we must thoroughly investigate the decision-making processes that are associated with tsunami disasters.
Evacuation mode choice is an important decision-making behaviour in tsunami disasters that has not yet been investigated. The 2011 event revealed that car usage, which exceeded the road capacities of local communities, caused severe traffic jams and tsunami casualties [
21,
22]. Moreover, the same problem was reported in the recent 2016 Fukushima Tsunami [
23]. The importance of studying the evacuation mode choice is also globally discussed. The concerns of the high demand for car use in tsunami evacuations and the corresponding jams have been raised both in the actual evacuation events [
24,
25,
26] and the intended evacuation behaviours [
27]. However, as clearly stated in [
24], factors promoting car evacuation have not been clear. Against the worldwide context of rapid urbanization and aging society, the investigation of factors that lead to appropriate/inappropriate evacuation mode choice is expected to provide essential information and implications for future better evacuations, not only in the study area, but also in worldwide tsunami prone areas. In this study, we conducted a statistical analysis using mass questionnaire data regarding evacuation behaviours during the 2011 tsunami in Kesennuma, Miyagi Prefecture, where severe traffic jams occurred during the event [
22]. A statistical analysis revealed the factors that promote inappropriate car usage during tsunami evacuation, and the quantitative effect on the decision-making process. These findings allowed us to consider the predictability of mode choice.
The remainder of the paper is structured as follows. In
Section 2, the study materials, such as the study area and details of the questionnaire survey, and statistical methods are introduced. The results of the analysis are presented in
Section 3. The discussion and suggestions for future countermeasures are provided in
Section 4.
Section 5 concludes the paper.
2. Materials and Methods
2.1. Study Area
This study focuses on the tsunami evacuation behaviours during the 2011 tsunami in Kesennuma, Miyagi Prefecture, where severe damage occurred [
28].
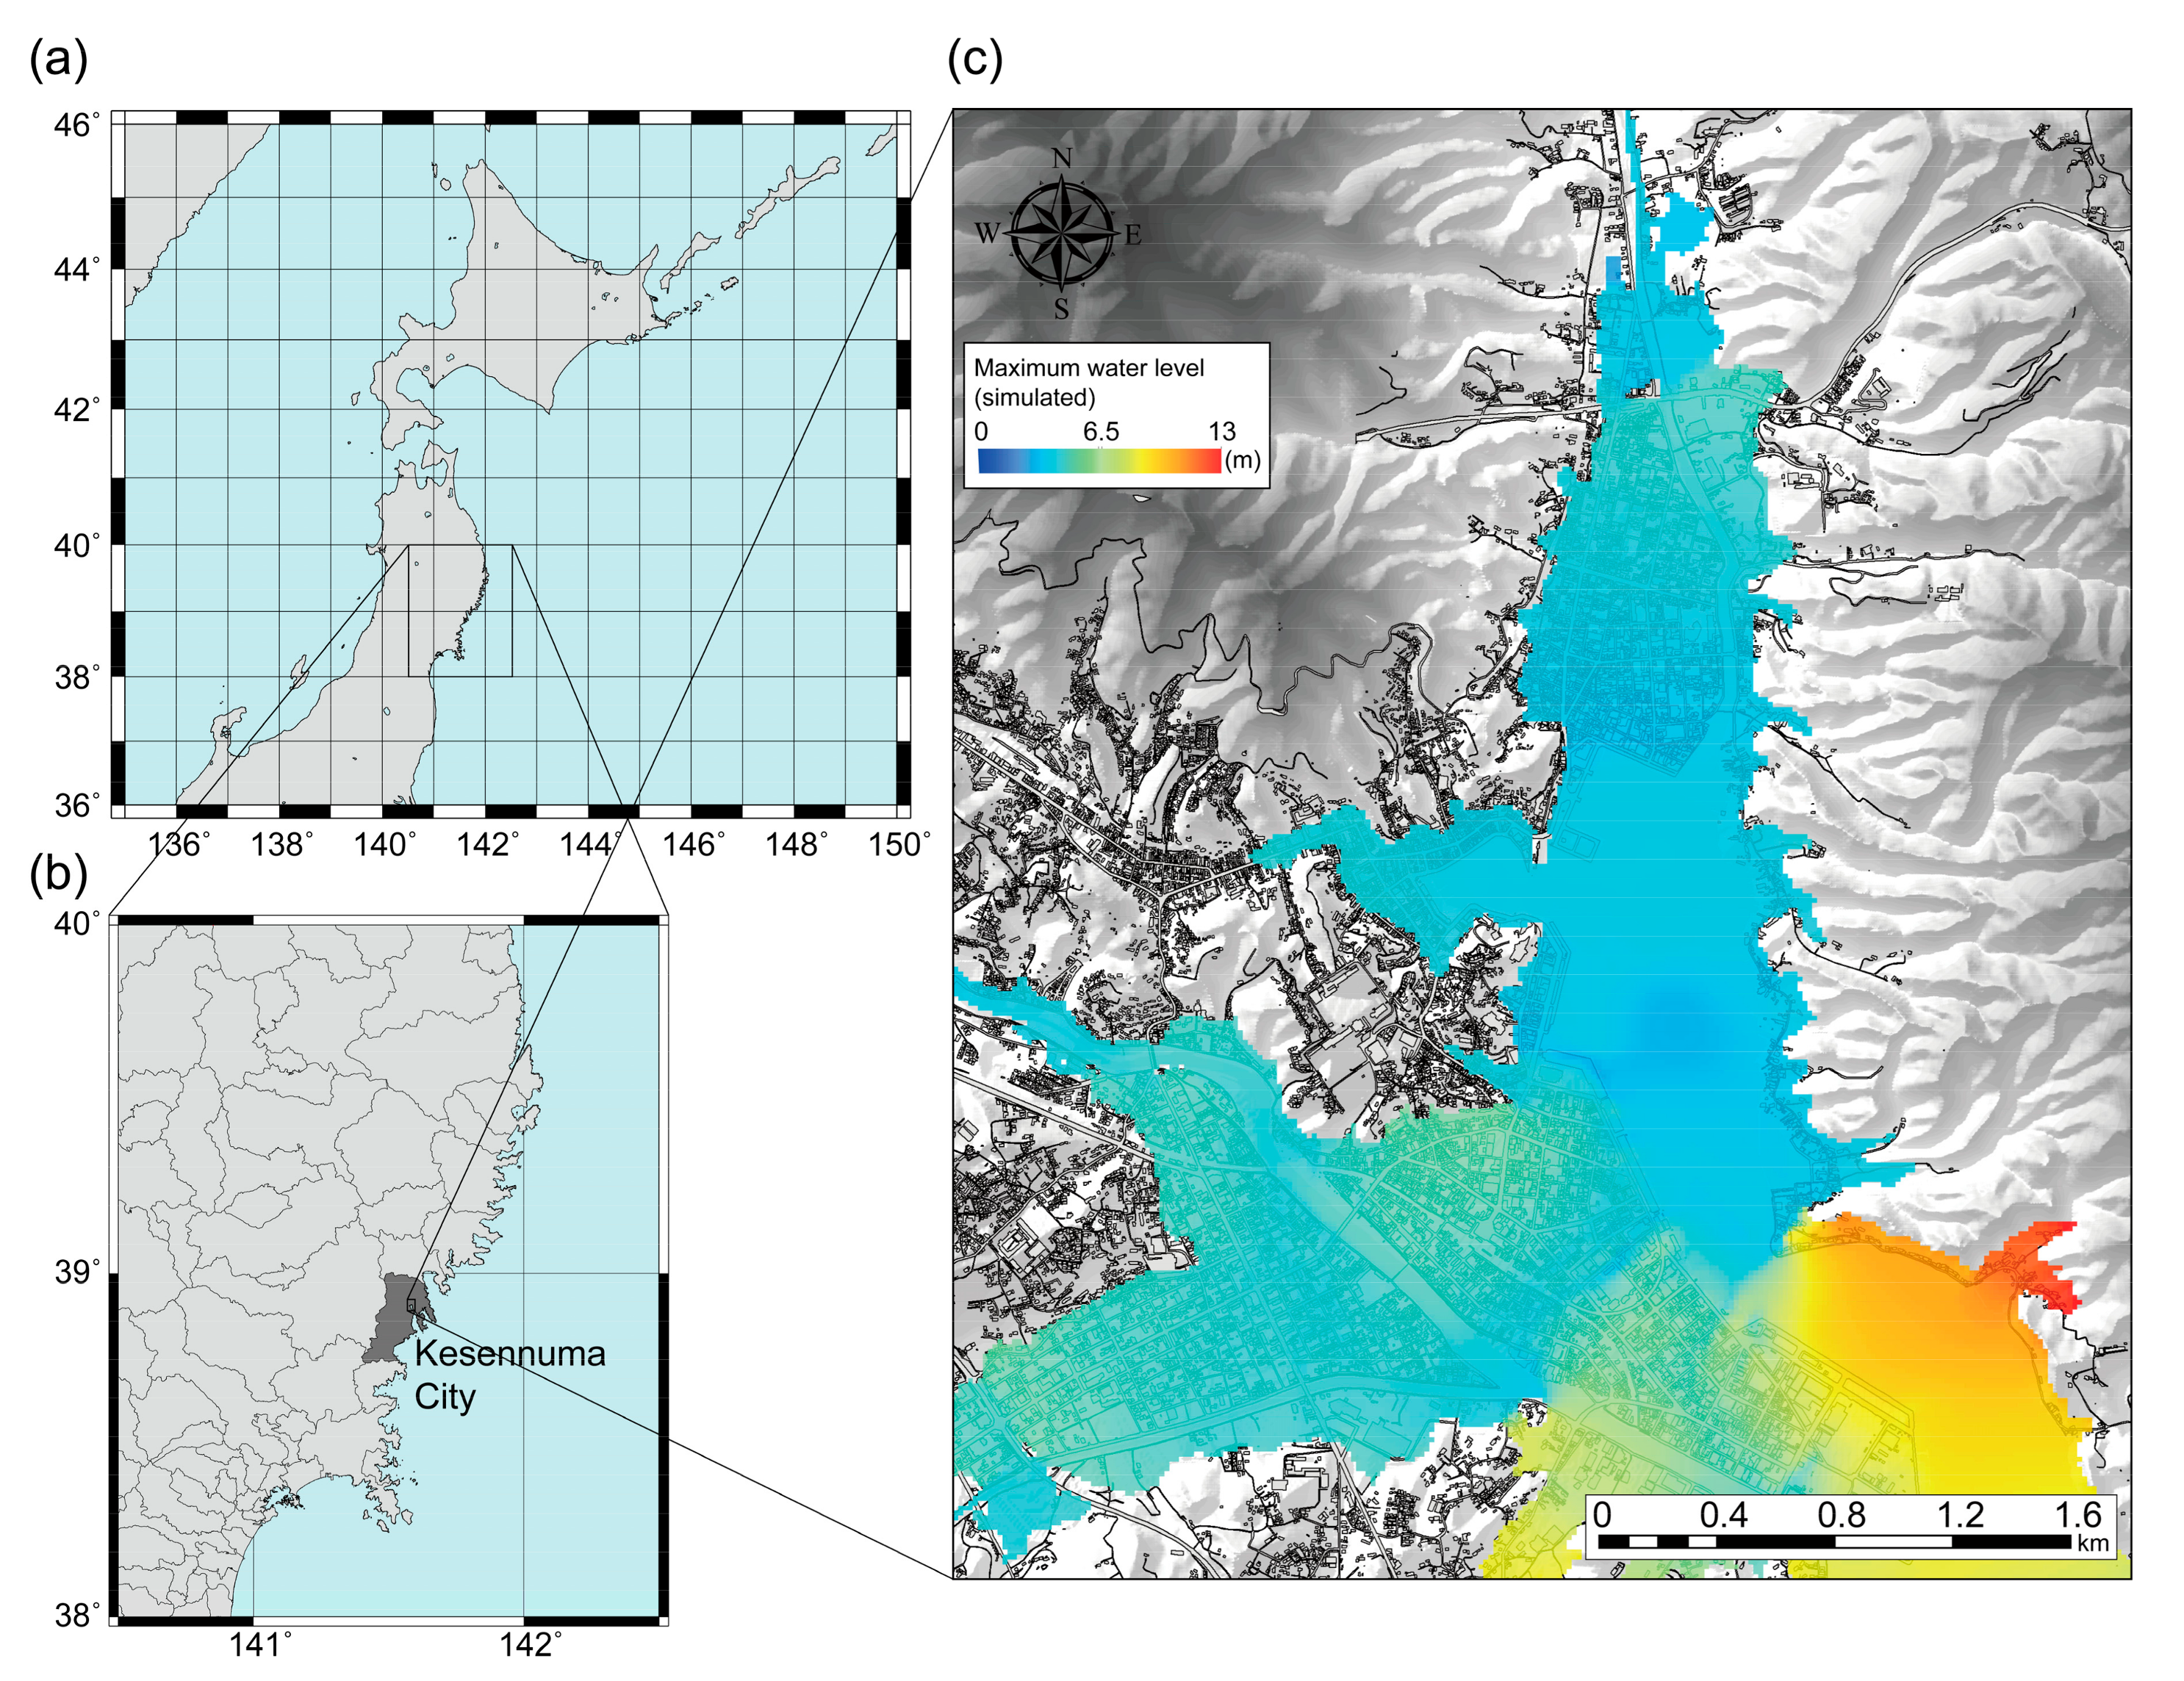
Figure 1 illustrates the location of the study area and the geographical features of the central urban area for a simulated tsunami [
29,
30]. Here, the geographical features are those before the 2011 tsunami, and the simulated tsunami was validated in a previous study [
22]. As shown in
Figure 1a,b, the study area is located in the northeast coastal part of Japan, which experienced a devastating tsunami that reached a height of over 10 m, as illustrated in
Figure 1c. Because approximately 40 min are required to perform evacuation behaviours and the study area is surrounded by areas with higher elevations, as shown in
Figure 1c, an appropriate evacuation is expected to lead to a small number of tsunami victims. However, in reality, a chaotic car evacuation process caused severe traffic jams, particularly in the central urban area, and led to a large number of casualties. Detailed information regarding the hazard intensity and the corresponding evacuation behaviours, including spatial analysis, are available in [
22]. Investigation of the possible factors that promote inappropriate car evacuation and consideration of appropriate countermeasures are required for future tsunamis.
2.2. Questionnaire Survey
A questionnaire survey was conducted by the municipal government in July 2013, approximately two years after the 2011 event. Responders were limited to residents whose age was over 16 years old as of 2 April 2013, in order to ensure the satisfactory quality of the answers. The constructed written questionnaires were distributed to 26,291 households in Kesennuma and were collected by mail. The government sent three copies of the questionnaire to each household. The questions focused on individual characteristics (e.g., age, sex and existence of vulnerable people in a family), general features of evacuation behaviours during the 2011 event (e.g., departure times and evacuation mode) and evacuation preference in future events. The total number of responses was 15,408, or approximately 24% of the predicted number of target residents based on the population over 16, i.e., 65,138 people at that time.
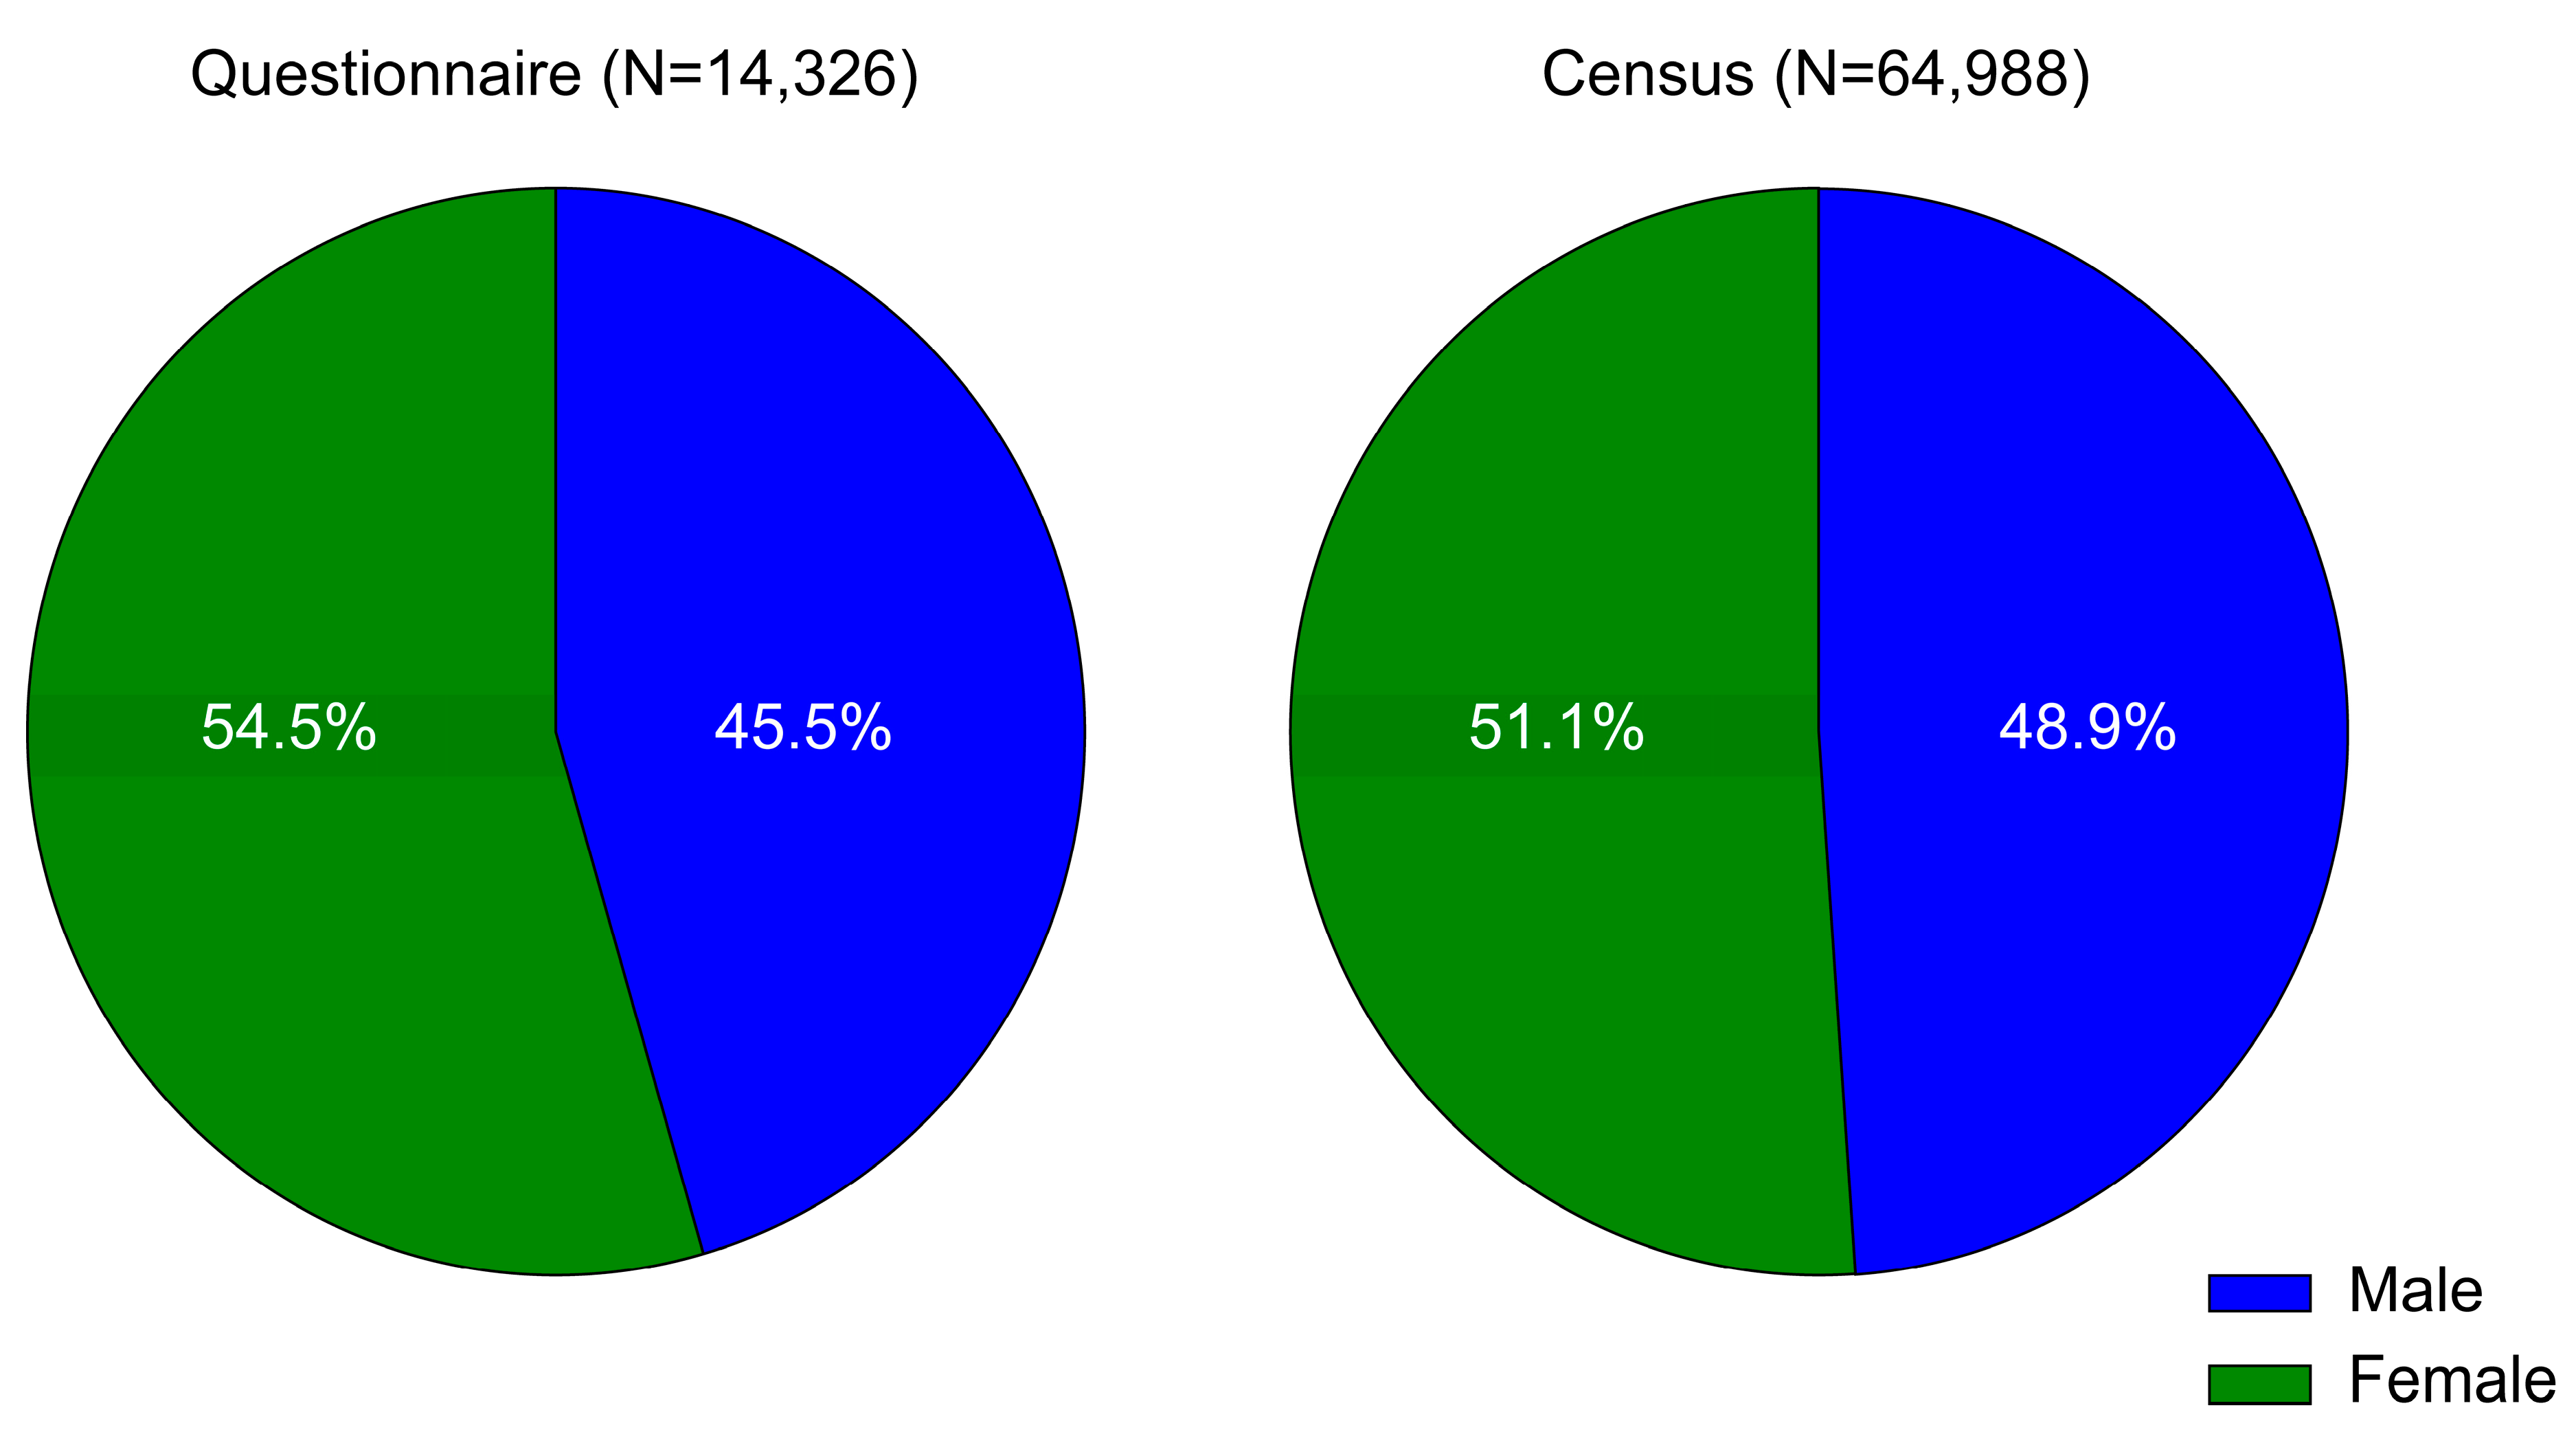
Figure 2 illustrates a comparison of the sex composition ratio between the survey and the latest census in 2015. Although the survey result included a higher percentage of females than that in the census result, the survey result yielded a similar sex comparison ratio.
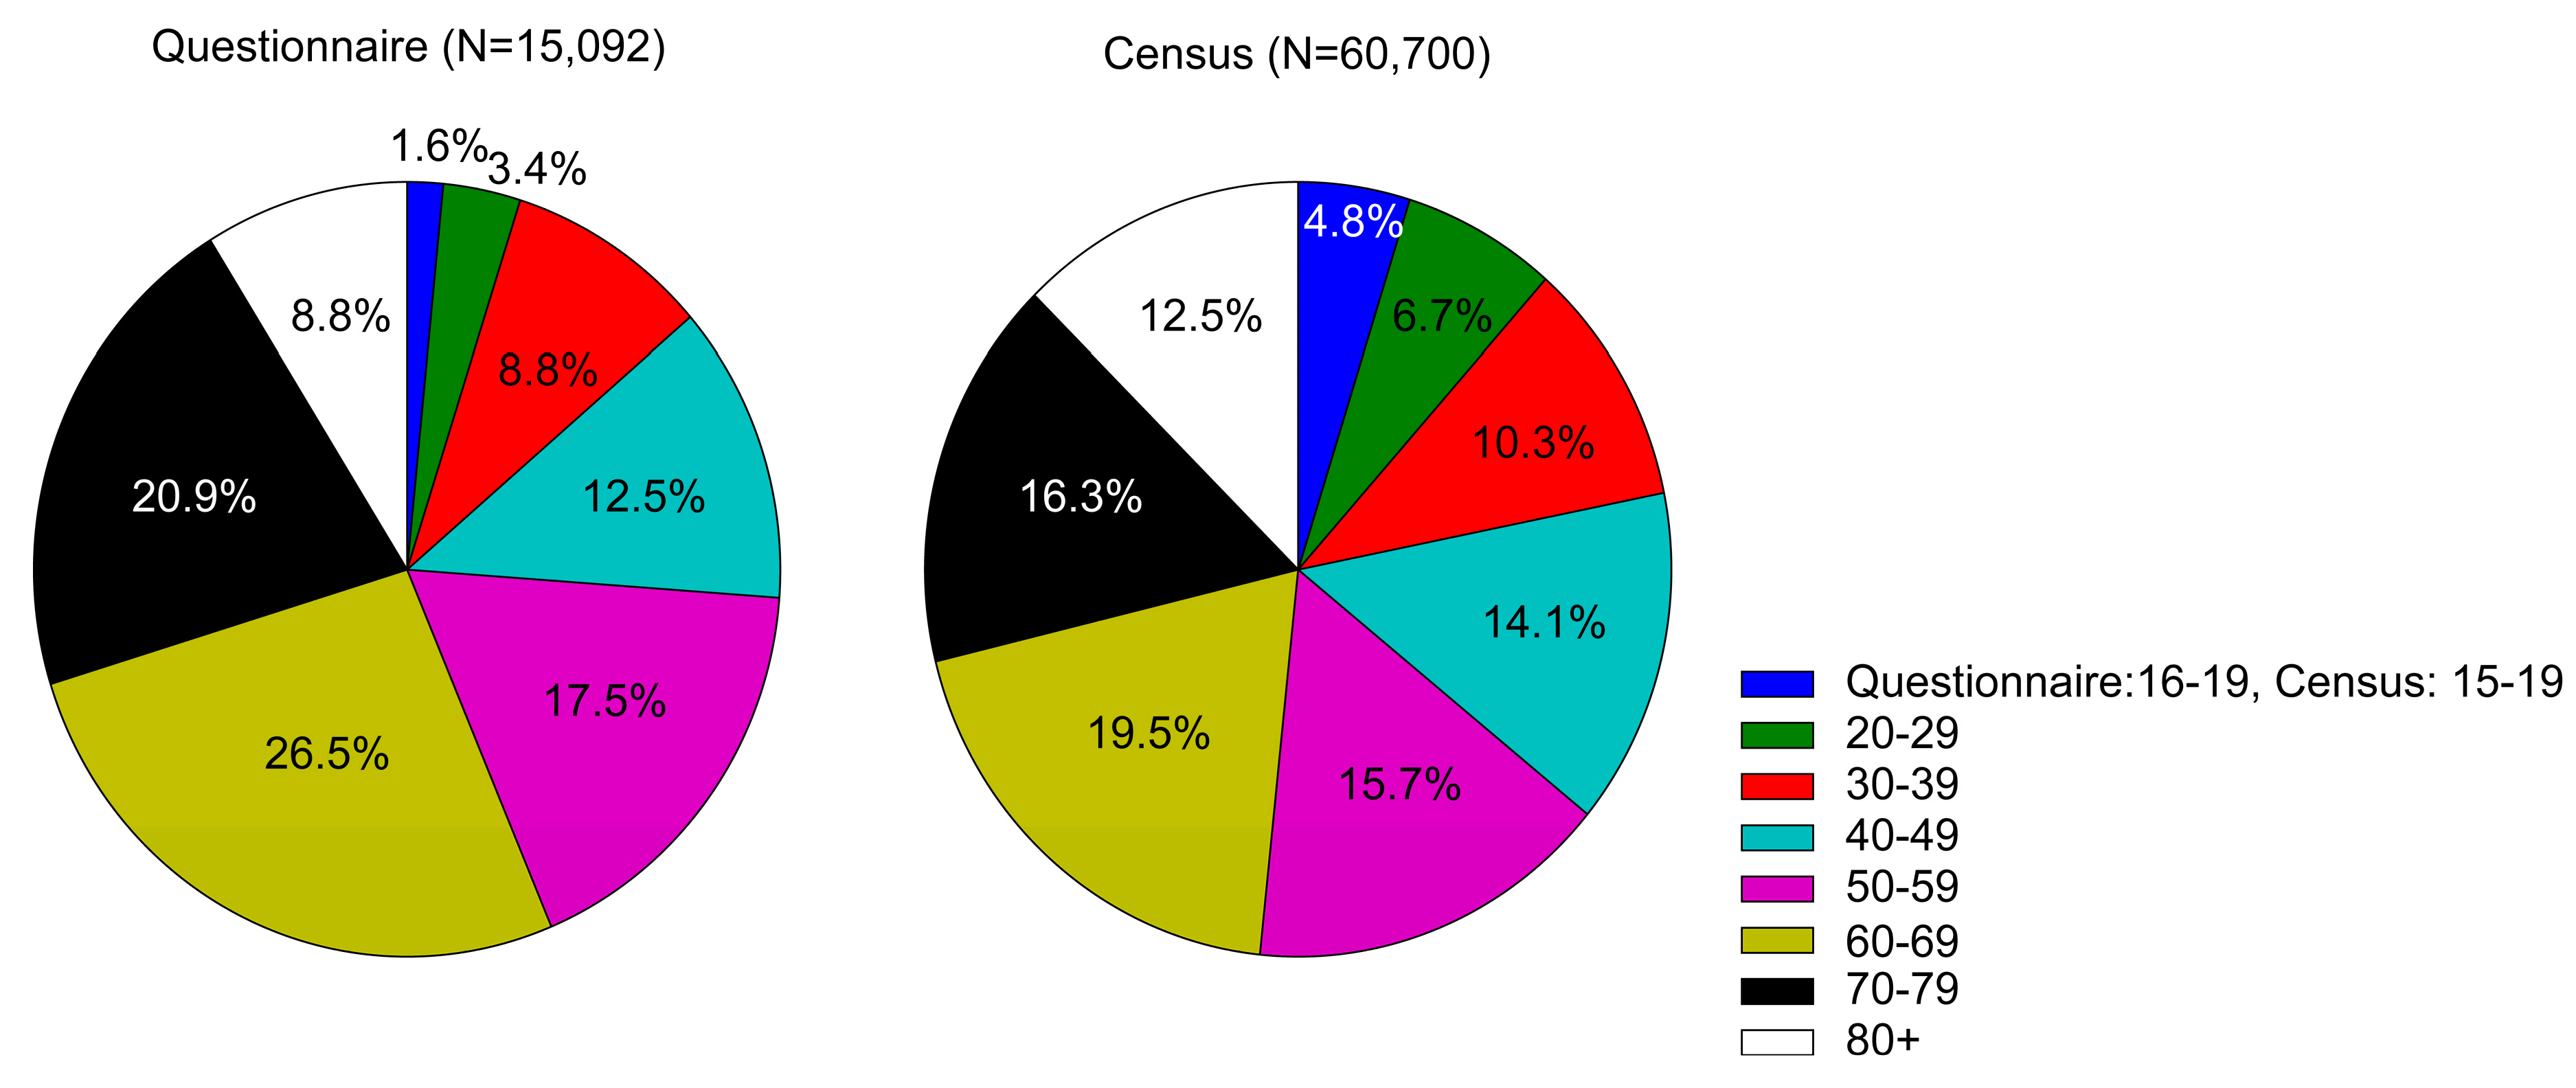
Figure 3 shows a comparison of the age composition ratio for the same data. Here, a small difference exists in the range of ages between the survey and the census. The survey obtained answers from a wide variety of ages, and there were no substantial differences between the survey and the census. The comparisons above indicate that the survey quality is satisfactory, i.e., statistical analysis is expected to return useful knowledge for assessing and discussing actual evacuation behaviours in the target area.
2.3. Simple and Cross Tabulation
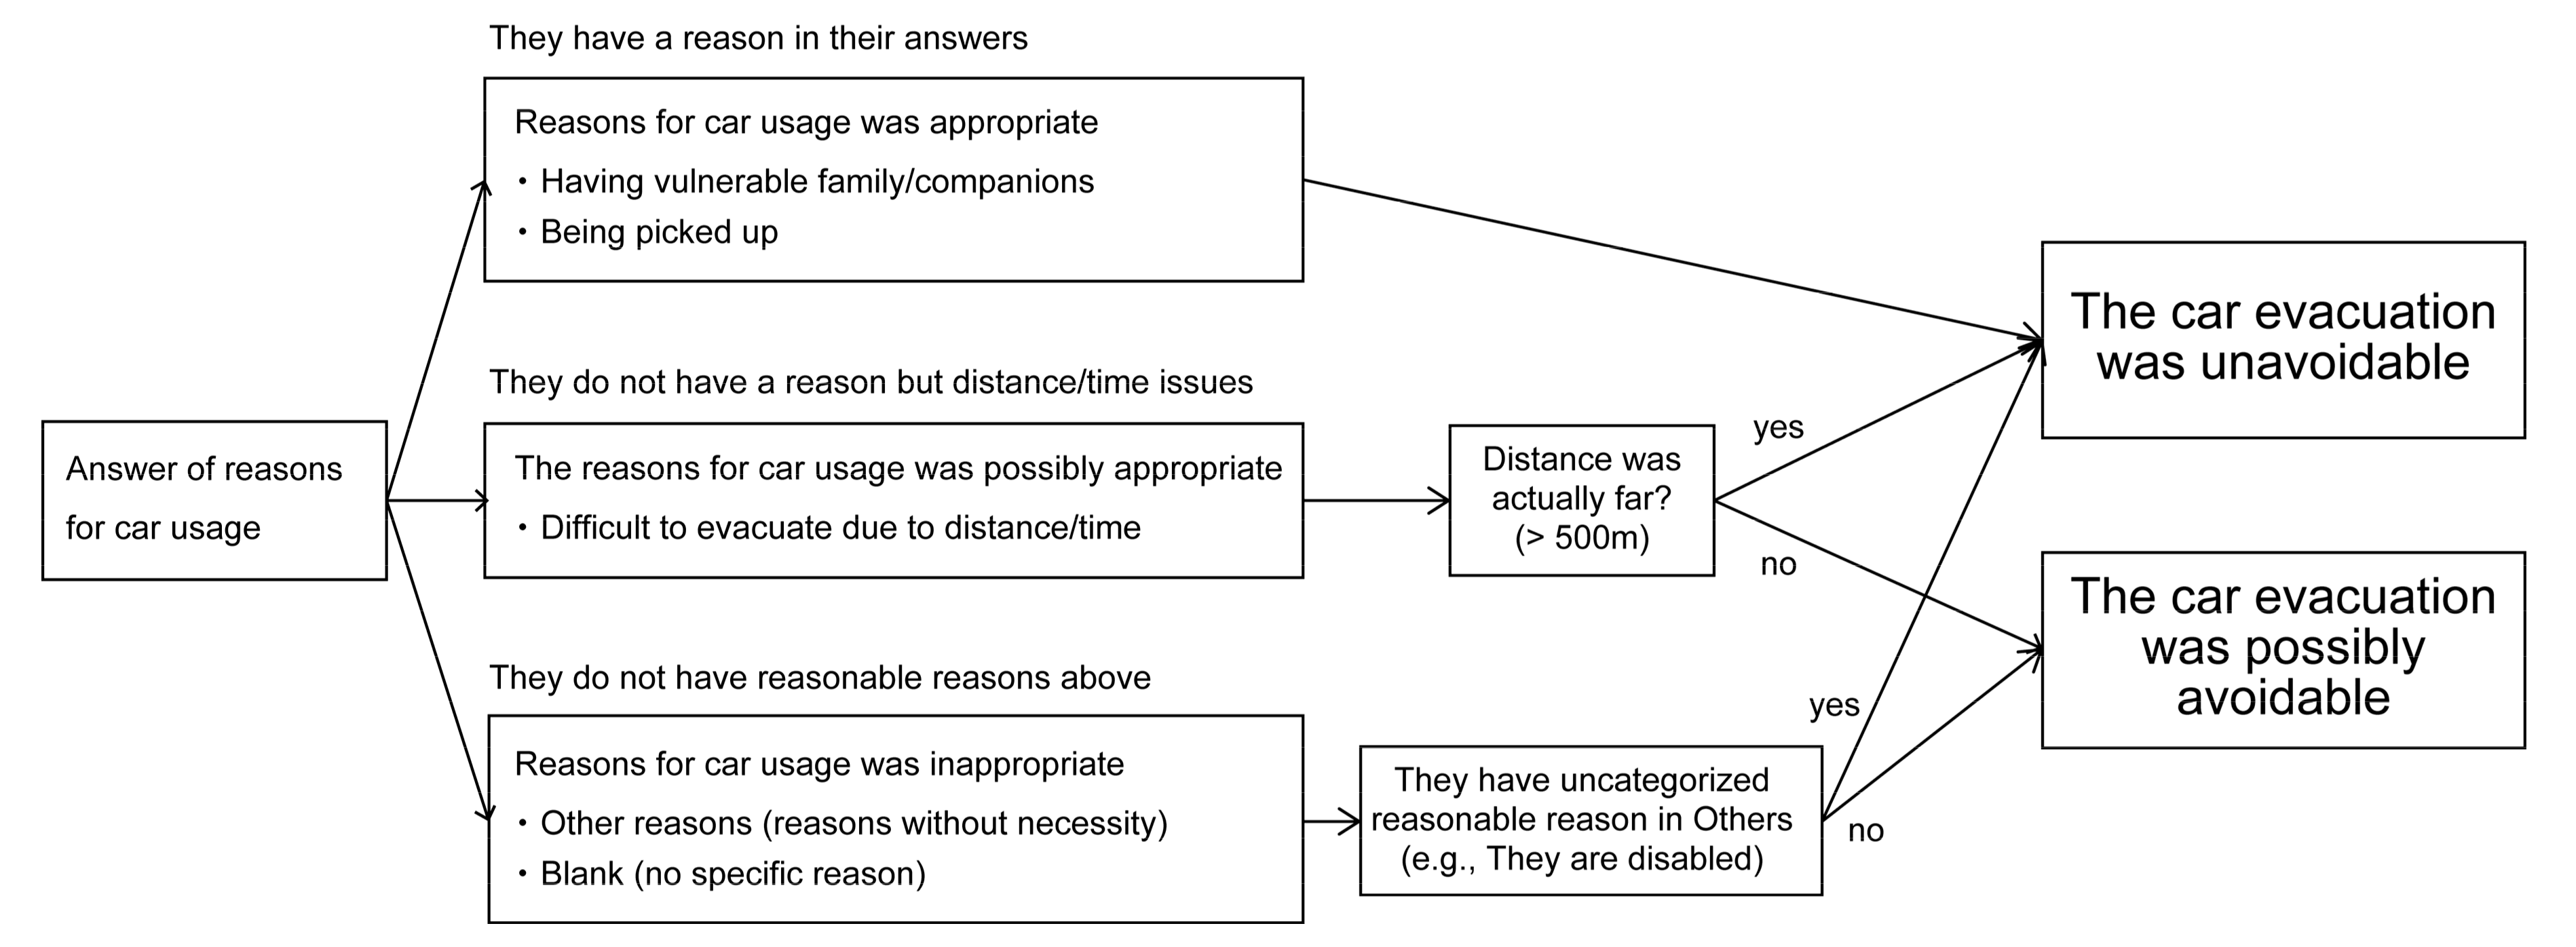
We analysed the general features of car evacuation during the tsunami using simple and cross tabulation. First, as a general feature of an evacuation mode, a composition ratio of evacuation mode choice was determined from the answers of residents who performed evacuation behaviours during the event. Next, we limited the responders to residents who performed car evacuations in the 2011 event, and the reasons for choosing the car evacuation mode were clarified. Next, the avoidability of car evacuation was estimated based on the framework described in
Figure 4. In this analysis, the evacuation distance and reasons given by individuals were considered, as were the reasons associated with the structured format of the mode. No previous research studies examined car evacuation avoidability, and this study provides the first known estimation. Finally, we analysed the evacuation mode preference for future tsunami events. The answers from residents who could possibly avoid car evacuation and the answers from residents for whom car evacuation was unavoidable were compared. This difference in preference, based on the different attributes of each evacuee, has not been previously studied.
2.4. Binary Logistic Regression
Although simple statistical analysis can provide useful information on the possible factors that promote car evacuation choices, it cannot evaluate the quantitative effects of these factors on decision-making processes. The quantitative identification of the factors that promote car evacuation enables the implementation of effective countermeasures, and even the prediction of decision-making processes regarding the evacuation mode choice. Therefore, binary logistic regression was performed in this study.
Based on the basic statistical analysis discussed in the previous section, we consider modelling binary choice behaviour for the following choices: evacuation on foot or by car. The probability that evacuee
i chooses car evacuation,
πi, can be modelled, as described in Equations (1) and (2) based on the random utility theory. The general form of the theory, including the binary choice and its derivation, can be found in [
31].
Here,
Yi = {0: Walk, 1: Car} is a response variable, and
xi represents predictor variables, i.e., recategorized binary answers from the survey. Note that the estimated model is constructed from individual responses without assumptions, such as the number of cars per households. In this analysis, we use Sex = {0: Male, 1: Female}, Age = {0: Under 60, 1: Over 60}, Initial place = {0: Home, 1: Workplace}, Departure timing = {0: Within 15 min, 1: Over 15 min}, Shelter type = {0: Designated, 1: Non-designated}, and Evacuation distance = {0: Under 500 m, 1: Over 500 m} as predictors. Here, the recategorization criteria were chosen based on the sample size in each category and the existing policy in Japan [
32]. Although the recategorization analysis is relatively simple, the result should reflect the general tendencies of the evacuation. All the reasonable predictors are included in the analysis. The model parameter
β can be estimated using maximum-likelihood criteria.
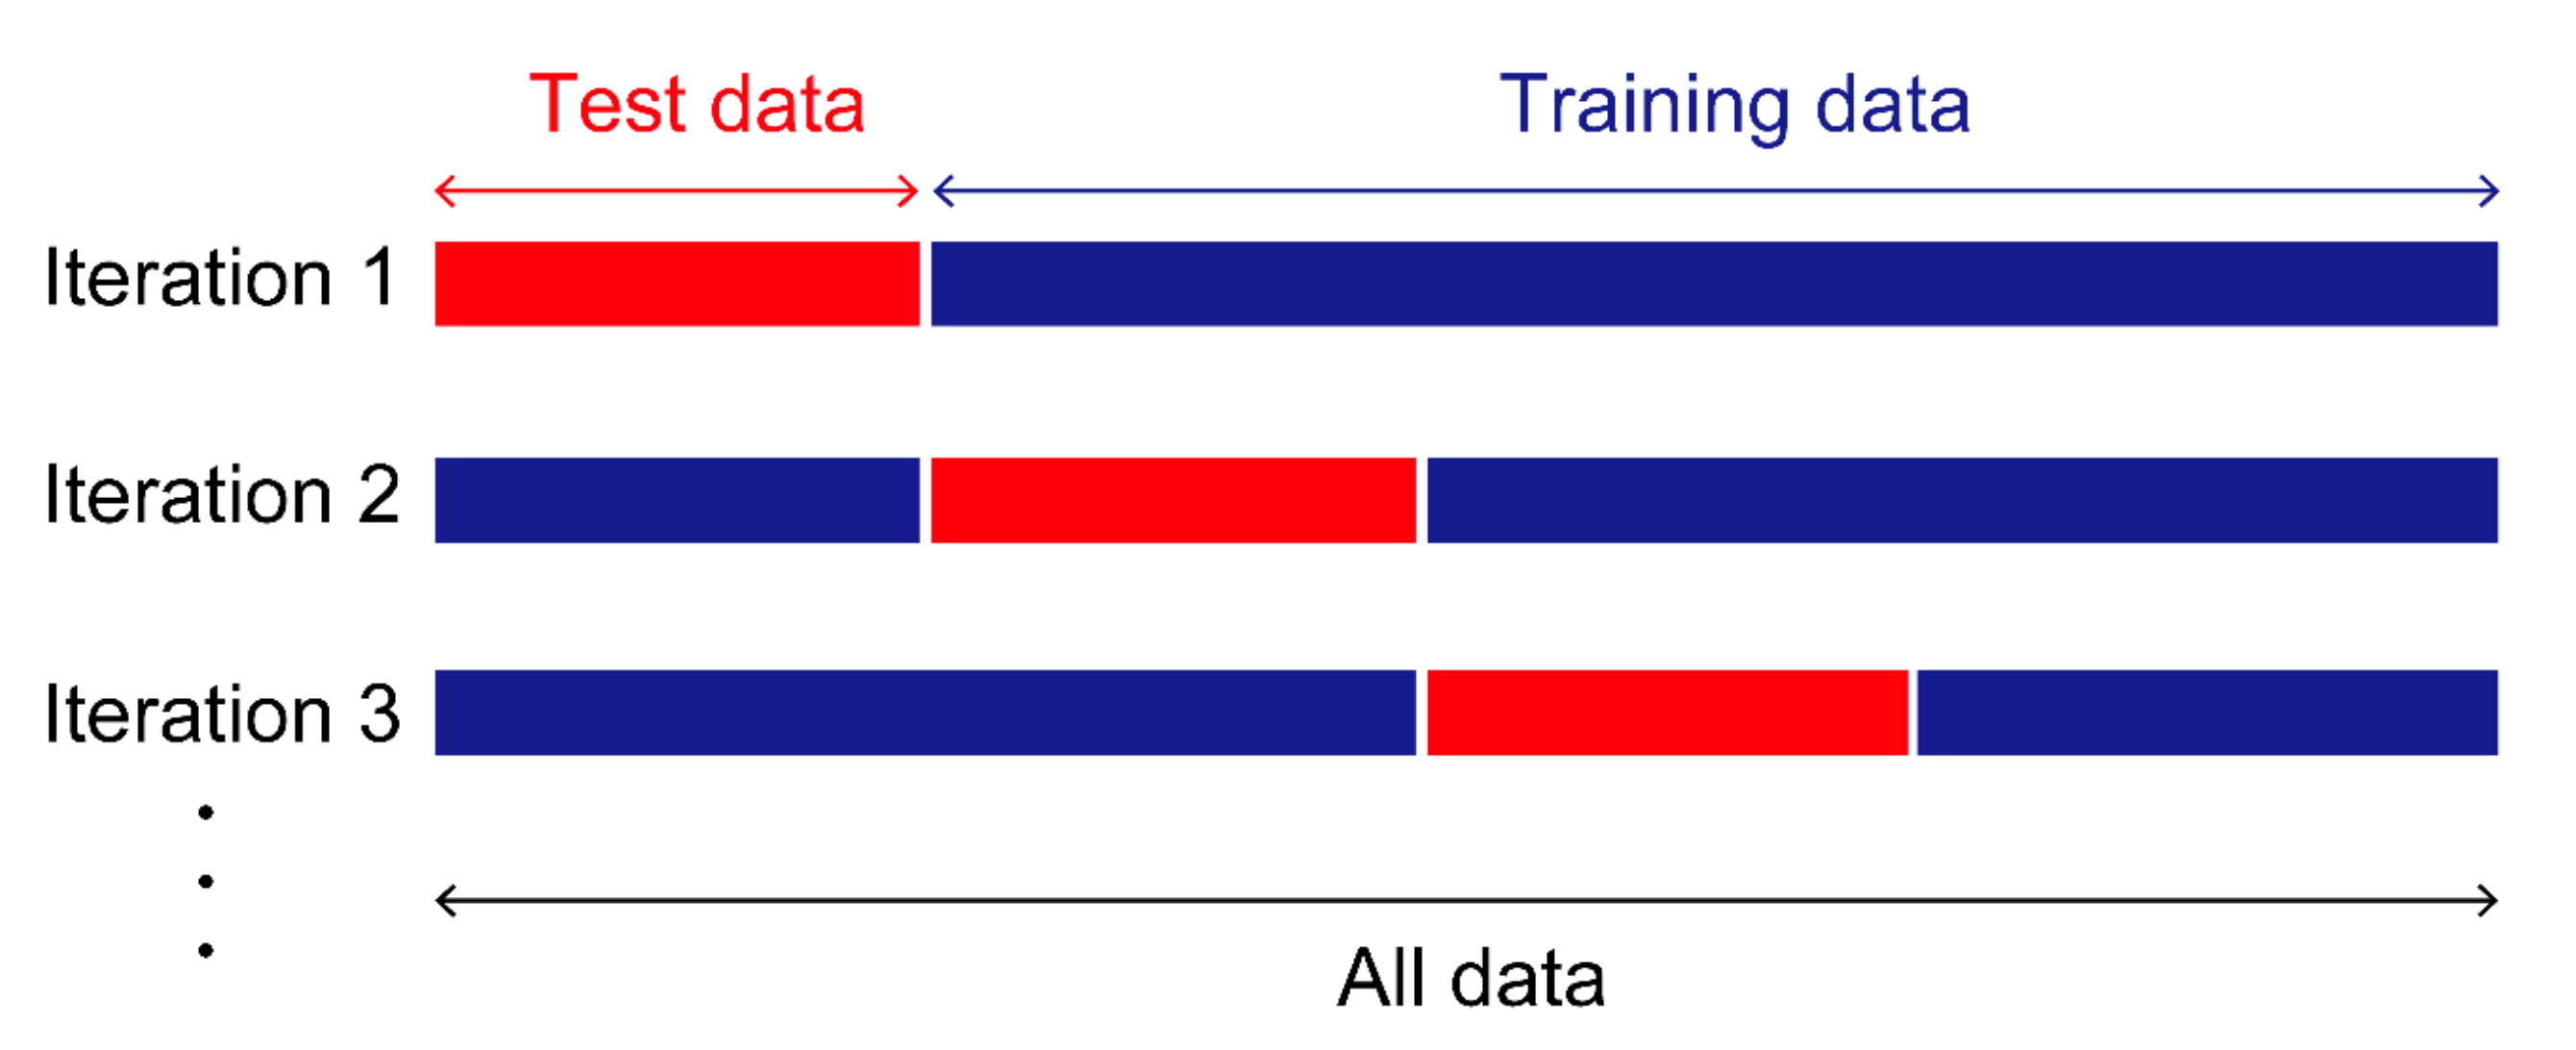
The validity of the estimated model was confirmed through the K-fold cross-validation test.
Figure 5 illustrates a schematic view of the K-fold validation. First, the data are divided into K sets of data. Next, the model estimated from the K-1 data set is used to predict the subsequent data set, and its accuracy is checked. Through this test, we can check for overfitting problems and assess the internal validity of the estimated model. In this study, we divided 3993 data points into 11 data sets with 363 data points in each set and then performed the validation.
3. Results
3.1. Evacuation Modes during the 2011 Event
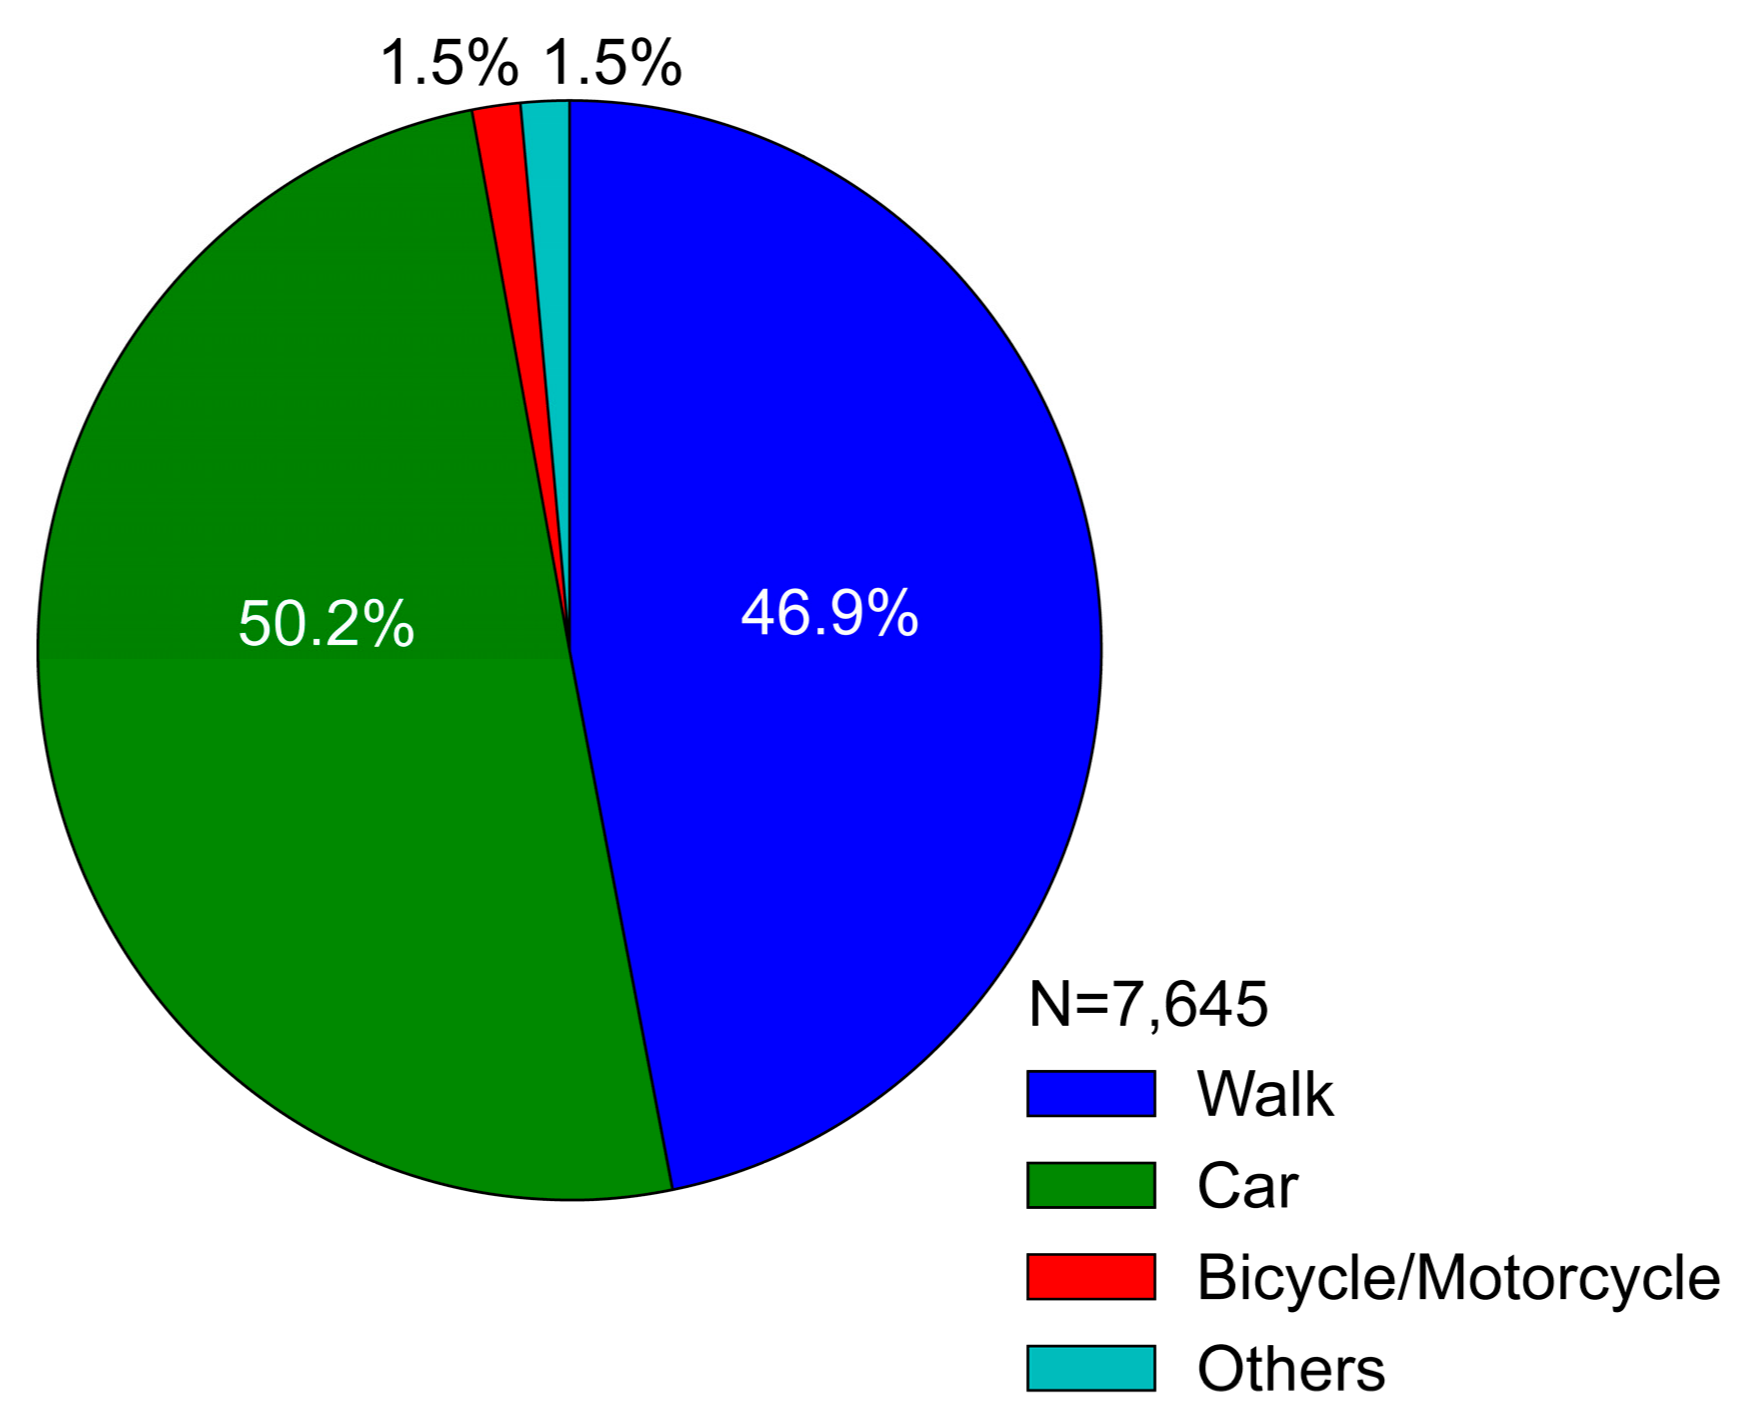
Figure 6 shows the composition ratio of the evacuation mode choice for the 2011 event. Only a few residents (1.5% of the residents) chose the bicycle and motorcycle modes during the event. Given the topographical features of the target area, most of the residents could reach safe high locations; however, 50.2% of residents used their cars to evacuate, a slightly larger number of residents than those whose evacuation mode was on foot. In summary, approximately half of the residents chose car evacuation, and the rest of the residents chose on-foot evacuation.
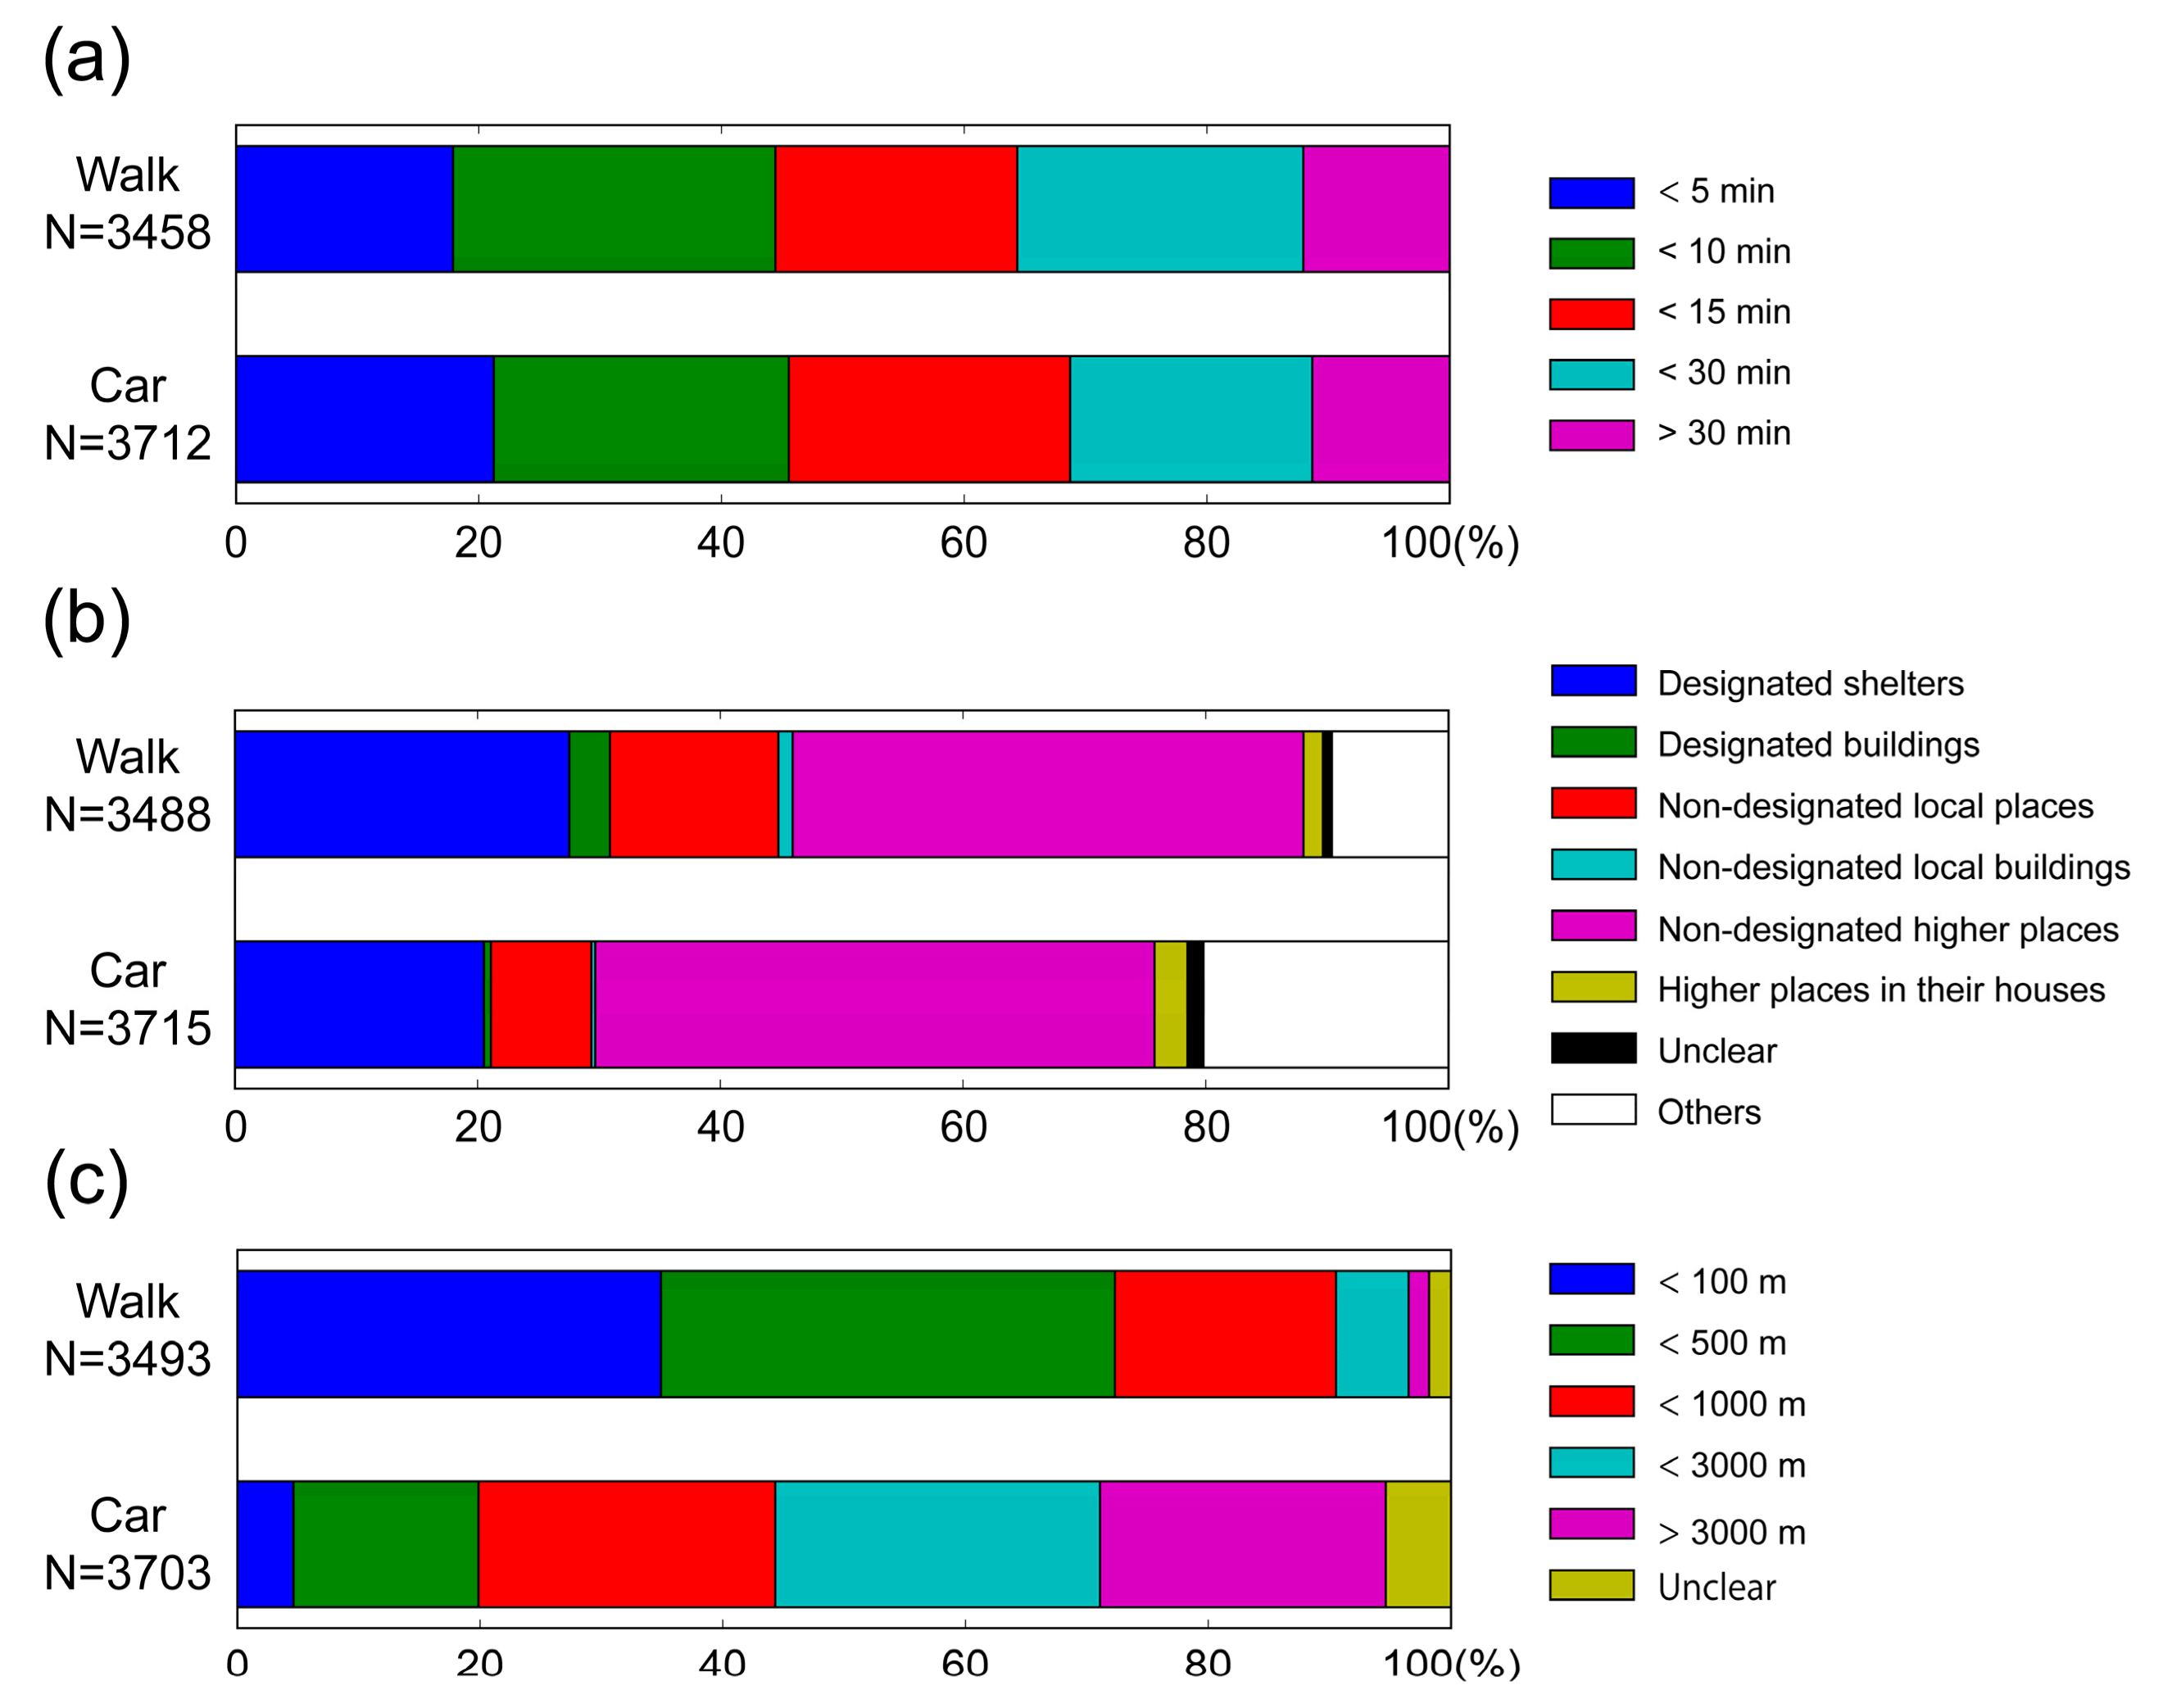
Differences in the evacuation metrics were analysed and are summarized in
Figure 7. Since the above findings indicated that almost all of the residents chose on-foot or car evacuations during the 2011 event, these two modes are considered in the analysis. There were no significant differences in tendencies between evacuation modes for the evacuation departure time or destination, except for the ratio of other destinations, as shown in
Figure 7b. A possible reason for this difference is that car evacuations are generally not vertical evacuations but horizontal evacuations because car evacuations can lead to long travel distances over a short time. Therefore, the ratio of other destinations reflects the ratio of people who evacuated to regions outside of the tsunami inundation area. A significant difference can be confirmed in evacuation distance. In contrast to the fact that approximately 70% of residents evacuated within 500 m by on-foot evacuation, less than 20% of residents moved within 500 m using cars. These results suggest that most of the car evacuees preferred to horizontally evacuate during the 2011 event, and as a result, the evacuation distances of car evacuations were greater than those of on-foot evacuations. These results are consistent with detailed spatial evacuation tracking and actual evacuation scenarios [
22], indicating that there were large traffic jams on routes leading out of the inundation area.
3.2. Reasons for Car Evacuation
The results in the previous section showed a high percentage of car usage during the 2011 tsunami. In this section, we analyse the reasons for car usage.
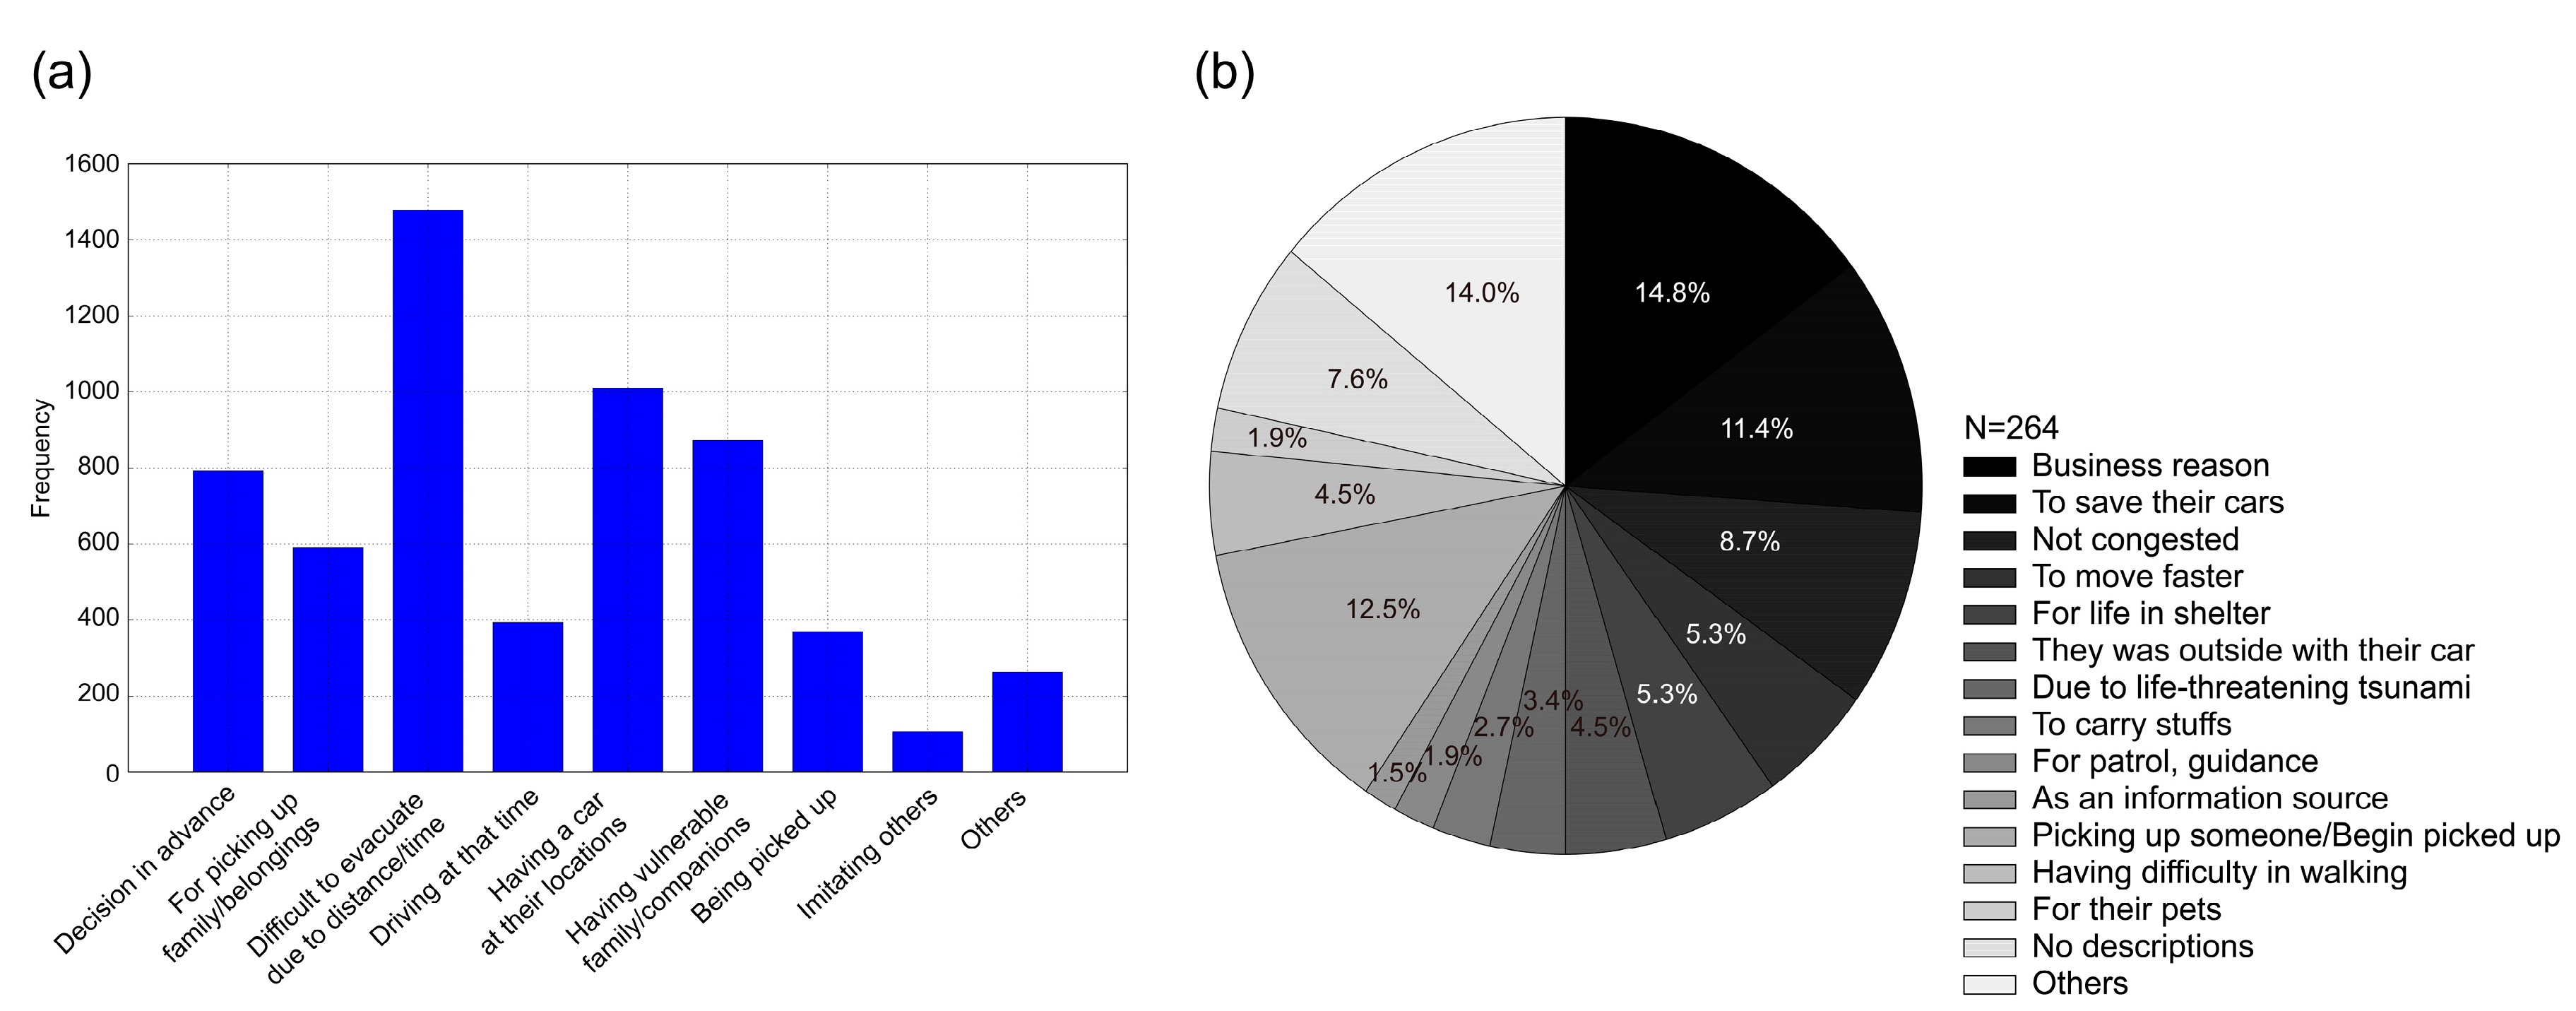
Figure 8a shows the various reasons for car usage, along with the categorized reasons in “Others” in
Figure 8b that appeared in the structured questionnaire. Here, inappropriate usages are visualized in dark colours, whereas appropriate usages are shown in bright colours in
Figure 8b. As shown in
Figure 8a, the dominant reason was “difficult to evacuate due to distance/time”, followed by “having a car at their location”, “having vulnerable family/companions”, and “decision in advance”. The most notable finding is that reasons that are not considered appropriate reasons alone, such as “having a car at their location” and “decision in advance”, have large numbers of responses. Predominant reasons found as “Others” include “business reasons” and “to save their cars”; those reasons are inappropriate reasons for car usage in terms of saving lives.
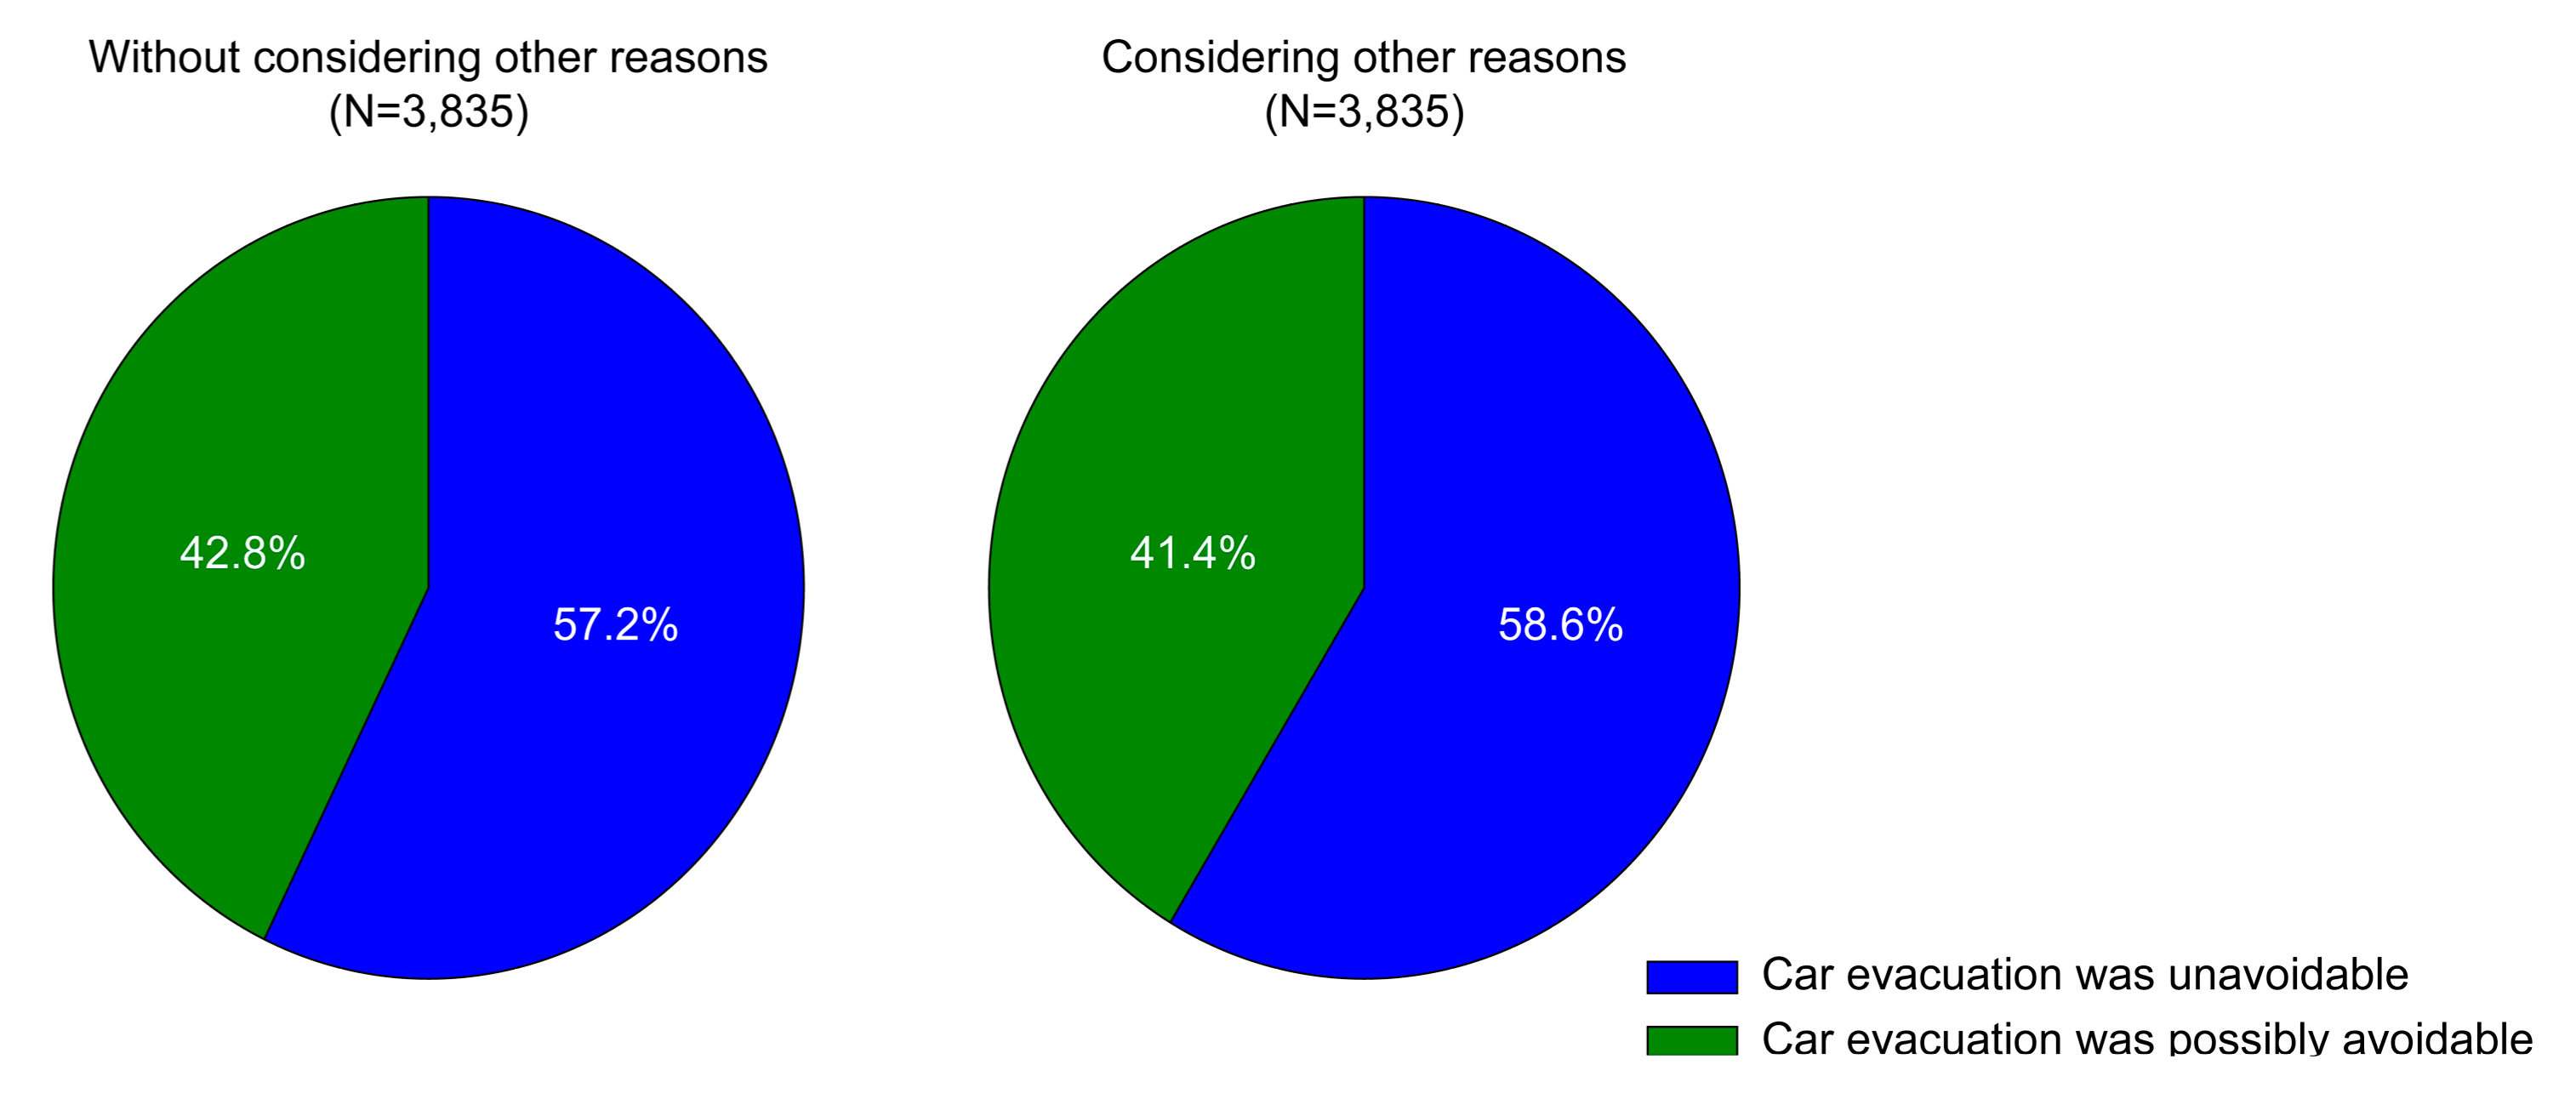
3.3. Car Evacuation Avoidability
In the previous sections, the analysis suggested that a high percentage of usage was associated with various inappropriate usages. In this section, we estimate car evacuation avoidability during an actual tsunami event based on the reasons for usages. The ratio of car evacuation avoidability was estimated, as shown in
Figure 9, according to the scheme illustrated in
Figure 4. In this estimation, uncategorized reasons in “Others” are carefully reviewed and considered to ensure that the ratio of avoidability is not overestimated. The results are shown in
Figure 9a,b for instances with and without considering reasons in “Others”, respectively. The results indicate that car usages that were essential to saving lives accounted for only approximately 60% of all of the usages, and the remaining 40% might have been avoidable from the viewpoint of reducing loss of life from the tsunami.
3.4. Future Evacuation Mode Preferences
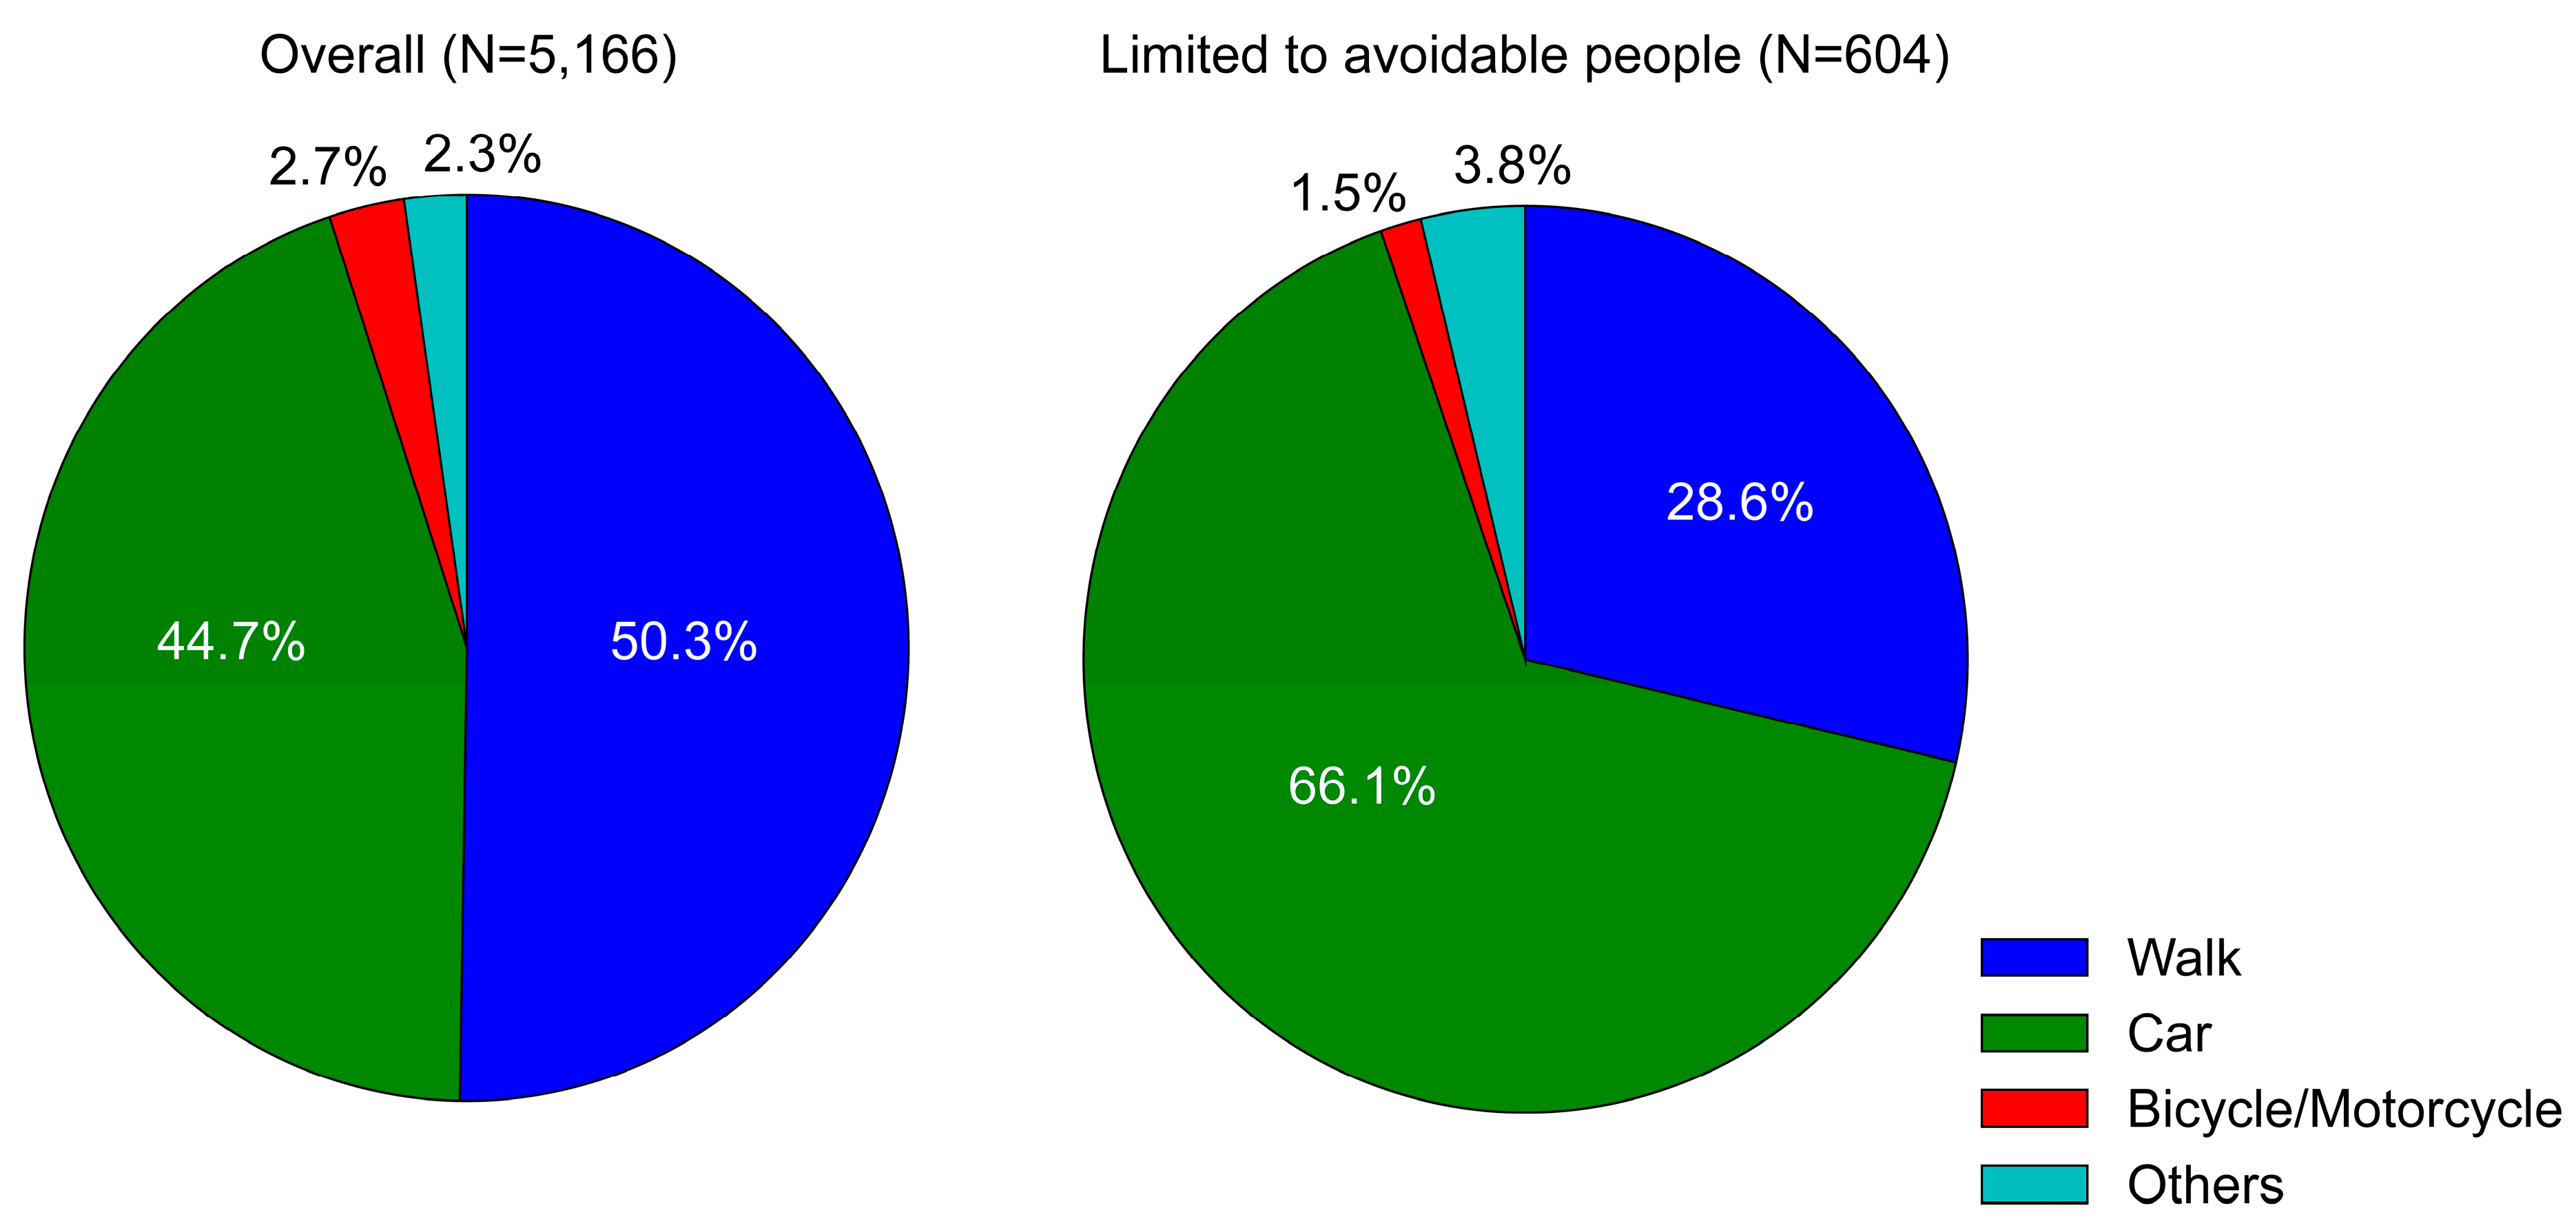
Evacuation mode preferences in future tsunamis based on different individual characteristics are shown in
Figure 10. Here, we investigated the preferences of all the people in the survey (a) and those who made avoidable decisions (b), as estimated in the previous section. This study is the first to investigate the future evacuation mode preferences of people with different individual characteristics. Even for local residents who experienced severe traffic jams in the previous event, nearly half of the residents will require car evacuations in future tsunamis. Moreover, the demand exceeds 60% when the set of responders is limited to the people whose car evacuation was potentially avoidable during the 2011 event.
3.5. Summary of the Straightforward Statistical Analysis
First, a straightforward statistical analysis revealed general trends in evacuation behaviour in the target area. To summarize the results, approximately 50% of the residents were involved in car evacuations, and the rest of residents were on-foot evacuees. Remarkable differences in evacuation trends were not observed for the different evacuation modes based on the evacuation timing or destination but were evident for the evacuation distance. This difference is assumed to come from the different types of evacuation. Vertical evacuation is the dominant in on-foot evacuation mode, and horizontal evacuation is the dominant type for car evacuation.
Next, the reasons for car usage were summarized, and the potential avoidability of car evacuation was investigated. The responses indicate a number of important issues, including the reasons for car evacuation for vulnerable people and numerous reasons that were considered to be avoidable in terms of saving lives. Based on the systematic criteria described in
Figure 4, the proportion of possible avoidable car evacuations was estimated at 40% of the total usage. Since the evacuation situations of individuals cannot be fully taken into account in the questionnaire survey, this numerical value is considered a reference; however, this result suggests that a large proportion of car evacuations may be associated with unnecessary usages.
Based on the results above and future scenarios, it is essential to investigate the possible factors that influence evacuation mode decision making and improve evacuation preparedness. Although a straightforward analysis is useful for understanding the general trends and relationship between two variables, it is difficult to simultaneously assess various factors based on this approach. The logistic regression in the next section allows us to quantitatively investigate various factors.
3.6. Mode Choice Model Estimation
To quantitatively investigate the effects of several factors on the mode choice decision-making process and to obtain useful information to implement effective countermeasures, the evacuation mode choice model is estimated using binary logistic regression. The estimation result is shown in
Table 1. In this estimation, the variables are tested based on the maximum-likelihood criteria, and all of the variables were chosen for prediction. Since all of the variables are significant based on the Wald test and each 95% confidence interval (C.I.) does not include 1.00, all of the predictor variables are useful for explaining the evacuation mode choice.
Personal attribute-related factors were associated with a higher probability of choosing car evacuation for males relative to females. The results also suggested that younger evacuees tended to use cars to evacuate relative to older evacuees, and that those at work were more likely to perform car evacuation than were residents in their homes when the event occurred.
Moreover, evacuees who started their evacuation in a later phase exhibited a higher probability of choosing car evacuation than did evacuees in early phases. In addition, designated shelters were more attractive to car evacuees than were non-designated shelters. The most dominant factor for predicting evacuation mode choice was the evacuation distance. The probability of choosing car evacuation was 9.5 times higher for residents who had a long evacuation distance when compared to those whose evacuation distances were relatively short.
3.7. Cross Validation of the Mode Choice Model
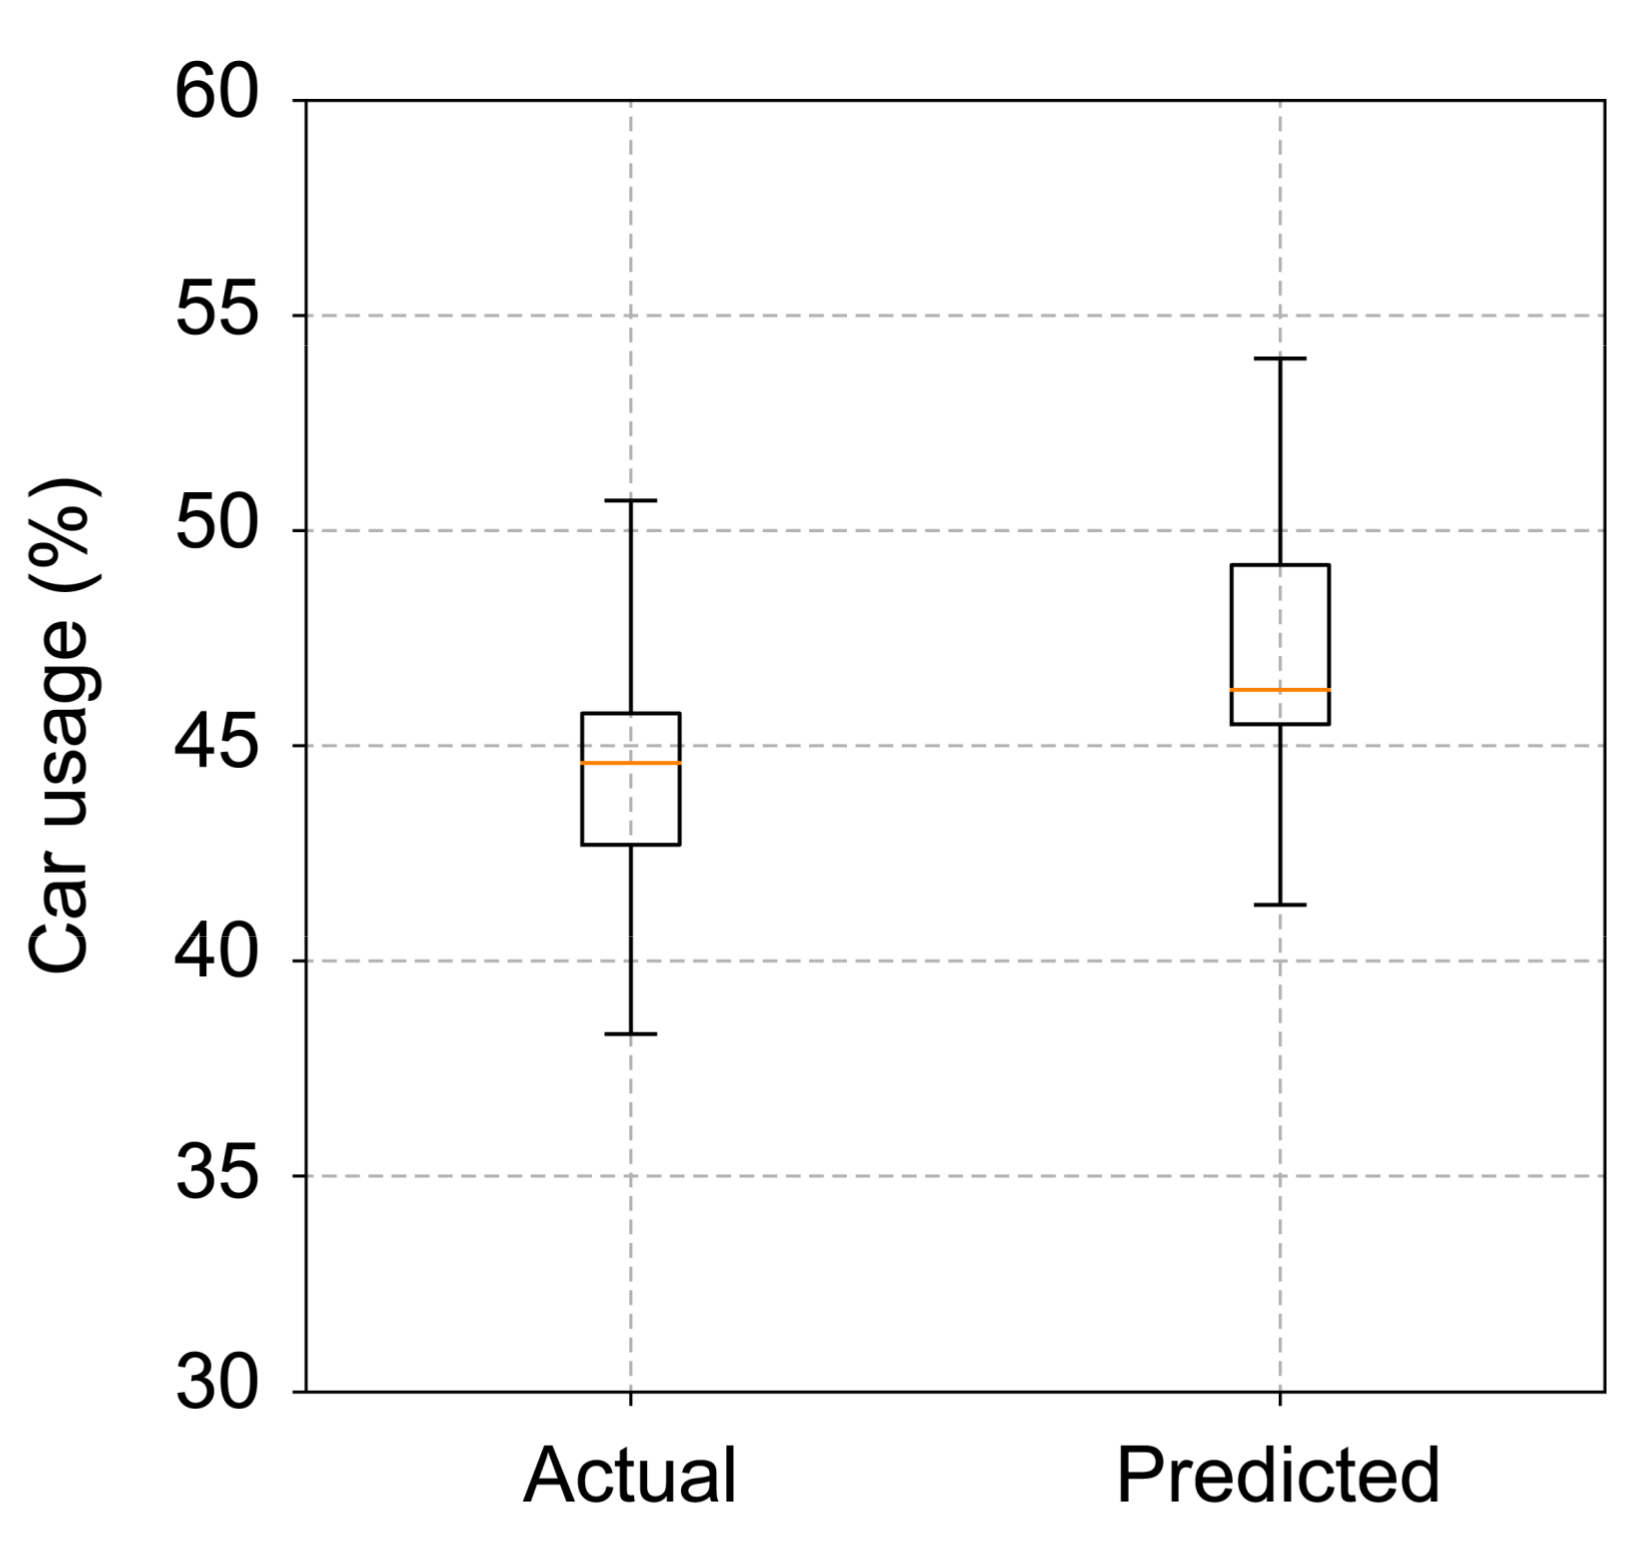
To assess the robustness of the estimated model, we conducted K-fold cross validation. The validation results are shown in
Figure 11. In this figure, the actual percentages of car usages and the predicted car usages for 11 subsets of data are visualized using a whisker box plot. Here, the edges of the box plots represent the maximum and minimum values of the percentage among the 11 data sets.
The figure illustrates the satisfactory estimation performance of the estimated model. Since the maximum gap between actual and predicted values was 6.1%, it is clear that the model accuracy does not depend on a specific data set. In addition to the average percentages of different usages, the accuracy of prediction for individual usages was satisfactory at 74.7% on average.
4. Discussion
The simple statistical analysis revealed not only that large numbers of residents used their cars to evacuate during the 2011 tsunami, but also that approximately 40% of car usage was potentially avoidable. This study is the first to estimate car evacuation avoidability for an actual tsunami event. Although precisely estimating car evacuation avoidability based only on a structured questionnaire survey is challenging because individual situations vary and are complex, the results quantitatively suggest that car evacuation during the 2011 tsunami event included many car evacuations that were not necessarily required to save lives. Given that the study area experienced severe traffic jams during the 2011 event that produced some tsunami casualties, reducing those avoidable car evacuations could potentially improve tsunami evacuation and reduce the number of victims. Because the survey results could only be obtained from survivors, survivor bias is inevitable in the survey; however, the fact that many cars in traffic jams in the target area were overtaken by the tsunami indicates that considering this bias will further support the results of this paper.
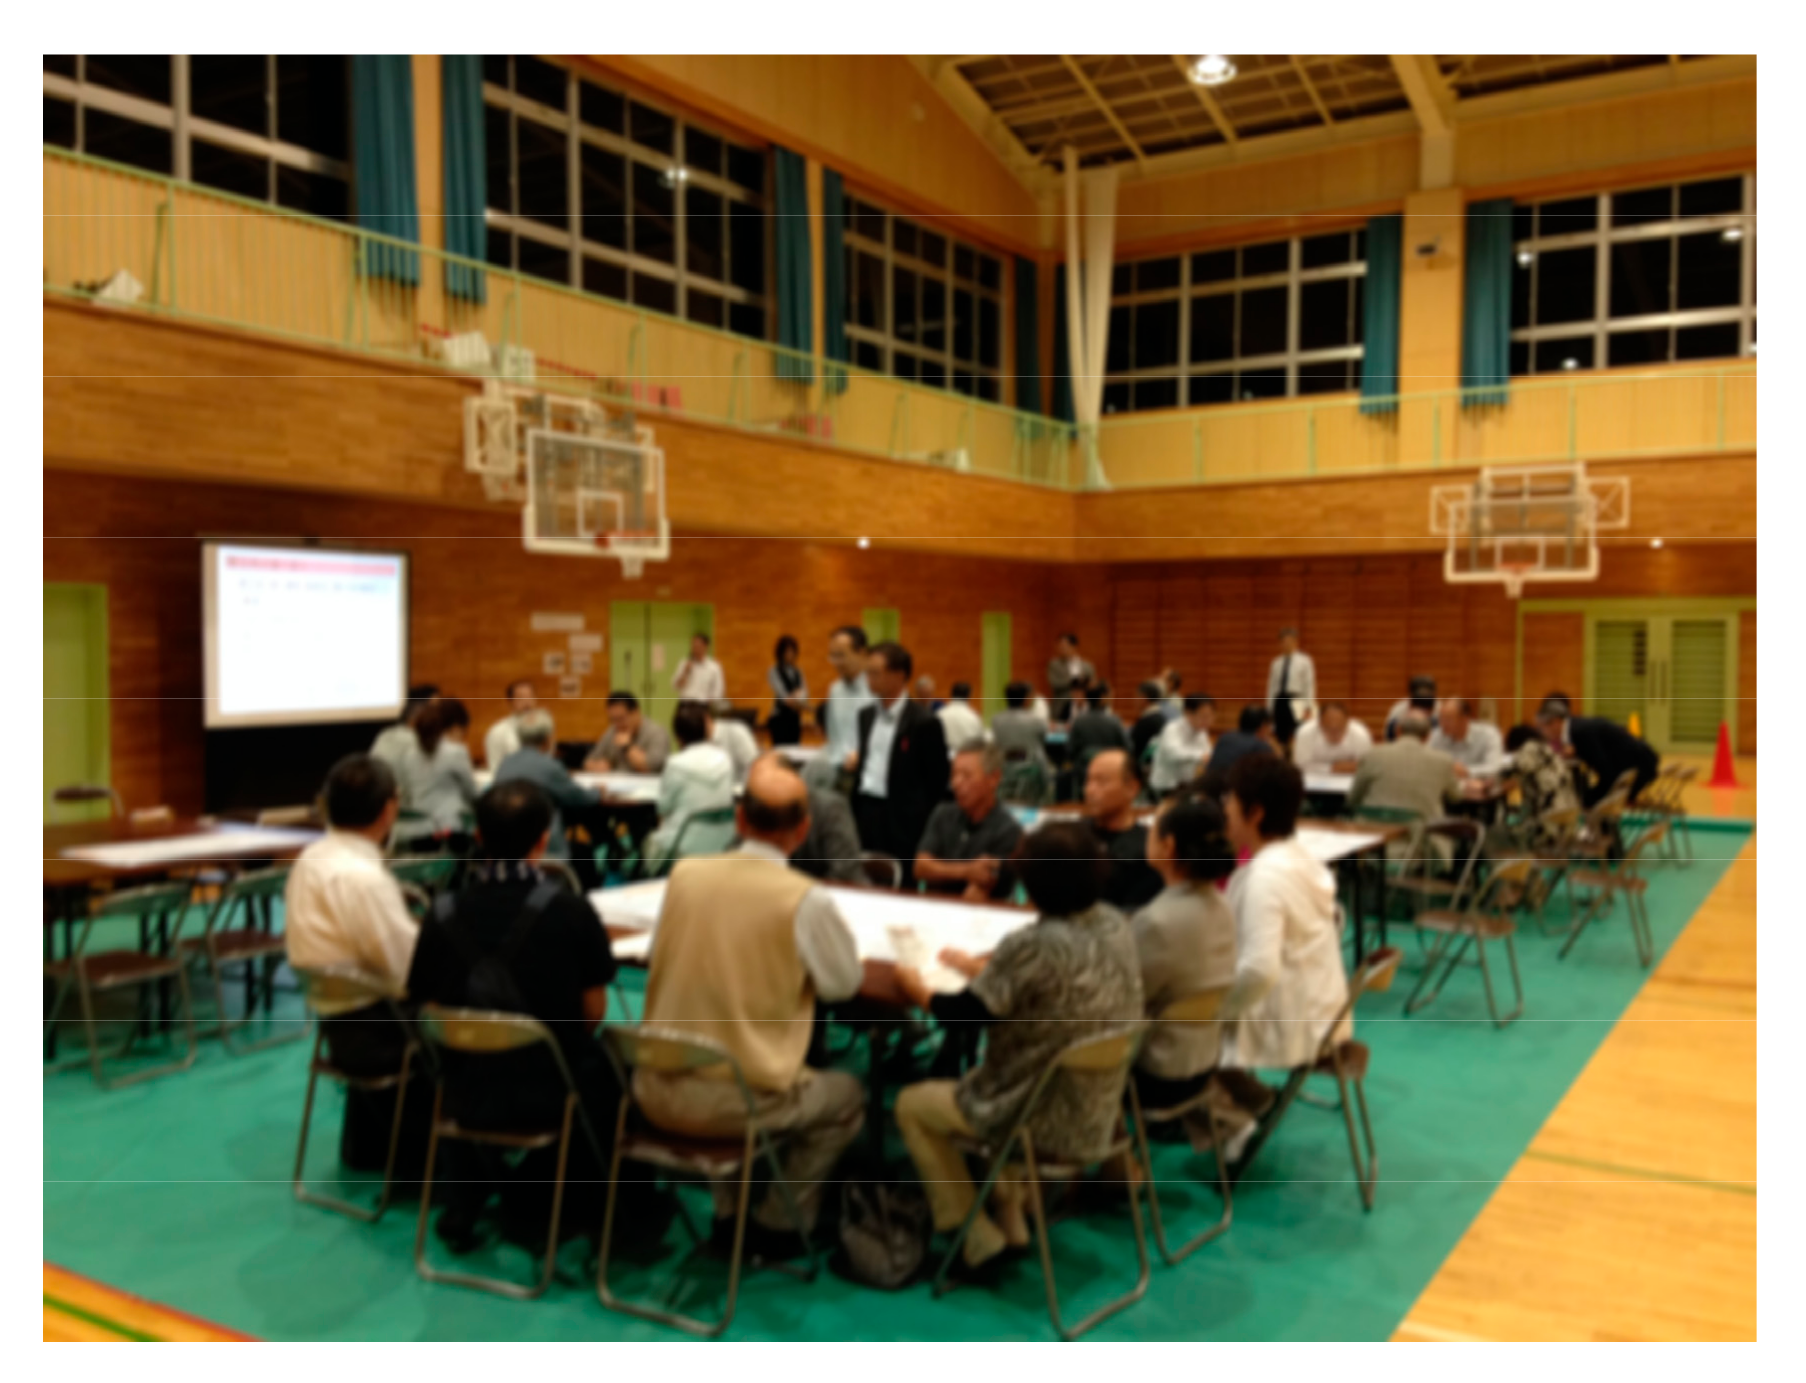
In addition to the results regarding the evacuation behaviour during the 2011 event, the results on evacuation mode preferences in future tsunami events suggest a high demand for car evacuation, with 44.7% of residents choosing to use their cars to evacuate the study area. Moreover, the cross-statistical analysis revealed that residents whose car evacuations were potentially avoidable during the 2011 event had a higher demand for car usage, and 66.1% of those residents preferred to conduct car evacuations. When considering the above findings, it is essential to estimate the potential demands for necessary and unnecessary car evacuations and to reduce avoidable car usages to minimize the number of future tsunami victims. Since poor reasons, such as “having a car at their location” and “decision in advance”, received large numbers of responses for choosing car evacuation, educational programmes, drills, and consensus buildings for future tsunami evacuations should be created to reduce unnecessary car evacuations. To address this challenge, the Kesennuma municipal government is attempting to implement measures to enhance disaster awareness and consensus building by collaborating with universities and companies (
Figure 12). However, the number of participants has been limited. Therefore, additional efforts will be required to address this challenge.
The possibility of estimating the future car evacuation demand based on several factors was investigated using binary logistic regression. For individual attributes, the results indicated that males have a higher probability of choosing car evacuation than females, and younger residents tend to use cars to evacuate more frequently than older residents. This result is likely associated with the characteristics in the study area, where many young males use their cars for their businesses (mainly fisheries). In addition to these business characteristics, the occurrence time of the earthquake, which was during business hours, affects this result. Thus, workers had a higher probability of choosing car evacuation than did the people in their homes. The analysis of evacuation factors indicated a higher probability of car usage for people whose evacuation departure occurred during a later phase of the event relative to people whose evacuations were conducted in an early phase after the earthquake. This imbalance might be a representation of the expectation that late-phase evacuees can reach safe locations faster using cars. In terms of shelter types, the result suggests that designated shelters are more attractive to car evacuees than are non-designated shelters. A possible reason for this result is that most of the designated shelters in the study area have parking lots, in contrast to non-designated shelters, which are tall buildings or high locations without roofs. The estimation result showed that the evacuation distance is a dominant factor for predicting the evacuation mode choice. This result is consistent with previous evacuation behaviours in the wider region, as noted by the Japanese cabinet office [
33]. Here, since the answers regarding evacuation distance are based on recognition or memories of the evacuees, the current approach is more appropriate for understanding the distance as the recognized distance. In this sense, existing activities, such as evacuation drills [
34], that improve geographical recognition would be an effective method of preventing unnecessary car evacuations.
Furthermore, a previous study [
35] indicated that a direct questionnaire cannot precisely measure car evacuation demands because residents consider themselves ideal evacuees. A numerical investigation, such as that performed in this study, can be performed to estimate the demand, including the potential demands. Because both region-specific factors and common factors affect the decision-making processes, a future study should include more possible factors and investigate different regions. Although this work represents only the first step of the study of the decision-making process regarding evacuation mode choices, further quantitative investigation of both common and uncommon regional factors that affect decision-making processes during evacuations is expected to lead to more effective countermeasures and even future evacuation behaviour prediction via the integration of numerical models of the decision-making processes and physical tsunami evacuation simulations [
36].
5. Conclusions
In this study, we conducted a statistical analysis of mass questionnaire survey results obtained in Kesennuma, Miyagi Prefecture, two years after the 2011 tsunami. This paper focused on the decision-making process of evacuation mode choice. First, the quality of the questionnaire survey was validated against census results, and the accuracy of the survey was confirmed by comparison before performing the analysis.
Next, simple statistical analysis was conducted to determine the actual evacuation scenarios during the 2011 event and the evacuation preferences for future tsunami events. A straightforward analysis indicated that nearly half of the residents conducted car evacuations for several reasons, and that approximately 40% of the car evacuations were potentially avoidable during the 2011 event. Furthermore, we found that people whose car evacuations were potentially avoidable exhibited higher demands for car evacuations relative to the result for the overall residents. Car evacuation avoidability and future preferences for different personal attributes were investigated in this study for the first time.
In addition, several factors that promoted car evacuations were quantitatively investigated through binary logistic regression. All of the factors considered in this study were useful for predicting evacuation mode choices, and the most dominant factor was found to be the evacuation distance. The K-fold cross-validation test exhibited a strong performance for predicting the actual car usage during the 2011 event and provided internal validity for the estimated model. Future studies must investigate the factors more comprehensively and to consider different study areas.
Although this study is only the first step in gaining a more comprehensive understanding of decision-making processes during tsunami evacuations, the following suggestions are presented to develop evacuation policies that are based on the results of this work. To prevent future evacuation failures due to chaotic evacuation behaviour, such as the over-usage of cars and the corresponding formation of traffic jams, estimating the evacuation demand, including the reasons for different evacuation choices, is an important first step in constructing better evacuation plans. Next, planners should verify whether the road capacities of local communities can handle the car evacuation demand of residents and possible through traffic. Given that simply calling the current evacuation guidance, the principle of on-foot evacuation, seems insufficient, as shown in
Figure 10, and the objective numerical results of simulations [
36] could be used to build a consensus. Because the demand of residents may include a large portion of unnecessary car usage due to the lack of disaster awareness, non-structural countermeasures, such as education and workshops are potentially effective options for reducing the unnecessary car evacuation demand, especially car evacuations within walking distance (except for vulnerable people), in addition to structural countermeasures, such as widening roads. To make non-structural countermeasures effective, further public involvement and a continuous cycle of evaluation and improvement, including the development of the relevant methodology, are essential for both practitioners and researchers.


