Analysis of Slope Sensitivity to Landslides by a Transdisciplinary Approach in the Framework of Future Development: The Case of La Trinité in Martinique (French West Indies)

 ,
,
Abstract
:1. Introduction
2. Study Site and Landslides
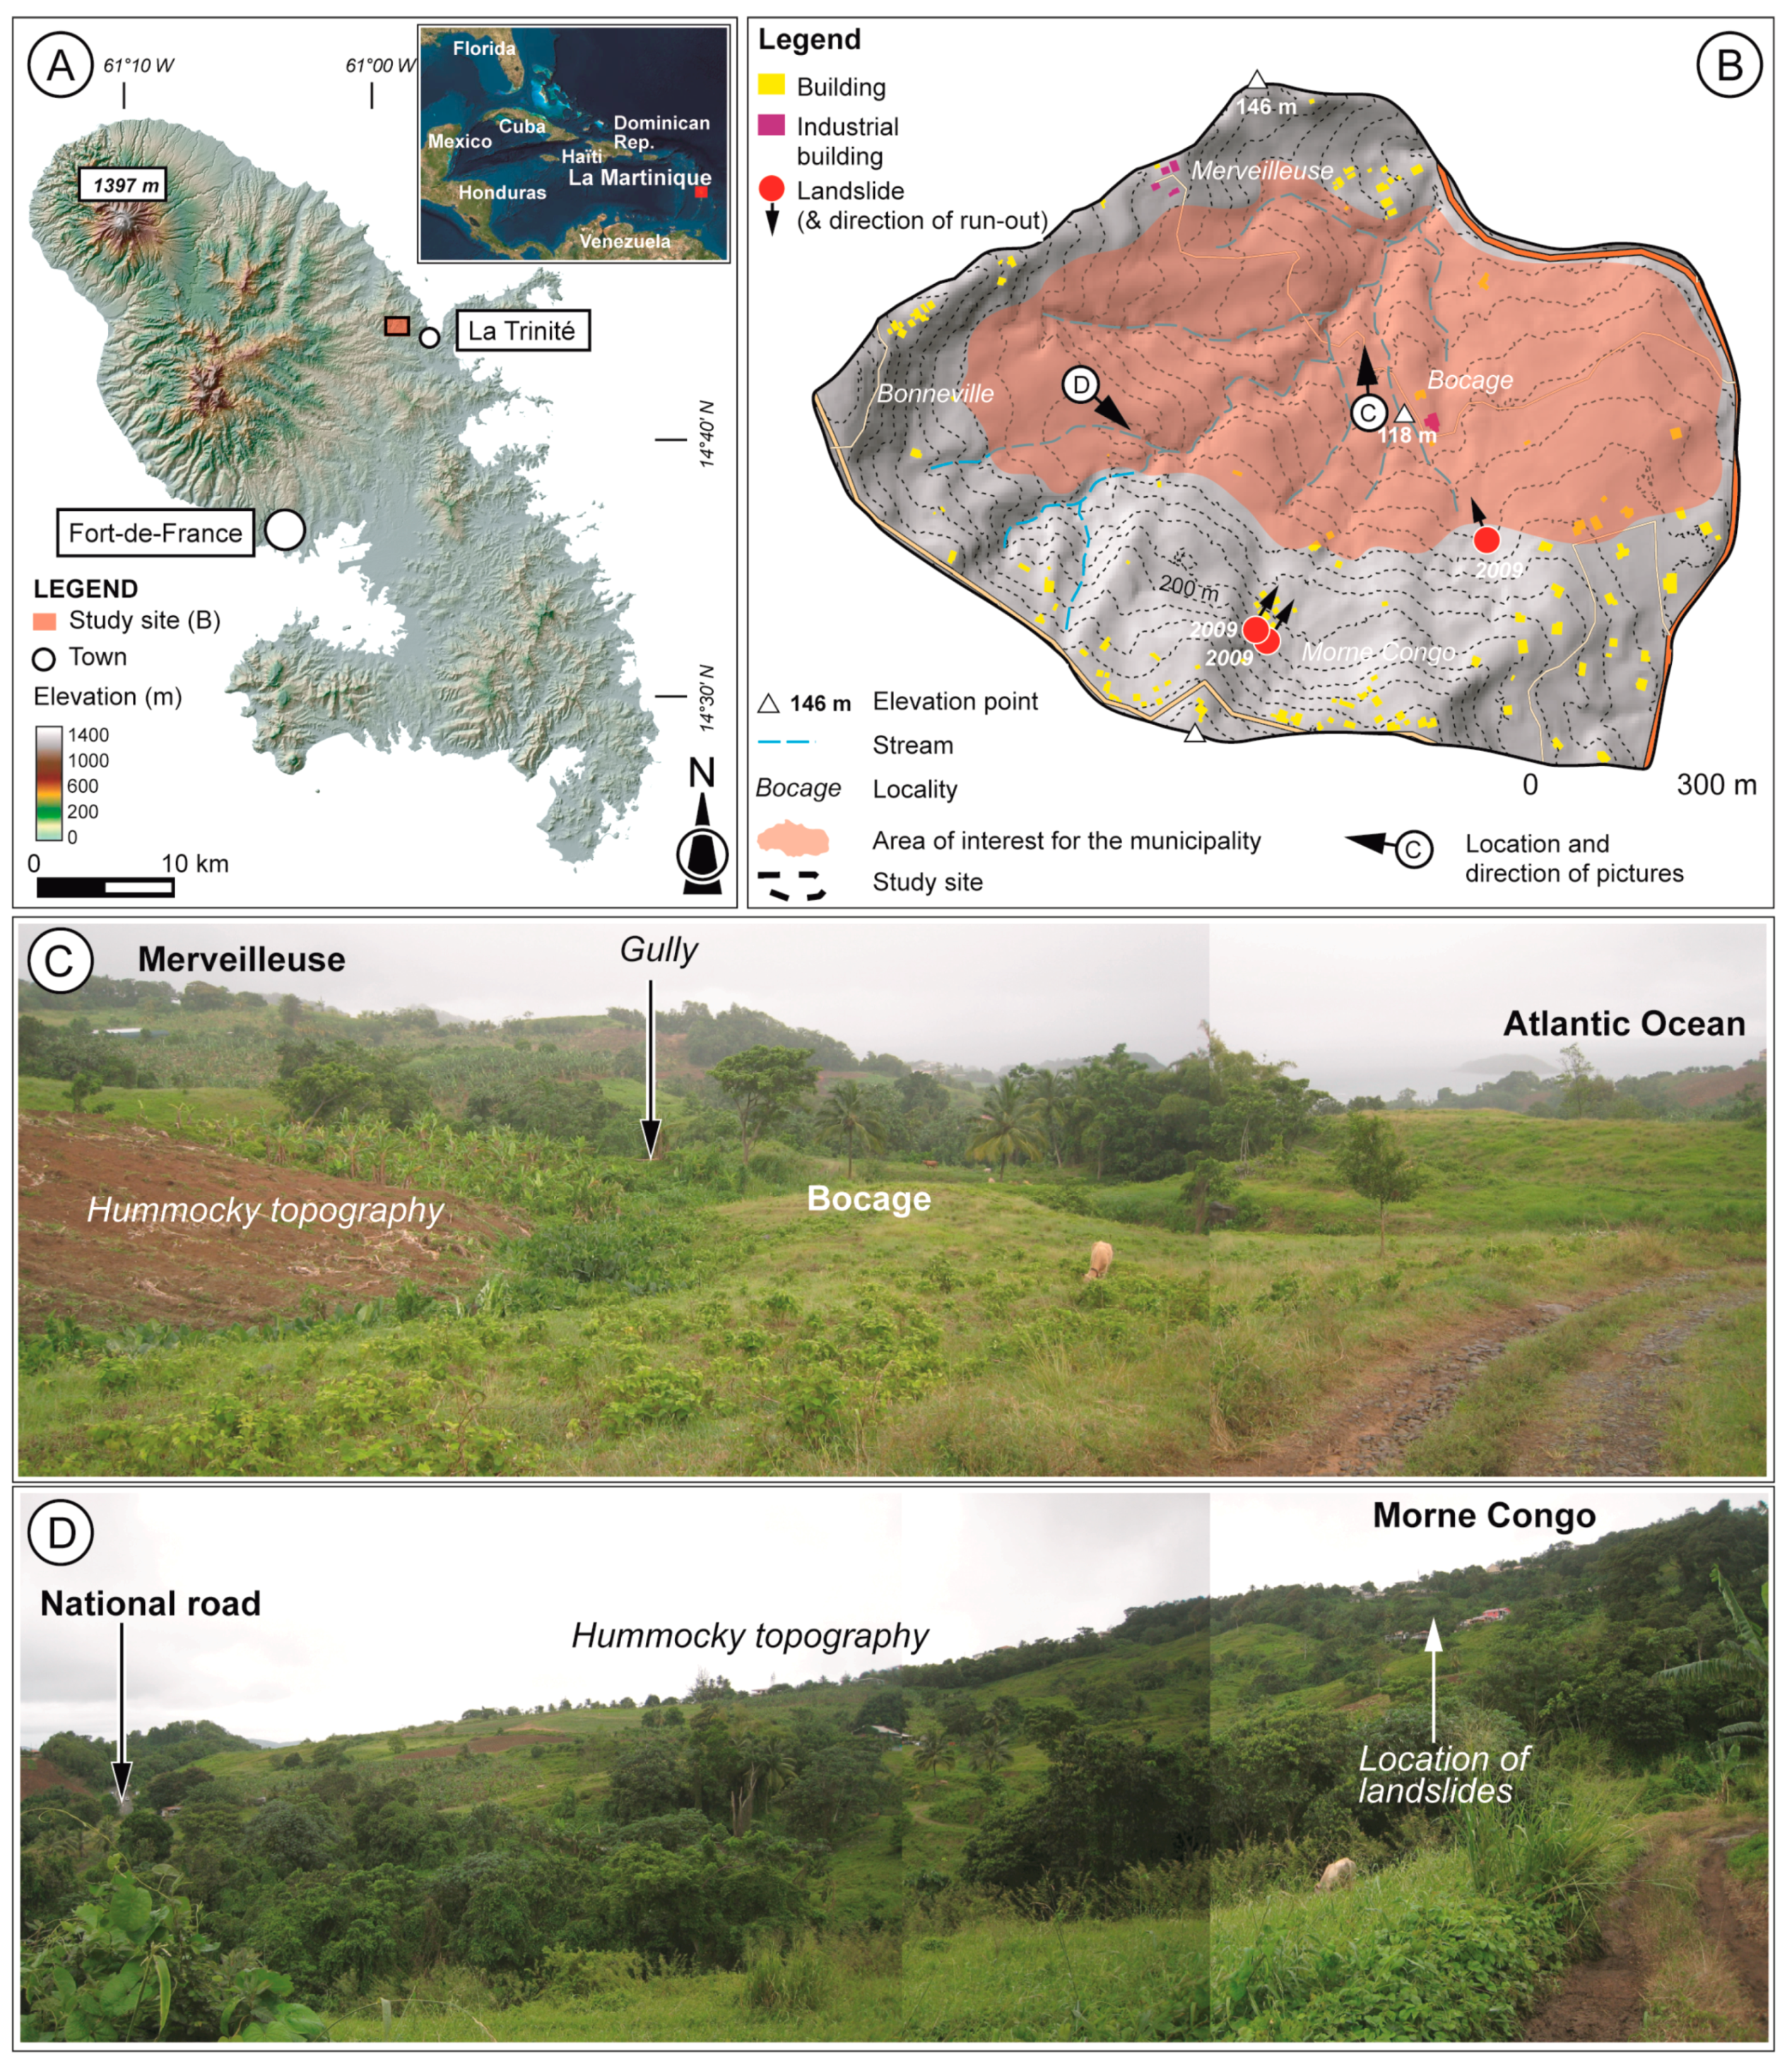
2.1. Study Site
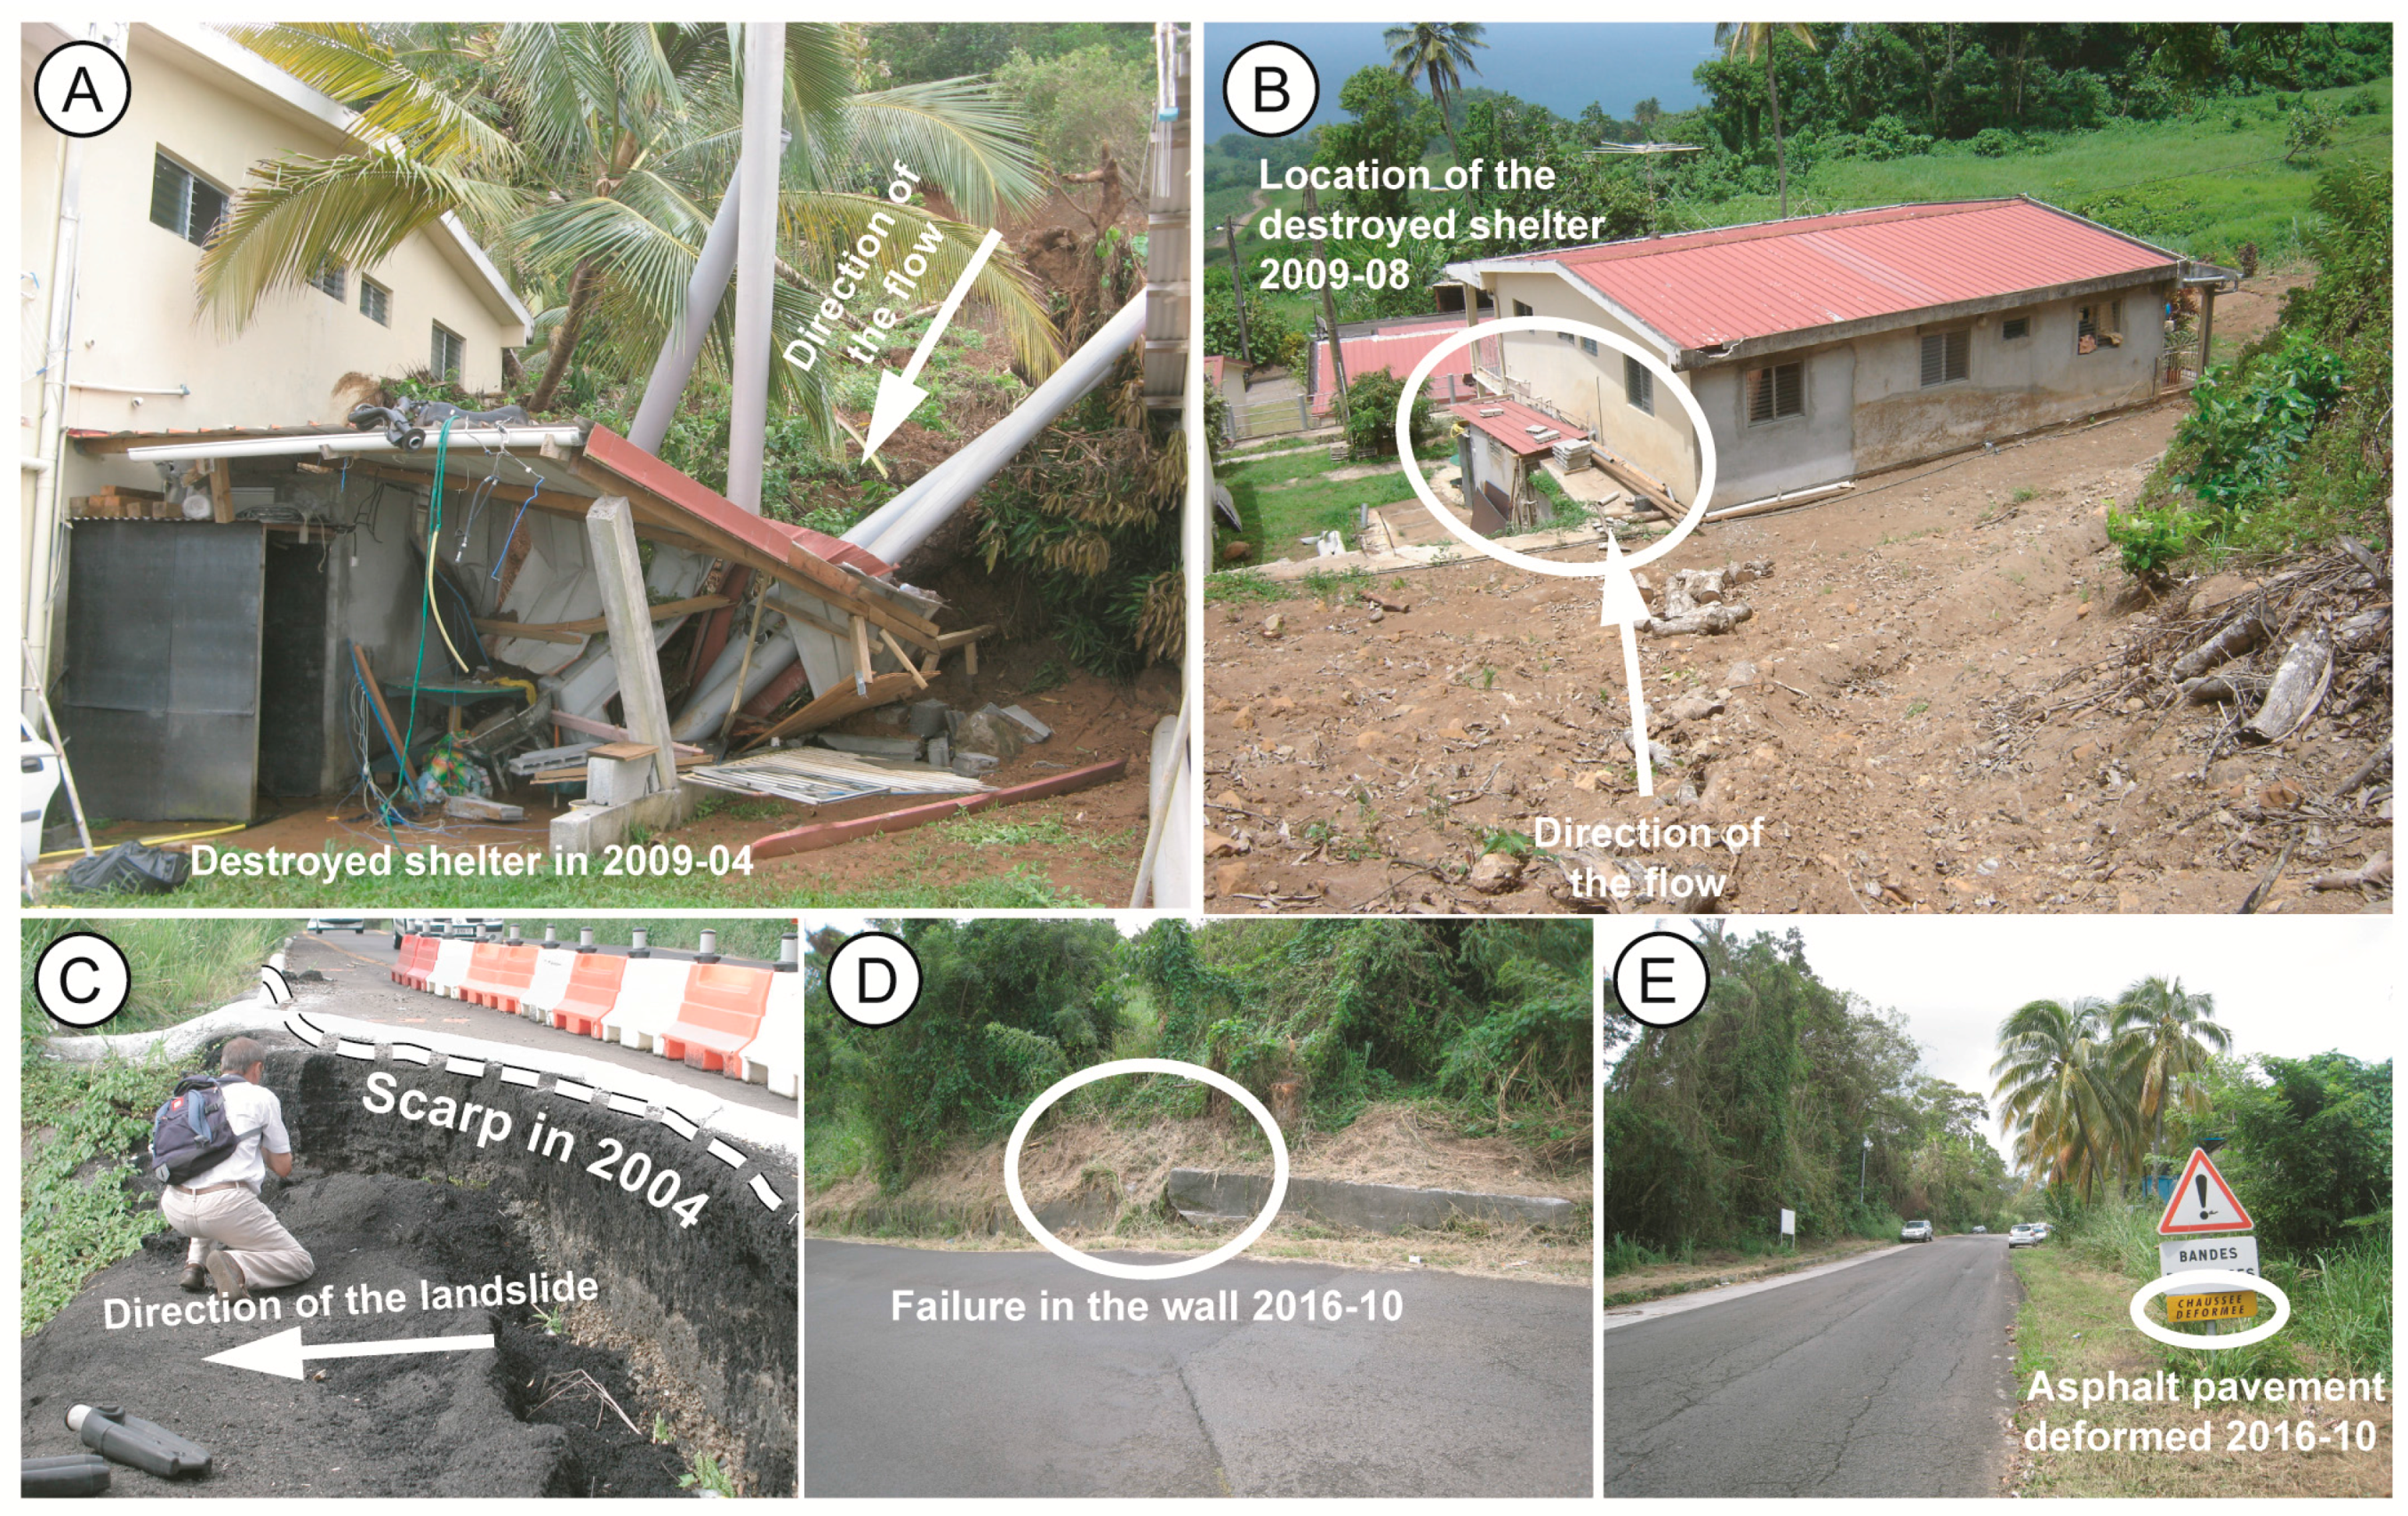
2.2. Landslides
3. Methods and Materials
3.1. Identification of Regolith (Surficial and Weathered Materials)
- The nature and implementation of the formations, allowing one to differentiate between the formations associated with different volcanic edifices (andesitic and basaltic flows, tuffs) and the formations associated with their dismantling and associated implementation process (colluvium, alluvium);
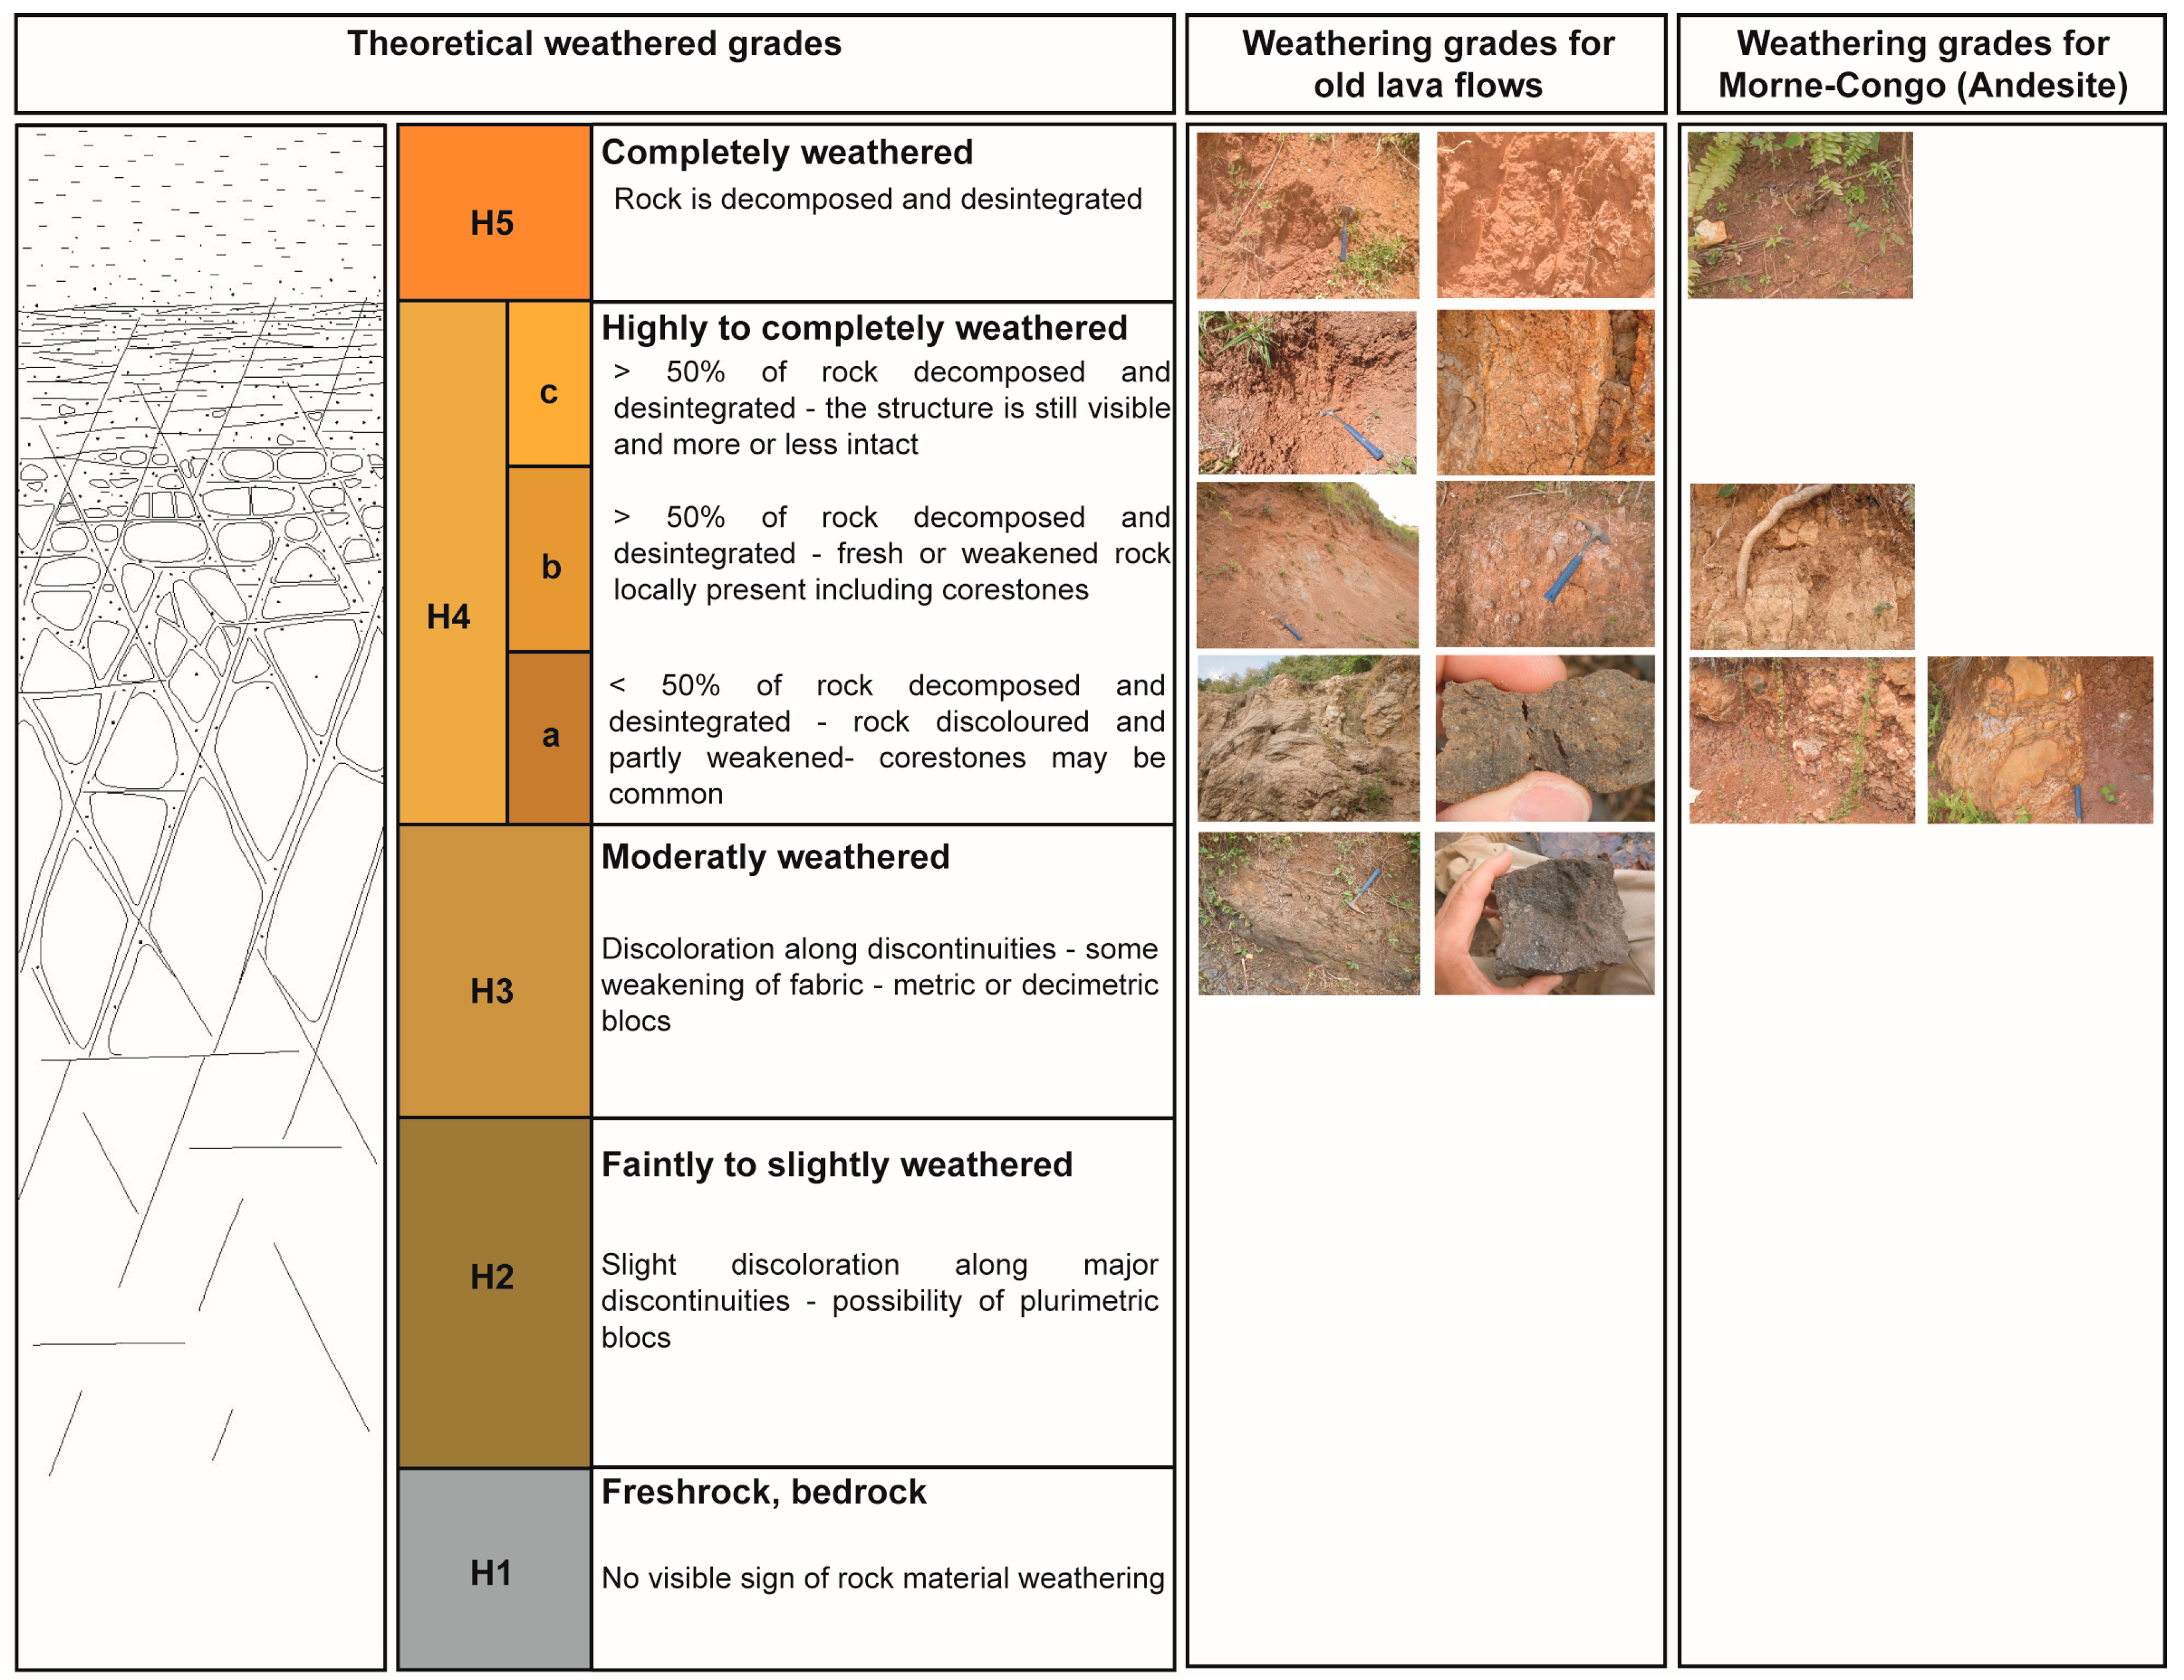
- The degree of weathering for each observed lithology. The weathering degree is assessed by the intensity of the fracturing in the rocks associated with the supergene phenomena and the degree of rock modification from a healthy stage without cracks to disaggregating rock into saprolite and alloterite [46,47,48]. The outcrops are listed in a typical weathering profile and belong to one of the following five types of horizons given in Figure 5.
3.2. TDEM and 3D Geological Model
3.2.1. Background
3.2.2. Technical Dispositive
3.2.3. Inversion Processes
3.2.4. 3D Geological Model
3.3. Landslide Susceptibility Analysis: Slope Stability Modeling, Elaboration of Scenarios, Run-out Analysis, and Spatialization
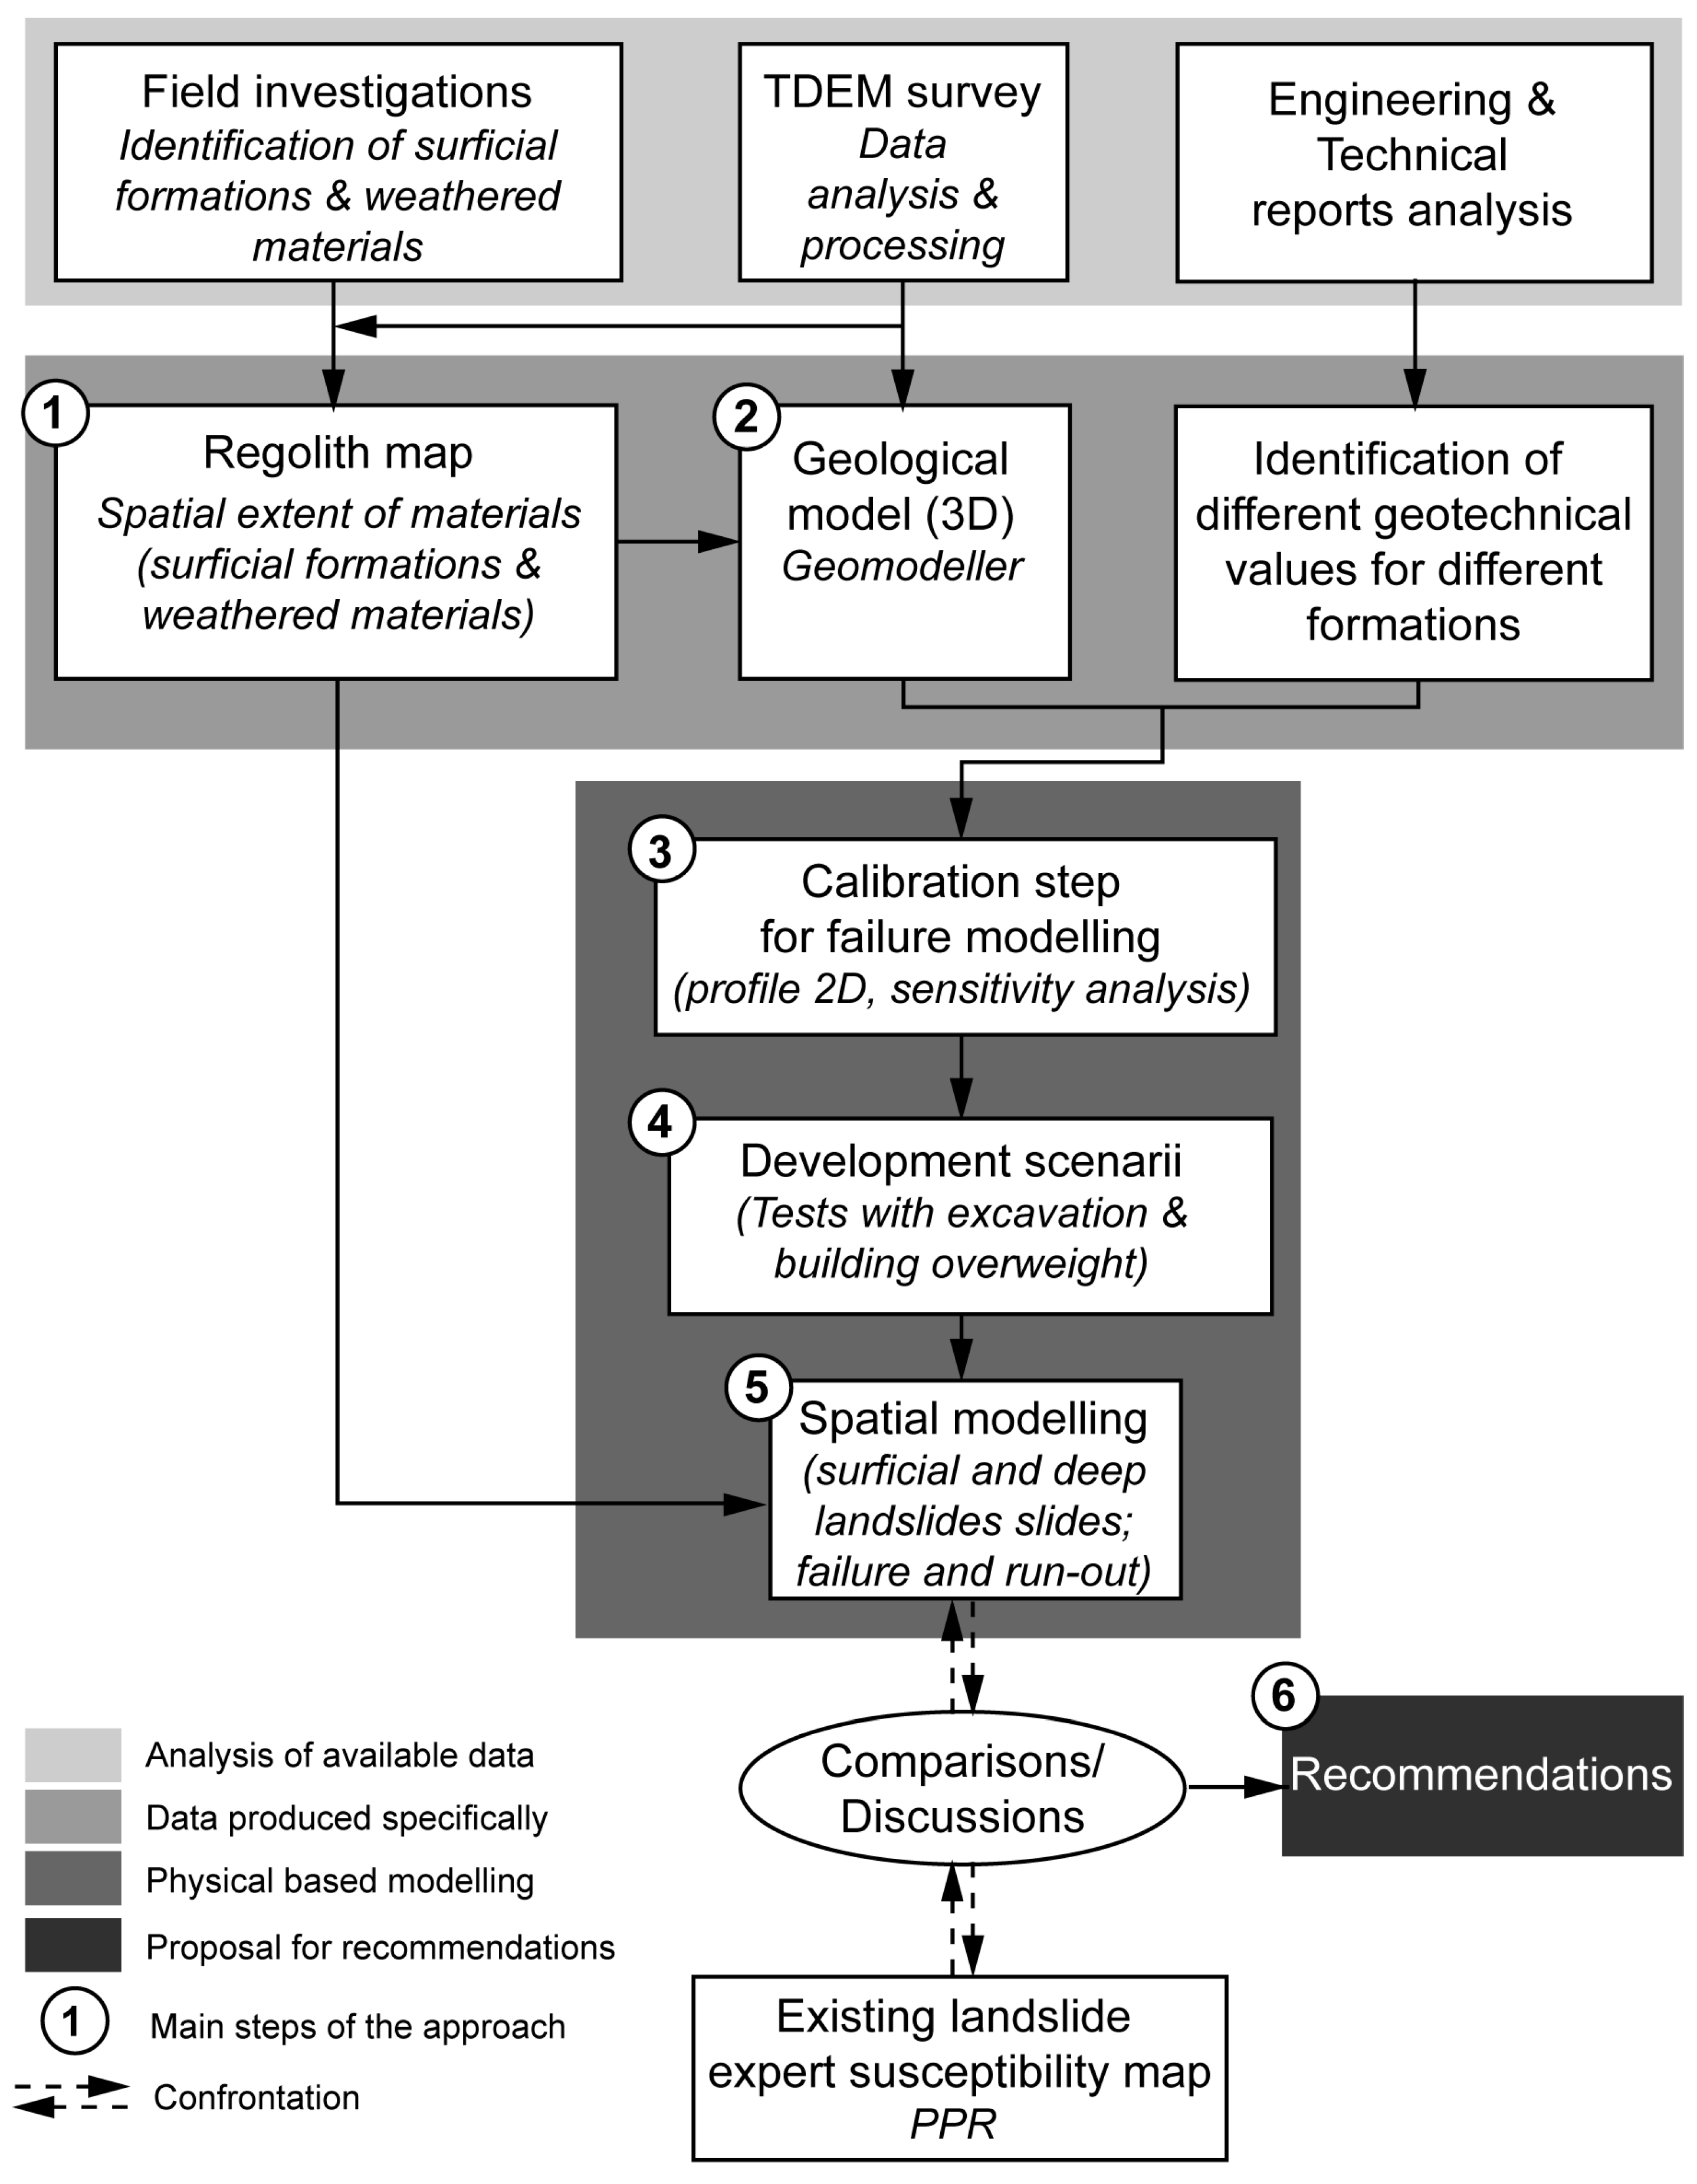
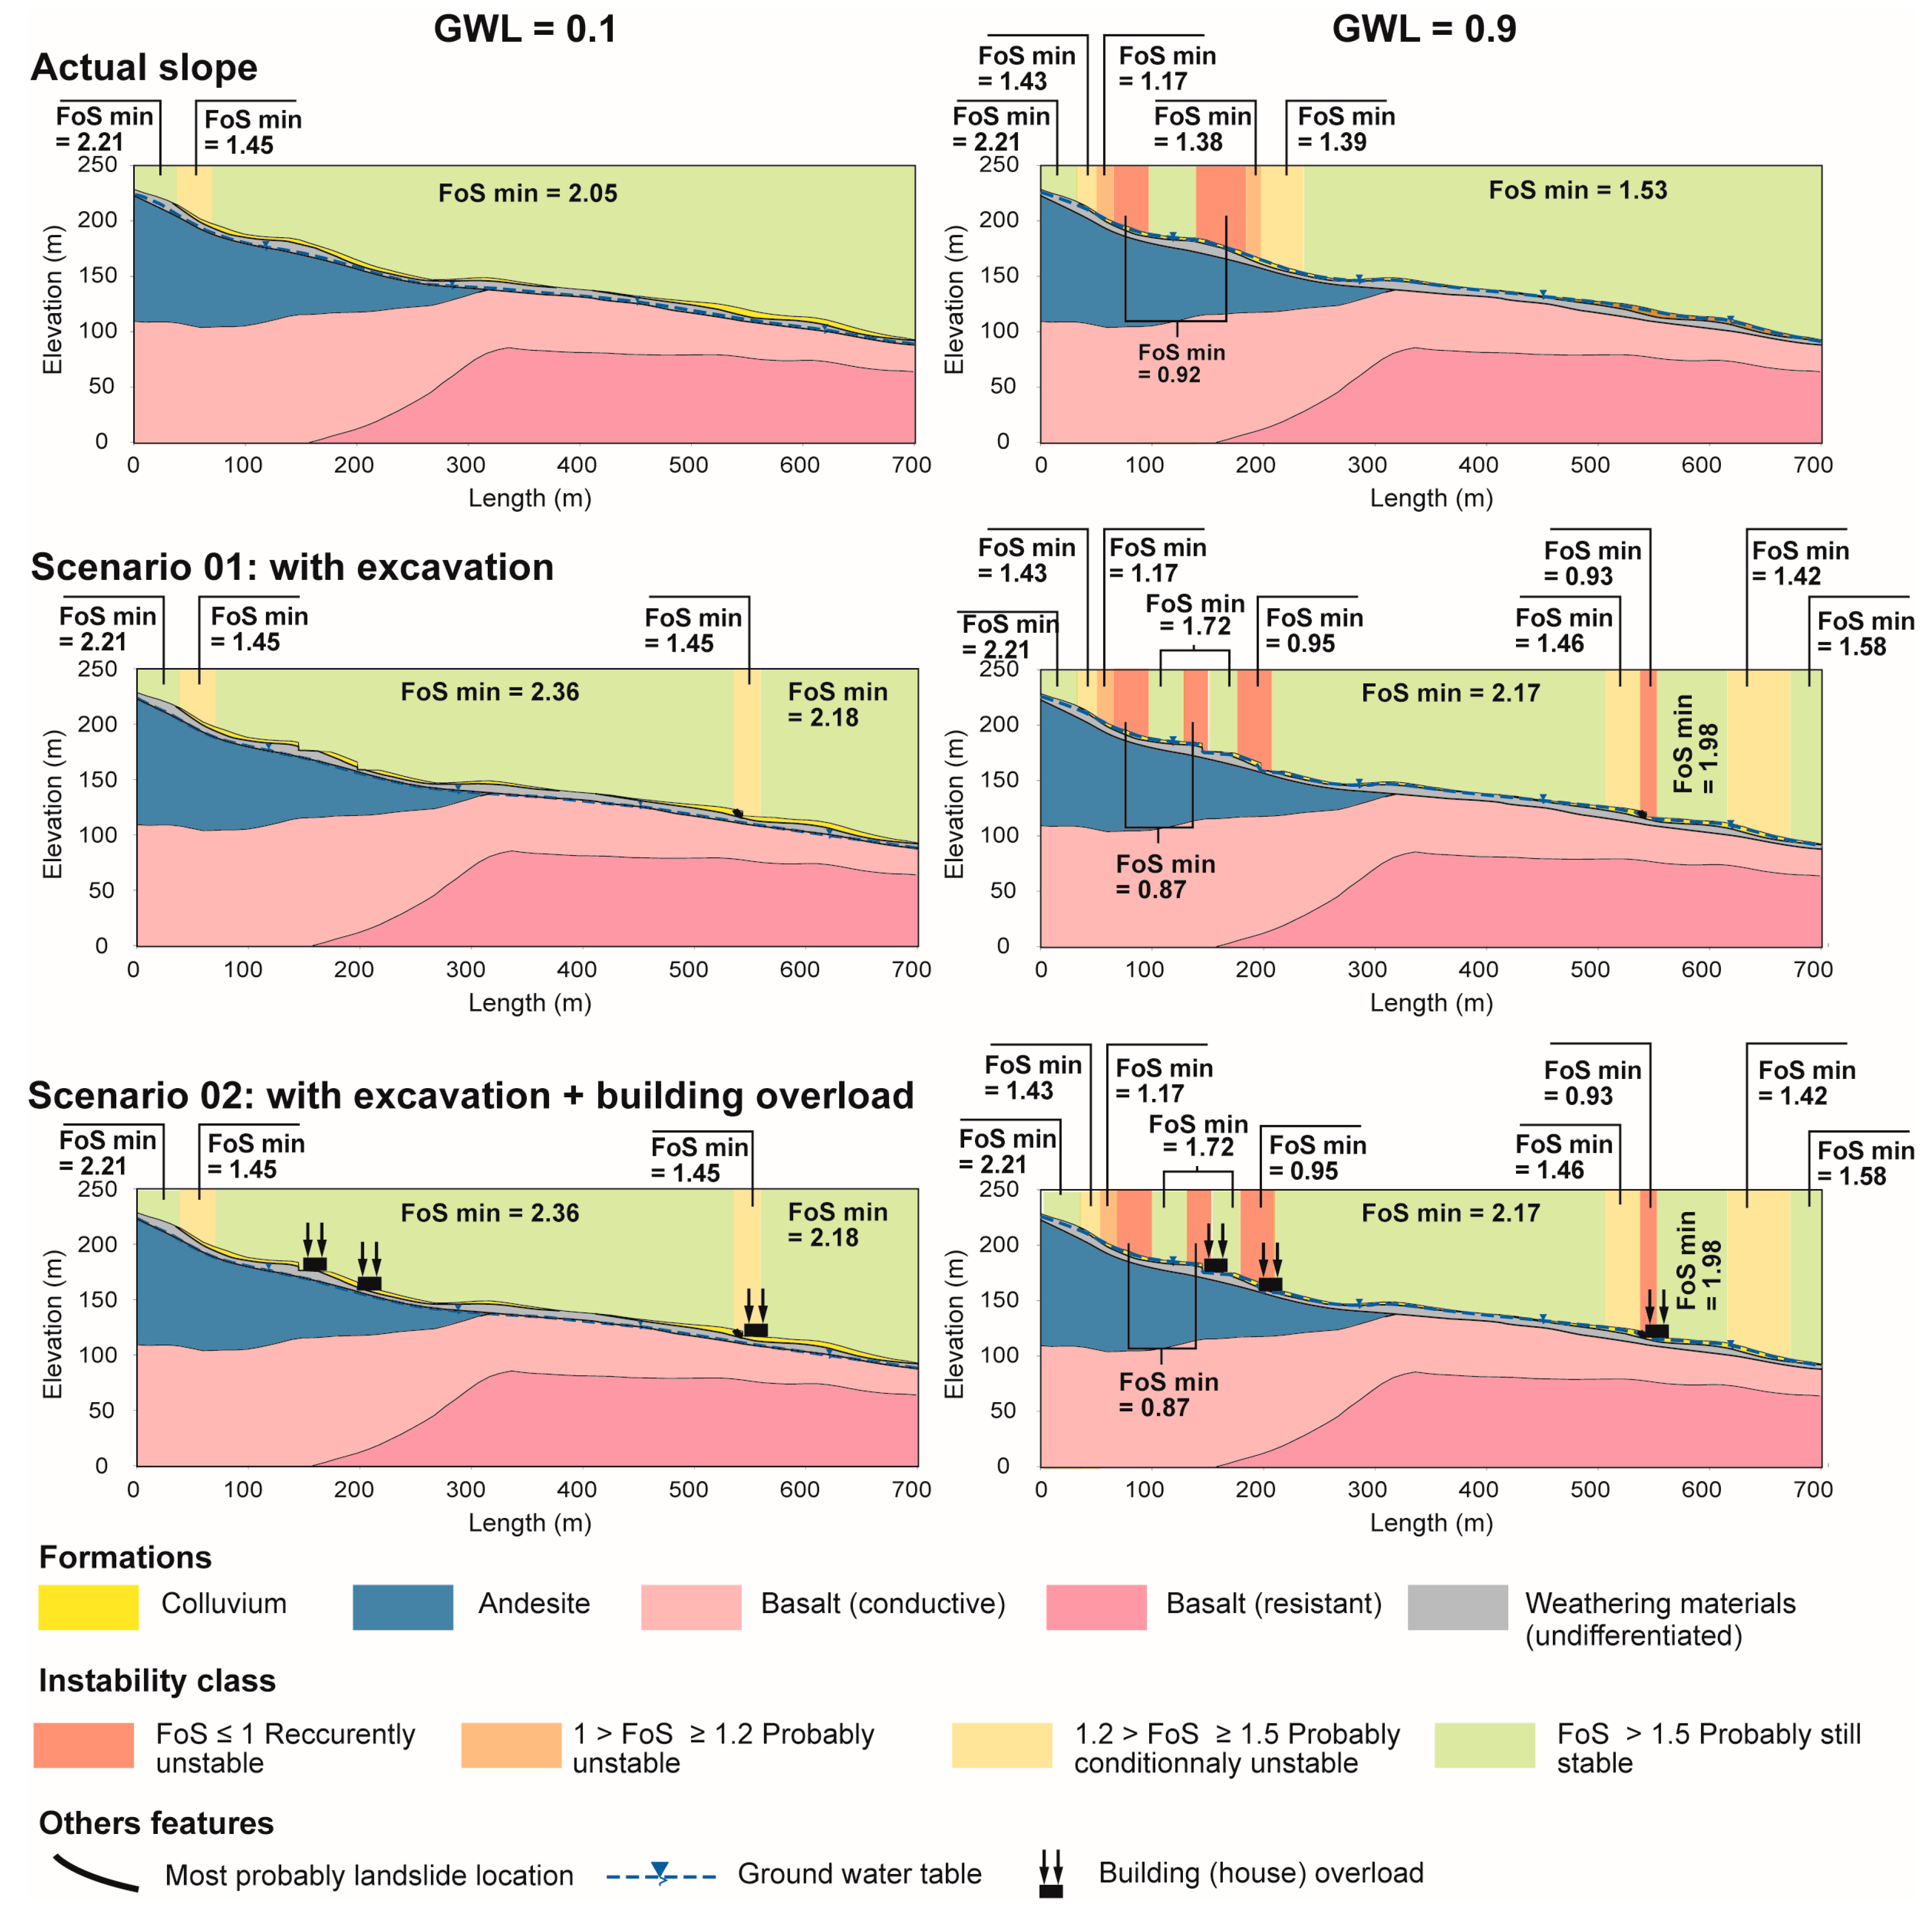
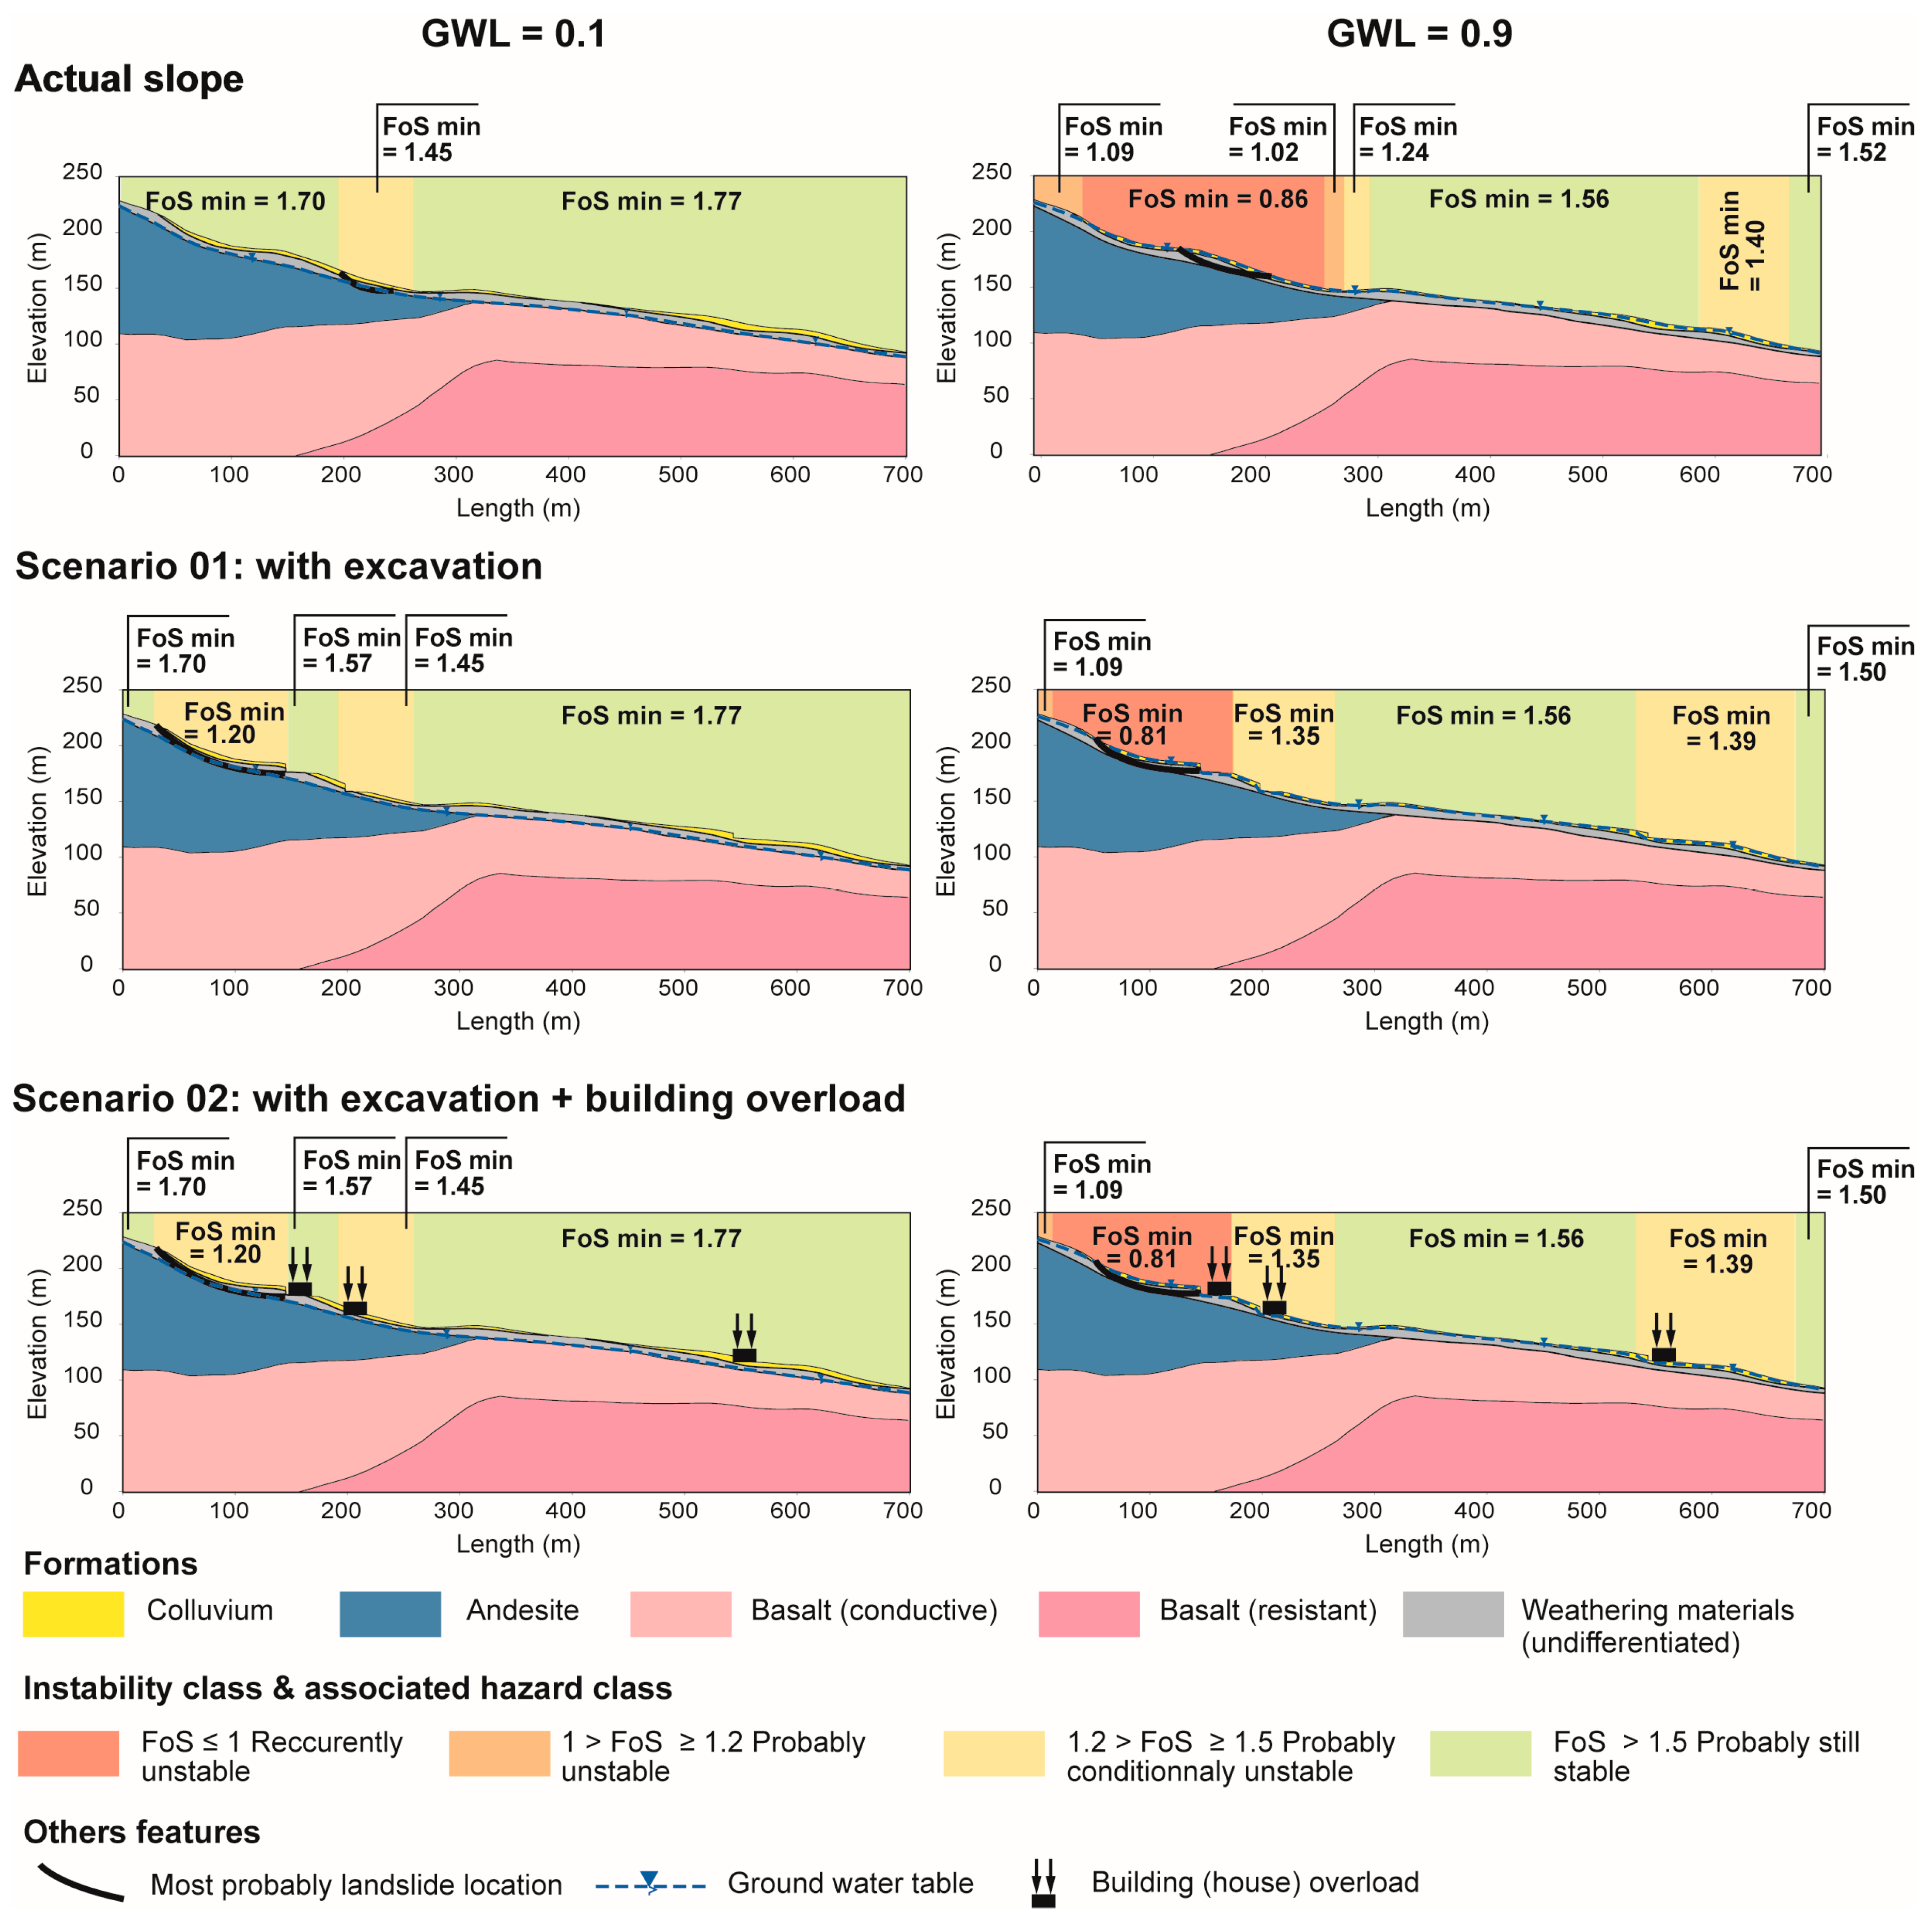
- The first step was based on a 2D analysis of the FoS assessing the various most influential parameters (topography, GWL, geotechnical values). Some scenarios were used along one cross section with tests about excavation and building overload (only taking into account house characteristics). In this way, it was possible to assess the influence of future planning on slope stability;
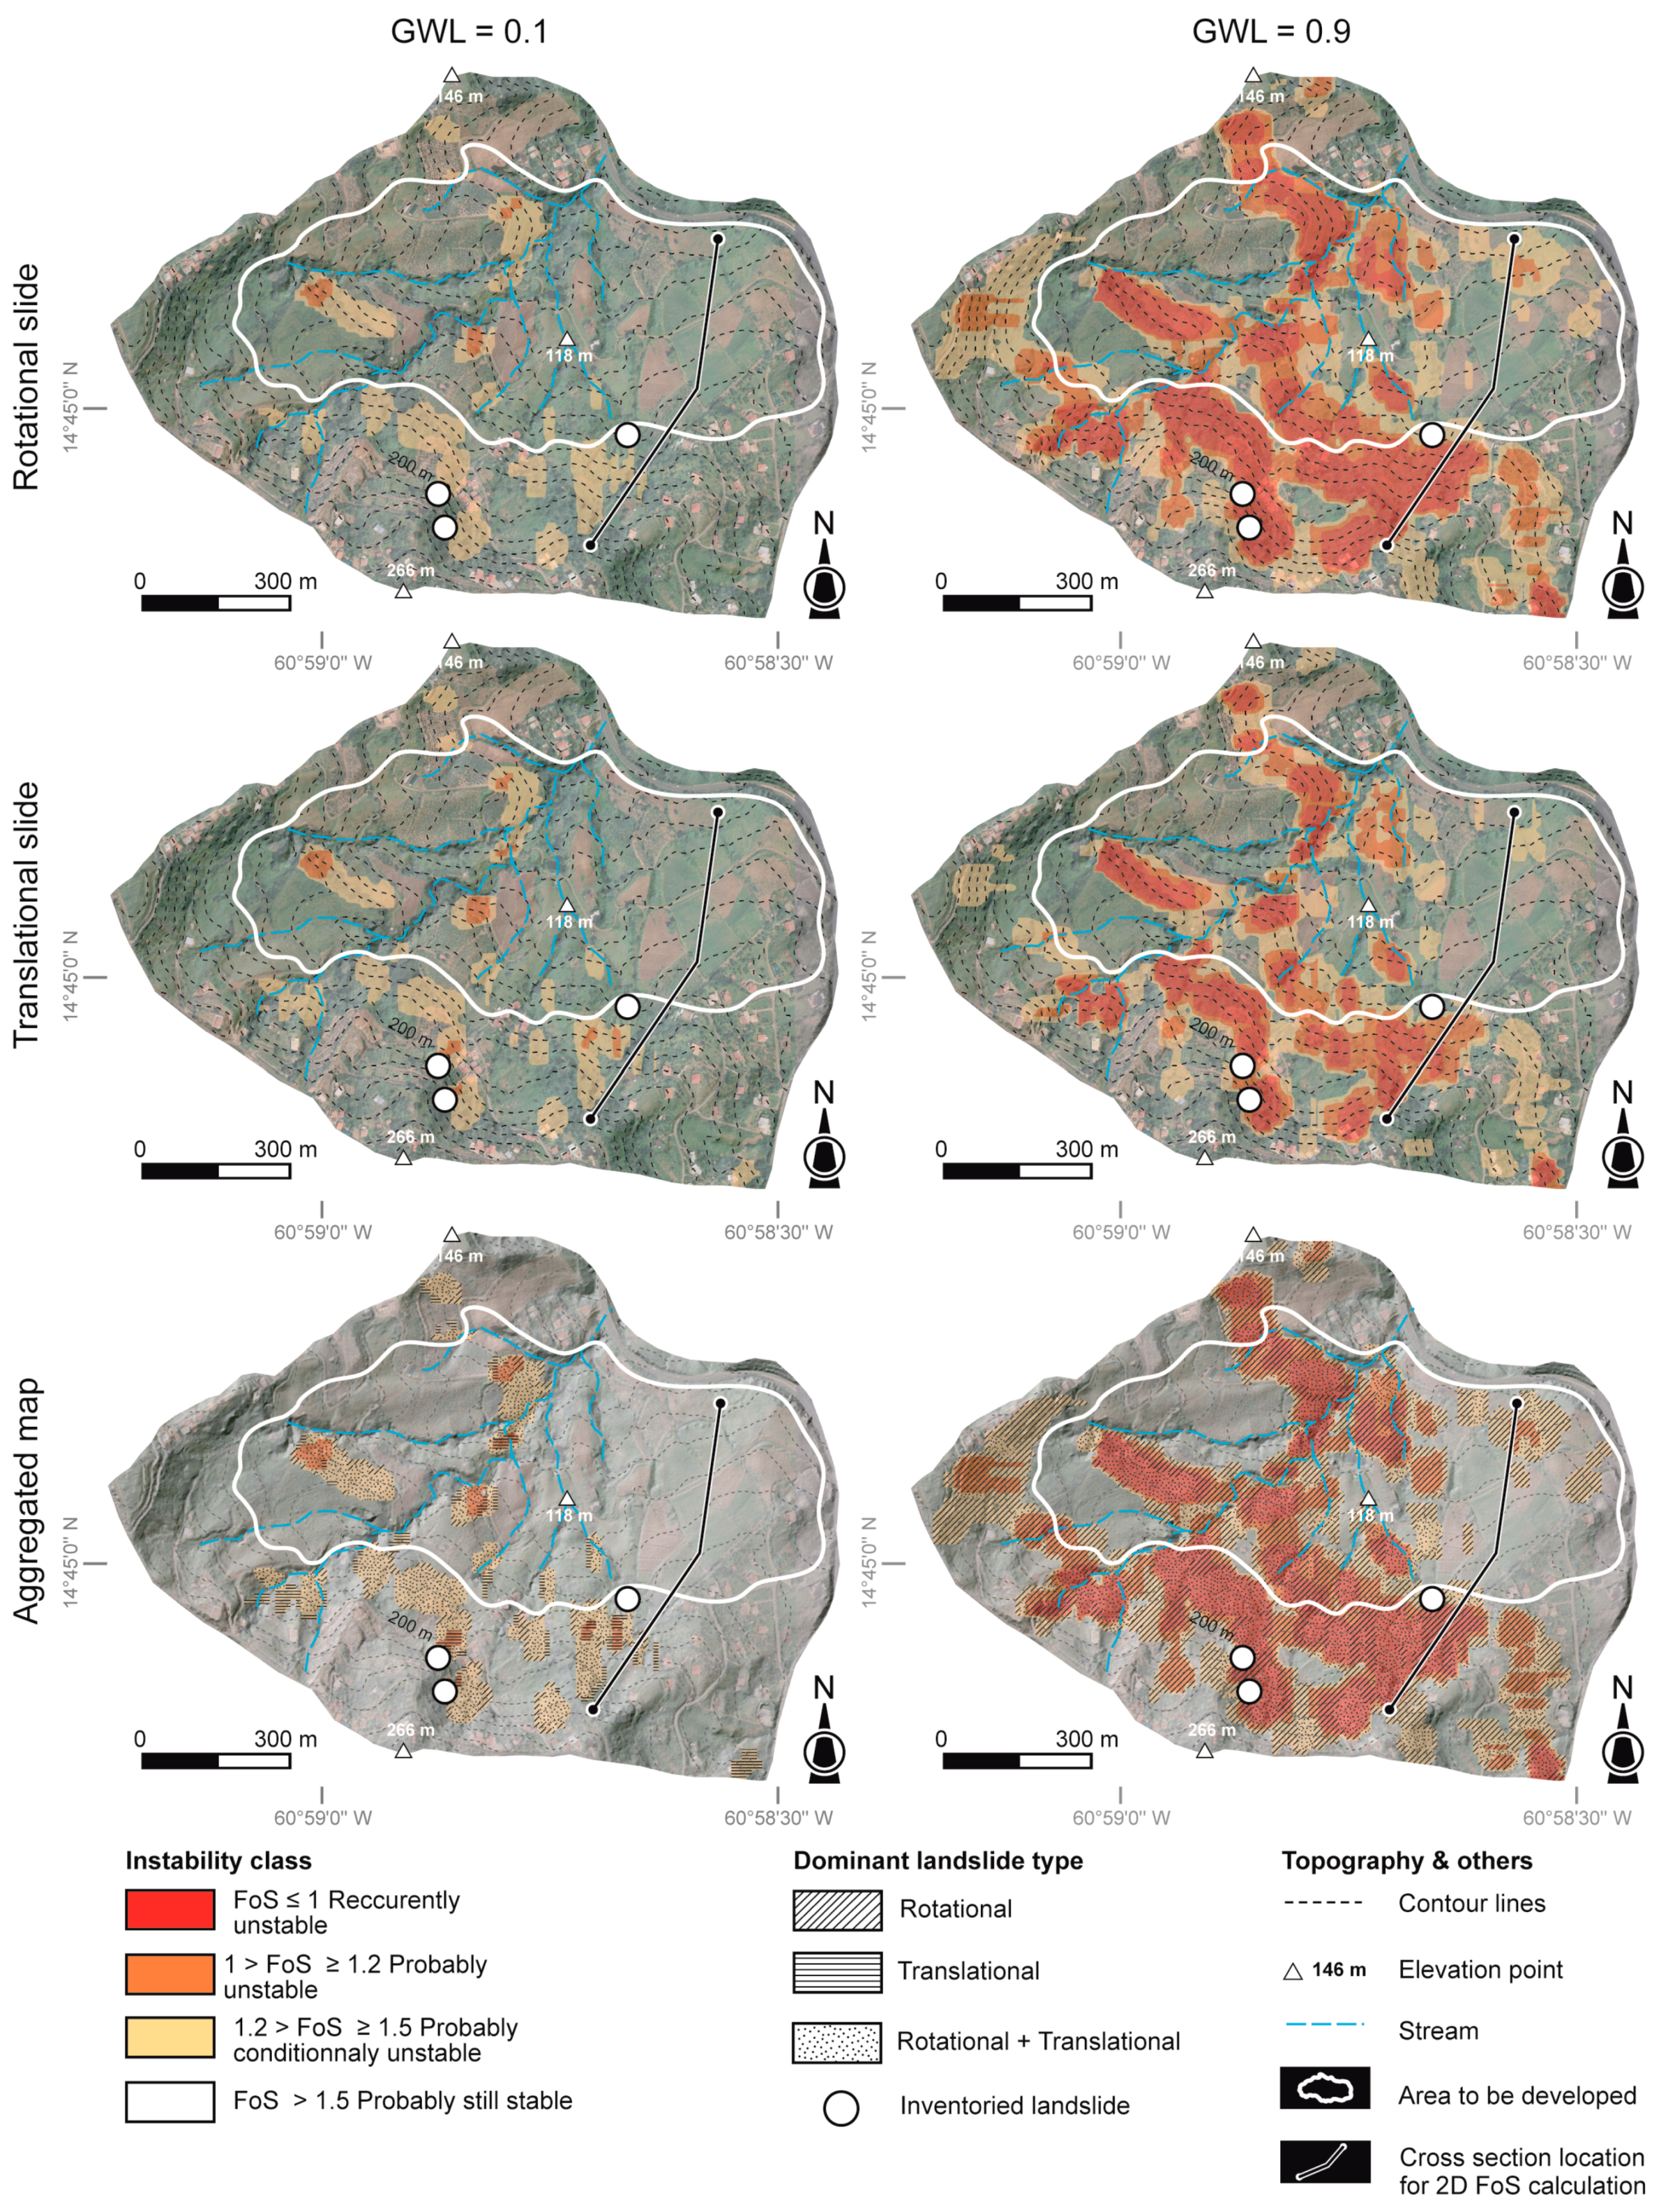
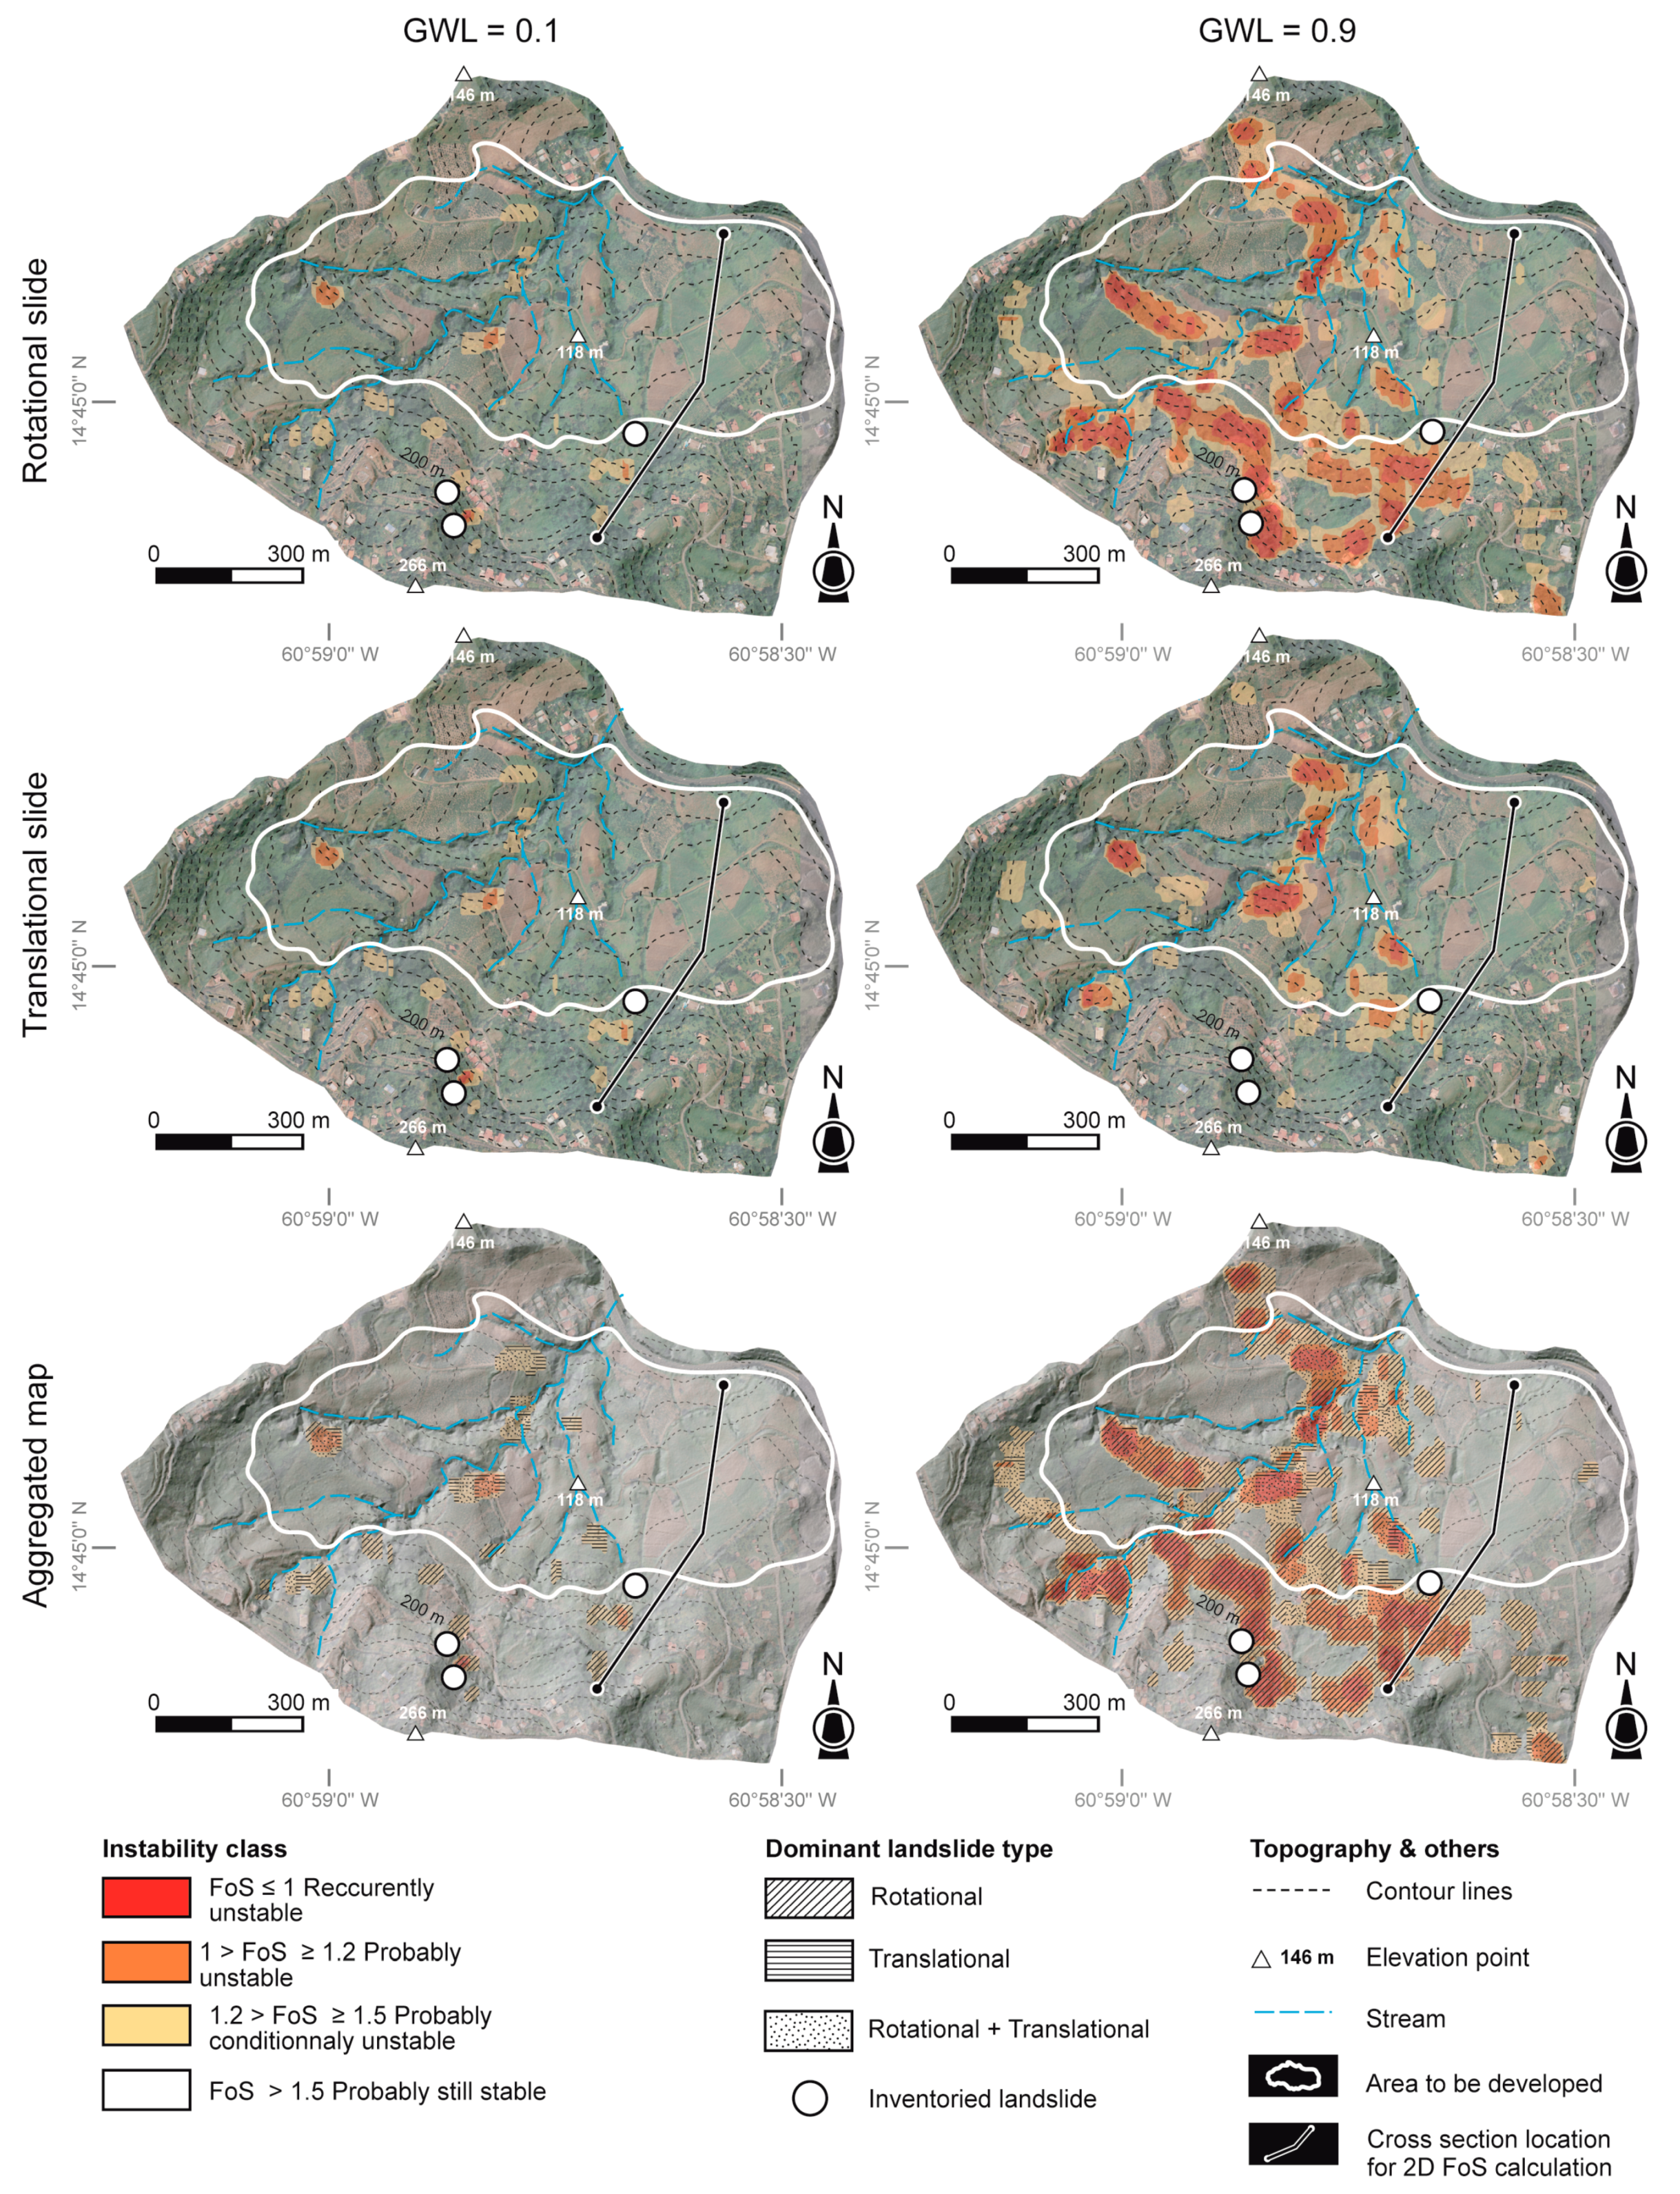
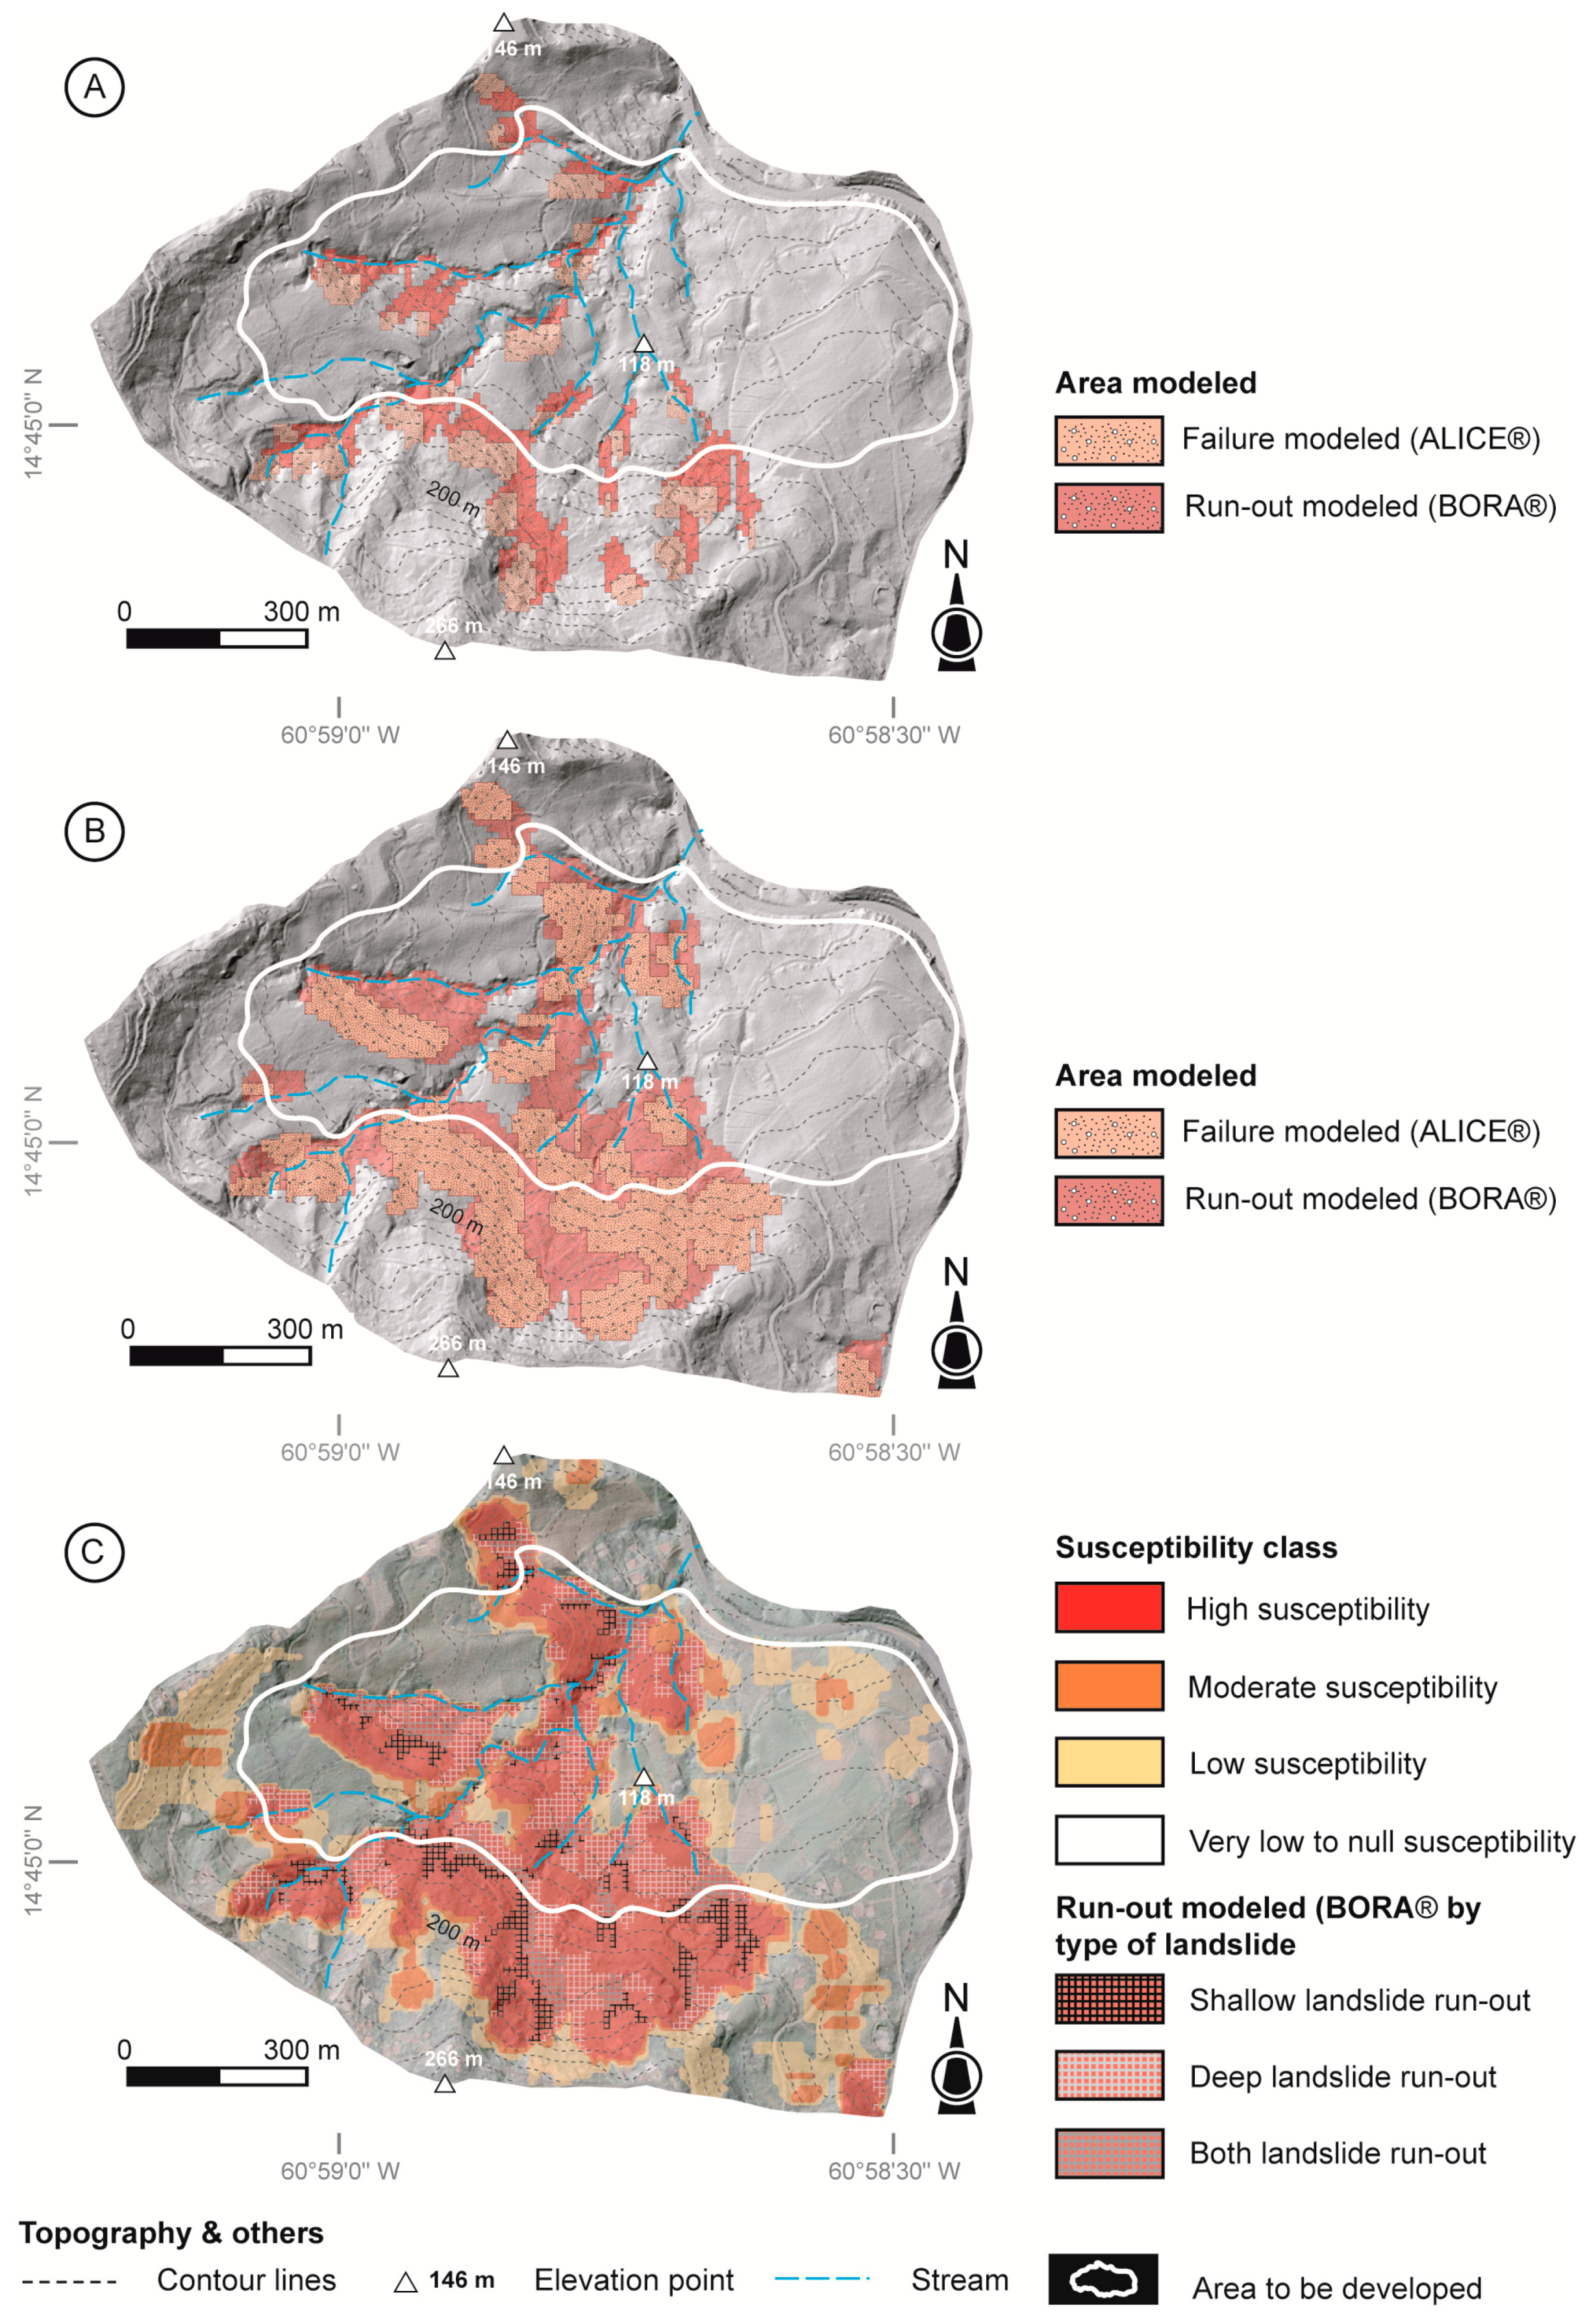
- The second step consisted of spatializing the FoS to define the most unstable areas according to a spatialized physically based model (i.e., ALICE®) developed by the French Geological Survey [65,66]. ALICE® is able to support different landslides’ geometries, the spatial and inherent heterogeneity of the surficial deposits and geology and their geotechnical parameters, different triggering factors (i.e., GWL and seismicity—PGA), and land use change. The geometry of the studied area is entered as a dataset in raster format: topography, geometry of geological, and/or surficial deposits layers represented by a DTM (i.e., basal surface of the layer). Geomechanical characteristics are associated with each geologic and surficial deposit layer. More details about the tool and its possibility can be found in [65,66];
- The third step focused on the run-out calculation based on the ALICE® results with a cellular automaton (BORA®) developed by the French Geological Survey for the French Indies and Polynesia [67].
- Surface topography and internal structure geometry;
- Effective cohesion c’ (kPa);
- Effective angle of friction ϕ’ (°);
- Specific bulk unit weight yd (kN·m−3).
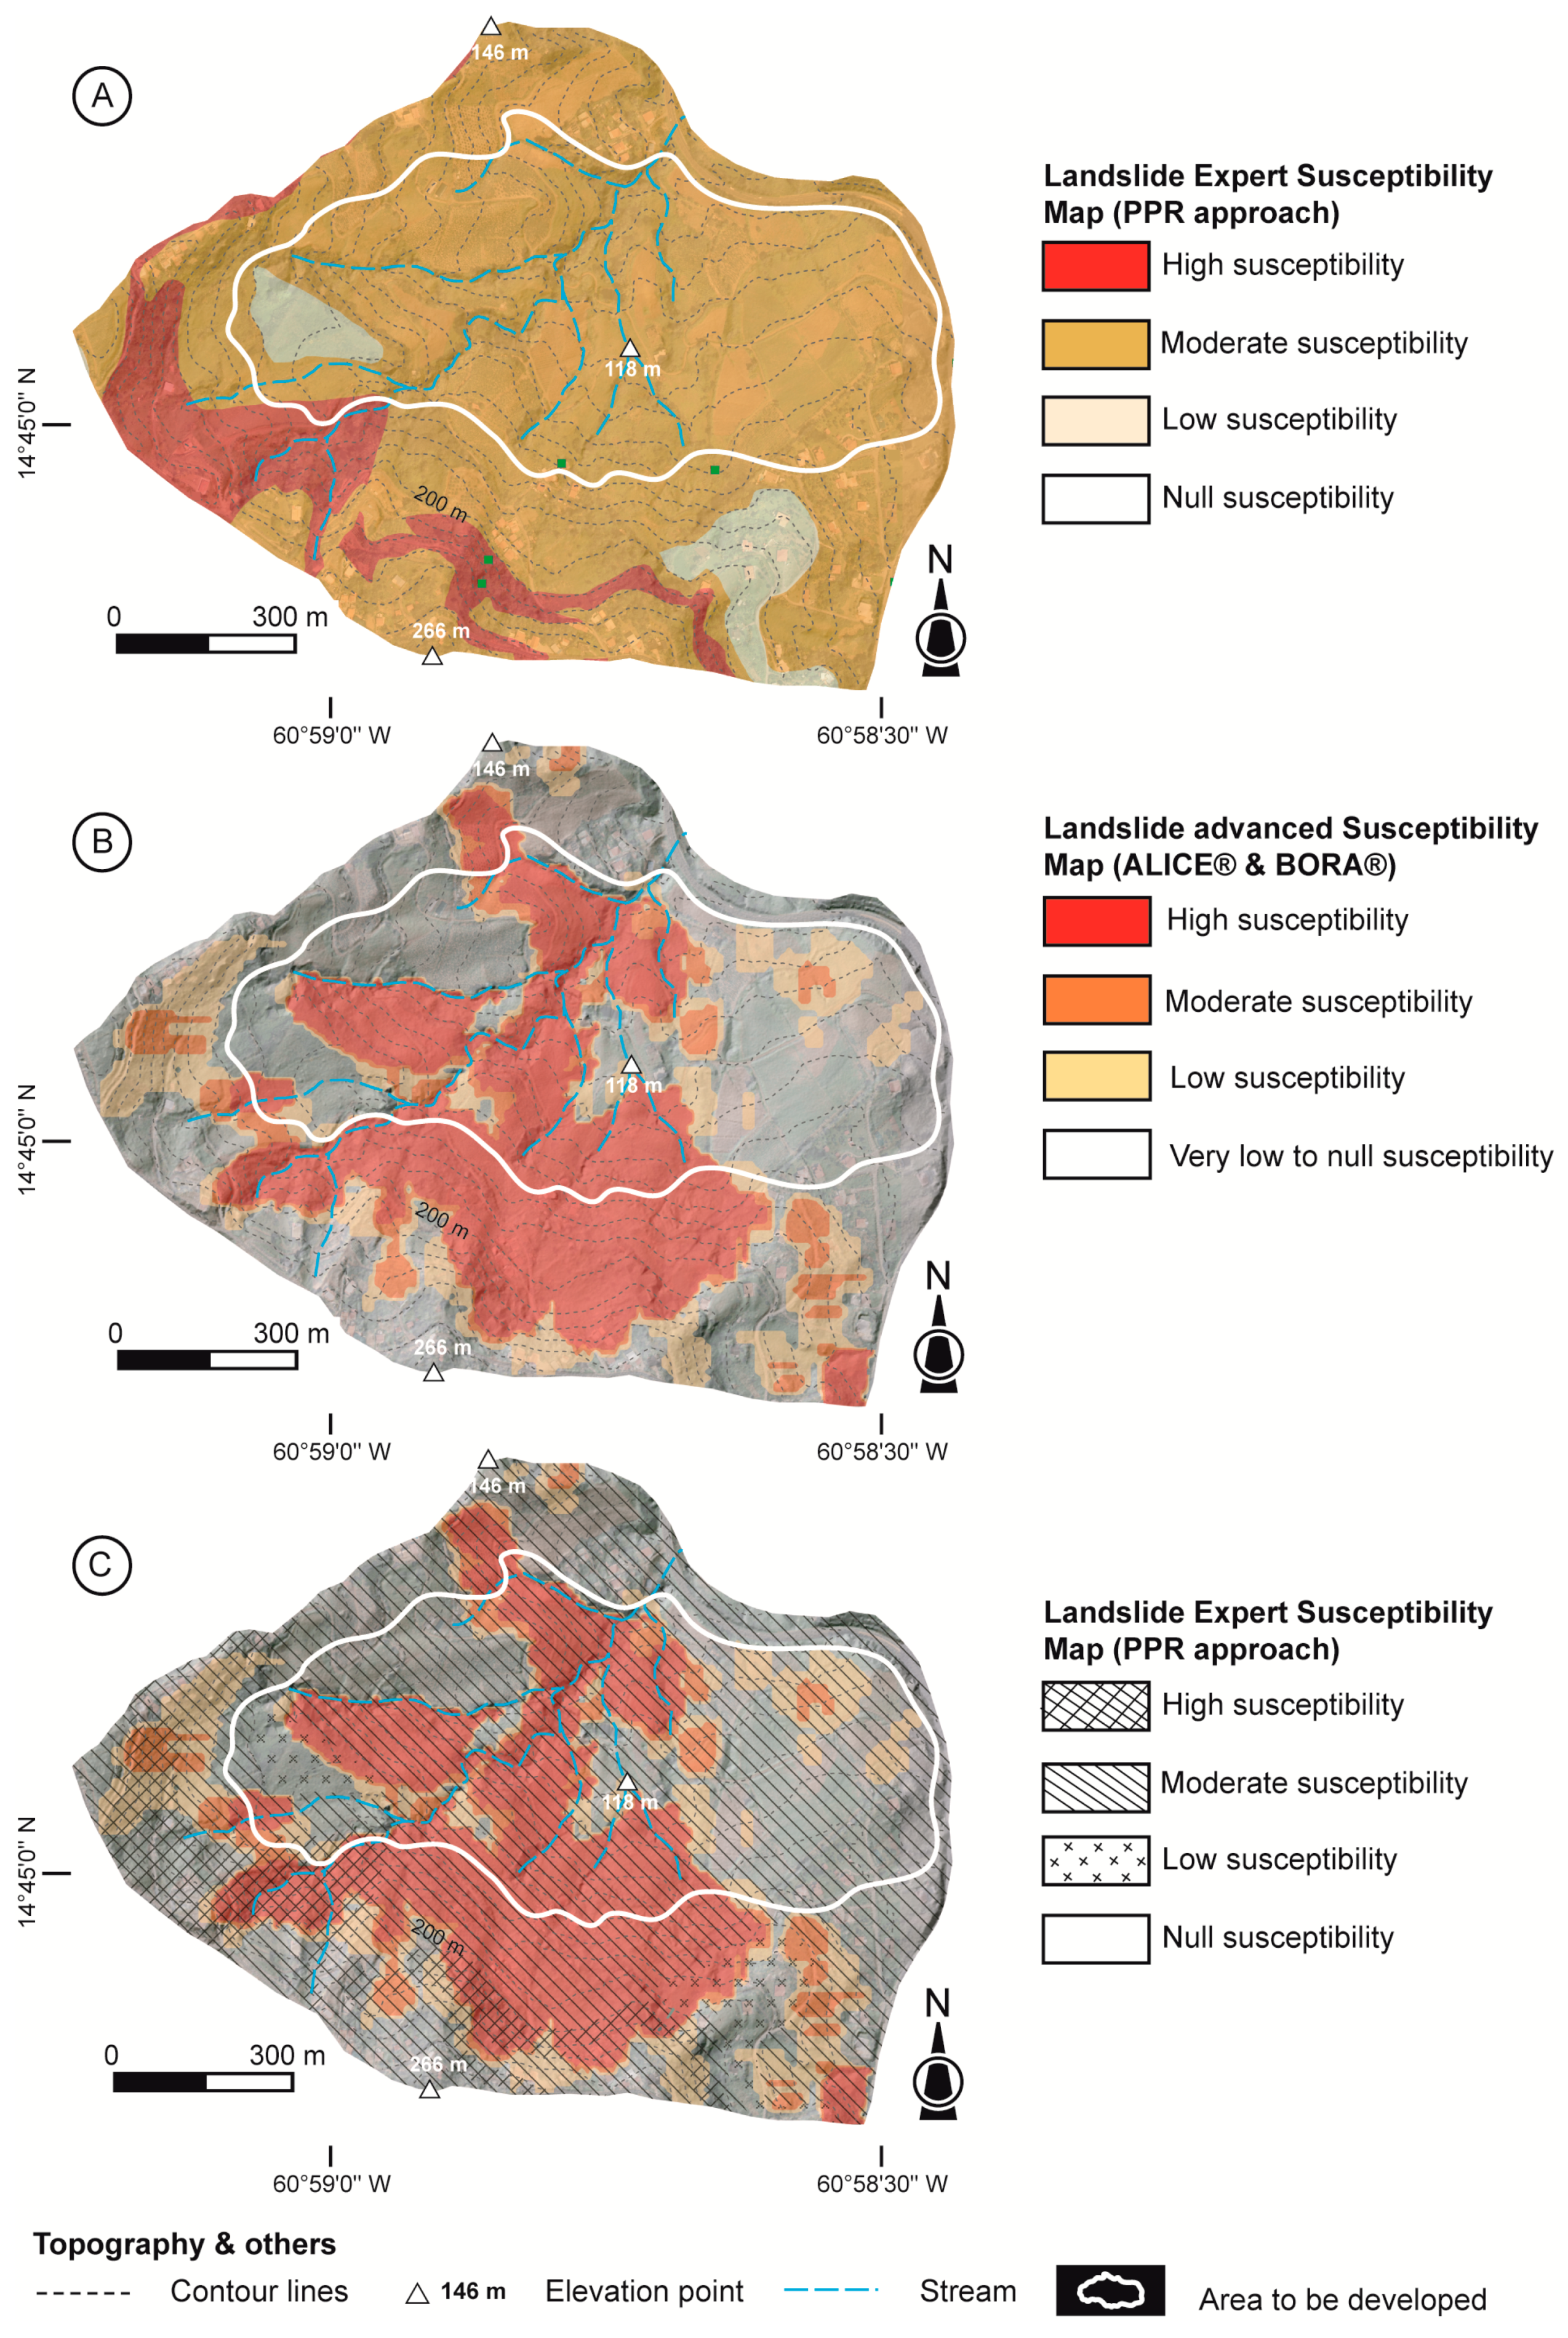
3.4. Comparison with Existing Landslide Expert Maps
- A zoning plan, resulting from the crossing of susceptibility or hazards (when information about the frequency and intensity of phenomena is available) and issues identifying areas that cannot be built on or only with special developments;
- A report presenting the studies, the results and justifications of the different zones and regulations included, and those made compulsory;
- A regulation describing the constructive and/or urban planning constraints in each zone.
4. Results
4.1. Regolith Map and Weathered Degree
- Horizons H5 and H4c formed the soft surface;
- Horizons H4b and H4c constituted the strongly weathered part;
- Horizons H4a and H3 represented healthy rocks with supergene origin cracking from low to medium intensity.
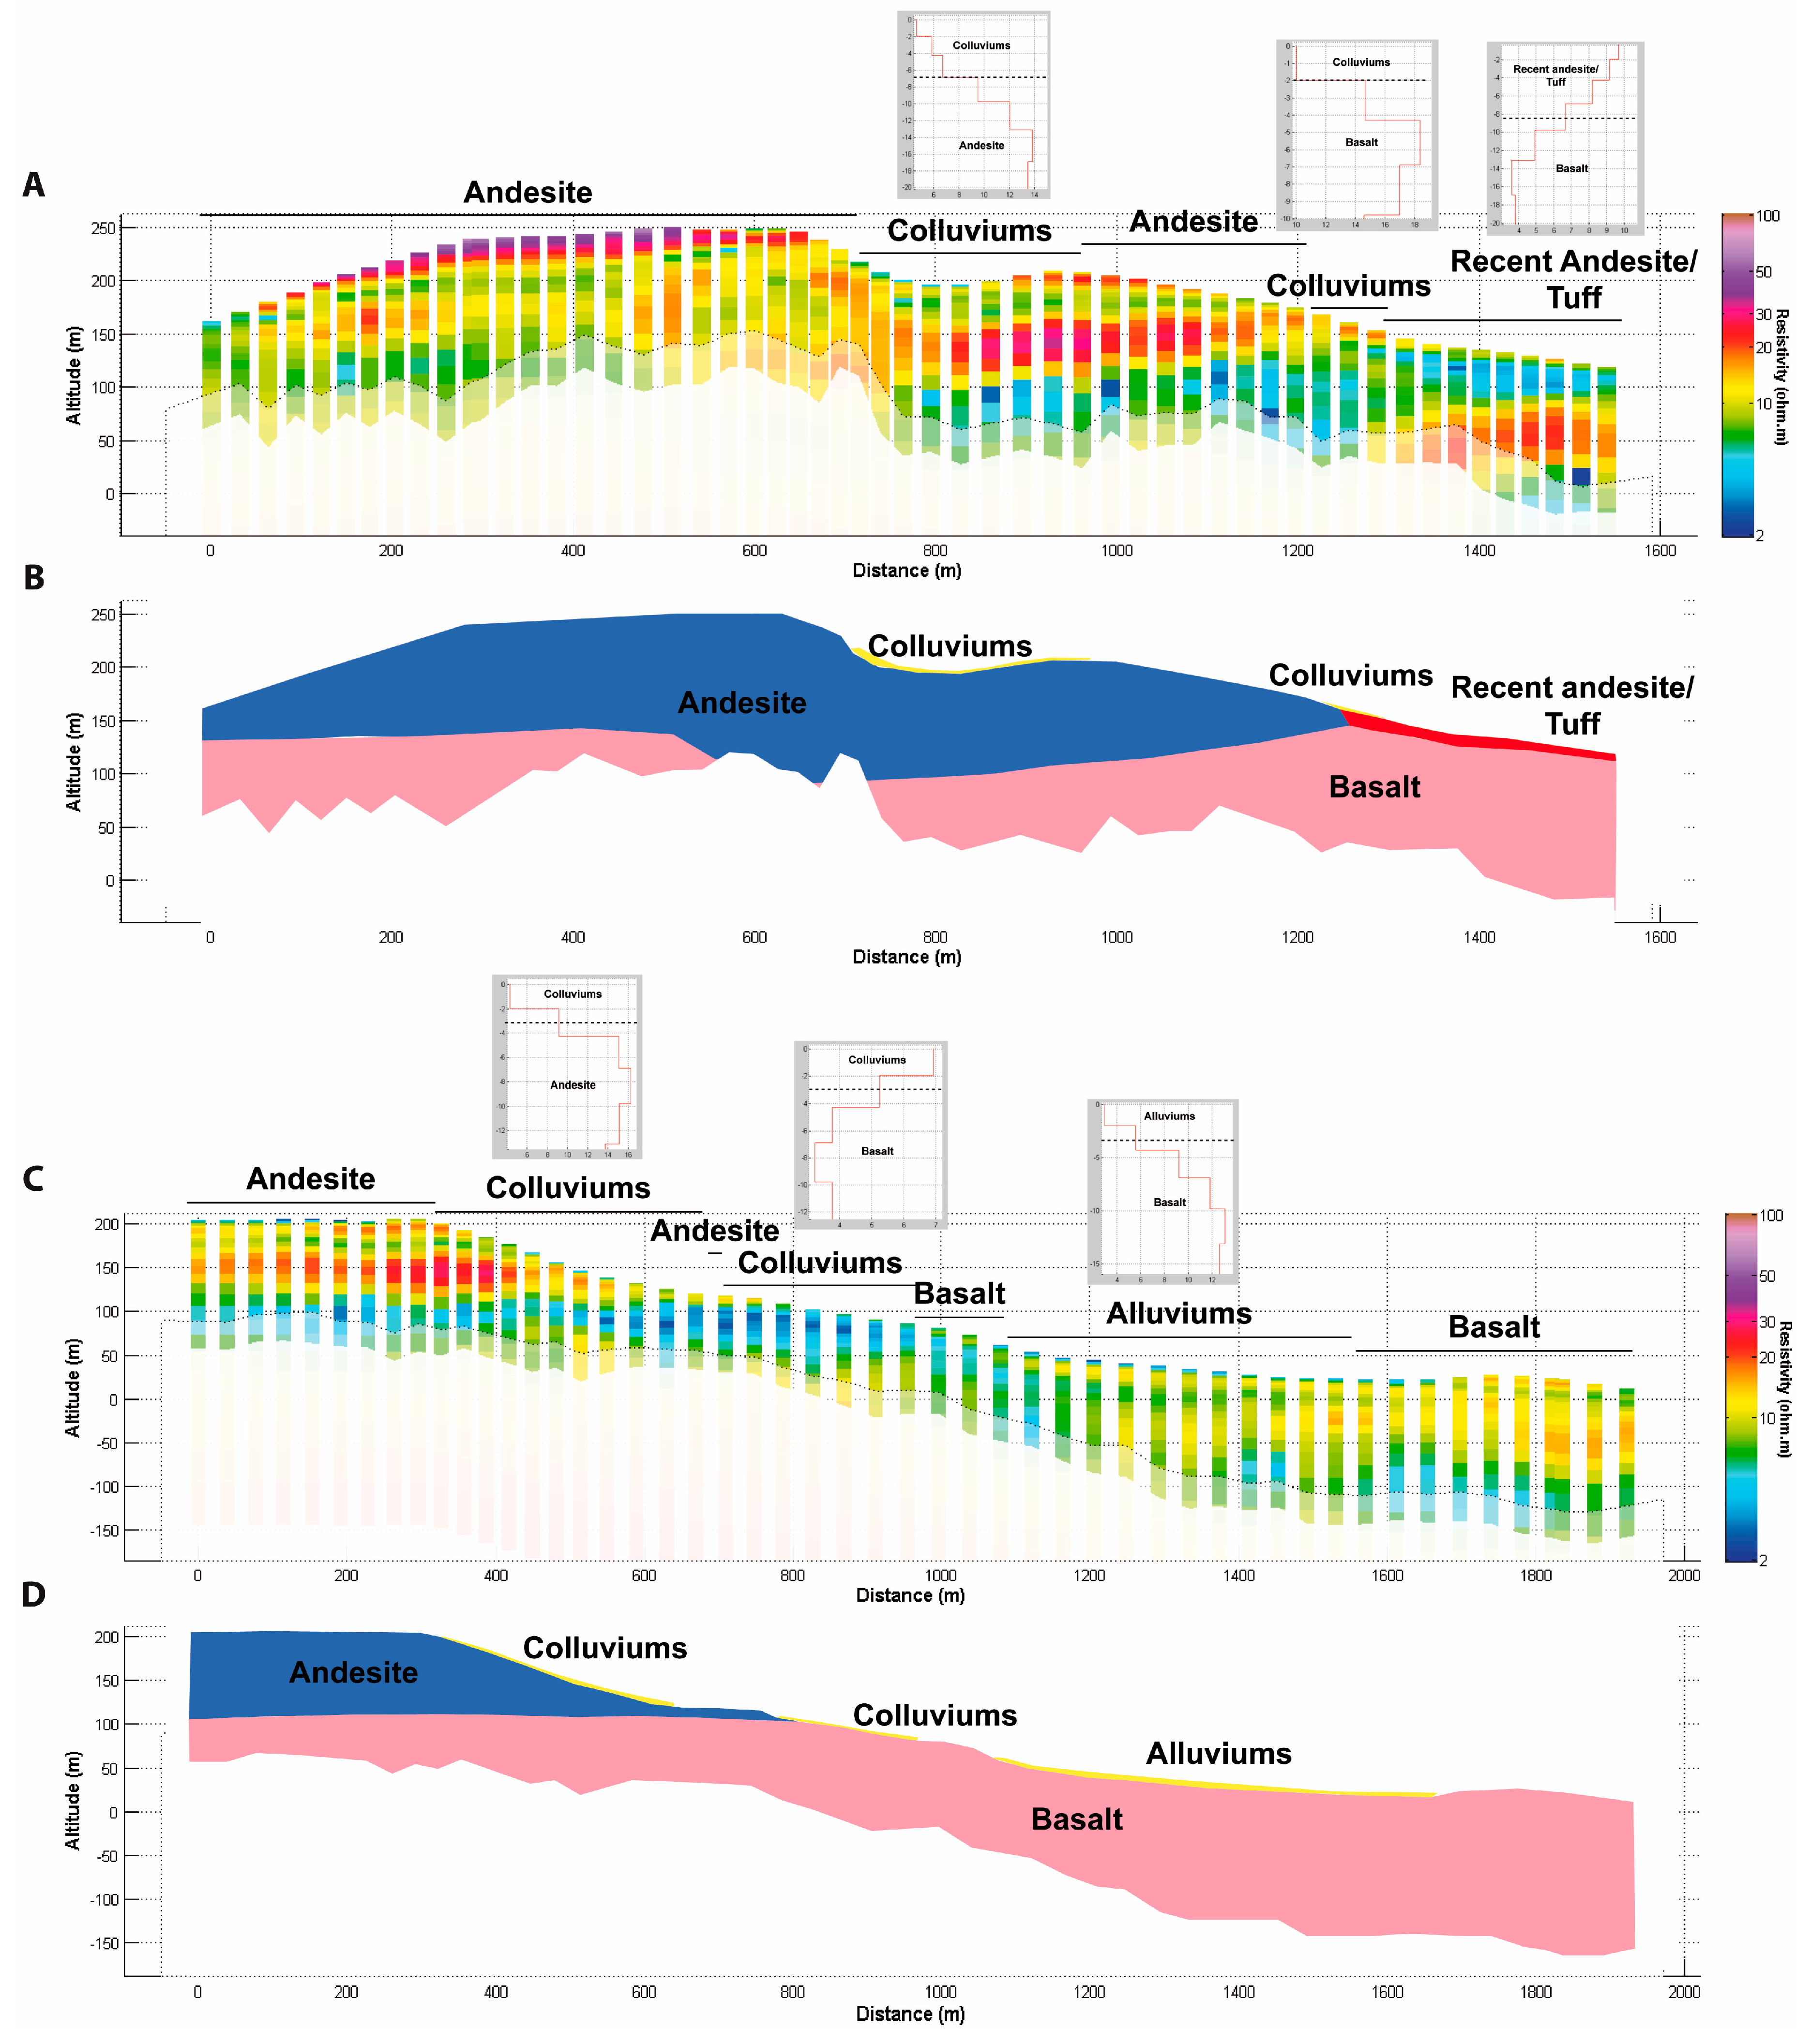
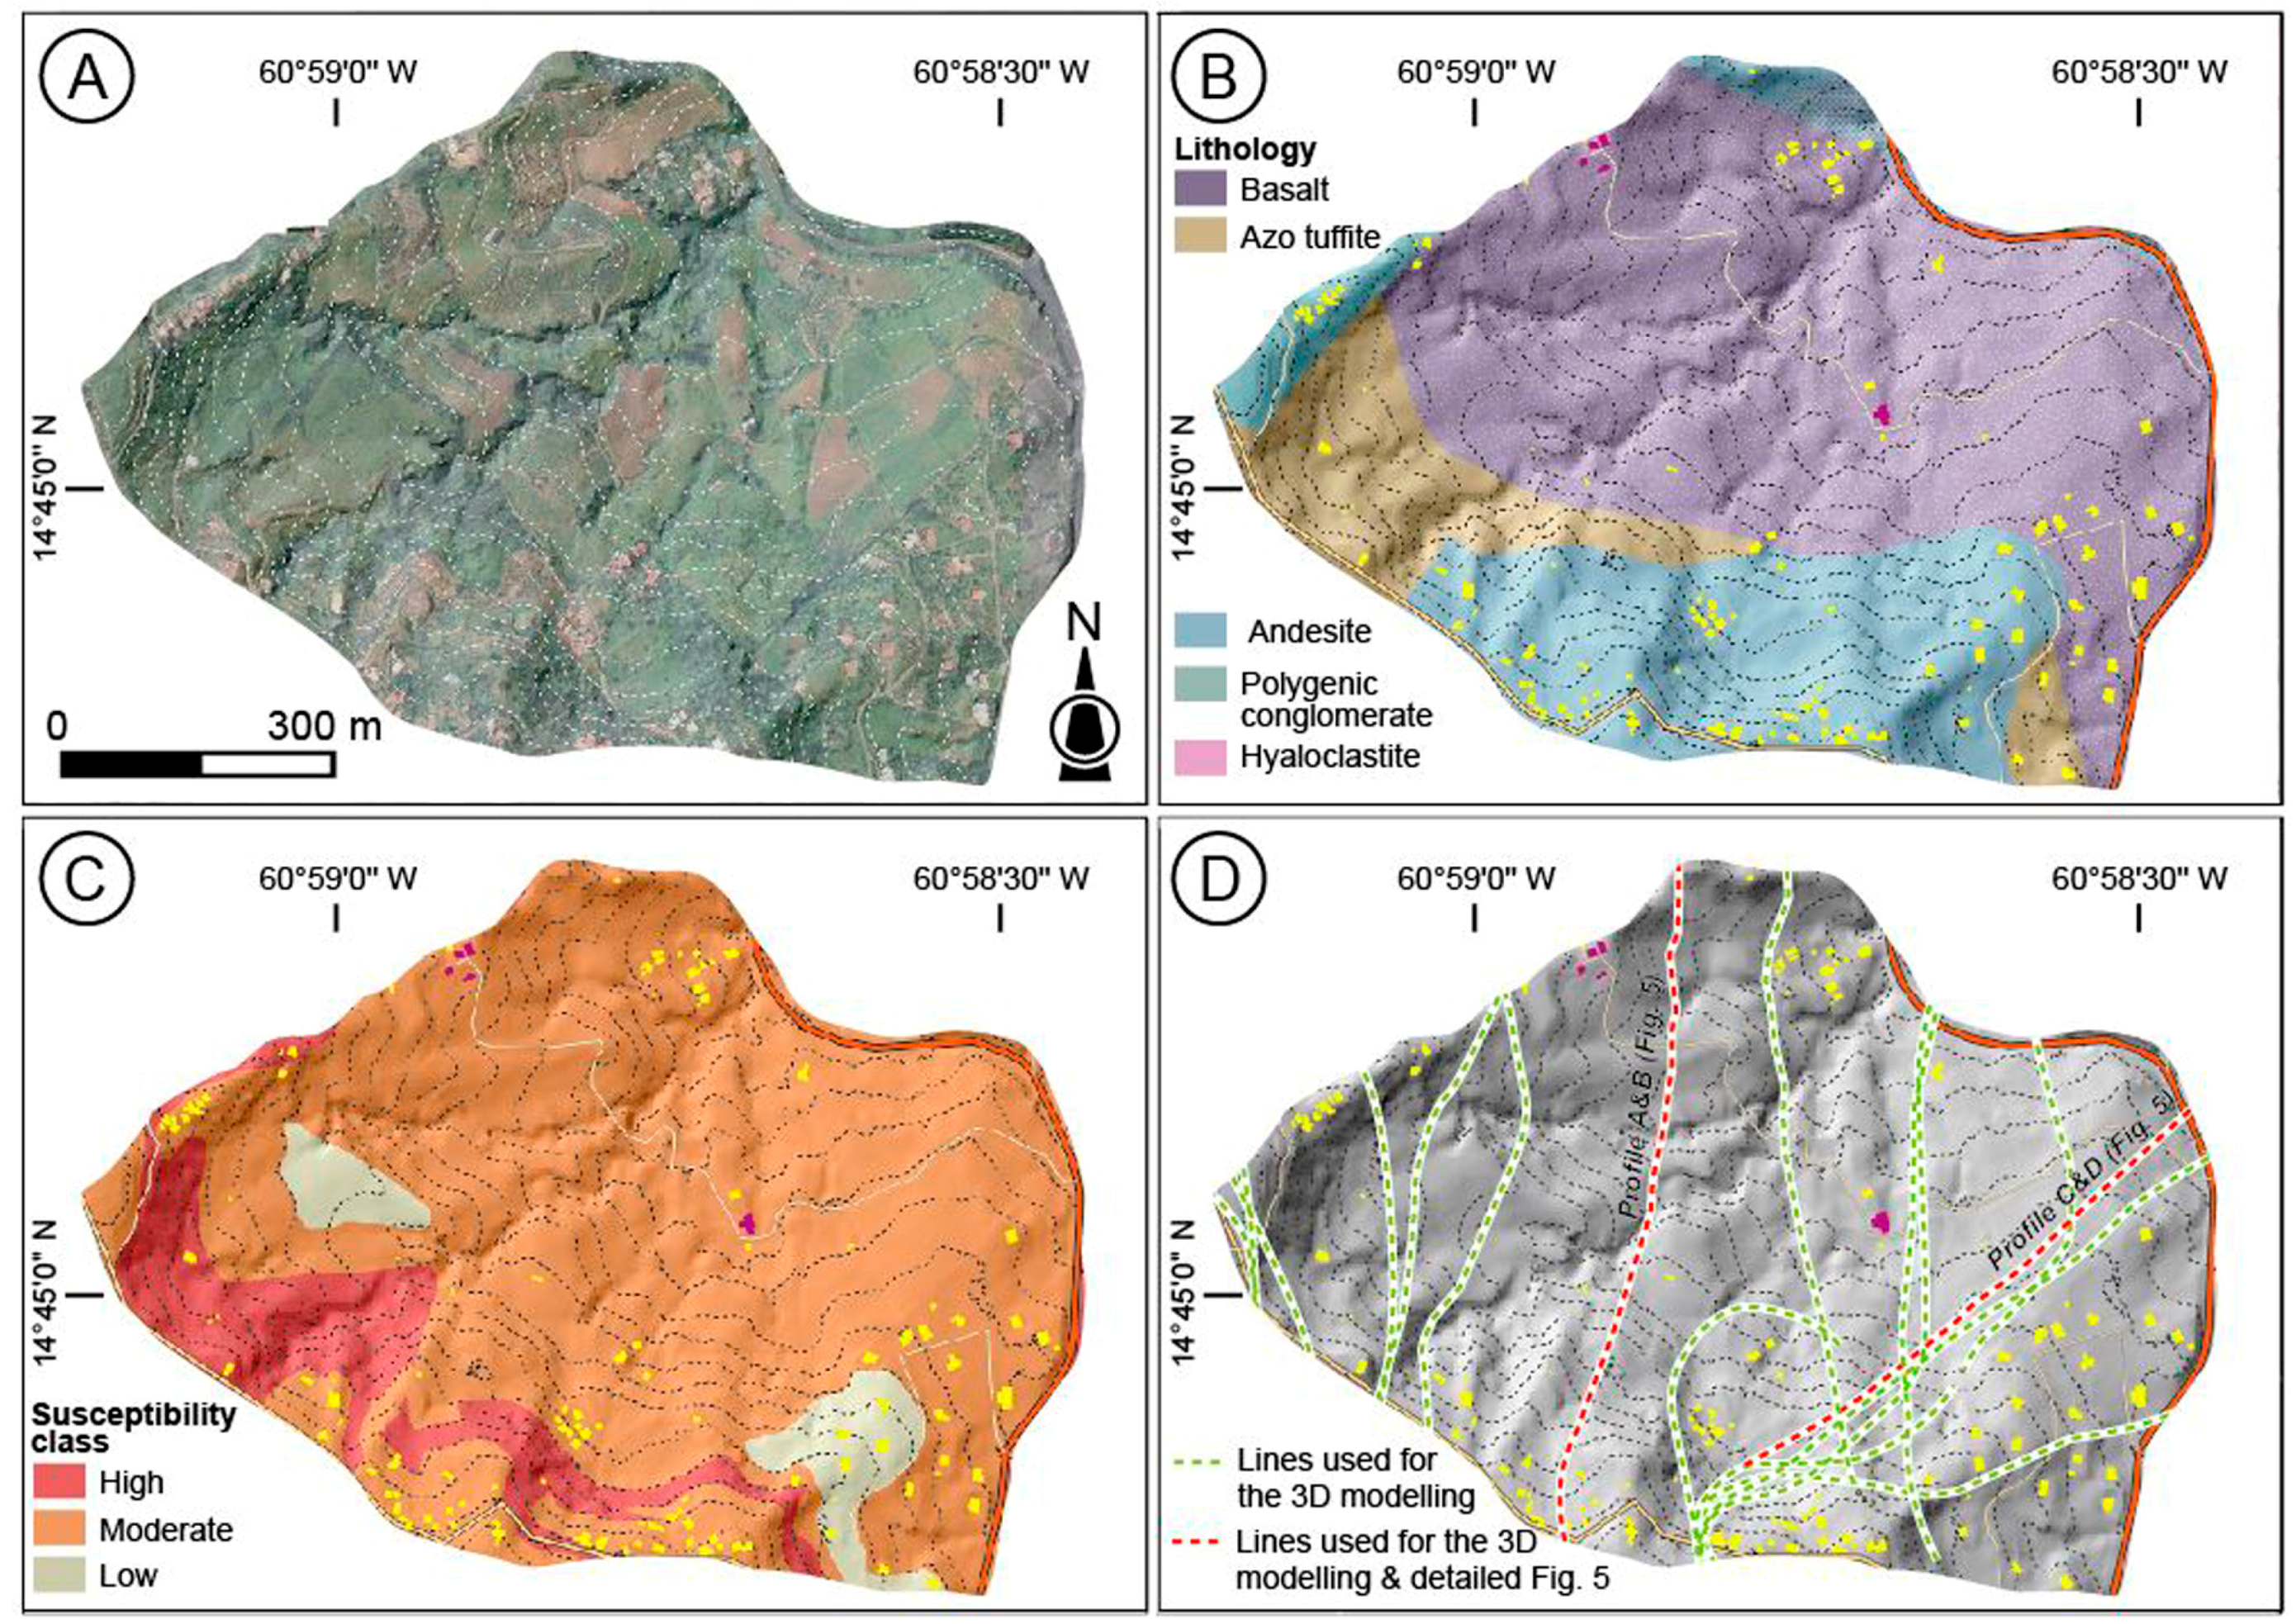
4.2. TDEM Interpretation
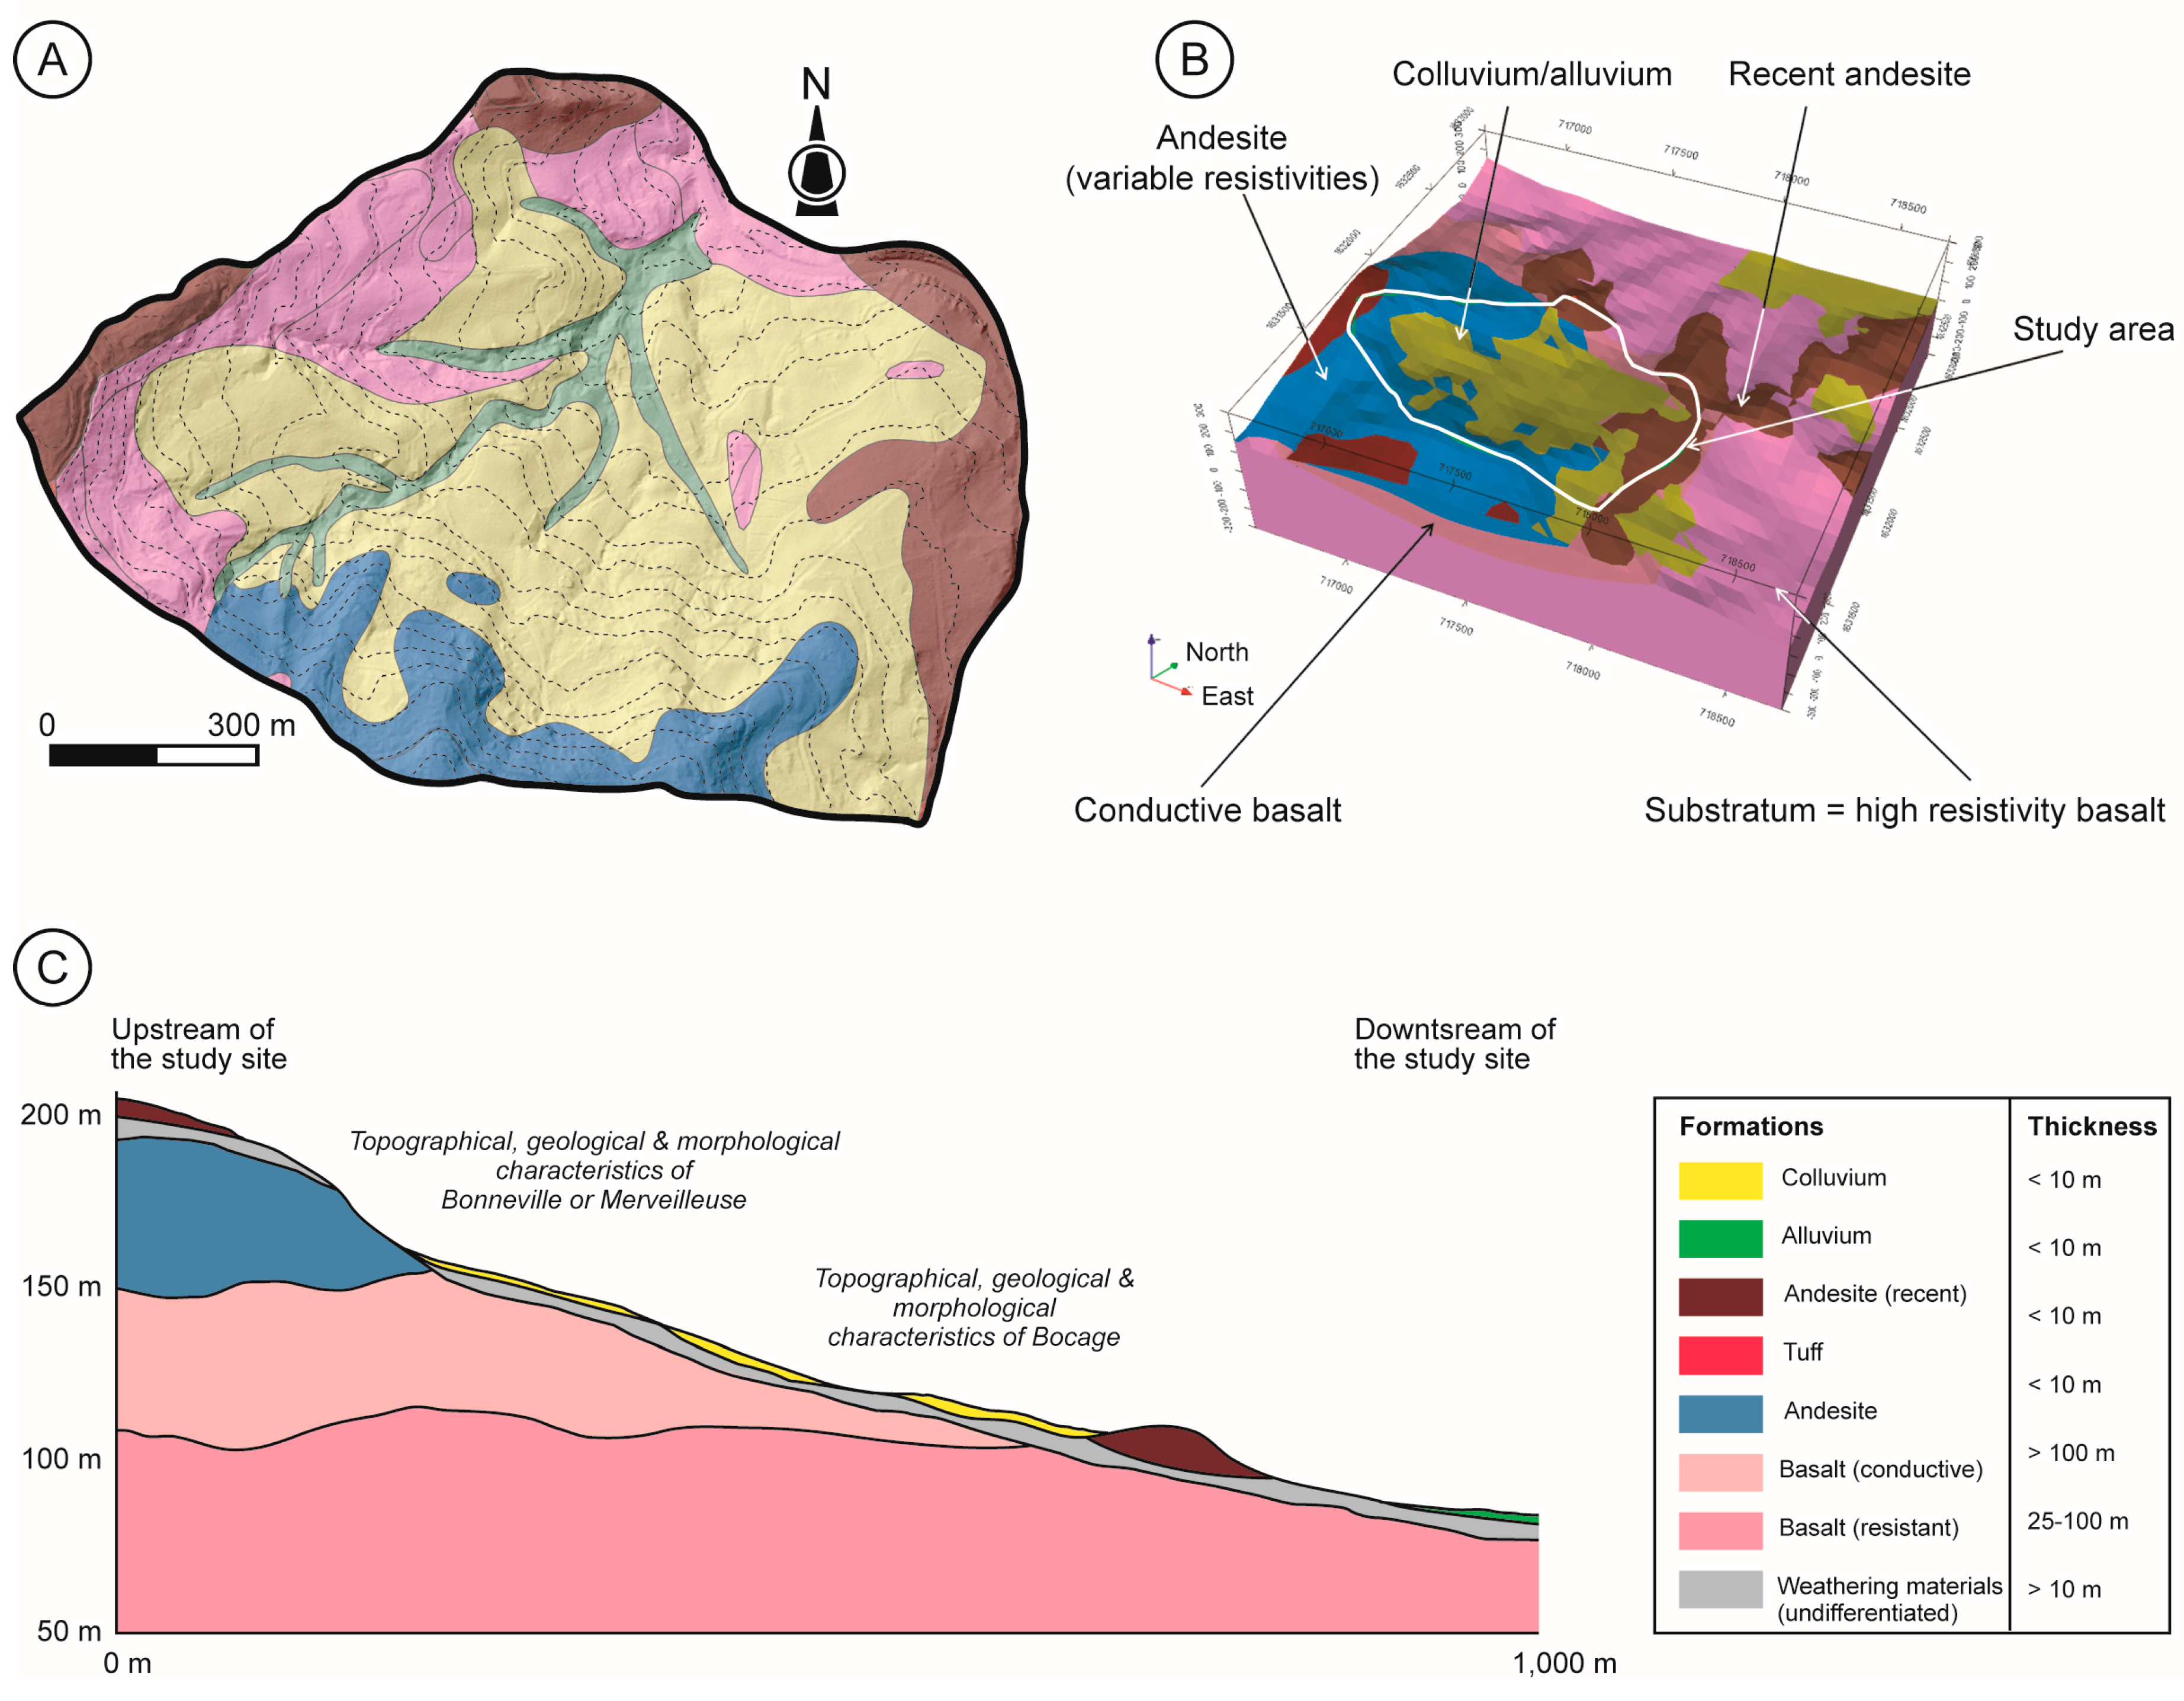
4.3. 3D Geological Model
4.4. Landslide Susceptibility Analysis: Sensitivity Analysis, Scenario, and Spatialization
4.4.1. Analysis of 2D Slope Stability Models
4.4.2. Analysis of Slope Stability and Run-Out Spatialization
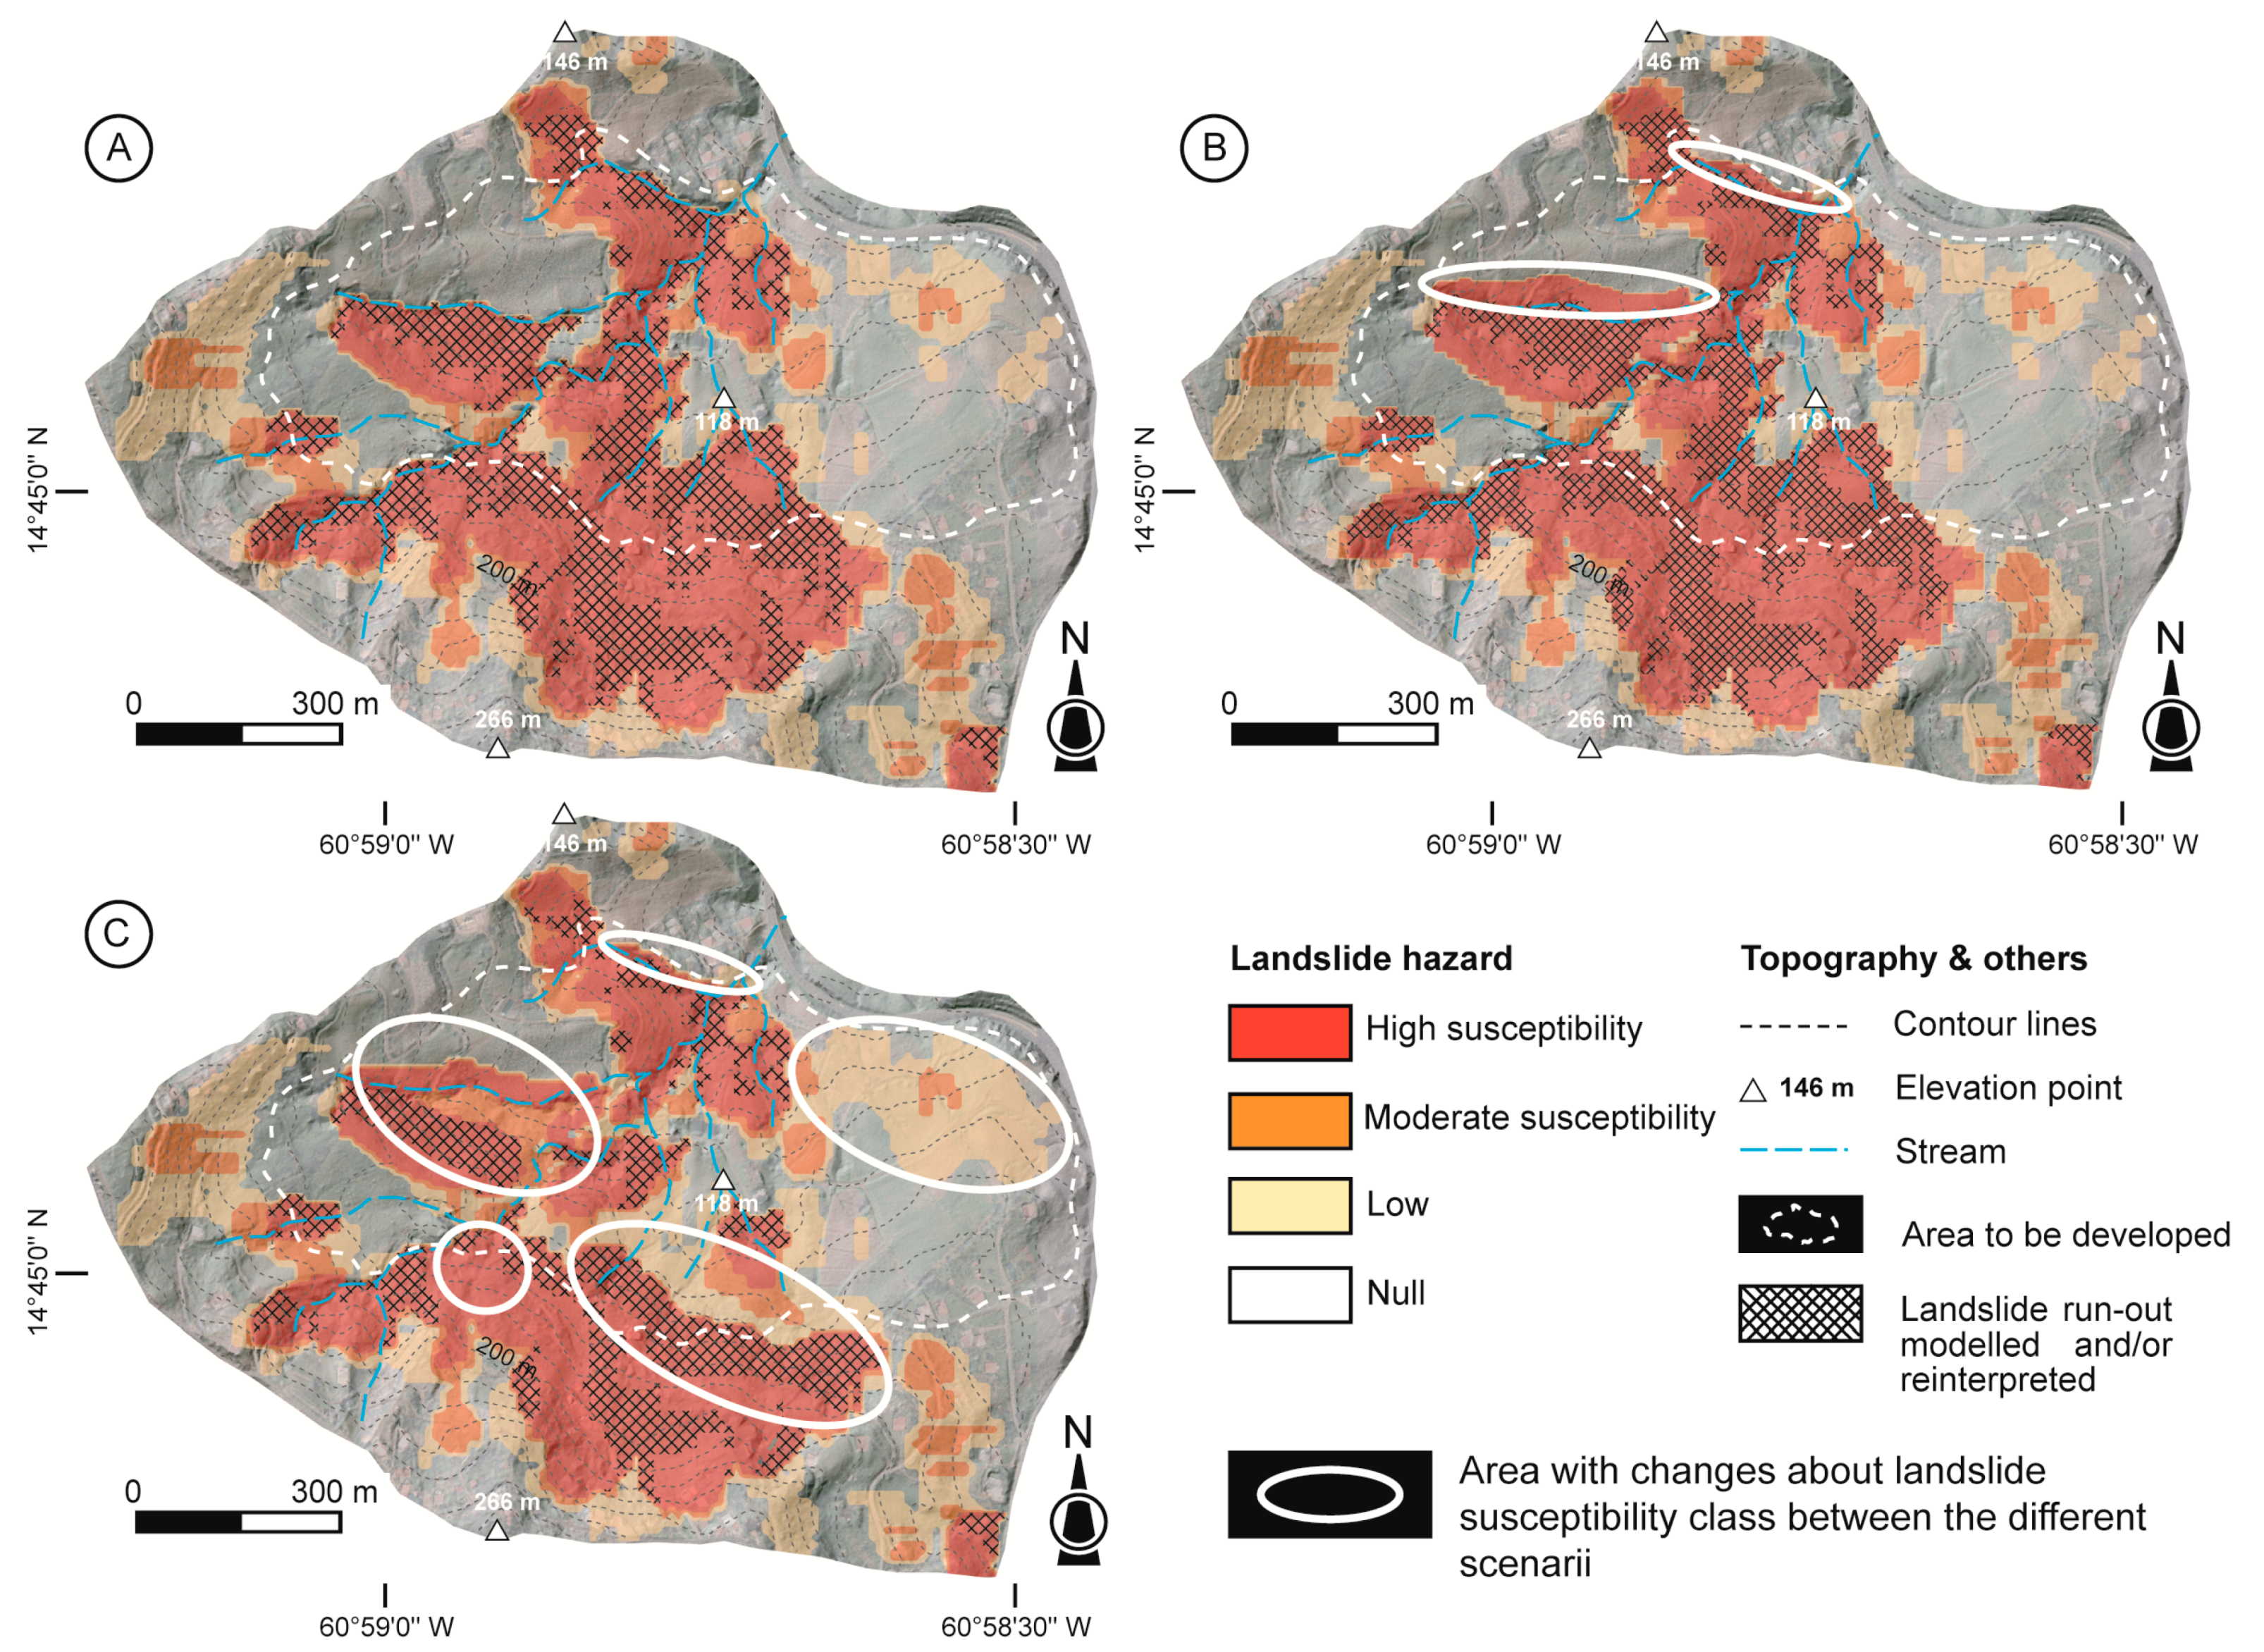
4.4.3. Comparison with LEM
5. Discussion and Recommendations
5.1. TDEM and Its Application
5.2. Models and Hypothesis
- The formation thicknesses were derived from the TDEM analysis and the 3D model obtained by GeoModeller®. Despite efforts to obtain the most accurate data possible, it is necessary to have a minimum of drilling or information to “calibrate” the thicknesses from the analysis of TDEM images. This helps limit the uncertainties related to the local geological context. For this research, the recent results from nearby sites, added to the exhaustive field phase, made it possible to overcome this step.
- The maps obtained by modeling can be considered advanced susceptibility maps because they do not take into account the intensity and the return periods of the events indispensable to assess landslide hazards [11,12,13,14,15]. It is difficult to apply this type of reasoning in this area because only three landslides were inventoried. Therefore, the analysis should be extended to similar environments with an exhaustive inventory in order to obtain the intensity, statistical laws [77,78,79], and return periods of events, thereby improving results.
- The slope stability models used are based on limit equilibrium hypotheses, which consider water in stasic and not dynamically. The use of more complex models (e.g., a model using finite difference equations like FLAC 2D/3D) would allow for taking this parameter into account, but would also require more input data. Generalization and spatialization would be complex to implement. The advantage of the ALICE® approach is to be able to model/map the potential failure areas relatively quickly without having too many data to manage while taking into account triggering factors (i.e., Ground Water Level or Peak Ground acceleration, if necessary). Moreover, the difference in terms of results (i.e., Factor of Safety) will not be significant. Indeed, several tests, including those recently performed by [80,81], show a small difference in terms of results between the two approaches.
- Little information about the relation between the groundwater table (GWL) and precipitations was available. Nevertheless, near-field studies have shown that the cumulative rainfall in the humid season was the main triggering factor and high GWL induced landslides [34,35,36,37,43]. Therefore, the GWL was introduced empirically with the hypothesis of a low GWL or a high GWL, corresponding to field observations. This step requires knowing the GWL role applied on the internal strengths and on the ground destabilization. For future studies, two axes of research about triggering conditions by precipitation could be envisaged with a procedure in two steps: (1) the pose of piezometers and rain gauge to identify on long chronicles the relation GWL; (2) once representative chronicles are acquired, it can be possible to make prospective analyses based on different climatic change scenarios elaborated by the GIEC consortium.
- The run-out models show spatially the maximum area covered by landslide run-out following local parametrization. Results do not take into account the volumes, velocities, and intensities of the materials involved. This analysis cannot be applied as part of impact research on infrastructures. Thus, it is essential to pay close attention to the results, which require more complementary information for impact studies.
- The planning scenarios used to assess the anthropogenic role on ground destabilization are simplistic but have the advantage of showing the possible consequences on slope stability. It is possible to question the consequences of the slope reshaping in the context of deep landslides (Figure 8). In fact, re-profiling slopes can be disastrous and may even become a triggering factor [82]. It is possible to multiply tests in the future for similar environments.
- Lastly, anthropogenic factors are rarely taken into account in slope stability analysis and mapping; as [10,11,15] point out, it is necessary to do so by answering the seven questions in Table 4. This summarizes the questions that can be asked before or during studies relative to slope stability. Table 4 shows that three questions were taken into account in this study. Thus, it might be possible to improve the study—for instance, by considering in our approach the land use change, as in [82,83,84,85,86].
5.3. Recommendations/Indications
6. Conclusions
Acknowledgments
Author Contributions
Conflicts of Interest
References
- ACS-AEC, 2017. Available online: http://www.acs-aec.org/index.php?q=disaster-risk-reduction/natural-hazards-in-the-caribbean-too-costly-to-ignore (accessed on 18 November 2017).
- CHARIM, 2017. Available online: http://www.charim.net (accessed on 18 November 2017).
- Van Westen, C.J.; National Scale Landslide Susceptibility Assessment for Grenada. Caribbean Handbook on Risk Information Management, World Bank GFDRR, ACP-EU Natural Disaster Risk Reduction. 2016. Program. Available online: http://www.charim.net (accessed on 18 November 2017).
- Van Westen, C.J.; National Scale Landslide Susceptibility Assessment for Dominica. Caribbean Handbook on Risk Information Management, World Bank GFDRR, ACP-EU Natural Disaster Risk Reduction. 2016. Program. Available online: http://www.charim.net (accessed on 18 November 2017).
- Van Westen, C.J.; National Scale Landslide Susceptibility Assessment for Saint Vincent and the Grenadines. Caribbean Handbook on Risk Information Management, World Bank GFDRR, ACP-EU Natural Disaster Risk Reduction. 2016. Program. Available online: http://www.charim.net (accessed on 18 November 2017).
- Van Westen, C.J.; National Scale Landslide Susceptibility Assessment for Saint Lucia. Caribbean Handbook on Risk Information Management, World Bank GFDRR, ACP-EU Natural Disaster Risk Reduction. 2016. Program. Available online: http://www.charim.net (accessed on 18 November 2017).
- Van Westen, C.J.; National Scale Landslide Susceptibility Assessment for Belize. Caribbean Handbook on Risk Information Management, World Bank GFDRR, ACP-EU Natural Disaster Risk Reduction. 2016. Program. Available online: http://www.charim.net (accessed on 18 November 2017).
- Momtpelat, J.M. Unités Cartographiques et Évaluation de L’aléa Mouvements de Terrain en Guadeloupe (Antilles Françaises). Ph.D. Thesis, Institut de Physique du Globe de Paris, Paris, France, 1994; 337p. [Google Scholar]
- Durville, J.-L.; Rivière, D. Les Risques de Mouvements de Terrain sur le Site de Morne Callebase à Fort de France (Martinique). Available online: http://cgedd.documentation.developpement-durable.gouv.fr/documents/cgedd/008932-01_rapport.pdf (accessed on 18 November 2017).
- Jaboyedoff, M.; Michoud, C.; Derron, M.; Voumard, J.; Leibundgut, G.; Sudmeier-Rieux, K.; Nadim, F.; Leroi, E. Human Induced landslides: Toward the analysis of anthropogenic changes of the slope environment. In Proceedings of the 12th International Symposium on Landslides and Engineered Slopes. Experience, Theory and Practice, Napoli, Italy, 12–19 June 2016; Aversa, S., Cascini, L., Picarelli, L., Scavia, C., Eds.; CRC Press: Boca Raton, FL, USA, 2016; pp. 217–231. [Google Scholar]
- Fell, R.; Corominas, J.; Bonnard, C.; Cascini, L.; Leroi, E.; Savage, W.Z. Guidelines for landslide susceptibility, hazard and risk zoning for land-use planning. Eng. Geol. 2008, 102, 85–98. [Google Scholar] [CrossRef]
- Leroi, E. Global rockfalls risk management process in ‘La Désirade’ Island (French West Indies). Landslides 2005, 2, 358–365. [Google Scholar] [CrossRef]
- Corominas, J.; van Westen, C.; Frattini, P.; Cascini, L.; Malet, J.-P.; Fotopoulou, S.; Catani, F.; Van Den Eechaut, L.; Mavrouli, O.; Agliardi, F.; et al. Recommendations for the quantitative analysis of landslide risk. Bull. Eng. Geol. Environ. 2014, 73, 209–263. [Google Scholar] [CrossRef] [Green Version]
- Terzaghi, K. Mechanism of Landslides. In Application of Geology to Engineering Practice; Geological Society of America: Boulder, CO, USA, 1950; pp. 83–123. [Google Scholar]
- Van Westen, C.J.; Van Asch, T.W.J.; Soeters, R. Landslide hazard and risk zonation—Why is it still so difficult? Bull. Eng. Geol. Environ. 2006, 65, 167–184. [Google Scholar] [CrossRef]
- Cascini, L. Applicability of landslide susceptibility and hazard zoning at different scales. Eng. Geol. 2008, 102, 164–177. [Google Scholar] [CrossRef]
- Malet, J.-P.; Maquaire, O.; Calais, E. Le GPS en géomorphologie dynamique. Application à la surveillance de mouvements de terrain (super-Sauze, Alpes du Sud, France)/GPS in geomorphological studies. Application to the survey of landslides (super-Sauze, South France). Géomorphologie 2002, 8, 165–179. [Google Scholar] [CrossRef]
- Van Westen, C.J. Geo-information tools for landslide risk assessment: An overview of recent developments. Landslides: Evaluation and Stabilization—Glissement de Terrain: Evaluation et Stabilisation. In Proceedings of the 9th International Symposium on Landslides, Rio de Janeiro, Brazil, 28 June–2 July 2004; pp. 39–56. [Google Scholar]
- Crozier, M.J. Landslide geomorphology: An argument for recognition, with examples from New Zealand. Geomorphology 2010, 120, 3–15. [Google Scholar] [CrossRef]
- Jongmans, D.; Garambois, S. Geophysical investigation of landslides: A review. Bull. Soc. Géol. Fr. 2007, 178, 101–112. [Google Scholar] [CrossRef] [Green Version]
- Travelletti, J.; Malet, J.-P. Characterization of the 3D geometry of flow-like landslides: A methodology based on the integration of heterogeneous multi-source data. Eng. Geol. 2012, 128, 30–48. [Google Scholar] [CrossRef]
- Fressard, M.; Maquaire, O.; Thiery, Y.; Davidson, D.; Lissak, C. Multi-method characterisation of an active landslide: Case study in the Pays d’Auge plateau (Normandy, France). Geomorphology 2016, 270, 22–39. [Google Scholar] [CrossRef]
- Grandjean, G.; Pennetier, C.; Bitri, A.; Meric, O.; Malet, J.-P. Caractérisation de la structure interne et de l’état hydrique de glissements argilo-marneux par tomographie géophysique: L’exemple du glissement-coulée de super-Sauze (Alpes du Sud, France). C. R. Geosci. 2006, 338, 587–595. [Google Scholar] [CrossRef]
- Grandjean, G.; Malet, J.-P.; Bitri, A.; Méric, O. Geophysical data fusion by fuzzy logic for imaging the mechanical behaviour of mudslides. Bull. Soc. Géol. Fr. 2007, 178, 127–136. [Google Scholar] [CrossRef]
- Naudet, V.; Lazzari, M.; Perrone, A.; Loperte, A.; Piscitelli, S.; Lapenna, V. Integrated geophysical and geomorphological approach to investigate the snowmelt-triggered landslide of Bosco piccolo village (Basilicata, southern Italy). Eng. Geol. 2008, 98, 156–167. [Google Scholar] [CrossRef]
- Chambers, J.E.; Wilkinson, P.B.; Kuras, O.; Ford, J.R.; Gunn, D.A.; Meldrum, P.I.; Pennington, C.V.L.; Weller, A.L.; Hobbs, P.R.N.; Ogilvy, R.D. Three-dimensional geophysical anatomy of an active landslide in Lias groupmudrocks, Cleveland Basin, UK. Geomorphology 2011, 125, 472–484. [Google Scholar] [CrossRef] [Green Version]
- Palis, E.; Lebourg, T.; Tric, E.; Malet, J.-P.; Vida, M. Long-term monitoring of a large deep-seated landslide (La Clapiere, South-East French Alps): Initial study. Landslides 2016, 14, 155–170. [Google Scholar] [CrossRef]
- Baroň, I.; Supper, R.; Winkler, E.; Motschka, K.; Ahl, A.; Čarman, M.; Kumelj, Š. Airborne geophysical survey of the catastrophic landslide at Stože, Log pod Mangrtom, as a test of an innovative approach for landslide mapping in steep alpine terrains. Nat. Hazards Earth Syst. Sci. 2013, 13, 2543–2550. [Google Scholar] [CrossRef] [Green Version]
- Siemon, B.; Christiansen, A.V.; Auken, E. A review of helicopter-borne electromagnetic methods for groundwater exploration. Near Surf. Geophys. 2009, 7, 629–646. [Google Scholar] [CrossRef]
- Schamper, C.; Pedersen, J.B.; Auken, E.; Christiansen, A.V.; Vittecoq, B.; Deparis, J.; Jaouen, T.; Lacquement, F.; Nehlig, P.; Perrin, J.; et al. Airborne transient EM methods and their applications for coastal groundwater investigations. In Groundwater in the Coastal Zones of Asia-Pacific; Wetzelhuetter, C., Ed.; Springer Science: Berlin, Germany, 2013. [Google Scholar]
- Supper, R.; Baroň, I.; Ottowitz, D.; Motschka, K.; Gruber, S.; Winkler, E.; Jochum, B.; Römer, A. Airborne geophysical mapping as an innovative methodology for landslide investigation: Evaluation of results from the Gschliefgraben landslide, Austria. Nat. Hazards Earth Syst. Sci. 2013, 1, 2281–2318. [Google Scholar] [CrossRef]
- Vittecoq, B.; Deparis, J.; Violette, S.; Jaouën, T.; Lacquement, F. Influence of successive phases of volcanic construction and erosion on Mayotte Island’s hydrogeological functioning as determined from a helicopter-borne resistivity survey correlated with borehole geological and permeability data. J. Hydrol. 2013, 509, 519–538. [Google Scholar] [CrossRef]
- Vittecoq, B.; Reninger, P.A.; Violette, S.; Martelet, G.; Dewandel, B.; Audru, J.C. Heterogeneity of hydrodynamic properties and groundwater circulation of a coastal andesitic volcanic aquifer controlled by tectonic induced faults and rock fracturing-Martinique island (Lesser Antilles-FWI). J. Hydrol. 2015, 529, 1041–1059. [Google Scholar] [CrossRef]
- Thiery, Y.; Reninger, P.-A.; Nachbaur, A.; Vandromme, R. Exploitation de Levés D’électromagnétisme Héliporté Dans une Perspective de Réévaluation des Cartes d’aléa «Mouvement de Terrain» en Milieu Volcanique Tropical, Rapport Intermédiaire. Available online: http://infoterre.brgm.fr/rapports/RP-65407-FR.pdf (accessed on 18 November 2017).
- Thiery, Y.; Reninger, P.-A.; Nachbaur, A. Exploitation de Levés D’électromagnétisme Héliporté Dans une Perspective de Réévaluation des Cartes D’aléa «Mouvement de Terrain» en Milieu Volcanique Tropical. Rapport Final. Available online: http://infoterre.brgm.fr/rapports/RP-66605-FR.pdf (accessed on 18 November 2017).
- Thiery, Y.; Reninger, P.-A.; Vandromme, R.; Nachbaur, A. Contribution of Heliborne Electro-Magnetic Survey for Landslide Prediction: Application to La Martinique (West Indies, France); EGU: Vienne, Austria, 2017; Volume 19, p. 13970. [Google Scholar]
- Thiery, Y.; Reninger, P.-A.; Vandromme, R.; Nachbaur, A. Contribution of Heliborne Electro-Magnetic Survey for Landslide Recognition and Modelling: Application to La Martinique (West Indies, France). In Proceedings of the 25ème Réunion des Sciences de la Terre (RST 2016), Caen, France, 24–28 October 2016; Available online: https://rst2016-caen.sciencesconf.org (accessed on 18 November 2017).
- Germa, A.; Quidelleur, X.; Labanieh, S.; Chauvel, C.; Lahitte, P. The volcanic evolution of Martinique Island: Insights from K-Ar dating into Antilles arc migration since the Oligocene. J. Volcanol. Geotherm. Res. 2008, 208, 122–135. [Google Scholar] [CrossRef]
- Barras, A.-V.; Vanoudheusden, L.; Le Moigne, B.; Bayle, E. Intempéries du 5 mai 2009 en Martinique et Mouvements de Terrain Associés: Interventions en Situation de Crise, Inventaire Post-Crise et Retour D’expérience. Available online: http://infoterre.brgm.fr/rapports/RP-58851-FR.pdf (accessed on 18 November 2017).
- Varnes, D.J. Slope movement types and processes. In Landslides: Analysis and Control; Special Report 176, Transportation Research Board; Schuster, R.L., Krizek, R.J., Eds.; National Research Council: Washington, DC, USA, 1978; pp. 11–33. [Google Scholar]
- Corominas, J. Debris slide. In Landslide Recognition—Identification, Movement and Causes; Dikau, R., Brunsden, D., Schrott, L., Ibsen, M.-L., Eds.; Wiley: Chichester, UK, 1996; pp. 97–102. [Google Scholar]
- Cruden, D.M.; Varnes, D.J. Landslide Types and Processes Landslides: Investigation and Mitigation; Special Report No. 247, Transportation Research Board; Turner, A.K., Shuster, R.L., Eds.; National Research Council: Washington, DC, USA, 1996; pp. 36–75. [Google Scholar]
- Allard, J.F. RN1 Carrefour Nord de Trinité—Glissement du Morne Figue—Trinité—Martinique, Etude Géotechnique. Available online: http://infoterre.brgm.fr/rapports/89-MTQ-082.pdf (accessed on 18 November 2017).
- Buma, J.; van Asch, T. Slide (rotational). In Landslide Recognition—Identification, Movement and Causes; Dikau, R., Brunsden, D., Schrott, L., Ibsen, M.-L., Eds.; Wiley: Chichester, UK, 1996; pp. 43–61. [Google Scholar]
- Mompelat, J.-M.; Audru, J.-C.; Terrier, M.; Bertil, D. Prévention du Risque Sismique aux Antilles Françaises. Geosciences 2011, 14, 68–75. [Google Scholar]
- Westercamp, D.; Andreieff, P.; Bouysse, P.; Cottez, S.; Battistini, R. Notice Explicative de la Carte Géologique à 1: 50 000ème de la Martinique; BRGM: Orleans, France, 1989; 286p. [Google Scholar]
- Dearman, W.R.; Shibakova, V.S. The tropical environment. In Engineering Geology of the Earth; Dearman, W.R., Sergueev, E.M., Shibakova, V.S., Eds.; Nauka Publishers: Moscow, Russia, 1989; pp. 128–141. [Google Scholar]
- Ollier, C.-D.; Calcaterra, D.; Parise, M. Studies in weathering and slope movements-an introduction. Geomorphology 2007, 87, 101–103. [Google Scholar] [CrossRef]
- Ollier, C.-D. Very dep weathering and related landslides. In Weathering as a Predisposing Factor to Slope Movements; Calcaterra, D., Parise, M., Eds.; Engineering Geology Special Publications: London, UK, 2010; Volume 23, pp. 5–14. [Google Scholar] [CrossRef]
- Sørensen, K.I.; Auken, E. SkyTEM: A new high-resolution helicopter transient electromagnetic system. Explor. Geophys. 2004, 35, 191–199. [Google Scholar]
- Spies, B.R. Depth of investigation in electromagnetic sounding methods. Geophysics 1989, 54, 872–888. [Google Scholar] [CrossRef]
- Ward, S.H.; Hohmann, G.W. Electromagnetic theory for geophysical applications. In Electromagnetic Methods in Applied Geophysics; Nabighian, M.N., Ed.; Society of Exploration Geophysicists: Tulsa, OK, USA, 1988; Volume 1, pp. 131–311. [Google Scholar]
- Viezzoli, A.; Christiansen, A.V.; Auken, E.; Sørensen, K. Quasi-3D modeling of airborne TEM data by spatially constrained inversion. Geophysics 2008, 73, 105–113. [Google Scholar] [CrossRef]
- Christiansen, A.V.; Auken, E. A global measure for depth of investigation. Geophysics 2012, 77, WB171–WB177. [Google Scholar] [CrossRef]
- Calcagno, P.; Chilès, J.P.; Courrioux, G.; Guillen, A. Geological modelling from field data and geological knowledge: Part I. Modelling method coupling 3D potential-field interpolation and geological rules. Phys. Earth Planet. Inter. 2008, 171, 147–157. [Google Scholar] [CrossRef]
- Martelet, G.; Calcagno, P.; Gumiaux, C.; Truffert, C.; Bitri, A.; Gapais, D.; Brun, J.P. Integrated 3D geophysical and geological modelling of the Hercynian Suture Zone in the Champtoceaux area (South Brittany, France). Tectonophysics 2004, 382, 117–128. [Google Scholar] [CrossRef]
- Glade, T.; Crozier, M.J. A review of scale dependency in landslide hazard and risk analysis. In Landslide Hazard and Risk; Glade, T., Anderson, M., Crozier, M.J., Eds.; Wiley: Chichester, UK, 2005; pp. 75–138. [Google Scholar]
- Guzzetti, F.; Carrara, A.; Cardinali, M.; Reichenbach, P. Landslide hazard evaluation: A review of current techniques and their application in a multi-scale study, central Italy. Geomorphology 1999, 31, 181–216. [Google Scholar] [CrossRef]
- Guzetti, F.; Reichenbach, P.; Ardizzone, F.; Cardinali, M.; Galli, M. Estimating the quality of landslide susceptibility models. Geomorphology 2006, 81, 166–184. [Google Scholar] [CrossRef]
- Remondo, J.; Gonzàlez-Diez, A.; Dìaz de Teràn, J.R.; Cendrero, A. Landslides susceptibility models utilising spatial data analysis techniques. A case study from the lower Deba Valley, Guipùzcoa (Spain). Nat. Hazards 2003, 30, 267–279. [Google Scholar] [CrossRef]
- Thiery, Y.; Malet, J.-P.; Sterlacchini, S.; Puissant, A.; Maquaire, O. Landslide susceptibility assessment by bivariate methods at large scales: Application to a complex mountainous environment. Geomorphology 2007, 92, 38–59. [Google Scholar] [CrossRef] [Green Version]
- Brabb, E.E. Innovative approaches to landslide hazard mapping. In Proceedings of the Fourth International Symposium on Landslides, Toronto, ON, Canada, 10–15 July 1984; pp. 307–324. [Google Scholar]
- Soeters, R.; Van Westen, C.J. Slope instability, recognition, analysis, and zonation. In Landslides Investigation and Mitigation; Transportation Research Board, Special Report 247; Turner, A.K., Schuster, R.L., Eds.; National Research Council: Washington, DC, USA, 1996; pp. 129–177. [Google Scholar]
- Duncan, J.-M. Soil slope stability analysis. In Landslides: Investigation and Mitigation; Transportation Research Board, Special Report 247; Turner, A-K., Schuster, R-L., Eds.; National Academy Press: Washington, DC, USA, 1996; pp. 337–371. [Google Scholar]
- Vandromme, R.; Desramaut, N.; Garnier, C.; Bernardie, S. A Novel Approach to Integrate Effects of Vegetation Changes on Slope Stability. In Engineering Geology for Society and Territory—Volume 2; Lollino, G., Giordan, D., Crosta, G.B., Corominas, J., Azzam, R., Wasowski, J., Sciarra, N., Eds.; Springer: Cham, Switzerland, 2014; p. 47. [Google Scholar]
- Thiery, Y.; Vandromme, R.; Maquaire, O.; Bernardie, S. Landslide susceptibility assessment by EPBM (Expert physically based model): Strategy of calibration in complex environment. In Advancing Culture of Living with Landslides, Volume 2 Advances in Landslide Science, Proceedings of the 4th World Landslide Forum, Ljubljana, Slovenia, 29 May–2 June 2017; Mikoš, M., Tiwari, B., Yin, Y., Sassa, K., Eds.; Springer: Berlin, Germany, 2017; pp. 917–926. [Google Scholar]
- Sedan, O.; Mirgon, C.; Bes de Berc, S. Cartographie de l’aléa Mouvement de Terrain—Prise en Compte de la Propagation-Programme BORA—Technical Report. BRGM/RP-54650-FR. 2006. Available online: http://infoterre.brgm.fr/rapports/RP-54650-FR.pdf (accessed on 18 November 2017).
- Morgenstern, N.R.; Price, V. The analysis of the stability of general slip surfaces. Geotechnique 1965, 15, 79–93. [Google Scholar] [CrossRef]
- Zhu, D.Y.; Lee, C.F.; Qian, Q.H.; Chen, G.R. A concise algorithm for computing the factor of safety using the Morgenstern–Price method. Can. Geotech. J. 2005, 42, 272–278. [Google Scholar] [CrossRef]
- IGN; SHOM (Eds.) IGN-Litto3D® Version 1.0. Descriptif Technique. 2015. Available online: http://professionnels.ign.fr/doc/DC_Litto3D.pdf (accessed on 18 November 2017).
- MATE/MATL. Plan de Prévention des Risques (PPR): Risques de Mouvements de Terrain; La Documentation Française; Ministère de l’Aménagement du Territoire et de l’Environnement (MATE), Ministère de l’Equipement des Transports et du Logement (METL): Paris, France, 1999; 74p. [Google Scholar]
- Leroi, E. Landslide hazard—Risk maps at different scales: Objectives, tools and development. In Proceedings of the ISL’96, 7th International Symposium on Landslides, Trondheim, Norway, 17–21 June 1996. [Google Scholar]
- Audru, J.-C.; Nachbaur, A.; Colas, B.; Rinaudo, J.-D.; Le Roy, M.; Barnerias, I. Les mouvements de terrain en Martinique (Antilles françaises): Risques, aide à la décision et politique de gestion. In Proceedings of the 8éme Colloque sur Les Risques Naturels au Québec, Conférences ACFAS, Université Laval, Quebec City, QC, Canada, 20–24 May 2008. [Google Scholar]
- NF EN 1991-1-1. Eurocode 1-Actions sur les Structures-Partie 1-1: Actions Générales-Poids Volumiques, Poids Propres, Charges D’exploitation des Bâtiments. 2003. Available online: http://freeit.free.fr/eurocodes/EC1%201.1%20FA102763.PDF (accessed on 18 November 2017).
- Reninger, P.A.; Martelet, G.; Perrin, J. Frame effective tilt correction for HEM data acquired over rugged terrain. In Proceedings of the First European Airborne Electromagnetics Conference, Turin, Italy, 6–10 September 2015. [Google Scholar]
- Reninger, P.-A.; Martelet, G.; Deparis, J.; Perrin, J.; Chen, Y. Singular value decomposition as a denoising tool for airborne time domain electromagnetic data. J. Appl. Geophys. 2001, 75, 264–276. [Google Scholar] [CrossRef] [Green Version]
- Guzzetti, F.; Reichenbach, P.; Ardizzone, F.; Cardinalli, M.; Galli, M. Estimating the quality of landslide susceptibility models. Geomorphology 2006, 81, 166–184. [Google Scholar] [CrossRef]
- Godt, J.W.; Baum, R.L.; Chleborad, A.F. Rainfall characteristics for shallow landsliding in Seattle, Washington, USA. Earth Surf. Process. Landf. 2006, 31, 97–110. [Google Scholar] [CrossRef]
- Guzzetti, F.; Peruccacci, S.; Rossi, M.; Stark, C.P. The rainfall intensity-duration control of shallow landslides and debris flows: An update. Landslides 2008, 5, 3–17. [Google Scholar] [CrossRef]
- Matthews, C.; Farook, Z.; Helm, P.-R. Slope stability analysis—Limit equilibrium or the finite element method? Ground Eng. 2014, 48, 22–28. [Google Scholar]
- Liu, S-Y.; Shao, L-T.; Li, H-J. Slope stability analysis using the limit equilibrium method and two finite element methods. Comput. Geotech. 2015, 63, 291–298. [Google Scholar] [CrossRef]
- Jaboyedoff, M.; Oppikofer, T.; Locat, A.; Locat, J.; Turmel, D.; Robitaille, D.; Demers, D.; Locat, P. Use of ground-based Lidar for the analysis of retrogressive land-slides in sensitive clay and of rotational landslides in river banks. Can. Geotech. J. 2009, 46, 1–12. [Google Scholar] [CrossRef]
- Reichenbach, P.; Busca, C.; Mondini, A.C.; Rossi, M. The Influence of Land Use Change on Landslide Susceptibility Zonation: The Briga Catchment Test Site (Messina, Italy). Environ. Manag. 2014, 54, 1372–1384. [Google Scholar] [CrossRef] [PubMed]
- Van Beek, L.P.H.; Van Asch, T. Regional assessment of the effects of land-use change on landslide hazard by means of physically based modelling. Nat. Hazards 2004, 31, 289–304. [Google Scholar] [CrossRef]
- Meusburger, K.; Alewell, C. Impacts of anthropogenic and environmental factors on the occurrence of shallow landslides in an alpine catchment (Urseren Valley, Switzerland). Nat. Hazards Earth Syst. Sci. 2008, 8, 509–520. [Google Scholar] [CrossRef] [Green Version]
- Giordan, D.; Cignetti, M.; Baldo, M.; Godone, D. Relationship between man-made environment and slope stability: The case of 2014 rainfall events in the terraced landscape of the Liguria region (Northwestern Italy). Geomat. Nat. Hazards Risks 2017, 8, 1833–1852. [Google Scholar] [CrossRef]
- Swiss Environmental Federal Office. Recommendation—Aménagement du Territoire et Dangers Naturels. Office Fédéral du Développement Territorial, Office Fédéral des Eaux et de la Géologie, Office Fédéral de L’environnement, des Forêts et du Paysage, Eds.; 2005; 50p. Available online: https://www.vd.ch/fileadmin/user_upload/themes/territoire/dangers_naturels/fichiers_pdf/recommandation_AT-DN.pdf.pdf (accessed on 18 November 2017).
- Donnelly, L.J. Landslides associated with the Soufrière Hills Volcano, Montserrat, West Indies. In Landslides and Climate Change—Challenge and Solutions; Mc Innes, R., Jakeways, J., Fairbanks, H., Mathie, E., Eds.; Taylor and Francis Group: London, UK, 2007; pp. 311–320. [Google Scholar]
- Crozier, M.J. Deciphering the effect of climate change on landslide activity: A review. Geomorphology 2010, 124, 260–267. [Google Scholar] [CrossRef]
- Gariano, S.L.; Guzzetti, F. Landslides in a changing climate. Earth-Sci. Rev. 2016, 162, 227–252. [Google Scholar] [CrossRef]


| Susceptibility Class | Regulation |
|---|---|
| S5: Very high susceptibility | Environmental conditions are very favorable to slope instability. High possibility of landslide occurrences for the next 100 years. Future human and socioeconomic developments are forbidden. Expropriation process is possible. |
| S4: High susceptibility | Environmental conditions are very favorable to slope instability. High possibility of landslide occurrences for the next one hundred years. Future human and socio-economic developments are forbidden except as specified in the legal regulation document. Expropriation process is possible. |
| S3: Moderate susceptibility | Environmental conditions are moderately favorable to slope instability. Moderate possibilities of landslide occurrences for the next 100 years. Prescriptions are necessary and global development studies are required. In general, mitigation works are essential for future human and socioeconomic developments of the area. |
| S2: Low susceptibility | Environmental conditions are lowly favorable to slope instability. Low possibility of landslide occurrence for the next 100 years. Future human and socioeconomic developments of the area are possible and can be determined with specific attention to each specific case. |
| S1: Null susceptibility | Environmental conditions are not favorable to slope instability. No possibility of landslide developments for the next 100 years. Future human and socioeconomic developments of the area are possible and cannot be subject to specific attention. |
| Description of Material | Thickness | Resistivity Boundaries | Age Formation Estimated 1,2 |
|---|---|---|---|
| Alluviums or colluviums | Lower than 10 m | From a few Ωm to 20 Ωm | Quaternary/Present |
| Recent andesite with relatively high resistivity | Lower than 10 m | More than 20 Ωm | 2.1 Ma–1.5 Ma |
| Tuffs | Lower than 10 m | More than 20 Ωm | 2.1 Ma–1.5 Ma |
| Andesite (probably weathered at the top and compact at the bottom) | More than 50 m | From 8 to 20 Ωm for the upper part; from 10 to 35 Ωm for the bottom part | 5.5 Ma–2.2 Ma |
| Conductive basalt | From 25 m to 100 m | Lower than 10 Ωm | 16.8 Ma–8.48 Ma |
| Resistant basalt | Model basis | Higher than 20 Ωm | 16.8 Ma–8.48 Ma |
| Formations | Cohesion (c’ in kPa) | Angle of Friction (ϕ’ in °) | Specific Bulk Unit Weight (γd in kN·m−3) |
|---|---|---|---|
| Colluviums | 8 | 15 | 15 |
| Weathered materials | 12 | 18 | 18 |
| Andesite | 40 | 35 | 20 |
| Basalts | 50 | 38 | 25 |
| Questions to Consider about Slope Stability in Relation with Human Activities for Future Development 3 | Answers from this Study and Possible Improvements |
|---|---|
| Did the slope modifications affect its stability? | Considered |
| Do the changes affect the groundwater circulation? | More or less considered, can be improved by use of more complex models |
| Do the changes affect the surface water amount and flow path? | Not considered |
| Do the present or future land use changes and their potential degradation modify any process affecting slope stability? | Not considered, should be considered in the future by integration of climatic change and elaboration of scenarios in concertation with municipality |
| Are the artificial structures taking into account the full environment of the slope? | Not considered because the area to develop is in cropland |
| Do the works or traffic create explosions or vibrations that can affect stability? | Not considered but can be considered because national road RN1 is located near the area |
| How will the ageing of infrastructure and works affect future slope stability? | Not considered because the area to develop is in cropland |
| Factor of Safety Computed | Run-Out Computed | Class of Susceptibility | Rules for Development | Rules in Case of Existing Development |
|---|---|---|---|---|
| FoS ≤ 1 | Yes | High | No new planning and development | Prohibition of extension |
| Regular monitoring and observations of buildings and infrastructures | ||||
| Mandatory implementation of protective measures | ||||
| Eviction of people if necessary (after careful monitoring and observations) | ||||
| Regular information to people is indispensable | ||||
| 1 < FoS ≤ 1.2 | No | Moderate | Discussion and cost/benefit studies are required to choose alternative solution. | Extension authorized under conditions if no other solution is possible |
| Protective measures must be discussed | ||||
| Technical measures for sensible buildings or infrastructures must be discussed | ||||
| Development possible under conditions and obtaining new information (e.g., after geotechnical studies, drainage, slope reshaping, etc.) | Regular information updates to the people involved are indispensable | |||
| Necessary requirements with consideration of protective measures. | ||||
| Sensible buildings and infrastructures are forbidden in this area. | ||||
| 1.2 < FoS ≤ 1.5 | No | Low | Sensible buildings and infrastructure are not welcome in this area; possibility to develop this type of infrastructure after cost/benefit study. | Technical measures for sensible buildings or infrastructure must be discussed |
| New development with recommendations after cost/benefit study. | Punctual information to people is possible | |||
| FoS > 1.5 | No | Null | No requirements necessary | No requirements necessary |
© 2017 by the authors. Licensee MDPI, Basel, Switzerland. This article is an open access article distributed under the terms and conditions of the Creative Commons Attribution (CC BY) license (http://creativecommons.org/licenses/by/4.0/).
Share and Cite
Thiery, Y.; Reninger, P.-A.; Lacquement, F.; Raingeard, A.; Lombard, M.; Nachbaur, A. Analysis of Slope Sensitivity to Landslides by a Transdisciplinary Approach in the Framework of Future Development: The Case of La Trinité in Martinique (French West Indies). Geosciences 2017, 7, 135. https://doi.org/10.3390/geosciences7040135
Thiery Y, Reninger P-A, Lacquement F, Raingeard A, Lombard M, Nachbaur A. Analysis of Slope Sensitivity to Landslides by a Transdisciplinary Approach in the Framework of Future Development: The Case of La Trinité in Martinique (French West Indies). Geosciences. 2017; 7(4):135. https://doi.org/10.3390/geosciences7040135
Chicago/Turabian StyleThiery, Yannick, Pierre-Alexandre Reninger, Frederic Lacquement, Anne Raingeard, Maeva Lombard, and Aude Nachbaur. 2017. "Analysis of Slope Sensitivity to Landslides by a Transdisciplinary Approach in the Framework of Future Development: The Case of La Trinité in Martinique (French West Indies)" Geosciences 7, no. 4: 135. https://doi.org/10.3390/geosciences7040135