Using Open Access Satellite Data Alongside Ground Based Remote Sensing: An Assessment, with Case Studies from Egypt’s Delta

1
Department of Anthropology, The University of Alabama at Birmingham, Birmingham, AL 35294, USA
2
Globalxplorer, Birmingham, AL 35203, USA
*
Author to whom correspondence should be addressed.
Geosciences 2017, 7(4), 94; https://doi.org/10.3390/geosciences7040094
Submission received: 31 July 2017
/
Revised: 18 September 2017
/
Accepted: 18 September 2017
/
Published: 27 September 2017
(This article belongs to the Special Issue Remote Sensing and Geosciences for Archaeology)
Abstract
:This paper will assess the most recently available open access high-resolution optical satellite data (0.3 m–0.6 m) and its detection of buried ancient features versus ground based remote sensing tools. It also discusses the importance of CORONA satellite data to evaluate landscape changes over the past 50 years surrounding sites. The study concentrates on Egypt’s Nile Delta, which is threatened by rising sea and water tables and urbanization. Many ancient coastal sites will be lost in the next few decades, thus this paper emphasizes the need to map them before they disappear. It shows that high resolution satellites can sometimes provide the same general picture on ancient sites in the Egyptian Nile Delta as ground based remote sensing, with relatively sandier sedimentary and degrading tell environments, during periods of rainfall, and higher groundwater conditions. Research results also suggest potential solutions for rapid mapping of threatened Delta sites, and urge a collaborative global effort to maps them before they disappear.
Keywords:
Worldview-3; Worldview-2; CORONA; magnetometer; ground penetrating radar; Nile Delta; Egypt1. Introduction
Landscapes across the Middle East have presented many opportunities for testing a broad range of remote sensing, from ground to space-based imagery, over the past 95 years. Thanks to the first aerial photographs taken of Stonehenge by balloon in 1906, followed by reconnaissance pilots such as Father Antoine Poidebard in Syria during the 1920s, the entire field of aerial archaeology was born. Now, there is great urgency to map the rapidly disappearing landscapes of the Middle East and North Africa (MENA) region. With climate change, rising sea levels, urbanization, looting, and site destruction from civil war, for many sites, remotely sensed data is the main evidence we now have for their existence. Many RAF photos are available for Egypt from the 1930s, which are invaluable today in relation to intensive landscape changes following the construction of the Aswan High Dam. CORONA high resolution space photography from the late 1960s to early 1970s is the best data for archaeologists to examine prior to major urbanization and population growth with many discoveries at and around sites emerging from these datasets [1,2,3]. While archaeologists have used satellite images since the early 1980s, this technology saw limited use in the Middle East until the late 1990s to early 2000s [4,5] Since then, archaeologists working in the MENA region have applied diverse datasets to a myriad of issues, including regional site detection [6,7] and looting [8,9,10,11,12].
This paper shows how CORONA imagery and high-resolution satellite sensors can reveal subsurface features on sites in the Egyptian Nile Delta. It focuses on primarily visual detection methods across broad areas, where the prohibitive cost of multi-year and multi-sensor data make open sources tools like Google Earth essential. Sensors that capture images at the optimum time can reveal the layout of an entire subsurface ancient town, but the window for this data capture is narrow and can vary from year to year. This paper also shows how CORONA data helped an archaeological team to locate the enclosure wall of an ancient temple at the site of Tell Tebilla (northeast Nile Delta), where a magnetometer survey produced tomb and residential-level outlines, but it was not done at a sufficient scale and coverage to capture the presence or dimensions of the wall. Satellite data can now provide the same general picture as ground-based remote sensing tools, while the finer detail is generally missing unless 0.3 m data is available. The quality of satellite data for revealing buried features in Egypt’s Nile Delta is dependent on the season, type of soil matrix at a given site (it must contain higher amounts of sand), and groundwater levels in the surrounding fields. This paper discusses the advantages and disadvantages of both satellite and ground-based remote sensing systems. Ideally, they will be used together, but this is not always possible.
2. Materials and Methods
The following section describes how both CORONA and high-resolution satellite imagery helped to map features on sites in Egypt’s Nile Delta.
2.1. CORONA Imagery in Egypt
CORONA high-resolution satellite imagery is valuable to archaeologists, due to its high resolution, low cost, broad accessibility and its value in recording landscapes now built over or destroyed, especially in the Middle East. Declassified in 1995 by President Bill Clinton, the U.S. government released 860,000 images (taken between 1960 and 1972) to the public at the cost of reproduction only. The declassified intelligence imagery, code-named CORONA, ARGON and LANYARD, has helped to locate patterns in landscapes that have been changed through modern farming techniques and sites threatened by dams and construction projects. The CORONA systems included the labels KH-1, KH-2, KH-3, KH-4, KH-4A, and KH-4B, while the ARGON system was designated KH-5 and the LANYARD system KH-6. The image resolution of each system varies greatly, from one to two meters for the KH-4B system to 460 feet for the KH-1 system. The KH-4B mission series is of interest to archaeologists doing work across the Middle East, since this represents one of the primary efforts mapping the 1967 cease-fire between Egypt and Israel. In some cases, the ground resolution of this mission can reach one-two meters at nadir. In general, the KH-4A, KH-4B and KH-6 systems have the best resolution and quality, but earlier images may be useful for documenting widescale site changes. CORONA imagery is an excellent dataset for viewing longer term change in many areas of interest, and may highlight cultural features that are ephemeral today.
Numerous archaeological projects in the Middle East have made use of CORONA imagery, documenting regional landscape changes, routes to and from ancient sites, and ancient environmental features that modernization may have altered [13,14,15]. In Egypt, several studies have incorporated CORONA imagery in the reconstruction of palaeogeography as well as site change over time [6,16].
The initial analysis on the CORONA imagery for the Nile Delta took place in 2003, required the acquisition of the black and white CORONA negatives, and scanning them at 10 microns. The original CORONA imagery obtained in 2003 was from the KH 4B 1968 1105–2235 mission. Today, there is an invaluable map platform for Egyptologists, based at the Center for Advanced Spatial Technologies, University of Arkansas [17]. This project obtained CORONA imagery across North Africa and the Middle East, scanning and orthorectifying the data to be used in a Google Earth-like platform [18]. Some site locations in Egypt’s Nile Delta are noted, but the majority are not indicated there. Given the high scanning quality of the data, this team utilized it to compare against the Google Earth imagery for landscape and site changes.
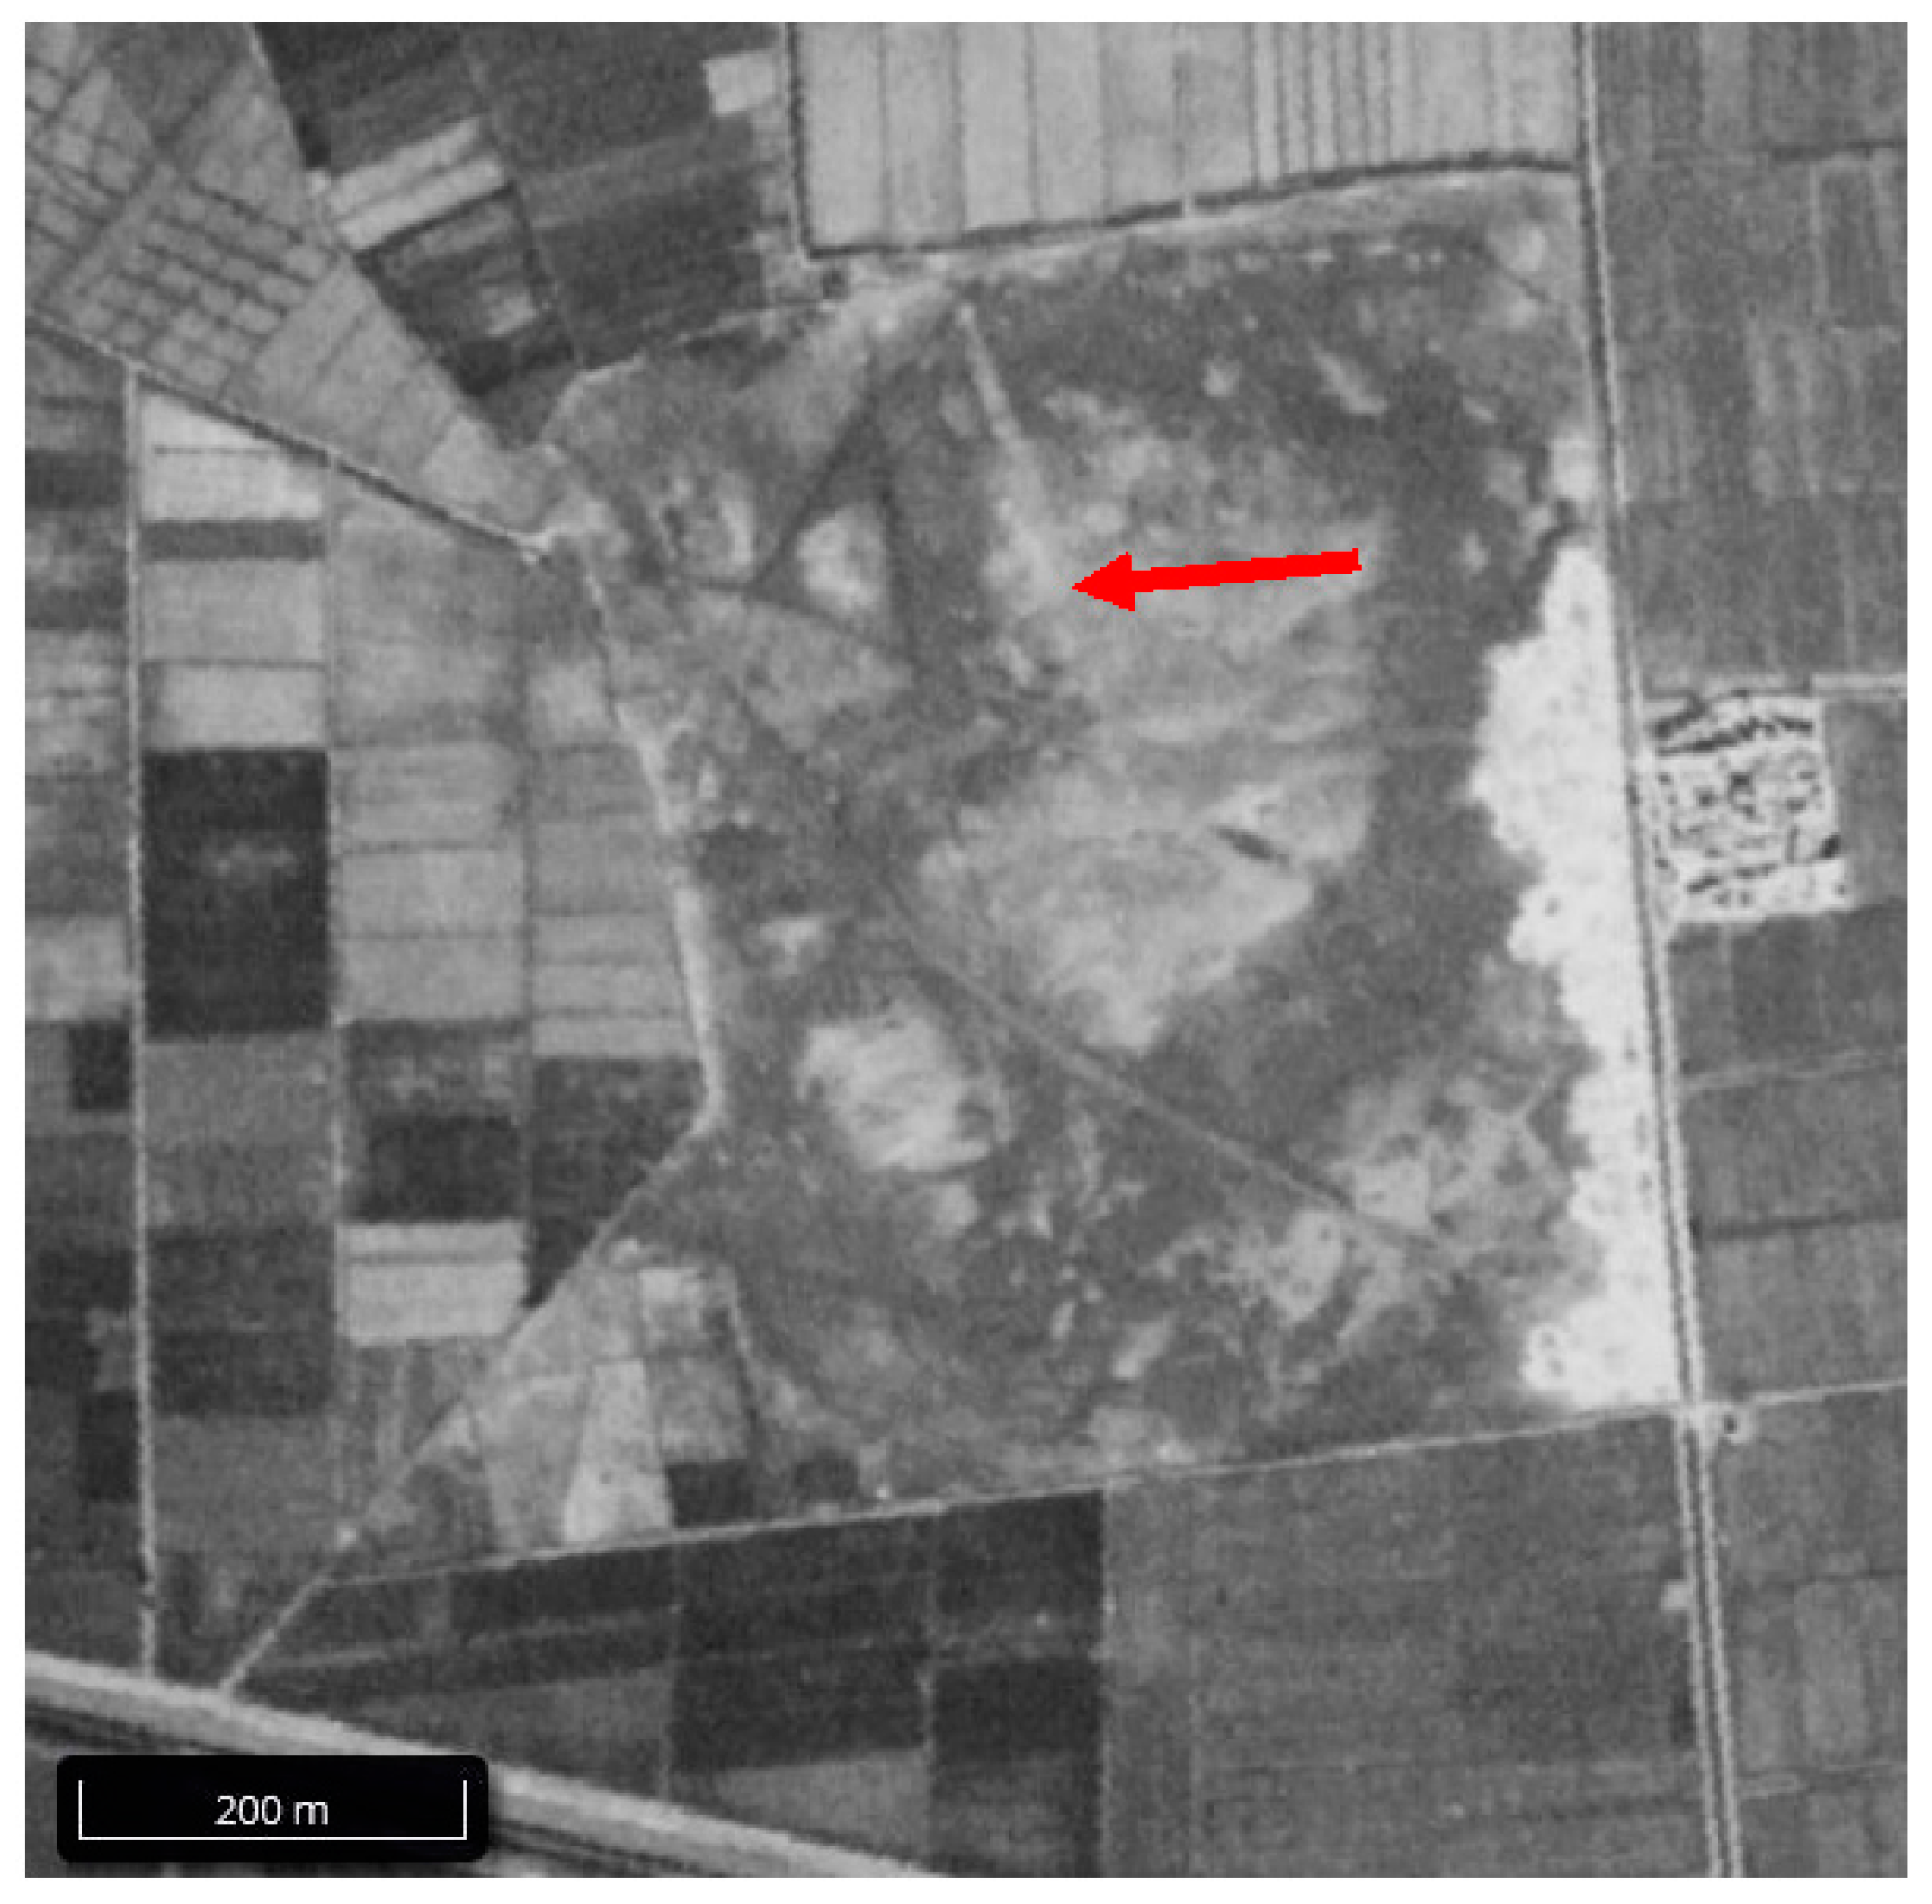
The CORONA imagery used in the paper came from the 1105-2235Fore mission (taken on 18 November 1968). An initial assessment revealed the enclosure wall of a temple wall dated to the late 4th century BC at Tell Tebilla (Figure 1) in the Northeast Delta which wasexcavated by a Canadian project team in 2003 (Figure 2 and Figure 3). This work was done in collaboration with Egypt’s Supreme Council of Antiquities, now Ministry of Antiquities. The enclosure wall had been partially disturbed by a modern water filtration plant, so the older imagery proved invaluable for visualizing the feature for further exploration.
An unusual subsurface rectangular feature surrounding one-quarter of the site in its northwest quadrant was identified adjacent to Tell Tebilla based on examination of the imagery. Changing contrast and brightness settings highlighted this feature, which represents an enclosure wall. The discovery proved to be particularly significant based on previous knowledge regarding traces of a destroyed temple from the same northwest quadrant. The minimum size of the Tell Tebilla temple, dating possibly as early as the New Kingdom (ca. 1550 BC–1069 BC) to early Third Intermediate Period (ca. 1069 BC–712 BC), with blocks of Ramesses II (found on the surface), had been reconstructed hypothetically from over 300 surface blocks that were photographed, measured and recorded by the Tell Tebilla team ([19] pp. 267–286). We determined the temple’s exact location by speaking to Egyptian Antiquities Inspector Said el-Tahwle, who claimed that municipal digging had uncovered a 15 m × 15 m limestone block paving with column bases and a drain channel since destroyed by the construction of a water plant. The temple had likely been destroyed mostly during the Roman Period (30 BC–395 AD) (similar destruction occurs at Mendes, twelve km to the south). The extant ex-situ blocks suggest it measured a minimum of 12 m–18 m by 30 m–35 m, and was dedicated to the triad of Osiris-Isis-Horus, but also included deities such as Sobek, Duamutef, Imsety, Qebahsenuef and Hapy [19,20,21].
2.2. An Overview of Ground-Based Remote Sensing in Egypt
Ground-based remote sensing tools, like resistivity, magnetometry and ground-penetrating radar (GPR) surveys have helped archaeologists to identity subsurface ancient structures in Egypt (Figure 4), including temple enclosure walls, houses, tombs and palaces and have even helped to map entire cities. At tell sites in the Delta and Nile Valley, magnetometers are the ground survey tool of choice for most Egyptological expeditions. Magnetometers can, however, sometimes miss features in sandier environments. GPR surveys are the tool most often chosen for subsurface mapping efforts in the desert. They are not as greatly affected by buried metal objects compared to magnetometers, and can provide a 3D time-slice of buried features. All subsurface detection techniques have challenges in environments where modern city layers may make it more difficult to detect the more deeply buried archaeological remains.
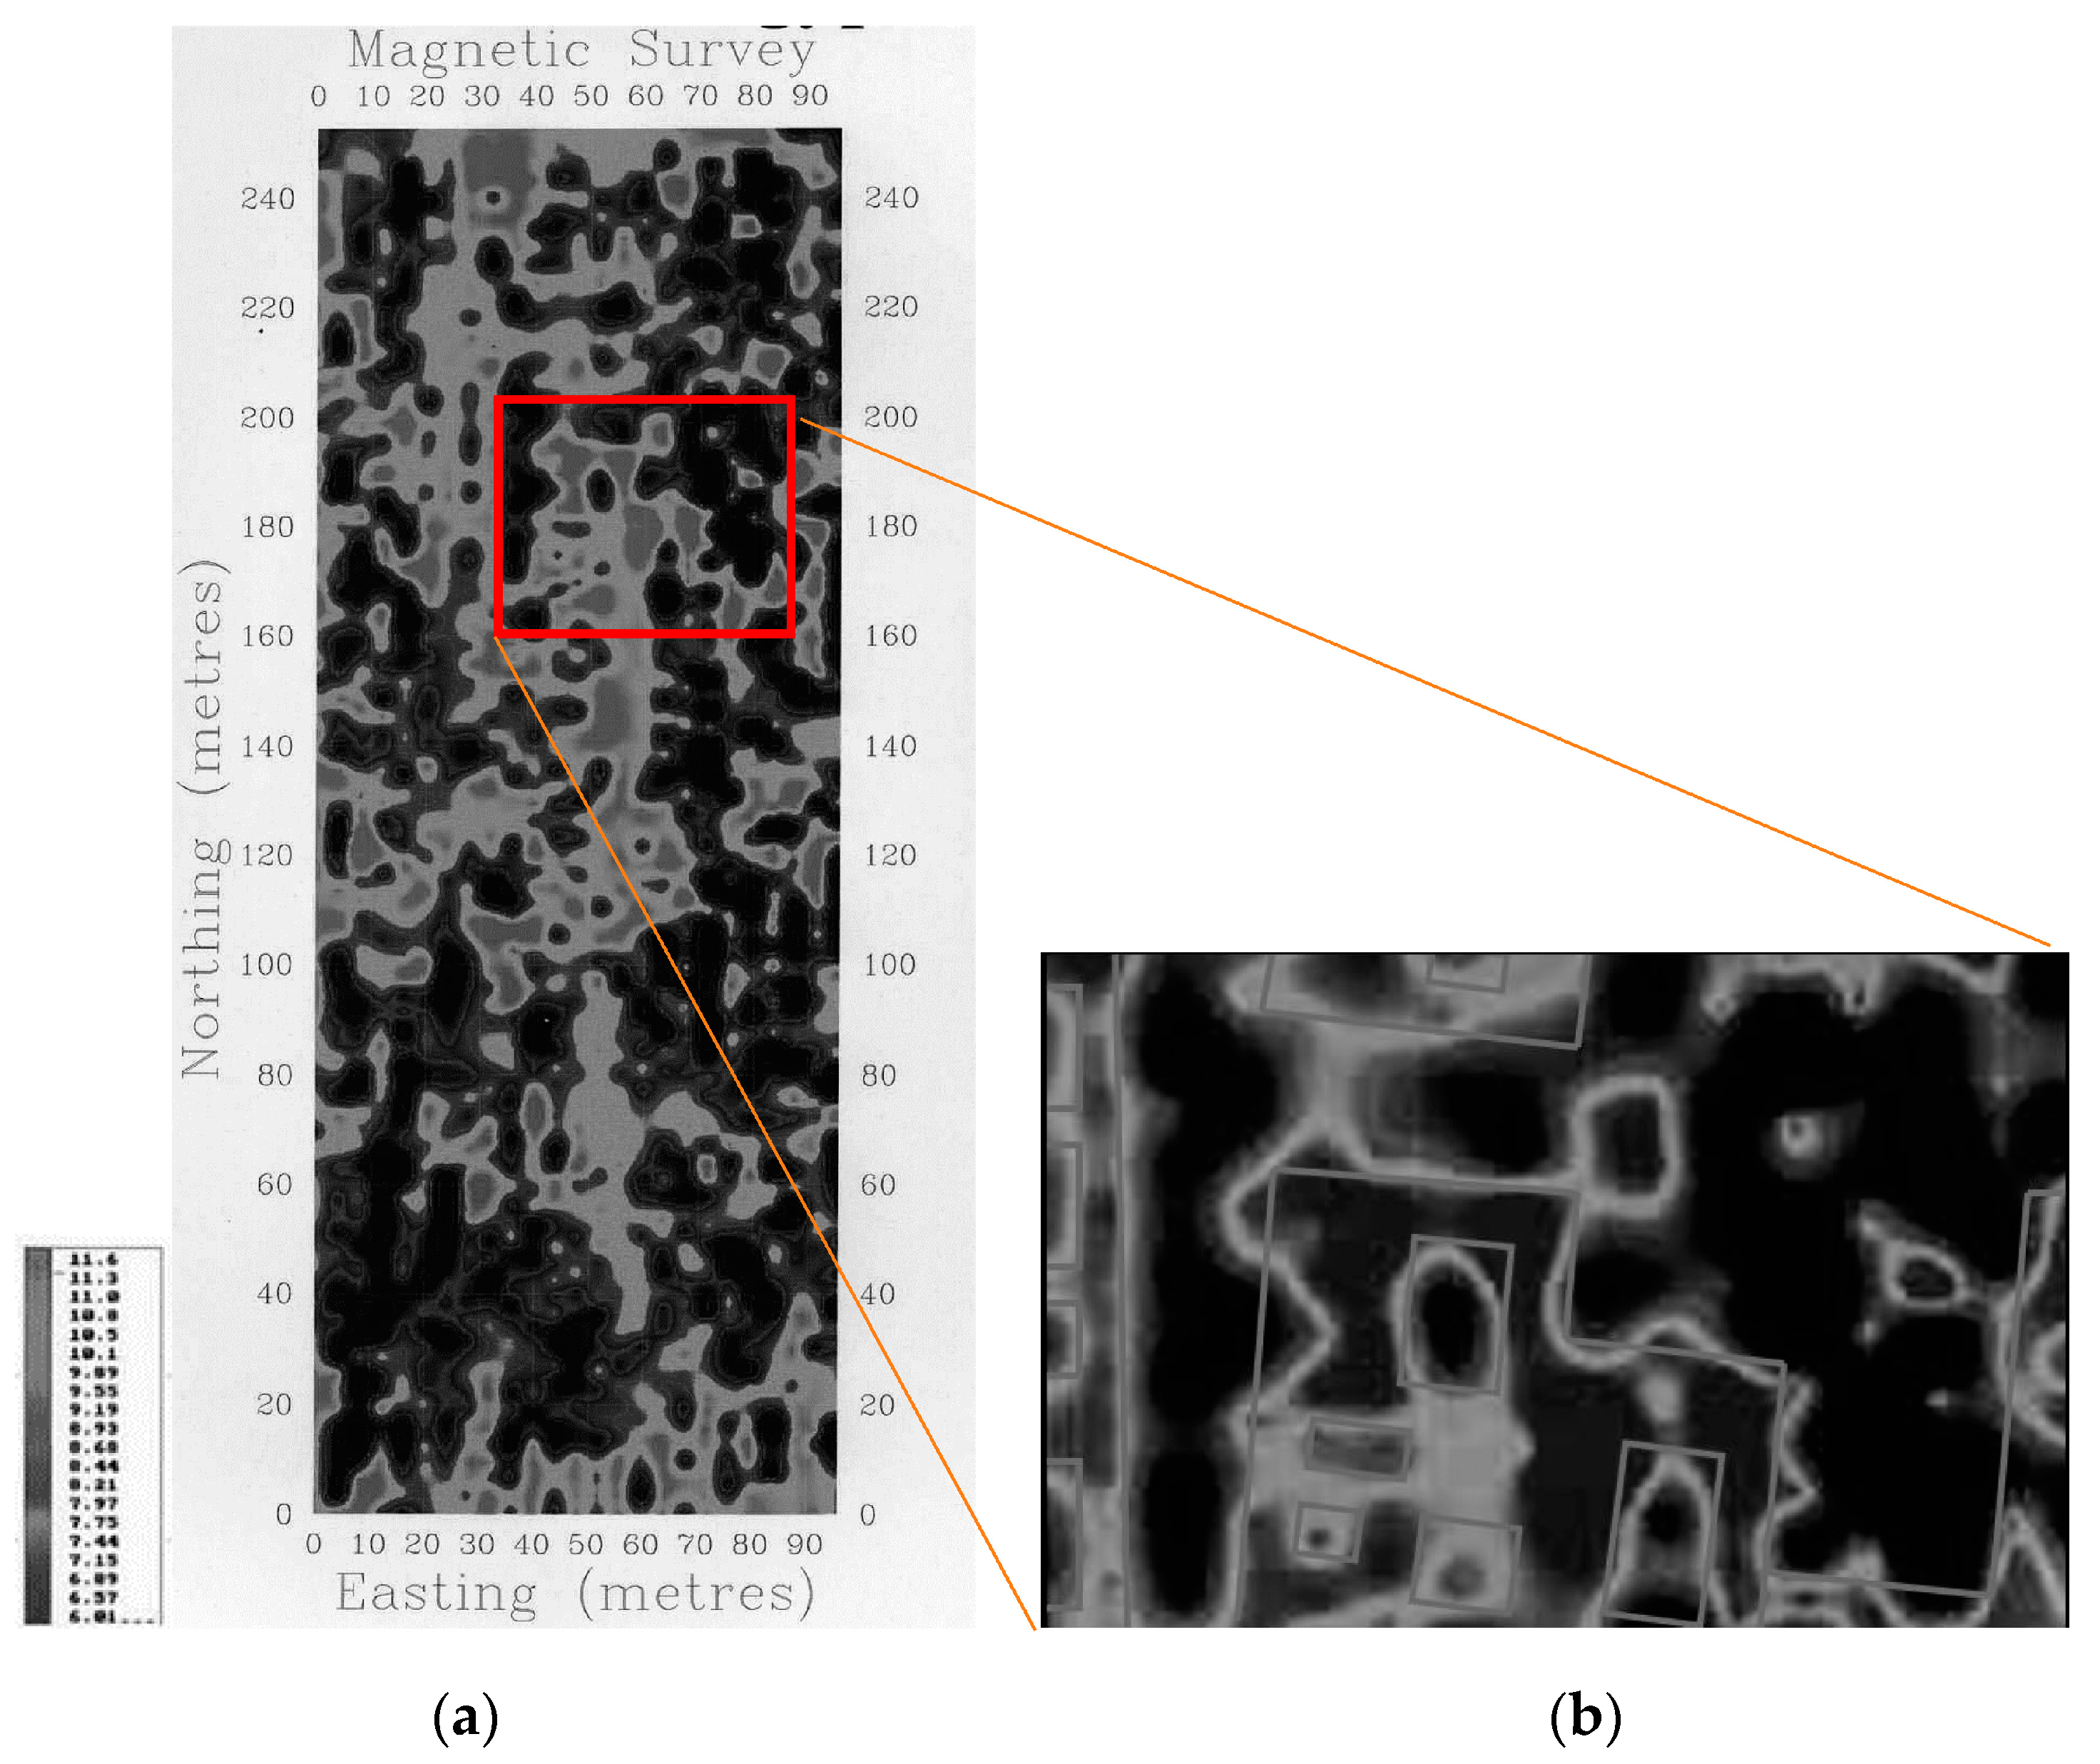
At the sites of Mendes and Tell Tebilla, L. Pavlish conducted magnetometer surveys using a fluxgate gradiometer [22]. These techniques helped to highlight key portions of these sites for archaeological excavation. At Tell Tebilla, the magnetometry survey showed the outline of a complex (Figure 5), later found by excavators to be the remains of a structure reused as a tomb, preserved over seven meters deep. H. Becker and J. Fassbinder have done magnetometry work at Pi-Ramesses, which revealed the outlines of many structures now beneath agricultural fields [23].
In Luxor, L. Pavlish has carried out magnetic surveys over the remains of a mortuary temple equated with Amenhotep I, showing the outlines of this temple complex and related buildings. At Saqqara, I. Mathieson has revealed the outlines of an ancient settlement and nearby road [24]. At Abydos T. Herbich has found many potential Early Dynastic tombs and related enclosures [25]. In Egypt, subsurface remote sensing is clearly a standard part of excavation projects. However, bringing scientific equipment into Egypt can be problematic, with periodic challenges of clearing equipment through customs. A number of projects have had equipment sit in customs for months. Archaeologists may not be allowed to use the equipment in sensitive areas. Now, with limited budgets, it is not always feasible to include ground based remote sensing. It is also not practical to use ground based remote sensing for surveying of many sites.
This subsurface feature detection paper originated unexpectedly out of a 2014 study to examine open source methods for the detection of archaeological looting and site damage in Egypt via satellite imagery. This study [12] used both high-resolution and free access satellite data from 2002 to 2013 for a database of 1200 “sitescapes”, or archaeological zones, in Egypt. The study found nearly 200,000 looting pits at 279 sites, with major spikes in looting and site destruction following the 2009 recession, and again following the 2011 Arab Spring. As our team examined Nile Delta Google Earth imagery from multiple years, we started to notice likely near-surface archaeological features at numerous sites. The Google Earth imagery represents DigitalGlobe data, which includes Worldview-1, Worldview-2, Worldview-3, Worldview-4, Quickbird-1, Quickbird-2, and Geoeye datasets. Their resolutions range from 0.3 m to 0.6 m. While the Google Earth data is true color, it can be useful in comparing data from multiple seasons. We spent additional time examining each Nile Delta site’s satellite image closely, as walls and features can be ephemeral compared with looting pits. When we noted potential features, we marked the site or its components as “likely feature”, and then later examined each likely site in a team effort to eliminate false positives. Since this current study is taking place in 2017, we have examined all additional Google Earth satellite data for the sites since 2014.
With a total study area of 22,000 km2, purchasing high resolution data for 12 years of the entire Nile Delta region would have cost approximately 5.3 million US Dollars (assuming an average cost of $20.00 per sq. km). This does not include the time spent downloading and processing the data. While the data analysts were paid appropriately for their time on this project, employment represents a cost equal to 1% of the raw physical data. The visible aspect of satellite images should not be overlooked, as it can allow the creation of maps in areas where good maps do not exist or are not easily accessible, and make it possible to search for features before initiating in-depth survey season research. The main disadvantage of visual detection alone is that unclear features remain ambiguous. Purchasing the data (assuming unlimited funds and time) would have allowed for actual processing, and a higher percentage of the Nile Delta sites may have had apparent features. There are tradeoffs between cost and scale of data analysis that all researchers must consider.
3. Results
Nile Delta Remote Sensing Results
At 20 sites in the Nile Delta, an assessment of multiple years of visual site data (from varying months) revealed subsurface archaeological featuring ranging from single houses to clear outlines of settlements. While we cannot divulge their exact locations (for site protection purposes), we can describe their general region, size, observed features, vegetation coverage (if any), and general estimate of occupation time-period (some of which have previous survey data). We also relate the extent to which the sites and their landscapes have changed in a nearly 50-year period. It is noted that the spelling of specific site names in Egypt can vary widely. Much of the previous survey work is described on the Egypt Exploration Society’s Nile Delta survey website [26]. The visible above-ground site size can be measured via the most recently available satellite imagery (2016 or 2017).
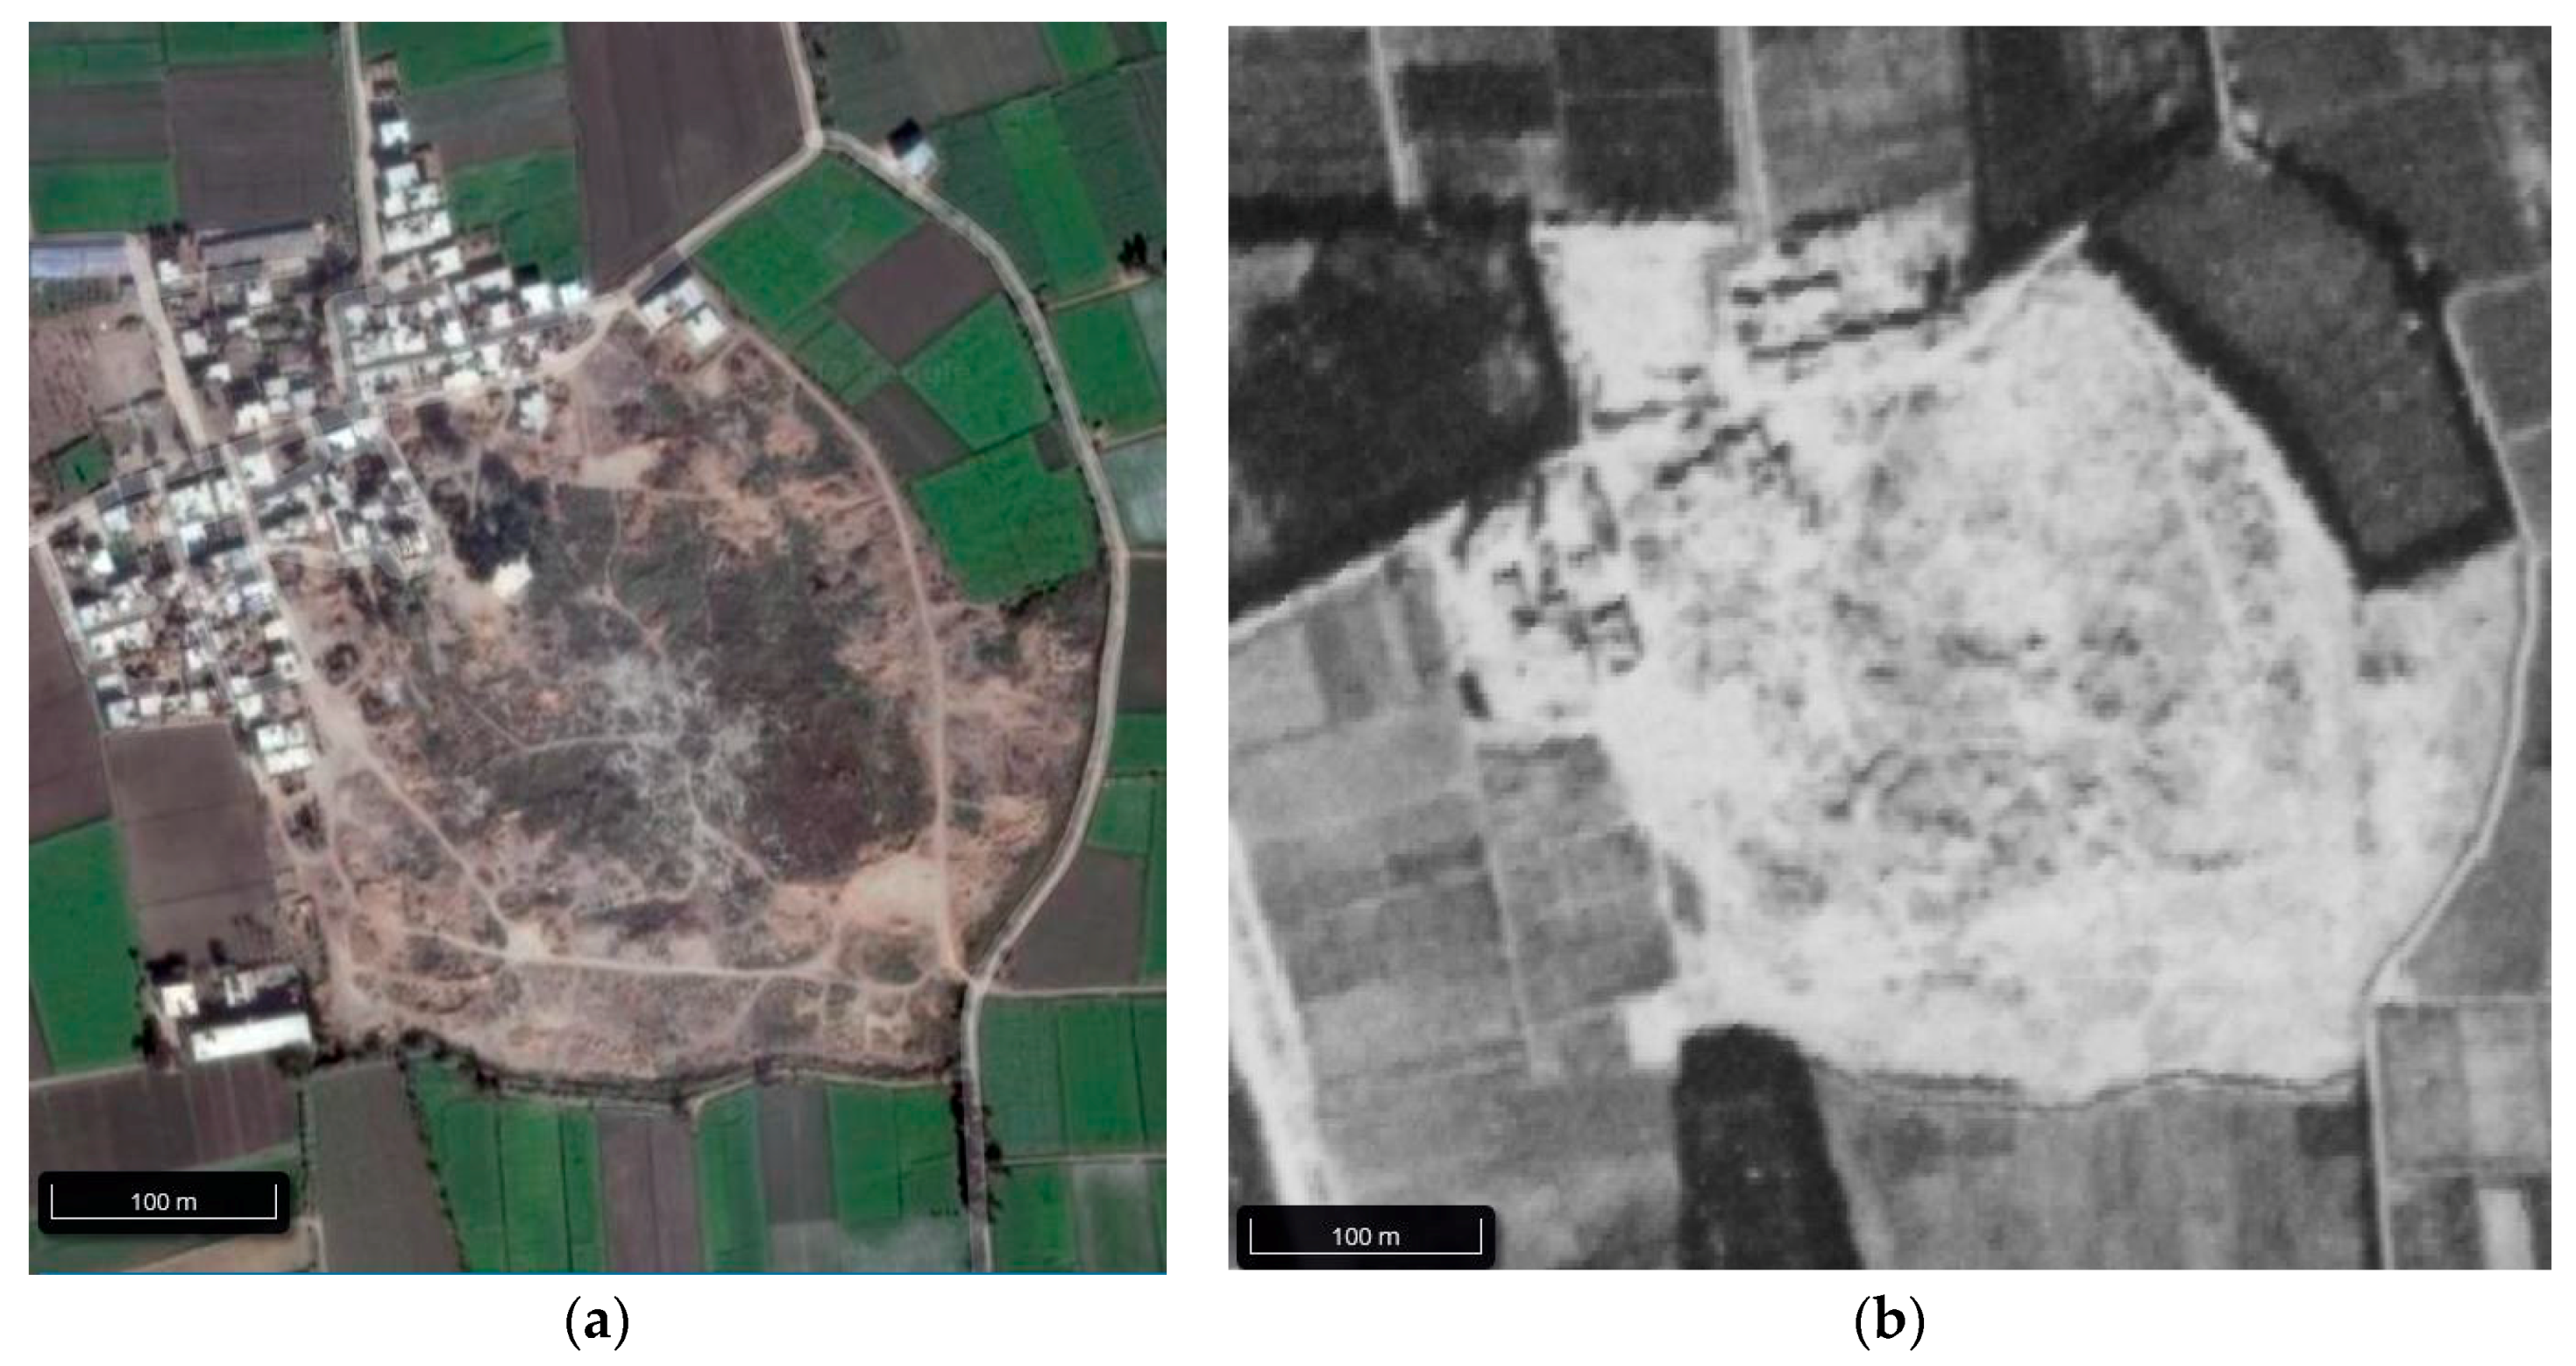
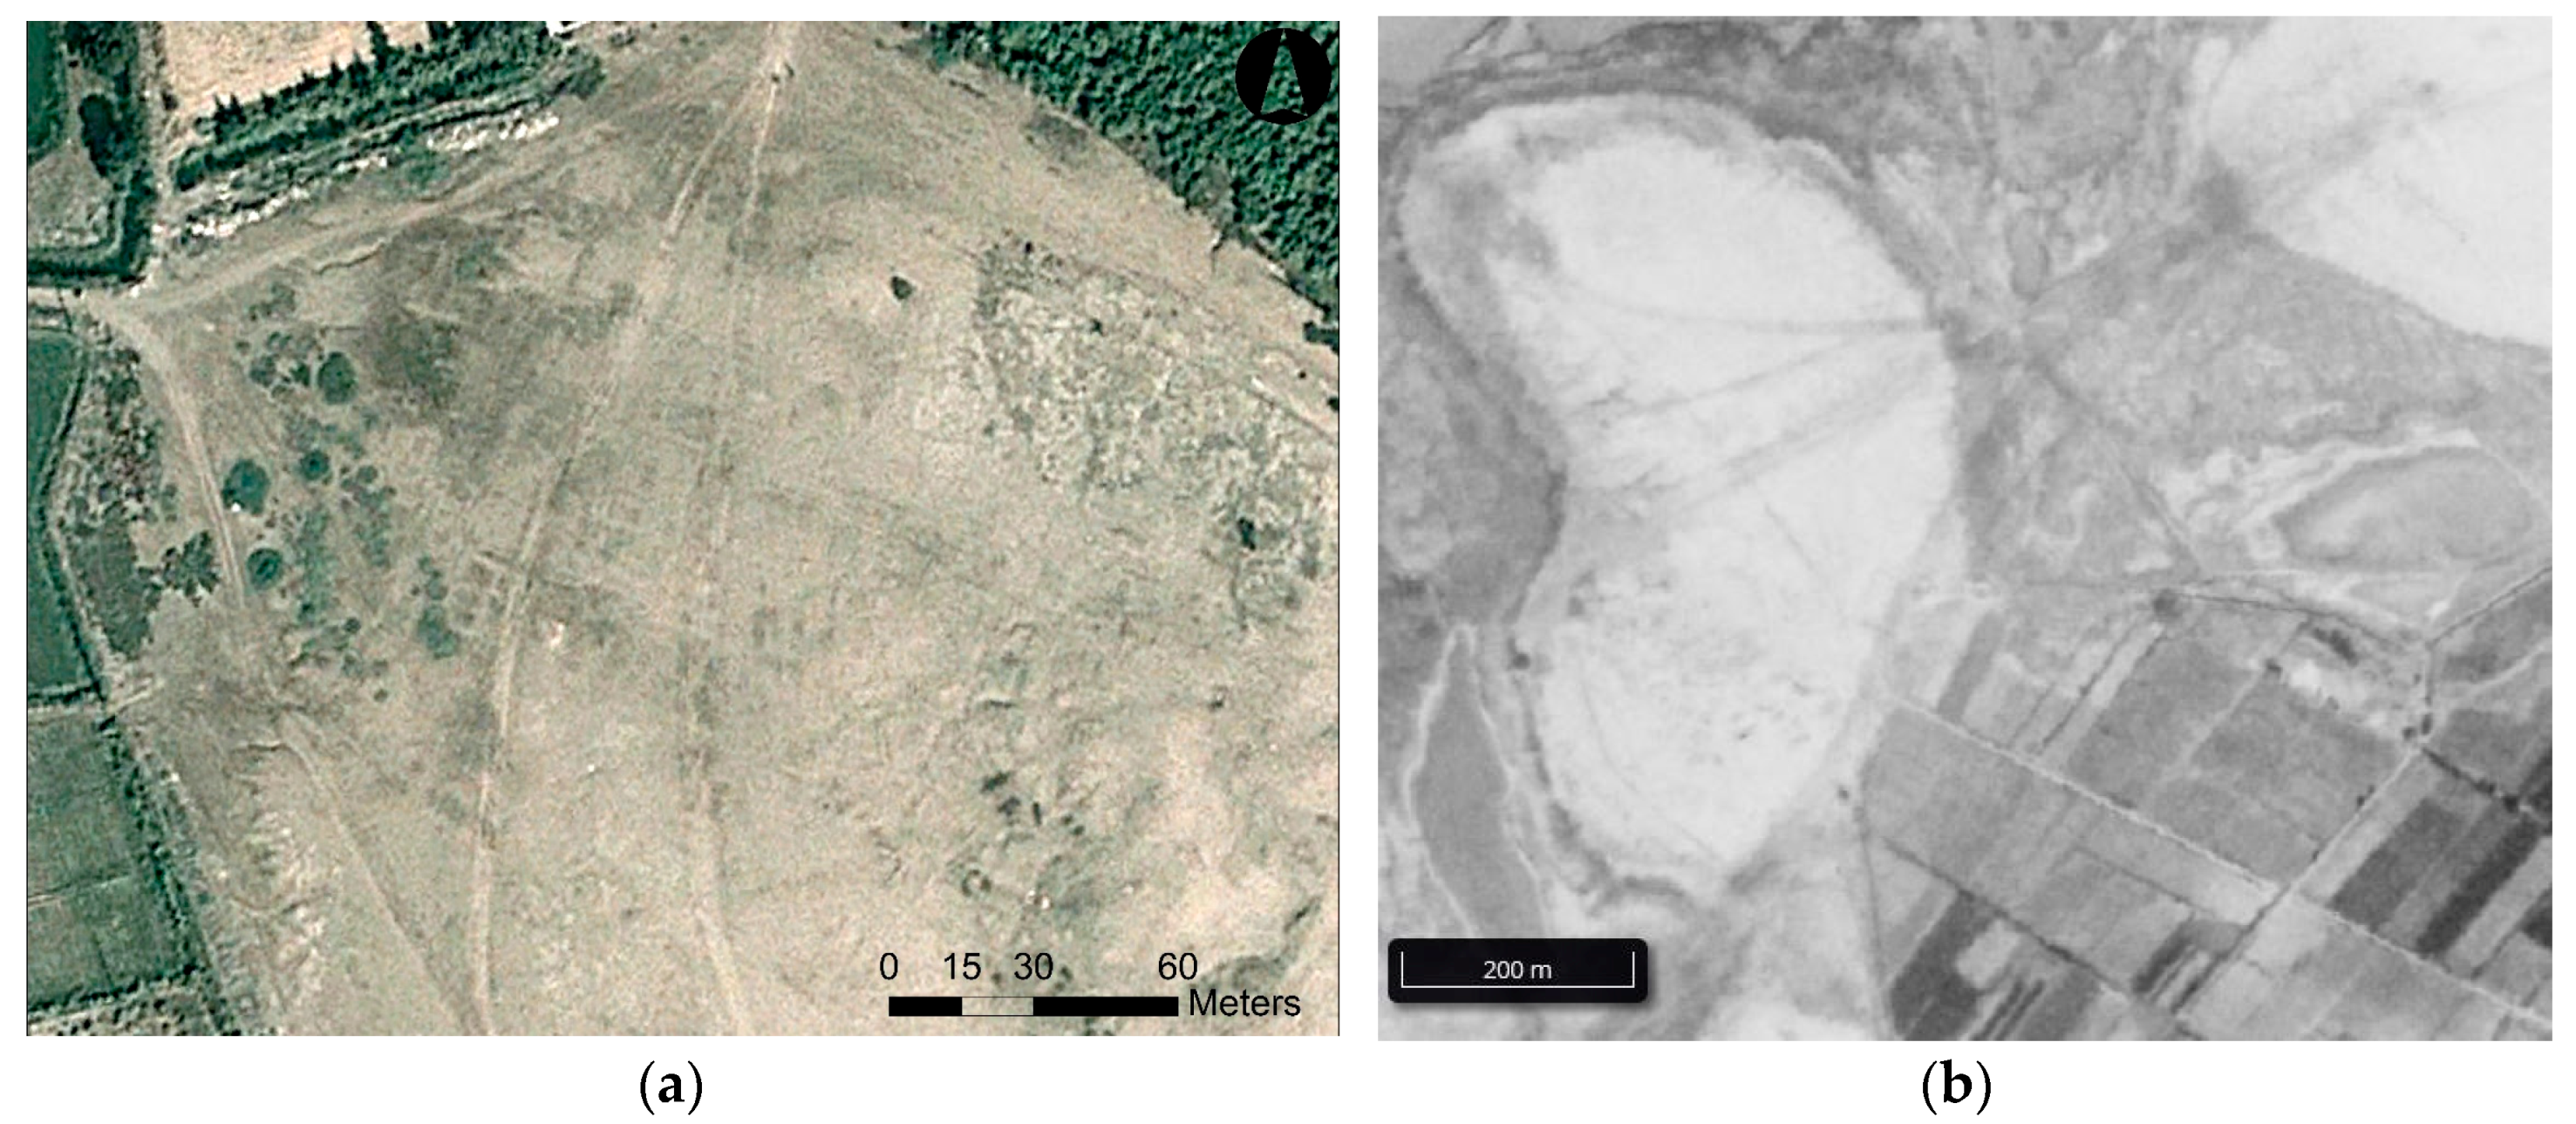
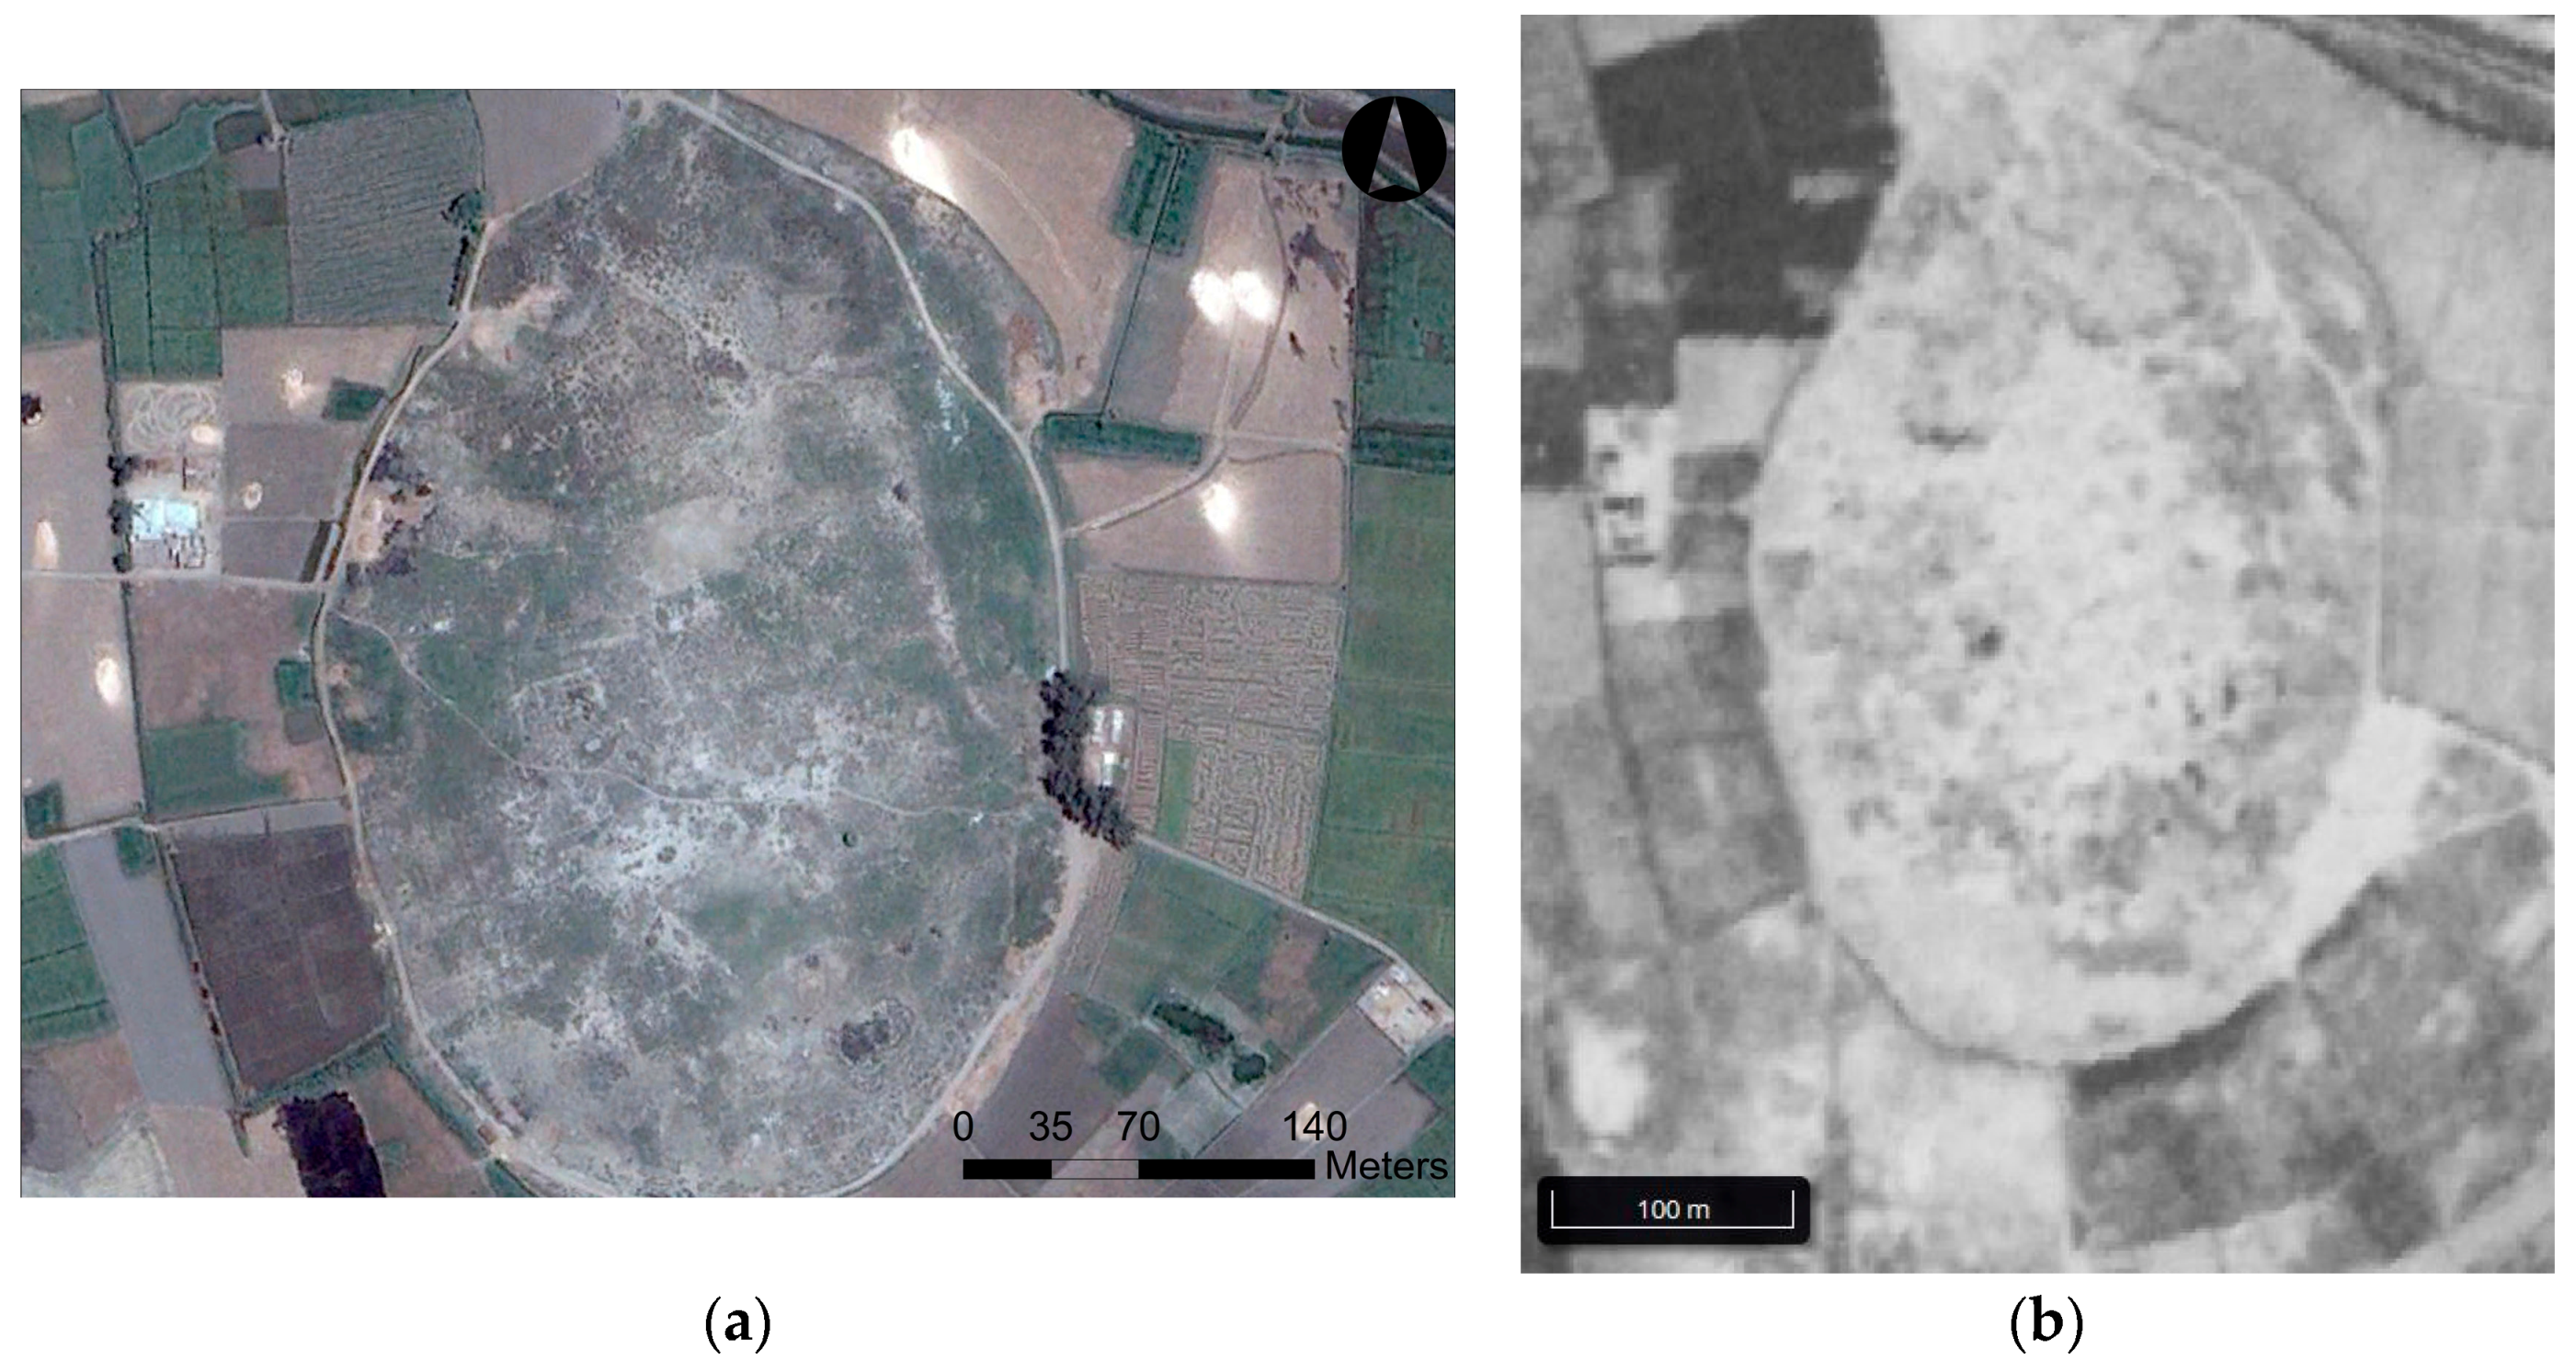
Abu el Humar: Located in the western Nile Delta, the site measures 300 m × 320 m, and is a lighter colored sandy mound with vegetation covering 50% of the site. A 180 m long enclosure was can be seen, with a clear southern wall and tapering eastern and western walls. The wall is most clear in an April 2002 satellite image. Given the size of the enclosure wall and other features at the site, it may be Late Period-Roman period in date (ca. 712 BC–395 AD) [26]. The village has tripled in size in almost 50 years, but the overall size of the site has not changed (Figure 6).
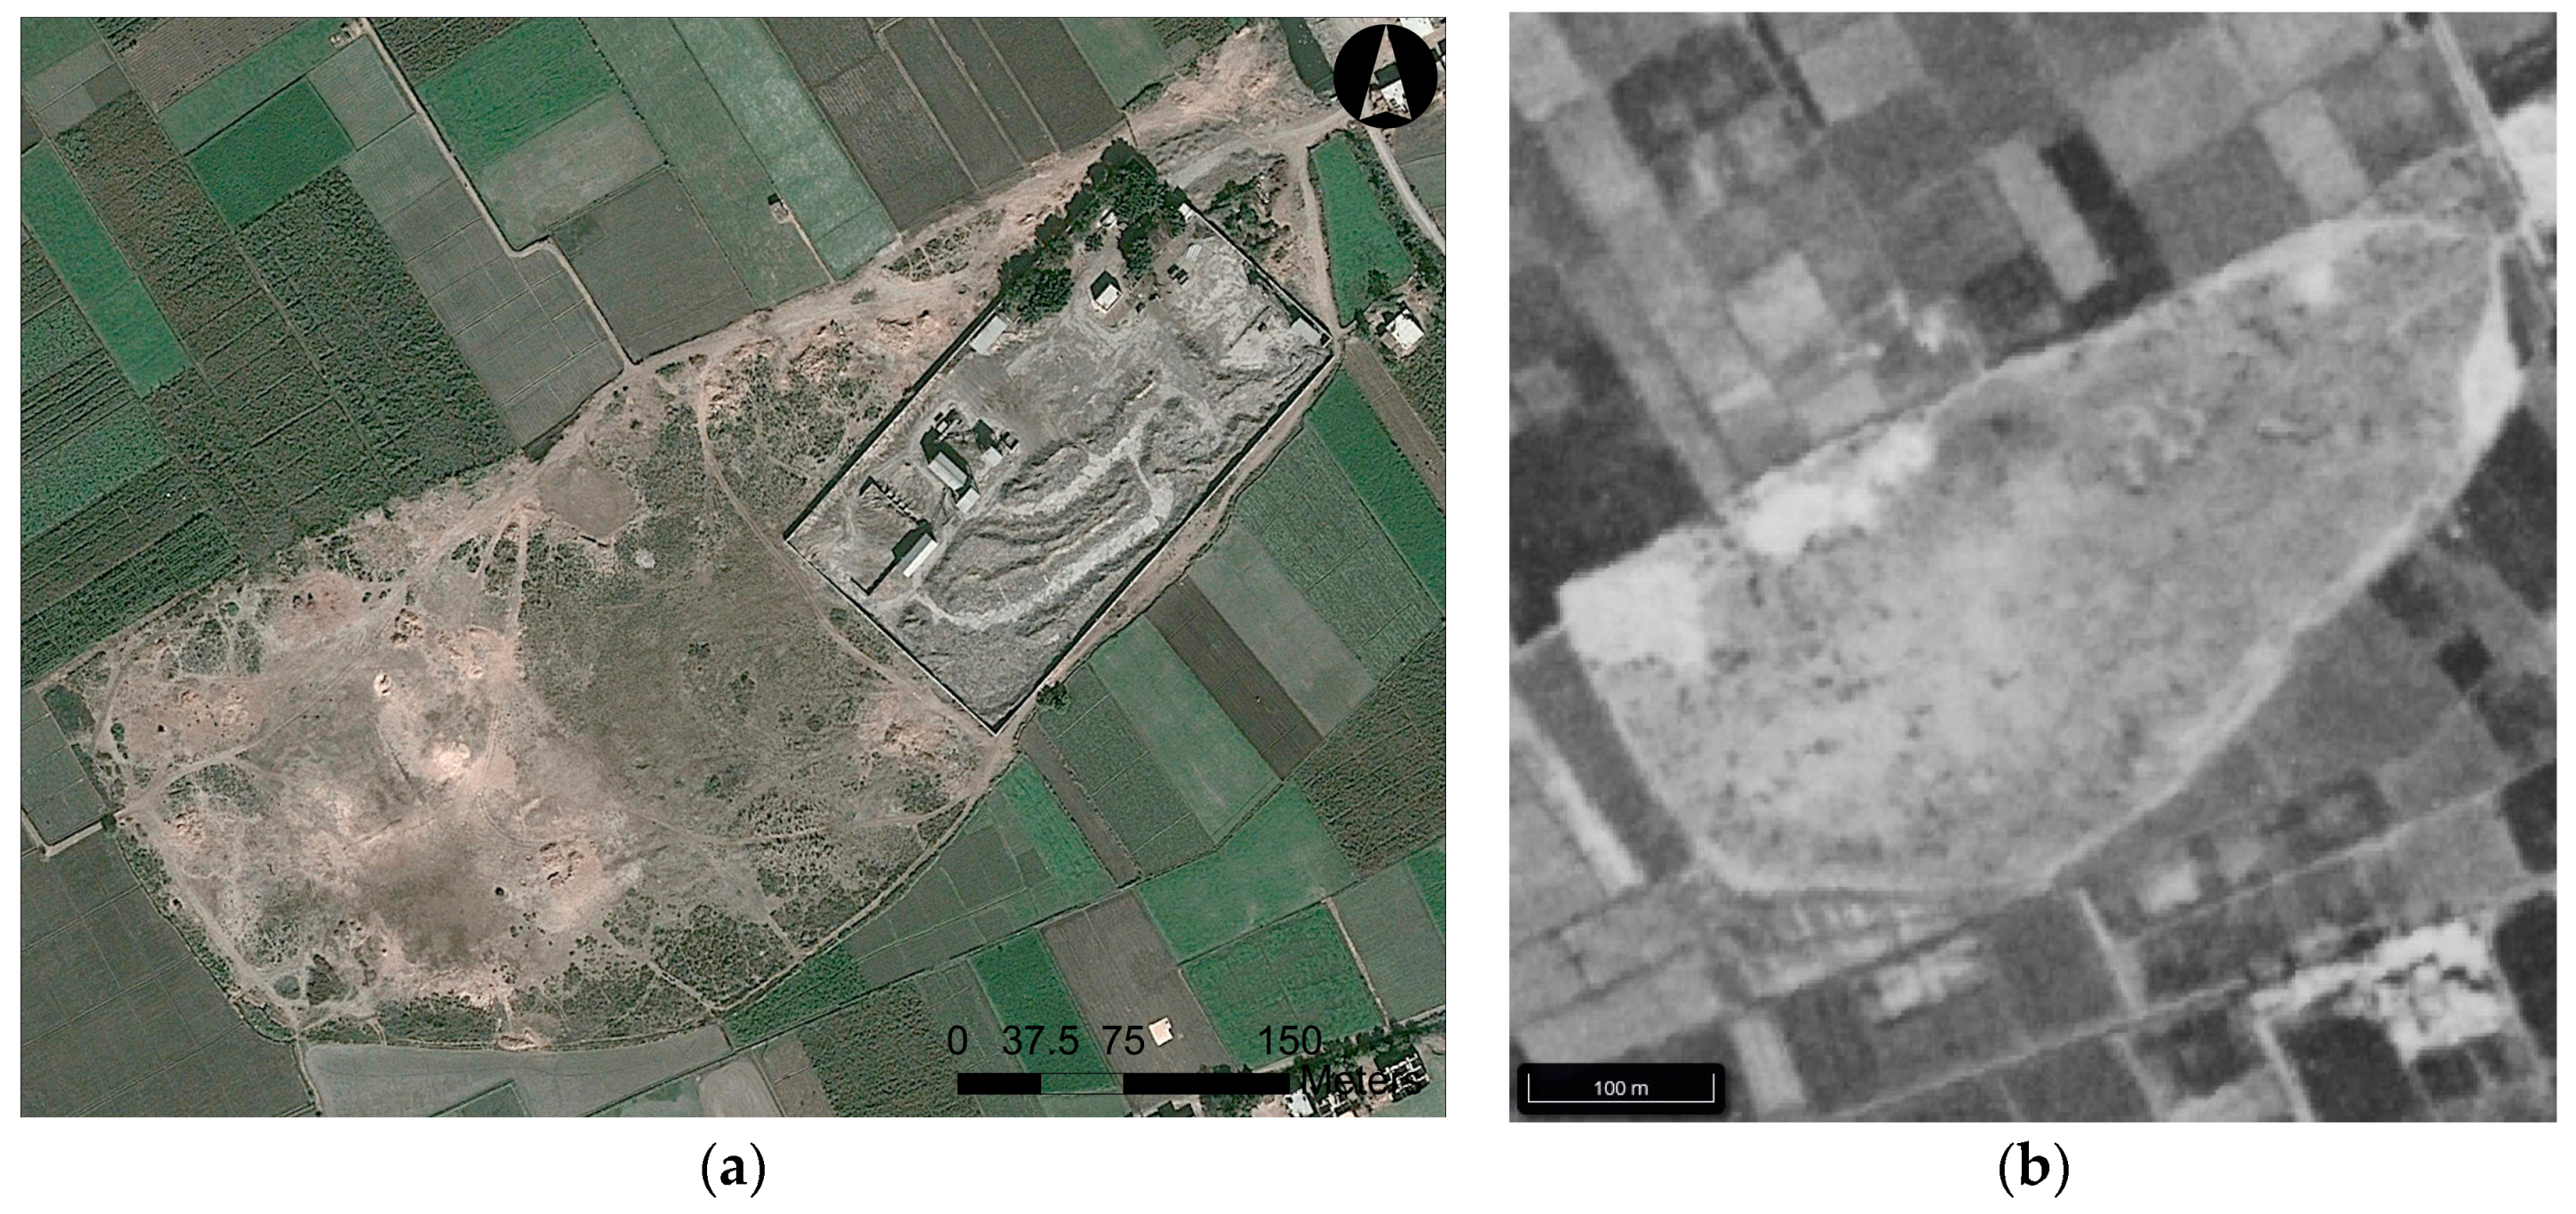
Abu Mitawi: Located in the Central Nile Delta, the site measures 520 × 250 m, is mainly a lighter colored sandy mound, with no vegetation. The site is heavily looted along the north side, but its central and southern sections have multiple ancient subsurface structures. The southwestern part of the site has a series of larger and interconnected structures, perhaps part of an administrative complex, most clearly seen in a December 2015 image. The site is Saite Period-Roman Period (664 BC–395 AD). (Dated using ceramic evidence from previous survey work) [26] (Figure 7). The overall site seems to have shrunk since 1968, with 100-m sections to the west and east of the site now covered by modern fields.
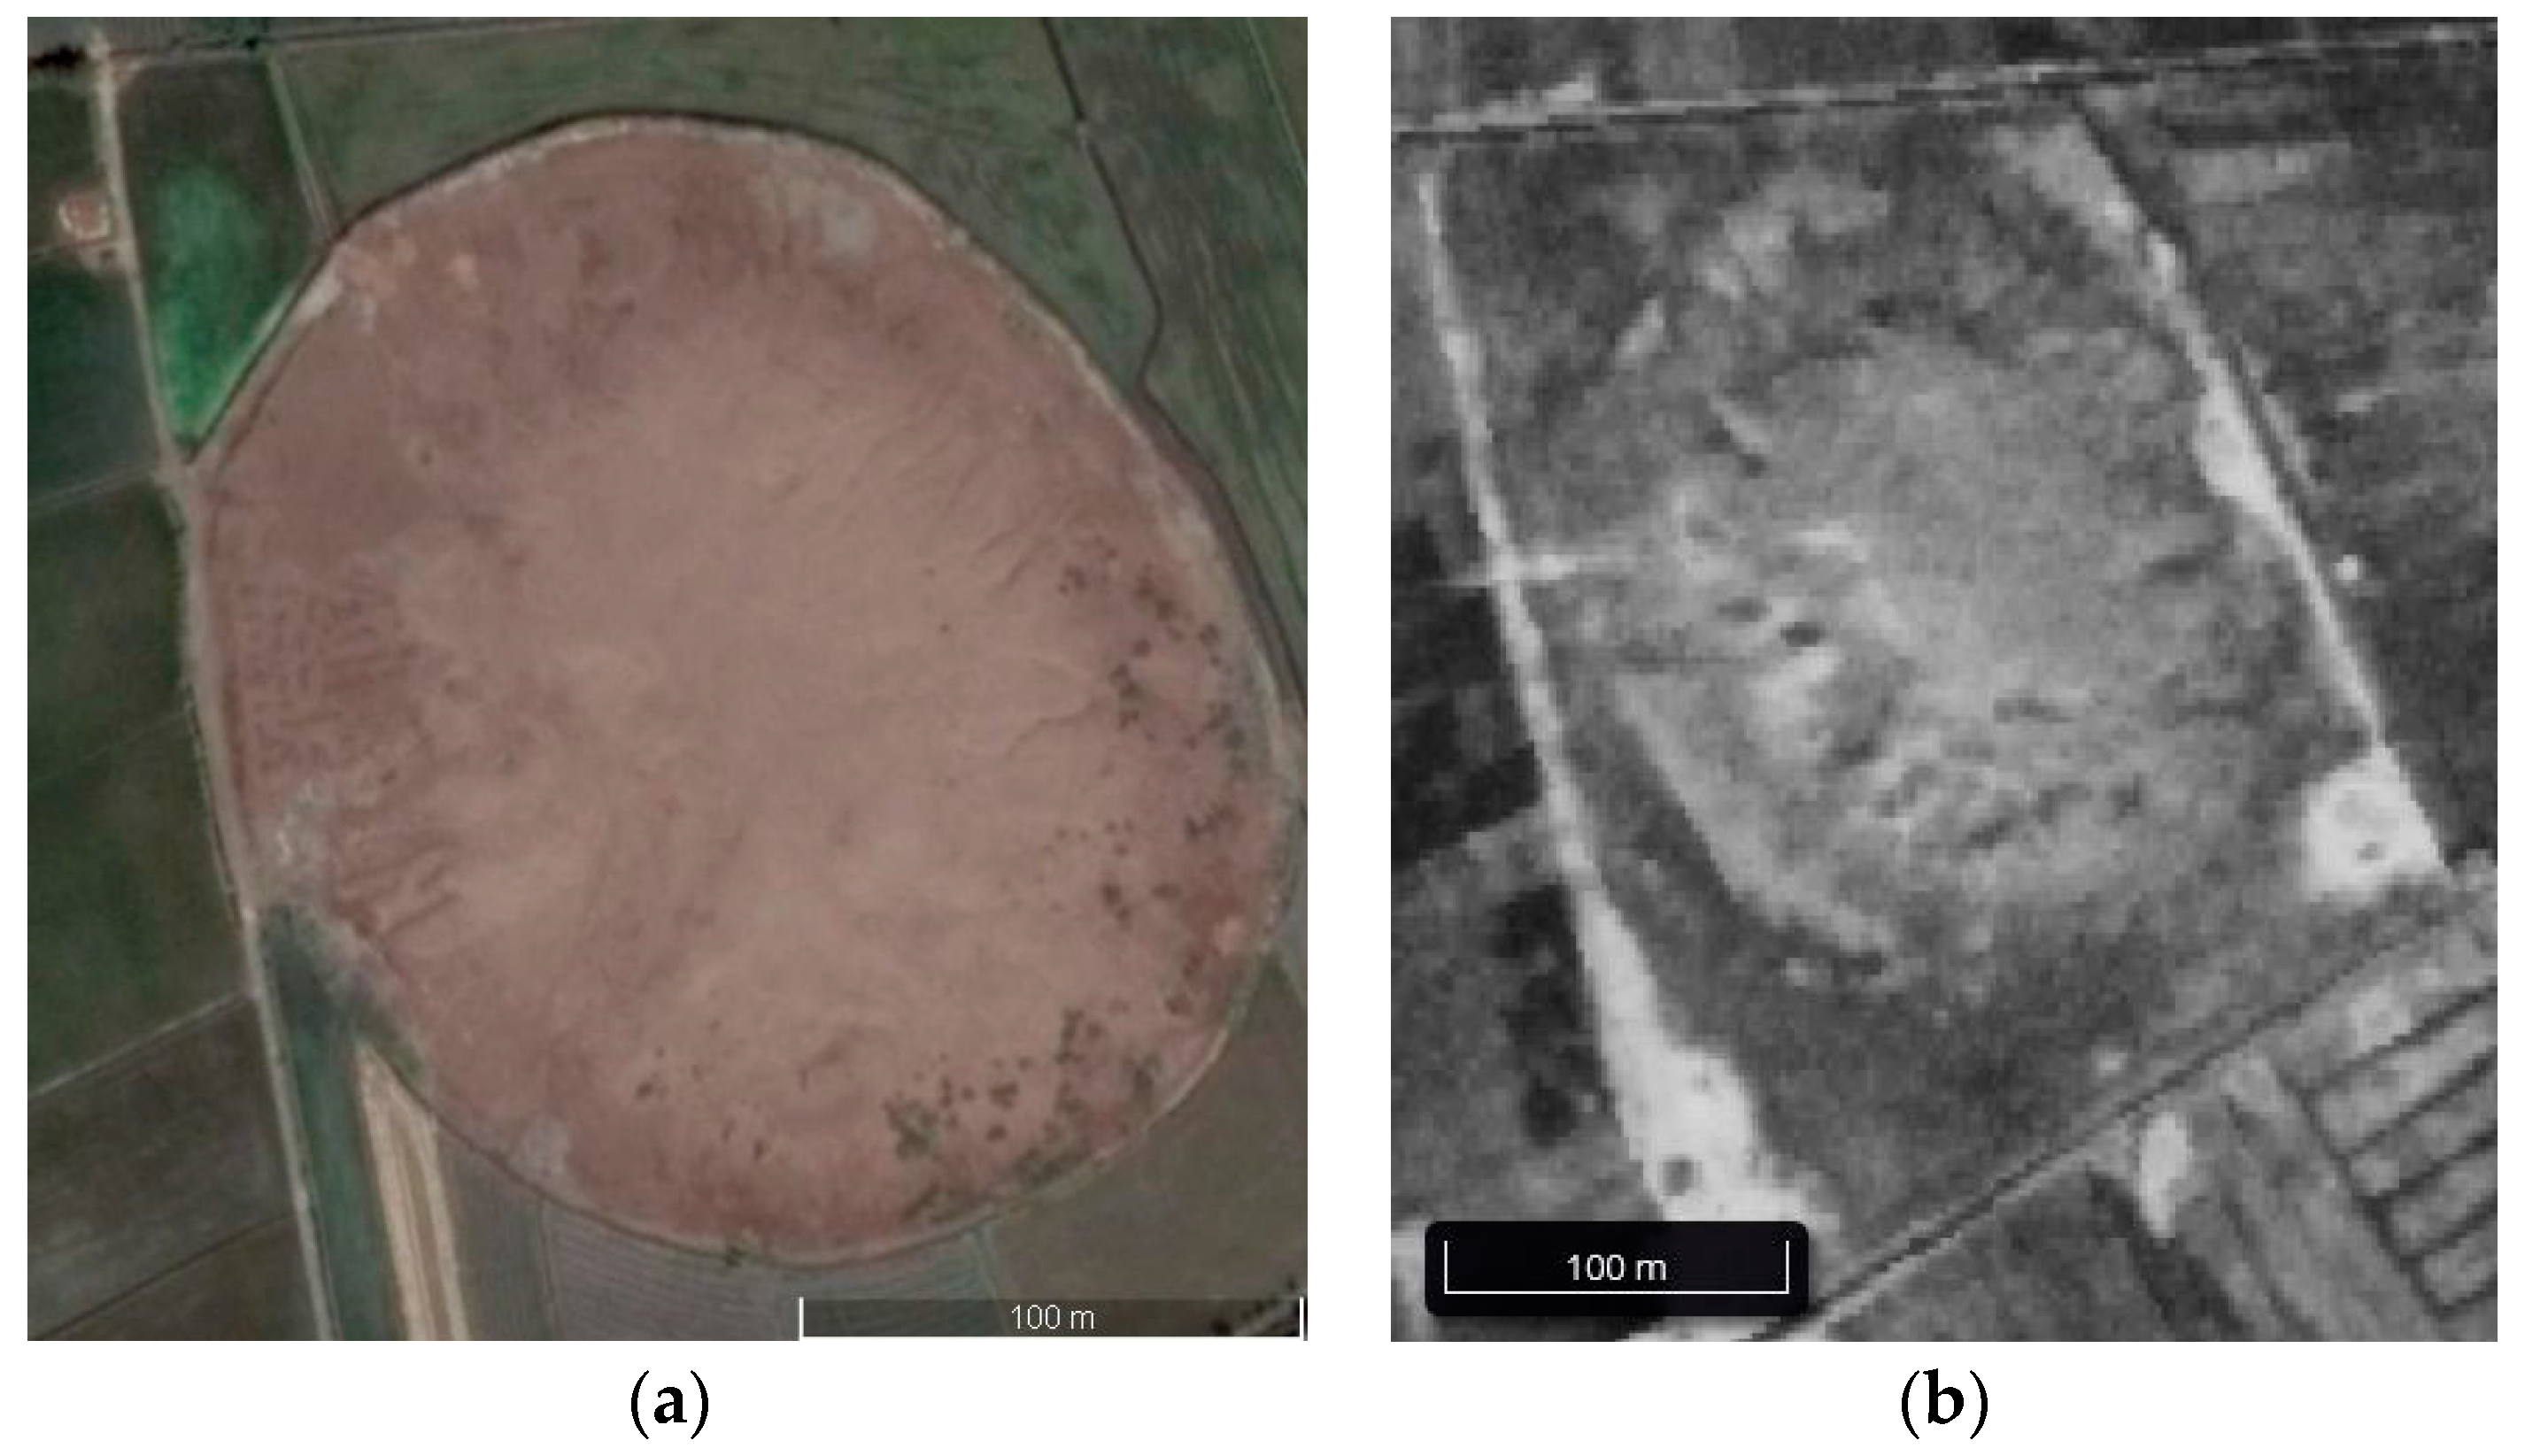
Daba el-Qibli: Located in the western Nile Delta, the site measures 240 m × 280 m, and is a lighter colored sandy mound with limited vegetation. Multiple structures appear in a December 2014 image. The site dates from the Roman Period (30 BC–395 AD) (dated by ceramic evidence from previous survey work) [26] (Figure 8). The site has shrunk by 75% since 1968, being cut into by agricultural fields.
Kom Biltus: Located in the western Nile Delta, the site measures 340 m × 275 m, and is covered in sparse vegetation. There are smaller features apparent in a September 2005 image. The site might have some New Kingdom (ca. 1550 BC–1069 BC) construction based on their shape (Figure 9). The southernmost part of the site has been cut into by modern agriculture since 1968.
Kom Bunduq: Located in the western Nile Delta, the site measures 240 m × 220 m, and has no vegetation. Some smaller features are visible in a November 2011 image, while others appear in the central part of the tell in a February 2013 image. The site dates to the Late Roman to Islamic Periods (ca. 395–1517 AD) [26] (Figure 10). In the 1968 image, the site appears to have a lower section (similar to sites in Syria or Iraq), now beneath agricultural fields.
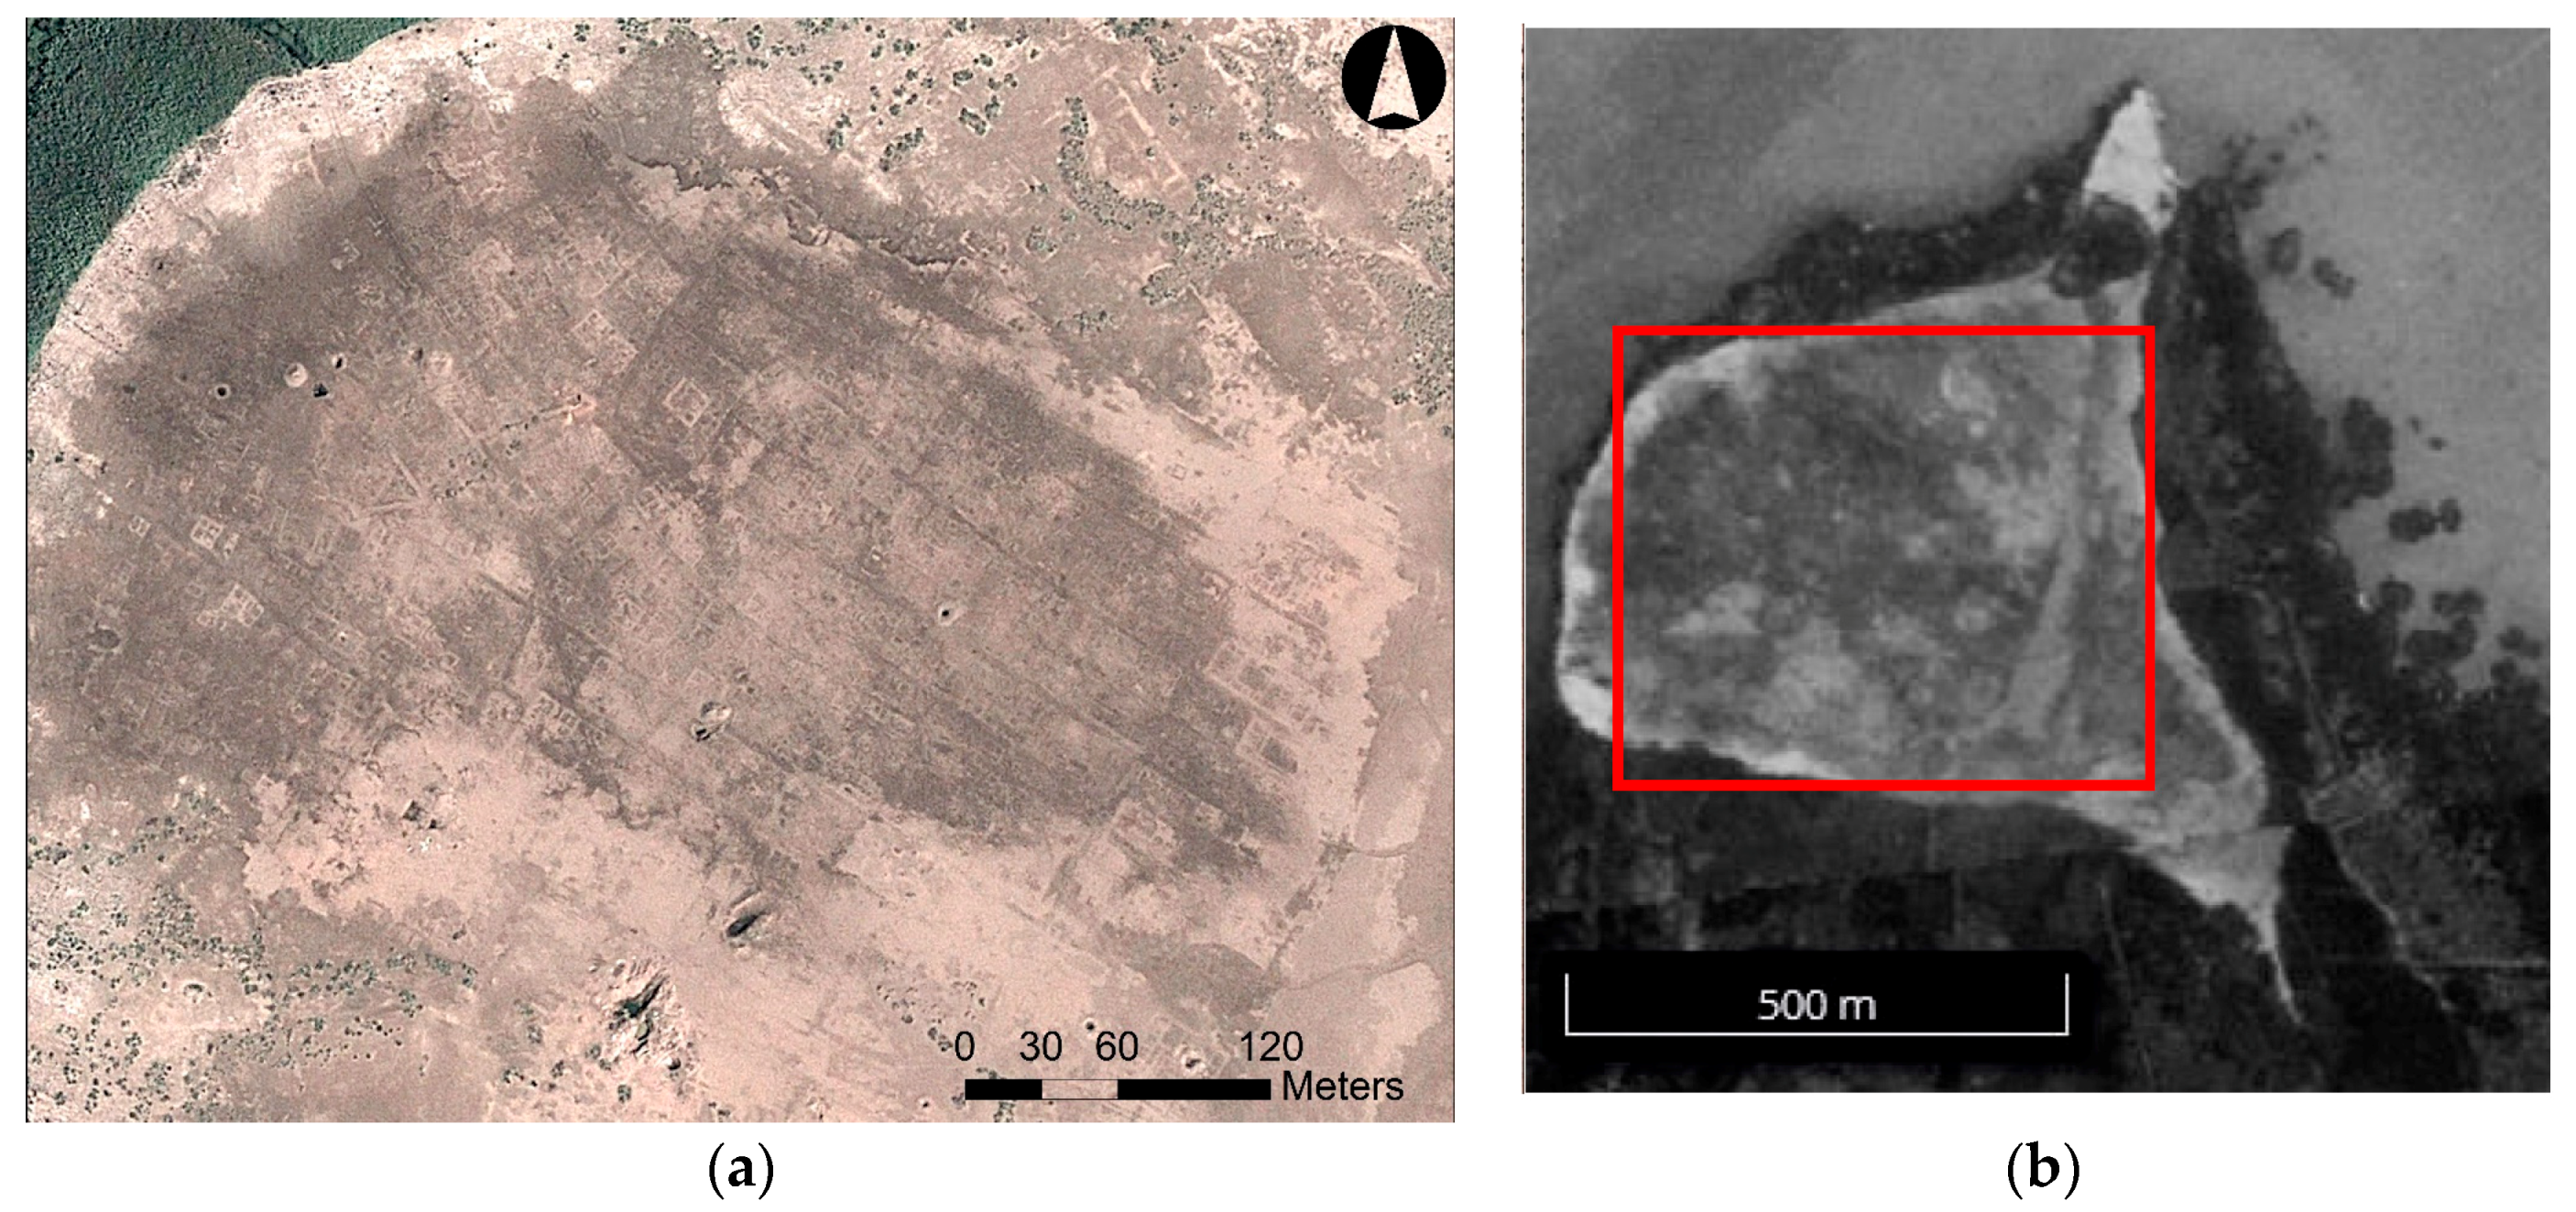
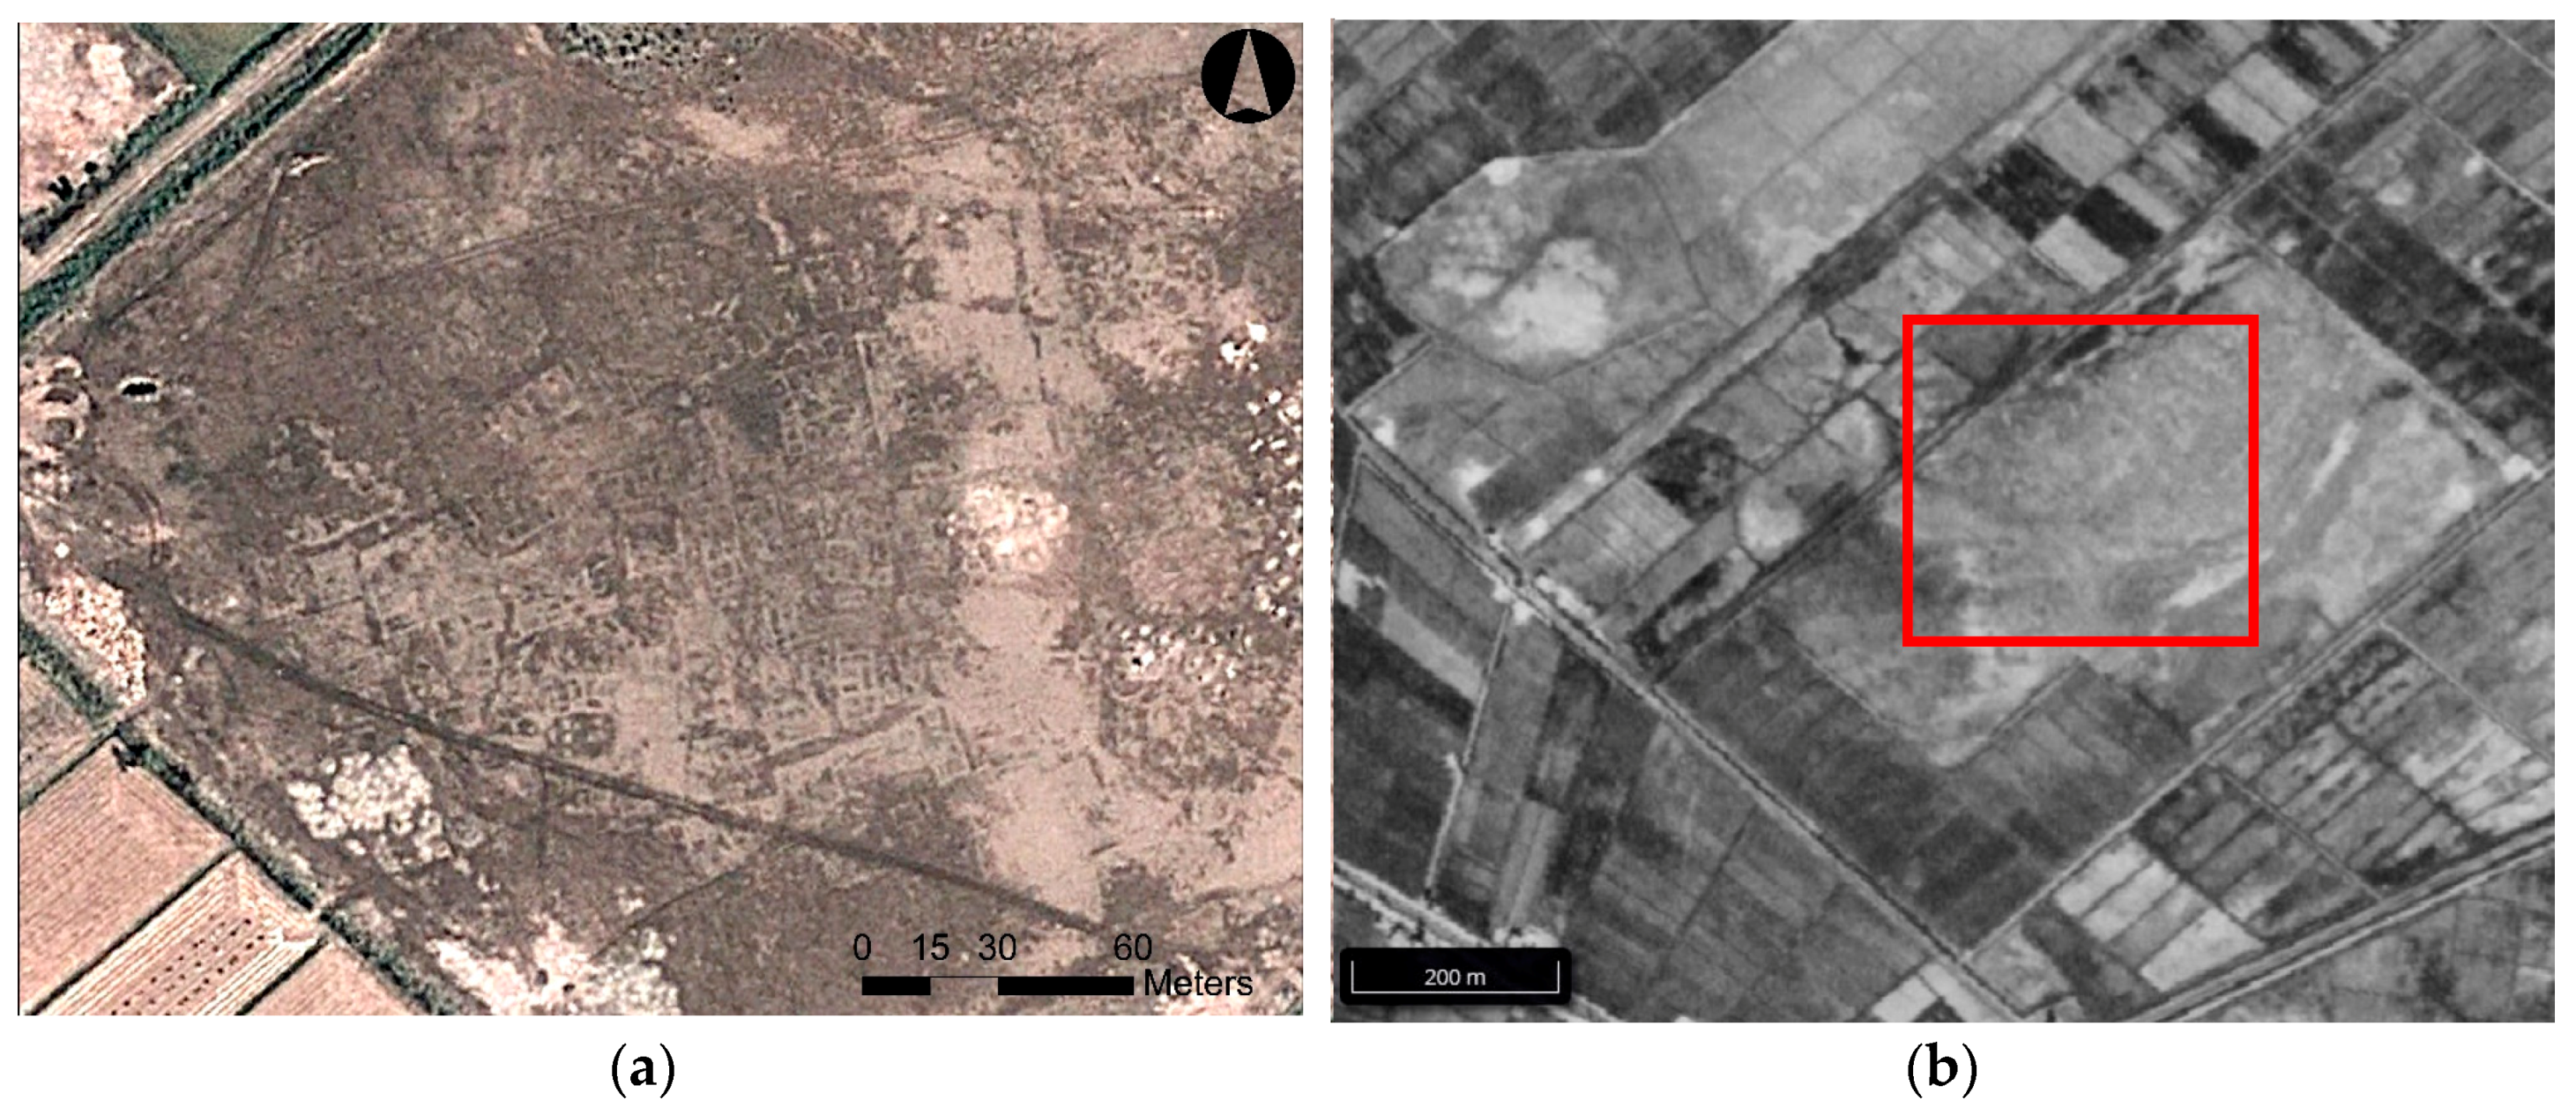
Kom ed-Dahaba (1): Located in the eastern Nile Delta, the site measures 550 m × 750 m, with no vegetation, and appears to be a very lighter colored sandy tell. A well-planned town can be seen in a September 2011 satellite image. The remaining town measures 360 m × 460 m. There are clear roads running N-S and E-W, with one subsurface structure in the western part of the town measuring 30 m × 40 m. The buildings in the southern part of the town seem to be upper middle class in scale, measuring 17 m × 40 m, with 8–12 rooms, while there are 10 m × 10 m 4-room houses in the north, where the roads veer to the northeast; the town does not appear to be as well planned. There is one clearer 40 m × 60 m structure in the western part of the town. There are some similarities between this town and the Third Intermediate Period (ca. 1069 BC–712 BC) town mapped at Tanis, but given the regular layout of the streets, it is probably Ptolemaic-Roman Period (332 BC–395 AD) versus New Kingdom (ca. 1550 BC–1069 BC) (Figure 11). In the 1968 imagery, the site stood along the edge of Lake Manzala, and is now surrounded by agricultural fields.
Kom ed-Dahaba (2): Located in the western Nile Delta, the site measures 640 m × 220 m, and is mainly a sandy silt mound. The site is half-covered with grass and low-laying vegetation. Several rectilinear features appear in the western part of the site. They are most clear in October 2009 and 2011 images, and a late September 2009 image. The occupation time-period is unknown (Figure 12). In 1968, the site was devoid of any structures, but in the modern imagery, an installation (possibly military) covers 1/3 of the site.
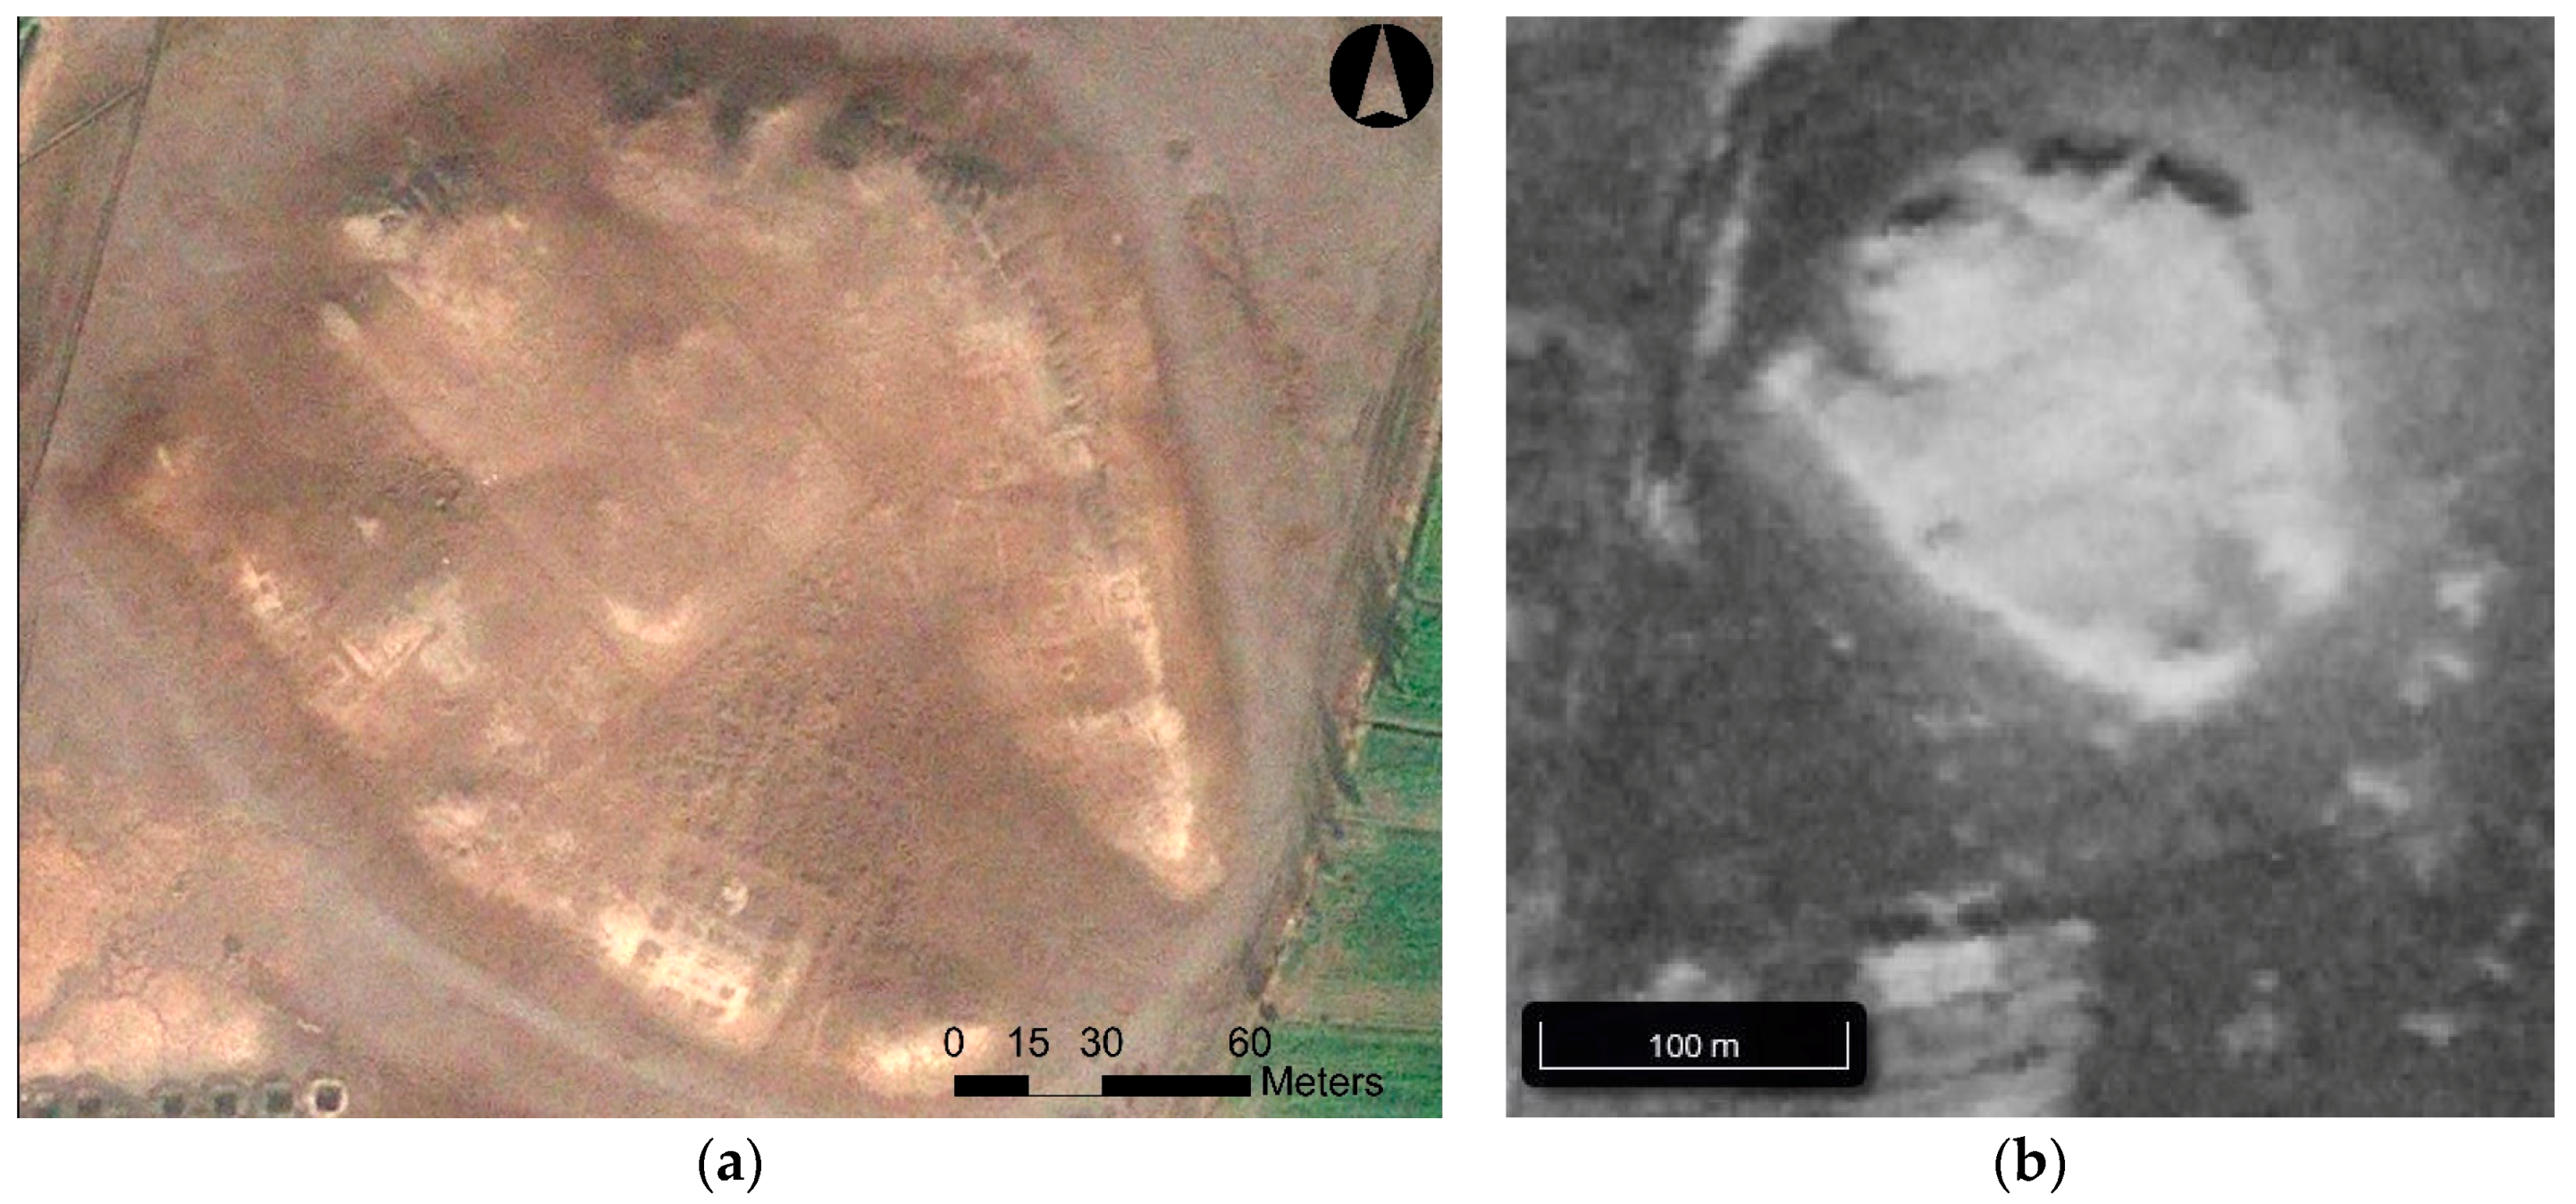
Tell el-Arab: Located in the eastern Nile Delta, the site measures 340 m × 230 m, and is comprised of silt with a comparatively lighter color than other sites investigated. There is no vegetation on the site except along the edges. A clear map of a subsurface settlement is apparent in a mid-September 2011 image, measuring 140 m × 170 m, dating from the Late Roman to Coptic Periods (ca. 395 AD–620 AD) [26] (Figure 13). Modern agriculture has cut the site in half since 1968, with evidence that it was once a part of Tell el-Ghuzz to the northwest.
Kom el-Arab: Located in the western Nile Delta, the site measures 560 m × 550 m, and is composed of a lighter colored sandy silt. Along its western edge, there is what appears to be a Roman Period settlement measuring 180 m × 130 m, appearing on a November satellite image. The site has Coptic-Islamic period pottery (ca. 395 AD–1517 AD) [26] (Figure 14). In 1968, the site was devoid of modern structures, and now, they cover 25% of the site, mainly in the south.
Kom el-Barud: Located in the western Nile Delta, the site measures 375 m × 250 m, composed of a lighter colored sandy silt, but 95% is covered with vegetation. On a late October 2011 image, multiple structures are evident through the vegetation. Previous survey work has shown the site dates to the Greco-Roman and Late Roman periods (332 BC–640 AD) [26] (Figure 15). The site appears unchanged in 50 years.
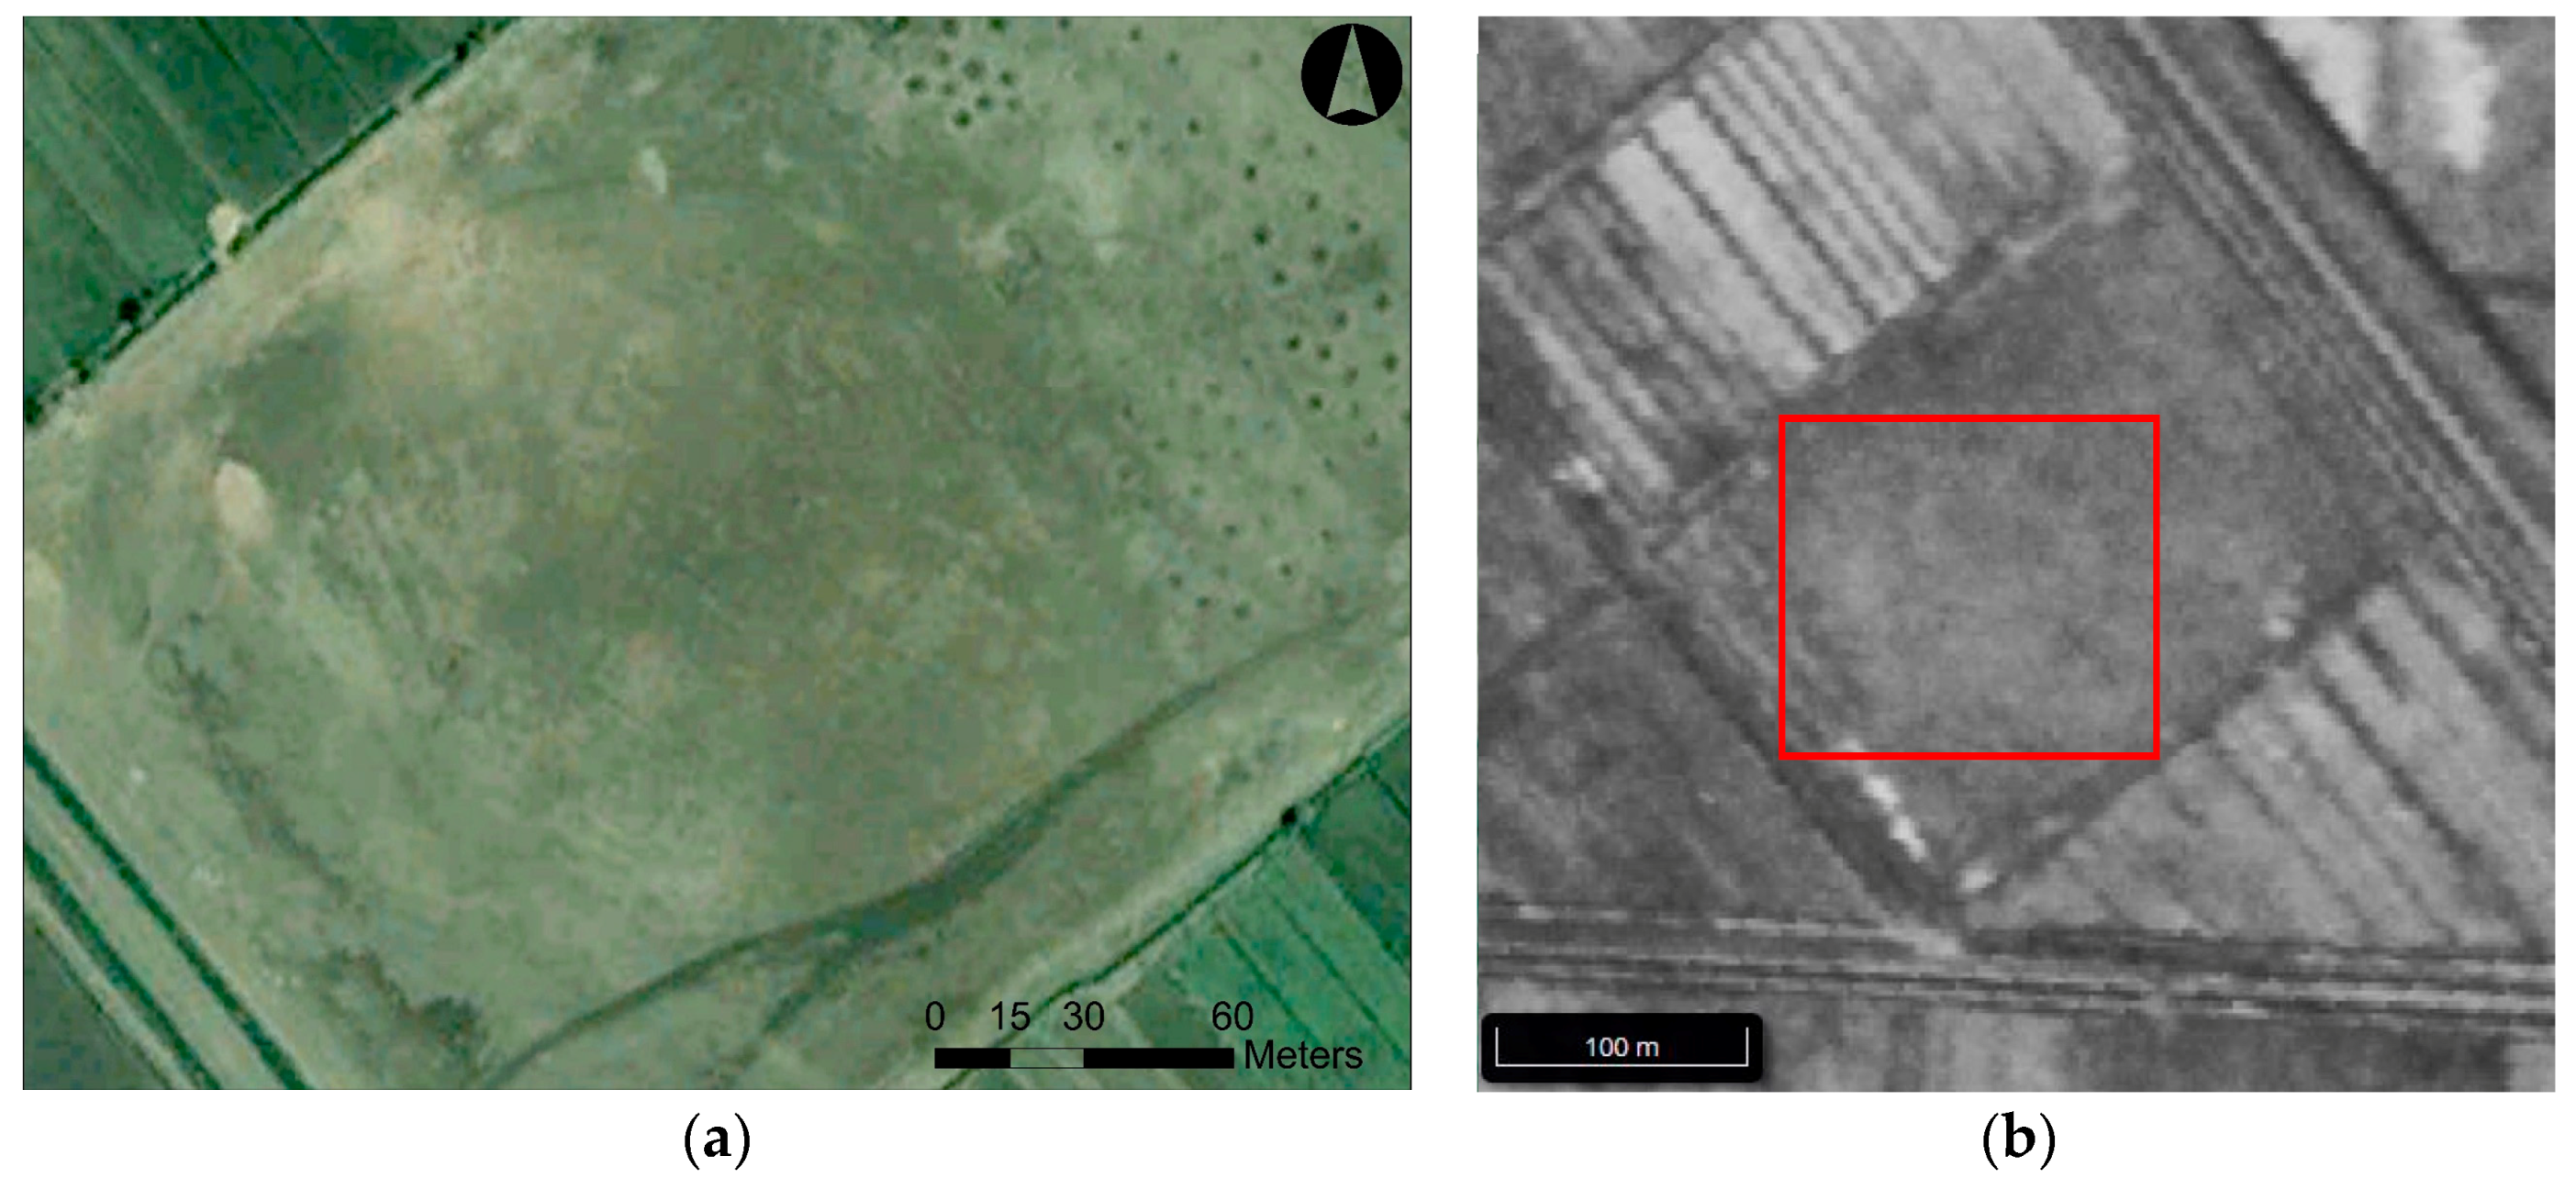
Kom el-Garad: Located in the western Nile Delta, the site measures 200 m × 170 m, and is composed of a lighter colored sandy silt with virtually no vegetation. In a mid-November 2011 image, a 125 m × 135 m settlement is apparent, with multiple structures. While the habitation time-period of the site is not known, the rectilinear layout of the housing is suggestive of the Roman Period (30 BC–395 AD) (Figure 16). The site does not appear to have changed in 50 years.
Tell Belim: Located in the eastern Nile Delta, the site measures 570 m × 1000 m, and contains a darker colored silt. This is a well-known site, under excavation 15 years ago by the Egypt Exploration society [27]. A great many structures, as well as the outline of a New Kingdom (ca. 1550 BC–1069 BC) temple enclosure wall [28], seen on satellite imagery and excavated by the EES, are apparent on a late July 2013 image, in what appears to be a period of inundation for the fields surrounding the site. It is curious that an image taken the very next day does not reveal as many structures. The temple enclosure is also visible on a 1935 RAF aerial photograph. The survey and excavation work date the site to the New Kingdom (ca. 1550 BC–1069 BC) and Ptolemaic-Late Roman periods (332 BC–640 AD) [26] (Figure 17). The site used to lie along the edge of Lake Manzala, and has been cut into by modern agriculture.
Tell Buweib: Located in the eastern Nile Delta, the site measures 535 m × 270 m, composed of a medium colored darker silt. It is a well-known site, with excavations taking place from 2004 onwards. On an early January 2010 image, the outline of structures and a temple enclosure wall are visible. The site dates from the New Kingdom (ca. 1550 BC–1069 BC) to Late Period. (ca. 712 BC–332 BC) [23,25] (Figure 18). The site looks like it has lost 25% of its area in the last 50 years due to expanding agricultural fields.
Tell el-Damalun: Located in the western Delta, the site measures 250 m × 550 m, and is composed of a medium colored sandy silt with limited vegetation along its southern side. A mid-September 2011 image displays the outline of structures. The site date is unknown, but the buildings are suggestive of the Roman Period (30 BC–395 AD) [26] (Figure 19). 10% of the site has been lost to agricultural expansion since 1968.
Tell el-Gassa: Located in the eastern Nile Delta, the site measures 340 m × 230 m, and has a medium colored sandy silt with limited vegetation along its northwestern side. In a mid-September 2011 image, the outline of structures is clear, including what appears to be a 12 m thick temple enclosure wall and the outline of the temple platform itself, measuring 15 m × 20 m. The structure could also be a fortress. There are multiple clear structures to the north of the enclosure wall. Previous survey work dates the site to the Late Roman Period (395–640 AD) [26] (Figure 20). The site was an island in 1968, located close to the shores of ancient Lake Manzala. It has now decreased in size by 50%.
Tell er-Ruhban: Located in the eastern Nile Delta, the site measured 260 m × 140 m in 2009, and is composed of a darker colored medium sandy silt. The mound measured 650 m × 350 m in 2004. In a late January 2010 image, clear rectilinear structures appear across the site. The occupation time-period is unknown (Figure 21).
Tell Mutubis: Located in the western Delta, the site measures 550 m × 500 m, and has a lighter colored sandy silt with 20% vegetation coverage. Mid-November 2011 imagery shows a series of clear rectilinear features in the southern part of the site. Previous survey work dates the site to the Greco-Roman through Islamic Periods (ca. 323 BC–1517 AD) [26] (Figure 22). The site seems unchanged in 50 years.
Tukh el Qaramus: Located in the western Nile Delta, the site measures 470 m × 580 m, composed of a reddish colored sandy silt with minimal vegetation coverage. Surveys by both the Liverpool University Delta Survey and the Amsterdam Delta Survey have mapped features on the site. Multiple structures appear in an early December 2009 satellite image, including a known temple of Philip Arrhideus, and potentially a second temple in the eastern part of the site (with the same shape and orientation of the known and excavated temple). The site dates from the Ptolemaic- Roman Periods (332 BC–395 AD) based on the survey findings [26,29] (Figure 23). The modern settlement atop the site has tripled in size in 50 years.
Umm el-Lahm: Located in the western Nile Delta, the site measures 190 m × 270 m, and is composed of a reddish colored dark silt with virtually no vegetation. In an early May image, there are faint traces of structures apparent in the central part of the mound. Previous work dates the site to the Ptolemaic-Roman periods (332 BC–395 AD) [23] (Figure 24). The site has been cut into in its southernmost corner since 1968.
Umm Gafar: Located in the western Nile Delta, the site measures 400 m × 320 m, and is composed of a medium colored sandy silt with limited vegetation along its northern side. A February 2015 image shows a well-planned settlement measuring 230 m × 280 m. Given that previous survey work has found Roman Period (30 BC–395 AD) sherds, the layout of the site may match this time-period as well [26] (Figure 25). The edges of the tell in 1968 are difficult to see, as it appears to be in a now dried up riverbed. It looks as though it has lost approximately 20% of its area, with modern buildings now on its southern side.
4. Discussion
4.1. Results from the Nile Delta Satellite Imagery Assessment
To locate potential features at archaeological sites in the Egyptian Nile Delta using open-source satellite imagery, one must consider the soil matrix each site, seasonality, weather, and inundation/growing seasons. These factors are just as important as imagery processing techniques, since different images of the same site from the summer versus fall may show clear features versus almost nothing, even with enhanced processing. The results from the aforementioned 20 sites show that 15 (75%) have features appearing in the drier September-December time-period. In fact, 100% of lighter sandy sites had their features appear more clearly during these dry months. The same two images (16 September 2011; 10 November 2011) captured visible surface features for 10 separate locations. The remaining five sites with medium reddish silt on their surfaces varied slightly regarding the optimum time-period for revealing subsurface features. Three of the sites had features appear during the wetter January-February months. Of the two remaining sites, one was affected by summer inundation levels. It became clear while examining between 5 and 20 images per site (ranging from 2002 to 2016) that the specific weather conditions as well as the inundation of the fields played an essential role in feature visibility. For example, at Tell Belim, an image from 30 July 2013 had features easier to visualize versus an 1 August 2013 image. On 30 July, the fields surrounding the site were clearly inundated with water, while on the next day they did not appear to be as fully inundated. With Google Earth containing so many images across a long time-period, archaeologists can study these images of their sites, or similar sites, prior to purchasing specific imagery to determine which seasons or years might be most appropriate.
It is essential to recognize why features did not appear on some of the satellite imagery of the same locations. There are over 700 sites in the Egyptian Exploration Society Delta survey, and 1200 additional potential sites that appeared in our imagery analysis (most of which are beneath modern towns). Buried features only appear when the image is taken at the right time of year, including wetter weather conditions, with the “best” soil type (sandier soil versus siltier soil), and higher groundwater levels. While additional images have been taken in the last three years, prior to that, imagery choices can be limited, and may not be from the time of year when there was sufficient rain or inundated fields for optimate imagery analysis. On many satellite images, vegetation is dense. In some cases, the vegetation reveals buried walls, but if it is too bushy or dense, it is not possible to see anything. Heavy looting, which sadly shows up on dozens of Nile Delta sites, may also have destroyed the visible surface features. Overall, 25% of the study sites remain unchanged in 50 years. 50% of the sites have shrunk from 10 to 50% of their total area. Since these sites are a good representation of sites across the Delta, this is of great concern. 15% used to lie along Lake Manzala, which has shrunk considerably in the past 50 years. 15% have had villages on top of them double or triple in size. 10% of the sites have had other buildings constructed on them (military or private compounds).
Given these results, we can compare space based visual feature detection to ground based remote sensing. A space-based approach can be carried out in an efficient way using Google Earth if one knows the locations of sites. The main challenge is data availability. Most sites in the Delta have 10+ satellite images, with over 50% of the images being taken in the last 3–4 years. If the site’s upper matrix is sandier in composition, there is no guarantee that data will emerge during a drier fall period, or that imagery might exist from when standing water surrounds the site.
Assuming there is good data from the right time of year, season, or inundation conditions, what about the quality of the data? Of the 20 sites mapped, five sites displayed features like walls or single structures (Abu el Humar, Kom Biltus, Kom Bunduq, Kom ed-Dahaba 2, Kom el-Barud), and eight sites had areas containing interconnected buildings under 1 ha. (100 m × 100 m) (Abu Mitawi, Daba el-Qibli, Tell Belim, Tell Buweib, Tell el-Damalun, Tell el-Gassa, Tell Mutubis, Tukh el-Qaramus). There were four sites that contained site outlines greater than a hectare (Tell el-Arab, Kom el-Arab, Kom el-Garad). Three sites (Kom ed-Dahaba 1, Tell er-Ruhban, Umm Gafar), yielded features across their remaining surfaces, greater than 200 m × 200 m in size. 65% of the sites examined might have shown additional features if higher resolution multispectral imagery were purchased and processed. Additional data is needed from other times of year. Typically, if subsurface features show up in visual site assessment alone, then additional buried features will appear after the application of algorithms. This multi-image assessment is indeed a crucial first step for further remote sensing work at optimum locations. 35% of the sites using visual assessment alone had enough data to begin comparative work against known excavated examples of sites from similar time periods. While it was possible to see large subsurface settlement remains in 15% of the sites, only two (Tell er-Ruhban and Kom ed-Dahaba 1) had data of the same size and quality one would expect from ground based remote sensing. Kom ed-Dahaba 1 represents the most detailed settlement map result from this research effort. Similarly, even the most detailed magnetometer maps may not be complete [30], like the gaps seen in some of the visible surface remains in the satellite imagery.
4.2. Results from the Tell Tebilla Excavations
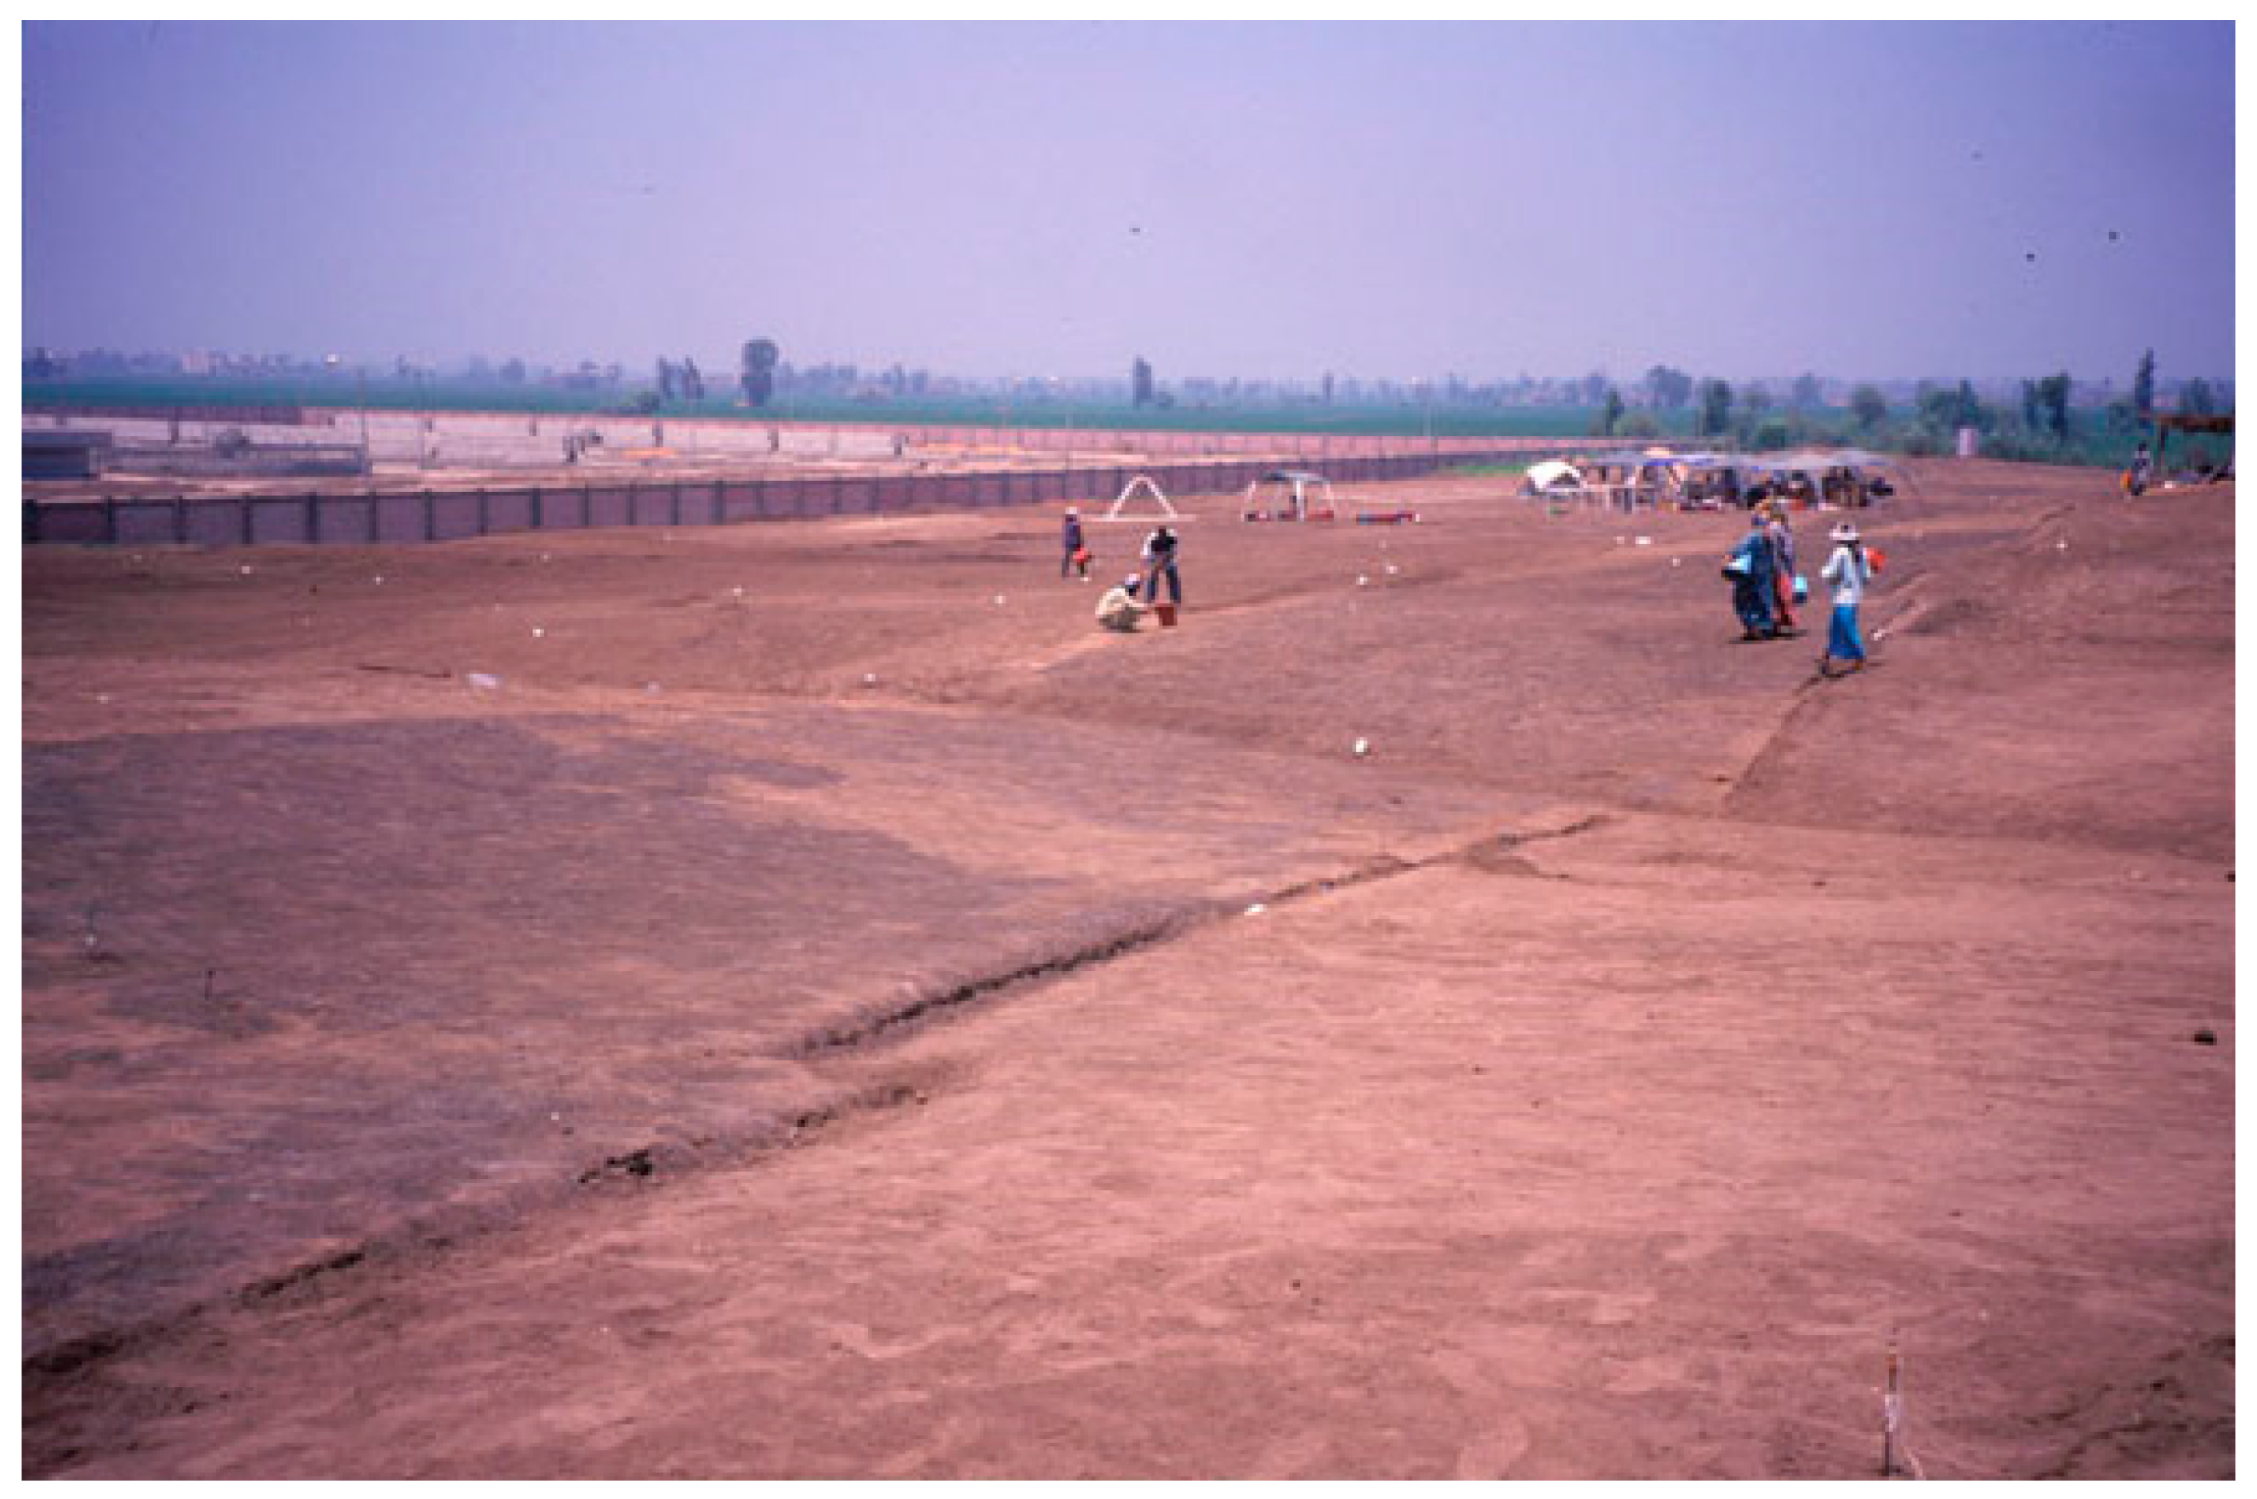
G. Mumford, director of the Tell Tebilla project, compared a copy of the satellite image with the exposed stratigraphy along the west side of the mound to locate the enclosure wall. During the 2003 season, the excavation team explored the western side of Tell Tebilla, beginning with part of an exposed section revealed by the recent construction of a water plant. The team scraped along the edges of the tell and found a mud brick wall measuring 11.5 m wide, representing a southern cross-section through the enclosure wall’s foundation. Ten cm of loose degraded clay and occupation debris covered the wall, which the team cleared and 100-m to the east and then 280-m north.
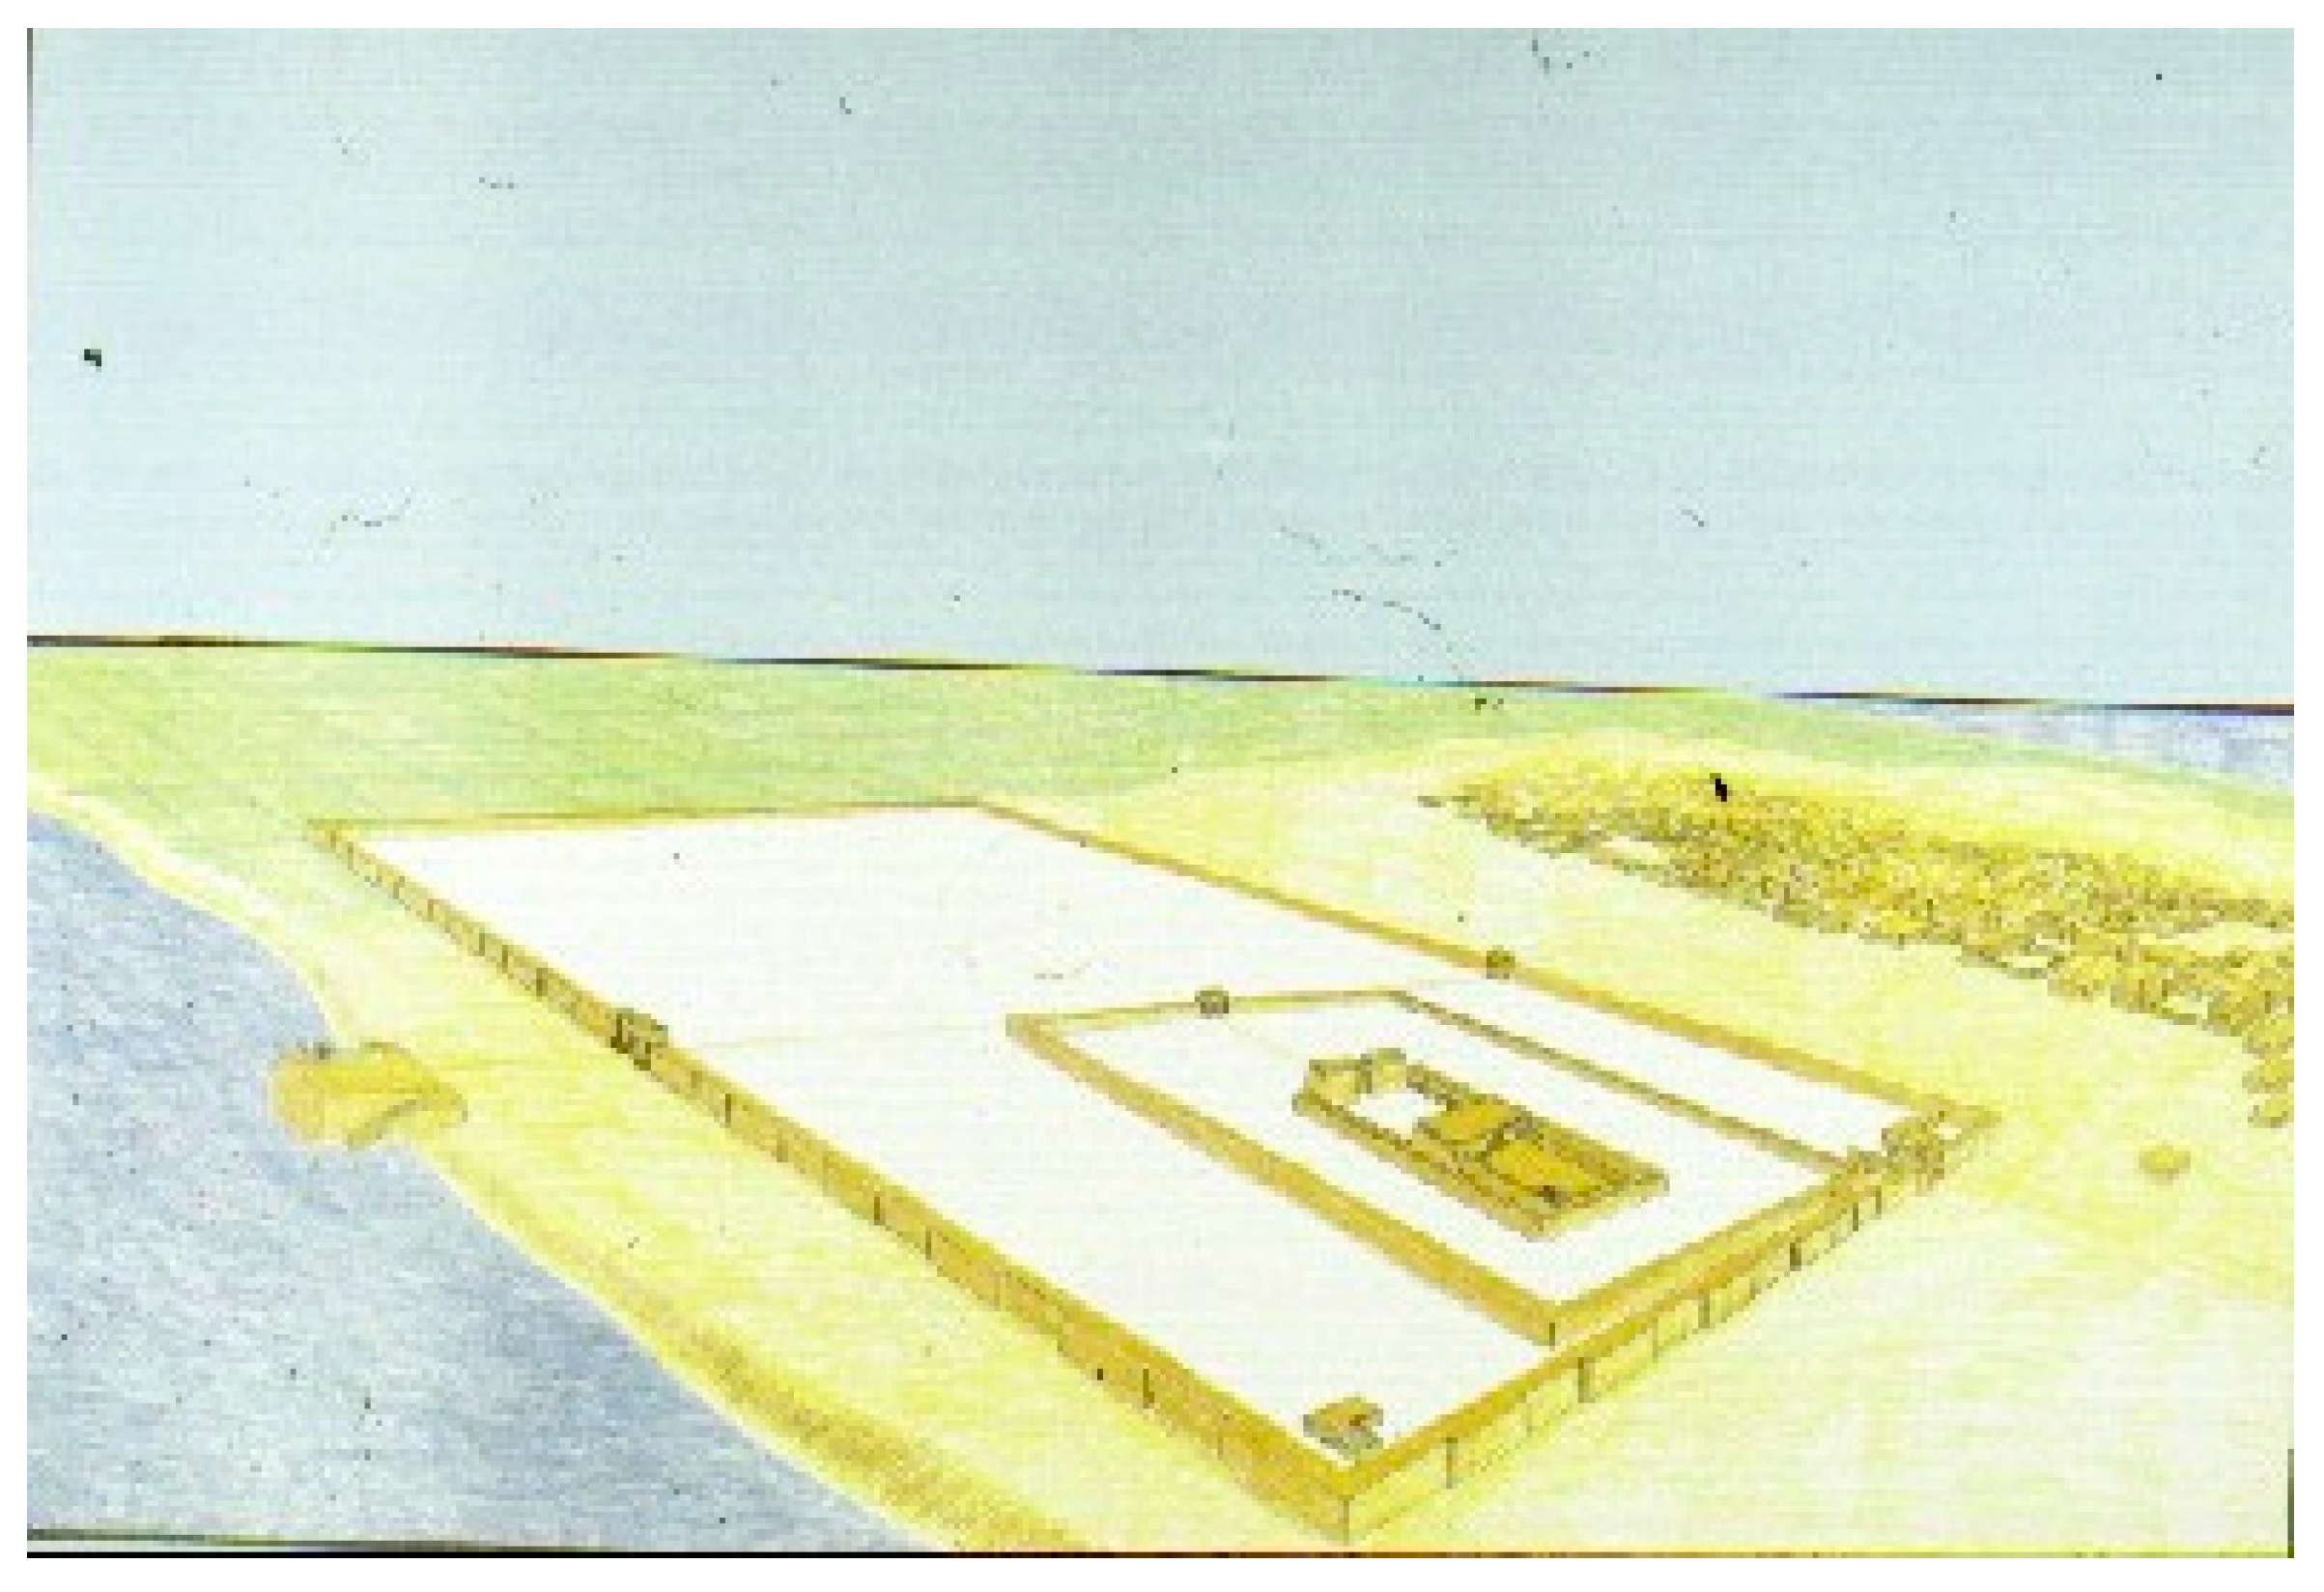
Overall, the structure measured 235-m east-west. The southeastern and southwestern corners were preserved, with the northeastern corner laying beneath modern rice fields. The wall is between 10.50 m and 11.50 m wide, with a series of slight buttresses on the eastern and southern exterior. We also know that a 13.50 m wide foundation trench had cut through Third Intermediate Period (ca. 1069 BC–712 BC), to Dynasty 26 mastabas (664 BC–525 BC) (Figure 18). It seems likely that the structure represents a “fort”-temple or temple enclosure of Nectanebo I/II, constructed along this branch of the Nile (Figure 26), possibly fortifying the area in expectation of an invasion by the Persians around 343 BC. It did not last for long: the Persians likely destroyed it at Mendes and elsewhere, leaving only the foundations [31,32]. Although only the temple enclosure wall’s foundations remain, the degraded matrix above it had absorbed moisture in such a way as to reflect light differently from the slightly different surface layer around it, making the wall quite visible on the CORONA imagery. It must be noted that only when walls are of sufficient thickness is it possible to detect them on CORONA imagery. With a one-two meter pixel resolution, 11-m wide walls covered with ten to thirty-cm of overlaying debris will still appear quite clearly. Overall, the temple enclosure wall at Tell Tebilla measures 25% of the size of the mud brick enclosure found at Mendes, and fits in as a medium sized enclosure wall compared with other Egyptian temple enclosure walls dating to the same period [19].
4.3. Comparing Space-Based Remote Sensing Results to Ground Based Remote Sensing at Tell Tebilla
The CORONA imagery helped to reveal the temple enclosure wall at Tell Tebilla, yet only faint features are apparent on Google Earth imagery. The soil at Tebilla has higher concentrations of silt and less sand compared to the other sites in this study. The CORONA imagery only showed the large enclosure wall but no other features, likely because the other buried walls are 1 m or less in width. The magnetometer survey only caught part of the temple enclosure wall, and it was impossible to discern the exact nature of the wall from the smaller survey area. This shows one limitation of magnetometer surveys: with limited time in the field, it is possible to miss larger features. However, the magnetometer survey shows far greater detail across a site when compared with open-access imagery results. Magnetometer survey would have likely shown clear features at nearly all the tell sites described in this report. We cannot say for sure if 100% of these sites could be surveyed on the ground due to soil types, metal debris and proximity to power lines. At sites like Tell Tebilla, magnetometer survey is the best option, with a high degree of correlation between the excavated structures and the outlines seen in the magnetometer results
5. Conclusions
Overall, this is a way to target and scale ground based remote sensing and make it more effective. Ground based remote sensing can also fill in gaps that visual satellite data does not capture. Permits in Egypt are granted for regional survey, but it is rare to get permission to do ground-based remote sensing at more than one site. Satellites could help teams to target clear areas with near-surface remains. Magnetometer survey has proven effective for subsurface survey in Egypt’s Delta, but may not always work given potential metal waste on sites. Would magnetometer survey work still be necessary at the three sites with greater than 200 m × 200 m of their near-surface structures visible? There were certainly gaps within and around those blocks of structures, and the detail in some areas was clearer than others. Smaller rooms (1 m or less in width) appeared blurry. The overall detail of structures seen on those three sites appeared like standard magnetometer surveys, but they only represent 15% of the sites mapped. The numbers of sites with this level of features apparent may be higher, but we await the release of satellite data from other times of year.
Every high-resolution satellite image is not on Google Earth. Once the time of year is known that works for visual subsurface feature detection from the open-access data, imagery can be purchased for a site or sites in question, even if the data is greyscale. This would be worth the $200.00–$500.00 in investment (with archive data costing between $8.00–$20.00 per sq. km) compared to the overall cost of magnetometer or other subsurface survey without any good satellite data. The cost of a specialist in the field, including plane ticket, lodging, food, cost per day of effort, and post processing, can run into thousands of dollars. It becomes a high-cost risk in relationship to typical excavation budgets and fieldwork windows to have them come out to survey a site nearly blind. The satellite data, if the conditions are right, might be able to direct the location of the ground-based remote sensing efforts.
With the varied clear threats to many known, little known, and unknown sites in Egypt, what might be done to hasten their mapping and protection? Presently, we are engaged in a collaborative training project with Egypt’s Ministry of Antiquities via the Lisht Mission field school. Egyptian archaeologists are being trained in free access satellite mapping tools like Google Earth, and then are taking the data to examine potential findings in the field locally. This began in 2016, and will continue in 2017. In addition to Google Earth, students will be trained on NASA data, as well as the CAST CORONA platform. They have been, and will continue to be taught how much landscapes can change over time, affecting site preservation efforts. In the long term, it is hoped that the training and analysis done during the field school will give each participant a starting point for survey work in their own inspectorate regions. Access to good satellite maps is a challenge to all archaeological projects in countries where these data are too expensive or difficult to access. This is a point that all our field school students and local project collaborators have emphasized. Poor internet connections and accessing Google Earth are a significant challenge in rural areas, which is why we will be using WIFI boosting service BRCK [33] for our Lisht field school. The Ministry of Antiquities did have an ongoing mapping branch, called the Egyptian Antiquities Information System (EAIS) [34]. Starting as an Egyptian–Finnish project, this aimed to map sites across Egypt and create a comprehensive GIS. Presently, it is part of the MoA, but does not have the same levels of funding.
The monitoring of archaeological sites has become more critical. It does not depend on the season, but imagery does need to be taken every few months. This was not the case prior to 2013, but since then, imagery has become more frequent in the Delta region. It is now possible to see ongoing agricultural and urban encroachment, or in desert areas, illegal quarrying and cemetery construction. In the coastal Delta areas, one can map rising ground water levels.
In future, Egyptologists might consider crowdsourcing of satellite data (with protective measures ensuring site location masking) to assist with examining regional efforts to detect potential new sites, as well as tracking site changes through time using CORONA data. While the looting project took 3 people 6 intensive months, examining the entirety of Egypt’s flood plain, including the Eastern Desert and Western Desert would take far longer. However, having thousands of people examine the data using crowdsourcing would allow this to be done in a matter of months. An initial concern would be access by looters and looting. Would there be any way to mask the satellite data effectively to prevent specific site identification?
We have overcome this concern with Globalxplorer (GX) [35], an online citizen science satellite imagery crowdsourcing platform that launched in January 2017. The official campaign “ended” in late April 2017, but it is still possible to participate. Over 60,000 individuals from 200 countries took part in GX, finding thousands of potential anthropogenic features in Peru (the country where the first campaign is based). Platform design played a key role in ensuring that no site identification of looting could take place. GX users, after taking a tutorial and seeing many examples of site looting, join the looting detection campaign. They are given a 300 m × 300 m satellite image clip of an undisclosed location somewhere in Peru. There are no visible maps, no GPS coordinates, and no indications of where you might be. A user can vote “looting” or “no looting” on the visible image. The same goes for the feature detection part of the campaign, where a vote is possible for “feature” or “no feature.” One image might be in northern Peru, the next might be in southwestern Peru. The only people that can see actual site locations are the GX back end team, who evaluate each site seen by the crowd. Final map data is being shared only with professional Andean archaeologists and Peru’s Ministry of Culture for ground truthing efforts.
A similar campaign could be done in Egypt in full collaboration with Egypt’s Ministry of Antiquities. Instead of finding new sites or mapping looting, the crowd could assist with landscape changes and threats to sites via modern development. They could look at CORONA imagery alongside high resolution site data from the past 15 years. There are 1930s aerial photographs available for the Luxor and Giza regions, but no entity has yet fully digitized them. Apparently, the UK RAF has full aerial coverage of Egypt from the 1930s and 1940s, but attempts by S. Parcak to obtain these data has failed.
Egyptologists may use Google Earth imagery or DigitalGlobe data, but not realize that the time of year is an essential factor for revealing potential subsurface features. There needs to be better training for Egyptologists, or specialists working with them, on open source data and how to obtain and use satellite imagery appropriately in their projects. While many remote sensing papers appear on the archaeology of other countries in the ancient Near East, not as many papers can be seen for Egyptology, especially for survey efforts. This must change. DigitalGlobe and other satellite companies might be encouraged to collect additional data from the Middle East and North Africa regions during the wetter winter months, especially after periods of rainfall when subsurface features can appear in site imagery.
It is clear from this assessment of archaeological sites in the Delta that many of its sites are at risk from partial to total loss in the coming decades. Survey efforts by groups like the EES Delta survey and others is commendable, but they are composed of small teams of dedicated individuals. What is needed as a first step is a total geospatial assessment of the highest at-risk sites in the Egyptian Delta to focus ground-based remote sensing survey and excavation efforts. This is not unlike the multinational survey efforts around Aswan with the dam construction in the 1960s to 1970s. Resources can and should be pooled by nations for ground work to map sites as quickly as possible. The time has come for a concerted and focused effort by the entire Egyptology community, before many of these sites are either obscured from space or more fully eradicated.
Acknowledgments
Funding support for this research came from the National Geographic Society; The National Science Foundation, the Social Sciences and Humanities Research Council of Canada, and private donors. We wish to thank Egypt’s Ministry of Antiquities for their ongoing support of our research, especially Minister of Antiquities Khaled el Anany, Aynman Eshmawy, Mohammed el Badaie, Mohammed Ismail, Adel Okasha, and Sharif Abd el Monaem.
Author Contributions
Sarah Parcak, Greg Mumford, and Chase Childs conceived and designed the experiments; Sarah Parcak, Chase Childs and Gregory Mumford performed the experiments; Sarah Parcak and Chase Childs analyzed the data; Gregory Mumford contributed analysis tools; Sarah Parcak, Greg Mumford, and Chase Childs wrote the paper.
Conflicts of Interest
Sarah Parcak is President of the Board of Globalxplorer. She is also an archaeology Fellow with the National Geographic Society. Chase Childs is Executive Director of Globalxplorer.
References
- Challis, K.; Priestnall, G.; Gardner, A.; Henderson, J.; O’Hara, S. Corona remotely-sensed imagery in Dryland archaeology: The islamic city of al-Raqqa, Syria. J. Field Archaeol. 2002–2004, 29, 139–153. [Google Scholar] [CrossRef]
- Hritz, C. Tracing settlement patterns and channel systems in Southern Mesopotamia using remote sensing. J. Field Archaeol. 2010, 35, 184–203. [Google Scholar] [CrossRef]
- Kennedy, D. Declassified satellite photographs and archaeology in the Middle East: Case studies from Turkey. Antiquity 1998, 72, 553–561. [Google Scholar] [CrossRef]
- Wilkinson, T. Surface collection, field walking, theory and practice, sampling theories. In Handbook of Archaeological Sciences; Pollard, A., Brothwell, D., Eds.; John Wiley: New York, NY, USA, 2001. [Google Scholar]
- Stone, E. Patterns of looting in southern Iraq. Antiquity 2008, 82, 125–138. [Google Scholar] [CrossRef]
- Parcak, S. Going, going, gone: Towards a satellite remote sensing methodology for monitoring archaeological tell sites under threat in the Middle East. J. Field Archaeol. 2007, 42, 61–83. [Google Scholar]
- Menze, B.; Ur, J. Mapping patterns of long-term settlement in Northern Mesopotamia at a large scale. Proc. Natl. Acad. Sci. USA 2012, 109, E778–E787. [Google Scholar] [CrossRef] [PubMed] [Green Version]
- Casana, J.; Panahipour, N. Notes on a disappearing past: Satellite-based monitoring of looting and damage to archaeological sites in Syria. J. East. Mediterr. Heritage Stud. 2012, 2, 128–151. [Google Scholar]
- American Association for the Advancement of Science (AAAS). Ancient History, Modern Destruction: Assessing the Current Status of Syria’s World Heritage Sites Using High-Resolution Satellite Imagery; AAAS: Washington, DC, USA, 2014. [Google Scholar]
- Contreras, D.; Brodie, N. The utility of publicly-available satellite imagery for investigating looting of archaeological sites in Jordan. J. Field Archaeol. 2010, 35, 101–114. [Google Scholar] [CrossRef]
- Parcak, S. Archaeological looting in Egypt: A geospatial View (case studies from Saqqara, Lisht, and el Hibeh). Near East. Archaeol. 2015, 78, 196–203. [Google Scholar] [CrossRef]
- Parcak, S.; Gathings, D.; Childs, C.; Mumford, G.; Cline, E. Satellite evidence of archaeological site looting in Egypt: 2002–2013. Antiquity 2016, 90, 188–205. [Google Scholar] [CrossRef]
- Wilkinson, T.J.; Ur, J.; Casana, J. Nucleation to dispersal: Trends in settlement patterns in the northern Fertile Crescent. In Side-by-Side Survey: Comparative Regional Studies in the Mediterranean World; Alcock, S., Cherry, J., Eds.; Oxbow: Oxford, UK, 2004; pp. 198–205. ISBN 1842170961. [Google Scholar]
- Ur, J. Corona satellite photography ancient road networks: A northern Mesopotamian case study. Antiquity 2003, 77, 102–115. [Google Scholar] [CrossRef]
- Ur, J. Sennacherib’s northern Assyrian canals: New insights from satellite imagery and aerial photographs. Iraq 2005, 67, 317–345. [Google Scholar] [CrossRef]
- Moshier, S.; El-Kalani, A. Late Bronze Age Paleogeography along the ancient ways of Horus in Northwest Sinai, Egypt. Geoarchaeology 2008, 23, 450–473. [Google Scholar] [CrossRef]
- Corona Atlas & Referencing System. Available online: http://CORONA.cast.uark.edu/ (accessed on 19 September 2017).
- Casana, J.; Cothren, J. The Corona Atlas Project: Orthorectification of corona satellite imagery and regional-scale archaeological exploration in the near east. In Mapping Archaeological Landscapes from Space; Comer, D., Harrower, M., Eds.; Springer: New York, NY, USA, 2013; pp. 33–43. ISBN 978-1-4614-6073-2. [Google Scholar]
- Mumford, G. Reconstruction of the temple at Tell Tebilla (East Delta). In Egypt, Israel and the Ancient Mediterranean World: Studies in Honour of Donald B. Redford; Knoppers, G., Hirsch, A., Eds.; Brill: Leiden, The Netherlands, 2002; pp. 267–286. ISBN 9789004138445. [Google Scholar]
- Mumford, G. Concerning the 2001 Season at Tell Tebilla (Mendesian Nome). In The Akhenaten Temple Project Newsletter; Pennsylvania State University: College Park, PA, USA, 2002; pp. 1–4. [Google Scholar]
- Mumford, G. The University of Toronto Tell Tebilla Project (Eastern Delta). The American Research Center in Egypt Annual Report, 2001; Emory University West Campus: Atlanta, GA, USA, 2001; pp. 26–27. [Google Scholar]
- Pavlish, L. 2004 Archaeometry at Mendes, 1990–2002. In Egypt, Israel and the Ancient Mediterranean World: Studies in Honour of Donald B. Redford; Knoppers, G., Hirsch, A., Eds.; Brill: Leiden, The Netherlands, 2002; pp. 61–112. ISBN 789004138445. [Google Scholar]
- Becker, H.; Fassbinder, J. In search of Piramesses—The lost capital of Ramesses II in the Nile Delta (Egypt) by caesium magnetometry. In Archaeological Prospection, Arbeitshefte des Bayerischen Landesamtes für Denkmalpflege; Fassbinder, J., Irlinger, W., Petzet, M., Eds.; Bayerischen Landesamtes für Denkmalpflege: München, Germany, 1999; pp. 146–150. ISBN 387499699X. [Google Scholar]
- Mathieson, I. The National Museums of Scotland Saqqara Survey Project, 1990–2000. In Abusir and Saqqara in the year 2000; Bárta, M., Krejčí, J., Eds.; Archiv Orientalni: Prague, Czech Republic, 2002; pp. 27–39. ISBN 8085425394. [Google Scholar]
- Herbich, T. Archaeological geophysics in Egypt: The Polish contribution. Archaeol. Pol. 2003, 41, 13–56. [Google Scholar]
- Egypt Exploration Society Delta Survey Website. Available online: http://deltasurvey.ees.ac.uk/ds-home.html (accessed on 12 July 2017).
- Spencer, A. The exploration of Tell Belim, 1999–2002. J. Egypt. Archaeol. 2002, 88, 37–51. [Google Scholar] [CrossRef]
- Spencer, A.; Spencer, P. A new kingdom temple in the Delta. Egypt. Archaeol. 2004, 45, 5–8. [Google Scholar]
- Milne, J. The Tukh el-Qaramus Gold Hoard. J. Egypt. Archaeol. 1941, 27, 135–137. [Google Scholar] [CrossRef]
- Spencer, N. Kom Firin I: The Ramesside Temple and the Site Survey; British Museum Research Publication 170; British Museum Press: London, UK, 2008; ISBN 978-086159-170-1. [Google Scholar]
- Lloyd, A. The Late Period, 664–323 BC. In Ancient Egypt: A Social History; Trigger, B., Kemp, B., O’Connor, D., Lloyd, A., Eds.; Cambridge University Press: Cambridge, UK, 1983; pp. 279–348. ISBN 0521284279. [Google Scholar]
- Mumford, G. A late period riverine and maritime port town and cult center at Tell Tebilla (Ro-Nefer). J. Anc. Egypt. Interconnect. 2013, 5, 38–67. [Google Scholar]
- Connecting Africa to the Internet. Available online: https://www.brck.com/ (accessed on 19 September 2017).
- The Egyptian Antiquities Information System. Available online: http://www.arce.org/files/resource/h/rsrc/EAIS_July_2003.pdf (accessed on 19 September 2017).
- Globalxplorer. Available online: https://www.globalxplorer.org (accessed on 19 September 2017).
Figure 1.
Location of Tell Tebilla, Eastern Delta, Egypt. Imagery courtesy Chase Childs.
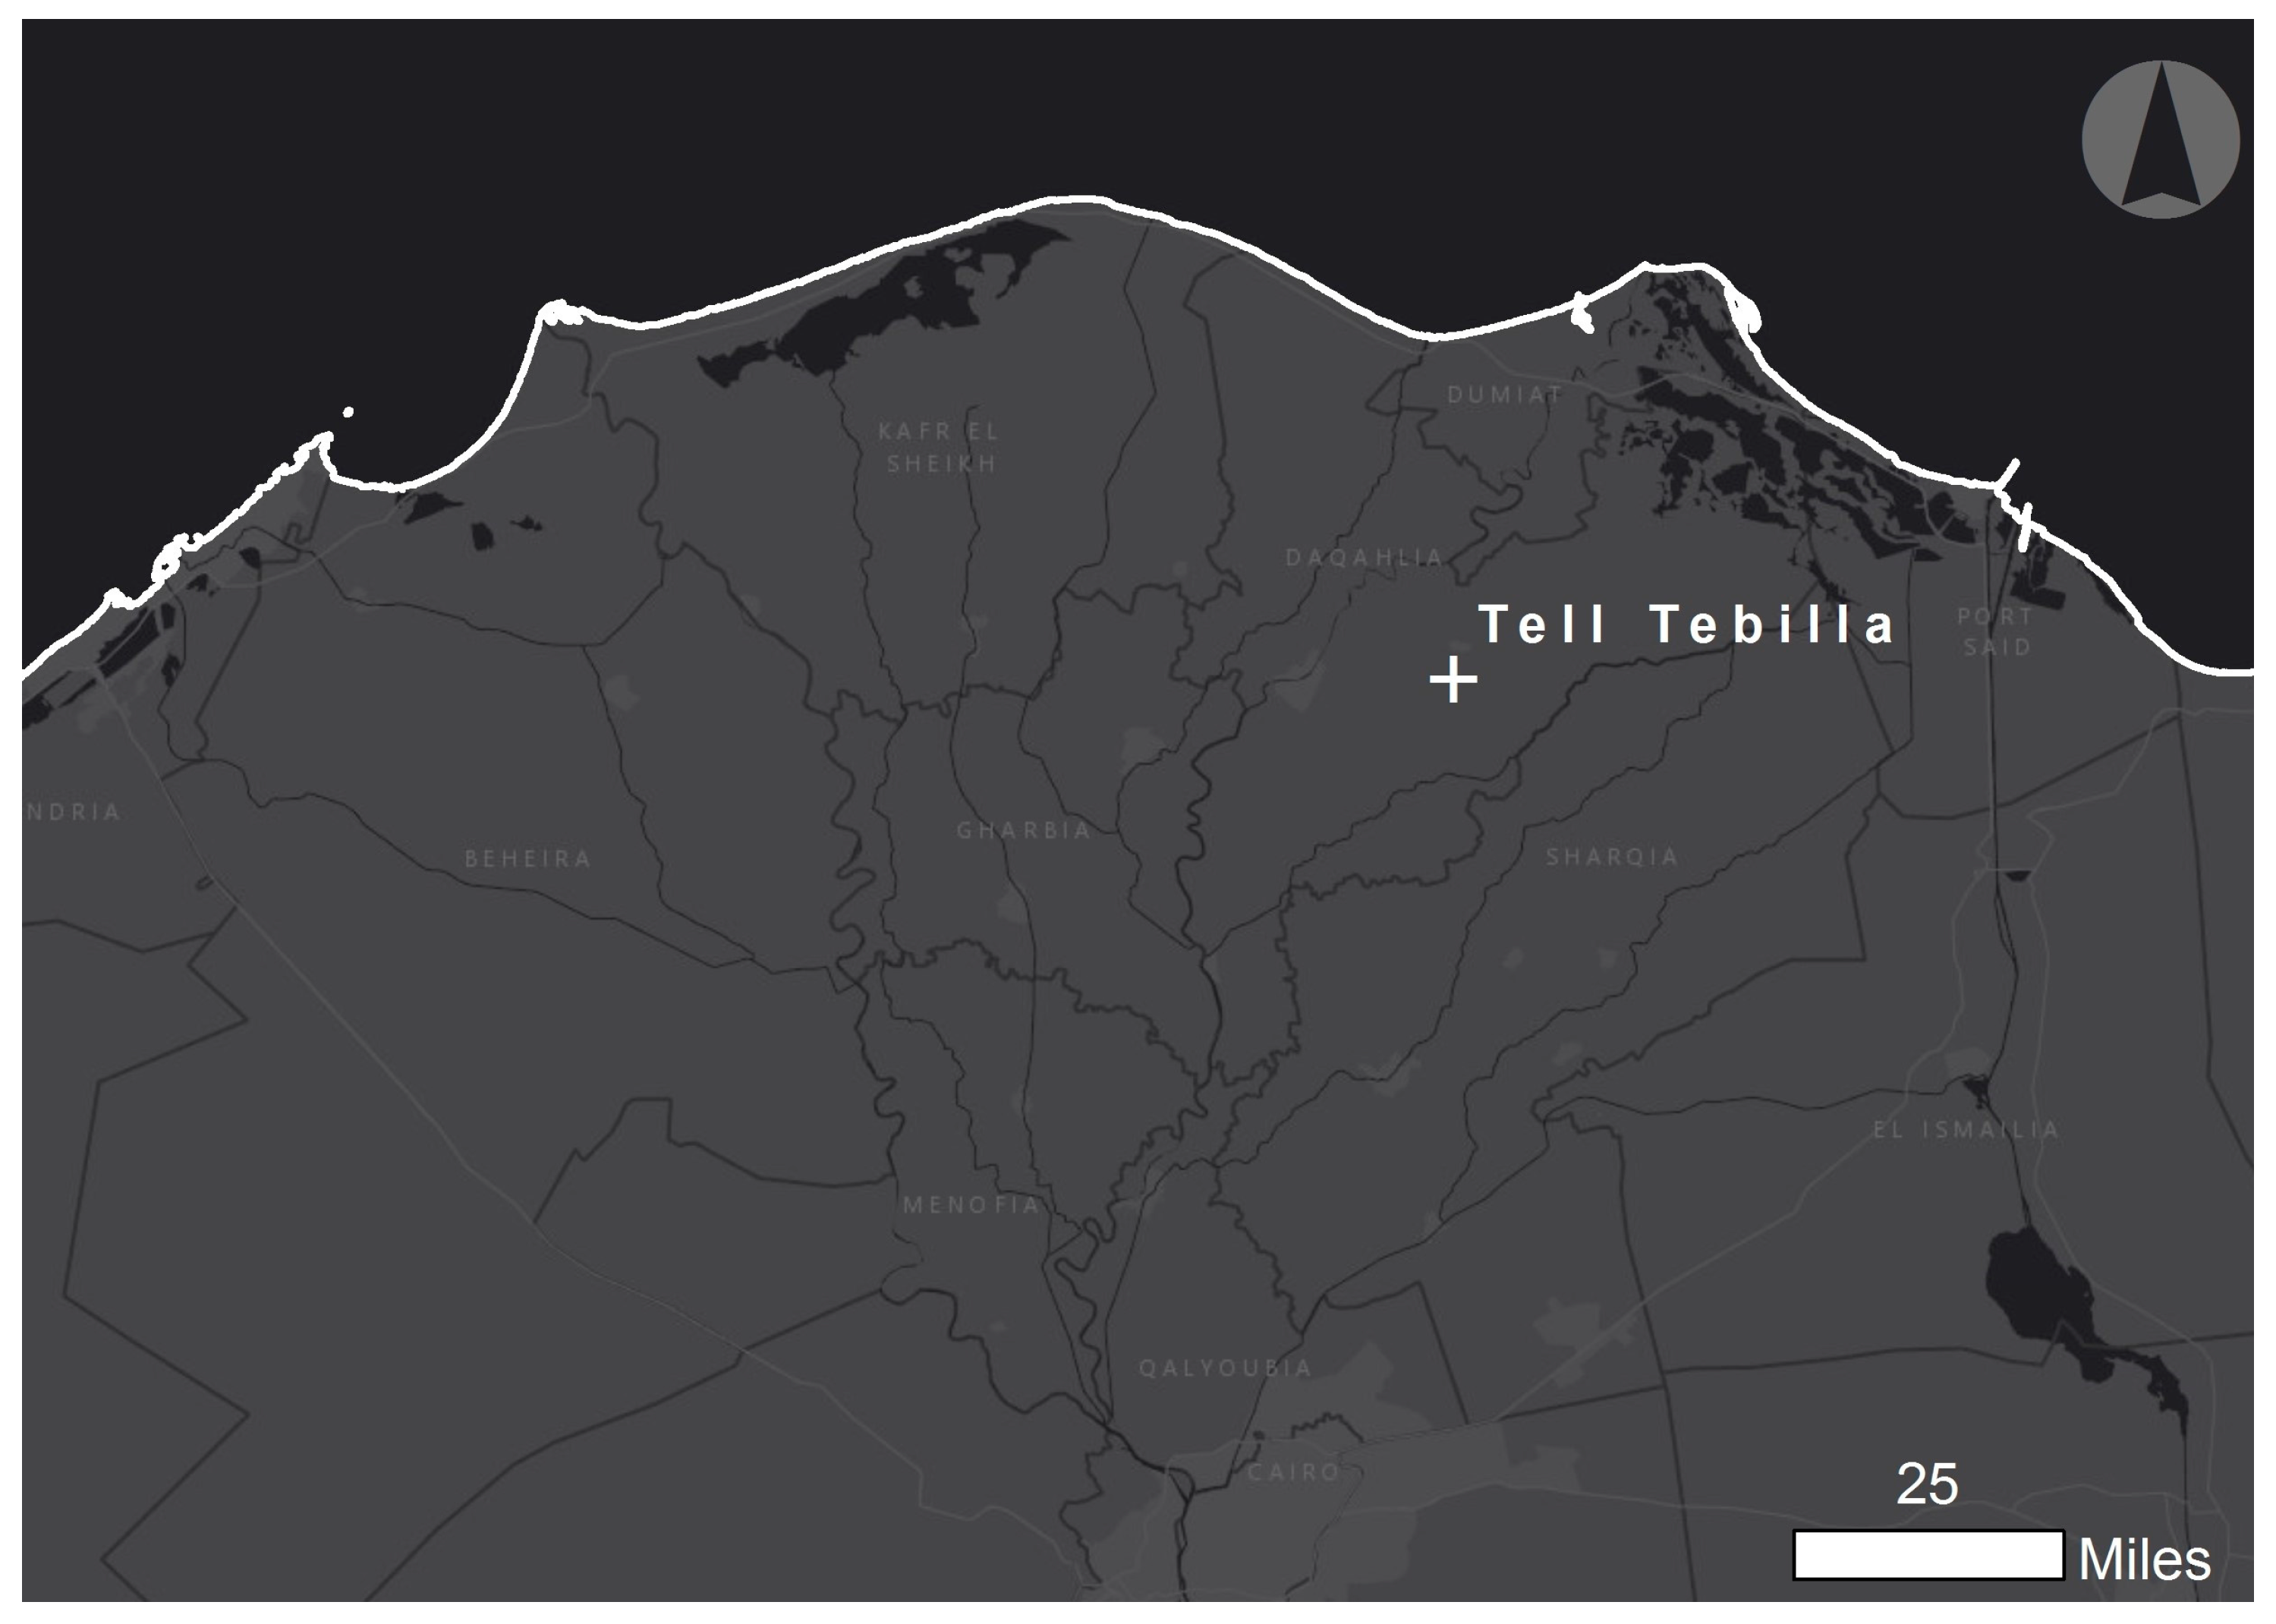
Figure 2.
CORONA KH-4B satellite image of Tell Tebilla, taken in 1972. Note the red arrow pointing to the enclosure wall of the Late Period (ca. 712–332 BC) temple. Imagery courtesy of the Center for Advanced Spatial Technologies, University of Arkansas/U.S. Geological Survey.
Figure 2.
CORONA KH-4B satellite image of Tell Tebilla, taken in 1972. Note the red arrow pointing to the enclosure wall of the Late Period (ca. 712–332 BC) temple. Imagery courtesy of the Center for Advanced Spatial Technologies, University of Arkansas/U.S. Geological Survey.

Figure 3.
Excavating the eastern side of the mudbrick enclosure wall, 2003 Tell Tebilla project. The modern water plant is in the background. Imagery courtesy of S. Parcak.
Figure 3.
Excavating the eastern side of the mudbrick enclosure wall, 2003 Tell Tebilla project. The modern water plant is in the background. Imagery courtesy of S. Parcak.

Figure 4.
Map of key sites where magnetometry work has taken place. Image courtesy Chase Childs.
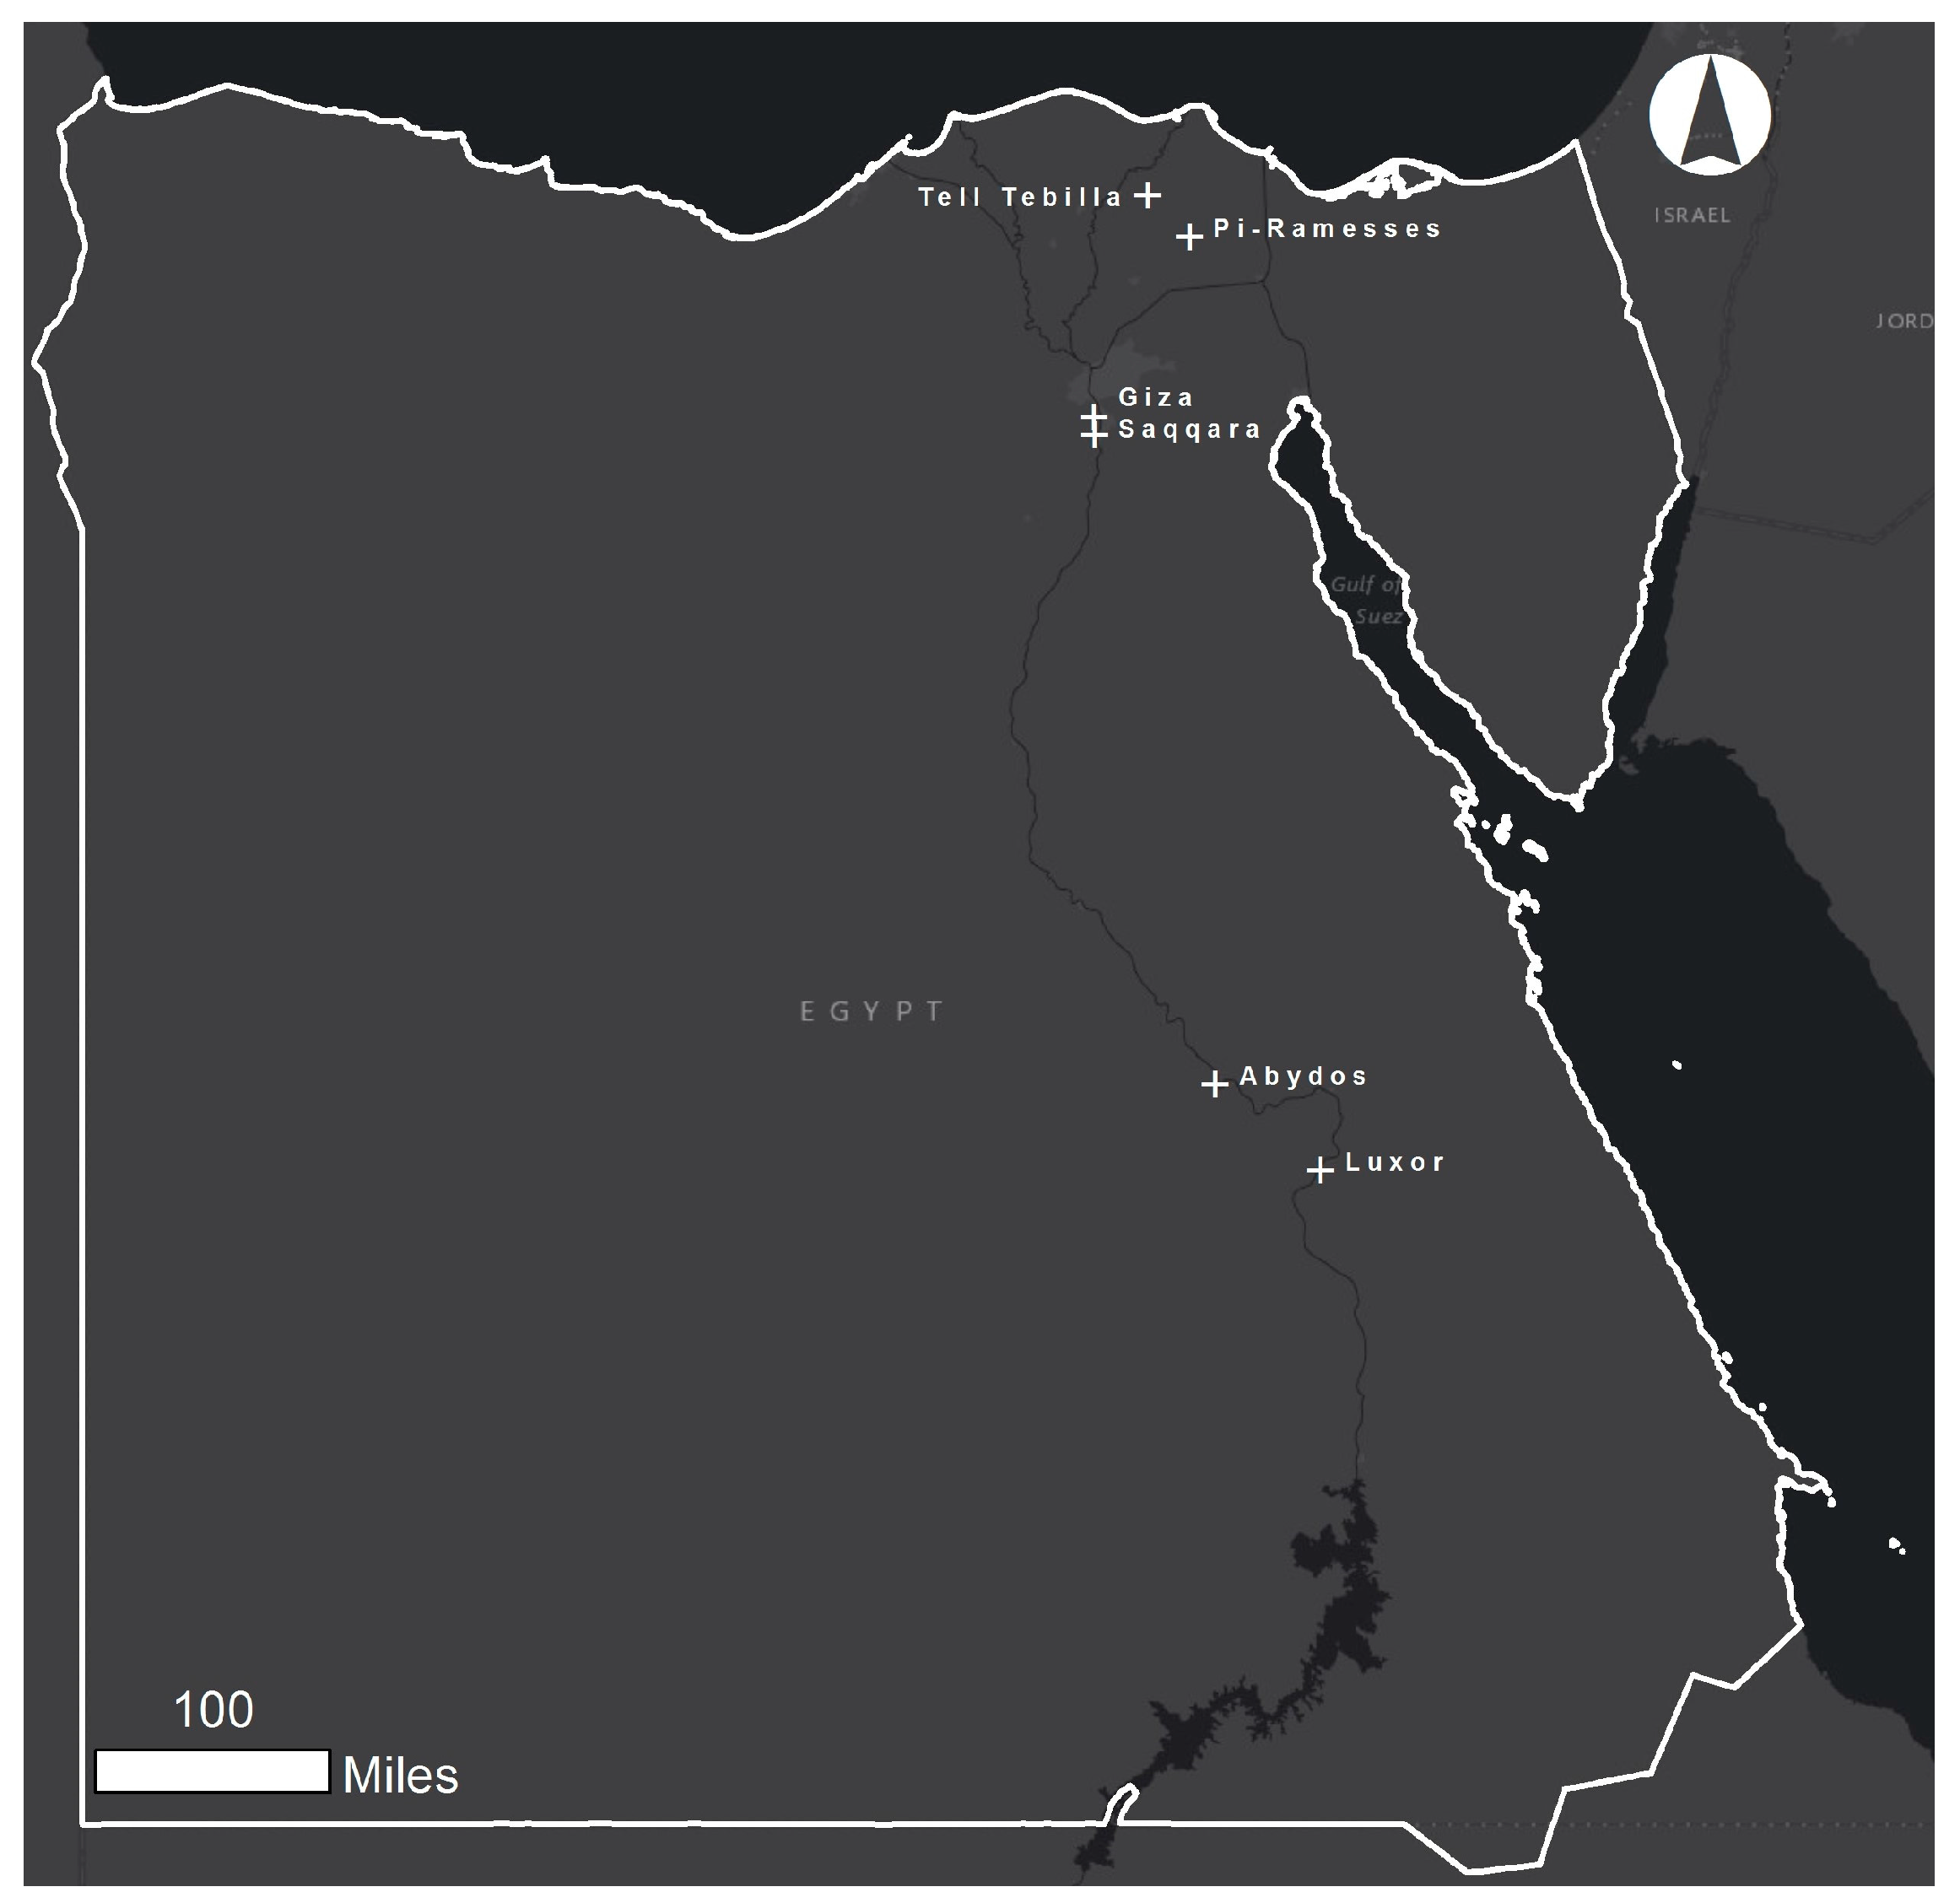
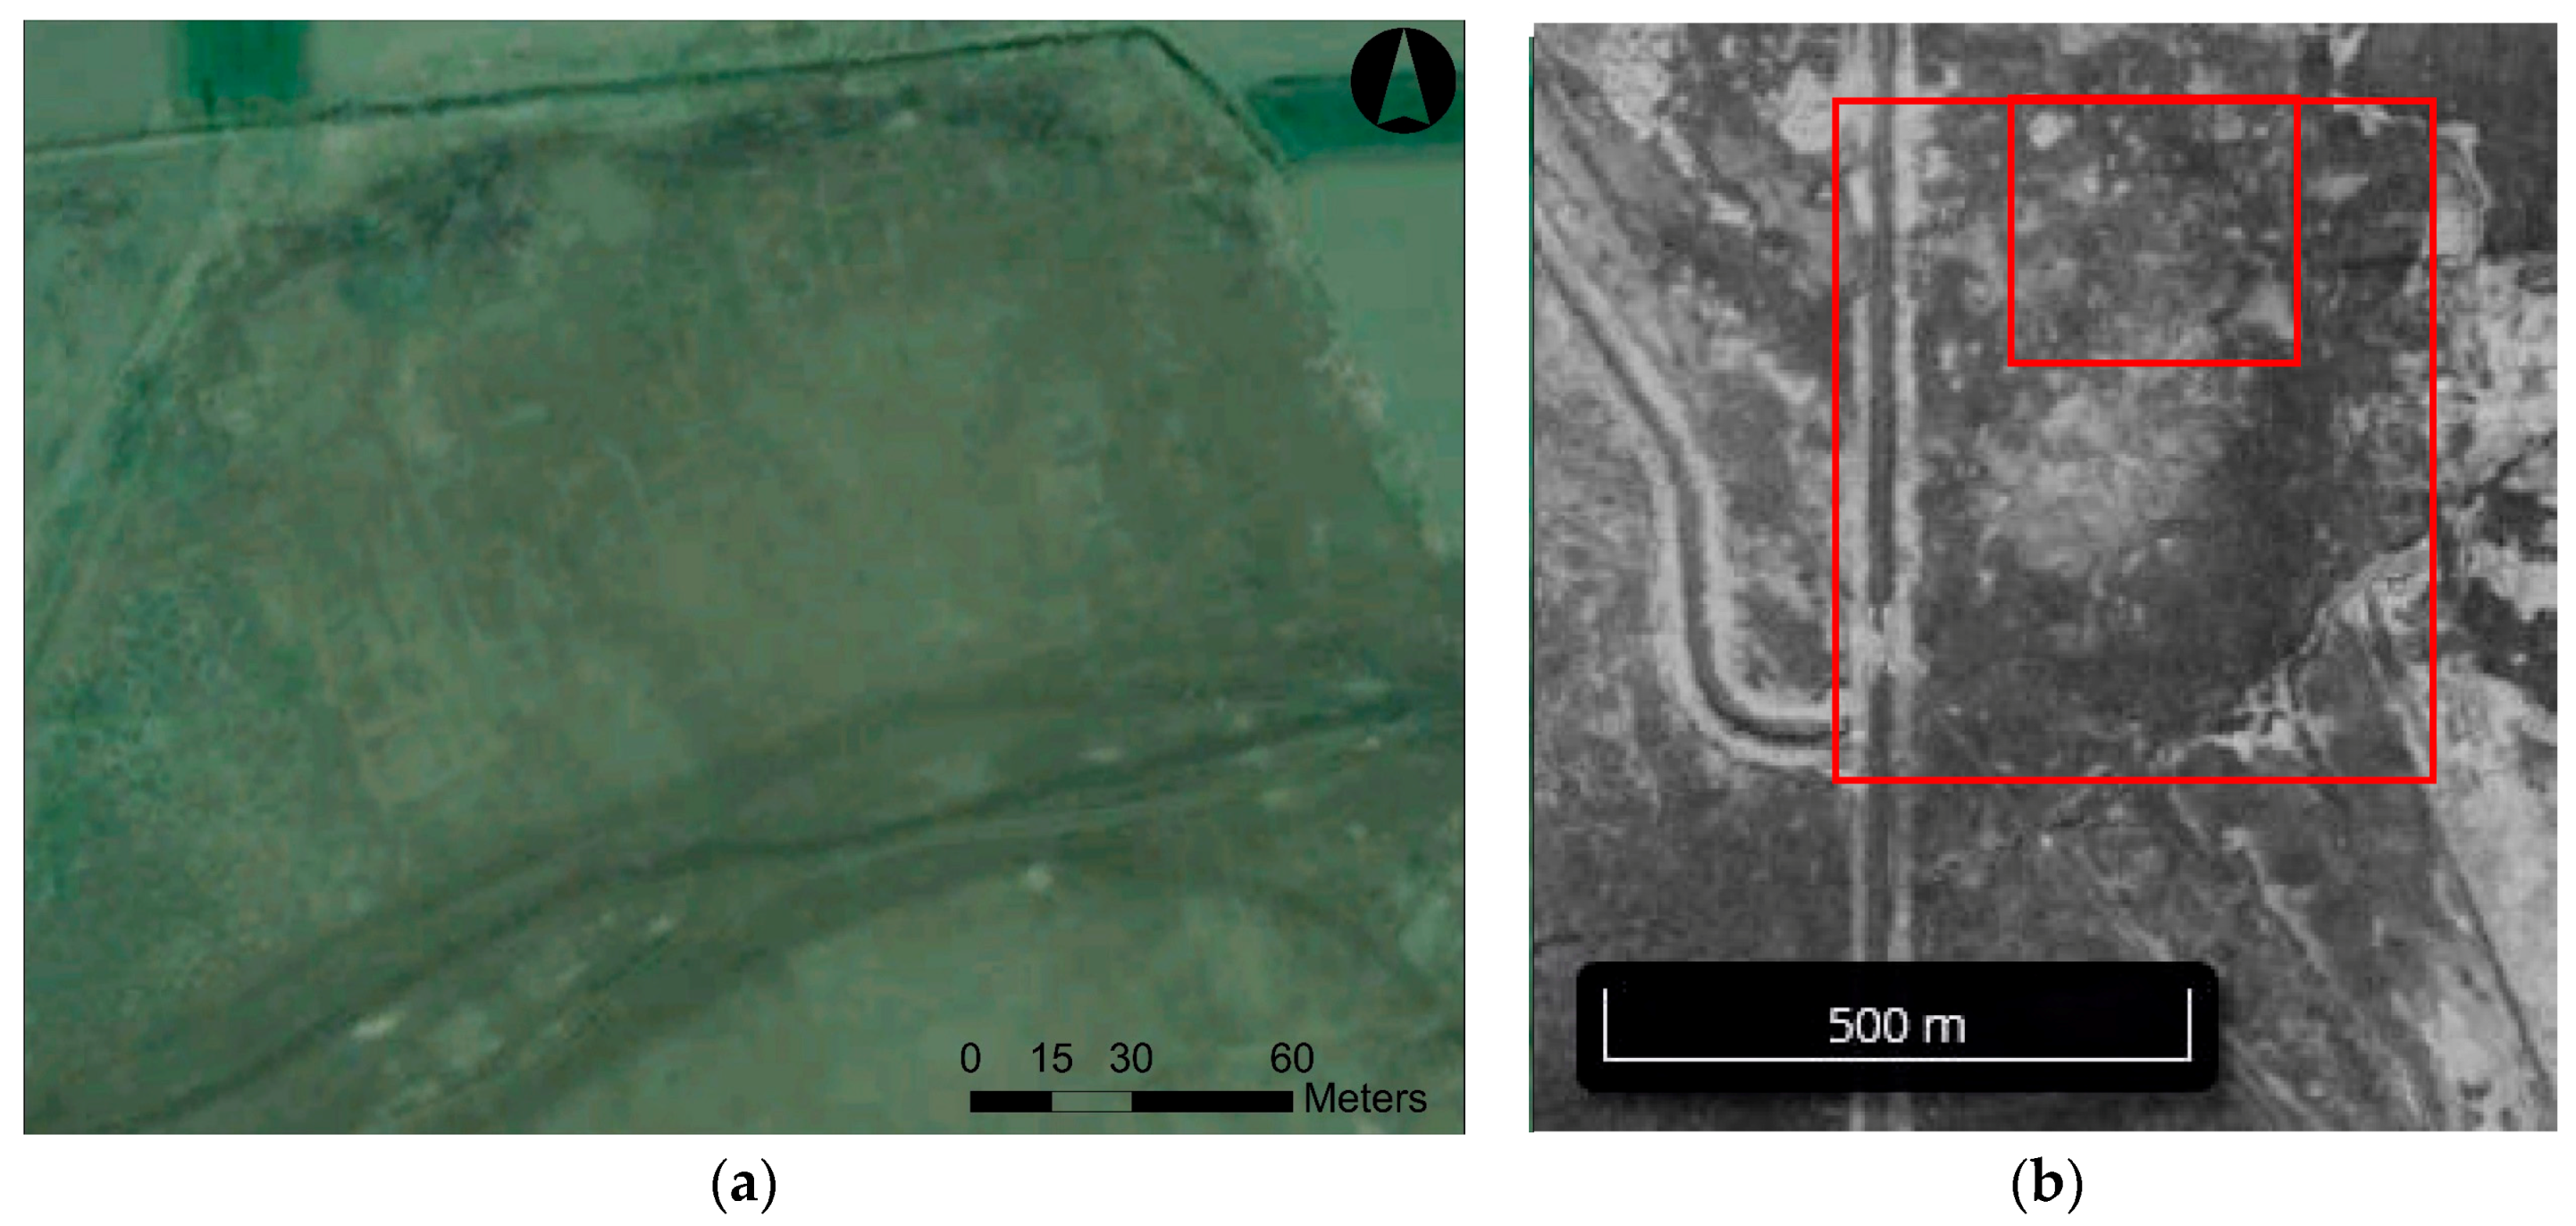
Figure 5.
(a) Partial results from the 2003 magnetometer survey of Tell Tebilla indicating buried mudbrick from a housing/cemetery installation, with detail of inset; (b) Shows the location of the mudbrick walls Imagery courtesy Larry Pavlish and Greg Mumford.
Figure 5.
(a) Partial results from the 2003 magnetometer survey of Tell Tebilla indicating buried mudbrick from a housing/cemetery installation, with detail of inset; (b) Shows the location of the mudbrick walls Imagery courtesy Larry Pavlish and Greg Mumford.

Figure 6.
(a) The site of Abu el Humar. Image courtesy Google Earth; (b) 1968 CORONA image. Image courtesy of the Center for Advanced Spatial Technologies, University of Arkansas/U.S. Geological Survey.
Figure 6.
(a) The site of Abu el Humar. Image courtesy Google Earth; (b) 1968 CORONA image. Image courtesy of the Center for Advanced Spatial Technologies, University of Arkansas/U.S. Geological Survey.

Figure 7.
(a) The site of Abu Mitawi. Image courtesy Google Earth; (b) 1968 CORONA image. Image courtesy of the Center for Advanced Spatial Technologies, University of Arkansas/U.S. Geological Survey.
Figure 7.
(a) The site of Abu Mitawi. Image courtesy Google Earth; (b) 1968 CORONA image. Image courtesy of the Center for Advanced Spatial Technologies, University of Arkansas/U.S. Geological Survey.
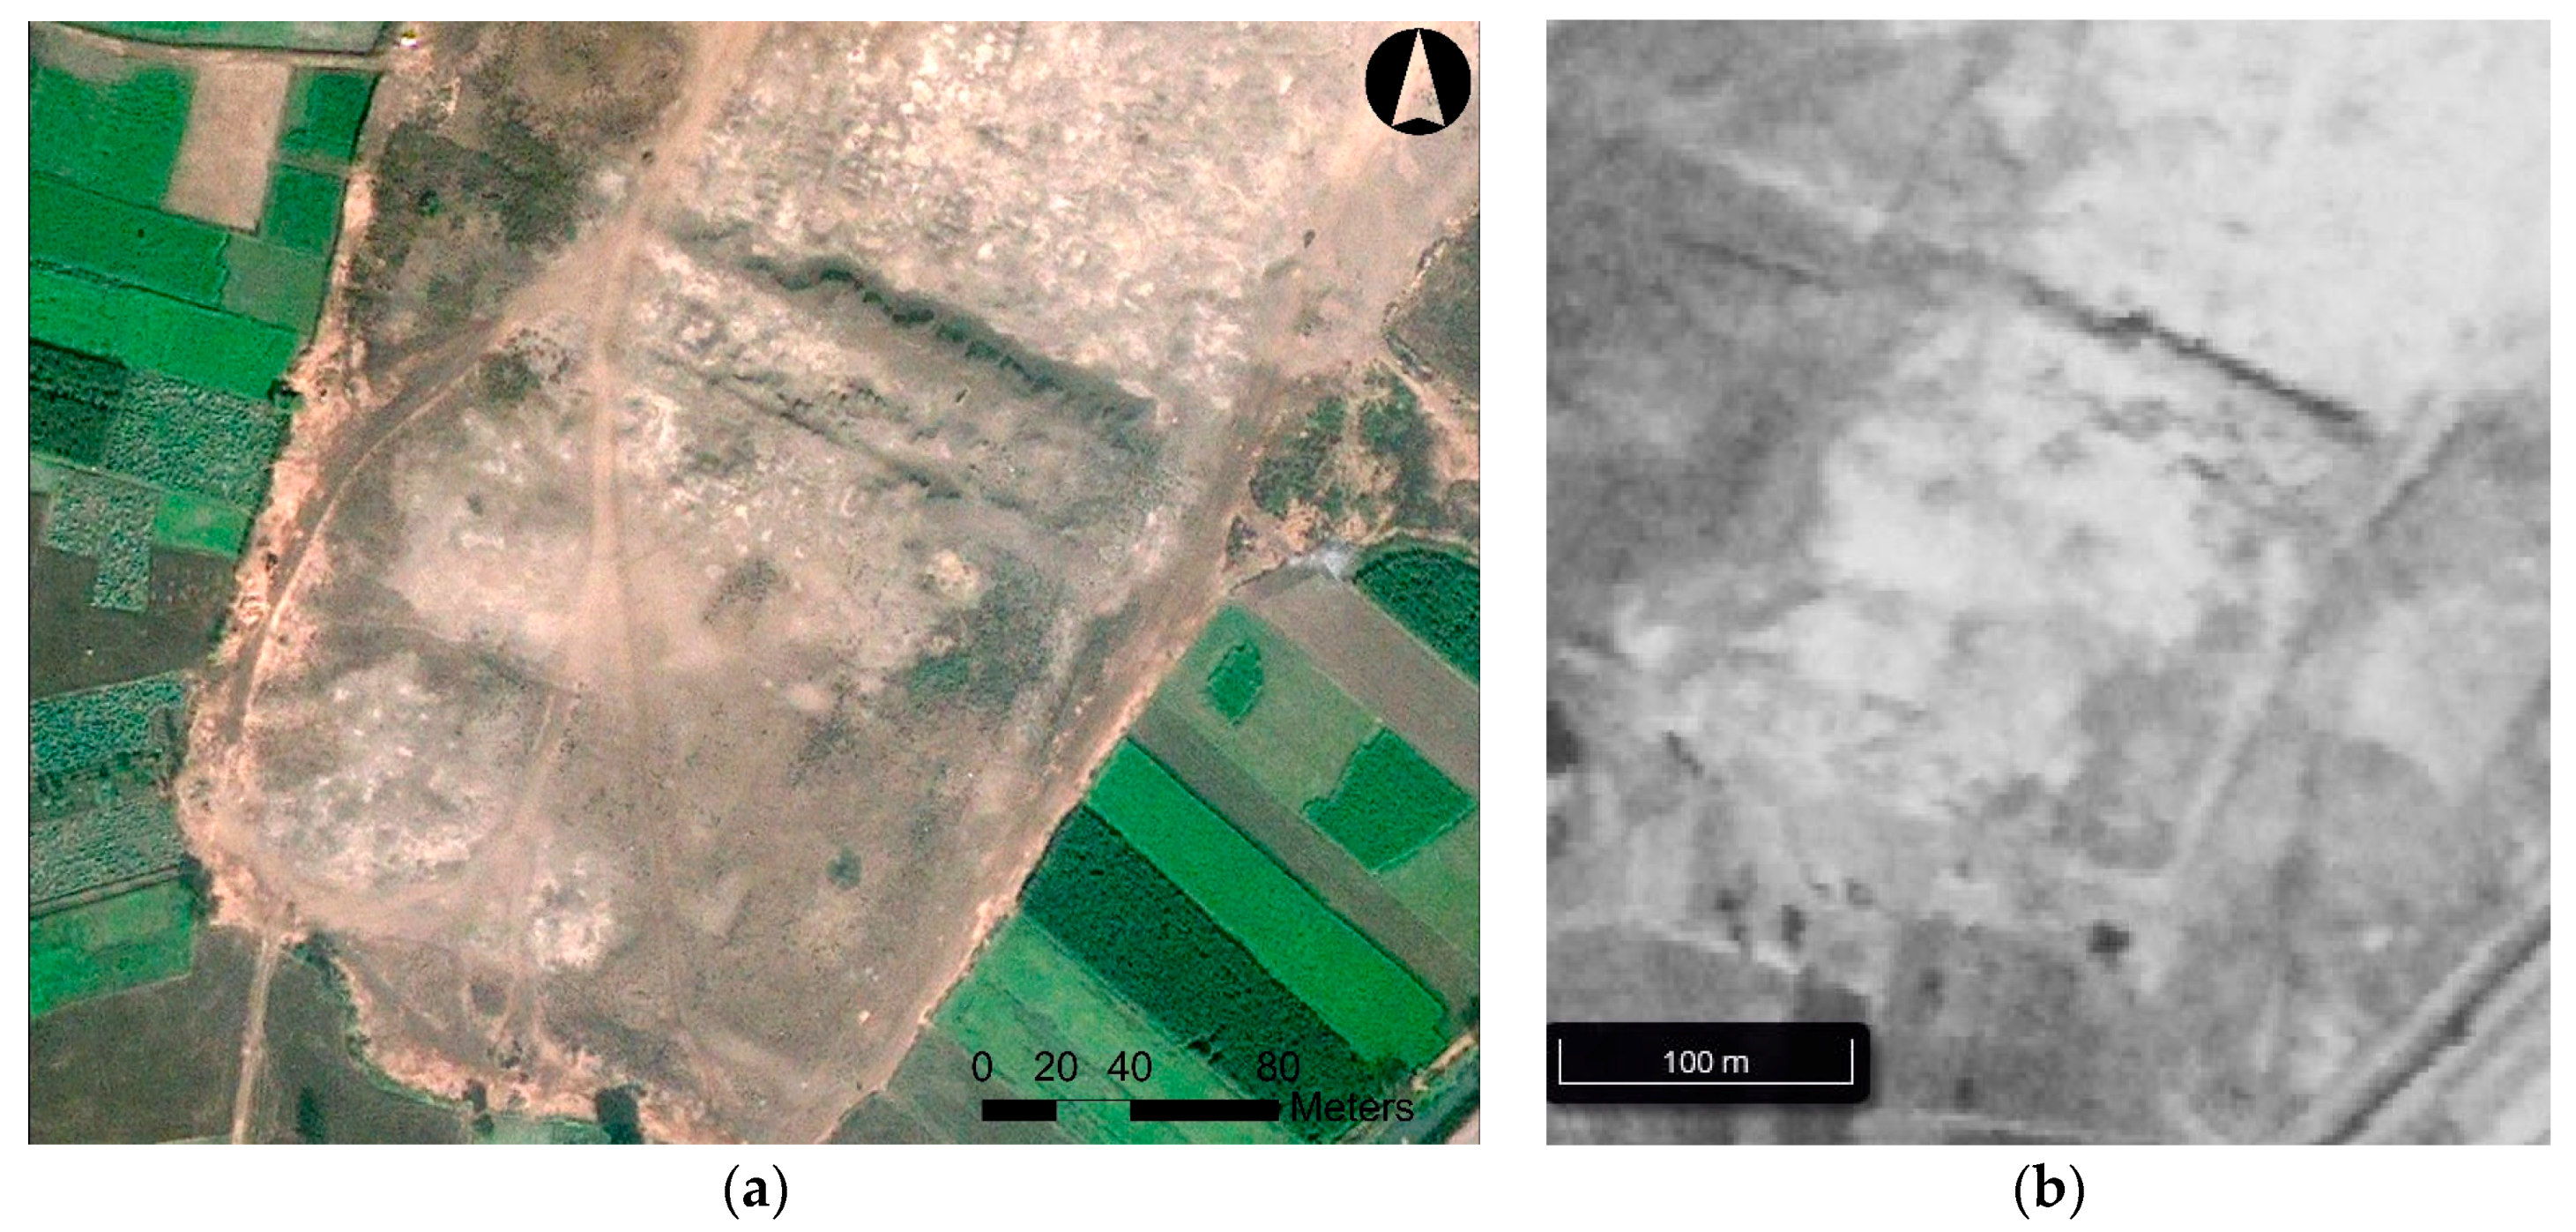
Figure 8.
(a) The site of Daba el-Qibli. Image courtesy Google Earth; (b) 1968 CORONA image. Image courtesy of the Center for Advanced Spatial Technologies, University of Arkansas/U.S. Geological Survey.
Figure 8.
(a) The site of Daba el-Qibli. Image courtesy Google Earth; (b) 1968 CORONA image. Image courtesy of the Center for Advanced Spatial Technologies, University of Arkansas/U.S. Geological Survey.

Figure 9.
(a) The site of Kom Biltus. Image courtesy Google Earth; (b) 1968 CORONA image. Image courtesy of the Center for Advanced Spatial Technologies, University of Arkansas/U.S. Geological Survey.
Figure 9.
(a) The site of Kom Biltus. Image courtesy Google Earth; (b) 1968 CORONA image. Image courtesy of the Center for Advanced Spatial Technologies, University of Arkansas/U.S. Geological Survey.
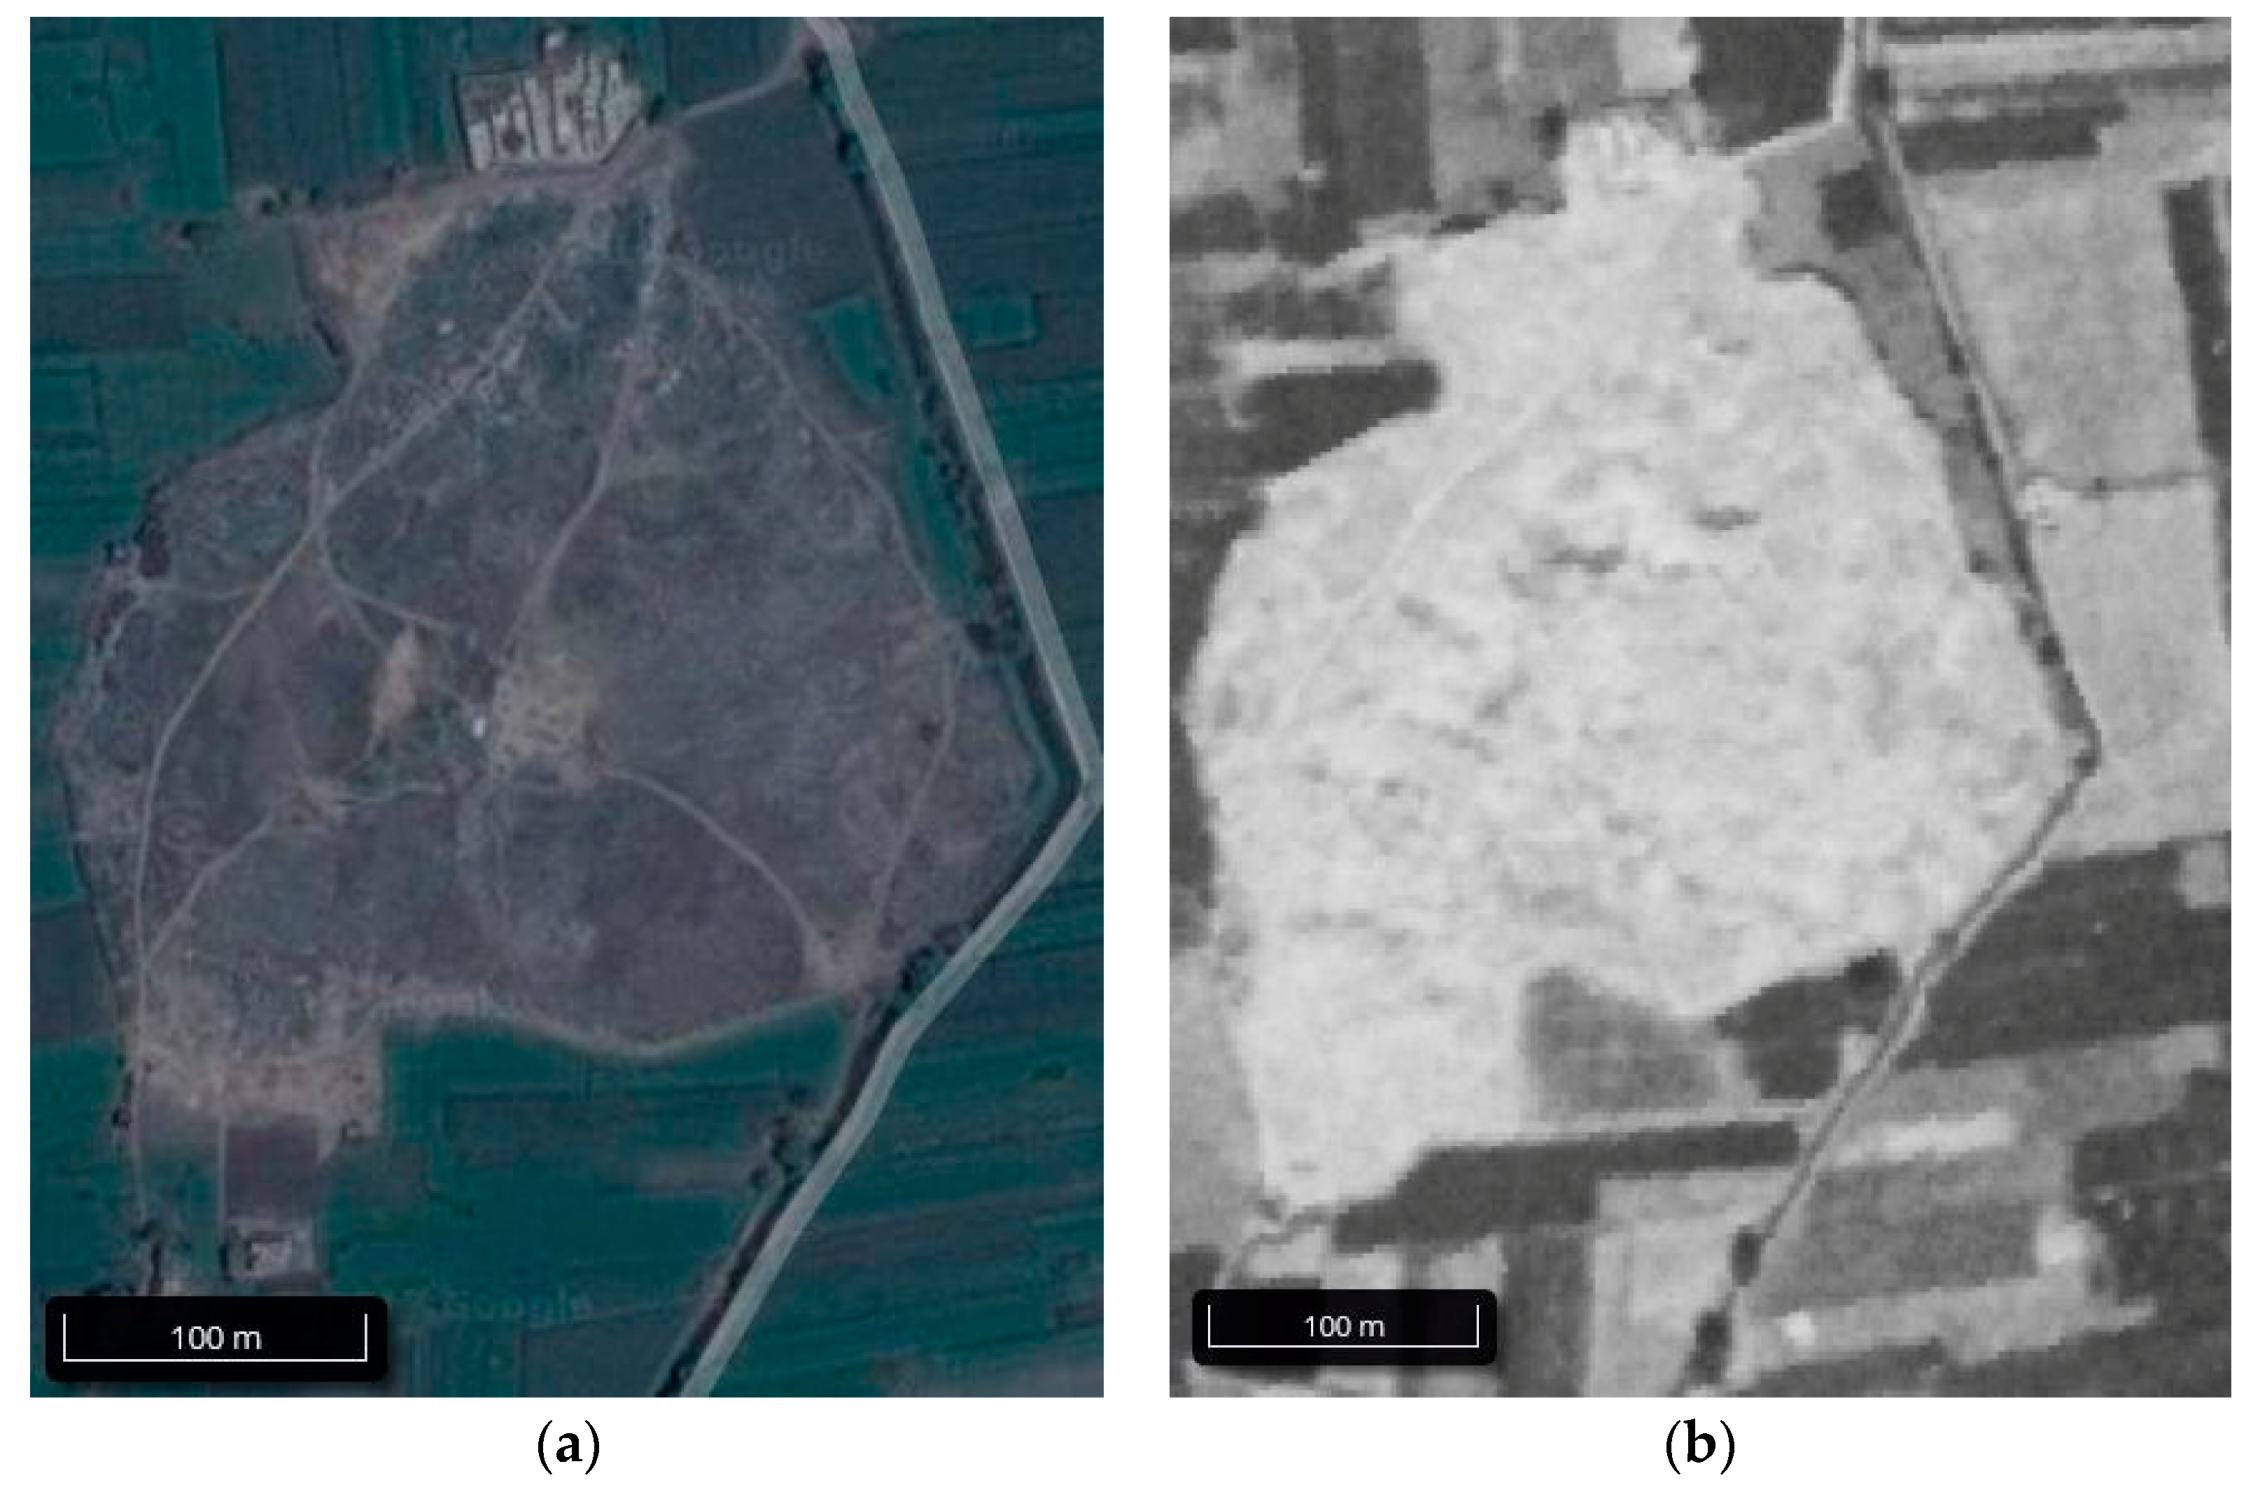
Figure 10.
(a) The site of Kom Bunduq. Image courtesy Google Earth; (b) 1968 CORONA image. Image courtesy of the Center for Advanced Spatial Technologies, University of Arkansas/U.S. Geological Survey.
Figure 10.
(a) The site of Kom Bunduq. Image courtesy Google Earth; (b) 1968 CORONA image. Image courtesy of the Center for Advanced Spatial Technologies, University of Arkansas/U.S. Geological Survey.

Figure 11.
(a) The site of Kom ed Dahaba. Image courtesy Google Earth; (b) 1968 CORONA image. Area in image (a) is within the red box. Image courtesy of the Center for Advanced Spatial Technologies, University of Arkansas/U.S. Geological Survey.
Figure 11.
(a) The site of Kom ed Dahaba. Image courtesy Google Earth; (b) 1968 CORONA image. Area in image (a) is within the red box. Image courtesy of the Center for Advanced Spatial Technologies, University of Arkansas/U.S. Geological Survey.

Figure 12.
(a) The site of Kom ed Dahaba. Image courtesy Google Earth; (b) 1968 CORONA image. Image courtesy of the Center for Advanced Spatial Technologies, University of Arkansas/U.S. Geological Survey.
Figure 12.
(a) The site of Kom ed Dahaba. Image courtesy Google Earth; (b) 1968 CORONA image. Image courtesy of the Center for Advanced Spatial Technologies, University of Arkansas/U.S. Geological Survey.

Figure 13.
(a) The site of Tell el-Arab. Image courtesy Google Earth; (b) 1968 CORONA image. Image (a) is within the red box. Image courtesy of the Center for Advanced Spatial Technologies, University of Arkansas/U.S. Geological Survey.
Figure 13.
(a) The site of Tell el-Arab. Image courtesy Google Earth; (b) 1968 CORONA image. Image (a) is within the red box. Image courtesy of the Center for Advanced Spatial Technologies, University of Arkansas/U.S. Geological Survey.

Figure 14.
(a) The site of Kom el Arab. Image courtesy Google Earth; (b) 1968 CORONA image. The area of image (a) is in the red box. Image courtesy of the Center for Advanced Spatial Technologies, University of Arkansas/U.S. Geological Survey.
Figure 14.
(a) The site of Kom el Arab. Image courtesy Google Earth; (b) 1968 CORONA image. The area of image (a) is in the red box. Image courtesy of the Center for Advanced Spatial Technologies, University of Arkansas/U.S. Geological Survey.
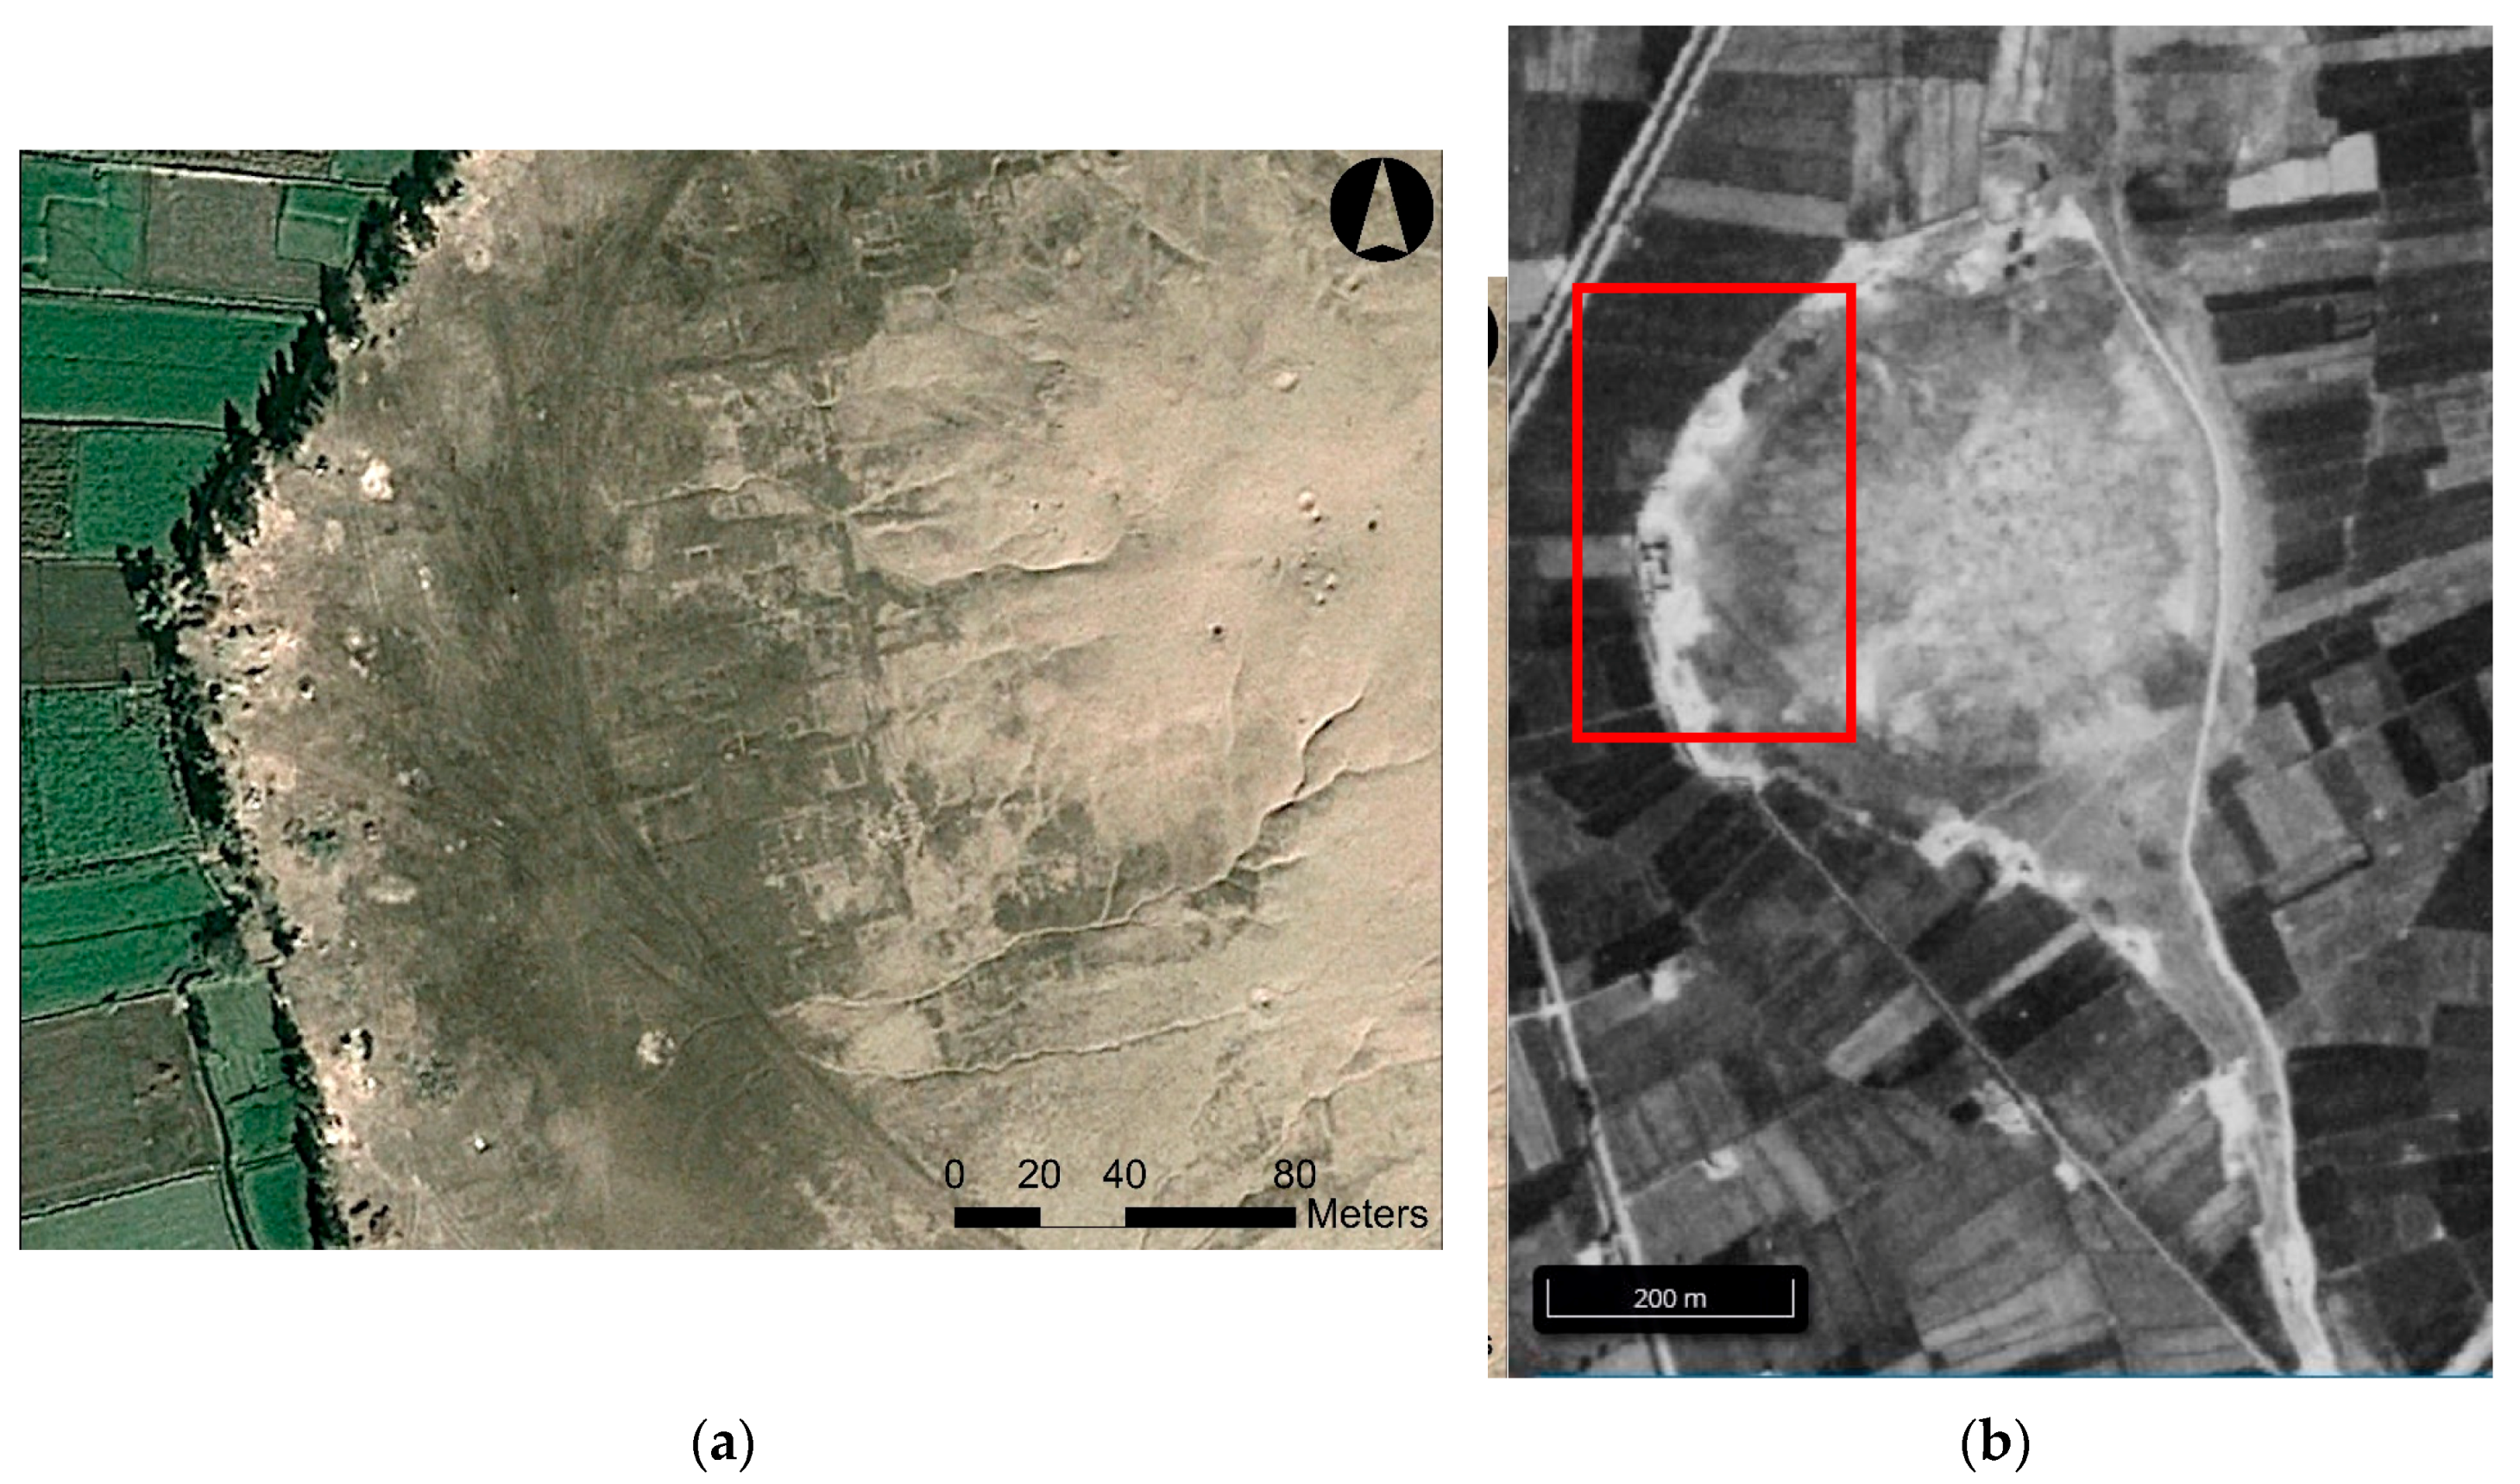
Figure 15.
(a) The site of Kom el-Barud. Image courtesy Google Earth; (b) 1968 CORONA image. Image courtesy of the Center for Advanced Spatial Technologies, University of Arkansas/U.S. Geological Survey.
Figure 15.
(a) The site of Kom el-Barud. Image courtesy Google Earth; (b) 1968 CORONA image. Image courtesy of the Center for Advanced Spatial Technologies, University of Arkansas/U.S. Geological Survey.

Figure 16.
(a) The site of Kom el-Garad. Image courtesy Google Earth; (b) 1968 CORONA image. The area of image (a) is within the red box. Image courtesy of the Center for Advanced Spatial Technologies, University of Arkansas/U.S. Geological Survey.
Figure 16.
(a) The site of Kom el-Garad. Image courtesy Google Earth; (b) 1968 CORONA image. The area of image (a) is within the red box. Image courtesy of the Center for Advanced Spatial Technologies, University of Arkansas/U.S. Geological Survey.
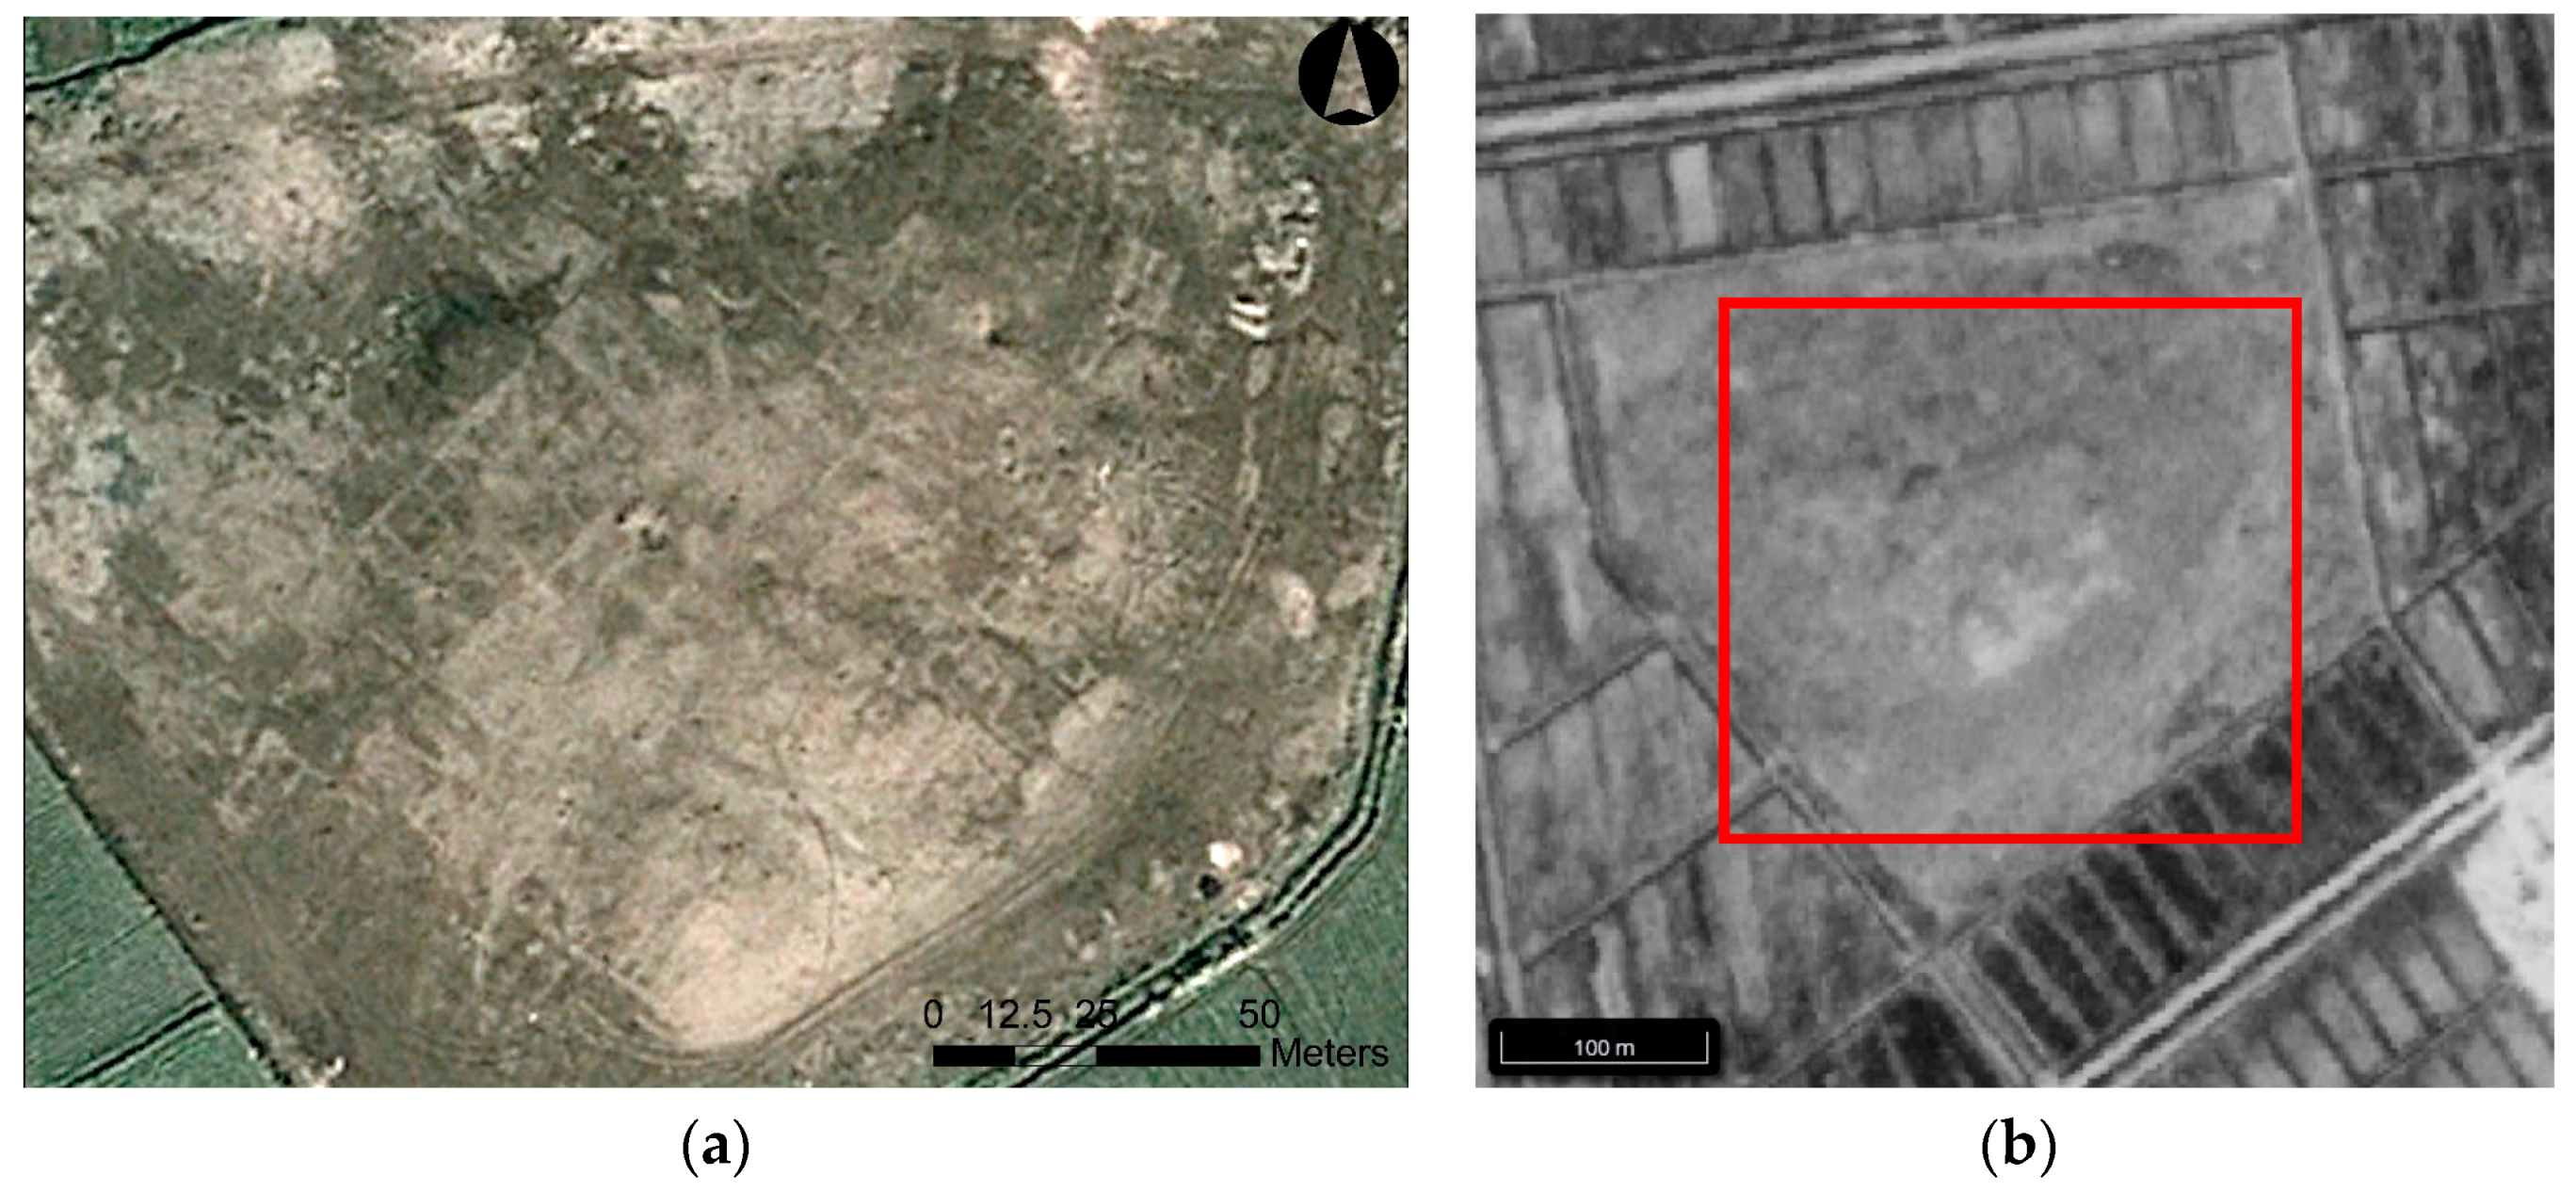
Figure 17.
(a) The site of Tell Belim. Image courtesy Google Earth; (b) 1968 CORONA image. The area of image (a) is in the red box. Image courtesy of the Center for Advanced Spatial Technologies, University of Arkansas/U.S. Geological Survey.
Figure 17.
(a) The site of Tell Belim. Image courtesy Google Earth; (b) 1968 CORONA image. The area of image (a) is in the red box. Image courtesy of the Center for Advanced Spatial Technologies, University of Arkansas/U.S. Geological Survey.
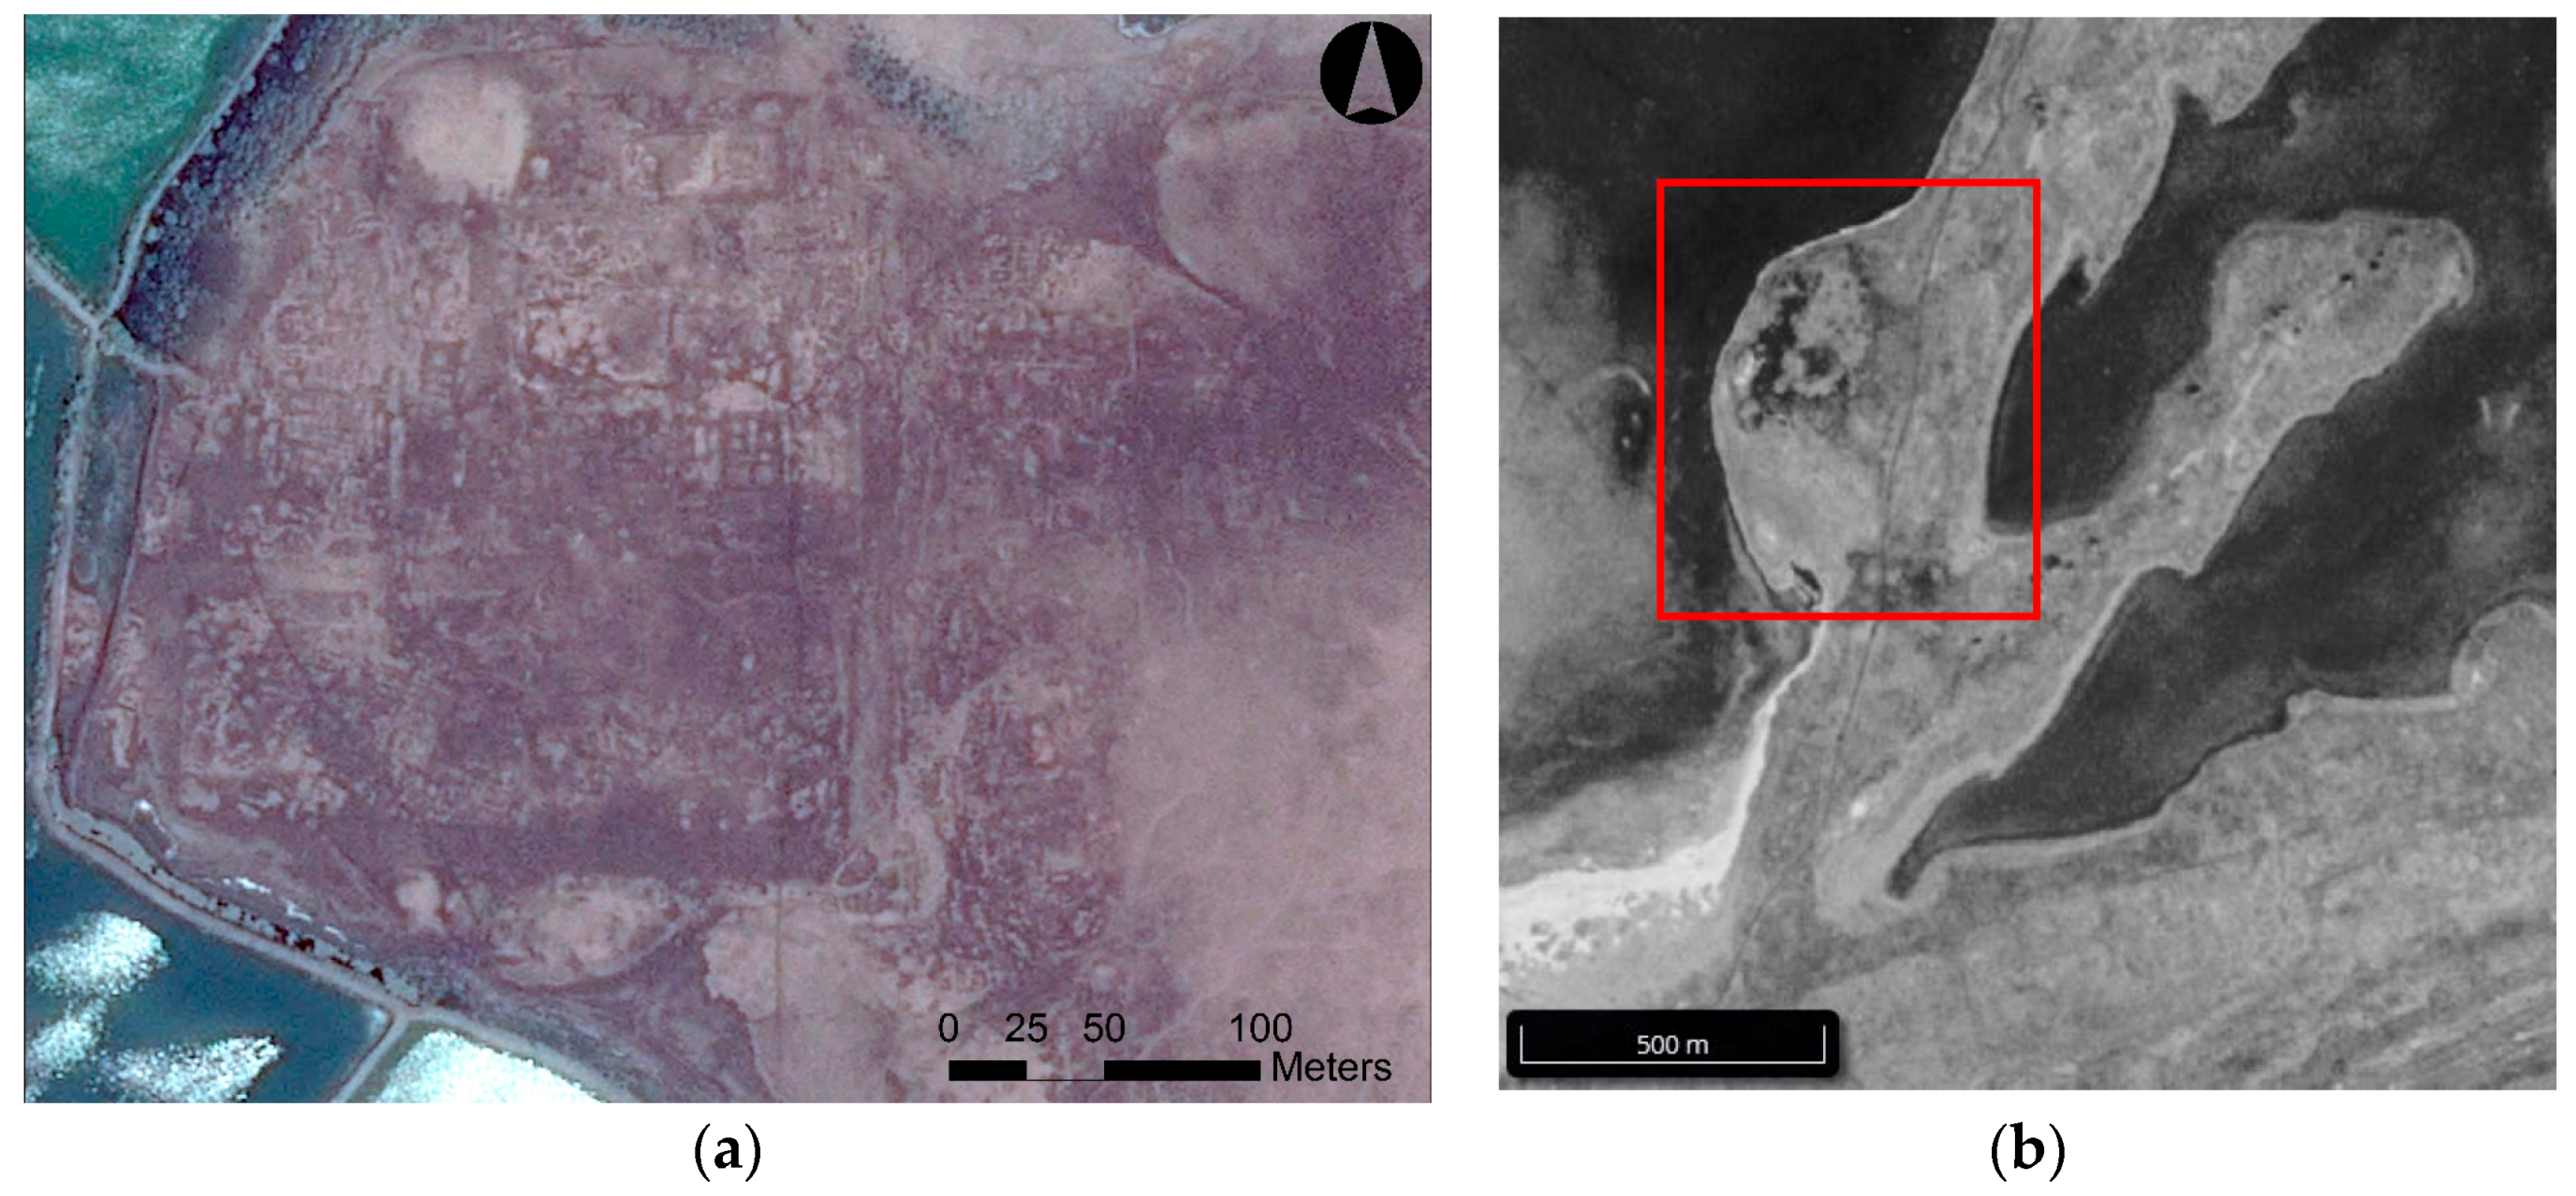
Figure 18.
(a) The site of Tell Buweib. Image courtesy Google Earth; (b) 1968 CORONA image. Image courtesy of the Center for Advanced Spatial Technologies, University of Arkansas/U.S. Geological Survey.
Figure 18.
(a) The site of Tell Buweib. Image courtesy Google Earth; (b) 1968 CORONA image. Image courtesy of the Center for Advanced Spatial Technologies, University of Arkansas/U.S. Geological Survey.

Figure 19.
(a) The site of Tell el-Damalun. Image courtesy Google Earth; (b) 1968 CORONA image. The area of image (a) is within the red box. Image courtesy of the Center for Advanced Spatial Technologies, University of Arkansas/U.S. Geological Survey.
Figure 19.
(a) The site of Tell el-Damalun. Image courtesy Google Earth; (b) 1968 CORONA image. The area of image (a) is within the red box. Image courtesy of the Center for Advanced Spatial Technologies, University of Arkansas/U.S. Geological Survey.
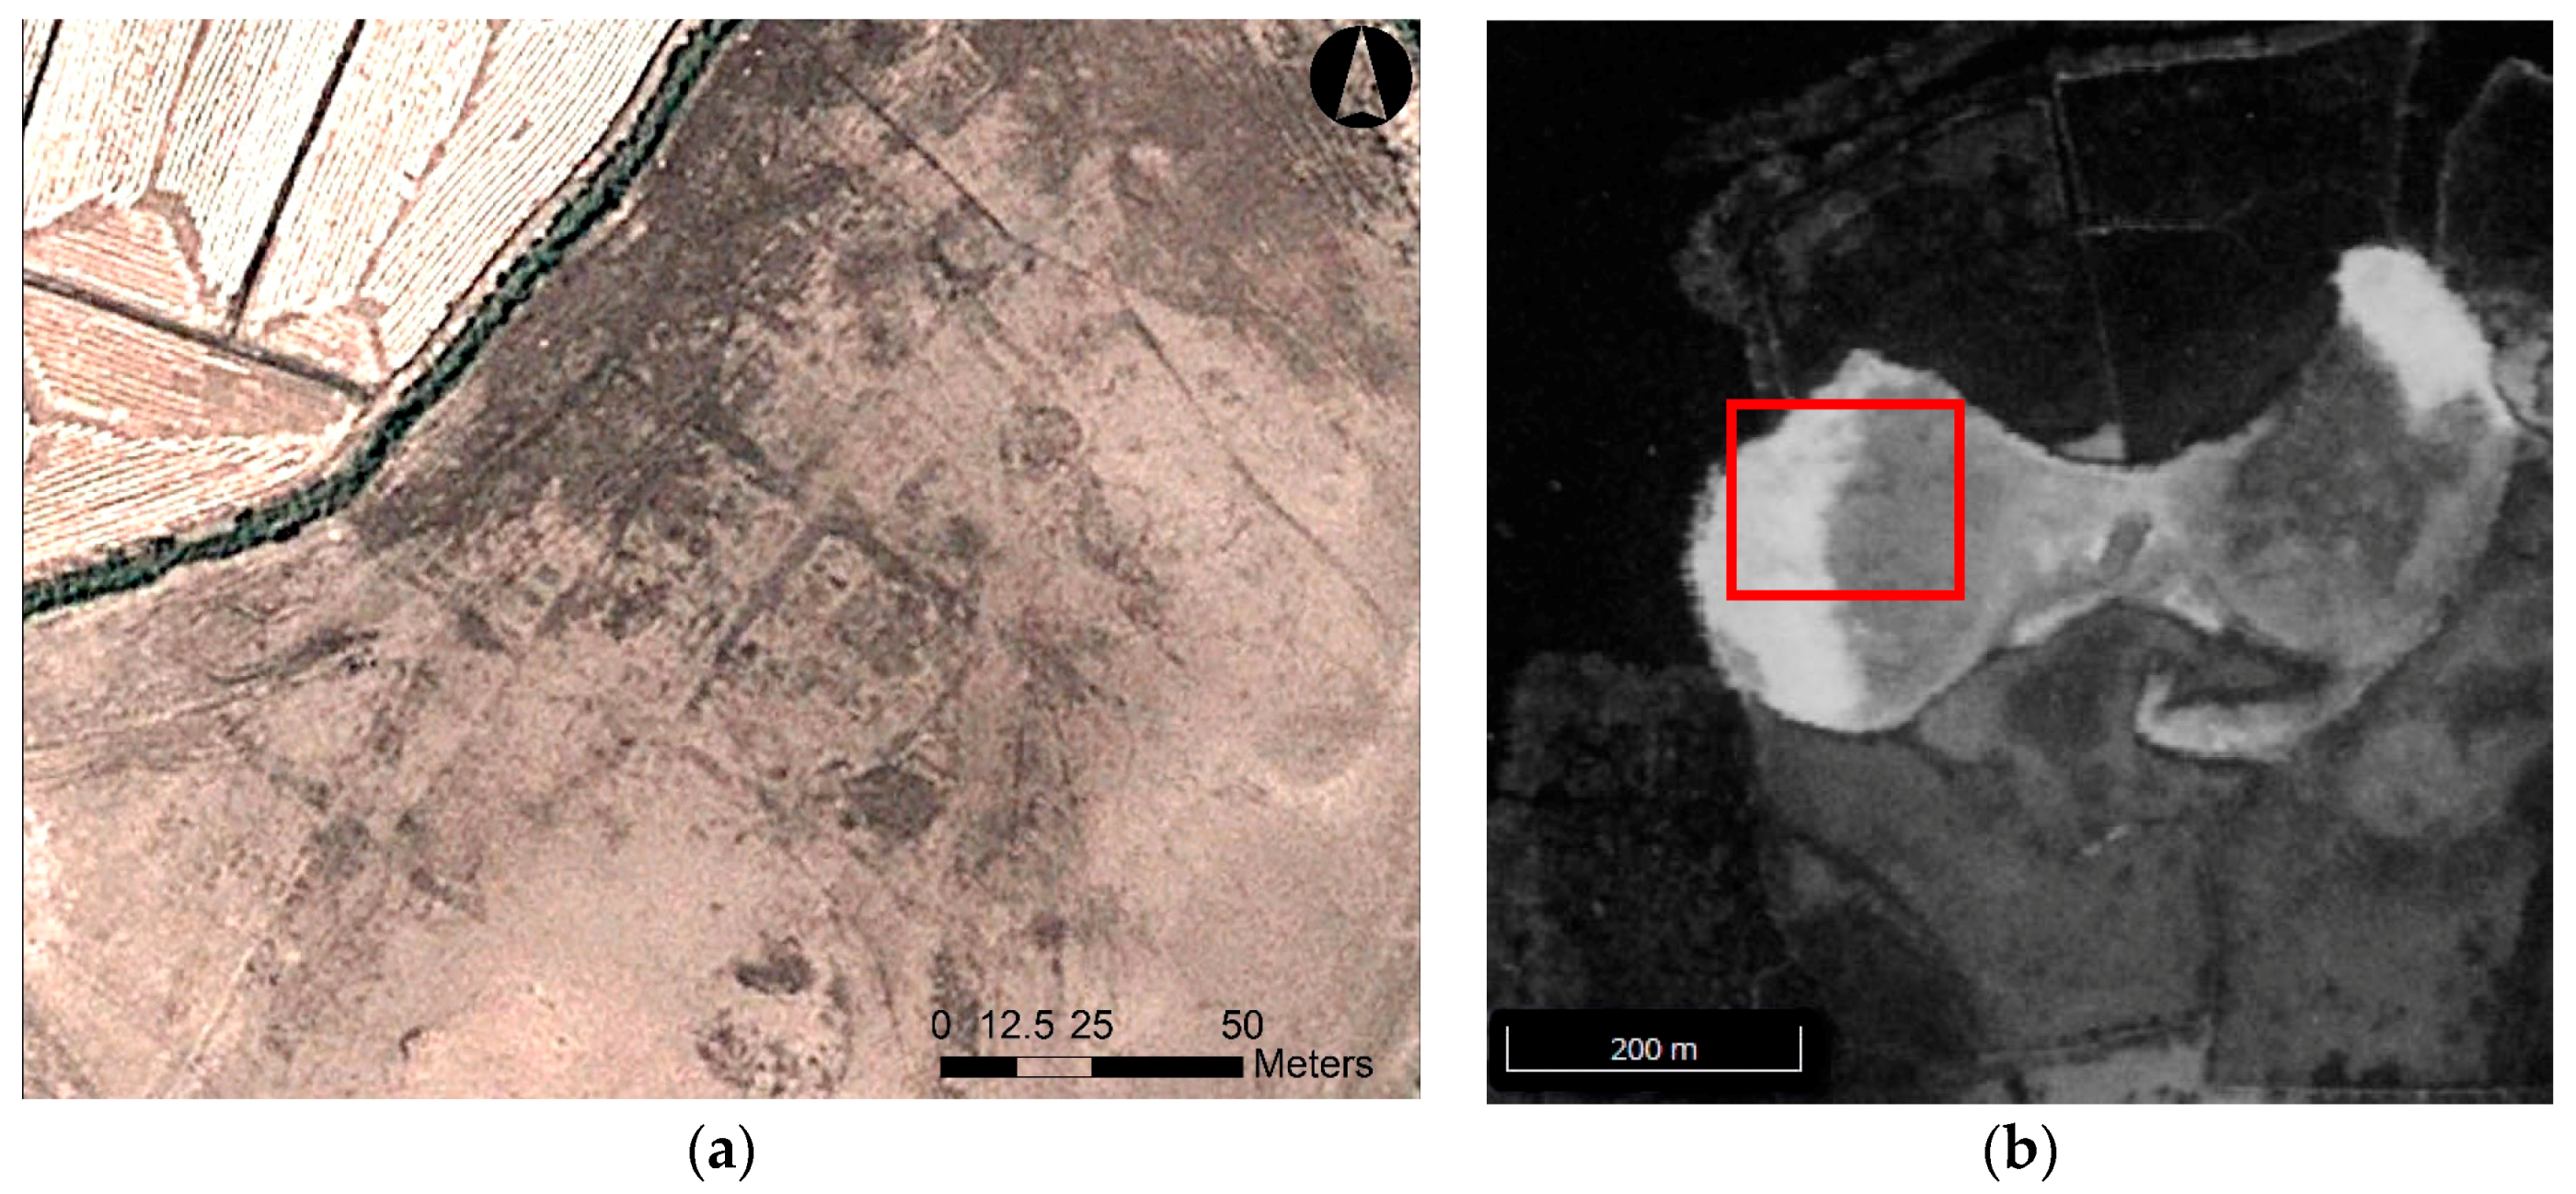
Figure 20.
(a) The site of Tell el-Gassa Image courtesy Google Earth; (b) 1968 CORONA image. The area of image (a) is in the red box. Image courtesy of the Center for Advanced Spatial Technologies, University of Arkansas/U.S. Geological Survey.
Figure 20.
(a) The site of Tell el-Gassa Image courtesy Google Earth; (b) 1968 CORONA image. The area of image (a) is in the red box. Image courtesy of the Center for Advanced Spatial Technologies, University of Arkansas/U.S. Geological Survey.
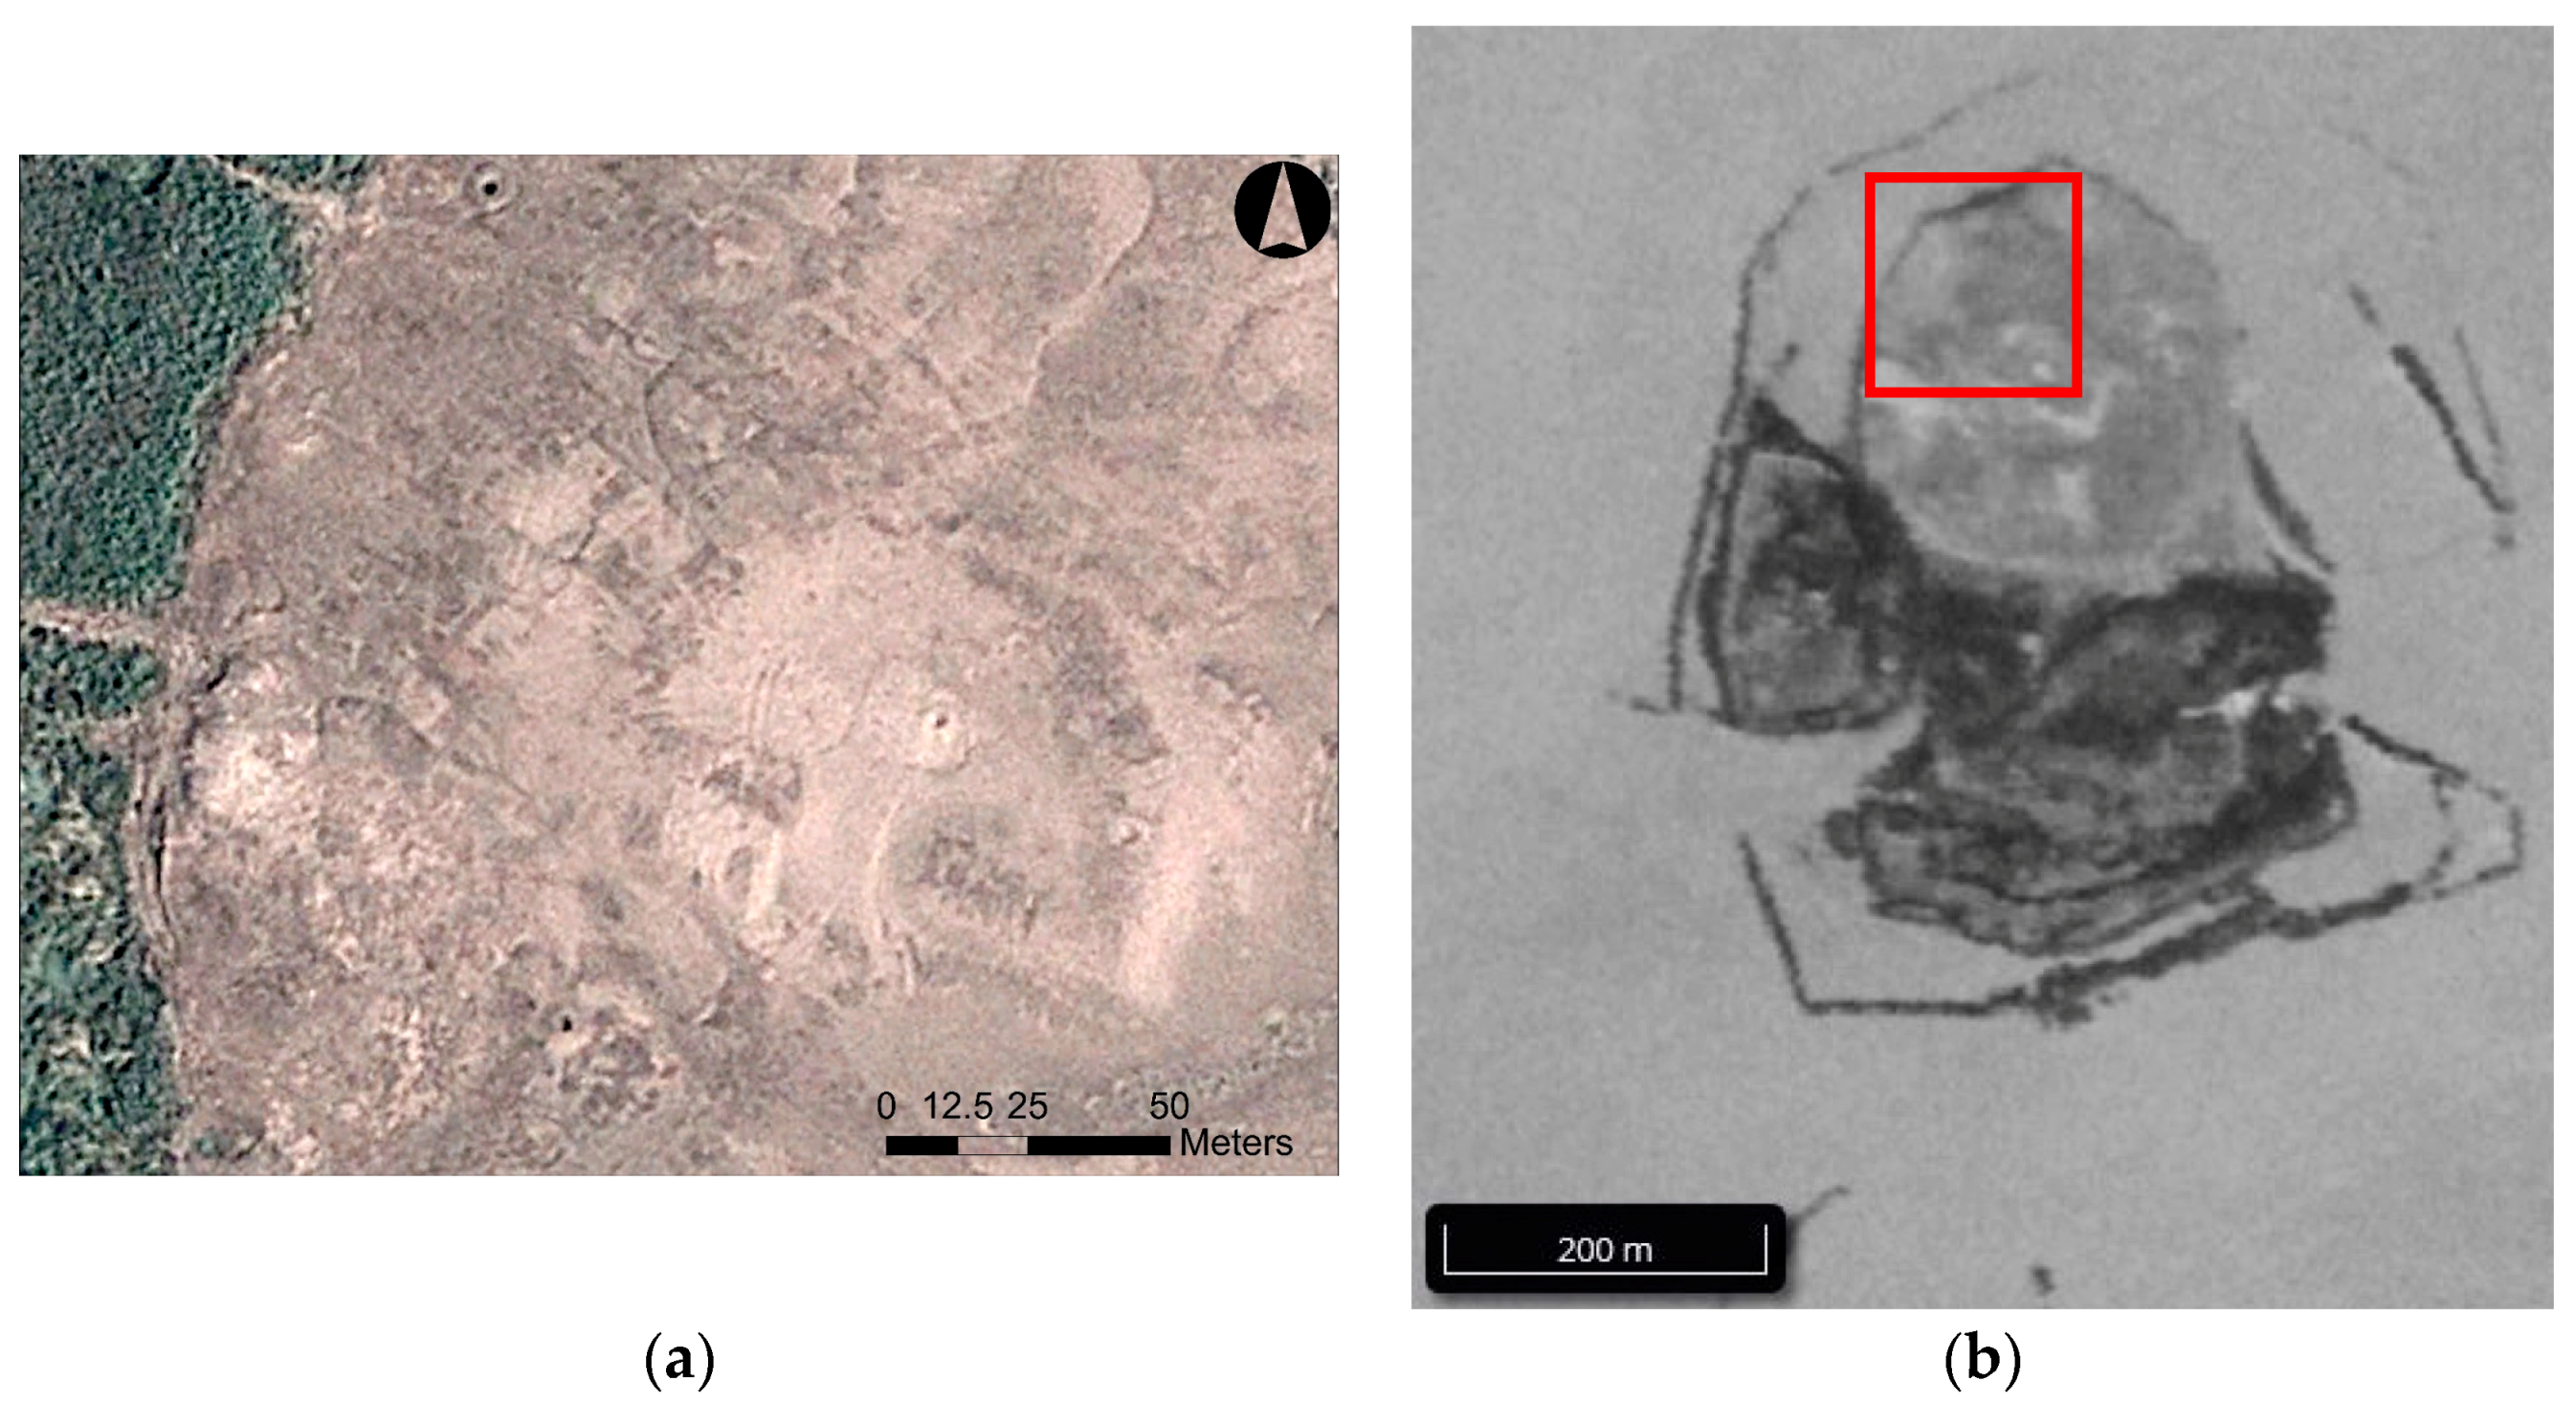
Figure 21.
(a) The site of Tell er-Ruhban. Image courtesy Google Earth; (b) 1968 CORONA image. The area of image (a) is in the red box. Image courtesy of the Center for Advanced Spatial Technologies, University of Arkansas/U.S. Geological Survey.
Figure 21.
(a) The site of Tell er-Ruhban. Image courtesy Google Earth; (b) 1968 CORONA image. The area of image (a) is in the red box. Image courtesy of the Center for Advanced Spatial Technologies, University of Arkansas/U.S. Geological Survey.
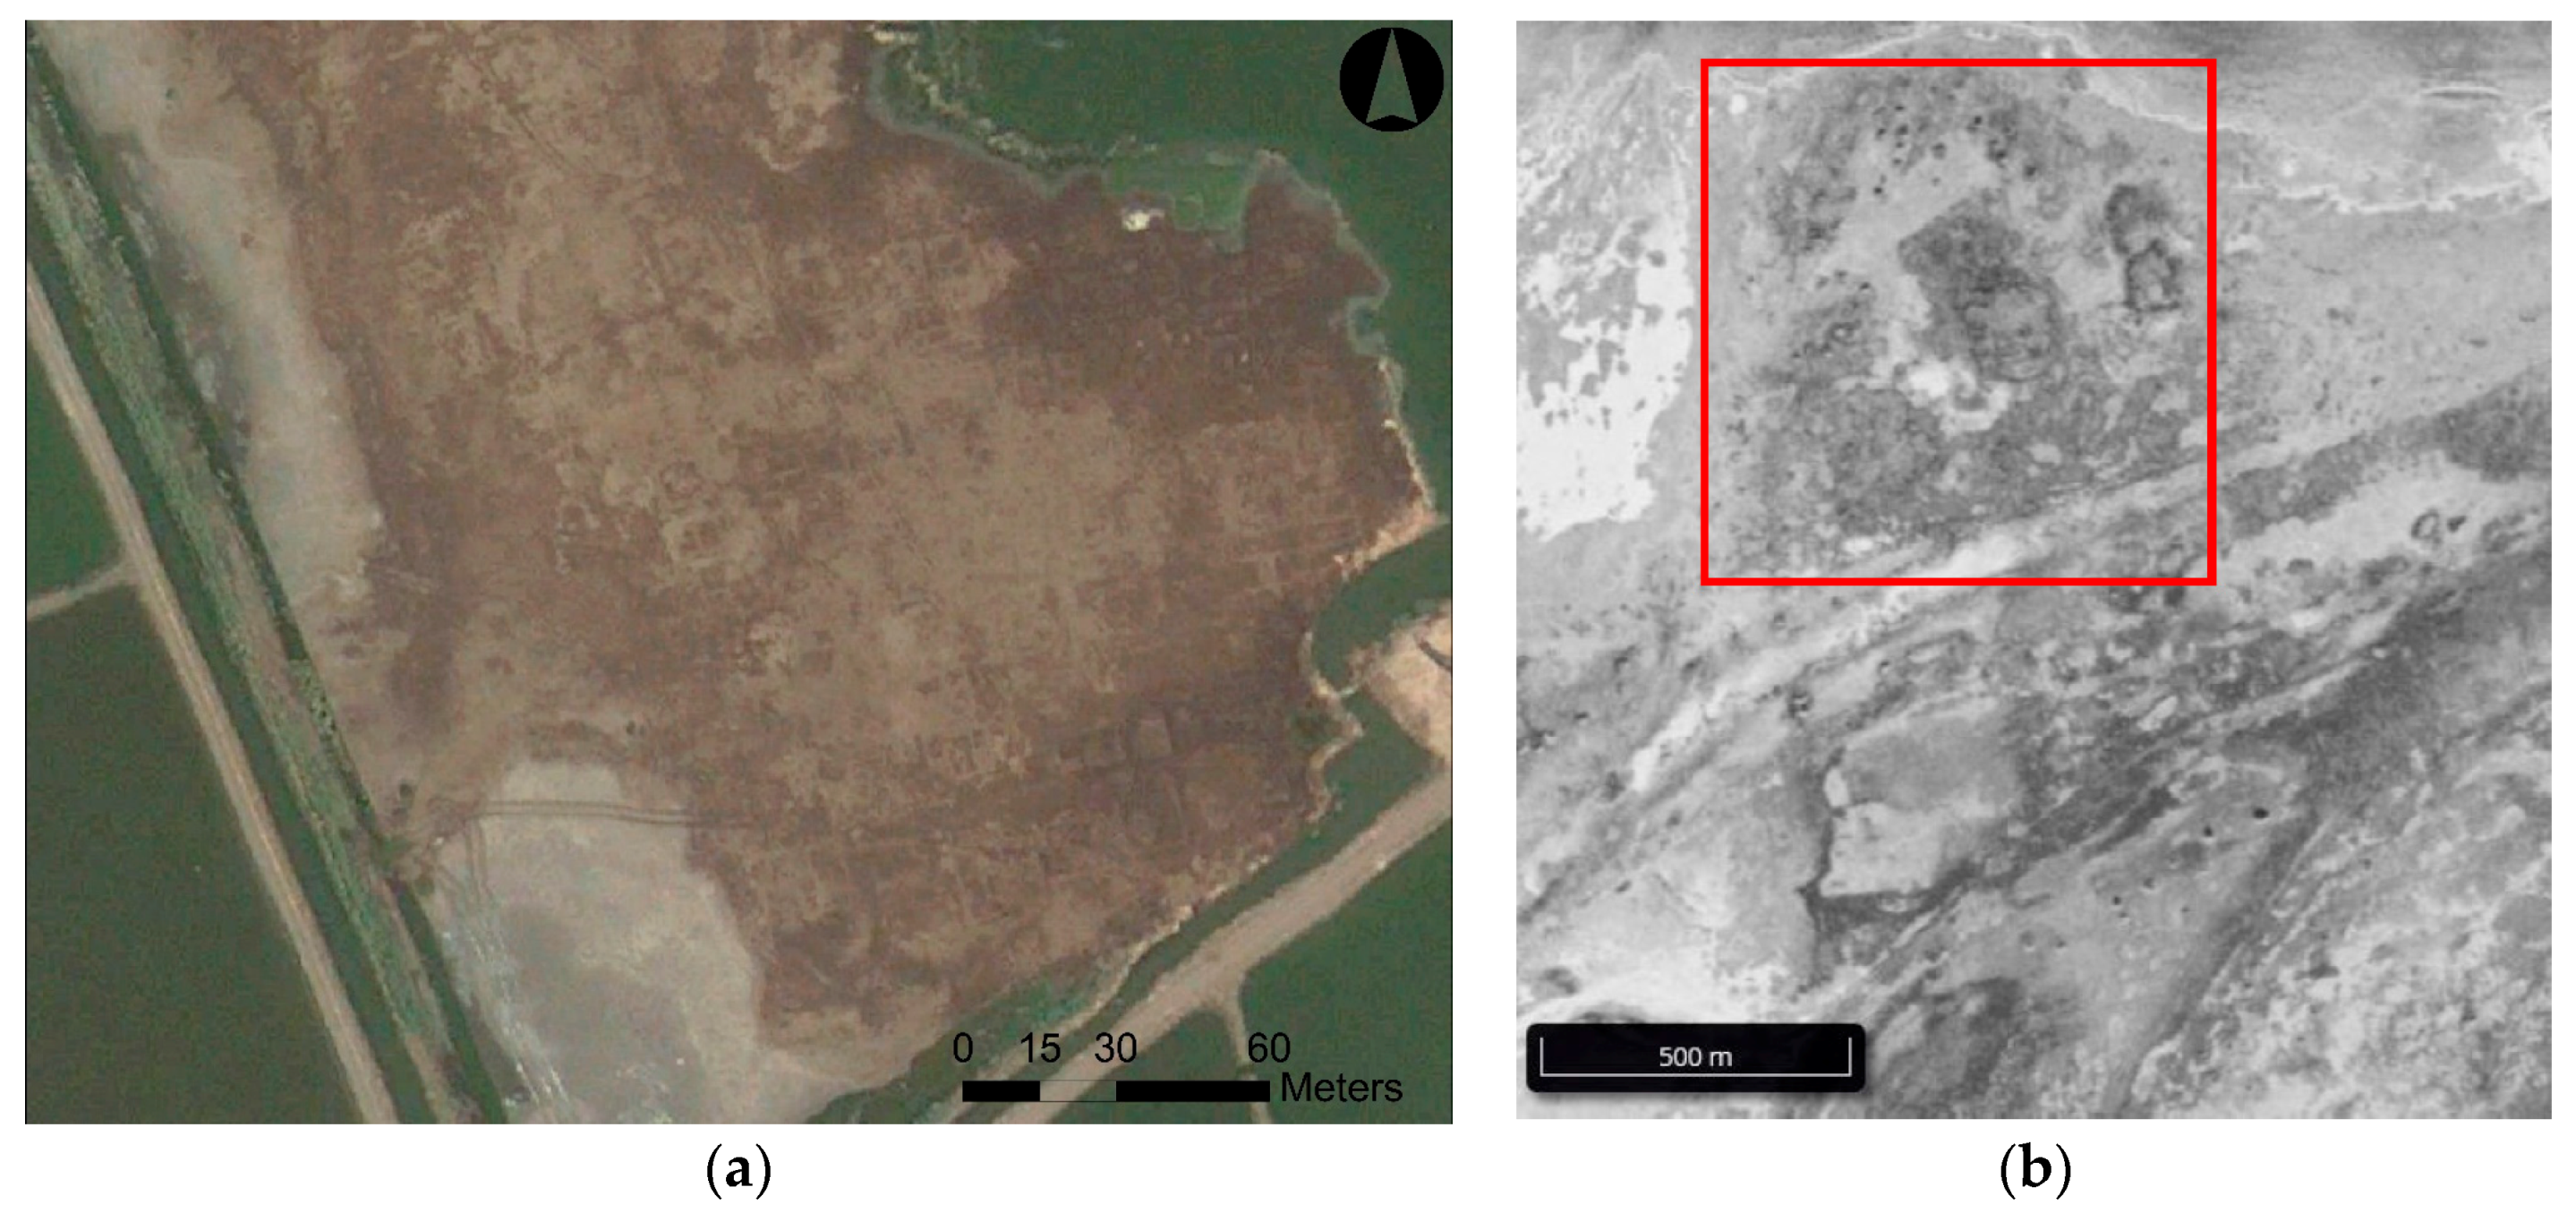
Figure 22.
(a) The site of Tell Mutubis. Image courtesy Google Earth; (b) 1968 CORONA image. The area of image (a) is in the red box. Image courtesy of the Center for Advanced Spatial Technologies, University of Arkansas/U.S. Geological Survey.
Figure 22.
(a) The site of Tell Mutubis. Image courtesy Google Earth; (b) 1968 CORONA image. The area of image (a) is in the red box. Image courtesy of the Center for Advanced Spatial Technologies, University of Arkansas/U.S. Geological Survey.
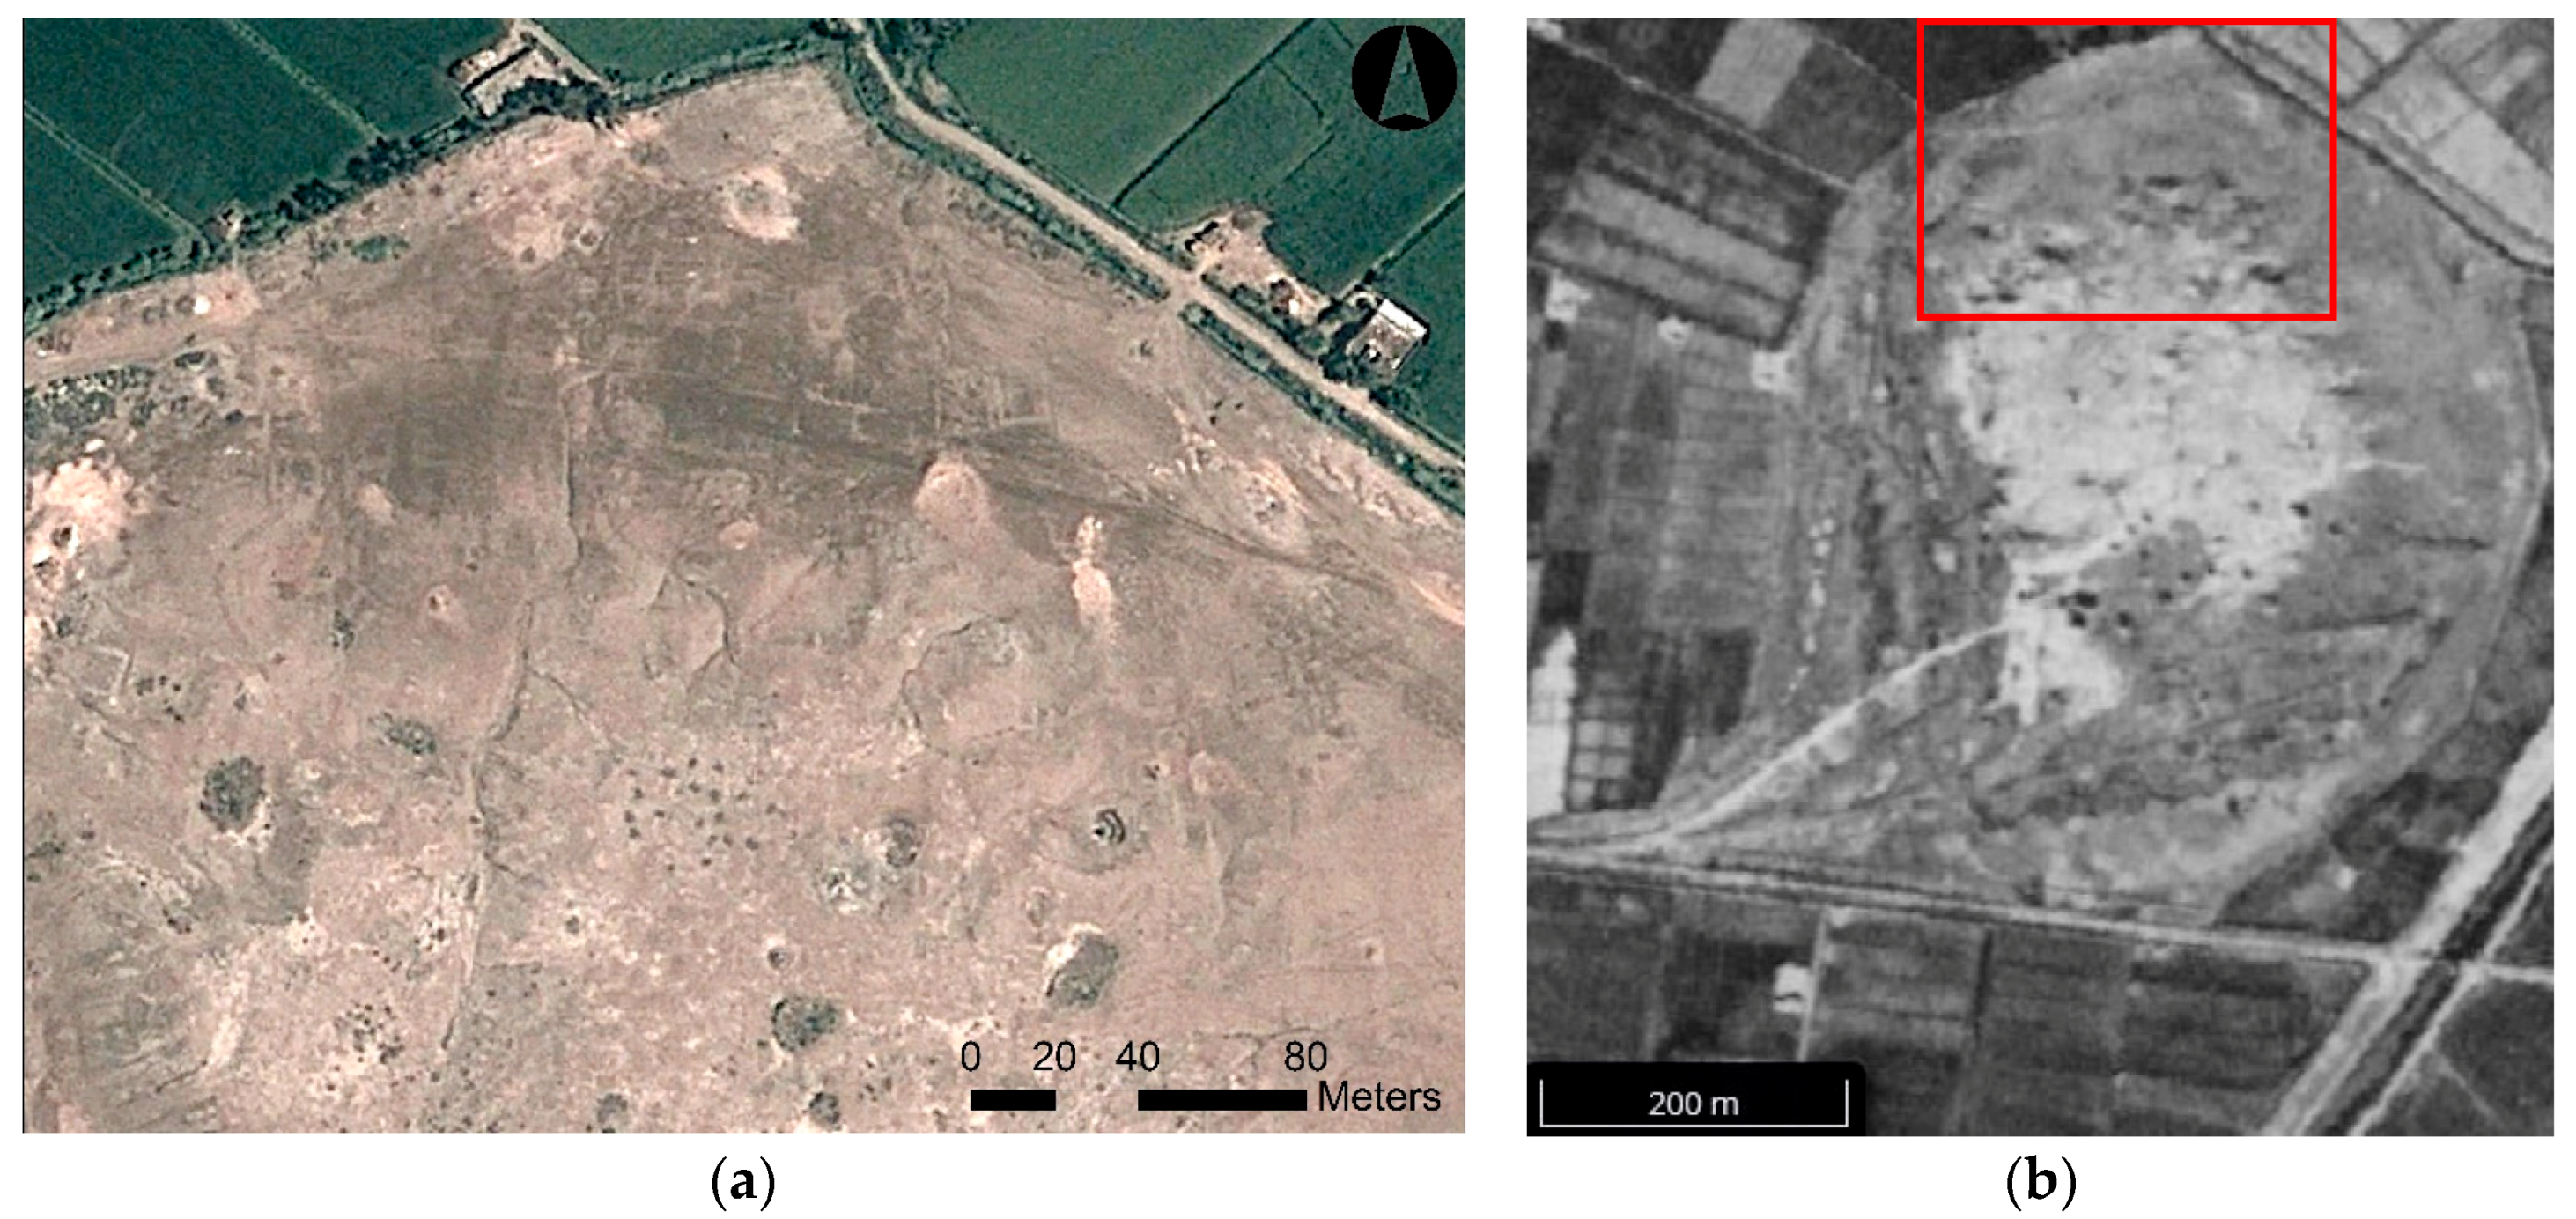
Figure 23.
(a) The site of Tukh el Qaramus, with the temple of Philip Arrhideus in the western rectangle, and a potential temple in the eastern rectangle. Image courtesy Google Earth; (b) 1968 CORONA image. Image courtesy of the Center for Advanced Spatial Technologies, University of Arkansas/U.S. Geological Survey.
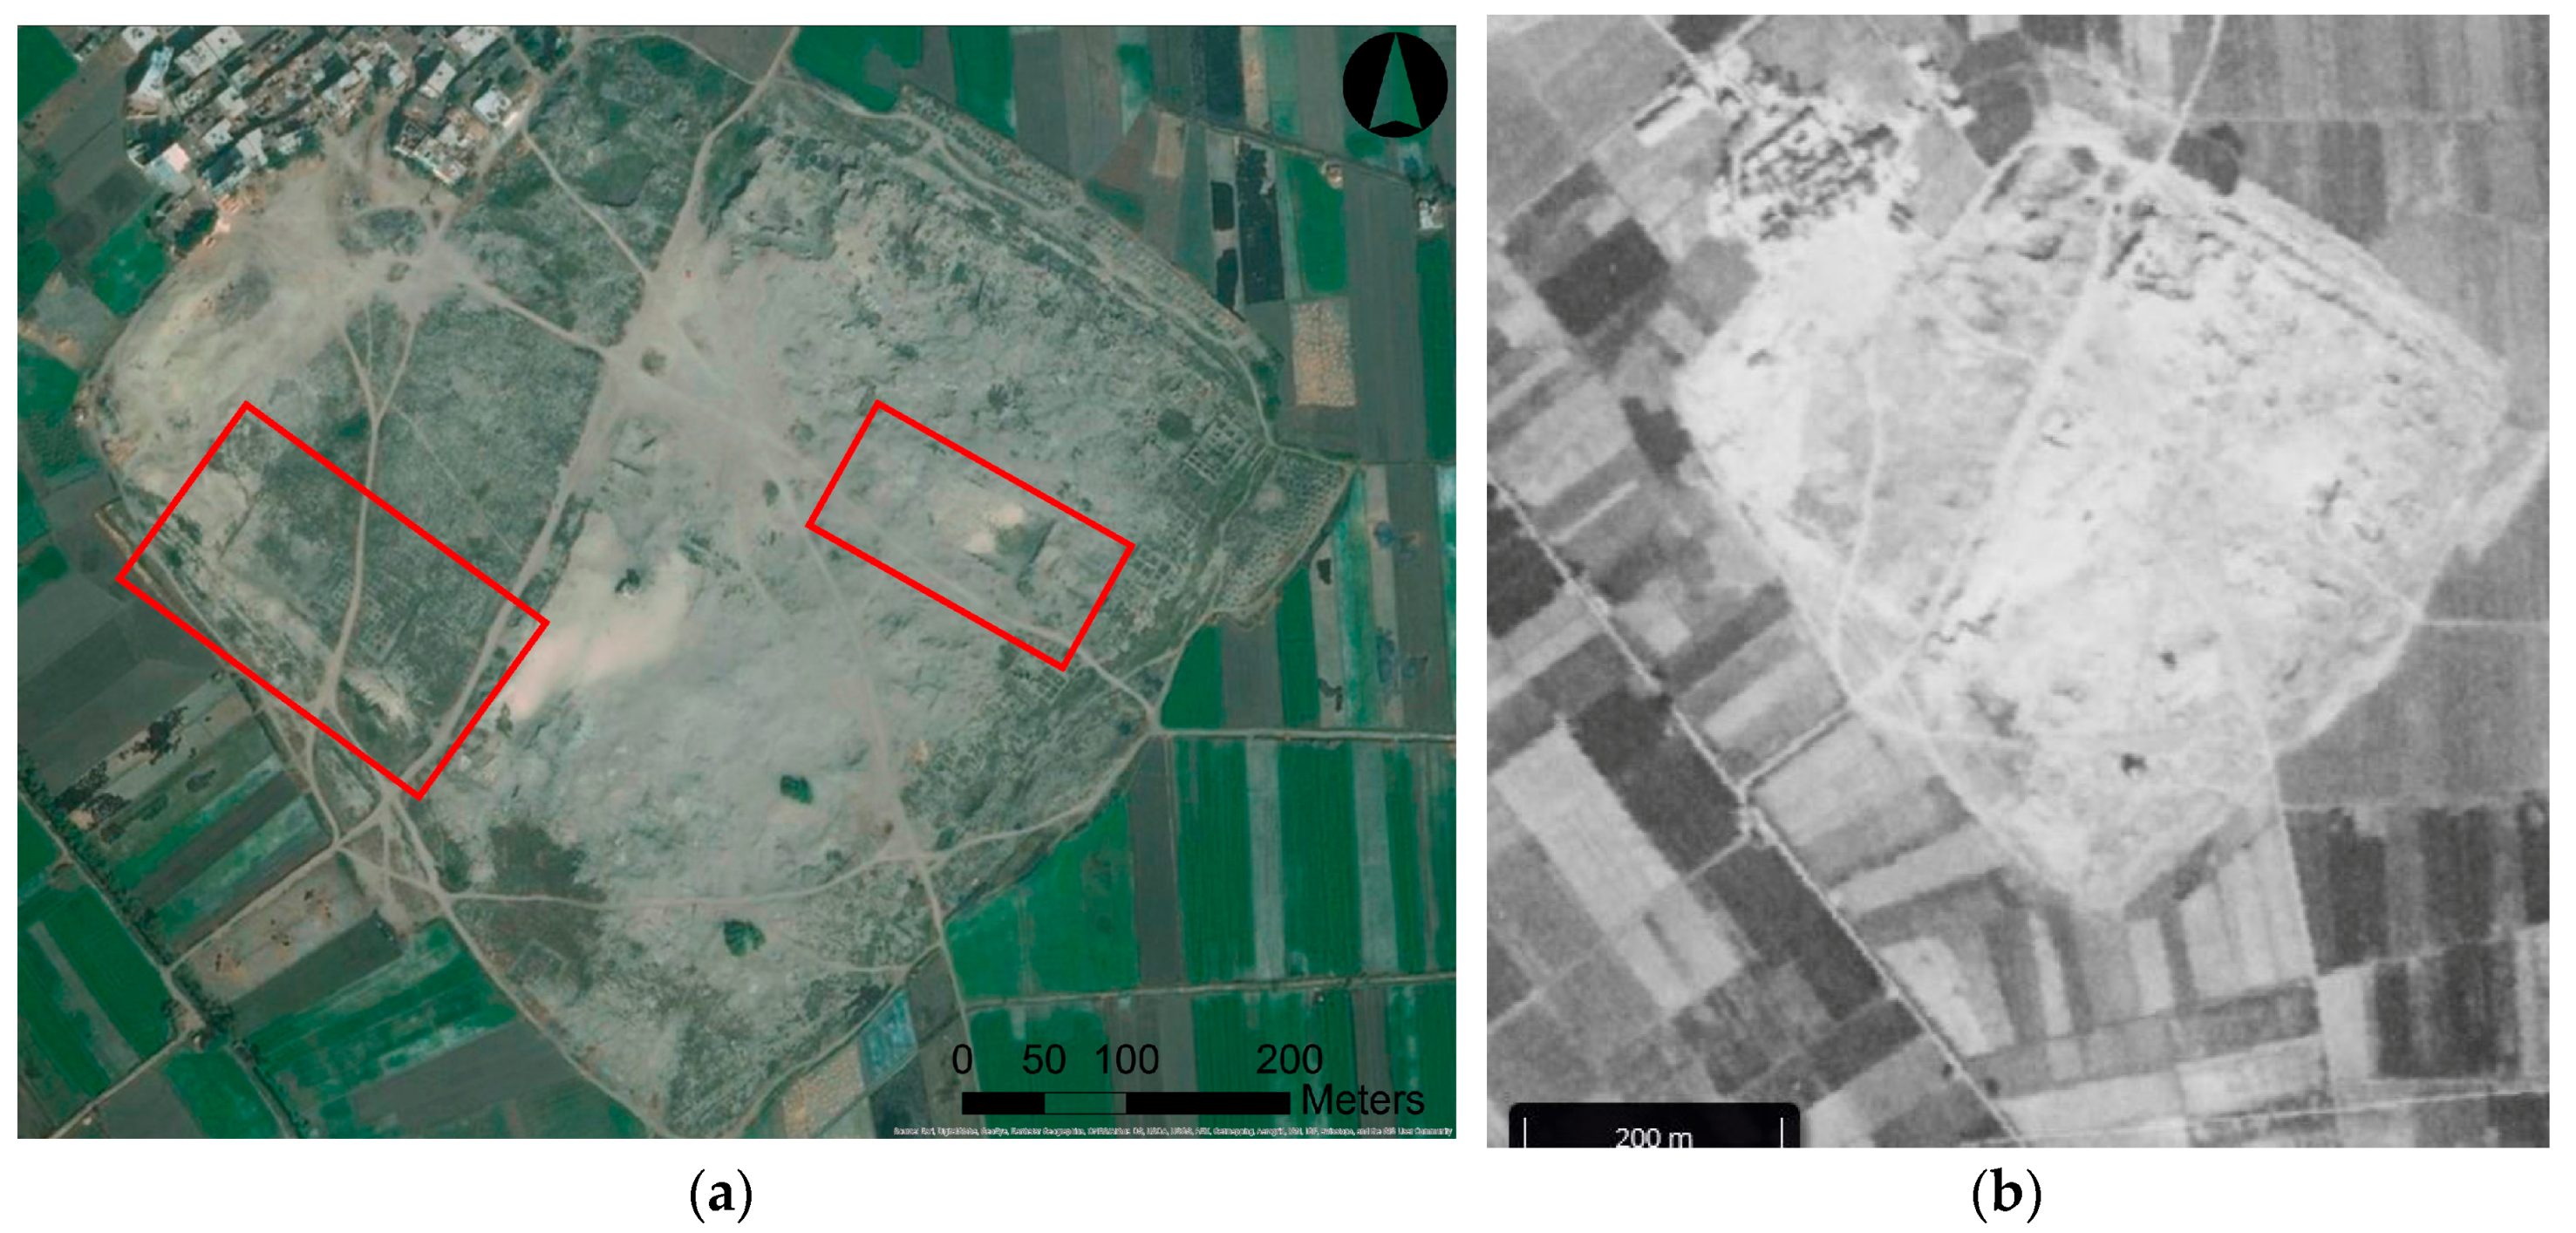
Figure 24.
(a) The site of Umm el-Lahm Image courtesy Google Earth; (b) 1968 CORONA image. The area of image (a) is in the red box. Image courtesy of the Center for Advanced Spatial Technologies, University of Arkansas/U.S. Geological Survey.
Figure 24.
(a) The site of Umm el-Lahm Image courtesy Google Earth; (b) 1968 CORONA image. The area of image (a) is in the red box. Image courtesy of the Center for Advanced Spatial Technologies, University of Arkansas/U.S. Geological Survey.

Figure 25.
(a) The site of Umm Gafar Image courtesy Google Earth; (b) 1968 CORONA image. The original boundaries of the site are within the larger red box, while the area in image (a) is in the smaller box. Image courtesy of the Center for Advanced Spatial Technologies, University of Arkansas/U.S. Geological Survey.

Figure 26.
3D reconstruction of the ancient site of Tell Tebilla. Imagery courtesy Greg Mumford.
© 2017 by the authors. Licensee MDPI, Basel, Switzerland. This article is an open access article distributed under the terms and conditions of the Creative Commons Attribution (CC BY) license (http://creativecommons.org/licenses/by/4.0/).
Share and Cite
MDPI and ACS Style
Parcak, S.; Mumford, G.; Childs, C. Using Open Access Satellite Data Alongside Ground Based Remote Sensing: An Assessment, with Case Studies from Egypt’s Delta. Geosciences 2017, 7, 94. https://doi.org/10.3390/geosciences7040094
AMA Style
Parcak S, Mumford G, Childs C. Using Open Access Satellite Data Alongside Ground Based Remote Sensing: An Assessment, with Case Studies from Egypt’s Delta. Geosciences. 2017; 7(4):94. https://doi.org/10.3390/geosciences7040094
Chicago/Turabian StyleParcak, Sarah, Gregory Mumford, and Chase Childs. 2017. "Using Open Access Satellite Data Alongside Ground Based Remote Sensing: An Assessment, with Case Studies from Egypt’s Delta" Geosciences 7, no. 4: 94. https://doi.org/10.3390/geosciences7040094
Note that from the first issue of 2016, this journal uses article numbers instead of page numbers. See further details here.